Embed Size (px)
Citation preview
A Social Cost-Benefit Analysis of Conserving the Ranomafana-Andringitra-
Pic d’Ivohibe Corridor in Madagascar
By Neal J. Hockley & Ramy Razafindralambo University of Wales, Bangor, UK & Conservation Intl., Madagascar
2006
30th December 2006 USAID Cooperative Agreement No. 687-A-00-04-00090-00 USAID strategic objective: SO6 - Biologically diverse forest ecosystems conserved Project activity: Maintaining Biological Integrity of Critical Biodiversity Habitats (MIARO) Prime recipient: Conservation International Sub-recipients: WWF, WCS, ANGAP Sponsoring USAID operating Unit: USAID/Madagascar, SO6 © Neal J Hockley & Ramy Razafindralambo 2006

i
A Social Cost-Benefit Analysis of Conserving the Ranomafana-Andringitra-Pic d’Ivohibe Corridor in Madagascar
Neal J. Hockley1,2 and Ramy Razafindralambo3 1School of the Environment and Natural Resources, University of Wales, Bangor. Deiniol Road, Bangor. LL57 2UW. Wales, United Kingdom. [email protected]. Tel: +44 1248 382450 Fax: +44 1248 354997 2 Vokatry ny Ala, BP 1067, Fianarantsoa 301, Madagascar. 261 (0) 20 75 517 01 3 Conservation International, Antananarivo, Madagascar. [email protected]
Keywords: Andringitra; Benefits Transfer; Biodiversity; Conservation and Development; Distribution of Benefits; Madagascar; Opportunity Costs; Protected Areas; Ranomafana; Social Cost-benefit Analysis.
J. Economic Lit. Codes: Q20, Q23, Q24, Q25, Q26, Q28, Q34, Q54, Q57
Abstract
We reviewed existing studies and data to conduct a social cost-benefit analysis for a new protected area in south-eastern Madagascar. The global net present value of conserving the Ranomafana-Andringitra-Pic d’Ivohibe corridor is large and positive, with a mid range estimate of over US$ 330 million, if benefits are not weighted according to the income of the recipient. However, at the local level, net present value of conservation is negative at around US$-1400 per household in forest frontier communities. At the national level, net benefits are non-significant. Thus, for corridor conservation to make a positive contribution to global welfare these inequalities must be addressed. For this reason, and to ensure the future supply of biodiversity conservation, we recommend that measures to mitigate the costs of conservation be directed at all forest frontier communities and made contingent on the conservation of forests and biodiversity. Given the large global net benefit of conserving the corridor, we believe that these measures are affordable and sustainable.
This report can be downloaded from: http://www.bangor.ac.uk/~afpe5d/SCBA.html
ii
Une Analyse Coûts-Bénéfices Sociale de la Protection du Corridor Ranomafana-Andringitra-Pic d’Ivohibe, Madagascar
Neal J. Hockley1,2 et Ramy Razafindralambo3 1School of the Environment and Natural Resources, University of Wales, Bangor. Deiniol Road, Bangor. LL57 2UW. Pays de Galles, Royaume Uni. [email protected]. Tél. : +44 1248 382450 Fax : +44 1248 354997 2 Vokatry ny Ala, BP 1067, Fianarantsoa 301, Madagascar. Tél. : +261 (0) 20 75 517 01 3 Conservation International, Antananarivo, Madagascar. [email protected]
Mots Clés : Andringitra ; transfert des bénéfices ; biodiversité ; Conservation et développement ; répartition des bénéfices ; Madagascar ; Coûts d’opportunités ; Aires protégées; Ranomafana; Analyse coûts-bénéfices sociale.
J. Economic Lit. Codes: Q20, Q23, Q24, Q25, Q26, Q28, Q34, Q54, Q57
Résumé Se basant sur l’étude des littératures et données existantes, nous avons effectué une analyse coût-bénéfice sociale d’une nouvelle aire protégée dans le sud est de Madagascar. Au niveau mondial, la valeur actuelle nette de la conservation du Corridor Ranomafana-Andringitra-Ivohibe est très importante et positive, avec une valeur moyenne estimée à plus de US$ 330 millions, si les bénéfices ne sont pas pondérés selon le revenu de la bénéficiaire. Cependant, la valeur actuelle nette de la conservation est négative, aux environs de US$-1400 par ménage, pour les communautés locales aux abords de la forêt. Au niveau national, le bénéfice net n’est pas significatif. Ainsi, pour espérer une contribution positive de la conservation du corridor au bien être global, ces déséquilibres doivent être considérées. Pour cette raison et pour assurer la continuité de la conservation de la biodiversité dans le future, nous recommandons que des mesures pour alléger le coût de la conservation sont orientées vers toutes les communautés aux abords de la forêt, en fonction de leur performance sur la conservation de la forêt et de la biodiversité. Etant donné l’importance du bénéfice net mondial de la conservation du corridor, nous pensons que ces mesures sont abordables et faisables sur long terme.
Ce rapport peut-être téléchargé au: http://www.bangor.ac.uk/~afpe5d/SCBA.html

Hockley & Razafindralambo (2006) A Social Cost-Benefit Analysis of Conserving the Ranomafana-Andringitra-Pic d’Ivohibe Corridor
Extended Abstract
The Government of Madagascar plans to triple the size of the country’s protected area network. Because of its rich biodiversity the forested corridor joining the National Parks of Ranomafana and Andringitra and the Special Reserve of Pic d’Ivohibe has been identified as a priority site for a new protected area.
We reviewed existing studies and unpublished data to carry out a social cost-benefit analysis of conserving the entire corridor, including the existing two National Parks and the Reserve. Based on the results of these studies, we evaluate the costs and benefits of corridor conservation in terms of its impact on: local livelihoods; timber production; irrigation; carbon sequestration and ecotourism. We also use an innovative approach to value the international non-use values of biodiversity. Despite considerable uncertainties at all levels, we find the global net present value of conserving the corridor to be large and positive, with a mid range estimate of over US$ 330 million (range: 22-642m), when benefits are not weighted according to the income of the beneficiary.
We then determine the distribution of costs and benefits across different stakeholder groups, from forest edge communities, through the national to the global level. Despite being overwhelmingly positive at the global level, our review suggests that the benefits of conservation are unequally distributed, with significant costs at the local level. We estimate the mid-range net present value of costs to forest frontier communities at over US$1400 (range: US$196-2610) per average household. These costs will be distributed unequally among communities. At the national level, the conservation of the corridor has a slightly positive net present value of US$13 million (+/- 83m), insignificant compared to the size of the uncertainties.
These inequalities mean that the true contribution which corridor conservation makes to global welfare is highly dependent on benefits being transferred to local communities and to the Malagasy nation. Without such transfers, conserving the corridor would most probably have a negative net effect on global welfare, and its success would not be assured. Conservation has the potential to make a real positive contribution to Madagascar’s development, but for this to happen, Madagascar must capture a higher proportion of the international value of its forests.
Despite the very large quantitative uncertainties, the economic case for corridor conservation is therefore compelling when the global, un-weighted, value is considered. However, the case for transferring benefits to the local and national levels is equally compelling: to ensure the success of conservation and to ensure it makes a positive, rather than negative impact on human welfare. Ecotourism and carbon sequestration credits are likely to play an important role in the long-term. In the short-term, we advocate the use of direct and proportionate mitigation measures that are compatible with, and contingent on the supply of, biodiversity conservation. Because the market for biodiversity conservation is undeveloped at present, we recommend continuing or increasing transfer payments for biodiversity, such as donor financing and government support, whilst ensuring that they are well targeted to those bearing the costs. Market-based mechanisms should also be developed. Finally, we note that the local costs, while very significant in comparison with local incomes, are small compared to the global benefits, and conclude that such measures should be affordable.
iii

Hockley & Razafindralambo (2006) A Social Cost-Benefit Analysis of Conserving the Ranomafana-Andringitra-Pic d’Ivohibe Corridor
Contents Abstract i Résumé (en français) ii Extended Abstract iii Contents iv List of Figures and Tables v Acknowledgements vi Introduction 1 Policy context and objectives of the study 1 Social Cost-benefit Analysis 1 Methodology 4 Framework of the analysis 4 Methods 5 Spatial Coverage 5 Missing Values 8 Results 9 Global Value of Conserving the Corridor 9 Distribution of Net Benefits 9 Costs at the forest frontier 10 The size of the Strictly Protected Core Zone. 11 Southern Extension of the Corridor to Vondrozo 12 Logging in the Conservation Site 12 Uncertainty and sensitivity 13 Discussion 15 Costs and benefits, winners and losers 15 Assuring the supply of biodiversity conservation 15 Conclusions 17 References & Sources 18 Appendix 1: Full Methods I Appendix 2: Full results table XXII Appendix 3: Notes on hydrological functions of forests, by J. E. Annis & N. J. Hockley XXIV
iv
Hockley & Razafindralambo (2006) A Social Cost-Benefit Analysis of Conserving the Ranomafana-Andringitra-Pic d’Ivohibe Corridor
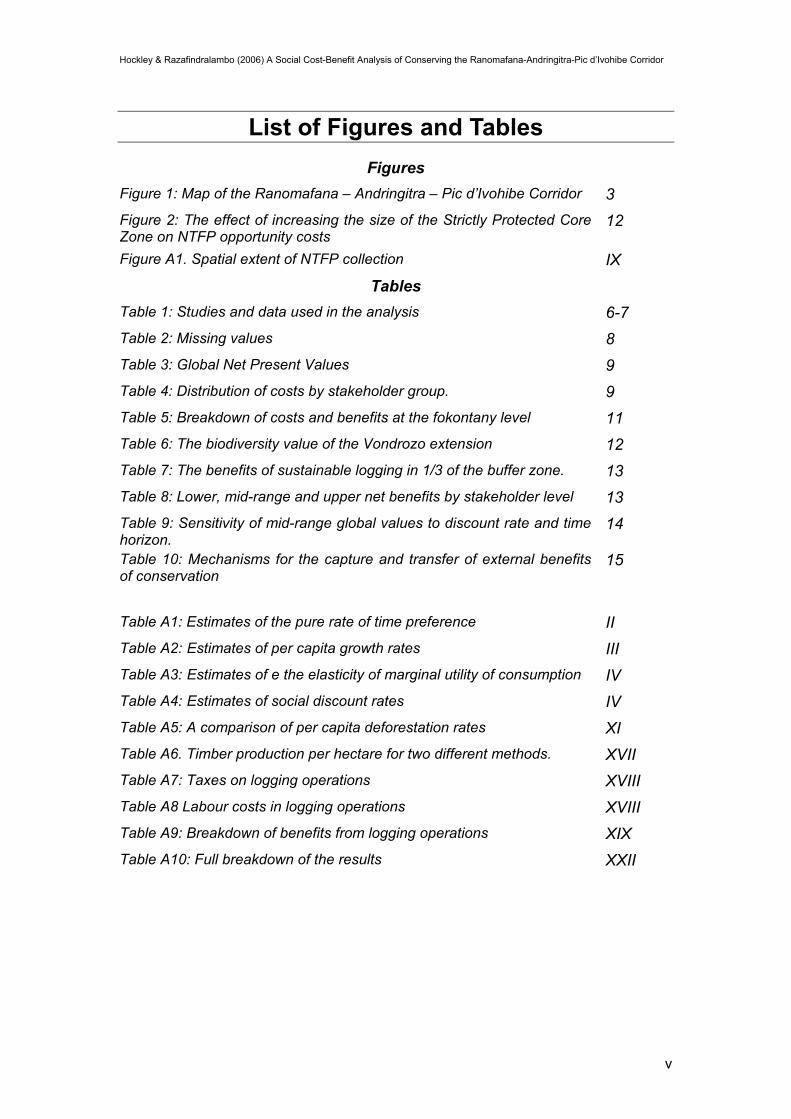
List of Figures and Tables Figures
Figure 1: Map of the Ranomafana – Andringitra – Pic d’Ivohibe Corridor 3 Figure 2: The effect of increasing the size of the Strictly Protected Core Zone on NTFP opportunity costs
12
Figure A1. Spatial extent of NTFP collection IX Tables
Table 1: Studies and data used in the analysis 6-7 Table 2: Missing values 8 Table 3: Global Net Present Values 9 Table 4: Distribution of costs by stakeholder group. 9 Table 5: Breakdown of costs and benefits at the fokontany level 11 Table 6: The biodiversity value of the Vondrozo extension 12 Table 7: The benefits of sustainable logging in 1/3 of the buffer zone. 13 Table 8: Lower, mid-range and upper net benefits by stakeholder level 13 Table 9: Sensitivity of mid-range global values to discount rate and time horizon.
14
Table 10: Mechanisms for the capture and transfer of external benefits of conservation
15
Table A1: Estimates of the pure rate of time preference II Table A2: Estimates of per capita growth rates III Table A3: Estimates of e the elasticity of marginal utility of consumption IV Table A4: Estimates of social discount rates IV Table A5: A comparison of per capita deforestation rates XI Table A6. Timber production per hectare for two different methods. XVII Table A7: Taxes on logging operations XVIII Table A8 Labour costs in logging operations XVIII Table A9: Breakdown of benefits from logging operations XIX Table A10: Full breakdown of the results XXII
v

Hockley & Razafindralambo (2006) A Social Cost-Benefit Analysis of Conserving the Ranomafana-Andringitra-Pic d’Ivohibe Corridor
Acknowledgements This study was primarily financed by Conservation International through the MIARO project of USAID financial assistance to Madagascar’s Third Environmental Programme. Additional support was received from Ecoregional Initiatives, Fianarantsoa.
The specialist groups at the workshop were led by: Mijasoa Andriamarovololona, Joanna Durbin, Julia Jones, David Meyers, Julien Noel, Holy Raharinjanahary, Vololoniaina Raharinomenjanahary, Anicet Ranaivoarison, Rija Ranaivoarison, Haja-Guy Randrianarisoa, Florent Ravoavy and Georges Serpantié, we thank them for their efforts.
We would also like to thank the following people for assistance with and presentations at, the workshop: Vladimir Ratsimandresy, BAMEX, Fianarantsoa; Rondro Andriamampionona, Michel Randriambololona and Jean Razafitsotra, Conservation International, Fianarantsoa; Frank Hawkins and Fabi Randrianarisoa, Conservation International, Antananarivo, Jean-Solo Ratsisompatrarivo, DAI, Antananarivo, Mark Freudenberger of ERI, Fianarantsoa, Karen Freudenberger, FCER, Fianarantsoa.
We thank Lisa Gaylord and the team at USAID for continuing technical and financial support.
Thanks also to the following people or institutions who helped with requests for documentation or information: ANGAP Ranomafana, Fianarantsoa and Antananarivo; Jonathon Annis; Pieter van Beukering; Geoff Bright; JIRAMA Fianarantsoa; David Knox; Susanne Menzel; Dominic Moran; Ny Tanintsika, Fianarantsoa; Colin Price; Etienne Rasamisandy; SAGE, Fianarantsoa; Bert Saveyn; Georges Serpantié and Richard Tol.
Finally, Frank Hawkins and David Meyers read an earlier draft of this report, and made many helpful and insightful comments. The responsibility for any errors or omissions which remain is of course our own.
Misaotra indrindra
vi

Hockley & Razafindralambo (2006) A Social Cost-Benefit Analysis of Conserving the Ranomafana-Andringitra-Pic d’Ivohibe Corridor
Introduction
Policy Context and Objectives of the Study At the World Parks Congress in Durban, SA, in 2003, President Marc Ravalomanana announced Madagascar’s intention to triple the size of its protected areas. As a result, the corridor of natural forest linking the National Parks of Ranomafana and Andringitra and the Special Reserve of Pic d’Ivohibe (Figure 1, below) has been identified as a key part of the expansion strategy1. The corridor is a hugely important refuge for biodiversity and, together with the two parks, boasts two endemic primate species2 and contains a wide range of rare and endemic flora and fauna. As a result, the corridor will be designated a “Conservation Site3”, a new form of protected area. While conservation organisations and the international community have welcomed the President’s vision, they recognise the need to assess the socio-economic impact of the new protected areas; to address the concerns raised by political leaders in the corridor region; and to provide an up to date assessment of the economic value of conserving the forest corridor.
Conservation International (CI) and Ecoregional Initiatives (ERI) responded to these needs in two ways:
First, a workshop was held in Fianarantsoa, Madagascar, on the 26-28th April 2005, to enable stakeholders to discuss the socio-economic implications of the new Conservation Site, and to gather information and opinion on the development needs of the surrounding communities. Around 80 delegates, including local community leaders, researchers, representatives of NGOs and government agencies, attended the workshop.
Second, we were asked to prepare a study that quantified the costs and benefits of conserving the corridor, while also determining their distribution across local, national and international scales. The study would build on the findings of the workshop, and use existing studies and data rather than carry out new research.
This report presents the results of this study and a discussion of their implications. Full details of the methodology can be found in Appendix 1. The original spreadsheet, containing all of the calculations as well as most of the data used in the analysis, is available from the authors. Anyone requiring further information is welcome to contact the authors.
Social Cost-benefit Analysis Social Cost-Benefit Analysis (SCBA) involves the quantification of the costs and benefits of a project, with the aim that these can be aggregated to determine whether the project makes a net positive or negative economic contribution to society. SCBA should consider all costs and benefits, including those for which no markets exist. It should also explicitly consider the distribution of costs and benefits amongst different
1 By a biological priority setting workshop held in Fianarantsoa in January 2005: L’Atelier Scientifique de Planification: Corridor Forestier Ranomafana – Andringitra – Pic d’Ivohibe. 17-20 janvier 2005. Alliance Ecorégionale (2005). 2 The Golden Bamboo Lemur (Hapalemur aureus) and the Greater Bamboo Lemur (Hapalemur simus). 3 Or “Site de conservation”. Since the study, the site has become “La Future Aire Protégée de Fandriana – Vondrozo” which includes northern and southern extensions to Fandriana and Vondrozo respectively.
1

Introduction
stakeholders. In this manner, the equity implications of a project can be assessed, along with its economic efficiency.
SCBA is only one of many tools available for appraising the desirability of projects, including multi-criteria decision-making, rapid and participatory rural appraisal and soft systems analysis (see Blumenthal & Jannink [2000] and Joubert et al. [1997] for discussions of these methods). Each tool differs in the degree to which it achieves the participation of stakeholders, the quantification of costs and benefits, and whether it aims simply to inform the decision making process (e.g. cost-benefit analysis) or whether it actually is a decision making process (e.g. participatory rural appraisal, [Chambers 1994]).
It is fair to say that SCBA tends to be one of the less participatory decision making tools. It is also true that SCBA has no explicit means of dealing with costs or benefits that are extremely difficult to value in economic terms. Given this: why should we use SCBA? We believe that SCBA is useful in this case, firstly, because many of the most important costs and benefits have been quantified and secondly, because despite advances in alternative methods, there exists no more satisfactory method for aggregating diverse benefits, and the divergent preferences of many different stakeholders (see for example Pearce [1998 p96-97]). We feel that the best solution is to carry out an “open” SCBA, in which as much attention is directed to the breakdown of costs and benefits, their distribution across groups and to those costs and benefits which could not be evaluated economically, as is given to the overall result. We feel that this represents the most useful way to present to decision makers the information which is available.
2

Hockley & Razafindralambo (2006) A Social Cost-Benefit Analysis of Conserving the Ranomafana-Andringitra-Pic d’Ivohibe Corridor
Figure 1: Map of the Ranomafana – Andringitra – Pic d’Ivohibe Corridor showing existing protected areas and the southern extension.
3
Hockley & Razafindralambo (2006) A Social Cost-Benefit Analysis of Conserving the Ranomafana-Andringitra-Pic d’Ivohibe Corridor
Methodology4
Framework of the Analysis The cost-benefit analysis was designed to evaluate the economic case for conserving the corridor. It aims to identify, and where possible to quantify, the benefits and costs of protecting the forests of the corridor. It does this by comparing two alternative scenarios: • Scenario A: The null scenario, without conservation. Deforestation and extractive
activities continue as they would in the absence of protection. • Scenario B: A Conservation Site is established, composed of a core of strictly
protected forest, surrounded by a zone in which certain extractive uses, but not logging, are allowed.
In addition, the economic value of allowing sustainable, community-managed selective logging within scenario B was assessed. However, it was impossible to assess in a quantitative fashion many of the costs of allowing this exploitation. The analysis is also designed to determine the distribution of these costs and benefits across five key geographically determined stakeholder groups:
• Fokontany5 bordering the forest (Forest Frontier Fokontany [FFF]). • Communes bordering the forest. (Forest Frontier Communes [FFC]) • Regions surrounding the corridor. • Madagascar. • The international community.
By assigning costs and benefits to the stakeholder groups to which they accrue, we can identify winners and losers, and seek strategies that will improve the efficacy and equitability of forest conservation.
One of the most significant costs which we evaluate at the local level, is the opportunity cost of no longer being able to convert the corridor for agriculture (tavy6). Much of this conversion has been illegal, since the colonial times, although its illegality has often had little or no effect (see Kull 2004). However, residents of the corridor maintain that they have rights to the corridor and that, while illegal, practising tavy is one of those rights (Ferraro 1994, Kull 2004). We have conducted our analysis with the assumption that residents of the corridor had the right, albeit only customary, to practise tavy, and that policy makers wish to know what impact the complete prohibition of tavy will have on their livelihoods.
4 Full details of the methodology can be found in Appendix 1. The original spreadsheets, containing all of the calculations and data used in the analysis, together with most of the documents used in the study, are available from the authors. In this section we summarise the main features of the SCBA, and the information we used. 5 Fokontany are the lowest unit into which communities are organised by the government. Each fokontany contains one or a few villages and fokontany populations usually range from 500-3000 inhabitants. 6 Some differentiate between tavy and tevy, with the latter reserved for the clearing of primary forest, while the former refers to slash and burn of fallow vegetation. However, the term tavy has become widely used, and any practitioners of tavy (or tevy) use tavy to mean clearing of forest.
4
Methodology
Methods No resources were available for any primary studies of the costs and benefits of conserving the corridor. We therefore proceeded by applying the results of previous studies to the corridor. This approach, termed “benefits transfer” (Bateman et al. 2002) is of course open to criticism. Its accuracy will depend on the quality of the original research, and the degree of similarity between the original situation, and that prevailing in the area to which it is applied. However, where new, dedicated research is impossible, benefits transfer represents a pragmatic compromise between reliability and cost.
Table 1 (overleaf), shows the main values that we were able to quantify, and the sources of information we used. In addition to the information mentioned in table 1, we used basic information on the populations of communes and fokontany surrounding the corridor, deforestation rates and remaining forest cover. In most cases we have used two separate estimates, representing upper and lower estimates of each benefit or cost. We have then used the mid range values in the results presented below.
Spatial Coverage The two national parks at either end of the corridor, Ranomafana and Andringitra, together with the Special Reserve of Pic d’Ivohibe, are already protected and managed by ANGAP, the National Parks service. The Durban Vision proposals relate only to the corridor between the two parks and the reserve, and will not affect their status. In economic terms, it would be preferable to determine the marginal value of conserving additional forest outside of the parks, in order to determine the optimum level of conservation. However, for both biological and political reasons, this is not sensible. From a policy perspective, there are no proposals to conserve only a part of the corridor7. Biologically, it is impossible to determine how biodiversity would be affected by the loss of different areas of forest since the processes which determine the resilience of biodiversity to habitat loss are poorly understood (du Toit et al. 2004). In any case, it would be even more difficult to determine how this would affect the benefits that flow from biodiversity (see Tisdell et al. 2005 for an interesting example, however). For these reasons, the analysis considers the Conservation Site in the corridor and the parks together (Scenario B) and compares this to a situation where no parks, reserves or Conservation Sites were present (Scenario A).
Although the biological priority-setting workshop recommended that the Conservation Site should include the extension of the corridor as far as Vondrozo, we have confined our analysis to the Ranomafana – Andringitra - Pic d’Ivohibe Corridor, for reasons of data availability. However, our conclusions are likely to be qualitatively true of this corridor extension (see Results and Discussion below).
7 Though different areas of the corridor may be protected to different degrees, with, for example, selective logging being permitted in some areas but not others. We have tried to structure our analysis in such a way that such plans could be evaluated.
5

Table 1: Studies and data used in the analysis
Value Information Used and Outline of the Calculations
Forest Products We used Ferraro’s (1994, 2002) estimates of the per-household opportunity costs of lost forest product collection opportunities around Ranomafana National Park and applied them to the whole corridor. We then used data on the spatial extent of a community’s forest product use (Vokatry ny Ala, unpublished data) to determine the impact on local people’s forest product collection of different sizes of strictly protected core zones (Scenario B), and of losing forest to deforestation in Scenario A.
Tavy We used Ferraro’s (1994, 2002) estimates of the per-household opportunity costs of lost tavy opportunities around Ranomafana National Park and applied them to the whole corridor. We also used the estimates of Kremen et al. (2000) of per hectare benefits of tavy, and applied them to the corridor using corridor specific deforestation rates.
Ecotourism Data on ecotourism revenues (ANGAP [unpublished data], VOI ANJA [unpublished data]) are used together with forecasts of ecotourism growth (World Tourism Organisation, quoted in Carret & Loyer [2003]), to estimate the value of ecotourism in the corridor, into the future. Data on the distribution and magnitude of indirect benefits are also used (Carret and Loyer [2003], ANGAP [No Date].)
Irrigation The willingness to pay of rice farmers in another area of Madagascar to prevent upstream deforestation was determined by Brand et al. (2002). We applied this to the agricultural populations of forest edge communes, using population data from the ILO census (Minten et al. 2003).
Timber Data provided by workshop participants, and other informants, were used to estimate the benefits from two different timber harvesting regimes in the corridor. The first was a multiple rotation (30yr) approach, in which only good quality timber of adequate diameter was extracted. The second was a one-time approach in which all economically useful timber was extracted in a single rotation.
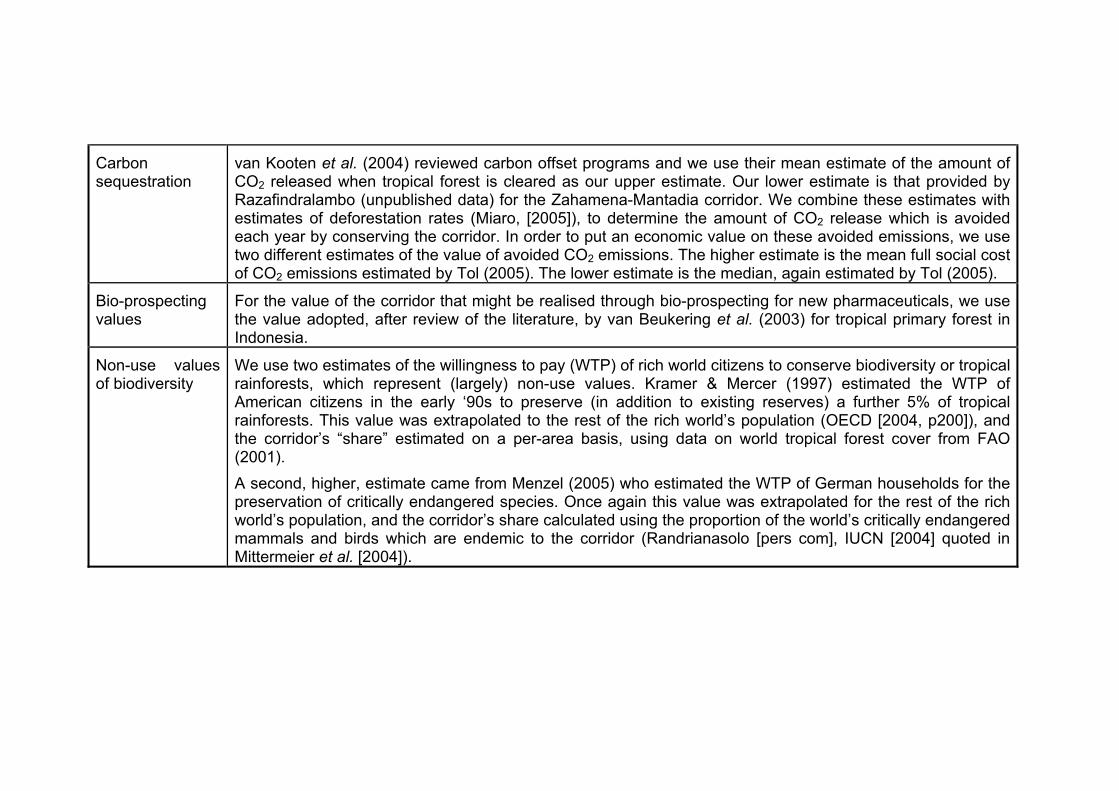
Carbon sequestration
van Kooten et al. (2004) reviewed carbon offset programs and we use their mean estimate of the amount of CO2 released when tropical forest is cleared as our upper estimate. Our lower estimate is that provided by Razafindralambo (unpublished data) for the Zahamena-Mantadia corridor. We combine these estimates with estimates of deforestation rates (Miaro, [2005]), to determine the amount of CO2 release which is avoided each year by conserving the corridor. In order to put an economic value on these avoided emissions, we use two different estimates of the value of avoided CO2 emissions. The higher estimate is the mean full social cost of CO2 emissions estimated by Tol (2005). The lower estimate is the median, again estimated by Tol (2005).
Bio-prospecting values
For the value of the corridor that might be realised through bio-prospecting for new pharmaceuticals, we use the value adopted, after review of the literature, by van Beukering et al. (2003) for tropical primary forest in Indonesia.
Non-use values of biodiversity
We use two estimates of the willingness to pay (WTP) of rich world citizens to conserve biodiversity or tropical rainforests, which represent (largely) non-use values. Kramer & Mercer (1997) estimated the WTP of American citizens in the early ‘90s to preserve (in addition to existing reserves) a further 5% of tropical rainforests. This value was extrapolated to the rest of the rich world’s population (OECD [2004, p200]), and the corridor’s “share” estimated on a per-area basis, using data on world tropical forest cover from FAO (2001). A second, higher, estimate came from Menzel (2005) who estimated the WTP of German households for the preservation of critically endangered species. Once again this value was extrapolated for the rest of the rich world’s population, and the corridor’s share calculated using the proportion of the world’s critically endangered mammals and birds which are endemic to the corridor (Randrianasolo [pers com], IUCN [2004] quoted in Mittermeier et al. [2004]).
Hockley & Razafindralambo (2006) A Social Cost-Benefit Analysis of Conserving the Ranomafana-Andringitra-Pic d’Ivohibe Corridor
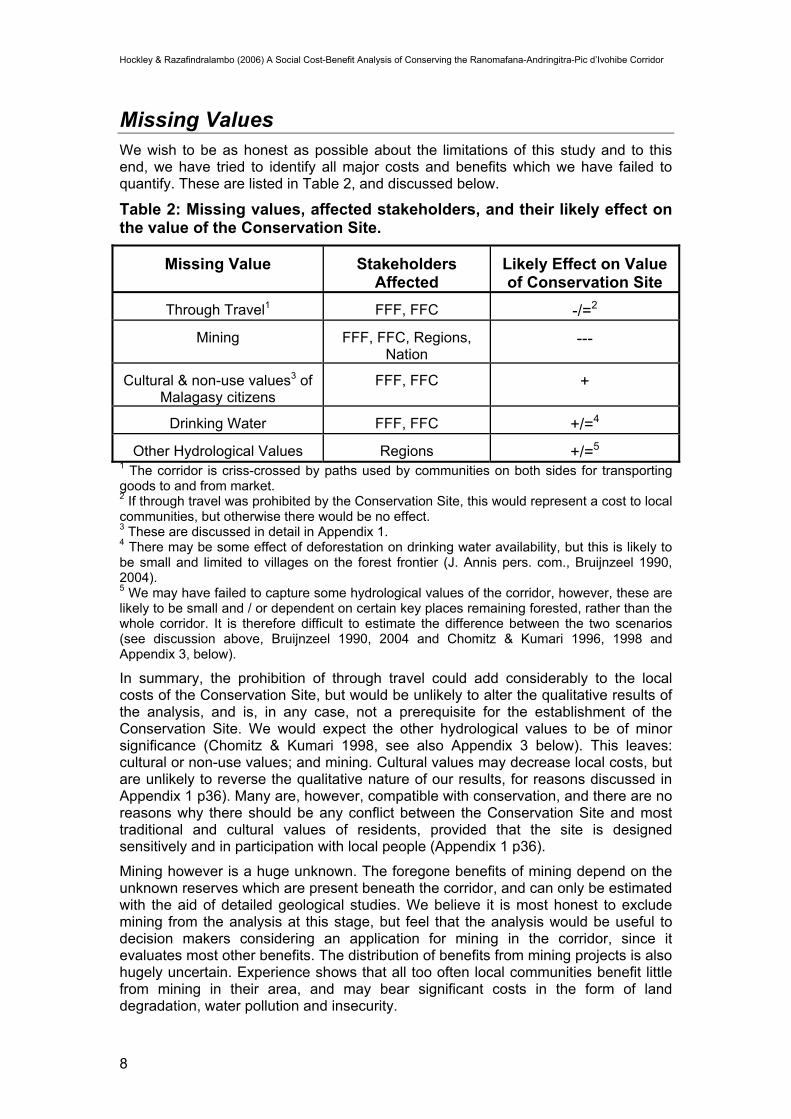
Missing Values We wish to be as honest as possible about the limitations of this study and to this end, we have tried to identify all major costs and benefits which we have failed to quantify. These are listed in Table 2, and discussed below.
Table 2: Missing values, affected stakeholders, and their likely effect on the value of the Conservation Site.
Missing Value Stakeholders Affected
Likely Effect on Value of Conservation Site
Through Travel1 FFF, FFC -/=2 Mining FFF, FFC, Regions,
Nation ---
Cultural & non-use values3 of Malagasy citizens
FFF, FFC +
Drinking Water FFF, FFC +/=4
Other Hydrological Values Regions +/=5
1 The corridor is criss-crossed by paths used by communities on both sides for transporting goods to and from market. 2 If through travel was prohibited by the Conservation Site, this would represent a cost to local communities, but otherwise there would be no effect. 3 These are discussed in detail in Appendix 1. 4 There may be some effect of deforestation on drinking water availability, but this is likely to be small and limited to villages on the forest frontier (J. Annis pers. com., Bruijnzeel 1990, 2004). 5 We may have failed to capture some hydrological values of the corridor, however, these are likely to be small and / or dependent on certain key places remaining forested, rather than the whole corridor. It is therefore difficult to estimate the difference between the two scenarios (see discussion above, Bruijnzeel 1990, 2004 and Chomitz & Kumari 1996, 1998 and Appendix 3, below).
In summary, the prohibition of through travel could add considerably to the local costs of the Conservation Site, but would be unlikely to alter the qualitative results of the analysis, and is, in any case, not a prerequisite for the establishment of the Conservation Site. We would expect the other hydrological values to be of minor significance (Chomitz & Kumari 1998, see also Appendix 3 below). This leaves: cultural or non-use values; and mining. Cultural values may decrease local costs, but are unlikely to reverse the qualitative nature of our results, for reasons discussed in Appendix 1 p36). Many are, however, compatible with conservation, and there are no reasons why there should be any conflict between the Conservation Site and most traditional and cultural values of residents, provided that the site is designed sensitively and in participation with local people (Appendix 1 p36).
Mining however is a huge unknown. The foregone benefits of mining depend on the unknown reserves which are present beneath the corridor, and can only be estimated with the aid of detailed geological studies. We believe it is most honest to exclude mining from the analysis at this stage, but feel that the analysis would be useful to decision makers considering an application for mining in the corridor, since it evaluates most other benefits. The distribution of benefits from mining projects is also hugely uncertain. Experience shows that all too often local communities benefit little from mining in their area, and may bear significant costs in the form of land degradation, water pollution and insecurity.
8

Hockley & Razafindralambo (2006) A Social Cost-Benefit Analysis of Conserving the Ranomafana-Andringitra-Pic d’Ivohibe Corridor
Results Below we describe the key results of our analysis. Unless otherwise stated, all figures are mid-range values and assume that the Strictly Protected Core Zone of the Conservation Site is delimited at 3km from the forest edge, and that no logging of any form takes place in the corridor. Net Present Values are calculated over 60 years, with a social discount rate of 5%8. The effect of changing these assumptions and parameters is discussed below.
The full results table, giving complete breakdown of costs and benefits by type, and stakeholder group, is given in Appendix 2.
Global Value of Conserving the Corridor We estimate the global net present value of conserving the Ranomafana – Andringitra - Pic d’Ivohibe corridor to be just over US$ 330 million over 60 years, using a discount rate of 5%. In other words, conserving the corridor, along with the three existing protected areas, represents a net benefit to the world, of US$ 330m, compared with the null scenario of continued exploitation for slash and burn agriculture and logging.
The upper and lower limits of this global NPV are US$ 22m and 642m respectively (Table 3, below), demonstrating that even with the most conservative assumptions, conservation of the corridor outperforms the null scenario by a substantial margin.
Table 3: Global Net Present Values (million US$)
Lower estimate Mid-range Estimate Upper Estimate
Global Net Present Value 22 332 642
Distribution of Net Benefits However, we are also interested in the distribution of costs and benefits among different stakeholder groups: who are the winners and who are the losers? Table 4, below, shows the distribution of benefits between each stakeholder group.
Table 4: Distribution of costs by stakeholder group.
Stakeholder groups
Cumulative Net Benefit
mUS$ Net Benefit (US$) per head of population
Forest Frontier Fokontany (FFF) -29 -168.49 Total Forest Frontier Communes (FFC) inc FFF -47 -94.82 Total National Benefit (inc FFF and FFC) 13 0.76 Total Global Benefit 332
Each row shows the cumulative net benefits, at that level. For example, the Net Benefit at the National level sums the local costs, and national benefits, to give a small positive National Net Benefit.
8 This rate is in line with Social Discount Rates calculated for India (5.2%, Kula 2004) and used in Indonesia (4%, van Beukering et al. 2003). See Appendix 1, pp21-26 for justification and calculations.
9

Results
At the level of the Forest Frontier Fokontany and Communes, costs exceed benefits, and costs are highest, per capita, in communities closest to the forest. At the national level, mid-range benefits marginally exceed costs: while rural corridor populations bear most of the costs of conservation, most of the benefits to Madagascar occur at larger spatial scales.
These costs and benefits are of course averaged over each stakeholder group, and mask the very large inter-household variance which must surely exist.
In addition these figures do not take account of the large quantities of development assistance that the corridor receives (though they do take account of direct spending on existing and proposed protected area management). In some areas, agricultural assistance has greatly increased household incomes, while larger scale projects such as the rehabilitation of transport networks may have boosted the regional economy. However, we are aware of no studies which have evaluated the benefit to rural communities of receiving development assistance. It is therefore impossible to use the amount of funds spent on international development to estimate the net benefit, in terms of income growth, for stakeholder groups.
In addition, like the costs and benefits of forest protection themselves, the benefits of development assistance are not evenly distributed. It is likely that remote communities, who have often benefited least from development initiatives to date, also stand to gain least from the protection of the forest – they are unlikely to attract ecotourists, and may find it harder to move away from tavy, into, for example cash crops (see Nambena 2003).
The marginal utility of income, and the importance of compensation In calculating the global value of conserving the corridor, we have assumed constant marginal utility of income, i.e. that a dollar is worth the same to a poor Malagasy as it is to a rich Westerner. Under these assumptions, conservation of the corridor would increase aggregate global welfare (by 300m dollars or so). However, economists recognise that the value of a unit of income is not the same for all people. This effect, known as the “diminishing marginal utility of income”, means that income changes which affect poor people should be weighted more highly than those which affect the rich. In the case of the corridor, where costs are borne by the poor, and benefits accrue to the rich, this effect will substantially reduce the net value of conservation. In fact, using fairly conservative assumptions, it is easy to show that the net value of conservation would be strongly negative9, if benefits are not transferred from (rich) winners to (poor) losers or in economic parlance, if “compensation” is not paid. It cannot be stressed too strongly that, evaluated in terms of welfare, the positive net value of conservation is highly dependent on benefits being transferred and would almost certainly be negative were this not to be the case. The figure of 330m global NPV therefore assumes that winners compensate the losers.
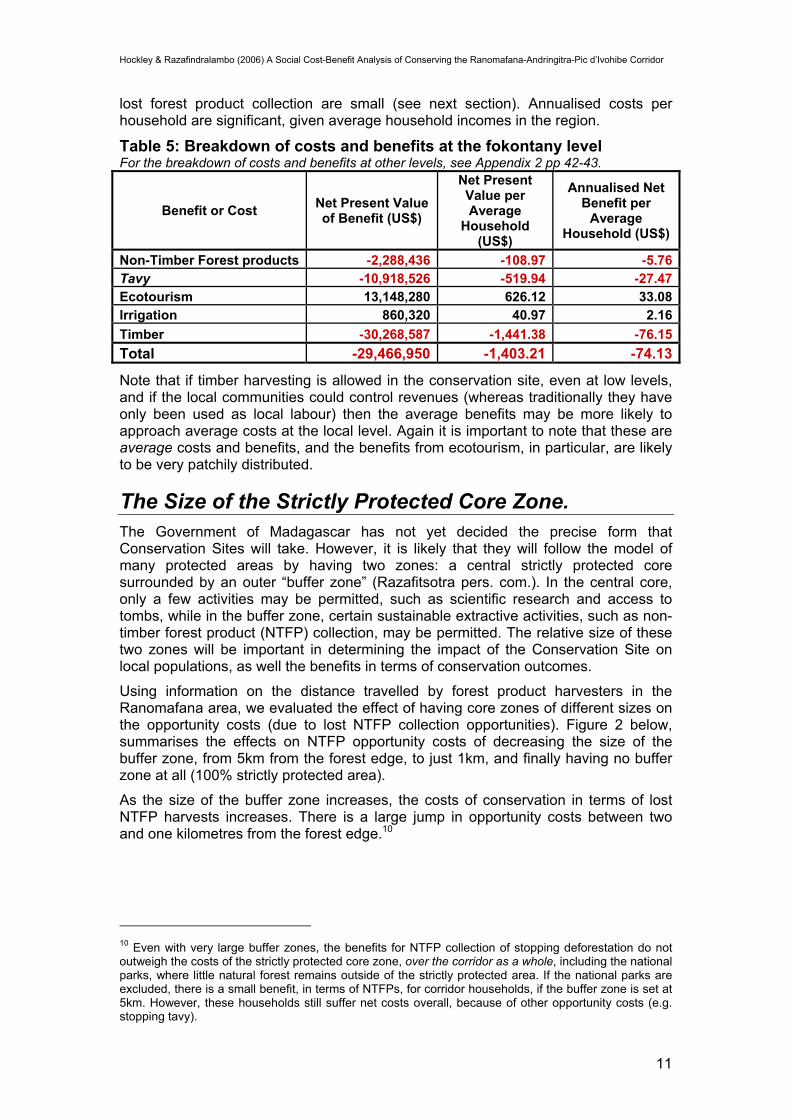
Costs at the Forest Frontier The most important net costs are felt at the level of those Fokontany which border the forest. Table 5, below, shows the breakdown of costs and benefits by type, and the average values per household. The opportunity costs of stopping tavy and timber exploitation represent the biggest costs, while ecotourism provides the largest benefits. With a buffer zone set at 3km from the forest edge, the opportunity costs of
9 For example, using a conservative value (1) for the elasticity of marginal utility of income, and weighting costs and benefits according to the relative incomes of the stakeholder groups they affect, turns the positive global net present value of US$330m negative by at least the same order of magnitude.
10
Hockley & Razafindralambo (2006) A Social Cost-Benefit Analysis of Conserving the Ranomafana-Andringitra-Pic d’Ivohibe Corridor
lost forest product collection are small (see next section). Annualised costs per household are significant, given average household incomes in the region.
Table 5: Breakdown of costs and benefits at the fokontany level For the breakdown of costs and benefits at other levels, see Appendix 2 pp 42-43.
Benefit or Cost Net Present Value of Benefit (US$)
Net Present Value per Average
Household (US$)
Annualised Net Benefit per
Average Household (US$)
Non-Timber Forest products -2,288,436 -108.97 -5.76 Tavy -10,918,526 -519.94 -27.47 Ecotourism 13,148,280 626.12 33.08 Irrigation 860,320 40.97 2.16 Timber -30,268,587 -1,441.38 -76.15 Total -29,466,950 -1,403.21 -74.13
Note that if timber harvesting is allowed in the conservation site, even at low levels, and if the local communities could control revenues (whereas traditionally they have only been used as local labour) then the average benefits may be more likely to approach average costs at the local level. Again it is important to note that these are average costs and benefits, and the benefits from ecotourism, in particular, are likely to be very patchily distributed.
The Size of the Strictly Protected Core Zone. The Government of Madagascar has not yet decided the precise form that Conservation Sites will take. However, it is likely that they will follow the model of many protected areas by having two zones: a central strictly protected core surrounded by an outer “buffer zone” (Razafitsotra pers. com.). In the central core, only a few activities may be permitted, such as scientific research and access to tombs, while in the buffer zone, certain sustainable extractive activities, such as non-timber forest product (NTFP) collection, may be permitted. The relative size of these two zones will be important in determining the impact of the Conservation Site on local populations, as well the benefits in terms of conservation outcomes.
Using information on the distance travelled by forest product harvesters in the Ranomafana area, we evaluated the effect of having core zones of different sizes on the opportunity costs (due to lost NTFP collection opportunities). Figure 2 below, summarises the effects on NTFP opportunity costs of decreasing the size of the buffer zone, from 5km from the forest edge, to just 1km, and finally having no buffer zone at all (100% strictly protected area).
As the size of the buffer zone increases, the costs of conservation in terms of lost NTFP harvests increases. There is a large jump in opportunity costs between two and one kilometres from the forest edge.10
10 Even with very large buffer zones, the benefits for NTFP collection of stopping deforestation do not outweigh the costs of the strictly protected core zone, over the corridor as a whole, including the national parks, where little natural forest remains outside of the strictly protected area. If the national parks are excluded, there is a small benefit, in terms of NTFPs, for corridor households, if the buffer zone is set at 5km. However, these households still suffer net costs overall, because of other opportunity costs (e.g. stopping tavy).
11

Results
Figure 2: The effect of increasing the size of the Strictly Protected Core Zone, on NTFP opportunity costs
The Costs of Different Noyau Dur Regimes
0
5
10
15
20
25
30
35
40
5 4 3 2 1 No Forest ProductCollection Permitted
Distance of Noyau Dur from Forest Edge
Ann
ualis
ed N
et C
ost p
er F
ores
t Edg
e H
ouse
hold
(U
S$)
Southern Extension of the Corridor to Vondrozo The biological priority-setting workshop identified the southern extension of the corridor, as far as the first major break at Vondrozo, to be of conservation importance. This southern extension includes large areas of lowland (<800m) forest, a habitat type very rare in the rest of the corridor. It also covers most of the global range of a critically threatened lemur, E. albocollaris. However, because of the lack of information about this area, we have restricted our analysis to the Ranomafana-Andringitra-Ivohibe corridor and we cannot evaluate many of the costs and benefits of this southern extension. However, it is possible to determine some of the international benefits of extending the Conservation Site southwards. Table 6, below, shows the added value, in terms of the non-use values of biodiversity, of conserving the Vondrozo extension. Extending the conservation site would increase its biodiversity value, in economic terms, by up to 50%, to US$ 375m.
Table 6: The biodiversity value of the Vondrozo extension
Ranomafana-Andringitra-Ivohibe Corridor
Vondrozo Extension Combined
International Non-Use Values of Biodiversity
(Mid Range Values, US$m)
237 138 375
Logging in the Conservation Site The results presented above assume that no logging will be permitted in the corridor under Scenario B. Using estimates provided by experts (workshop participants, Rasamisandy pers. com.) we estimated the economic benefits of permitting low impact, sustainable logging, in some parts of the corridor. For this we used the same
12

Hockley & Razafindralambo (2006) A Social Cost-Benefit Analysis of Conserving the Ranomafana-Andringitra-Pic d’Ivohibe Corridor
productivity per hectare per year as in the multiple rotation approach considered for scenario A (see above, and Appendix 1). However, we assumed a rotation length of 40, rather than 30 years, and further assumed that logging was only permitted in 1/3 of the buffer zone (0-3km from the forest edge). As for Scenario A, no machinery is used, and all timber is felled and extracted by hand. Table 7, below, shows our estimate of the benefits of such logging, and of the potential reduction in opportunity costs which such logging would produce.
Table 7: The benefits of sustainable logging in 1/3 of the buffer zone.
Stakeholder Group
Cumulative NPV of
Conservation Site (without
logging)
NPV of Logging
Benefits in 1/3 of buffer
zone
NPV of logging benefits per Ha
maximum potential % reduction
in opportunity
costs Forest Frontier Fokontany -29,466,950 2,784,423 40 9%Forest Frontier Communes -46,546,387 5,662,283 82 12%Corridor Regions -40,606,009 6,507,888 94 16%National 12,782,933 8,783,079 127 Total Net Benefit World 332,101,942 8,783,079 127 All values are US$ All values are cumulative, i.e. the value for Forest Frontier Communes, includes all of the Commune population, including those in the Forest Frontier Fokontany.
It cannot be stressed too strongly, that these are only the net benefits associated directly with logging and we are unable to make any assessment of the effect of allowing such logging on other values. For example, logging would affect biodiversity (Ganzhorn et al. 1990); carbon sequestration (Healey et al. 2000) and possibly ecotourism, although it would be unlikely to have any significant effect on hydrological function of the forest (Bruijnzeel 1990, 2004, Serpantié pers. com.). It is beyond the scope of this study to assess the likely magnitude of such effects. It is for this reason that the final column of the table is titled: potential reduction in opportunity costs. Permitting such logging may well reduce the global value of the corridor, as well as reducing the ability of local communities to benefit from ecotourism. Therefore, while permitting logging represents one way in which local opportunity costs could be reduced, particularly in areas with little ecotourism potential, it is by no means certain that it represents the most efficient solution.
Uncertainty and Sensitivity Uncertainty As with any similar study, considerable uncertainty exists as to the magnitude of net benefits at each stake holder level. Table 8 below shows the lower, upper and mid-range estimates of Net benefits at key stakeholder levels.
Table 8: Lower, mid-range and upper net benefits by stakeholder level
Stakeholder Level Lower Estimate US$
Mid-range Estimate US$
Upper Estimate US$
Total Benefit to Forest Frontier Fokontany -54,808,473 -29,466,950 -4,125,426 Total Net Benefit to Forest Frontier Communes -87,393,271 -46,546,387 -5,699,502 Total National -70,785,475 12,782,933 96,351,341 Total Net Benefit World 22,078,510 332,101,942 642,125,374
All values are cumulative, i.e. the value for Communes includes the Forest Frontier Fokontany
13

Results
This table shows that while the magnitude of net benefits is highly uncertain at all levels, the sign is robust at the local and global level. The positive net benefit at the national level is, however, marginal. Our mid-range estimate is positive, but this is highly vulnerable to changes in parameter values and in discount rate and time horizon (discussed below). Other studies have shown negative net present values at the national level for conservation elsewhere in Madagascar, (Kremen et al. 2000 for Masoala). It should be stressed again that no primary research was possible for this study, and therefore, the robustness of its conclusions depend on the quality of the original research and expert opinions, as well as the reliability of transferring values from one study to another. Considerable uncertainty therefore exists over the quantitative level of net benefits at all scales; however, the qualitative findings at the local and global level appear robust.
Sensitivity to Discount rate and Time horizon All the results above are calculated with a 5% discount rate and 60 year time horizon. Table 9 below shows the effect on the mid-range global value of reducing the time horizon to 40 years, and using a range of discount rates. As is commonly the case, lengthening the time horizon, and / or decreasing the discount rate tends to favour the case for conservation, but the global value is actually rather robust to changes in these key parameters. One reason for this is that both estimates of biodiversity value are one-off statements of value, essentially Net Present Values, and enter into the calculations only in year 1.
Table 9: Sensitivity of mid-range global values to discount rate and time horizon.
Time Horizon Discount Rate 40 60
0.03 330,151,776 448,267,445 0.05 287,432,396 332,101,942 0.08 257,073,241 268,067,452
0.1 247,515,481 251,991,010
At the national level, The NPV of Scenario B turns negative at discount rates of greater than 5.5%, (60yr) and 2% (40 yr) – showing how tenuous this positive national value is. This is because Madagascar captures only a small percentage of the global benefits of its conservation programs (see discussion). The NPV of scenario B at the fokontany level is negative at all discount rates using either a 40 or 60 year time horizon. Overall then, the conclusion of global benefits and local costs are extremely robust to discount rates, while the net benefit at the national level is tenuous.
14
Hockley & Razafindralambo (2006) A Social Cost-Benefit Analysis of Conserving the Ranomafana-Andringitra-Pic d’Ivohibe Corridor
Discussion
Costs and Benefits, Winners and Losers We have shown substantial global benefits of conservation, accompanied by significant local costs. In this, our results are unexceptional. The same story has been told by other studies here in Madagascar11 (Ferraro 2002, Kremen et al. 200012, Minten 2003, Shyamsundar & Kramer 1997), and elsewhere (see Balmford & Whitten 2003 for a review).
The ubiquity of the local costs of conservation is one reason for biodiversity loss worldwide. The global benefits of conservation, on the other hand, provide the justification for its conservation and for support from the international community. Global net benefits mean that we can and should conserve the corridor. Local costs mean that the corridor will not preserve itself, and that we must take deliberate action. The supply of biodiversity conservation, like that of any other good or service, will only be assured if its benefits are captured where they are highest (at the international level) and its costs are paid where they too are highest (at the local level).
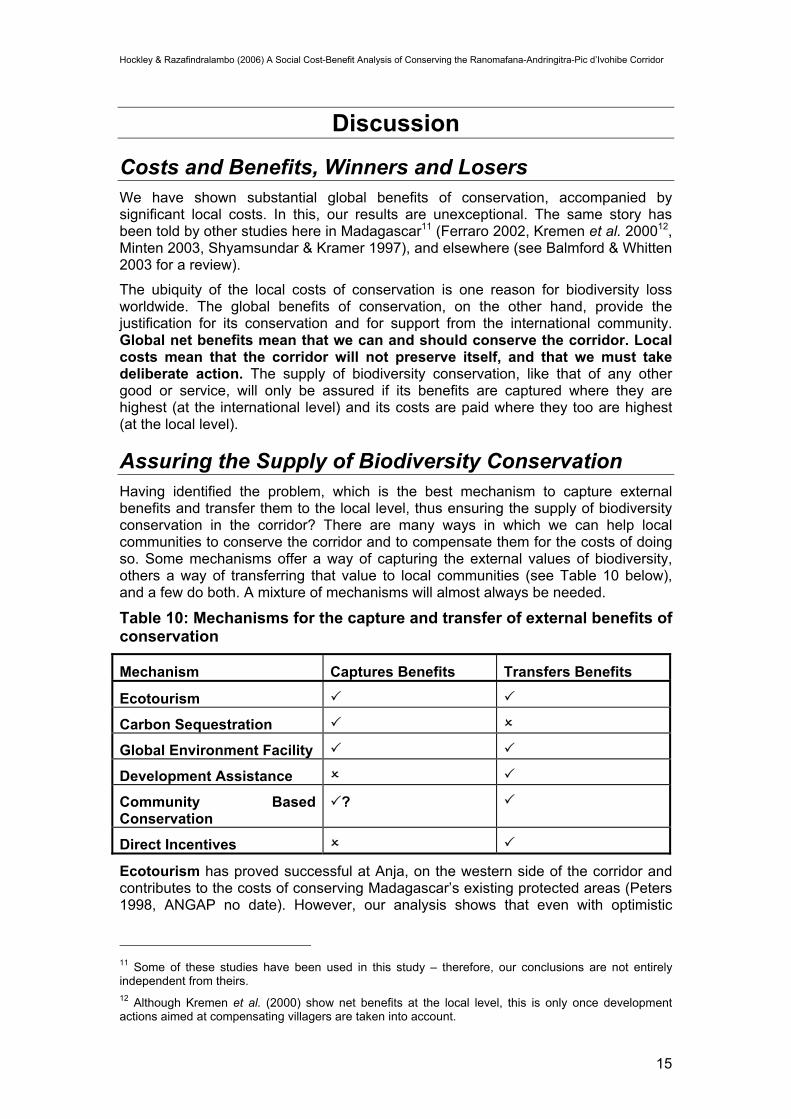
Assuring the Supply of Biodiversity Conservation Having identified the problem, which is the best mechanism to capture external benefits and transfer them to the local level, thus ensuring the supply of biodiversity conservation in the corridor? There are many ways in which we can help local communities to conserve the corridor and to compensate them for the costs of doing so. Some mechanisms offer a way of capturing the external values of biodiversity, others a way of transferring that value to local communities (see Table 10 below), and a few do both. A mixture of mechanisms will almost always be needed.
Table 10: Mechanisms for the capture and transfer of external benefits of conservation
Mechanism Captures Benefits Transfers Benefits
Ecotourism
Carbon Sequestration
Global Environment Facility
Development Assistance
Community Based Conservation
?
Direct Incentives
Ecotourism has proved successful at Anja, on the western side of the corridor and contributes to the costs of conserving Madagascar’s existing protected areas (Peters 1998, ANGAP no date). However, our analysis shows that even with optimistic
11 Some of these studies have been used in this study – therefore, our conclusions are not entirely independent from theirs. 12 Although Kremen et al. (2000) show net benefits at the local level, this is only once development actions aimed at compensating villagers are taken into account.
15
Discussion
predictions of growth in corridor ecotourism, it will be many years before it can play a substantial part in conserving the whole corridor.
Through the Kyoto protocol, developing countries can internalise some of the global benefits of carbon sequestration in their forests (Niesten et al. 2002). However, Madagascar is unlikely to realise more than a fraction of the true value of conserving the corridor through this mechanism. Furthermore, the bureaucratic hurdles involved mean that it may be several years before any money flows into the corridor from carbon sequestration. The Global Environmental Facility (GEF), administered by the World Bank and the UNDP, provides another mechanism by which rich countries can assist poor countries to protect their biodiversity. In doing so, it captures some of the substantial benefits which rich country citizens currently obtain free of charge (Menzel 2005). The projects it funds, in biodiversity rich countries, transfer these benefits to those bearing the costs of conservation.
Development assistance can significantly raise the incomes of forest edge communities, as well as making them less dependent on activities such as tavy, which conflict with conservation (LDI 2004). To be successful in achieving conservation, these benefits need to be made contingent on conserving the forest, and the links between development assistance and conservation have not always been tight enough to ensure this (Ferraro 2001). They may nevertheless be crucial to creating the wider conditions necessary for conservation on a regional level (Freudenberger 2003).
Community Based Conservation can help to increase the local benefits of improved natural resource management, but perhaps more importantly it can provide a vehicle for capturing and transferring the benefits of conservation at all scales, to those communities directly responsible for conserving the forest. This could be through enabling ecotourism, carbon sequestration, or providing a mechanism for the payment of direct incentives for biodiversity conservation (below). In this case, communities would be paid for their biodiversity conservation, which may go well beyond that demanded by their members, and even as far as strict protection.
A final mechanism is direct incentives for conservation (Durbin et al. 2001, Ferraro & Kiss 2002). Communities are paid, in cash or in kind, for achieving biodiversity conservation goals. Funding comes from conservation NGOs, the GEF, or carbon sequestration. This approach is relatively new, but has been trialled in the Menabe region of Madagascar (Durrell Wildlife Conservation Trust, 2005). The payment of direct incentives is likely to be complex where communal forests are concerned, and may rely on the presence of strong community management, as in the Durrell case.
With any mechanism, sustainability is a concern. However, it is important not to confuse sustainability with self-sufficiency. The world derives enormous external benefits from biodiversity conservation in Madagascar, and these are not likely to decrease in the near future. Given this, and the poverty of the country, there is no reason why conservation should be locally self-sufficient, or self-financing, for many years to come. To restrict our search to approaches which require no outside funding, or require it for only a limited period, is to make our task unnecessarily difficult.
16
Hockley & Razafindralambo (2006) A Social Cost-Benefit Analysis of Conserving the Ranomafana-Andringitra-Pic d’Ivohibe Corridor
Conclusion We have demonstrated a robust economic argument for the conservation of the Ranomafana – Andringitra – Pic d’Ivohibe corridor. Globally, society stands to gain by tens of millions of dollars annually as a result of the protection of the corridor. However, the benefits of forest protection are divided extremely unequally, with the heaviest costs being borne by some of the world’s poorest people. Although these costs can be minimised by carefully designing the conservation site in participation with local people, substantial costs will remain. If these are not compensated for, global welfare may suffer as a result of conservation.
Historically, no mechanism has existed to transfer benefits from those who gain from the forest’s existence, to those who threaten it (Balmford & Whitten 2003). This has led to a drastic undersupply of forest conservation. Today, although many are relatively untested, these mechanisms exist, and the future of the corridor, as well as the livelihoods of the people who live around it, will depend on them. Whichever methods are chosen, they must reach all areas of the corridor, and all sectors of the population who are affected. Furthermore, any benefits must be contingent upon the sound management and long lasting conservation of the corridor.
The existence of a positive global net present value for the preservation of the corridor represents both the argument for conserving it, and the means to do so. The corridor can be conserved - but only if we succeed in capturing the enormous external benefit of the corridor’s conservation and transferring it to local communities, and the nation of Madagascar.
17

Hockley & Razafindralambo (2006) A Social Cost-Benefit Analysis of Conserving the Ranomafana-Andringitra-Pic d’Ivohibe Corridor
References and Sources Quoted in the main report and appendices. Electronic copies of most documents are available on request from the 1st author.
Personal communications Annis, J. ERI, Fianarantsoa, Madagascar. August 2005. Rasamisandy, E. CIREEF, Eaux et Forêts, Fianarantsoa, Madagascar. August 2005 Serpantié, G. IRD, Antananarivo, Madagascar. April 2005 Randrianasolo, H. Conservation International, Antananarivo, Madagascar Razafitsotra, J. Conservation International, Fianarantsoa, Madagascar. April 2005.
Unpublished data ANGAP [unpublished data]. Available from the first author. Razafindralambo [unpublished data]. Available from the second author. VOI ANJA [unpublished data]. Available from the first author. Vokatry ny Ala [unpublished data]. Available from the first author.
References Alliance Ecorégionale (2005). Acte de l'Atelier Scientifique de Planification: Corridor Forestier Ranomafana - Andringitra - Pic d'Ivohibe pp 27. ANGAP (No Date). Evaluation de l'Impact Economique des Aires Protégées Balmford, A. & Whitten, T. (2003) Who should pay for tropical conservation, and how could the costs be met. Oryx, 37, 238-250. Bateman, I.J., Carson, R.T., Day, B., Hanemann, W.M., Hanley, N., Hett, T., Jones-Lee, M., Loomes, G., Mourato, S., Özdemiroglu, E., Pearce, D.W., Sugden, R., & Swanson, J. (2002) Economic Valuation with Stated Preferences Techniques: A Manual. Edward Elgar, Cheltenham, UK. Blamey, R. (1996). Citizens, consumers and contingent valuation: clarification and the expression of citizen values and issue-opinions. In Forestry, Economics and the Environment (eds W.L. Adamowicz, P.C. Boxall, M.K. Luckert, W.E. Phillips & W.A. White). CAB International, Wallingford. Blue, E.N. & Tweeten, L. (1997) The estimation of marginal utility of income for application to agricultural policy analysis. Agricultural Economics, 16, 155-169. Blumenthal, D. & Jannink, J.L. (2000) A classification of collaborative management methods. Conservation Ecology, 4, art. no.-13. Brand, J., Healy, T., Keck, A., Minten, B., & Randrianarisoa, C. (2002). Truths and myths in watershed management: the effect of upland deforestation on rice productivity in the lowlands, Policy Brief. FOFIFA Programme ILO. August 2002. pp 5. Brand, J., Healy, T., Keck, A., Minten, B., & Randrianarisoa, C. (2002). Réalités et mythes sur l'aménagement des bassins versants : l'effet de la déforestation des pentes sur la productivité de riz dans les plaines, Policy Brief. FOFIFA Programme ILO. August 2002. pp 5. Bruijnzeel, L.A. (1990). Hydrology of moist tropical forests and effects of conversion: a state of knowledge review. UNESCO, Paris. pp 225. Bruijnzeel, L.A. (2004) Hydrological functions of tropical forests: not seeing the soil for the trees? Agriculture, Ecosystems and Environment, 104, 185–228.
18

References & Sources
Carret, J.-C. & Loyer, D. (2003). Madagascar protected area network sustainable financing economic analysis perspective, Paper Presented at the World Parks Conference, Durban, South Africa, 11th-15th September, 2003. pp 11. Chambers, R. (1994) The Origins and Practice of Participatory Rural Appraisal. World Development, 22, 953-969. Chomitz, K.M. & Kumari, K. (1996). The Domestic Benefits of Tropical Forests A Critical Review Emphasizing Hydrological Functions, POLICY RESEARCH WORKING PAPER Rep. No. 1601. World Bank. May 1996. Chomitz, K.M. & Kumari, K. (1998) The domestic benefits of tropical forests: A critical review. World Bank Research Observer, 13, 13-35. Dixon, J.A., Carpenter, R.A., Fallon, L.A., Sherman, P.B., & Manopimoke, S. (1986) Economic analysis of the environmental impacts of development projects Earthscan Publications, London. du Toit, J.T., Walker, B.H., & Campbell, B.M. (2004) Conserving tropical nature:current challenges for ecologists. Trends in Ecology & Evolution, 19, 12-17. Durbin, J., Andrianarimisa, A., & DeCosse, P.J. (2001). Le Potentiel des Contrats de Conservation pour Contribuer à la Conservation de la Biodiversité à Madagascar - The Potential of Conservation Contracts to Contribute to Biodiversity Conservation in Madagascar, Unpublished Report to PAGE, Madagascar November 2001. pp 36. Durrel Wildlife Conservation Trust (2005). Suivi écologique participatif 2004 de la forêt du nord de Menabe central. Durrell WCT., Antananarivo, Madagascar. ESRI (2002). ArcView GIS. Vers: 3.3. Evans, D.J. (2005) The elasticity of marginal utility of consumption: Estimates for 20 OECD Countries. Fiscal Studies, 26, 197-224. FAO (2001). Global Forest Resources Assessment 2000 Main report. Rep. No. 140. FAO, Rome. Ferraro, P.J. (1994) Natural Resource Use in the Southeastern Rain Forests of Madagascar and the Local Impacts of Establishing the Ranomafana National Park. Masters, Duke University. Ferraro, P.J. (2001) Global Habitat Protection: Limitations of Development Interventions and a Role for Conservation Performance Payments. Conservation Biology, 15, 990-1000. Ferraro, P.J. (2002) The local costs of establishing protected areas in low-income nations: Ranomafana National Park, Madagascar. Ecological Economics, 43, 261-275. Ferraro, P.J. & Kiss, A. (2002) Direct payments to conserve biodiversity. Science, 298, 1718-1719. Freudenberger, K.S. (2003). The Fianarantsoa-East Coast railroad and its role in Eastern forest conservation. In The natural history of Madagascar (eds S.M. Goodman & J.P. Benstead), pp. xxi+1709. University of Chicago Press, Chicago & London. Ganzhorn, J.U., Ganzhorn, A.W., Abraham, J.P., Andriamanarivo, L., & Ramananjatovo, A. (1990) The Impact of Selective Logging on Forest Structure and Tenrec Populations in Western Madagascar. Oecologia, 84, 126-133. Green, G.M. & Sussman, R.W. (1990) Deforestation History of the Eastern Rain Forests of Madagascar from Satellite Images. Science, 248, 212-215. Hadker, N., Sharma, S., David, A., & Muraleedharan, T.R. (1997) Willingness-to-pay for Borivli National Park: Evidence from a contingent valuation. Ecological Economics, 21, 105-122.
19

Hockley & Razafindralambo (2006) A Social Cost-Benefit Analysis of Conserving the Ranomafana-Andringitra-Pic d’Ivohibe Corridor
Hawkins, F. & Horning, N. (2001). Forest cover change in USAID and control areas. A preliminary evaluation and report to USAID and partners. PAGE, Antananarivo. July 2001. pp 21. Healey, J.R., Price, C., & Tay, J. (2000) The cost of carbon retention by reduced impact logging. Forest Ecology and Management, 139, 237-255. HM Treasury (2003) The Green Book - Appraisal and Evaluation in Central Government HMSO, London. Irwin, M.T., Johnson, S.E., & Wright, P.C. (2005) The state of lemur conservation in south-eastern Madagascar: population and habitat assessments for diurnal and cathemeral lemurs using surveys, satellite imagery and GIS. Oryx, 39, 204-218. Joubert, A.R., Leiman, A., deKlerk, H.M., Katua, S., & Aggenbach, L.C. (1997) Fynbos (fine bush) vegetation and the supply of water: a comparison of multi-criteria decision analysis and cost-benefit analysis. Ecological Economics, 22, 123-140. Kahneman, D. & Knetsch, J.L. (1992) Valuing public goods: the purchase of moral satisfaction. Journal of Environmental Economics and Management, 22, 57-70. Kramer, R.A. & Mercer, D.E. (1997) Valuing a global environmental good: US residents' willingness to pay to protect tropical rain forests. Land Economics, 73, 196-210. Kremen, C., Niles, J.O., Dalton, M.G., Daily, G.C., Ehrlich, P.R., Fay, J.P., Grewal, D., & Guillery, R.P. (2000) Economic incentives for rain forest conservation across scales. Science, 288, 1828-1832. See also Supplementary Information on CD and Web. Kula, E. (2004) Estimation of a social rate of interest for India. Journal of Agricultural Economics, 55, 91-99. Kull, C.A. (2004) Isle of fire. The political ecology of landscape burning in Madagascar University of Chicago Press, Chicago & London. Lambert, P.J., Millimet, D.L., & Slottje, D. (2003) Inequality aversion and the natural rate of subjective inequality. Journal of Public Economics, 87, 1061-1090. LDI (2004). Final Report March 2004. Lean & Rowntree (1993) A GCM simulation of the impact of Amazonian deforestation on climate using an improved canopy representation. Quarterly Journal of the Royal Meteorological Society, 119, 509-530. Menzel, S. (2005). Financial support for biodiversity protection in developing countries – does the CBD mechanism lead to an appropriate level of biodiversity protection? In Valuation and Conservation of Biodiversity Interdisciplinary Perspectives on the Convention on Biological Diversity (eds M. Markussen, R. Buse, H. Garrelts, M.A. Manez Costa, S. Menzel & R. Marggraf), pp. xxx, 430 p. 57 illus. Springer. MIARO (2005) Le corridor Ranomafana - Andringitra - Ivohibe et les principales zones de deforestation. MIARO. Minten, B. (2003) Compensation and cost of conservation payments for biodiversity. Minten, B., Randrianarisoa, J.-C., & Randrianarison, L., eds. (2003) Agriculture, pauvreté rurale et politiques économiques à Madagascar, pp 107. FOFIFA, Antananarivo. Mittermeier, R.A., Robles Gil, P., Hoffmann, M., Pilgrim, J., Brooks, T., Mittermeier, C.G., Lamoreux, J., & da Fonseca, G.A.B., eds. (2004) Hotspots Revisited, pp 391. CEMEX. Moseley, W. G. (2001) African Evidence on the Relation of Poverty, Time Preference and the Environment. Ecological Economics, 38, 317-326.
20
References & Sources
Nambena, S.M. (2003) Using Geographic Information Systems to Assess Possibilities of Expanding Traditional Agroforestry in Slash-and-Burn Zones in Madagascar. Mountain Research and Development, 23, 329–333. Niesten, E., Frumhoff, P.C., Manion, M., & Hardner, J.J. (2002) Designing a carbon market that protects forests in developing countries. Philosophical Transactions of the Royal Society of London Series a-Mathematical Physical and Engineering Sciences, 360, 1-14. OECD (2004) Quarterly Labour Force Statistics. Pearce, D. (1998) Cost-benefit analysis and environmental policy. Oxford Review of Economic Policy, 14, 84-100. Peters, J. (1998) Sharing national park entrance fees: Forging new partnerships in Madagascar. Society & Natural Resources, 11, 517-530. Price, C. (1993) Time, Discounting and Value. Blackwell, Oxford. Price, C. (No Date). Economic valuation of biodiversity: a consequentialist pilgrimage, SAFS Monograph. University of Wales, Bangor, Bangor. Sader, S.A. (1995) Spatial Characteristics of Forest Clearing and Vegetation Regrowth as Detected by Landsat Thematic Mapper Imagery. Photogrammetric Engineering and Remote Sensing, 61, 1145-1151. Sharma, R.A., McGregor, M.J., & Blyth, J.F. (1991) The Social Discount Rate for Land-Use Projects in India. Journal of Agricultural Economics, 42, 86-92. Shyamsundar, P. & Kramer, R. (1997) Biodiversity Conservation - At What Cost? A Study of Households in the Vicinity of Madagascar's Mantadia National Park. Ambio, 26, 180-184. Simpson, R.D., Sedjo, R.A., & Reid, J.W. (1996) Valuing biodiversity for use in pharmaceutical research. Journal of Political Economy, 104, 163-185. Tisdell, C., Wilson, C., & Nantha, H.S. (2005) Policies for saving a rare Australian glider: economics and ecology. Biological Conservation, 123, 237-248. Tol, R.S.J. (2005) The marginal damage costs of carbon dioxide emissions:an assessment of the uncertainties. Energy Policy, 33, 2064–2074. Turpie, J.K. (2003) The existence value of biodiversity in South Africa: how interest, experience, knowledge, income and perceived level of threat influence local willingness to pay. Ecological Economics, 46, 199-216. UNDP (2005) Human Development Report 2005. UNDP, New York. van Beukering, P.J.H., Cesar, H.S.J., & Janssen, M.A. (2003) Economic valuation of the Leuser National Park on Sumatra, Indonesia. Ecological Economics, 44, 43-62. van Kooten, G.C., Eagle, A.J., Manley, J., & Smolak, T. (2004) How costly are carbon offsets? A meta-analysis of carbon forest sinks. Environmental Science & Policy, 7, 239-251. Verissimo, A., Barreto, P., Mattos, M., Tarifa, R., & Uhl, C. (1992) Logging Impacts and Prospects for Sustainable Forest Management in an Old Amazonian Frontier - the Case of Paragominas. Forest Ecology and Management, 55, 169-199. Weitzman M (2001) Gamma Discounting, American Economic Review, 91, 260-271.
21

Hockley & Razafindralambo (2006) A Social Cost-Benefit Analysis of Conserving the Ranomafana-Andringitra-Pic d’Ivohibe Corridor
Appendix 1: Full Methods This Appendix describes in detail the methods used in the cost-benefit analysis. It summarises the assumptions made, and the sources used in the calculation. The full, original calculations are also available, on request, from the authors.
Currencies, Time Horizon and Net Present Values All figures are presented in 2005 US$. Dollar values taken from other studies were converted to 2005 dollars using a Consumer Price Index-based deflator, provided by the Bureau of Labor Statistics (http://www.bls.gov/cpi/). Unless otherwise stated by the authors of a study, we take all values to be in the year prior to the publication date of that study.
Values in other currencies (FMG, Ariary or Euros) were converted to US$ using the exchange rate at the time of the relevant study (mid-year, median, inter-bank exchange rate as quoted by FX Currency Converter (http://www.oanda.com/convert/classic). These dollar values are then converted to 2005 dollars as above.
We present all costs and benefits as Net Present Values (NPVs), using a discount rate of 5% (see below) and a time horizon of 60 years. We discuss the effects of changing the discount rate or time horizon above. The time horizon is similar to, though slightly longer than that normally adopted for such appraisals (see for example Dixon et al. 1986) reflecting the long term nature of the scenarios – logging rotations are evaluated over 30-60 years for example.
Social Discount Rate Choosing the Social Discount Rate (SDR) to use in a Social Cost-Benefit Analysis is extremely difficult. The SDR used in a study determines the relative weight given to communal consumption at different points in time (Kula 2004). The rate used can have a significant effect on both the quantitative and qualitative results of a study. Numerous authors now regard the social time preference rate, rather than the opportunity cost of public investment, to be the principal justification for discounting in social cost-benefit analyses (e.g. Kula 2004, see also Price 1993 for a full discussion). This is particularly true of projects with significant non-market or non-financial benefits and costs, and inter-generational implications. This view is not confined to academics – since 2003, for example, the UK treasury has required all government projects, including overseas assistance, to be discounted using an appropriate SDR based on social time preference rate (HM Treasury 2003).
The SDR should be appropriate for the community affected by the project. In our case, we are concerned with several communities: local people living close to the forest corridor; the rest of Madagascar; and the rest of the world, in particular residents of high income OECD countries. For simplicity, and because of the limited data available, we considered two communities: Madagascar, and the high income OECD. Unfortunately, though estimates of SDR for high income countries are becoming more common, very few exist for developing countries. To our knowledge, the estimates of India’s SDR as 5.2% by Kula (2004) and 2% by Sharma et al. (1991) remain the only published estimates.
The Social Discount Rate is composed of two components. First, a rate of pure time preference (p) which reflects the tendency for people to prefer consumption now rather than later, regardless of their expectation of changes in per capita
I

Appendix 1: Full Methods
consumption. The second component reflects the diminishing marginal utility of income, as income rises. It is composed of the per capita growth in consumption (g), and the elasticity of the marginal utility of income, e. These are combined according to the following formula:
SDR = (e x g) + p (c.f. HM Treasury 2003, Kula 2004)
Pure Time Preference Rate p HM Treasury (2003) interprets this as being composed of two sub-components, “Catastrophe risk” and “Pure time preference”. Catastrophe risk is the risk of a catastrophic event, such as natural disaster, which eliminates all returns from the policies under evaluation. This can also include positive developments, such as technological advancement, which render the policy obsolete. Pure time preference represents “individuals’ preference for consumption now, rather than later, with an unchanging level of consumption per capita over time” HM Treasury (2003). Kula (2004) on the other hand, interprets this as being the mortality rate, m, with an individual’s expected mortality providing the justification for pure time preference.
For all practical purposes, the distinction between these two interpretations is not important, since estimates of the two factors for developed countries do not differ widely, and no estimate exists for the former for developing countries.
HM Treasury (2003) reports estimates of p of 1.5, 1.3 and between 1.0 and 1.6 (Scott [1977] Scott [1989] OXERA [2002] respectively, quoted in HM Treasury [2003]). Kula (2004) taking p to be the mortality rate, uses 1.3 for the period 1965-1995 for India. The current mortality rate13 for Madagascar is around 1.3 (WHO 200614). The various figures are summarised in Table A1 below.
Table A1: Estimates of the pure rate of time preference. Madagascar High Income OECD
Estimate Type Source Estimate Type Source 1.21 Mortality rate, reflecting
expected increase in life expectancy
1 Mortality rate Evans (2005) for High Income OECD
1.3 Mortality Rate WHO 2006
1.3 Pure Time Preference, for UK/USA
Scott (1989)
1.32 (1.0-1.6)
Pure Time Preference, for UK/USA
OXERA (2002) for UK
1.53 Rate of time preference.
HM Treasury (2003)
1.5 Pure Time Preference, for UK.
Scott (1977). Adopted by HM Treasury (2003)
Notes on Table: 1Mortality rates would be expected to fall in Madagascar in the future, as they have in the past, though this may depend on the rate of economic growth. 2Midpoint value, range reported by the authors is given in brackets. 3This value could be justified by arguing that a developing country would not be expected to have a pure rate of time preference less than that considered suitable for the UK. This of course presupposes that the UK rate is suitable.
13 WHO publish age-standardized death rates, to allow comparisons between countries with different age structures. However, the economically relevant death rate is the uncorrected one. There is only a small difference between uncorrected rates for developing and developed countries, since the former tend to have relatively more young people, reducing their death rates despite poorer public health. 14 http://www.who.int/ncd_surveillance/infobase/web/InfoBasePolicyMaker/CountryProfiles/QuickCompare.aspx?DM=10&Countries=450&Year=2002&sf1=mo.cg.990&Sex=all
II

Hockley & Razafindralambo (2006) A Social Cost-Benefit Analysis of Conserving the Ranomafana-Andringitra-Pic d’Ivohibe Corridor
Growth of Per Capita Consumption g The growth rate of per capita consumption in real terms (g) is highly problematic, for two reasons. The first problem is one of statistical availability: no reliable statistics are available on consumer spending for Madagascar (c.f. Kula [2004], Evans [2005]). Therefore we need to use some proxy for these, such as gross domestic product (GDP) or Gross National Income (GNI). Even more difficult, we need to predict the growth rate over the next 40-60 years. Even for a country which has shown relatively stable economic growth over the last 40 years, such as the UK, this would be a formidable challenge. In Madagascar, on the other hand, growth has been patchy and largely negative: annual GDP per capita growth between 1975 and 2003 was -1.6%, and that between 1990 and 2003 was -0.9% (UNDP 2005). Extrapolating these rates into the future would lead to a negative discount rate! However, for the last five years or so growth rates (however measured) have been better, but still highly unstable: ranging from -15.1% in 2002, to 6.8% in 2003. Ignoring these years15, the average has been around 2.5%.
Faced with such uncertainty, it is probably sensible to take a broader view, and consider the average performance, past and future, of developing countries. Average annual growth rate in GDP per capita, between 1975 and 2003 has been 2.3% across all developing countries (UNDP 2005). Sub-saharan Africa has averaged -0.7%, while the rate for East Asia and the Pacific, is much higher, at 6%. The World Bank (200616) forecasts sub-Saharan Africa to grow (real GDP per capita) with an average annual rate of 3.2% per year between 2004 and 2008.
For Madagascar, therefore, it seems reasonable to adopt an upper figure of 3.2% and a lower figure of 2.3%, while bearing in mind the possibility that it could be considerably lower. The High-Income OECD grew at an average of 2.2% p.a. from 1975-2003. World Bank predictions are for continued growth at an average 2.5% per year between 2004 and 2008 (World Bank 2006).
Table A2: Estimates of per capita growth rates. Madagascar High Income OECD
Estimate Region and Period
Source Estimate Type Source
-1.6% Madagascar, 1975-2003
UNDP 2005
2.2% High Income OECD 1975-2003
UNDP 2005
2.3% Developing countries, 1975-2003
UNDP 2005
3.2 Sub-Saharan Africa 2004-2008
World Bank 2006
2.5% 2004-2008 World Bank 2006
15 The very low figure for 2002 is due to the political and social crisis which gripped the country during this year, while the very high figure for 2003 obviously reflects a partial bounce back by the economy from an artificially low level. Over the five year period the economy still shrank by 2.5%. It is tempting to regard such events as exceptional, but a glance at Madagascar’s modern history makes this seem unwise. A five year period is a suitable period over which to evaluate the effects of such political crises, tied as they are to presidential elections, which occur every 4-5 years. 16 http://web.worldbank.org/WBSITE/EXTERNAL/EXTDEC/EXTDECPROSPECTS/EXTGBLPROSPECTSAPRIL/0,,menuPK:659178~pagePK:64218926~piPK:64218953~theSitePK:659149,00.html
III

Appendix 1: Full Methods
Elasticity of Marginal Utility of Consumption (e) This is perhaps the most difficult parameter to estimate, and again, while estimates for developing countries are relatively numerous, those for developing countries are very rare.
It is often assumed that elasticity is constant across all incomes, and therefore may be the same across all countries, but evidence for this is hardly overpowering, with little empirical support for constant elasticity (though see Blue & Tweeten 1997).
Kula (2004) and Sharma (1991) provide the only estimates of e for developing countries, while HM Treasury (2003) recommends using unity. Evans (2005) suggests the appropriate value for developed countries may be close to 1.4.
Table A3: Estimates of e the elasticity of marginal utility of consumption Madagascar High Income OECD
Estimate Region and Period
Source Estimate Source
1 UK HM Treasury (2003)
0.95 (0.8-1.1)
UK OXERA (2002)
1.4 India Sharma et al (1991)
1.1 (0.7-1.5)
UK Pearce & Ulph (1995)17
1.64 India Kula (2004)
1.4 Hi Income OECD
Evans (2005)
Note: Where authors give a range, the midpoint is quoted, with the range in brackets.
Estimates of the Social Discount Rate Using the various estimates given in Tables A1-A3 above, we calculate upper, lower and medium values for the SDR (Table A4, below).
Table A4: Estimates of social discount rates (SDR)
Community High Incom OECD Madagascar
Value Low Med High Low Med High
p 1.00 1.30 1.50 1.20 1.30 1.50
g 2.20 2.35 2.50 -1.60 2.30 3.20
e 0.95 1.10 1.40 1.64* 1.40 1.64
SDR 3.09 3.89 5.00 -1.42 4.52 6.75 *Because of the negative value for g, the highest value for e gives the lowest value for the SDR.
In principle, the rate for each community should be applied separately to their respective costs and benefits: the Cost-Benefit Analysis would therefore have more than one discount rate.
In practice, given the high degree of uncertainty associated with the estimates, and the fact the OECD estimate is entirely contained within the Madagascar estimate, we have used a single discount rate (5%) throughout the appraisal, but have carried out sensitivity analyses using rates from 3 to 10%.
17 Cited in HM Treasury (2003)
IV

Hockley & Razafindralambo (2006) A Social Cost-Benefit Analysis of Conserving the Ranomafana-Andringitra-Pic d’Ivohibe Corridor
Why is the rate adopted so low? Many people used to conventional economic appraisal, particularly from the last century, may be surprised at the choice of such a low principal discount rate (5%) in this study, even though it is towards the upper range of reasonable estimates18. It is true that in the past organisations like the World Bank, as well as finance ministries, used much higher discount rates, particularly in the developing world. The choice of a lower rate here reflects both a change in the basis for the discount rate (no longer based on opportunity cost of capital) but also more realistic estimates of growth rates over sustained periods.
In addition, there has perhaps been a persistent misunderstanding of the relationship between poverty and discount rates. It is often contended, usually without evidence, that the poor must have higher discount rates than the rich. Yet proper reflection on the reasons for discounting shows this to be untrue. Although poor people have higher mortality rates than the rich, the difference is small (of the order of 0.2-0.5%). The principal basis for discounting, whether one considers social discount rates or financial discount rates, is some expectation that “life will get better”, or that investments will bear fruit. In SDR, this is represented by the term “eg”. Where the rate of improvement in life (g) is multiplied by the effect of this improvement on the value of income (e). If one is chronically poor, like most rural Malagasy, one can only expect life to get better gradually, if at all, and there is no reason why we would expect a chronically poor person to have a high discount rate. Indeed, in the “extreme” case of zero or negative growth, (which has been the reality for many developing countries over the last 30 years) one can expect very low or even negative discount rates. This is in sharp contrast to someone who is acutely poor. For example, an otherwise comfortable person stricken by a famine or other disaster can reasonably expect things to get much better, very quickly, if they can only survive the present. Such a person may be expected to have a relatively high discount rate, just like any other person who expects their income to increase dramatically: the discount rate is independent of the starting point. The truth is that for most of the world’s poor, life is less dramatic: they have a relatively low chance of dying in any given year, and can expect things to be pretty much the same in the future, as they have been in the past. The absence of any state funded welfare safety net in most developing countries may also lower people’s discount rates. Moseley (2001) provides empirical evidence for low discount rates among poor people in Africa, and counsels against presuming high discount rates when looking for explanations of environmental conversion (e.g. deforestation) by the poor.
In fact, the rate used is likely to be on the high side, for many reasons:
Firstly, it is important to note that some authors (e.g. Price 1993) have questioned discounting on the basis of mortality or pure time preference, for social projects, and therefore the inclusion of the mortality rate in the SDR. Excluding it would lower the rate by just over 1%.
Secondly, the rate chosen is almost certainly too high for some sectors of the population, including High Income OECD beneficiaries, and, perhaps, those poorest members of society whose income may be expected to grow at a lower rate than better placed members of society.
Finally, HM Treasury (2003, Annex 6) state that when projects are evaluated over periods longer than 30 years, the discount rate used should fall over time:
18 The use of much higher rates (10%) in the sensitivity analysis, is designed, in part, to address the concerns of this group.
V
Appendix 1: Full Methods
“The main rationale for declining long-term discount rates results from uncertainty about the future. This uncertainty can be shown to cause declining discount rates over time” Weitzman (2001).
Population and Household Size We use commune population figures from the ILO census (Minten et al. 2003). Unfortunately, population figures are not easily available below the commune level. The proportion of the corridor communes’ populations living in fokontany bordering the forest was estimated from those communes for which we were able to collect fokontany population figures at first hand. We then calculated a weighted average of these proportions and applied it to the total corridor population to give a corridor wide estimate (35%, based on figures from five communes).
An estimate of mean household size is extremely important since the analysis often required the multiplication of figures estimated “per household” by overall population estimates. Unfortunately, the number of people in a household depends on the definition of a household, and sources do not always specify their mean household size. We have two estimates of mean household size in the corridor. Ferraro (1994) calculated a household size of six persons, while information received from several communes indicates an average of 8.5 persons. For calculations involving only Ferraro’s (1994) estimates, we use Ferraro’s estimate of household size. For all other calculations we used the average (weighted by sample size) of all estimates (8.3).
Extent of “The Corridor” and Scope of the Analysis In this analysis the corridor has been taken to run from Ranomafana National Park in the north, to Andringitra National Park and Pic d’Ivohibe Special Reserve in the south. However, we structured the analysis to allow it to be easily extended further north or south as necessary, although this would require collecting additional local data. In fact, most of the analysis could easily be applied to other protected areas in Madagascar, using locally relevant parameters.
We have not included in the analysis the low altitude forest fragments to the east of the corridor, identified by the biological priority-setting workshop (Alliance Ecorégionale [2005]). It is unlikely that the inclusion of these would greatly affect any of the results. Nor have we extended the analysis fully to cover the proposed southern extension of the corridor, to Vondrozo. However we do consider the increase in global biodiversity benefits from conserving this area.
Forest Cover and Deforestation Deforestation Rates Deforestation between 1990 and 2000 was approximately 1.12% per year, across all altitude classes (MIARO 2005). Under scenario A, the null scenario, we have assumed that deforestation will continue at this rate, for the rest of the period considered by this study (60 years).
This assumption may be unsafe, for two reasons. Firstly, Green and Sussman (1990) found that in high population density areas (>5 people per km2) of the eastern rainforests; deforestation rates fell from 2.5% per year between 1950-1973 to 0.79% per year during 1973-1985, because suitable land for clearance gradually became exhausted. Most corridor areas are high density according to Green and Sussman’s study and it is possible that deforestation rates would fall as suitable land becomes limiting.
VI
Hockley & Razafindralambo (2006) A Social Cost-Benefit Analysis of Conserving the Ranomafana-Andringitra-Pic d’Ivohibe Corridor
Secondly, it must be noted that the deforestation estimate we use was calculated over a period when considerable foreign funded activity was taking place in the region with the aim of reducing deforestation. Hawkins and Horning (2001) suggest this activity may have succeeded in achieving this aim. In that case, the “real” deforestation rate, in the absence of conservation interventions, may be much higher.
These two potential biases would tend to act in opposite directions and it is beyond the scope of this study to inquire in greater depth into the driving forces of deforestation rates and to predict a true, real deforestation rate for the next 60 years. We therefore use the figure of 1.12%.
Forest Cover In order to derive an estimate of forest cover in 2005, we use the MIARO (2005) estimate of forest cover in 2000 (384,104 ha), and the deforestation rate (see above), and extrapolate using this deforestation rate to 2005, to give an estimated cover for the end of 2005 of 359,107 ha.
In order to estimate the area of forest that would be included in a strictly protected core zone, we have used a surface of natural forest cover created by PACT in 2000, and created buffers of 1,2,3,4 and 5km from the forest edge using ArcView 3.3 (ESRI 2002). We then calculated the proportion of forest in each of these bands, and applied these proportions to the estimated forest cover for 2005, to give an up to date estimate of the area of forest likely to be found in each band. These areas are used when calculating the opportunity costs, management costs or benefits arising from the forest under strict protection (see below).
Non-Timber Forest Product Collection The value of forest product collection to households No estimate exists for the value of non-timber forest product19 (NTFP) collection along the full length of the corridor. The most suitable estimate comes from Ferraro (1994, 2002), who estimated the opportunity cost of lost forest product collection rights20 to local communities surrounding the then newly established Ranomafana National Park. He found these to be approximately US$ 26 per household per year (Ferraro 1994, p80). We have used this as an estimate of the total net benefits of forest product collection from primary forest within the Conservation Site, and applied it to households in Forest Frontier Fokontany along the whole of the corridor.
At the April workshop, we were able to collect a great deal of qualitative data from a number of communities, which we used to determine whether the types of NTFPs collected and the systems of collection, use and commercialisation seemed similar to that described by Ferraro. We concluded that the corridor as a whole appeared to be similar to Ranomafana and that it would be reasonable to use Ferraro’s estimates as an approximation for the whole corridor. This may nevertheless be an underestimate of the value of NTFP collection from the Conservation Site since in the case of Ranomafana, not all primary forest was included in the park, whereas in the case of the corridor, we assume that all primary forest is included within the Conservation Site.
19 We have included in this category the harvesting of wood for subsistence use, but not the extraction of timber for commercial reasons, which is dealt with below. 20 Including traditional “rights” which may not be recognised in law, but were nonetheless believed by local people.
VII
Appendix 1: Full Methods
Ferraro makes no estimate of the effect of losing forest to agriculture, nor does he take account of substitutions which residents may be able to make away from forest products (Ferraro 1994, pp 39-40). Because these are crucial to determining the effect of the conservation site, we attempt to take account of these effects (see below). Ferraro’s estimates are, however, net benefits (subtracting labour costs) so we make no further adjustment for this.
In extrapolating from Ferraro (1994), we have deliberately used estimates of NTFP value per household, rather than per hectare. We believe this to be much more accurate (see for example Chomitz & Kumari 1998 p28) because, very often, much of the forest is under-utilised for NTFPs, and it is the number of people living around the forest and available markets rather than the quantity of forest, which determines the quantity and value of NTFPs extracted.
The opportunity costs of the Conservation Site In the case of Ranomafana, all NTFP collection was prohibited within the park, and therefore residents were expected to lose all access to this forest. In the case of a Conservation Site in the corridor, we have assumed that only a part of the forest would be designated as a strictly protected core zone in which NTFP collection would be prohibited21.
Both scenario A and B allow some NTFP harvesting therefore. The difference is that under scenario A, forest at the edge is gradually lost to tavy, which may reduce the amount of NTFPs that can be harvested. In Scenario B, however, no forest is lost to tavy (tending to increase the value of NTFP harvesting relative to A) yet some forest in the centre of the corridor is lost to the strictly protected core zone (having the opposite effect). The net benefits of B over A depend therefore on the relative areas lost, and the way in which the loss affects households’ collection of NTFPs. The opportunity costs in each case will differ, per hectare, as we discuss below, but information about the spatial extent of villagers’ forest use is essential for determining them in both cases – we need to understand where in the forest households harvest their NTFPs.
Spatial extent of NTFP harvesting Unfortunately, little good information is available on the spatial extent of villagers’ forest use. Unpublished data (Vokatry ny Ala) for 2 villages suggests that most forest use takes place within 4-5km of the village, with 3rd quartile distance of activities for one village equal to 2.2 km (Figure A1 next page).
21 Except for the existing protected areas, which are treated as being completely strictly protected. Households living in the periphery of these areas are treated as having lost all access to primary forest for NTFP collection under scenario B.
VIII

Hockley & Razafindralambo (2006) A Social Cost-Benefit Analysis of Conserving the Ranomafana-Andringitra-Pic d’Ivohibe Corridor
Figure A1. Spatial extent of NTFP collection
Cumulative Proportion of Forest Use with increasing distance from the Village
0.00
0.10
0.20
0.30
0.40
0.50
0.60
0.70
0.80
0.90
1.00
0 500 1000 1500 2000 2500 3000 3500 4000 4500
Distance from Village (m)
Cum
ulat
ive
Pro
porti
on o
f For
est U
se
Source: Vokatry ny Ala (unpublished data)
Opportunity cost of losing forest to the Strictly Protected Core Zone The opportunity cost of losing forest areas to the strictly protected core is valued at 0.5 times the value of the products that would have come from that area, as estimated using spatial information of NTFP collection (Figure A1, above [Vokatry ny Ala, unpublished data]). This assumes that forest products, and the revenues derived from them are at least partially replaceable with products and activities outside the forest, and that this rate of replacement is approximately 50%. In fact, we lack good empirical information on this rate of substitution. We estimate these opportunity costs for five sizes of Core Zone, to allow us to assess the effect on household opportunity costs of increasing the size of the Core Zone.
Opportunity Costs of losing forest to Deforestation Just as we have no quantitative information on the rate of substitution for products and revenues lost to the strictly protected core zone, we cannot quantify the rate of substitution for products lost to deforestation. However, it seems reasonable to assume that the opportunity cost of losing a hectare of forest to deforestation, is less than losing a hectare of forest to protection, and may be very low indeed. This is true for two reasons.
Firstly, when farmers clear a hectare of forest it is replaced; at various times during the cultivation / fallow cycle, with vegetation which supplies at least some forest products, or close substitutes. For example, roofing can be made from bamboo collected in the forest, but it can also be made from bamboo growing outside the forest or from thatch (tegnina or bozaka) collected from degraded lands outside the forest.
The second reason is that along most of the corridor, the forest is not fully utilised for forest products – most products are collected from near the edge of the forest. As the edge moves back, forest is lost, but people move with the edge. Even though some people may lose access to the forest, the number of people living next to the forest
IX
Appendix 1: Full Methods
can be expected to remain roughly constant. In much of the corridor, forest is being cleared by the offspring of villagers living next to the forest, not by complete outsiders. In this case the total benefit derived from the forest, in terms of forest products, by those villagers (including their offspring), is likely to remain relatively constant.
Using our estimates of spatial patterns of forest use, we see that beyond 5km from the forest edge, forest is essentially unused. There are 6300 ha of forest 5km from the forest edge. If we assume that forest use moves with the frontier, we find that each hectare lost from the outer band, can be replaced by a hectare from the next band, and so on. The first 6300 ha of deforestation are essentially “free”, with no cost in terms of lost opportunities for harvesting NTFPs born by local people. The next 12,228 ha are priced at the value per hectare of forest products collected within the band 4-5km from the forest edge, multiplied by 0.3. This factor of 0.3 represents the assumption that most forest products have substitutes outside the forest, which are at least 70% as good. Note this rate of substitution (70%) is higher than that for the Strictly Protected Core Zone,
Affected Population Ferraro’s estimates apply to villages in the periphery of Ranomafana National Park, i.e. within 3km of the park boundaries. We have assumed these criteria to be roughly equivalent to our category of Forest Frontier Fokontany, and have therefore applied these estimates to our estimated population for the Forest Frontier Fokontany. Note that Ferraro’s estimates do not take account of population growth. This seems reasonable given our assumption that the frontier would move with population growth, essentially maintaining the number of people living on the frontier approximately constant.
Tavy Upper Estimate: Ferraro (1994) Only one estimate exists of the opportunity costs of stopping tavy in the eastern rainforests of Madagascar: that of Ferraro (1994, 2002). He made estimates for the villages surrounding Ranomafana National Park, on a per-household basis. We have used these estimates, and multiplied them by the number of households in Forest Frontier Fokontany (using Ferraro’s average household size). This gives the upper estimate of the opportunity costs of stopping tavy. In the same way as for NTFP costs, we have assumed that our category of Forest Frontier Fokontany corresponds to Ferraro’s peripheral villages.
In fact, the per capita deforestation figures reported by Ferraro (1994) were lower than those calculated by MIARO (2005) for the corridor, by a factor of 3-10, though the Miaro estimate was still similar to that reported by Green & Sussman (1990) as shown in Table A5 below. This indicates that the upper limit of the opportunity costs of stopping tavy could be higher, if the amount of tavy which would be stopped in the corridor, per capita, was higher than in the case studies by Ferraro. In addition, Ferraro’s deforestation rates actually refer to forest that would have been cleared by each household within the periphery of the park: therefore, one would expect that his estimates would be underestimates of the total amount of forest cleared by households. However, it would be inappropriate simply to multiply opportunity costs calculated per-household by a correction factor to account for the possibly higher deforestation rates in the corridor - it is possible that Ferraro’s deforestation rates, based as they are on local knowledge, rather than remote sensing, may be more accurate (Sader 1995).
X

Hockley & Razafindralambo (2006) A Social Cost-Benefit Analysis of Conserving the Ranomafana-Andringitra-Pic d’Ivohibe Corridor
Table A5: A comparison of per capita deforestation rates
Miaro (2005) Ferraro (1994)
Using Forest
Fokontany Population
Using Forest
Commune Population
Upper Lower
Green & Sussman
(1990)
Per Capita Deforestation
Rate
0.033 0.012 0.006 0.001 0.024
Sources: Green & Sussman (1990), Ferraro (1994), Miaro (2005).
It should also be noted that Ferraro’s calculations of opportunity cost include population growth rate and a model of declining fertility, and that his NPVs are for each household and its descendents. Thus, they cannot easily be annualised. However, the NPV per household that we give in most of our results is the same as that given by Ferraro – i.e. using a 60 year time horizon and 5% discount rate. The annualised figures are only used to allow us to change the time horizon and discount rate to look at sensitivity overall.
Lower Estimate: Kremen et al. (2000) Kremen et al. (2000), published estimates of the opportunity costs of tavy rice agriculture, per hectare deforested, for the Masoala Peninsula. We have used these estimates, and applied them to corridor specific figures for deforestation rates, to give corridor specific estimates. This provides the lower estimates of the opportunity costs.
ANGAP Management costs We assume that the strictly protected core of the site de conservation will be managed by an organisation similar to ANGAP22 (Madagascar’s national parks authority) and that this organisation would have similar costs per hectare. Carret and Loyer (2003) report ANGAP management costs to be approximately $3 per hectare, so total management costs are taken to be equal to this figure (in 2005 dollars) multiplied by the area of the three existing protected areas, plus the area of the strictly protected core of the site de conservation. We assume that the buffer zone would be managed by the communities surrounding the corridor, though we are unable to make any estimate of the management costs of community forest management associations (CoBas)
Since ANGAP is currently almost entirely funded by foreign aid, these management costs represent a cost at the international level, and a benefit at the national level (a transfer overall). In the future, donors expect ANGAP to be self-financing, and these costs may be transferred to the national level. This will only be possible if benefits at the national level increase, for example through capturing the value of carbon sequestration or through increased ecotourism revenues.
22 ANGAP = Association National pour la Gestion des Aires Protégées
XI

Appendix 1: Full Methods
Ecotourism There is currently no large-scale ecotourism in the main body of the corridor i.e. outside of the national parks. One small community-run reserve (Anja) and a private reserve (Ialatsara) also get significant visitors but these are not contiguous with the corridor. We have information from the National Parks and Anja reserve on the direct benefits, such as entrance fees.
We have based our estimates of the direct benefits of ecotourism on these figures, using a correction factor of 20% to account for the fact that we have incomplete coverage of the corridor. We have used estimates of the indirect benefits of ecotourism, quoted in Carret and Loyer (2003), and estimates for the distribution of those benefits between local, regional and national levels, given in ANGAP (No Date). Carret & Loyer (2003) give 55$ per person indirect benefits from ecotourism and this is partitioned as per fig 2 in ANGAP (no date). We assume that there is some overlap between Ranomafana, Anja and Andringitra and use this to decrease the national indirect benefits accordingly.
“Local” revenues from ANGAP (no date) were divided into 1/5 for Forest Frontier Fokontany and 4/5 for Corridor Communes following Peters (1998) who estimated that only 1/5 of local tourism revenue went to people resident within the park’s periphery prior to 1989 – broadly equivalent to our category of Forest Frontier Fokontany.
We assume that ecotourism in the corridor as a whole will grow at between 8 and 10% per year, following the World Tourism Organisation projections for the Indian Ocean (http://www.world-tourism.org/), for the next 25 years, and then at 4-5%. We also assume that the composition of that tourism, in terms of the distribution of benefits remains approximately the same. The overall benefits are likely to be broadly accurate, though the distribution of benefits will depend on the way tourism develops.
We lack estimates of the management costs of the Anja reserve. Some of these management costs will be in the form of cash spent in the community, and will thus probably not decrease net benefits. Some will be disbursed farther afield. The inclusion of management costs would therefore likely reduce net benefits slightly, and push benefits out from the fokontany to commune, regional and national levels.
We assume that any corridor ecotourism has no benefit at the international level, since it plays a negligibly small part in world tourism meaning that it has near-perfect substitutes, i.e. the presence of the corridor as an ecotourism venue has no net benefit to international ecotourists. The international value of the corridor is however, taken account of through its value for carbon sequestration, bio-prospecting and non-use values (see below).
We have used 2004 figures for ANGAP ecotourism (ANGAP unpublished data). These may change in 2005 because entrance fees have been substantially increased, but without knowing the price elasticity of demand it is impossible to predict the effect of these changes.
This still assumes that there is no substitutability between the corridor and other sites in Madagascar, in terms of ecotourism venues – i.e. that if the corridor was lost, no tourists would switch to other Madagascar destinations, they would simply be “lost” to Madagascar.
We have presumed ecotourism to be completely incompatible with Scenario A. Overall, these assumptions are likely to be generous to the case for conservation, and perhaps to overestimate its local benefits.
XII
Hockley & Razafindralambo (2006) A Social Cost-Benefit Analysis of Conserving the Ranomafana-Andringitra-Pic d’Ivohibe Corridor
Bio-prospecting It is notoriously difficult to determine the value of genetic diversity and many early estimates appear to have been wildly optimistic (Simpson et al. 1996). However, the eastern rainforests have an extremely high degree of endemism, and therefore may be relatively valuable per hectare. Having reviewed the literature on bio-prospecting values, van Beukering et al. (2003) use $1 per hectare for a tropical rainforest park in Indonesia, and we followed them in using this value.
For illustrative purposes we have taken the value of forest outside of the strictly protected core to have 75% the value of forests inside. For scenario A, we have used the expected area of forest at the end of the 40 years, for scenario B; we have used the estimated area of forest in 2005.
At present, we have assumed that pharmaceutical values, like those of carbon sequestration and the non-use values of biodiversity accrue only at the international level, because currently no mechanisms are in place to transfer them to local levels.
Note that the local value of medicinal plants is captured in estimates of NTFP use by villagers (Ferraro 1994, 2002).
Hydrological Benefits of Forest Protection Over the last two decades, our understanding of the effect of deforestation on hydrological function has advanced considerably. Two major reviews by Bruijnzeel (1990, 2004) have collected and synthesised a large number of empirical and modelling studies on the subject, while Chomitz & Kumari (1996, 1998) have reviewed the economic implications of deforestation, reforestation and forest protection. Meanwhile, Brand et al. (2002) have reviewed much of this from a Malagasy perspective. Appendix 3 summarises these findings.
The conclusions of these reviews are that many of the previously claimed benefits of tropical forests for hydrology have either been overstated, or are too uncertain to include in valuations. In particular, Bruijnzeel (1990, 2004) stresses that deforestation, per se, is not the cause of many hydrological problems, but rather that they are the result of poor management of land after it has been cleared. Many of the ways in which deforestation can cause hydrological problems are associated with heavy logging operations, which may not be relevant in the corridor, and can in any case be greatly alleviated by using appropriate techniques.
Nevertheless, it remains the case that the protection of forests will likely have a benefit for those living and farming downstream, particularly in terms of avoided erosion. We have used the study by Brand et al. (2002), of the willingness to pay (WTP) of downstream rice farmers to stop deforestation up stream, as an estimate of this. This study found that 50% of farmers were willing to pay to prevent deforestation up stream, and that for these farmers, average WTP was US$2 per household, at the time of the study. We took this value and applied it to 50% of all agricultural households in the Forest Frontier Fokontany and Communes. The fact that only 50% of farmers were willing to pay perhaps reflects the fact that some farmers perceived sedimentation to be a benefit rather than a cost, a view which the authors appear to endorse. It is possible therefore that these farmers would have been WTP to ensure upstream deforestation, and that in applying this figure we overestimate the benefits of forest protection.
Obviously, there are great uncertainties in transferring such an estimate to the corridor – in particular, Brand et al. (2002) do not provide much information on their study area. At the very least, we would have liked to use both their WTP per
XIII
Appendix 1: Full Methods
household, and per hectare of irrigated rice paddy, but we lack data on the number of hectares of irrigated rice paddy surrounding the corridor.
Non-use Values of Biodiversity to non-Malagasy Citizens of rich countries have repeatedly been found to be willing to fund nature conservation, in tropical countries, for reasons unrelated to tangible benefits they hope to gain from those resources. Numerous Contingent Valuation (CV) studies have been conducted on residents of rich countries to determine their willingness to pay (WTP) to preserve this or that habitat. However, none has yet been conducted concerning Madagascar, except on ecotourists already in Madagascar. In the absence of a corridor specific study, one possible approach would be to use a “basket” of valuation studies, each of which has valued a nature conservation site that was “similar” to the corridor. Some average of their valuations could then be used to estimate the value that rich world citizens might place on the continued existence of the corridor, and be willing to pay for its preservation. This approach has been termed “benefits transfer” (Bateman et al. 2002). Clearly, this would be imperfect, and heavily dependent on what was classed as “similar” to the corridor.
In addition, valuations of single sites have been criticised on the grounds that respondents in CV studies attribute all of their willingness to pay for conservation in general, to whichever specific site or species they are asked about in the study. Thus the CV reveals not the WTP for the site in question, but for all wildlife sites (see for example Blamey 1996, Kahneman & Knetsch 1992). Price (No Date, p16) provides a good summary of this, and other such problems.
For this reason, it is probably more realistic to use estimates of the WTP for conservation in general, and estimate the share of that WTP which is attributable to the corridor. Unfortunately, such aggregate studies are rare. We found just two suitable published studies. Kramer & Mercer (1997) investigated the WTP of US citizens for rainforest conservation, whereas Menzel (2005) investigated German citizens WTP for biodiversity conservation.
Kramer & Mercer (1997): WTP for tropical rainforest conservation Kramer & Mercer (1997) used CV to discover the one-time willingness to pay of US citizens to conserve an extra 5% of tropical rainforests throughout the world (over and above the 5% already in protected areas). The corridor would appear to fit this category, since it represents an extension to Madagascar’s protected area network, and is one of the highest priority conservation areas in the world (Mittermeier et al. 2004).
We have assumed that rest of rich world (European Economic Area, Canada, Japan, Australia, New Zealand) would exhibit similar WTP to the US. We calculated average per capita WTP from Kramer and Mercer’s per household estimate ($11.9), then multiplied this by rich world population of 868m in 2004 (OECD 2004). This total WTP for extra tropical rainforest conservation was then assumed to be shared out equally amongst 5% of all the world’s tropical forests, on a per hectare basis. The corridor accounts for 0.73% of this additional 5% of the world’s tropical rainforests. The global, one-time willingness to pay for conservation of the corridor, based on the Kramer and Mercer study is just over $78m.
This estimate is likely to be conservative, for two reasons:
1) Awareness of rainforests, and biodiversity has increased substantially since the study was conducted in 1992.
XIV

Hockley & Razafindralambo (2006) A Social Cost-Benefit Analysis of Conserving the Ranomafana-Andringitra-Pic d’Ivohibe Corridor
2) We have only included the richest OECD countries in the study: namely the EU15, Norway, Iceland, Switzerland, US, Canada, Japan, Australia and New Zealand. This ignores any value placed on the Malagasy forests by residents of other countries, in particular the substantial number of rich citizens of Eastern Europe, South East Asia and South and Central America.
The study is likely to represent only non-use values. Although the study may capture some use-values, the authors believed this to be low: the study was carried out before climate change became a major issue, and before international ecotourism was common place making it unlikely that respondents willingness to pay includes a great deal of use value.
Menzel (2005): WTP for biodiversity conservation Menzel (2005) used CV to estimate the monthly contribution which German residents over the age of 18 were prepared to make, in the form of a “biodiversity tax” for the “protection of half of the endangered species expected to become extinct in the next 10 years” (Menzel 2005, p33). The study asked respondents to reply for themselves, and not for their family or household, yielding a per capita value. The mean response was approximately €9 per month. This yields an annual figure, for the whole of Germany of just over €7bn per annum. However, the author states that this could be an overestimate, because people may, despite instructions to the contrary, have replied on behalf of their household. If we assume that the WTP is therefore a per household WTP, the result becomes €3.8bn ($4.5bn) per annum.
Using the per household estimate as a conservative estimate, we multiply by the population ratio of the rich world to Germany (868m:82.5m) to give an annual extrapolated total WTP for the rich world of $47.4bn.
To interpret this result in the context of the corridor, we have taken this WTP for the protection of half of the species facing extinction as a conservative estimate of the WTP to conserve all of these species. To calculate the corridor’s contribution to such an aim, we have used the percentage of the critically endangered bird and mammal species worldwide which are endemic to the corridor. There are 362 critically endangered birds and mammals worldwide (IUCN, quoted in Mittermeier et al. 2004) and three are endemic to the corridor (Randrianasolo pers. com.). Thus, by this reasoning, conservation of the corridor would achieve 0.8% of the worldwide task of preserving all critically endangered species. This is likely to be an underestimate of the corridor’s contribution, since it ignores those critically endangered species which are found elsewhere in Madagascar as well as in the corridor - the corridor would still play an important part in their conservation. However, using this assumption, we arrive at a global, annual WTP for the conservation of the corridor of $393m. This estimate may also underestimate WTP for conservation because it may not include other aspects of conservation which people value, including landscape and wilderness values, as well as ignoring the values of people outside of the rich world.
Unlike Kramer & Mercer’s study, Menzel aimed to elicit an annual, ongoing WTP. If we assume that this WTP would be repeated for each of the 40 year time horizon of the study, this would give a NPV of $6.7 trillion. However, for the purposes of this study, we have taken the conservative assumption that the value elicited by Menzel was a one off WTP, and therefore used $393m.
It should be noted that Menzel did not adjust for the age bias in her figures, which would lead to a small upward bias in her estimates, however, this should be more than compensated-for by taking her annual figure to be a one-time figure.
XV

Appendix 1: Full Methods
Vondrozo Extension The international non-use value of the Vondrozo extension was calculated in the same way as above. The value based on Kramer & Mercer (1997) was calculated using the estimated additional hectares of the extension (73,808 as estimated by the authors). The value based on Menzel (2005) was calculated using the fact that the Vondrozo extension adds at least one extra endemic mammal or bird species: Eulemur albocollaris, which is found only in a small portion of the corridor south of Andringitra, except for a small, very isolated population in Manombo Special Reserve, near Farafangana (Irwin et al. 2005).
Timber Information on timber production was provided by a specialist group at the workshop consisting of Eaux et Forêts personnel, commercial loggers, and regional development workers. This information was cross-checked with other specialists, and a consensus found.
Types of logging operation Two approaches were identified. The first involved extracting only category 2 and 3 timber species that have reached a given diameter. In principle, this would allow the forest to be logged, on a rotation basis, returning every 10-15 years (Rasamisandy pers com.) This rotation length seems quite short, compared to practices elsewhere (e.g. 30-40 years [Verissimo et al. 1992] 60 years [Healey et al. 2000], but without more information on the productivity of corridor forests, and the diameter criteria used, it is difficult to confirm this. Nevertheless we have used a longer rotation length of 30 years, meaning that two rotations would take place within the time period considered by the study. In this approach, Category 4 timbers, would not be extracted at all, and only half of Category 3 timbers, making this approach relatively conservative on timber volumes.
In the second approach, the forest would be logged for all useable timber, regardless of size and species (though not including prohibited Category 1 species). Participants agreed that this production was feasible and economic, but would mean that the forest could not be logged again for a long time – it is essentially a one-time extraction, and would be represent a greater initial impact on the forest.
XVI

Hockley & Razafindralambo (2006) A Social Cost-Benefit Analysis of Conserving the Ranomafana-Andringitra-Pic d’Ivohibe Corridor
Total value of production For each approach, experts estimated the total production per hectare, and its value on the open market (table A6 below).
Table A6. Timber production per hectare for two different methods.
Scenario Cat m3
harvested / ha
Product Pieces / m3
Pieces per
hectare
price per piece on market
Total Value of
Production (Ar) per ha
2 3 1 56 56 6,000 336,0003 3 1 56 56 4,000 224,0004 0 0 0 0 0 0
Multiple rotation
Total (Ar) / ha 560,0002 7.2 2.4 56 134 7,143 960,0003 9.69 3.23 56 181 3,118 564,0004 9.69 3.23 56 181 3,118 564,000
One-time
Total (Ar) / ha 2,088,000
Source: Eaux et Forets, Workshop Participants
In order to calculate the net present value of each approach, we first used the extrapolation of deforestation estimates (see above) to determine the amount of forest available in each year. All forest in the corridor was estimated to be exploitable (workshop participants, Rasamisandy, pers. coms.).
For the first, “multiple rotation23” approach, we assumed that in any given year, logging takes place in a portion of the forest remaining in that year equal to 1/r (where r is the rotation length). The gross value of production was given by the number of hectares multiplied by the per hectare value given in table A6 above.
For the second, “one-time” approach, we assumed that the whole of the corridor is logged within the first 25 years, and is not returned to within the time horizon of this study (60 years). In each of the first 25 years, 1/25th of the forest is logged.
These annual, gross, market values of production are then discounted to give a Gross Present Value of production.
Distribution of benefits The gross value of production is divided into benefits for the state (through taxes) labour (through wages), costs (principally transport) leaving a remainder for the owner of the logging operation. The type of logging practiced in the corridor is not capital intensive, and we assumed that all except transport costs represent a net benefit to Madagascar, and we justify this below.
Taxes In order to calculate the distribution of this product among different stakeholder groups, we first deducted the various taxes from the total gross value of production. These taxes represent a benefit to the state at various levels, as shown in table A7 below.
23 We have deliberately avoided the term “sustainable” here.
XVII

Appendix 1: Full Methods
Table A7: Taxes on logging operations
Percentage Beneficiary Stakeholder Level
12% Eaux et Forets
Nation
8% Fiscal Nation
3% Ristournes Fokontany, Commune, Region (see below)
Ristournes assumed to be divided in the following way:
10% (0.3% of total) Fokontany Forest Frontier Fokontany
30% (0.9% of total) Commune Forest Frontier Commune
30% (0.9%) District Corridor Regions
30% (0.9%) Region Corridor Regions
Implicitly we have assumed that logging operations pay all of their taxes, on the full value of their production. If this assumption was violated, it would of course reduce the benefit to state, but increase that to private individuals. Since most logging operations are owned by Malagasy nationals, this would not have a large effect on the distribution of benefits among the stakeholder groups considered in this analysis.
Labour Next we used estimates of the labour costs required to cut the wood and carry it to the road (Rasamisandy pers. com.) to determine the benefit to labour. These are shown in table A8 below.
Table A8 Labour costs in logging operations
Approach Cat Saw
Wages per
piece
Porter Wages
per Piece
Piece per hectare
Total Saw wage per ha
(Ar) Total Porter
wage per ha (Ar)
2 1800 1,150 56 100,800 64,400 3 1800 900 56 100,800 50,400
Multiple rotation
Total 201,600 114,800 2 1800 1,150 134 241,920 154,560 3 1800 900 180.88 325,584 162,792 4 100 900 180.88 18,088 162,792
One-time
Total 585,592 480,144
Source: (Rasamisandy pers. com.)
100% of the portering wages are assumed to accrue to residents of forest fokontany, while only 25% of the saw team wages are; the remainder are assumed to accrue residents of the communes, outside of the fokontany (see Ferraro 1994 pD-32). These gross benefits are assumed to be approximately equal to net benefits, because we assume that the opportunity cost of labour is low in these areas, with few alternative sources of employment outside of the agricultural season.
Transport Average transport costs were estimated at 300 Ar per plank, for delivery from the road head to Fianarantsoa. These come to 33,600 Ar per hectare for the multiple
XVIII

Hockley & Razafindralambo (2006) A Social Cost-Benefit Analysis of Conserving the Ranomafana-Andringitra-Pic d’Ivohibe Corridor
rotation scenario, and 148,848 Ar for the one-time scenario. Transport costs are subtracted from the total production, and are not considered to be benefits.
Logging Concessionaire The remainder, after labour, transport and taxes are taken into account, is the net benefit for the concessionaire. Smaller concessionaires may be residents of corridor communes, while larger businesses may be owned by those from farther a field. We have assumed that concessionaires’ benefits are divided 20:50:30 among the communes, regions and nation. The breakdown of benefits, per hectare, is given in Table A9 below.
Table A9: Breakdown of benefits from logging operations
"Multiple Rotation" "One-time" Share Value (Ar) per Ha Share Value (Ar) per Ha
Saw Workers 36% 201,600 28% 585,592Porters 21% 114,800 23% 480,144E&F 12% 67,200 12% 250,560Ristournes 3% 16,800 3% 62,640Fisc 8% 44,800 8% 167,040Exploitant 15% 81,200 19% 393,176Transport 6% 33,600 7% 148,848
Logging within the Conservation Site We evaluated the potential economic benefits, in terms of timber exploitation, of allowing communities to log, sustainably, a portion of the corridor outside of the strictly protected central zone. Using estimates of the area outside the central zone (see above), we calculate the gross present value of logging using the same total production per hectare as the multiple rotation approach above, but assuming a rotation length of 40 years instead of 30 for increased sustainability and lower impact.
We have assumed that benefits will be distributed as for Scenario A, in other words we do not presume that the villages retain any greater percentage of the value of production. If villages did manage to do so, e.g. by developing skills in saw work, or even by fulfilling the role of concessionaires, this would increase the local benefits of this scenario.
It must be noted, that we have not attempted to evaluate any of the costs of this scenario, compared to scenario B. This is because most of these, such as the impact of logging on biodiversity or ecotourism are impossible to judge (although the effects on hydrological function are likely to be negligible (Bruijnzeel 1990, 2004, Serpantié pers com). It should be possible to determine the effect on carbon sequestration (see for example Healey et al. 2000) but this would require a more precise understanding of the exact methods to be used in logging.
Carbon The sequestration of carbon dioxide, the main greenhouse gas, is one of the most important functions fulfilled by tropical forests and avoiding deforestation avoids the emission of CO2. Using estimates of forest cover, and deforestation rate published by MIARO (2005), we estimate the number of hectares of forest which would be lost under scenario A, and which are therefore saved by the Conservation Site. van Kooten et al. (2004) review studies of carbon offsets, and we use their mean value across all studies to give an upper estimate of the CO2 released by a conversion of a hectare of tropical forest (220 tonnes per ha). The lower estimate comes from
XIX
Appendix 1: Full Methods
Razafindralambo’s estimate for the Zahamena-Mantadia corridor (148 t/ha [R. Razafindralambo, unpublished data]).
There are several ways to value the benefits of avoiding the release of CO2. The first is to use the price of the CO2 on the world market. This represents the value which might be captured directly by Madagascar, through the Kyoto protocol. The second is to use estimates of the real marginal cost of CO2 emissions. Although the uncertainties in this estimate are obviously much greater, this represents the “true” value of avoided CO2 emissions. We use the latter (estimated by Tol 2005) to calculate the benefit to the global community of preventing deforestation in the corridor. We use his median estimate of $14.42 as our lower estimate, and his mean estimate of $44.29 as our upper estimate. These values are then multiplied by the quantity of CO2 release avoided each year, and the NPV calculated.
Cultural or non-use values of the corridor to Malagasy As well as citizens of rich countries Malagasy residents themselves may hold non-use or cultural values for the Malagasy forests. Unfortunately, we know of no attempt to determine the benefit which Malagasy residents gain simply from the continued existence of forests. Indeed, such assessments, while common in the developed world, are comparatively rare in developing countries. Those which have been carried out, have often demonstrated a significant willingness to pay for conservation among urban citizens (Hadker et al. [1997], Turpie [2003]).
One response to the absence of a specific study which identified Malagasy citizens’ WTP for corridor conservation would be to take a benefits transfer approach, whereby the results of other studies were applied to the context of the corridor, and Madagascar. However given the sparse literature on the subject, and the absence of any studies for Madagascar, we do not feel this to be an option at this stage.
In absolute terms, we might expect this WTP to be modest: incomes in Madagascar are low compared with, say South Africa, where Turpie (2003) found substantial WTP which increased with income. The lowest annual household income group in her study was <$1200, which is quite high in the Malagasy context. In addition, there appear to be low rates of forest-based recreation by Malagasy citizens, in contrast to the South Africa case. However, where this does occur (e.g. Anja reserve) it would be interesting to conduct a revealed preference study.
Nevertheless, if one considers the cultural and traditional importance of forests to the Malagasy, particularly those residing close to the forest, these may be significant. In an attempt to address this issue, in qualitative terms, and to evaluate what it may mean for the Conservation Site, a session of the workshop was devoted to discussing cultural and traditional values which residents of the corridor hold. This session uncovered a wealth of information about sites of cultural importance, traditional mechanisms for the management of forests, and the attitudes of the focus group towards outside interventions. In general, the group noted that any planning process for the Conservation Site should take account of the traditional and cultural importance of forest sites. Access to areas of special cultural importance, for example those containing tombs or which provide products such as medicinal plants should be guaranteed. In addition, activities, such as ecotourism or timber exploitation which might conflict with some of these sites, should be controlled carefully. The group exhibited a distrust of government or outside management of forests, while finding no conflict per se between conservation of the forest and traditional values. If implemented sensitively, the Conservation Site should only provide benefits to local populations in terms of non-use values.
XX

Hockley & Razafindralambo (2006) A Social Cost-Benefit Analysis of Conserving the Ranomafana-Andringitra-Pic d’Ivohibe Corridor
It is difficult to generalise across the whole region, and it must be noted that only a small and not necessarily representative group was present. However, the main lesson is that the Conservation Site need not conflict with local non-use values, but that this is contingent on it being implemented sensitively at the local level, with adequate participation in the planning process by local people. In terms of the analysis, it is likely that the inclusion of local non-use values of the forest in the economic evaluation would decrease the net costs of the Conservation Site for local people. However, we do not believe that these values would be sufficient to reverse the sign of the net benefits at the local level. If they were large enough to do this, it is likely that local conservation measures would have rendered government protection of the forest unnecessary. It seems more likely that local measures alone would result in the conservation of patches of forest of particular significance, but not the whole corridor. This retention of “sacred forests” is certainly seen in other areas of Madagascar, which are otherwise denuded of forest.
XXI
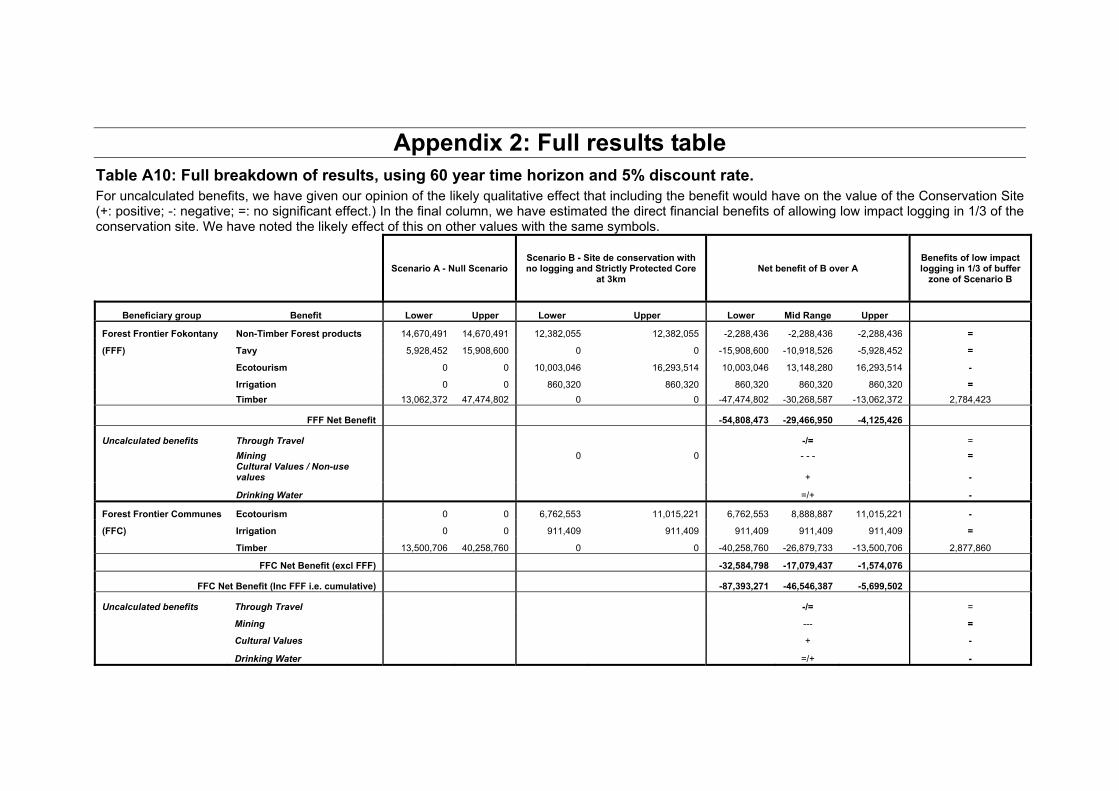
Appendix 2: Full results table Table A10: Full breakdown of results, using 60 year time horizon and 5% discount rate. For uncalculated benefits, we have given our opinion of the likely qualitative effect that including the benefit would have on the value of the Conservation Site (+: positive; -: negative; =: no significant effect.) In the final column, we have estimated the direct financial benefits of allowing low impact logging in 1/3 of the conservation site. We have noted the likely effect of this on other values with the same symbols.
Scenario A - Null Scenario Scenario B - Site de conservation with no logging and Strictly Protected Core
at 3km Net benefit of B over A
Benefits of low impact logging in 1/3 of buffer
zone of Scenario B
Beneficiary group Benefit Lower Upper Lower Upper Lower Mid Range Upper
Forest Frontier Fokontany Non-Timber Forest products 14,670,491 14,670,491 12,382,055 12,382,055 -2,288,436 -2,288,436 -2,288,436 =
(FFF) Tavy 5,928,452 15,908,600 0 0 -15,908,600 -10,918,526 -5,928,452 =
Ecotourism 0 0 10,003,046 16,293,514 10,003,046 13,148,280 16,293,514 -
Irrigation 0 0 860,320 860,320 860,320 860,320 860,320 = Timber 13,062,372 47,474,802 0 0 -47,474,802 -30,268,587 -13,062,372 2,784,423
FFF Net Benefit -54,808,473 -29,466,950 -4,125,426
Uncalculated benefits Through Travel -/= = Mining 0 0 - - - =
Cultural Values / Non-use values + -
Drinking Water =/+ -
Forest Frontier Communes Ecotourism 0 0 6,762,553 11,015,221 6,762,553 8,888,887 11,015,221 -
(FFC) Irrigation 0 0 911,409 911,409 911,409 911,409 911,409 =
Timber 13,500,706 40,258,760 0 0 -40,258,760 -26,879,733 -13,500,706 2,877,860
FFC Net Benefit (excl FFF) -32,584,798 -17,079,437 -1,574,076
FFC Net Benefit (Inc FFF i.e. cumulative) -87,393,271 -46,546,387 -5,699,502
Uncalculated benefits Through Travel -/= =
Mining --- =
Cultural Values + -
Drinking Water =/+ -

Region Ecotourism 0 0 12,711,196 20,704,699 12,711,196 16,707,947 20,704,699 -
Timber 3,966,928 17,568,211 0 0 -17,568,211 -10,767,570 -3,966,928 845,605
Region Net Benefit (excl FFC & FFF) -4,857,015 5,940,378 16,737,770
Region Net Benefit (Inc FFC & FFF i.e. cumulative) -92,250,286 -40,606,009 11,038,268
Uncalculated benefits Mining --- =
Irrigation =/+ =
Non-use values + -
Drinking Water =/+ =
National Ecotourism 0 0 54,612,090 88,955,193 54,612,090 71,783,641 88,955,193 -
Timber 10,673,448 40,178,606 0 0 -40,178,606 -25,426,027 -10,673,448 2,275,191
Management costs 0 0 7,031,328 7,031,328 7,031,328 7,031,328 7,031,328 =
National Net Benefit (excl Corridor Regions) 21,464,811 53,388,942 85,313,073
Total National Net Benefit (i.e. cumulative) -70,785,475 12,782,933 96,351,341
Uncalculated benefits Mining --- =
Non-use values + -
External Carbon Sequestration 0 0 29,654,109 135,595,037 29,654,109 82,624,573 135,595,037 =/-
Bioprospecting 0 129,594 109,049 109,049 -20,545 44,252 109,049 -
Non-use values 0 0 63,230,420 410,069,946 63,230,420 236,650,183 410,069,946 -
Management Costs 0 0 -7,031,328 -7,031,328 -7,031,328 -7,031,328 -7,031,328 =
External Net Benefit 92,863,985 319,319,009 545,774,032
Total Net Benefit
Madagascar -70,785,475 12,782,933 96,351,341
Total Net Benefit World 22,078,510 332,101,942 642,125,374

Hockley & Razafindralambo (2006) A Social Cost-Benefit Analysis of Conserving the Ranomafana-Andringitra-Pic d’Ivohibe Corridor
Appendix 3: Notes on Hydrology and Tropical Deforestation
Compiled by Jonathan E Annis1 and Neal J. Hockley2
1 Department of Civil and Environmental Engineering, Michigan Technological University, Houghton, MI USA. [email protected]. 2 School of the Environment & Natural Resources, University of Wales, Bangor. Deiniol Road, Bangor. LL57 2UW. United Kingdom. [email protected].
Summary In this Appendix, we summarise the state of knowledge about the hydrological functions of tropical forests, the effects of deforestation and the economic significance of these effects.
While tropical forests have some important hydrological functions that may be adversely affected by deforestation, the hydrological importance of deforestation has often been overestimated, and consequently the economic value of forests that is due to their hydrological function has sometimes been overstated. In many cases where the received wisdom asserted that forests were essential for maintaining hydrological function, empirical and modelling studies have suggested that the effects were smaller than previously assumed. In some cases, even the direction of the effect was shown to be inconsistent, or the reverse of that previously assumed. Many hydrological functions performed by forests have been shown to be compatible with other land uses.
The evidence from hydrological science therefore points firstly to a reduction in the probable size of the hydrological effects of deforestation, and secondly to an increase in the uncertainty over its magnitude, and direction. When translated into economic terms, this means that the value of the hydrological functions of tropical forests is likely to be much lower than previously assumed.
Hydrological Implications of Tropical Deforestation The following section aims to summarise two major reviews of the hydrological implications of deforestation in the tropics written by L. A Bruijnzeel (199024, and 2004)25. To help the reader verify what we have written, statements are followed by the page number of the original document, for example: “(1990:188)” means Bruijnzeel (1990, page 188). Statements in quotation marks have been copied verbatim from the text (though we have removed the citations). For the full references please see the original documents. Suggestions, interpretations or comments that we have made relative to the specific situation of the corridor or Madagascar are marked with “ ”.
We have attempted to present a balanced review of the most important points. If our review appears to be sceptical about the hydrological importance of tropical forests, this reflects the thrust of the original reviews and the fact that the received wisdom has up until now been overly optimistic about it. It is worth quoting from the foreword
24 Bruijnzeel (1990). Hydrology of Moist Tropical Forests and Effects of Conversion: A State of Knowledge Review published by the UNESCO International Hydrological Programme. 25 Bruijnzeel (2004). Hydrological functions of tropical forests: not seeing the soil for the trees? Agriculture, Ecosystems and Environment 104 p185–228.
XXIV

Appendix 3: Notes on Hydrology and Deforestation. J. E. Annis & N. J. Hockley.
to Bruijnzeel’s 1990 review, written by Lawrence S. Hamilton, of the Environment and Policy Institute, East-West Center in Hawaii:
“In spite of [attempts] to dispel the misinformation, misinterpretation, misunderstanding and myth about the role of forests with regard to hydrology and erosion, and what happens when the forest is altered or removed, many of these “four Ms” still continue to dominate popular and political thinking. This applies especially to tropical humid forests, which seem to automatically put emotion into command over reason”
Effect of Forest Clearance on Rainfall/Climactic Conditions “Apart from forests at specific locations, such as coastal fog belts or cloud belts in mountainous areas, or forests of very large areal extent (e.g. the Amazon basin), tropical forests most probably do not influence local amounts of rainfall significantly” (1990:179).
“Given the right conditions, increases in total precipitation through cloud stripping can be sizeable, especially so for isolated single trees or rows of trees. The effect is somewhat less in the case of closed forest due to the mutual sheltering of trees but hundreds of mm yr-1 may be contributed by occult precipitation in forests subjected to persistent wind-driven fog and/or clouds. Typical values for the wet tropics range between 4 and 18 per cent of ordinary rainfall to over 100 per cent under more seasonal conditions”. (1990:15)
The few empirical studies which have been conducted show mixed results, with some even demonstrating an increase in rainfall after deforestation. Major modelling studies of deforestation in the Amazon show that even deforestation of the entire area might result in only an 18% reduction in rainfall26. In the case of isolated forest corridors the effect will likely be insignificant.
“The impact of land cover on the precipitation signal is expected to be muted in regions with a large oceanic contribution, such as southeast Asia and the Pacific, West Africa, the Caribbean side of Central America and north-western South America” (2004:188).
Summary The Ranomafana – Andringitra corridor area appears to exhibit several
characteristics (oceanic climate; thin, isolated corridor, relatively high rainfall), that would tend to suggest that forest cover is not the principal driver of rainfall patterns, though in some of the higher parts of the corridor, cloud forests may be important in increasing local rainfall. However, the finding that cloud stripping is particularly pronounced when trees occur in isolation, or in thin bands, rather than as closed forest, may mean that maintaining the large areas of forest demanded by conservation is not necessary to maintain precipitation levels.
26 Lean, J. and P.R. Rowntree (1993). A GCM simulation of the impact of Amazonian deforestation on climate using an improved canopy representation. Quarterly Journal of the Royal Meteorological Society, 119, 509-530.
XXV

Hockley & Razafindralambo (2006) A Social Cost-Benefit Analysis of Conserving the Ranomafana-Andringitra-Pic d’Ivohibe Corridor
Effect of forests on water yield.
Effect of Forest Clearance on Total Water Yield Forests do not act as “sponges” soaking up water during the rainy season and releasing it during the dry season. Rather, they act more like pumps that continually uptake water from the substrate (2004:187, 194-195).
“Although forest soils generally have higher infiltration and storage capacities than soils with less organic matter often much of this water is consumed again by the forest rather than used to sustain streamflow.” (1990:79)
Removal of forest cover leads to higher stream flow totals and reforestation of open lands generally leads to a decline in overall stream flow. This is due to the decreased evaporative loss from tall vegetation during rainy spells (interception) and by the lack of transpiration from trees during dry periods (2004:201-209).
“The bulk of the increase in flow upon clearing is normally observed in the form of baseflow, as long as the intake capacity of the surface soil is not impaired too much” (2004:195).
“With respect to the influence of forests on water yield (total streamflow) it is beyond doubt that both natural and (mature) manmade forests use more water than most agricultural crops or grass land”. (1990:179).
“Generally, the initial increases in total water yield following forest clearing exhibit a more or less irregular decline to pre-clearing levels with time, reflecting the development of the regenerating or newly planted vegetation and year-to-year variability in rainfall” (2004:195).
“The results presented thus far all pertain to relatively small catchment areas [usually <1 km] involving a unidirectional change in cover. Although these provide a clear and consistent picture of increased water yield following a replacement of tall vegetation by a shorter one and vice versa, effects of conversion may be more difficult to discern in the case of larger basins having a variety of land use types and vegetation in various stages of regeneration.” (1990:96-97)
Effect of Forest Clearance on Seasonal Distribution of Flows “In many parts of the tropics, especially in areas experiencing a dry season, the seasonal distribution of streamflow assumes greater importance than total annual water yield.” (1990:98)
“Reports of greatly diminished dry season flow abound in the literature and are usually ascribed to “deforestation”.... At first sight this would seem to contradict the evidence presented [above] in respect to increases in total water yield following removal of tall vegetation… However, the conflict can be resolved when taking into account the net effects of changes in ET and infiltration opportunities associated with the respective land use types… Summarising, if infiltration opportunities after forest removal have decreased to the extent that the increase in amounts of water leaving the area as stormflow exceeds the gain in baseflow associated with decreased ET, then diminished dry season flow is the result.” (1990:111).
“the continued exposure of bare soil after forest clearance to intense rainfall, the compaction of topsoil by machinery or overgrazing the gradual disappearance of soil faunal activity and the increases in area occupied by impervious surfaces such as roads and settlements all contribute to gradually reduced rainfall infiltration opportunities in cleared areas. As a result, catchment response to rainfall becomes more pronounced and the increases in storm runoff during the rainy season may become so large as to seriously impair the recharging of the soil and groundwater
XXVI
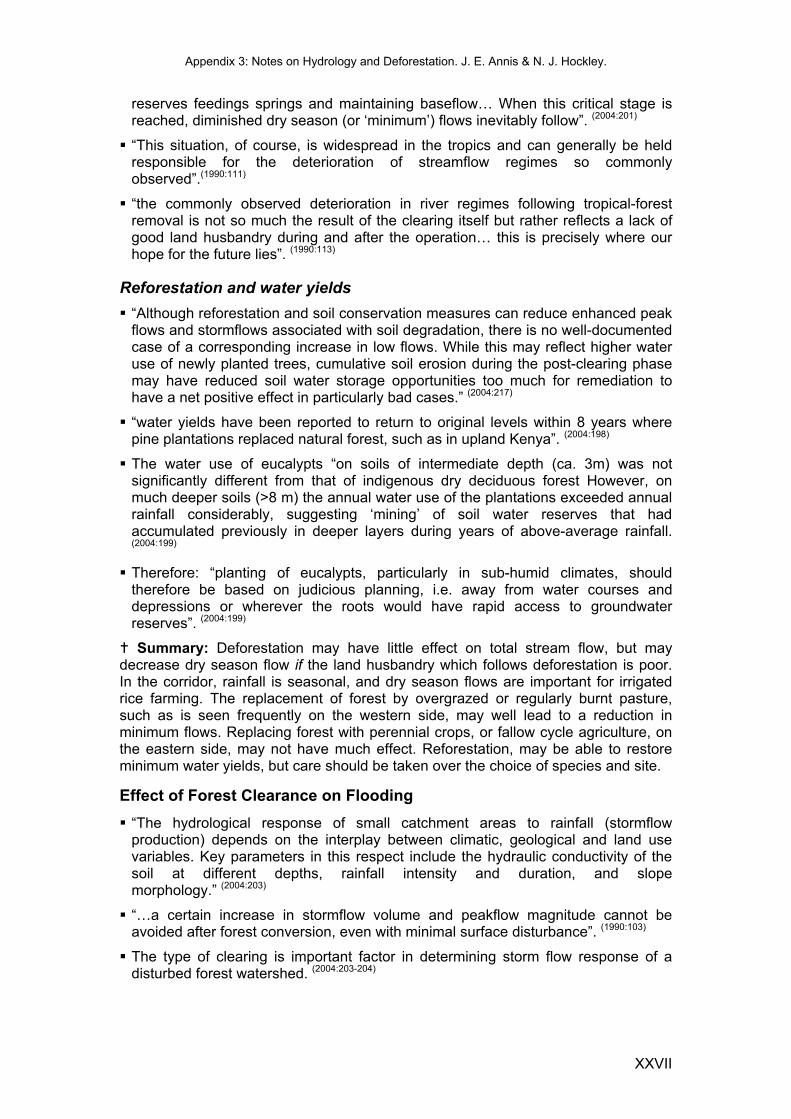
Appendix 3: Notes on Hydrology and Deforestation. J. E. Annis & N. J. Hockley.
reserves feedings springs and maintaining baseflow… When this critical stage is reached, diminished dry season (or ‘minimum’) flows inevitably follow”. (2004:201)
“This situation, of course, is widespread in the tropics and can generally be held responsible for the deterioration of streamflow regimes so commonly observed”.(1990:111)
“the commonly observed deterioration in river regimes following tropical-forest removal is not so much the result of the clearing itself but rather reflects a lack of good land husbandry during and after the operation… this is precisely where our hope for the future lies”. (1990:113)
Reforestation and water yields “Although reforestation and soil conservation measures can reduce enhanced peak flows and stormflows associated with soil degradation, there is no well-documented case of a corresponding increase in low flows. While this may reflect higher water use of newly planted trees, cumulative soil erosion during the post-clearing phase may have reduced soil water storage opportunities too much for remediation to have a net positive effect in particularly bad cases.” (2004:217)
“water yields have been reported to return to original levels within 8 years where pine plantations replaced natural forest, such as in upland Kenya”. (2004:198)
The water use of eucalypts “on soils of intermediate depth (ca. 3m) was not significantly different from that of indigenous dry deciduous forest However, on much deeper soils (>8 m) the annual water use of the plantations exceeded annual rainfall considerably, suggesting ‘mining’ of soil water reserves that had accumulated previously in deeper layers during years of above-average rainfall. (2004:199)
Therefore: “planting of eucalypts, particularly in sub-humid climates, should therefore be based on judicious planning, i.e. away from water courses and depressions or wherever the roots would have rapid access to groundwater reserves”. (2004:199)
Summary: Deforestation may have little effect on total stream flow, but may decrease dry season flow if the land husbandry which follows deforestation is poor. In the corridor, rainfall is seasonal, and dry season flows are important for irrigated rice farming. The replacement of forest by overgrazed or regularly burnt pasture, such as is seen frequently on the western side, may well lead to a reduction in minimum flows. Replacing forest with perennial crops, or fallow cycle agriculture, on the eastern side, may not have much effect. Reforestation, may be able to restore minimum water yields, but care should be taken over the choice of species and site.
Effect of Forest Clearance on Flooding “The hydrological response of small catchment areas to rainfall (stormflow production) depends on the interplay between climatic, geological and land use variables. Key parameters in this respect include the hydraulic conductivity of the soil at different depths, rainfall intensity and duration, and slope morphology.” (2004:203)
“…a certain increase in stormflow volume and peakflow magnitude cannot be avoided after forest conversion, even with minimal surface disturbance”. (1990:103)
The type of clearing is important factor in determining storm flow response of a disturbed forest watershed. (2004:203-204)
XXVII

Hockley & Razafindralambo (2006) A Social Cost-Benefit Analysis of Conserving the Ranomafana-Andringitra-Pic d’Ivohibe Corridor
“[Studies] indicate the strong (local) increases in stormflow volume and peakflow that may be brought about by such adverse practices as regular burning or overgrazing of grassland or forest undergrowth”. (1990:103)
“Normally, peaks (and to a lesser extent stormflow volumes) produced by some form of overland flow are more pronounced than those generated by subsurface types of flow. Therefore, the dramatic increases in peakflows/stormflows that are often reported after logging or land clearing operations using heavy machinery primarily reflect a shift from subsurface flow to overland flow dominated stormflow patterns as a result of increased soil compaction.” (2004:204)
“in catchments where overland flow (usually of the ‘saturation’ type) is already rampant under undisturbed conditions (for instance due to the presence of an impeding layer at shallow depth; the response to rainfall after forest removal hardly increases any further. An example of soils with such poor hydraulic conductivity, and thus high surface runoff even under forested conditions in southeast Asia are the shallow heavy clay soils developed from marls in Java”. (2004:204)
It would be interested to know how the heavy, clay soils of the naturally forested corridor respond, especially given that the bedrock is only just below the surface in many places, and that they therefore would appear to meet these criteria?
“it is important to not immediately attribute short-term trends in the frequency of occurrence of peak discharges or floods on large river systems to upstream changes in land use.” (2004:205)
“Truly widespread flooding is usually the result of an equally large field of extreme rain, occurring at a time when soils have become wetted up by previous rains. In such cases, the process of runoff generation is governed by soil water storage capacity rather than topsoil infiltration opportunities. The presence or absence of a well-developed vegetation cover has become of minor importance by then.” (1990:180)
“the measure often used for policy making is the economic loss associated with a particular flood… equating economic losses with severity of flooding may introduce serious bias in that it gives the impression that flooding has become more frequent and damaging in recent years, whilst in reality the increased economic losses mainly reflect economic growth and increased floodplain occupancy.” (1990:108)
“Whilst it is beyond doubt that adverse land use practices after forest clearance cause serious increases in stormflow volumes and peakflows, one has to be careful to extrapolate such local effects to larger areas. High stormflows generated by heavy rain on a misused part of a river basin may be ‘diluted’ by more modest flows from other parts receiving less or no rainfall at the time, or having regenerating vegetation”. (2004:205)
Summary: In general then, poor land husbandry in the corridor could cause increased flooding at the scale of the fokontany or commune, but will likely have little effect at the regional level.
Effects of Forest Clearance on Soil Erosion “in steep terrain, it is rather difficult to evaluate the influence of various disturbances on land-slide frequency and magnitude with any degree of certainty. Also, remaining areas of forest in the tropics are often found on slopes too steep for terraced cultivation. This immediately introduces the methodological difficulty of finding comparable control sites (the forested slopes being steeper and therefore more susceptible to gravity). In addition, it is not uncommon that such breaks in slope reflect a change in lithology as well”. (1990-122)
XXVIII
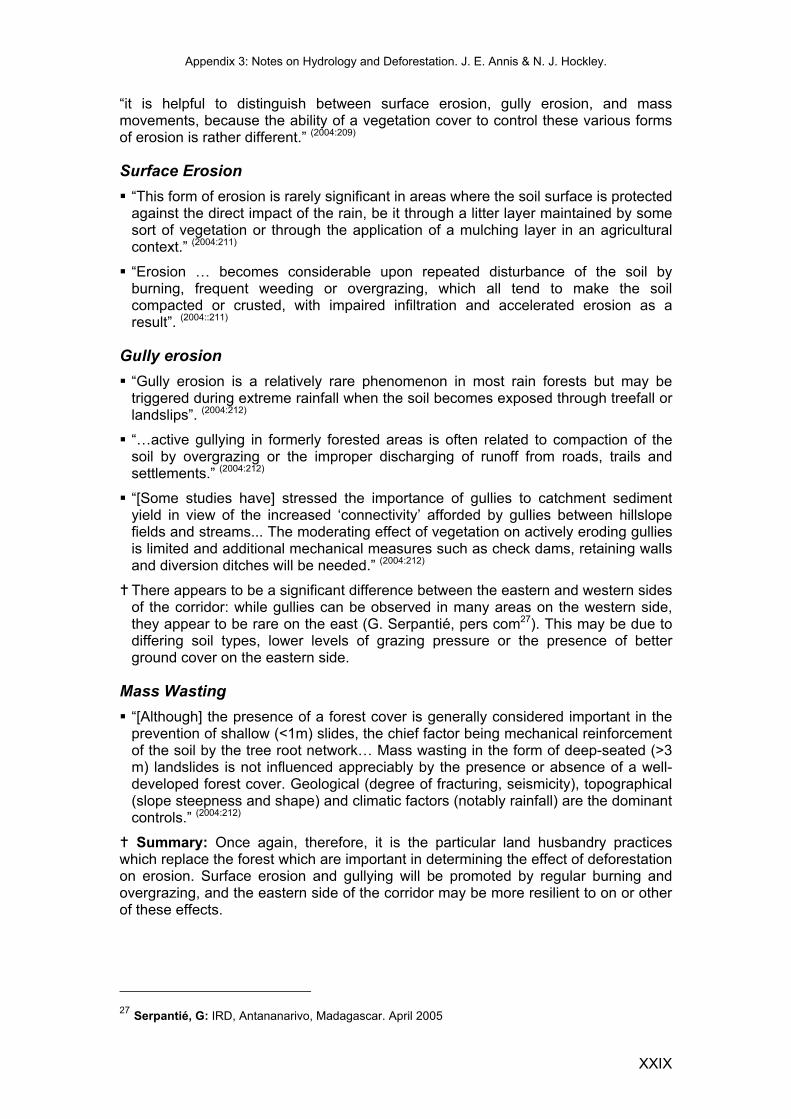
Appendix 3: Notes on Hydrology and Deforestation. J. E. Annis & N. J. Hockley.
“it is helpful to distinguish between surface erosion, gully erosion, and mass movements, because the ability of a vegetation cover to control these various forms of erosion is rather different.” (2004:209)
Surface Erosion “This form of erosion is rarely significant in areas where the soil surface is protected against the direct impact of the rain, be it through a litter layer maintained by some sort of vegetation or through the application of a mulching layer in an agricultural context.” (2004:211)
“Erosion … becomes considerable upon repeated disturbance of the soil by burning, frequent weeding or overgrazing, which all tend to make the soil compacted or crusted, with impaired infiltration and accelerated erosion as a result”. (2004::211)
Gully erosion “Gully erosion is a relatively rare phenomenon in most rain forests but may be triggered during extreme rainfall when the soil becomes exposed through treefall or landslips”. (2004:212)
“…active gullying in formerly forested areas is often related to compaction of the soil by overgrazing or the improper discharging of runoff from roads, trails and settlements.” (2004:212)
“[Some studies have] stressed the importance of gullies to catchment sediment yield in view of the increased ‘connectivity’ afforded by gullies between hillslope fields and streams... The moderating effect of vegetation on actively eroding gullies is limited and additional mechanical measures such as check dams, retaining walls and diversion ditches will be needed.” (2004:212)
There appears to be a significant difference between the eastern and western sides of the corridor: while gullies can be observed in many areas on the western side, they appear to be rare on the east (G. Serpantié, pers com27). This may be due to differing soil types, lower levels of grazing pressure or the presence of better ground cover on the eastern side.
Mass Wasting “[Although] the presence of a forest cover is generally considered important in the prevention of shallow (<1m) slides, the chief factor being mechanical reinforcement of the soil by the tree root network… Mass wasting in the form of deep-seated (>3 m) landslides is not influenced appreciably by the presence or absence of a well-developed forest cover. Geological (degree of fracturing, seismicity), topographical (slope steepness and shape) and climatic factors (notably rainfall) are the dominant controls.” (2004:212)
Summary: Once again, therefore, it is the particular land husbandry practices which replace the forest which are important in determining the effect of deforestation on erosion. Surface erosion and gullying will be promoted by regular burning and overgrazing, and the eastern side of the corridor may be more resilient to on or other of these effects.
27 Serpantié, G: IRD, Antananarivo, Madagascar. April 2005
XXIX
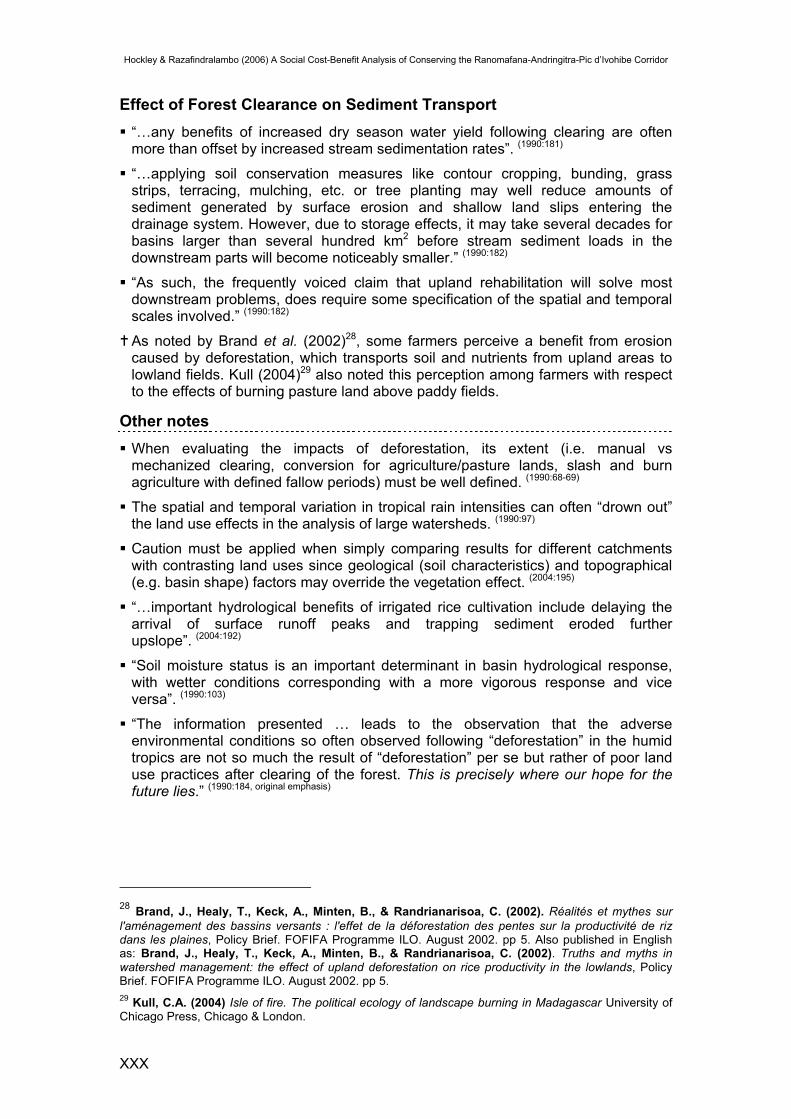
Hockley & Razafindralambo (2006) A Social Cost-Benefit Analysis of Conserving the Ranomafana-Andringitra-Pic d’Ivohibe Corridor
Effect of Forest Clearance on Sediment Transport “…any benefits of increased dry season water yield following clearing are often more than offset by increased stream sedimentation rates”. (1990:181)
“…applying soil conservation measures like contour cropping, bunding, grass strips, terracing, mulching, etc. or tree planting may well reduce amounts of sediment generated by surface erosion and shallow land slips entering the drainage system. However, due to storage effects, it may take several decades for basins larger than several hundred km2 before stream sediment loads in the downstream parts will become noticeably smaller.” (1990:182)
“As such, the frequently voiced claim that upland rehabilitation will solve most downstream problems, does require some specification of the spatial and temporal scales involved.” (1990:182)
As noted by Brand et al. (2002)28, some farmers perceive a benefit from erosion caused by deforestation, which transports soil and nutrients from upland areas to lowland fields. Kull (2004)29 also noted this perception among farmers with respect to the effects of burning pasture land above paddy fields.
Other notes When evaluating the impacts of deforestation, its extent (i.e. manual vs mechanized clearing, conversion for agriculture/pasture lands, slash and burn agriculture with defined fallow periods) must be well defined. (1990:68-69)
The spatial and temporal variation in tropical rain intensities can often “drown out” the land use effects in the analysis of large watersheds. (1990:97)
Caution must be applied when simply comparing results for different catchments with contrasting land uses since geological (soil characteristics) and topographical (e.g. basin shape) factors may override the vegetation effect. (2004:195)
“…important hydrological benefits of irrigated rice cultivation include delaying the arrival of surface runoff peaks and trapping sediment eroded further upslope”. (2004:192)
“Soil moisture status is an important determinant in basin hydrological response, with wetter conditions corresponding with a more vigorous response and vice versa”. (1990:103)
“The information presented … leads to the observation that the adverse environmental conditions so often observed following “deforestation” in the humid tropics are not so much the result of “deforestation” per se but rather of poor land use practices after clearing of the forest. This is precisely where our hope for the future lies.” (1990:184, original emphasis)
28 Brand, J., Healy, T., Keck, A., Minten, B., & Randrianarisoa, C. (2002). Réalités et mythes sur l'aménagement des bassins versants : l'effet de la déforestation des pentes sur la productivité de riz dans les plaines, Policy Brief. FOFIFA Programme ILO. August 2002. pp 5. Also published in English as: Brand, J., Healy, T., Keck, A., Minten, B., & Randrianarisoa, C. (2002). Truths and myths in watershed management: the effect of upland deforestation on rice productivity in the lowlands, Policy Brief. FOFIFA Programme ILO. August 2002. pp 5. 29 Kull, C.A. (2004) Isle of fire. The political ecology of landscape burning in Madagascar University of Chicago Press, Chicago & London.
XXX

Appendix 3: Notes on Hydrology and Deforestation. J. E. Annis & N. J. Hockley.
Economic Significance of Hydrological Functions Two major reviews of the economic implications of the hydrological functions of tropical forests, have been compiled by Chomitz and Kumari (199630, 199831). They base their reviews heavily on the work of Bruijnzeel and other hydrologists (see above). However, they have interpreted this work from an economic perspective, looking at the domestic (within–country) hydrological benefits of preserving tropical forests.
They stress that the hydrological effects of deforestation are far from clear, and depend greatly on the land use that follows. Given this, if one takes a domestic point of view, and ignores other values of the forest such as biodiversity values, maintaining natural forest cover under strict protection will rarely be the economically favoured way of maintaining hydrological functions of catchments. Reduced impact logging, or the replacement of natural forest by plantations, perennial crops, or long fallow slash and burn agriculture with small plot sizes will often be nearly as good from a hydrological perspective as natural forest, while generating other substantial economic benefits. In cost-benefit analyses, like that presented in the main report, that seek to compare two options for a forest area, one based on conservation, one on production, the hydrological benefits of maintaining some form of vegetation cover cannot be attributed solely to the conservation option. Many of these benefits will also be present, to some degree, in a production option that also allows greater extractive or productive use of the land area. Evaluating the difference between two options, in hydrological terms will be difficult, and there is no certainty that the conservation option will significantly outperform the production option.
In addition, even if a discernible reduction in hydrological or climatic function can be attributed to deforestation, it does not necessarily follow from this that an economic cost will result. For example, even if deforestation could be shown to result in a reduction in rainfall, it does not follow directly that a cost results. In areas which typically have very high rainfall levels, such as eastern Madagascar, it is far from clear that a reduction in rainfall would per se result in a net economic cost.
Finally one must consider the importance of the extent of any change. For while biodiversity conservation may require large areas of undistrubed natural forest, hydrological function may be maintained by the retention of small, possibly simplified forests (natural or planted) in particular key areas.
Chomitz and Kumari conclude that the case for tropical forest conservation must therefore be made substantially on other grounds, such as the value of the forest for ecotourism, carbon sequestration, or non-use, existence-related values of its biodiversity and landscape.
The authors state on the cover of their 1996 review that the economic benefits, in terms of hydrological function, of tropical forests benefits are:
“likely to be highly context-specific and may often be smaller than popularly supposed.”
30 Chomitz, K.M. & Kumari, K. (1996). The Domestic Benefits of Tropical Forests A Critical Review Emphasizing Hydrological Functions, Policy research working paper. Rep. No. 1601. World Bank, May 1996. 31 Chomitz, K.M. & Kumari, K. (1998) The domestic benefits of tropical forests: A critical review. World Bank Research Observer, 13, 13-35.
XXXI
Hockley & Razafindralambo (2006) A Social Cost-Benefit Analysis of Conserving the Ranomafana-Andringitra-Pic d’Ivohibe Corridor
XXXII
They go on to say that:
“This underscores the importance of grant financing to support forest preservation that yields global or non-economic benefits.”
In other words, they recommend that we should not necessarily expect developing countries to save tropical forests primarily because of their hydrological function, nor should they necessarily do so. However, where tropical forests provide other benefits, particular of a global nature, we should directly fund their conservation, internationally, through mechanisms such as the Global Environmental Facility (GEF)32.
Conclusion and Significance for the Corridor Hydrologically speaking, what happens after forests are cleared depends greatly on how the land is managed, and what vegetation replaces it. Agroforestry, plantations, long fallow slash-and-burn or perennial crops will all perform similarly to, if less well than, natural forest. Given the weakness of many of the linkages between deforestation and hydrological problems, the economic implications are even less clear, and likely to be less important than is often supposed. In the context of the corridor, the economic implications of hydrological problems following deforestation are far from certain, but are unlikely to be very large, and the value of un-captured benefits in this study is unlikely to be hugely significant. It is possible, however, that the effect may be very different on the two sides of the corridor, since land husbandry practices and the vegetation which replaces the forest is very different. On finer spatial scales, individual villages and communes may benefit significantly from forest retention: to predict this would require further work. Overall then, the hydrological benefits of the corridor should not be forgotten (nor have they been in the preceding valuation) but neither should they be overstated or allowed to become a distraction from the other, very significant benefits that conserving the corridor will bring to local communities, to Madagascar, and to the world.
32 See for example Menzel, S. (2005). Financial support for biodiversity protection in developing countries – does the CBD mechanism lead to an appropriate level of biodiversity protection? In Valuation and Conservation of Biodiversity Interdisciplinary Perspectives on the Convention on Biological Diversity (eds M. Markussen, R. Buse, H. Garrelts, M.A. Manez Costa, S. Menzel & R. Marggraf), pp. xxx, 430 p. 57 illus. Springer. And other chapters in the same volume.