Embed Size (px)
Citation preview
University of Rhode Island University of Rhode Island
DigitalCommons@URI DigitalCommons@URI
Open Access Master's Theses
2015
Cost and Environmental Impacts in Manufacturing: A Case Study Cost and Environmental Impacts in Manufacturing: A Case Study
Approach Approach
Nils Nörmann University of Rhode Island, [email protected]
Follow this and additional works at: https://digitalcommons.uri.edu/theses
Recommended Citation Recommended Citation Nörmann, Nils, "Cost and Environmental Impacts in Manufacturing: A Case Study Approach" (2015). Open Access Master's Theses. Paper 681. https://digitalcommons.uri.edu/theses/681
This Thesis is brought to you for free and open access by DigitalCommons@URI. It has been accepted for inclusion in Open Access Master's Theses by an authorized administrator of DigitalCommons@URI. For more information, please contact [email protected].
COST AND ENVIRONMENTAL IMPACTS IN MANUFACTURING: A CASE
STUDY APPROACH
BY
NILS NÖRMANN
A THESIS SUBMITTED IN PARTIAL FULFILLMENT OF THE
REQUIREMENTS FOR THE DEGREE OF
MASTER OF SCIENCE
IN
MECHANICAL ENGINEERING AND APPLIED MECHANICS
UNIVERSITY OF RHODE ISLAND
2015
MASTER OF SCIENCE IN MECHANICAL ENGINEERING
OF
NILS NÖRMANN
APPROVED:
Thesis Committee:
Major Professor: Valerie Maier-Speredelozzi
Yi Zheng
Aaron S. Bradshaw
Nasser H. Zawia
DEAN OF THE GRADUATE SCHOOL
UNIVERSITY OF RHODE ISLAND
2015
ii
ABSTRACT
According to the Brundtland report, sustainable development “meets the needs of
the present without compromising the ability of future generations to meet their own
needs” (United Nations 1987). The 3 pillars of sustainability have been identified as
economic development, social development, and environmental protection (United
Nations 2005). These components interact and affect each other in any real world
application. For manufacturing companies, sustainable manufacturing is one way to
decrease the environmental impact of their products. In the literature, there are
different approaches to assess sustainability. However, no approach aims to improve
sustainability and costs since sustainability and cost reduction are often seen as
conflictive and cannot be achieved at the same time. An overlap between cost
reduction and sustainability can push companies to expend more effort in order to
achieve long term business success while decreasing the environmental impact of their
products.
This study presents a framework that aims to prove this overlap based on gathered
data of a case study. Besides an assessment of the current state of manufacturing
processes, alternative future state models are determined, which are more sustainable
and decrease the costs of production.
All data gathered within this study was manipulated by a key multiplier to ensure
the integrity of the manufacturer and does not represent the real manufacturing data.
iii
ACKNOWLEDGMENTS
I would like to sincerely thank Dr. Valerie Maier Speredelozzi for her motivation
and enthusiasm as my advisor. Her guidance was always very helpful during the
exchange year in the Department of Mechanical, Industrial & Systems Engineering,
University of Rhode Island and while writing this thesis. It has been a real pleasure to
work with her.
I also would like to thank Karl Anderson W., Linda K. and all the coworkers who
supported me on my research.
Thank you to the committee members Dr. Zheng and Dr. Bradshaw for reviewing
my thesis and supporting my work with very helpful criticism.
I also want to say thank you to Vathana Ngeth for supporting and motivating me
during the entire time here in Rhode Island. You made this year absolutely unique and
unforgettable.
Finally, I would like to thank my parents Sabine Nörmann and Uwe Nörmann and
my Sister Lea Nörmann. Their loving support in any situation of my life and
especially during this year abroad was an enormous help and care. Thanks to them I
was able to challenge even the most difficult tasks and have reached as of today all my
goals.
iv
TABLE OF CONTENTS
ABSTRACT ................................................................................................................... ii
ACKNOWLEDGMENTS ............................................................................................ iii
TABLE OF CONTENTS .............................................................................................. iv
LIST OF TABLES ....................................................................................................... vii
LIST OF FIGURES .................................................................................................... viii
LIST OF ABBREVIATIONS ...................................................................................... xii
1. CHAPTER 1 – INTRODUCTION .......................................................................... 1
1.1. Background, Motivation and related Problems .......................................... 1
1.2. Objectives and Procedure ........................................................................... 3
2. CHAPTER 2 – REVIEW OF LITERATURE ......................................................... 6
2.1. Basics of Sustainability .............................................................................. 6
2.1.1. Background of Sustainability ............................................................. 6
2.1.2. Sustainability and Sustainable Development ..................................... 7
2.2. Product development and its influence on production ............................... 8
2.2.1. Simultaneous Engineering ............................................................... 11
2.2.2. Design for X ..................................................................................... 11
2.2.3. Design for Assembly by Boothroyd- Dewhurst ............................... 13
2.2.4. Design for Manufacturing ................................................................ 15
2.2.5. Design for Environment ................................................................... 16
2.3. Cost and environmental impact factors during manufacturing ................ 16
2.3.1. Energy .............................................................................................. 17
2.3.2. Resources ......................................................................................... 20
2.3.3. Consumables .................................................................................... 21
v
2.4. Measuring environmental impact ............................................................. 25
2.4.1. Life Cycle Assessment ..................................................................... 25
2.4.2. LCA Software .................................................................................. 38
2.4.3. Value Stream Mapping .................................................................... 39
2.5. Environmental impact of manufacturing processes ................................. 43
2.5.1. Machining ........................................................................................ 44
2.5.2. Casting ............................................................................................. 51
2.5.3. Welding ............................................................................................ 55
2.5.4. Coating ............................................................................................. 57
2.6. Computer Aided Cost Estimation ............................................................ 58
2.7. Need for a framework to assess sustainability and cost ........................... 60
3. CHAPTER 3 – METHODOLOGY ....................................................................... 62
3.1. Suitable Indicators of Sustainability ........................................................ 64
3.1.1. Basic criteria for Indicators .............................................................. 64
3.1.2. Identifying Indicators for Sustainability .......................................... 66
3.2. Collect Primary Data ................................................................................ 75
3.2.1. Data collection of CNC machines .................................................... 75
3.2.2. Data collection for welding .............................................................. 78
3.2.3. Data collection of painting process .................................................. 79
3.3. Selecting Appropriate LCA Software ...................................................... 79
3.4. Selecting CACE Software ........................................................................ 88
3.5. Developing an Enhanced Value Stream Map .......................................... 90
CHAPTER 4: APPLYING FRAMEWORK TO A CASE STUDY ............................ 92
4.1. Introduction of the Case Study: Industrial Equipment Unit..................... 92
4.1.1. Main components of the product...................................................... 94
4.1.2. Manufacturing process ..................................................................... 95
4.2. Application of Life Cycle Assessment ..................................................... 97
4.2.1. Goal and scope definition................................................................. 97
4.2.2. Inventory analysis ............................................................................ 99
vi
4.3. Implementation of the data into LCA Software ..................................... 109
4.3.1. Model 1: Current State ................................................................... 110
4.3.2. Model 2: Coconut-oil based cutting fluid and powder coating ...... 112
4.3.3. Model 3: unpainted IEU ................................................................. 113
4.4. LCA Results ........................................................................................... 113
4.4.1. Model 1: Current State ................................................................... 113
4.4.2. Model 2: Coconut-oil based cutting fluid and powder coating ...... 120
4.4.3. Model 3: No paint .......................................................................... 123
4.4.4. Further Future State Models........................................................... 124
4.5. Cost Aspect ............................................................................................ 126
4.5.1. Costing: Painting ............................................................................ 127
4.5.2. Costing: Metalworking Fluid ......................................................... 128
4.6. Overlap of Cost reduction an Environmental Impact ............................ 129
4.7. Visualization of the results in a Value Stream Map ............................... 130
CHAPTER 5 – CONCLUSION ................................................................................. 132
5.1. Discussion .............................................................................................. 133
5.2. Further research ...................................................................................... 134
5.3. Contribution ........................................................................................... 135
BIBLIOGRAPHY ...................................................................................................... 137
vii
LIST OF TABLES
Table 1: Advantages and disadvantages of vegetable oils as lubricants ...................... 25
Table 2: Collectability of specific data ........................................................................ 32
Table 3: Overview of different Streamlining approaches ............................................ 37
Table 4: LCA applications. Bold “X" indicates the most frequently used .................. 38
Table 5: Waste stream for drilling ............................................................................... 49
Table 6: Comparison of the waste stream of different casting types ........................... 53
Table 7: Criteria for Sustainability Indicators .............................................................. 65
Table 8: Key sustainability indicators .......................................................................... 68
Table 9: Identifying weighting factors for emissions .................................................. 72
Table 10: Result of Evaluation of Different LCA Software ........................................ 87
Table 11: Results of weight measuring for eccentric component .............................. 105
Table 12: Overview of the scrap metal production during machining....................... 106
Table 13: Collected data for CNC machines.............................................................. 107
Table 14: List of ingredients gloss metal lacquer ...................................................... 109
Table 15: List of generic data used within the LCA of the IEU case study ............... 111
Table 16: Quantities of used materials for each manufacturing step ......................... 117
viii
LIST OF FIGURES
Figure 1: Comparison of Origin and Responsibility of Costs ........................................ 3
Figure 2: Overall procedures of the study ...................................................................... 4
Figure 3: The three dimensions of Sustainability .......................................................... 8
Figure 4: Production systems as an Input-Throughput-Output process ........................ 9
Figure 5: Assessment and cost responsibility within the production process .............. 10
Figure 6: DFX- Methods .............................................................................................. 12
Figure 7: process steps of DFMA ................................................................................ 13
Figure 8: Structure of the total costs in manufacturing ............................................... 17
Figure 9: Comparison of the energy consumption of the German industry ................. 18
Figure 10: Sankey diagram for energy consumption of a chip removal process ......... 19
Figure 11: Specific energy consumption for different manufacturing processes ........ 20
Figure 12: Global Warming Potential (GWP) per kg of cutting fluid ......................... 24
Figure 13: General steps of Life Cycle Assessment .................................................... 27
Figure 14: Simplified example of a PVC window system boundary ........................... 28
Figure 15: Flow chart to visualize production process ................................................ 30
Figure 16: Schematic data collection ........................................................................... 31
Figure 17: Translation of operative data to process module based data set ................. 33
Figure 18: Example of an eco-profile .......................................................................... 35
Figure 19: Visual Representation of Process Water on Sus-VSM ............................... 40
Figure 20: Visual Representation of Raw Material Usage on Sus-VSM ..................... 41
ix
Figure 21: Visual Representation of Energy Consumption on Sus-VSM ................... 41
Figure 22: Work Environment Metric ......................................................................... 42
Figure 23: Input-Output diagram of Machining........................................................... 44
Figure 24: Determination of power characteristics and energy requirements ............. 46
Figure 25: Specific energy comparison between hard turning and grinding ............... 48
Figure 26: Comparison of LCA results for wet and dry machining ............................ 51
Figure 27: Energy requirements by stage..................................................................... 53
Figure 28: Material and energy flows used for Sand Casting ...................................... 55
Figure 29: Material flow for Gas metal-arc welding ................................................... 56
Figure 30: Contribution on environmental impact indicators ...................................... 57
Figure 31: Methodology steps of this study ................................................................. 63
Figure 32: Example of a midpoint-endpoint model ..................................................... 73
Figure 33: Okuma LB3000 EX CNC machine ............................................................ 75
Figure 34: General Input-Output diagram for CNC machining ................................... 76
Figure 35: Input-Output diagram of GMAW Welding ................................................ 78
Figure 36: Screenshot GaBi paper clip tutorial ............................................................ 82
Figure 37: Screenshot from the GaBi database for paint ............................................. 82
Figure 38: Screenshot of the detailed view in GaBi .................................................... 83
Figure 39: Screenshot of the current state model in GaBi ........................................... 83
Figure 40: Screenshot of Umberto NXT LCA Tutorial ............................................... 86
Figure 41: Evaluation of different CACE software ..................................................... 89
Figure 42: Example of the adjusted VSM .................................................................... 91
Figure 43: Industrial Equipment Unit .......................................................................... 93
x
Figure 44: IEU mounted to the body of a truck ........................................................... 94
Figure 45: Main components of the IEU...................................................................... 95
Figure 46: simplified manufacturing process of an IEU .............................................. 96
Figure 47: System boundaries of the analyzed product ............................................... 99
Figure 48: Energy consumption and demand for the housing on CNC A ................. 100
Figure 49: Energy demand and consumption for the housing on CNC C ................. 101
Figure 50: Energy consumption and demand for mounting cover on CNC A........... 102
Figure 51: Energy consumption and demand for eccentric on CNC A ..................... 103
Figure 52: Energy consumption and demand for shaft on CNC B ............................ 104
Figure 53: Energy consumption welding one shaft.................................................... 108
Figure 54: LCA-Model of the IEU............................................................................. 115
Figure 55: Overall LCA results of current state model .............................................. 116
Figure 56: GWP100 of Model 1 split up by manufacturing steps ............................. 118
Figure 57: Human toxicity of Model 1 split up by manufacturing steps ................... 119
Figure 58: AP of Model 1 split up by manufacturing steps ....................................... 120
Figure 59: Overview of environmental impact of Model 2 ....................................... 121
Figure 60: Potential improvements in the manufacturing phase of Model 2 ............. 122
Figure 61: Comparison of the impact improvement by changing the painting process
.................................................................................................................................... 123
Figure 62: Comparison of Model 1 and Model 4 (Plastic) ........................................ 125
Figure 63: Comparison of Model 1 and Model 5 (Cast Iron) .................................... 126
Figure 64: Costs and potential savings for coating processes .................................... 127
Figure 65: Metal working fluid consumption and related costs ................................. 128

xi
Figure 66: Comparison of Reduced Impact and Cost Savings for 10000 IEUs ........ 129
Figure 67: The painting process of the IEU visualized in a VSM ............................. 130
Figure 68: Value Stream Map of the current state model .......................................... 131
xii
LIST OF ABBREVIATIONS
ABC Activity Based Costing
AP Acidification Potential
BOM Bill of Material
BTU British Thermal Unit
CACE Computer Aided Cost Estimation
CAD Computer Aided Design
CFH Cubic Foot Per Hour
CNC Computer Numerical Control
CSD Commission on Sustainable Development
DALY Disability Adjusted Life Years
DCB Dichlorobenzene
DFA Design for Assembly
DFE Design for Environment
DFM Design for Manufacturing
DFMA Design for Manufacture and Assembly
DFX Design for X
DIN German Institute for Standardization
EIA Energy Information Administration
ELCD European Reference Life Cycle Database
EPA Environmental Protection Agency
xiii
GMA Grocery Manufacturers Association
GMAW Gas Metal-Arc Welding
GWP Global Warming Potential
HAP Hazardous Air Pollutants
HT Human Toxicity
IEU Industrial Equipment Unit
ISO International Organization for Standardization
LCA Life Cycle Assessment
LCI Life Cycle Inventory
LCIA Life Cycle Impact Assessment
MECS Manufacturing Energy Consumption Survey
MIG Metal Inert Gas Welding
MTM Methods Time Measurement
NEEDS New Energy Externalities Developments for Sustainability
NERC North American Electric Reliability Corporation
NREL National Renewable Energy Laboratory Data Base
PLI Physical Load Index
PVC Polyvinyl chloride
SLCA Simplified Life Cycle Assessment
SMAW Shielded Metal-Arc Welding
Sus-VSM Sustainable VSM
VOC Volatile Organic Compound

xiv
VSM Value Stream Map
1
1. CHAPTER 1 – INTRODUCTION
This thesis provides an overview of the broad discussed topic of sustainability
and assessment of sustainability in manufacturing by means of an extensive literature
review. Furthermore, a framework to relate manufacturing costs to environmental
impact will be derived and applied to a case study at a manufacturing company. The
first section of this chapter presents the background of the study and exposes the gaps
and concerns that justify the research in this field. The second section describes the
derived objectives of this study and how they can be approached successfully.
1.1. Background, Motivation and related Problems
A study of The Grocery Manufacturers Association (GMA) and Deloitte from
2009 states that 95% of all customers would buy “green products”, if there is a
satisfactory product on the market. Compared to the 25% of customers who already
purchase green products, it derives that there is an unfulfilled demand for such
products on the market. This survey shows, that nowadays the demand for sustainable
products show that society is more aware of the increasing pollution in the
environment and how it is connected to the ways products are made (Deloitte 2009).
Customers are increasingly environmentally conscious in their purchase decisions,
putting more pressure on the producers to create more sustainable products (Windsor
2011). In addition to this, environmental legislation is becoming stricter in order to
2
extend the producer’s responsibility (Lindahl 2006). To fulfill customer desires and
current environmental laws, companies have to redesign their products and still stay
competitive within the market. Therefore, the costs of the products have to be kept on
the same level or decrease within the redesign process. While different techniques
such as Design for Environment (DFE) and Design for Sustainability aim to decrease
the environmental impact of a product, Design for Cost aims to decrease the costs of a
product. This thesis will analyze the different techniques in order to identify whether
the relationship between sustainability and cost reduction in conflict, or if there are
overlapping benefits. The outcome of this approach will be a verification of the
existing overlapping benefits and how they can be achieved. Furthermore, to prove
these findings a case study in cooperation with a regional company is considered. An
existing product will be chosen and reasonable assumptions will be made in order to
verify the hypotheses. The overlap of sustainability and cost reduction would also
mean an overlap in business and stakeholder interest and protection of the
environment. Proving this overlap can push companies to expend more effort in order
to achieve long term business success while decreasing the environmental impact of
their products (Savitz and Weber 2007).
In a world with limited resources and increasing pollution problems a more
sustainable environment is highly important (Ljungberg 2007). In order to contribute
to this idea more sustainable products are needed, which means new ecofriendly
designs have to be implemented. To help designers and engineers, different types of
methods have been developed to support the development process with guidelines for
sustainability. However, price is one of the most important characteristics for a
3
successful product since most customers are price sensitive. Therefore, it can be
difficult to design a successful product while only focusing on its sustainability. To
avoid higher prices, reducing costs is one of the most important goals for every
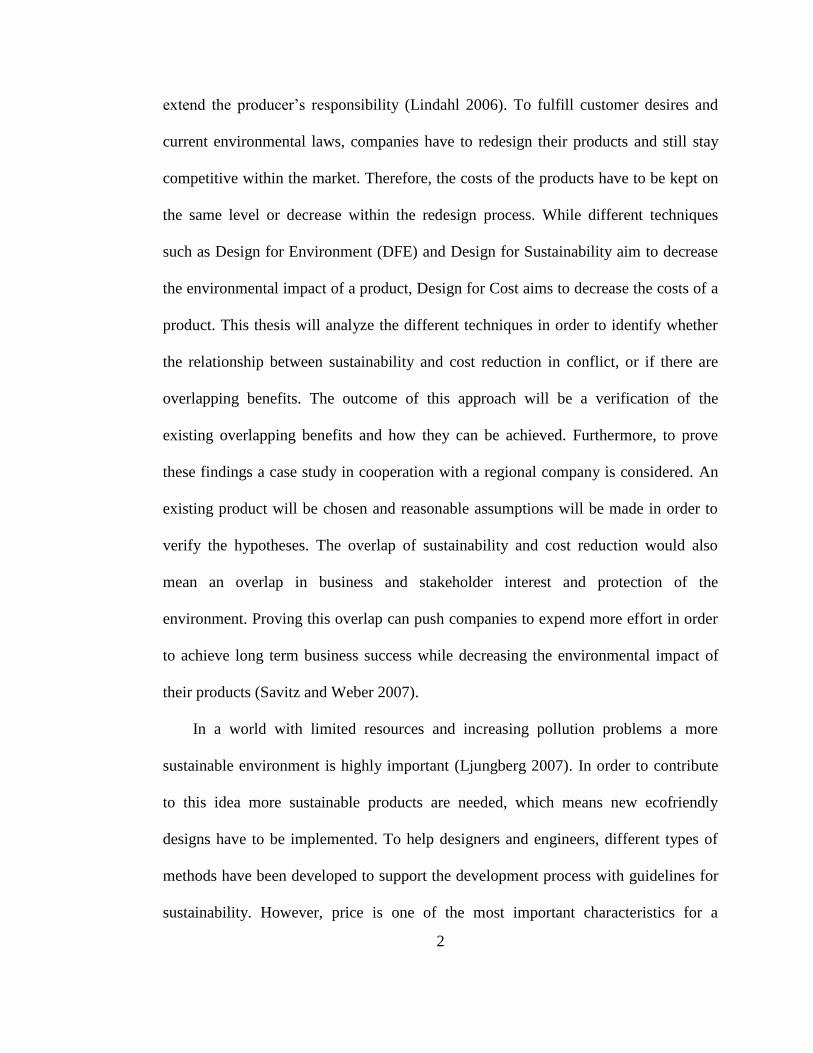
company. Lean design processes that aim to reduce the cost of the product are
indispensable, since the early stages of product development the influence of future
costs is high (see Figure 1) (Bullinger and Warschat 1995).
Figure 1: Comparison of Origin and Responsibility of Costs (Bullinger and Warschat 1995)
1.2. Objectives and Procedure
While sustainability and cost reduction are both well researched, a comprehensive
approach of how to combine these two terms is missing. Therefore, this research study
aims to analyze overlap of sustainability and cost based on a case study conducted at a
manufacturing company. This analysis identifies where in the manufacturing process
most of the environmental impact is caused and compares them with costs. Finally,
this study aims to provide alternative routings and processes to decrease the
environmental impact and costs. The procedures followed in this research study are
4
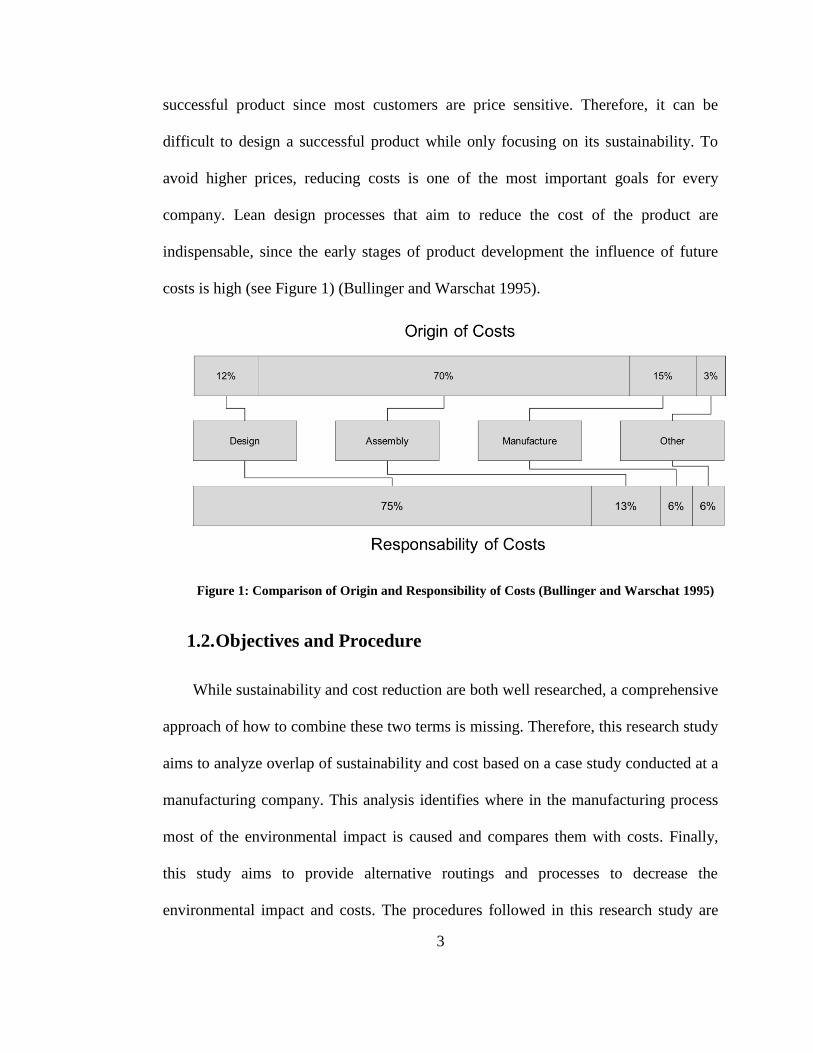
illustrated in Figure 2 and are oriented toward the problem-solving cycle. According to
these procedures, the problem is formulated in the first chapter. ´
Figure 2: Overall procedures of the study
In the next chapter, an extensive literature review is given to provide fundamental
knowledge of:
Manufacturing and product development
Cost and environmental impact factors in manufacturing
Sustainable manufacturing
5
Manufacturing and product development stresses on different approaches of how
to decrease manufacturing costs and enhance sustainability in the early stages of the
product design. Cost in manufacturing aims to explain the different cost factors in
manufacturing that are related to environmental impact and how to estimate them.
Whereas sustainable manufacturing explains different methods of measuring the
environmental impact of manufacturing processes and gives an overview of different
manufacturing processes and their environmental impact.
The third chapter introduces presents the methodology that is used in this research
to develop a framework to combine costs and environmental impacts. This includes
the identification of suitable measures for environmental impact and sustainability, the
evaluation of different software tools and how the results can be visualized and
compared to costs. In the fourth chapter, based on the framework, a case study is
conducted at a manufacturing company to assess the environmental impact of a
specific product. Therefore, Life Cycle Assessment (LCA) which is a common method
to evaluate the environmental impact of a product during its life cycle. Possible results
are for example the total CO2 emissions that are released within the manufacturing
process. In the next step alternative manufacturing routing and product designs are
suggested and evaluated. By comparing the LCA results of each alternative the most
environmental design and manufacturing process can be derived. Furthermore, the
LCA results will be compared to the costs of each manufacturing step to point out the
overlap of costs and sustainability. The last chapter closes with a summary and a
discussion that contains recommendations for further research.
6
2. CHAPTER 2 – REVIEW OF LITERATURE
For a better understanding of this research study, the following chapter gives a
review of the current work regarding product life cycle and how it is related to
sustainability and cost reduction. This also includes an overview of the most common
techniques to reduce cost and increase sustainability. In addition, existing approaches,
methods and software are presented within this chapter.
2.1. Basics of Sustainability
Despite its increasingly widespread use, the term and concept of sustainability has
remained ambiguous, vague, and non-binding in its consequences. However,
sustainability is becoming an important aspect in politics, industry and everyday life.
Should the use of the concept of sustainability be more than just a fashionable phrase,
it requires not only rhetorical interpretations of existing practice, but also an in-depth
discussion of the importance of this concept and its contents (Linne and Schwarz
2003).
2.1.1. Background of Sustainability
The general principle of sustainability greatly increased in popularity at the
conference in Rio de Janeiro in 1992. However, it had many precursors. Since the
early-1970s, there was a new debate on the "sustainability" of economic activity.
Important events were the growth critical publication "Limits to Growth" in 1972,
which took place in the same year as the first World Environment Conference which
7
was held in Stockholm and followed by the "Symposium on the economics of
exhaustible resources" two years later. Based on these three milestones "sustainability"
was first defined as the question of the optimal use of natural resources (Hauff 2014).
The report of the "Brundtland Commission", published in 1987, used the term
sustainable development to describe a new and comprehensive political model of the
world community. The objectives of this model are the environmental protection and
economic development that are connected with the demand to meet the needs of both
today's and future generations (Hinrichsen 1989). After the Rio Conference, there was
a variety of following conferences during which the vision of sustainable development
was further concretized (Hauff 2014).
2.1.2. Sustainability and Sustainable Development
The Brundtland Report is regarded as one of the most important contributions
to the development and definition of the vision of sustainable development. However,
there were a number of publications or opinions that have influenced this report. Of
particular note is the first report on the Club of Rome. The report is based on a
forecast which has the following central message: exponential growth leads to
exceeding the natural limits of nature, whereby particularly a scarcity of exhaustible
resources such as oil, occurs. This was an extreme contrast compared to the optimistic
growth models of the capitalistic and dominant economic systems at that time. The
forecast claims that up to the year 2100 crisis phenomena will occur such as a drop in
the population, a de-industrialization and a massive restriction of the usual living
conditions (United Nations 2011). Referring to the definition by Brundtland,
8
sustainable development is “development that meets the needs of the present without
compromising the ability of future generations to meet their own needs” (United
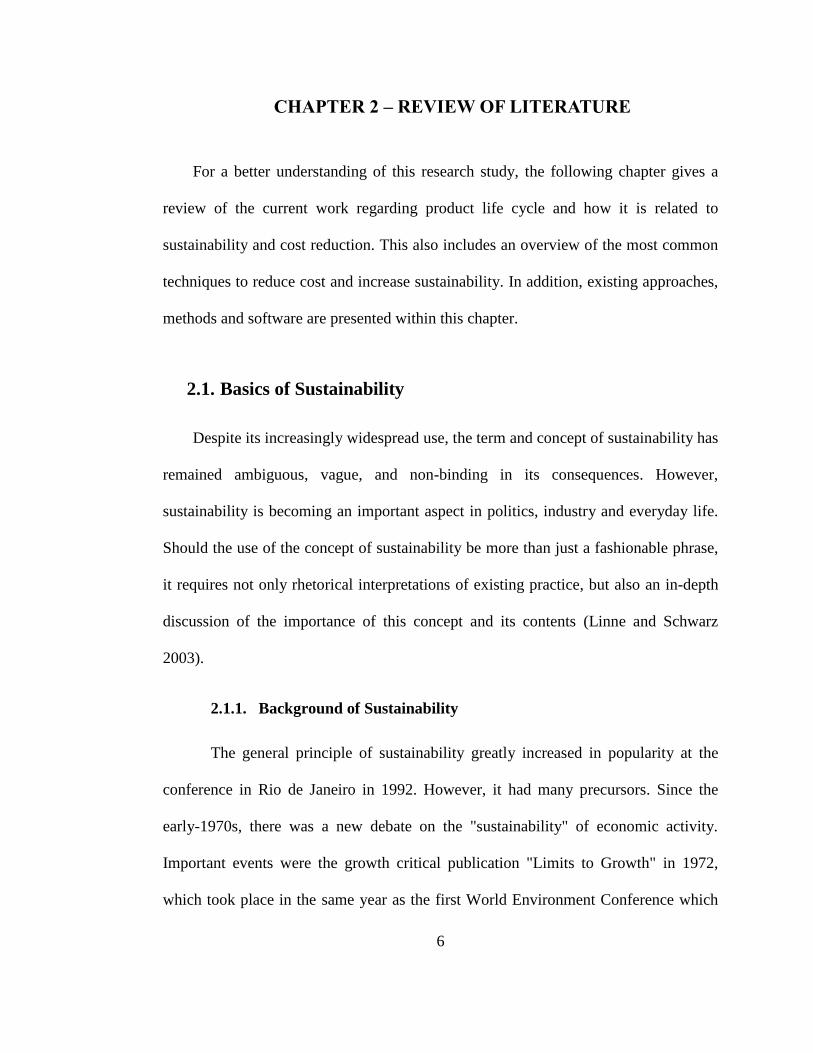
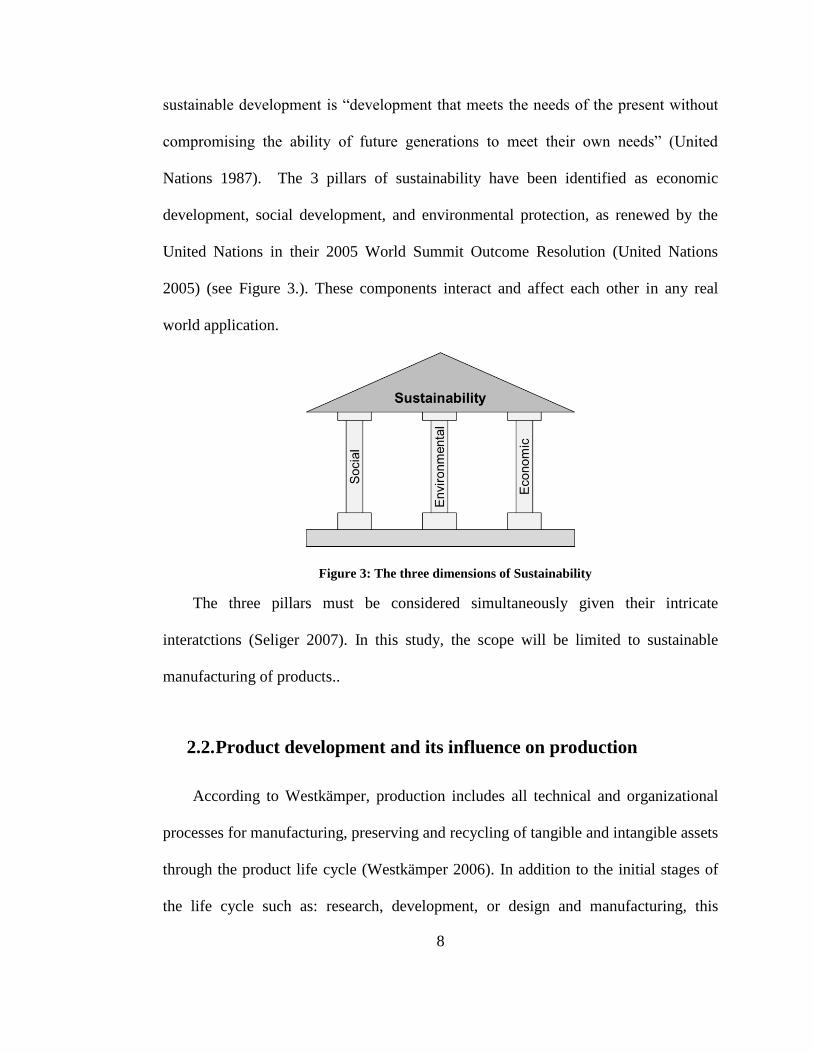
Nations 1987). The 3 pillars of sustainability have been identified as economic
development, social development, and environmental protection, as renewed by the
United Nations in their 2005 World Summit Outcome Resolution (United Nations
2005) (see Figure 3.). These components interact and affect each other in any real
world application.
Figure 3: The three dimensions of Sustainability
The three pillars must be considered simultaneously given their intricate
interatctions (Seliger 2007). In this study, the scope will be limited to sustainable
manufacturing of products..
2.2. Product development and its influence on production
According to Westkämper, production includes all technical and organizational
processes for manufacturing, preserving and recycling of tangible and intangible assets
through the product life cycle (Westkämper 2006). In addition to the initial stages of
the life cycle such as: research, development, or design and manufacturing, this
9
definition also includes the phases of product life where customs utilize and ultimately
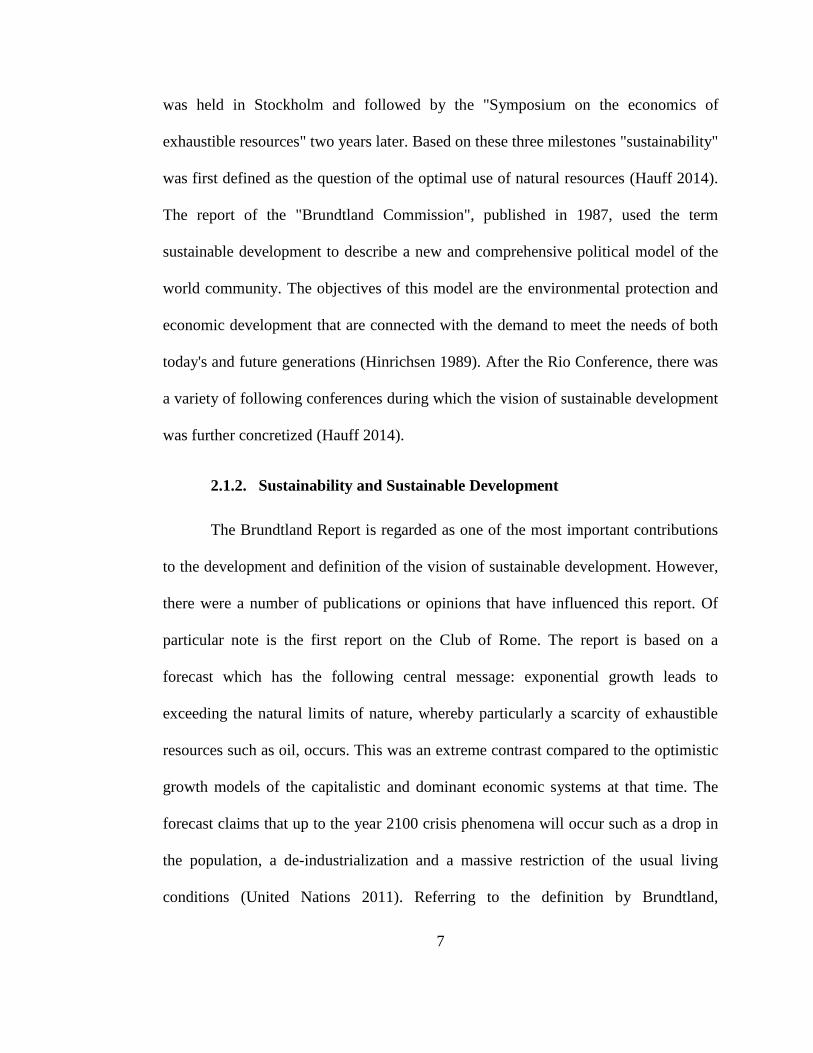
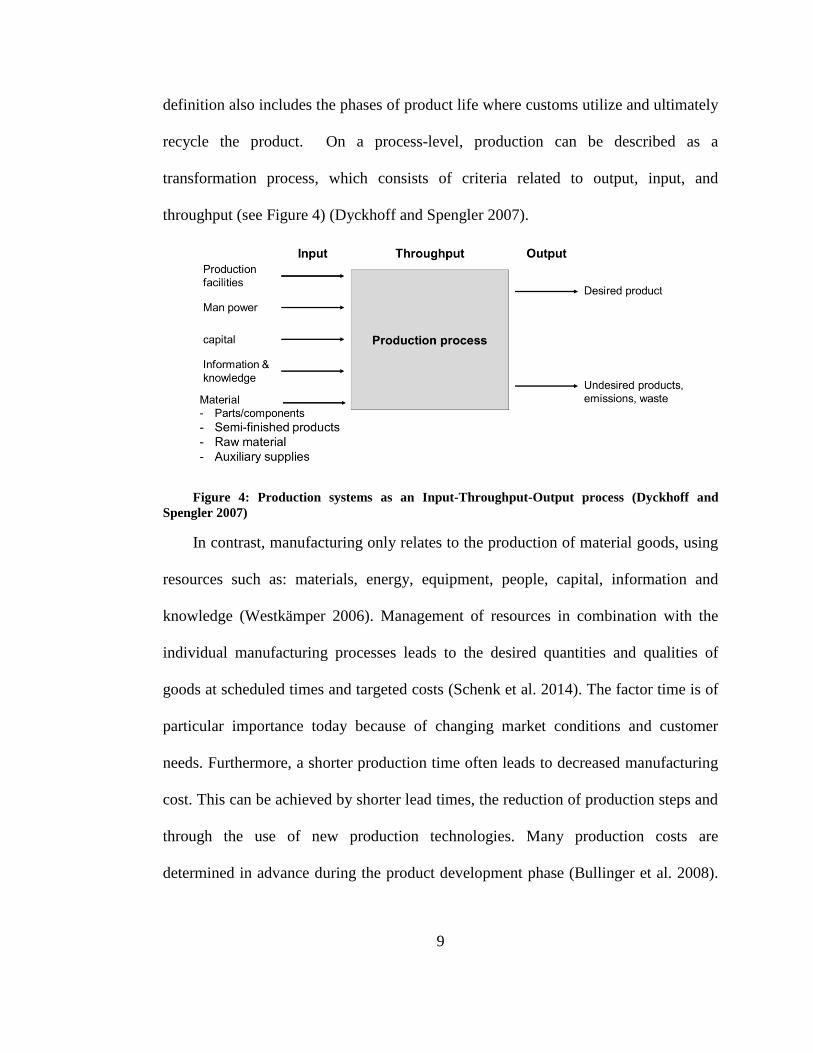
recycle the product. On a process-level, production can be described as a
transformation process, which consists of criteria related to output, input, and
throughput (see Figure 4) (Dyckhoff and Spengler 2007).
Figure 4: Production systems as an Input-Throughput-Output process (Dyckhoff and
Spengler 2007)
In contrast, manufacturing only relates to the production of material goods, using
resources such as: materials, energy, equipment, people, capital, information and
knowledge (Westkämper 2006). Management of resources in combination with the
individual manufacturing processes leads to the desired quantities and qualities of
goods at scheduled times and targeted costs (Schenk et al. 2014). The factor time is of
particular importance today because of changing market conditions and customer
needs. Furthermore, a shorter production time often leads to decreased manufacturing
cost. This can be achieved by shorter lead times, the reduction of production steps and
through the use of new production technologies. Many production costs are
determined in advance during the product development phase (Bullinger et al. 2008).
10
Therefore, even the use of the most efficient production techniques has a
comparatively low potential for reducing the cost.
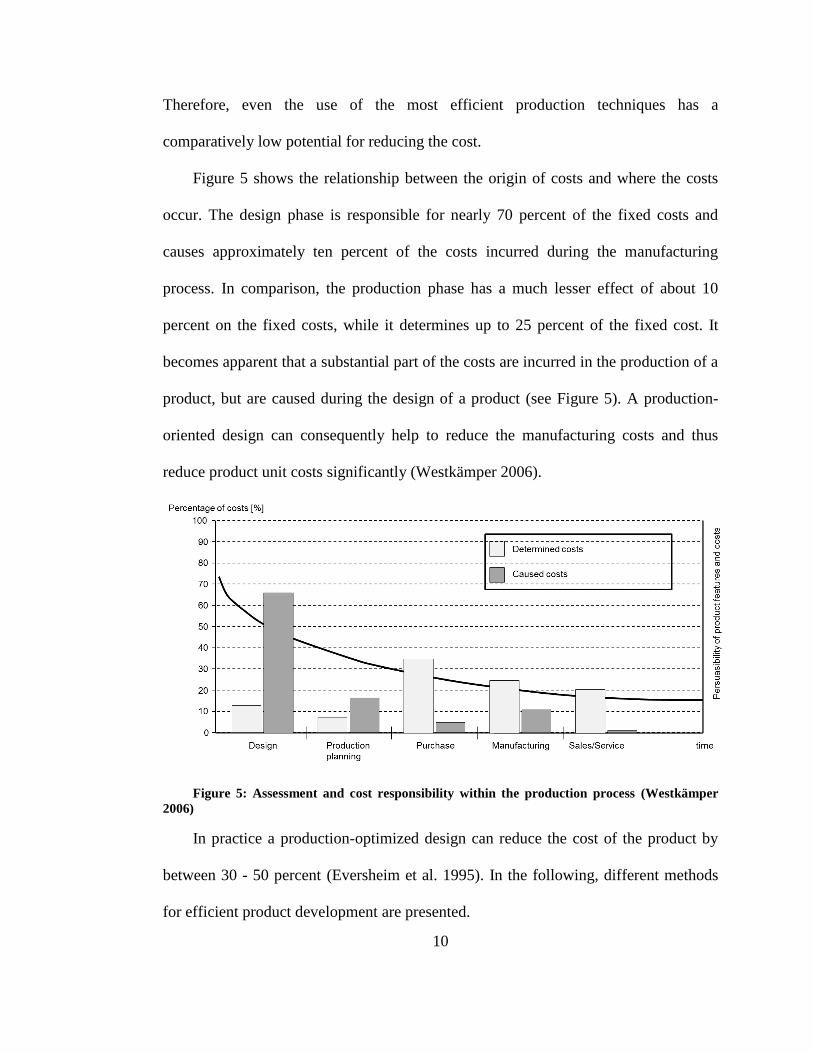
Figure 5 shows the relationship between the origin of costs and where the costs
occur. The design phase is responsible for nearly 70 percent of the fixed costs and
causes approximately ten percent of the costs incurred during the manufacturing
process. In comparison, the production phase has a much lesser effect of about 10
percent on the fixed costs, while it determines up to 25 percent of the fixed cost. It
becomes apparent that a substantial part of the costs are incurred in the production of a
product, but are caused during the design of a product (see Figure 5). A production-
oriented design can consequently help to reduce the manufacturing costs and thus
reduce product unit costs significantly (Westkämper 2006).
Figure 5: Assessment and cost responsibility within the production process (Westkämper
2006)
In practice a production-optimized design can reduce the cost of the product by
between 30 - 50 percent (Eversheim et al. 1995). In the following, different methods
for efficient product development are presented.
11
2.2.1. Simultaneous Engineering
Simultaneous Engineering is a fundamental approach for product development during
the design phase. In contrast to traditional product development, the formerly strictly
sequential processes are performed in parallel or overlapping in time for simultaneous
engineering. Hence, the duration of the entire development phase can be shortened. A
highly effective working method for this approach can be found in multi-disciplinary
and cross-divisional teams. Simultaneous Engineering, which is also known as
concurrent engineering, can help identify problems earlier, which would otherwise not
be discovered until later in the development chain or during the design of the
production process (Gaubinger et al. 2014). The late discovery of problems often
results in restrictions or high costs for troubleshooting (Eversheim et al. 1995).
For the successful implementation of Simultaneous Engineering the early
exchange of information between the parallel operating processes is essential. Since it
is often difficult to design a production process when the product design is not yet
complete, and on the other hand, product design can only be fully optimized for
production when the process is defined, both processes should be considered and
evaluated in parallel. Methods have been developed to support the product
continuously for manufacturability checks during product development (Bullinger and
Warschat 1995).
2.2.2. Design for X
The aim of production-oriented product design, is to design components so that
the subsequent production cost is as low as possible (Eversheim et al. 1995). In
12
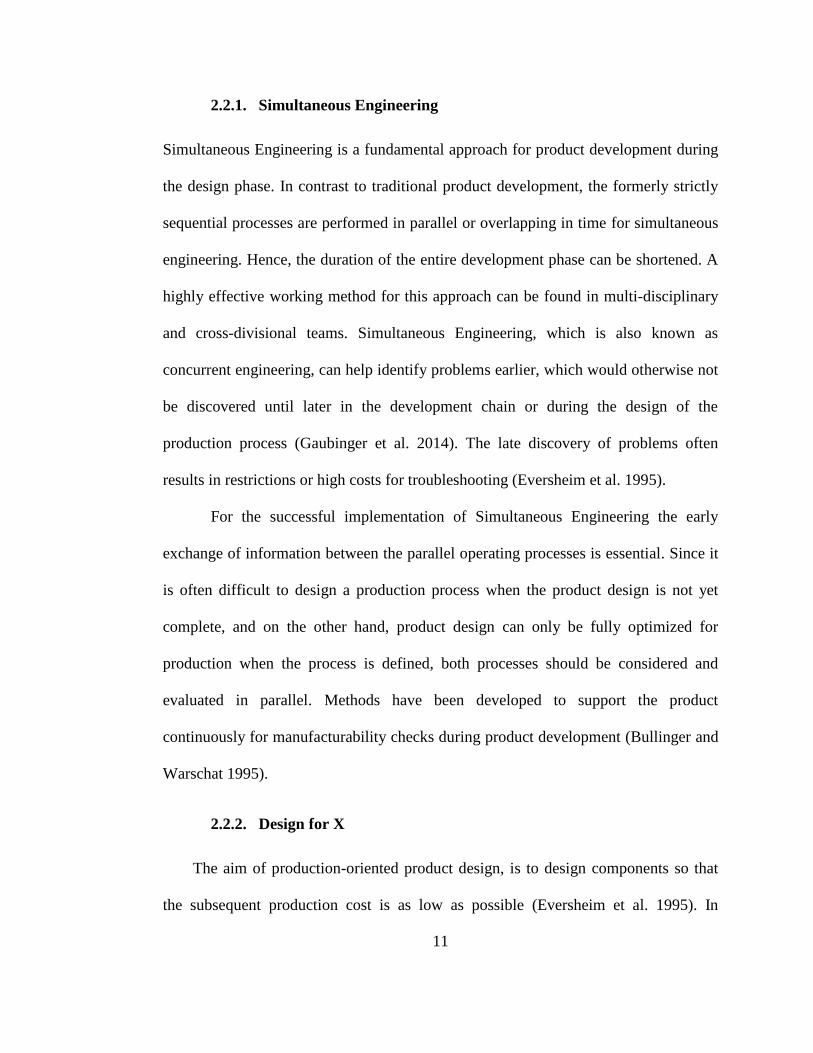
support of the product design there are a variety of methods that can be summarized
under the term Design for X (DFX) as seen in Figure 6(Huang 1996).
Figure 6: DFX- Methods (Huang 1996)
Although all DFX methods have a different scope, the approaches follow a
similar process for evaluating a product’s design and relationships with the
manufacturing process, measuring performance, and continuously improvings (Huang
1996).
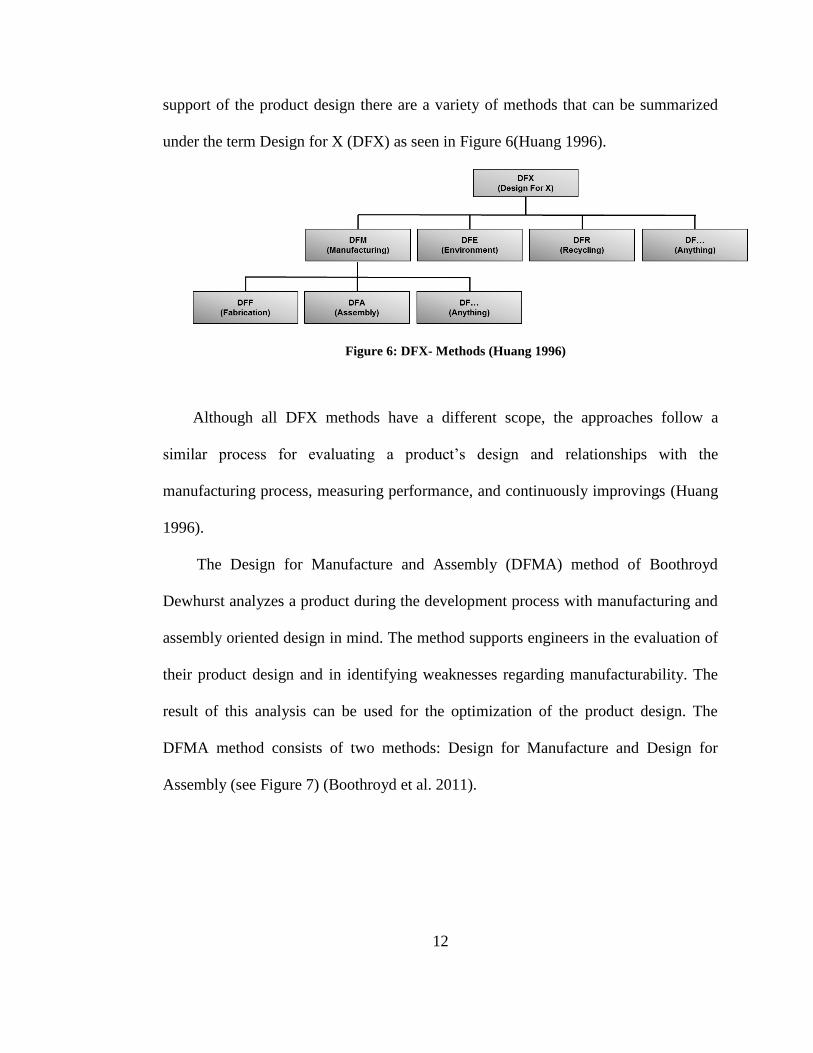
The Design for Manufacture and Assembly (DFMA) method of Boothroyd
Dewhurst analyzes a product during the development process with manufacturing and
assembly oriented design in mind. The method supports engineers in the evaluation of
their product design and in identifying weaknesses regarding manufacturability. The
result of this analysis can be used for the optimization of the product design. The
DFMA method consists of two methods: Design for Manufacture and Design for
Assembly (see Figure 7) (Boothroyd et al. 2011).
13
Figure 7: process steps of DFMA (Huang 1996)
2.2.3. Design for Assembly by Boothroyd- Dewhurst
The method Design for Assembly (DFA) was developed by Boothroyd and
Dewhurst in 1977. The objective of DFA is to make sure that the product is easy to
assemble and therefore aims to enhance the assimilability of the product by assisting
in the selection of materials and assembly processes. The method focuses on the
requirements of the assembly of the product. Therefore, the application of DFA
methods systematically tries to reduce the number of components by integrating them
into each other or changing the design of the components so that they can be adjusted,
handled and installed easily. The first step is to assess all components by asking
questions such as whether a part moves relative to other parts already assembled,
whether parts must be made of different materials, or whether it is necessary for a part
to be separate from all other parts already y assembled (Boothroyd et al. 2011).:
14
If all three questions are answered positive, the component is considered a critical
component and must remain separate. All non-critical components can be omitted or
integrated into one of the critical components. In the second step, the assembly time in
terms of efficiency as well as the difficulty of the installation steps is analyzed. For
this purpose, a separate DFA rating system is used, based on the Methods-Time
Measurement system (MTM). MTM calculates the handling and assembly time of
each component (Huang 1996), which are then summed to obtain the total estimated
assembly time 𝑇𝐸𝐴𝑇. To evaluate the efficiency of the assembly, a reference value is
used to compare the results to the minimal assembly time. This value is based on the
assumption that only critical components are present in an optimized product and that
every component can be mounted in three seconds. Finally, the design efficiency 𝐷𝐸
can be calculated as a function of the number of critical components is (𝑛𝑐𝑟𝑖𝑡) and the
actual total assembly time 𝑇𝐸𝐴𝑇 (see EQ.1) (Huang 1996).
𝐷𝐸 =3 ∗ 𝑛𝑐𝑟𝑖𝑡
𝑇𝐸𝐴𝑇 (EQ. 1)
The design efficiency can now be used as a key figure, in order to compare
different product designs. A redesign, based on the aim to reduce the number of parts,
can be analyzed by the DFA method and compared using the calculated design
efficiency with the previous design. It should be kept in mind that the design
efficiency metric, is not indicating an absolute value, and only takes into account how
the DFA optimized design compared to its predecessors (Eskilander 2001).
15
2.2.4. Design for Manufacturing
After the adjustment of the product design, the next step is to analyze the
manufacturing and associated costs of the individual components by applying DFM.
Therefore a list of questions with examples for different manufacturing processes is
included in DFM. These questions support engineers to specify and characterize the
current design. Manufacturing-oriented design (DFM) includes product design
activities that lead to minimization of production cost and time. One of the main
principles of DFM is to reduce the complexity of the product and its manufacturing
process, from which the following objectives of DFM can be derived (Boothroyd et al.
2011):
• Simplification of the manufacturing process
• Minimization the number of manufacturing processes per component
• Decrease of manufacturing steps through process integration
By changing the design of a product such as the shape, dimensions and materials
the designer can affect the applicable manufacturing processes and machine tools. The
processes that are available for manufacturing form the constraints for the design
engineers. For each of the various manufacturing processes, on the other hand, there
exists a particular design guideline to ensure easier processing (Ponn and Lindemann
2008). It helps to take manufacturability into account in the early stages of the product
development process, so that products can be produced with less effort and with the
lowest possible manufacturing costs and cycle times.
16
2.2.5. Design for Environment
Design for Environment (DfE) was originally designed to provide design engineers
with a set of guidelines that should be taken into consideration during the product
development process (Rose 2001). With the increasing public interest in sustainably
produced products and the increasing relevance for company's competitiveness, DfE
has become an integral part of the product development process for many companies
today (Huang 1996).
DfE takes all phases of the product life cycle into account. According to ISO
14040, the term "product life cycle" is the sum of all phases from the acquisition of the
raw material to recycling and disposal at the end of the products life. The term product
can be used as a synonym for all goods and services (ISO 14040:2006). Through the
comprehensive approach of DfE there exist a large number of factors that have to be
considered during sustainable production, as described in the following sections.
2.3. Cost and environmental impact factors during manufacturing
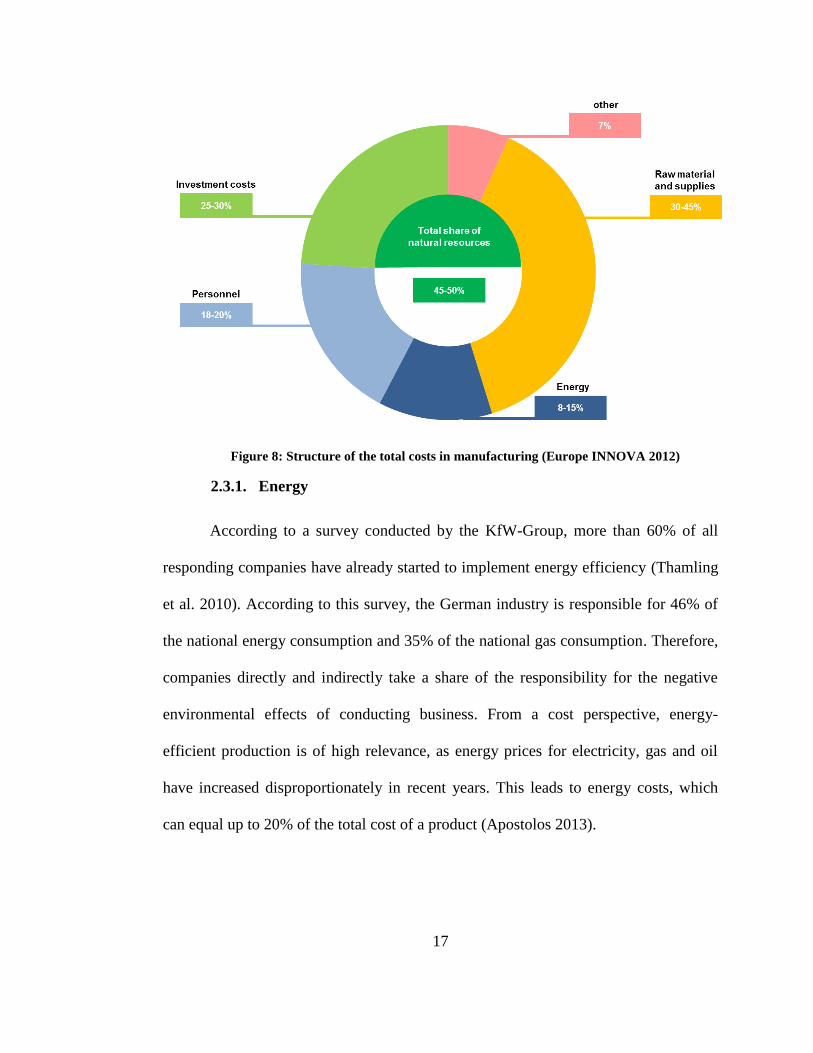
In the context of the potential depletion of abiotic resources and rising raw
material costs, material-efficient production is gaining greater importance. Today, raw
material and energy costs sum up to over 50% of the total cost of a product,
representing one of the largest contributing factors. Optimizing the use of resources
and energy is essential for a sustainable green growth of a company and being
competitive at the same time (see Figure 8) (Europe INNOVA 2012).
17
Figure 8: Structure of the total costs in manufacturing (Europe INNOVA 2012)
2.3.1. Energy
According to a survey conducted by the KfW-Group, more than 60% of all
responding companies have already started to implement energy efficiency (Thamling
et al. 2010). According to this survey, the German industry is responsible for 46% of
the national energy consumption and 35% of the national gas consumption. Therefore,
companies directly and indirectly take a share of the responsibility for the negative
environmental effects of conducting business. From a cost perspective, energy-
efficient production is of high relevance, as energy prices for electricity, gas and oil
have increased disproportionately in recent years. This leads to energy costs, which
can equal up to 20% of the total cost of a product (Apostolos 2013).
18
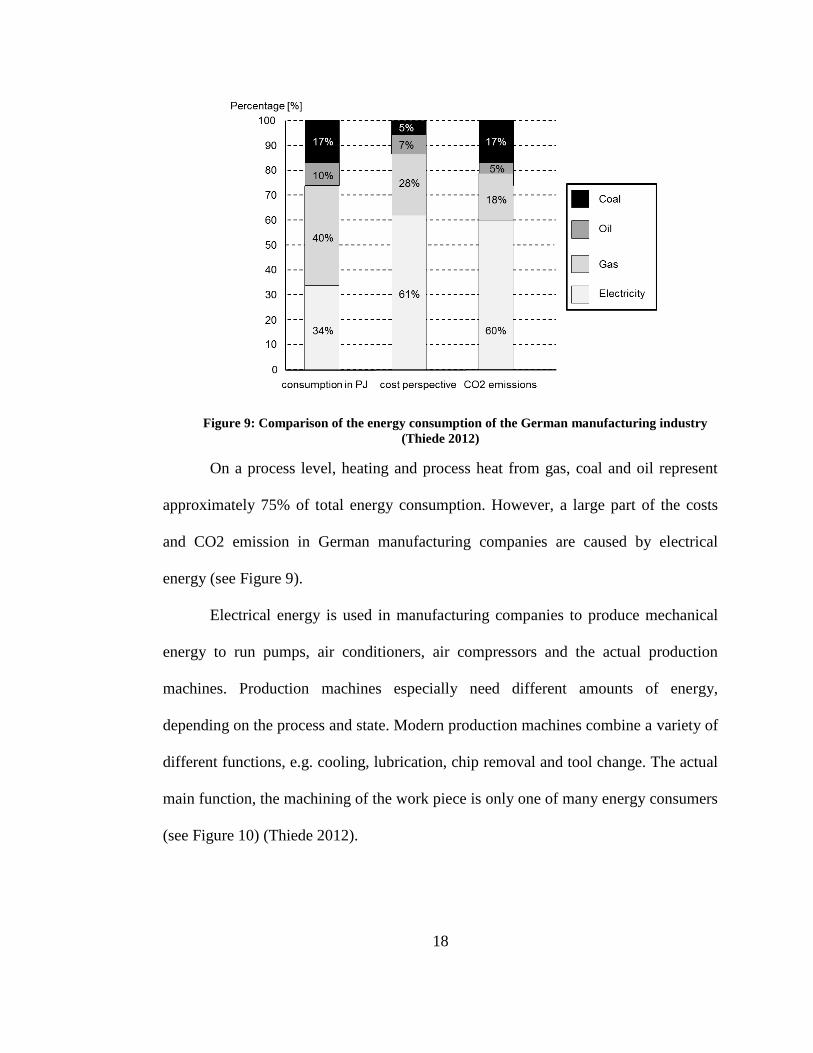
Figure 9: Comparison of the energy consumption of the German manufacturing industry
(Thiede 2012)
On a process level, heating and process heat from gas, coal and oil represent
approximately 75% of total energy consumption. However, a large part of the costs
and CO2 emission in German manufacturing companies are caused by electrical
energy (see Figure 9).
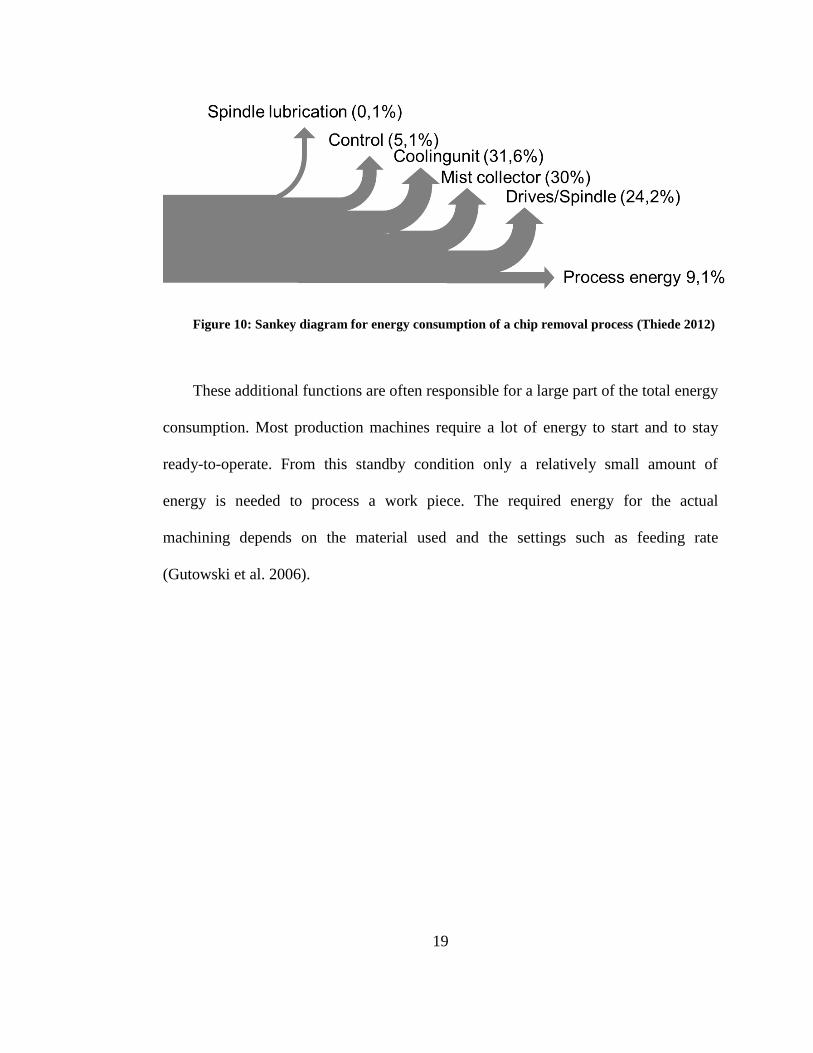
Electrical energy is used in manufacturing companies to produce mechanical
energy to run pumps, air conditioners, air compressors and the actual production
machines. Production machines especially need different amounts of energy,
depending on the process and state. Modern production machines combine a variety of
different functions, e.g. cooling, lubrication, chip removal and tool change. The actual
main function, the machining of the work piece is only one of many energy consumers
(see Figure 10) (Thiede 2012).
19
Figure 10: Sankey diagram for energy consumption of a chip removal process (Thiede 2012)
These additional functions are often responsible for a large part of the total energy
consumption. Most production machines require a lot of energy to start and to stay
ready-to-operate. From this standby condition only a relatively small amount of
energy is needed to process a work piece. The required energy for the actual
machining depends on the material used and the settings such as feeding rate
(Gutowski et al. 2006).
20
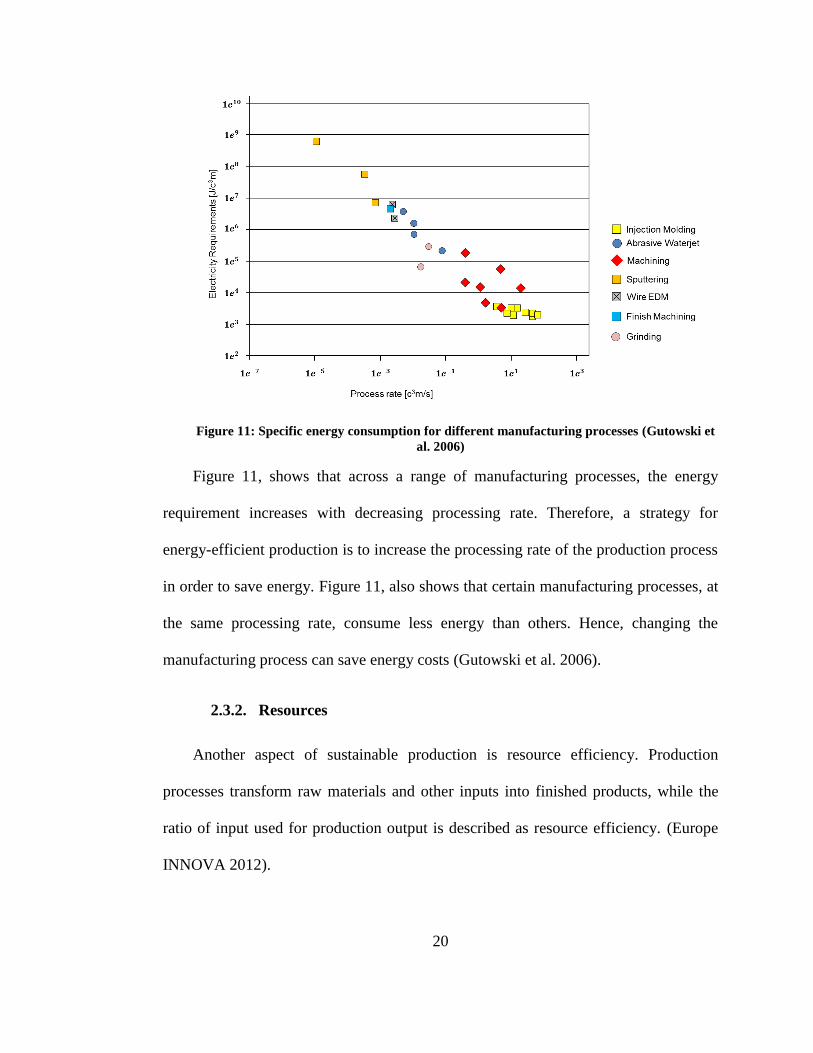
Figure 11: Specific energy consumption for different manufacturing processes (Gutowski et
al. 2006)
Figure 11, shows that across a range of manufacturing processes, the energy
requirement increases with decreasing processing rate. Therefore, a strategy for
energy-efficient production is to increase the processing rate of the production process
in order to save energy. Figure 11, also shows that certain manufacturing processes, at
the same processing rate, consume less energy than others. Hence, changing the
manufacturing process can save energy costs (Gutowski et al. 2006).
2.3.2. Resources
Another aspect of sustainable production is resource efficiency. Production
processes transform raw materials and other inputs into finished products, while the
ratio of input used for production output is described as resource efficiency. (Europe
INNOVA 2012).
21
Increasing resource efficiency leads automatically to a reduction of materials
demand and also lowers the requirement for production of new material. By reducing
the production of new material, the extraction of natural resources, energy demand,
emissions and other threats to the environment can be decreased (Allwood et al. 2013).
The four materials which have the most harmful emissions are steel, plastic, paper and
aluminum, which are the basis for almost every modern product (Allwood et al. 2010).
Improving resource efficiency can often be achieved by relatively small changes in the
manufacturing process, such as reduction of cuttings and rejects or improved recycling
of production wastes (Europe INNOVA 2012).
2.3.3. Consumables
The main consumables used in most machining processes during operating time
are: cuttings tools, cutting fluid and lubricant oil.
Cutting tools
Cutting tools and inserts wear out during machine operations and must be
replaced. Otherwise they can cause increasing energy demand and a decrease of
production quality. In the worst case it causes damage to the product or to the machine
itself. Often tools can also be regraded and used again. While cutting tools compared
to other consumables are relatively expensive, they are often amortized over various
products manufactured (Dahmus and Gutowski 2004).
Cutting fluids and lubricant oil
During manufacturing, especially machining, cutting fluid and lubricant oil are
one of the main sources of environmental impact. In order to pursue sustainable
22
manufacturing of products, it is an important step to reduce the usage of these fluids or
to use environmental friendly alternatives (Tan et al. 2002). However, cutting fluids
are often necessary to ensure the quality of manufacturing processes, since they
improve the cutting performance with cooling and/or lubrication effects. For low
cutting speeds, lubrication is more critical whereas the cooling effect becomes more
important at higher cutting speeds due to more heat production. A large variety of
different types of cutting fluids are available. To classify them, different standards can
be used (Grzesik 2008). A common norm is the German DIN 51385 that divides
cutting fluids into non-water miscible fluids, strait or neat oils which all are supplied
as premixed products. Water miscible products, on the other hand, are often supplied
as concentrates and must be diluted before application (DIN 51385:2013-12). Cutting
fluids can also be categorized into the following four categories (Boothroyd and
Knight 2006):
Straight or neat oil
Mineral-soluble oils
Semi-synthetic fluids
Synthetic fluids (mineral oil free)
According to a survey conducted by the US manufacturing industry, around 80%
of cutting fluids used are water-based emulsions of oil or synthetic fluids (Grzesik
2008). Cutting fluid is used in almost every industry to enable high speed, high
efficiency, high accuracy and long tool life. However, there are also significant costs
associated with cutting fluids for purchase, maintenance and disposal (Stephenson and
Agapiou 2006). To keep the performance on a constant level and prolong its work life,
23
cutting fluids have to be maintained properly by testing pH-levels and determining the
oil concentration values regularly, since part of the fluid vaporizes during the use
phase and are released into the atmosphere. Cutting fluids are related to significant
environmental and health impacts such as dermal initiation, air, water and soil
contamination. Therefore, there are strict national recommendations of permissible
levels (Boothroyd and Knight 2006).
Vegetable based cutting fluids
Besides the mineral oil-based cutting fluid, recent studies investigate the utilization of
vegetable oil-based metalworking fluids including successful applications for
machining. Ferrous metals, revealing the possibility of an environmentally friendly
option with similar performances (Lawal et al. 2012). Vegetable based cutting fluids
contain fatty acids extracted from a variety of vegetables such as: soy beans,
sunflowers, rapeseed, olives or coconut (Shashidhara and Jayaram 2010). According
to Alves and Oliveira, it was found that those vegetable oils contribute over ten times
less CO2 than mineral oil based cutting fluids. Per kg of mineral oil an equivalent of
50kg CO2 is released which can be compared to coconut oil which only contributes
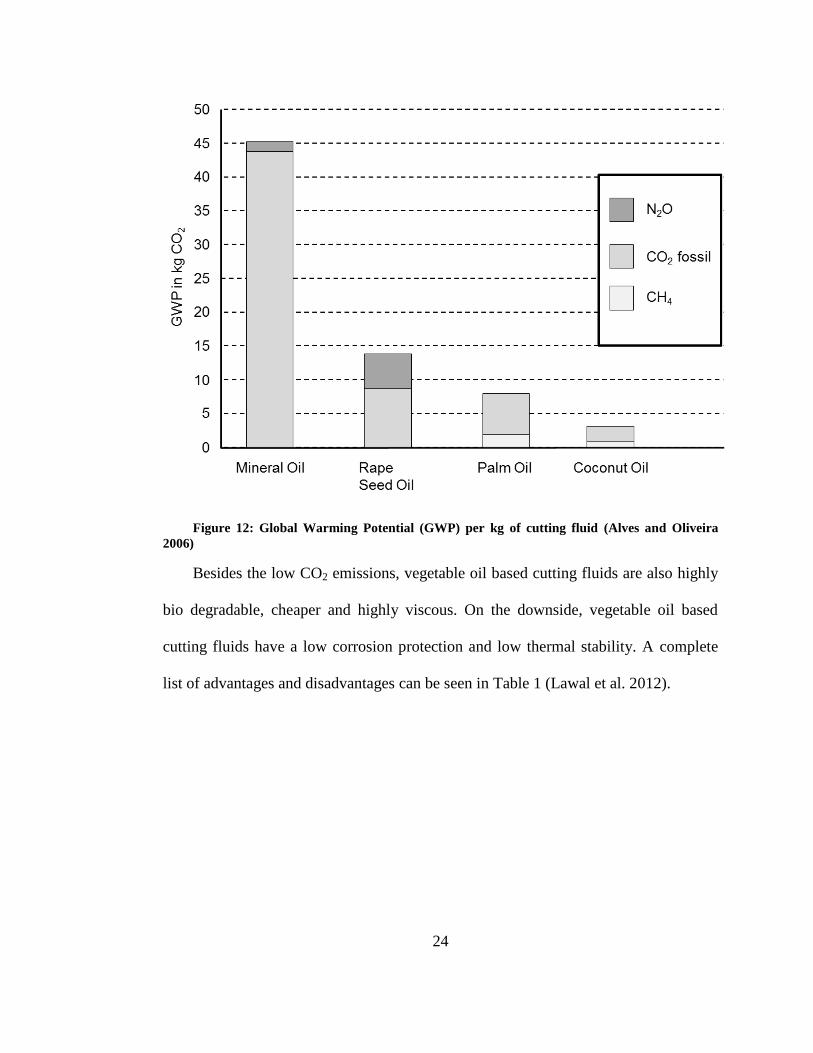
about 6kg of CO2 equivalent emissions (see Figure 12) (Alves and Oliveira 2006).
24
Figure 12: Global Warming Potential (GWP) per kg of cutting fluid (Alves and Oliveira
2006)
Besides the low CO2 emissions, vegetable oil based cutting fluids are also highly
bio degradable, cheaper and highly viscous. On the downside, vegetable oil based
cutting fluids have a low corrosion protection and low thermal stability. A complete
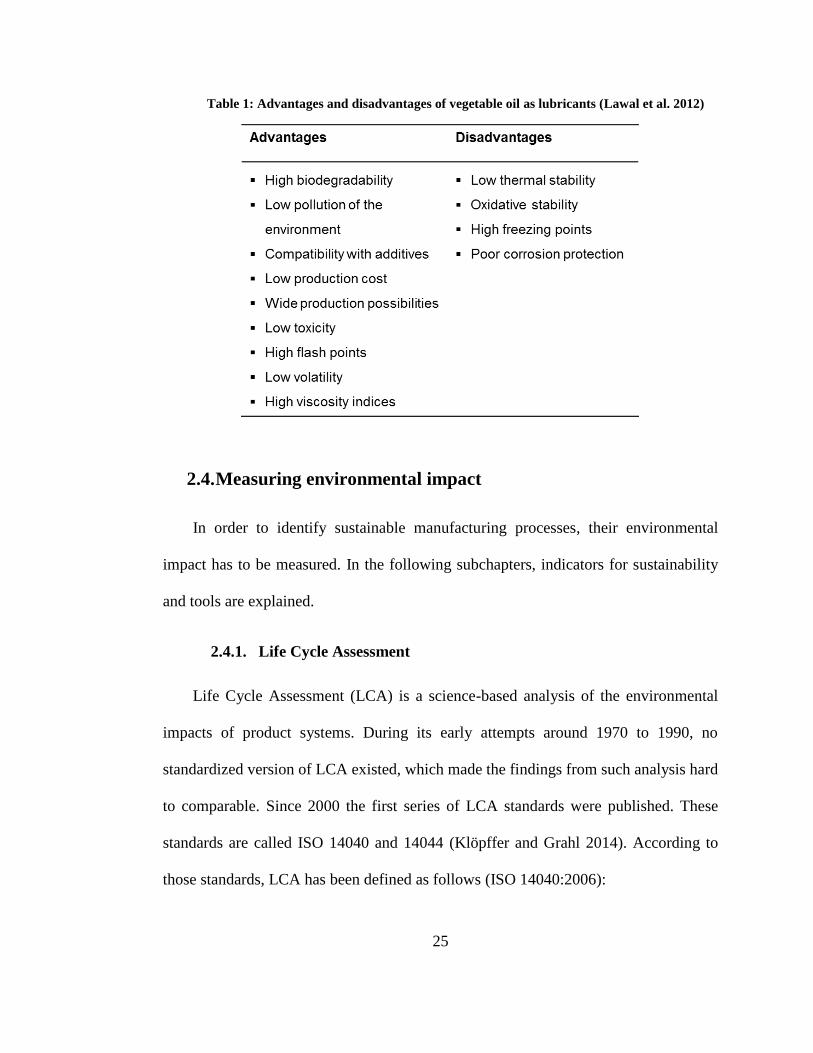
list of advantages and disadvantages can be seen in Table 1 (Lawal et al. 2012).
25
Table 1: Advantages and disadvantages of vegetable oil as lubricants (Lawal et al. 2012)
2.4. Measuring environmental impact
In order to identify sustainable manufacturing processes, their environmental
impact has to be measured. In the following subchapters, indicators for sustainability
and tools are explained.
2.4.1. Life Cycle Assessment
Life Cycle Assessment (LCA) is a science-based analysis of the environmental
impacts of product systems. During its early attempts around 1970 to 1990, no
standardized version of LCA existed, which made the findings from such analysis hard
to comparable. Since 2000 the first series of LCA standards were published. These
standards are called ISO 14040 and 14044 (Klöpffer and Grahl 2014). According to
those standards, LCA has been defined as follows (ISO 14040:2006):
26
“LCA studies the environmental aspects and potential impacts throughout a
product’s life from raw material acquisition through production, use and disposal. The
general categories of environmental impacts needing consideration include resource
use, human health and ecological consequences."
This definition excludes the pillars of society and economy and focuses on the
ecological influence of production systems. Since the first standards were established,
the method was criticized as being too complex regarding the demanding set of
requirements which led to a trend of simplifying LCA to make it more flexible and
easier to use (Hesselbach and Herrmann 2011).
Those simplifications of LCA are represented by simplified/streamlined Life
Cycle Assessment (SLCA) which can be used as a first step of a full LCA or even as a
stand-alone study. However, SLCA is not recommended for use in official
publications but can be sufficient for internal assessments (Klöpffer 2012).
General structure of LCA
A life cycle assessment includes the compilation of all significant input and
output flows and an assessment of the potential environmental impacts of a product.
For this purpose, the entire life cycle beginning with the supply of raw materials,
production, use, and disposal or recycling of the product, has to be taken into account.
Every phase is analyzed for its environmental impact by energy and material use.
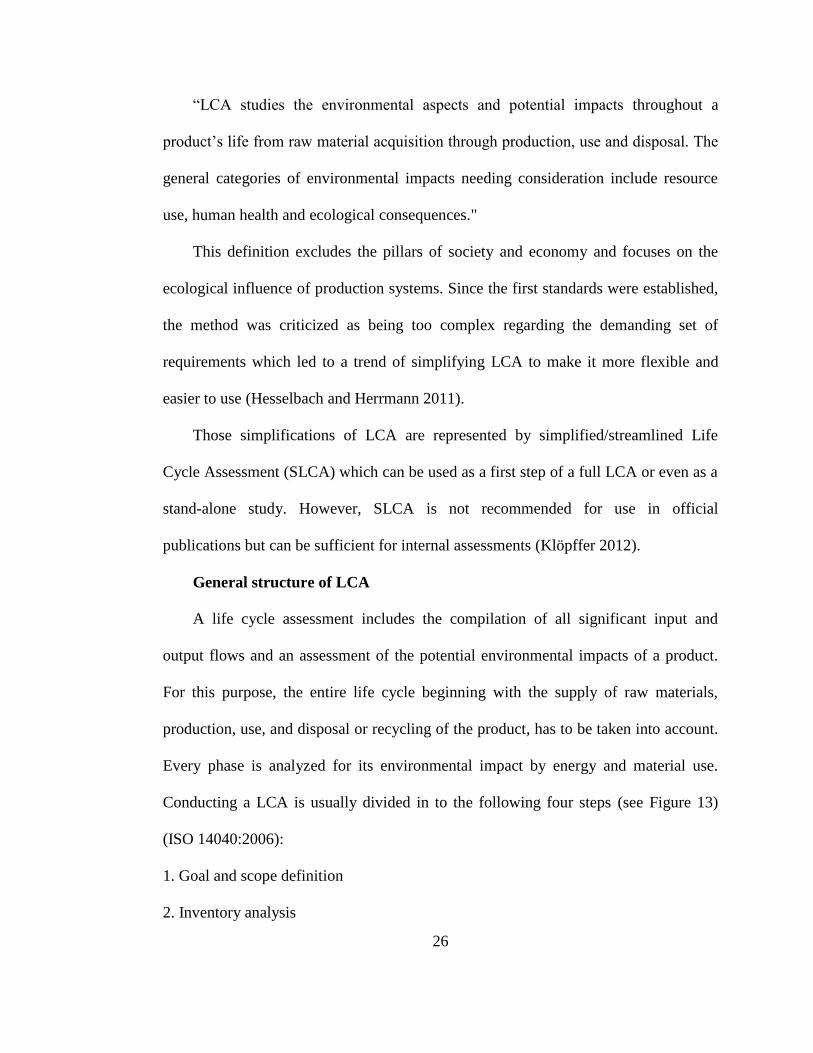
Conducting a LCA is usually divided in to the following four steps (see Figure 13)
(ISO 14040:2006):
1. Goal and scope definition
2. Inventory analysis
27
3. Impact assessment
4. Interpretation
These steps are iterative. When the results are planned to be published, an independent
committee has to conduct a critical review first (Guinée 2006).
Figure 13: General steps of Life Cycle Assessment (Jensen et al. 2006)
The first step in the goal and scope definition phase is to define and explain the
objectives of the study including its intended application and the audience. The scope
definition issues the main characteristics such as the temporal, geographical and
technology coverage of the LCA study and determines the functional unit that will be
analyzed (Herrmann 2010).
28
For example, environmental impacts of a train cannot easily be compared with
impacts of a car. A suitable functional unit is 'driving 100 kilometers in 1 hour with 1
person'. Another example is the functional unit of paint. It is necessary to compare the
function 'covering 10 square meters of a wall without wallpaper' instead of '1 liter of
paint' because the paints might have different mileage. The functional unit is often
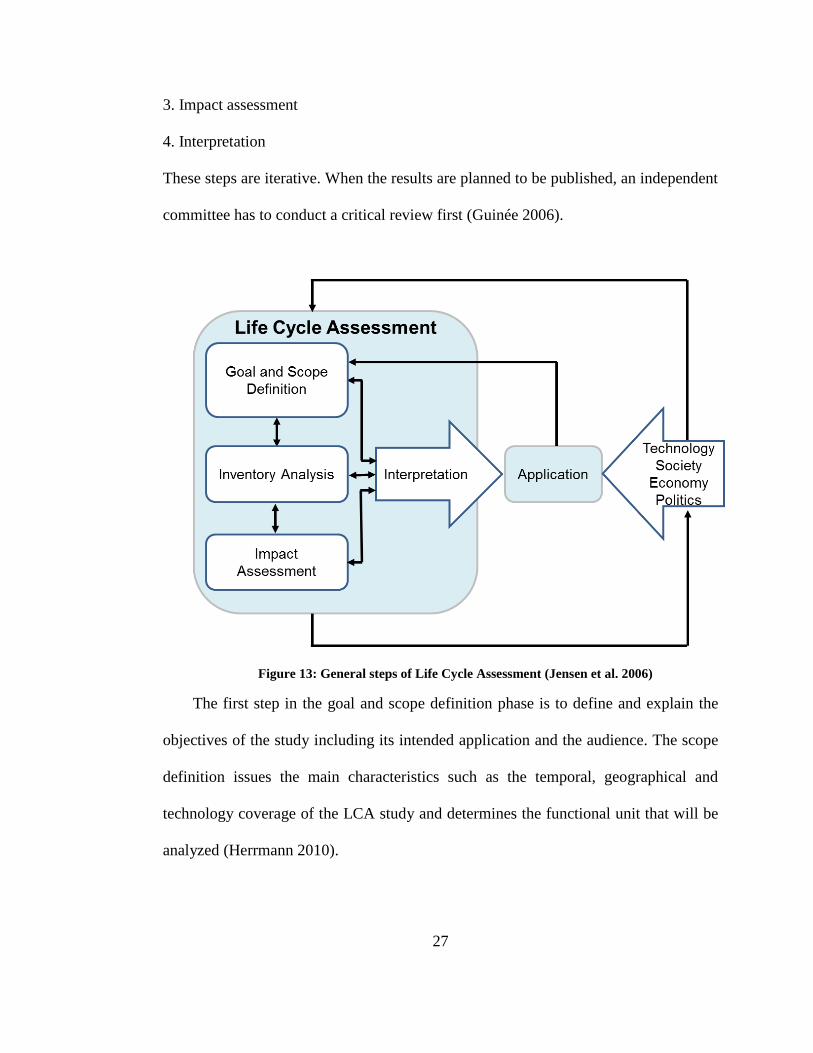
drawn as a diagram of the unit’s processes, which clarifies the system boundaries and
the interdependence within the production system. An example is given in Figure 14.
Figure 14: Simplified example of a PVC window system boundary (Klöpffer and Grahl
2014)
A particular problem is the omission of whole life cycle stages when products
with different production processes are compared since it may cause asymmetry of the
systems. Depending on the production process the major environmental impact of a
product might happen at a different life cycle stage which lets a product appear to be
29
more sustainable when this stage is not included in the assessment. Therefore, it has to
be verified that an omission does not influence the symmetry of the systems.
Whenever the goal of the LCA is to compare different products, it is common to
exclude life cycle stages that are identical (Klöpffer and Grahl 2014).
The first step of the LCA also includes the problem of availability and quality of
data needed to perform a comprehensive analysis. It has to be decided for which
processes require collection of primary data or whether existing data can be used and
the level of detail for the study. In this context the approach of simplified LCAs is
often discussed, since they require less data and are therefore less time intensive and
easier to conduct (Christiansen 1997).
Inventory Analysis
The inventory analysis is the result of material flow or mass flux analysis. It
includes the collection of data and the calculation method for quantifying relevant
input and output flows of a product system within the specified scope definition. The
inventory analysis serves as a basis for impact assessment and should be performed
transparent and on a uniform level of detail for each process (Klöpffer 2012). To
visualize the production process flow charts can be used. Flow charts of production
processes often have different branches for byproducts or waste which should be also
taken into account to preserve the symmetry of the system (see Figure 15) (Eversheim
2013).
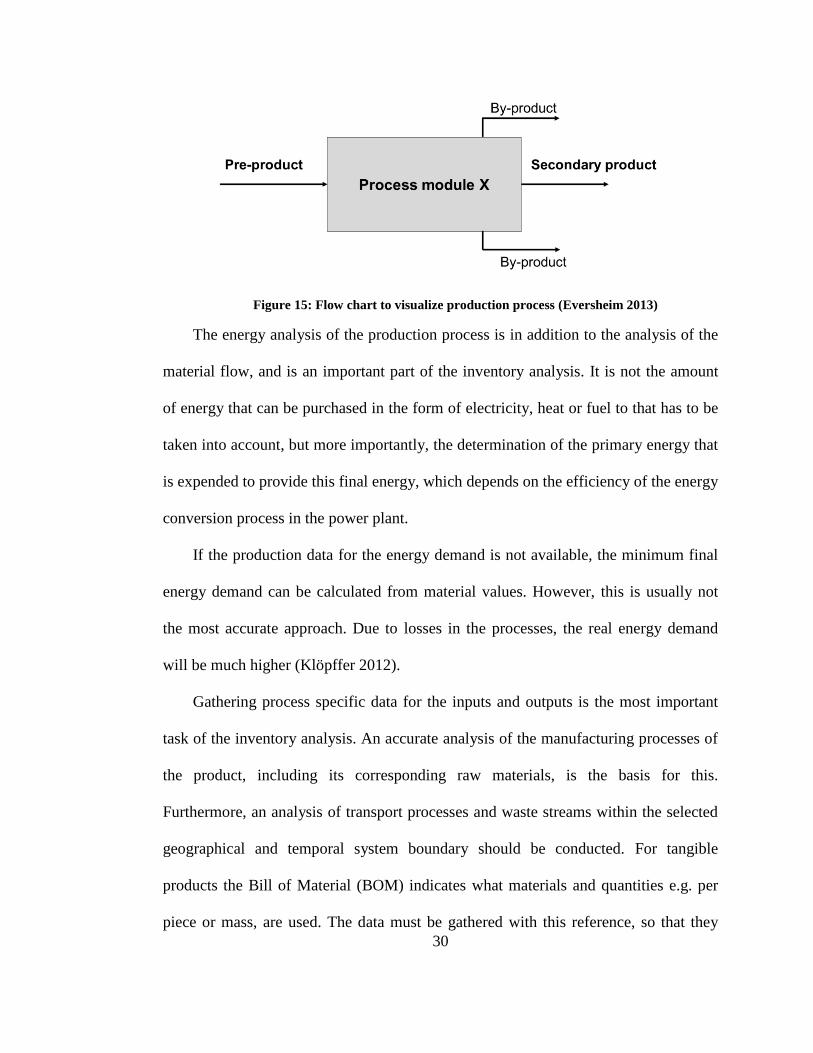
30
Figure 15: Flow chart to visualize production process (Eversheim 2013)
The energy analysis of the production process is in addition to the analysis of the
material flow, and is an important part of the inventory analysis. It is not the amount
of energy that can be purchased in the form of electricity, heat or fuel to that has to be
taken into account, but more importantly, the determination of the primary energy that
is expended to provide this final energy, which depends on the efficiency of the energy
conversion process in the power plant.
If the production data for the energy demand is not available, the minimum final
energy demand can be calculated from material values. However, this is usually not
the most accurate approach. Due to losses in the processes, the real energy demand
will be much higher (Klöpffer 2012).
Gathering process specific data for the inputs and outputs is the most important
task of the inventory analysis. An accurate analysis of the manufacturing processes of
the product, including its corresponding raw materials, is the basis for this.
Furthermore, an analysis of transport processes and waste streams within the selected
geographical and temporal system boundary should be conducted. For tangible
products the Bill of Material (BOM) indicates what materials and quantities e.g. per
piece or mass, are used. The data must be gathered with this reference, so that they
31
later can be converted easily on the reference flow according to the functional unit.
When there are datasets as generic data from a reliable database for materials that are
contained in the product, this data can be used alternatively (Simonen 2014).
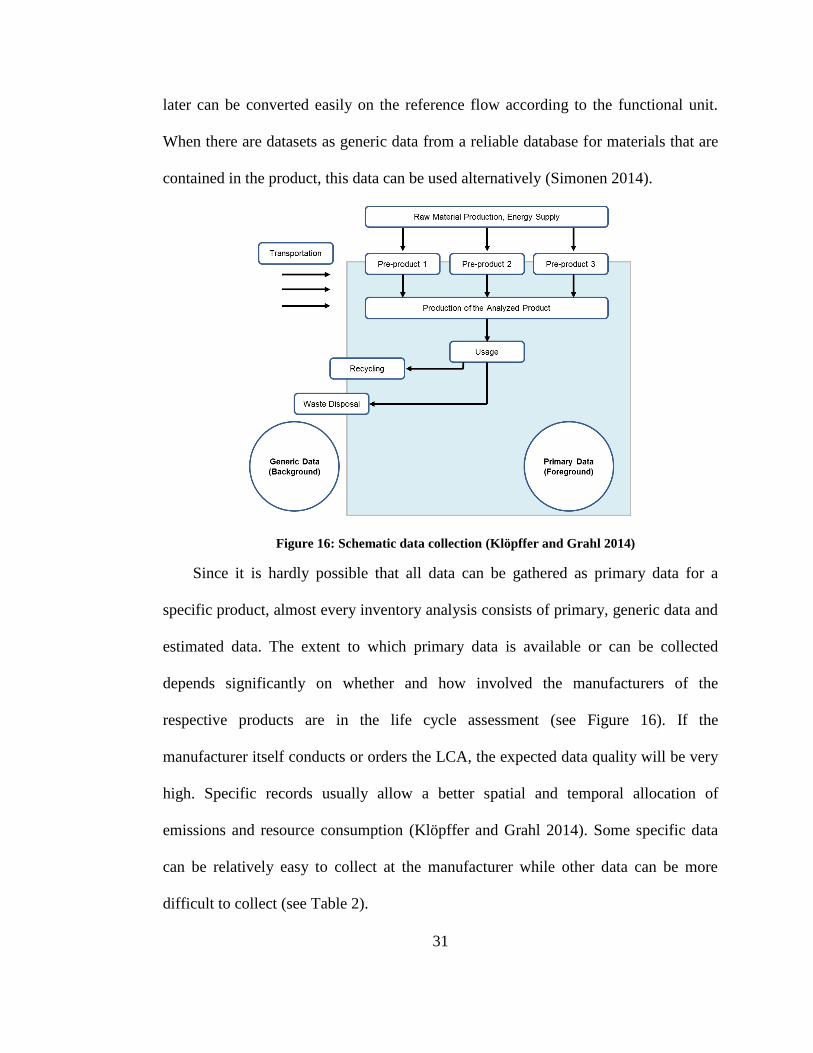
Figure 16: Schematic data collection (Klöpffer and Grahl 2014)
Since it is hardly possible that all data can be gathered as primary data for a
specific product, almost every inventory analysis consists of primary, generic data and
estimated data. The extent to which primary data is available or can be collected
depends significantly on whether and how involved the manufacturers of the
respective products are in the life cycle assessment (see Figure 16). If the
manufacturer itself conducts or orders the LCA, the expected data quality will be very
high. Specific records usually allow a better spatial and temporal allocation of
emissions and resource consumption (Klöpffer and Grahl 2014). Some specific data
can be relatively easy to collect at the manufacturer while other data can be more
difficult to collect (see Table 2).
32
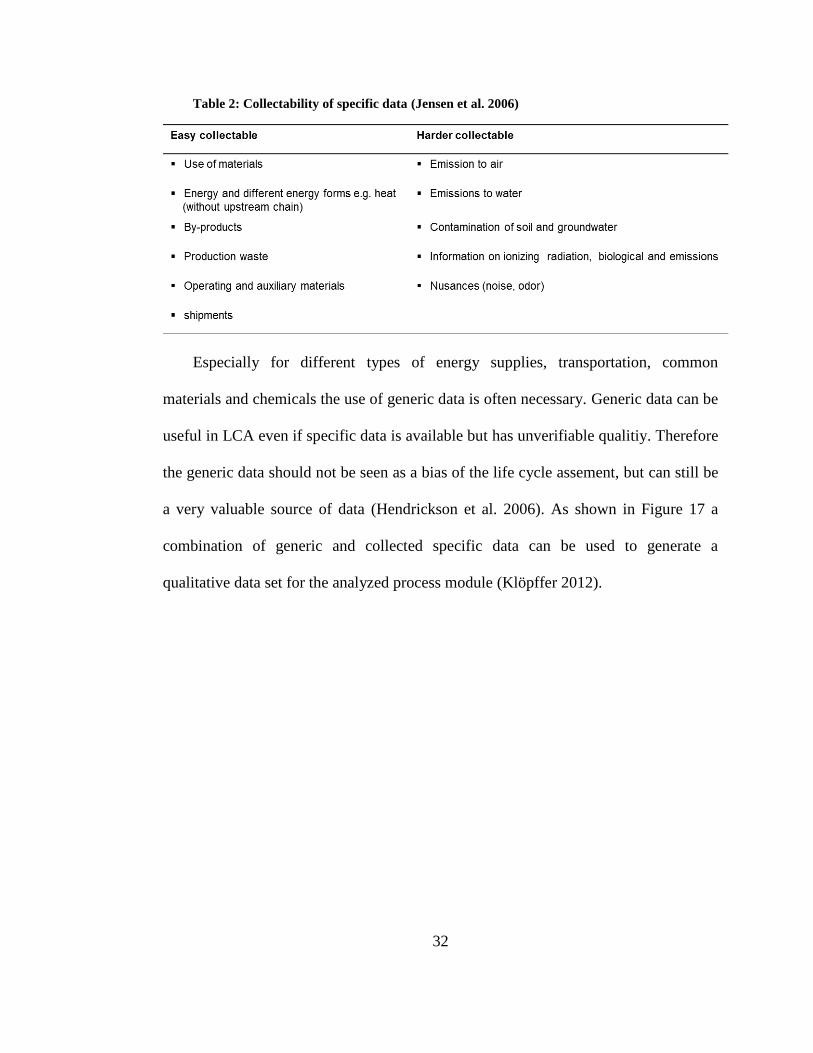
Table 2: Collectability of specific data (Jensen et al. 2006)
Especially for different types of energy supplies, transportation, common
materials and chemicals the use of generic data is often necessary. Generic data can be
useful in LCA even if specific data is available but has unverifiable qualitiy. Therefore
the generic data should not be seen as a bias of the life cycle assement, but can still be
a very valuable source of data (Hendrickson et al. 2006). As shown in Figure 17 a
combination of generic and collected specific data can be used to generate a
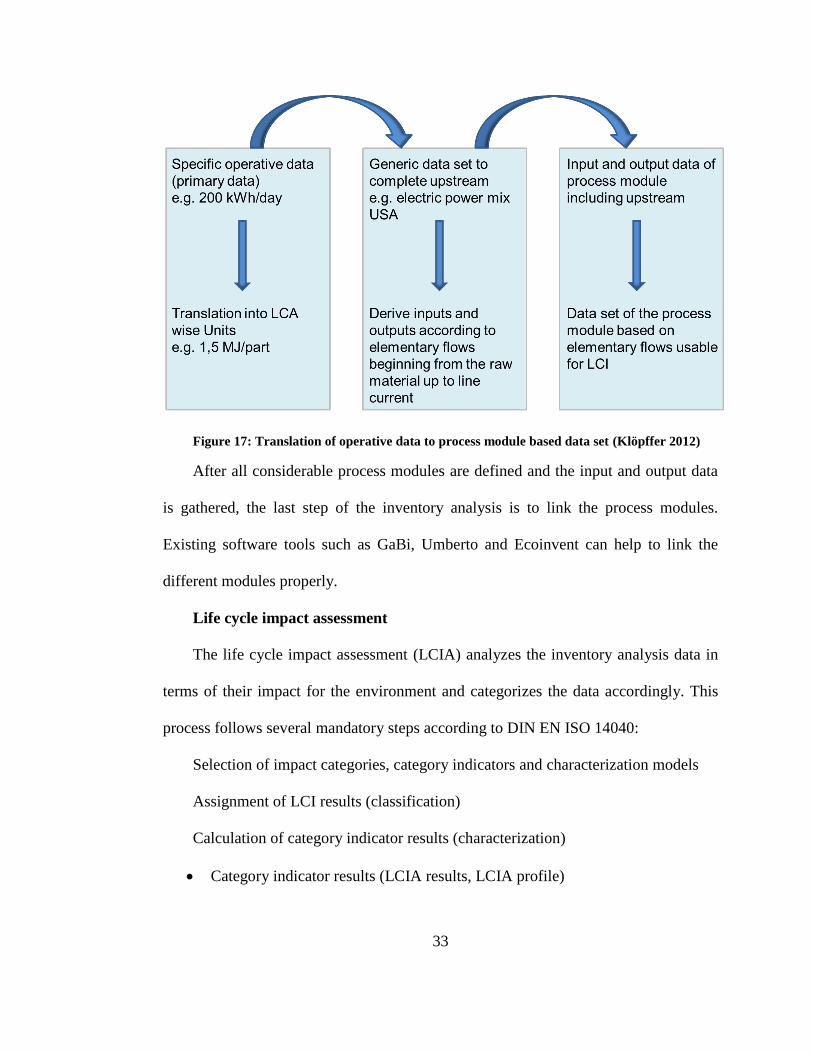
qualitative data set for the analyzed process module (Klöpffer 2012).
33
Figure 17: Translation of operative data to process module based data set (Klöpffer 2012)
After all considerable process modules are defined and the input and output data
is gathered, the last step of the inventory analysis is to link the process modules.
Existing software tools such as GaBi, Umberto and Ecoinvent can help to link the
different modules properly.
Life cycle impact assessment
The life cycle impact assessment (LCIA) analyzes the inventory analysis data in
terms of their impact for the environment and categorizes the data accordingly. This
process follows several mandatory steps according to DIN EN ISO 14040:
Selection of impact categories, category indicators and characterization models
Assignment of LCI results (classification)
Calculation of category indicator results (characterization)
Category indicator results (LCIA results, LCIA profile)
34
During the classification, the data is assigned to the impact categories. Every
other material which accounts for this category is converted by fixed factors into
equivalents of that indicator. For example, nitrous oxide is multiplied by 25 to receive
a CO2 equivalent. All equivalents are summed to reach a final result for the impact
category. In some cases, a parameter can be assigned to several impact categories e.g.
Methane (CH4) emissions. Methane contributes to both the Global warming potential
(GWP) as well as to summer smog. In addition to the direct effects, indirect effects are
determined such as human health hazard by environmental damage (ISO 14040:2006).
In the following step, the characterization of the environmental impact, the results
are quantified. There are two assessment approaches. The first is the midpoint
approach which includes direct impact categories like the change of tropospheric
ozone concentration under the name ozone depletion. In contrast to that, the endpoint
approach describes concrete damage categories. For example, the endpoint indicator
of ozone depletion is loss of life years. On the one hand, since the knowledge of ozone
depletion is getting more uncertain in the determination of the exact consequences on
human health, the midpoint approach includes more facts and fewer assumptions. On
the other hand, the endpoint approach is more demonstrative in presenting concrete
effects instead of reference indicators only (Curran 2012).
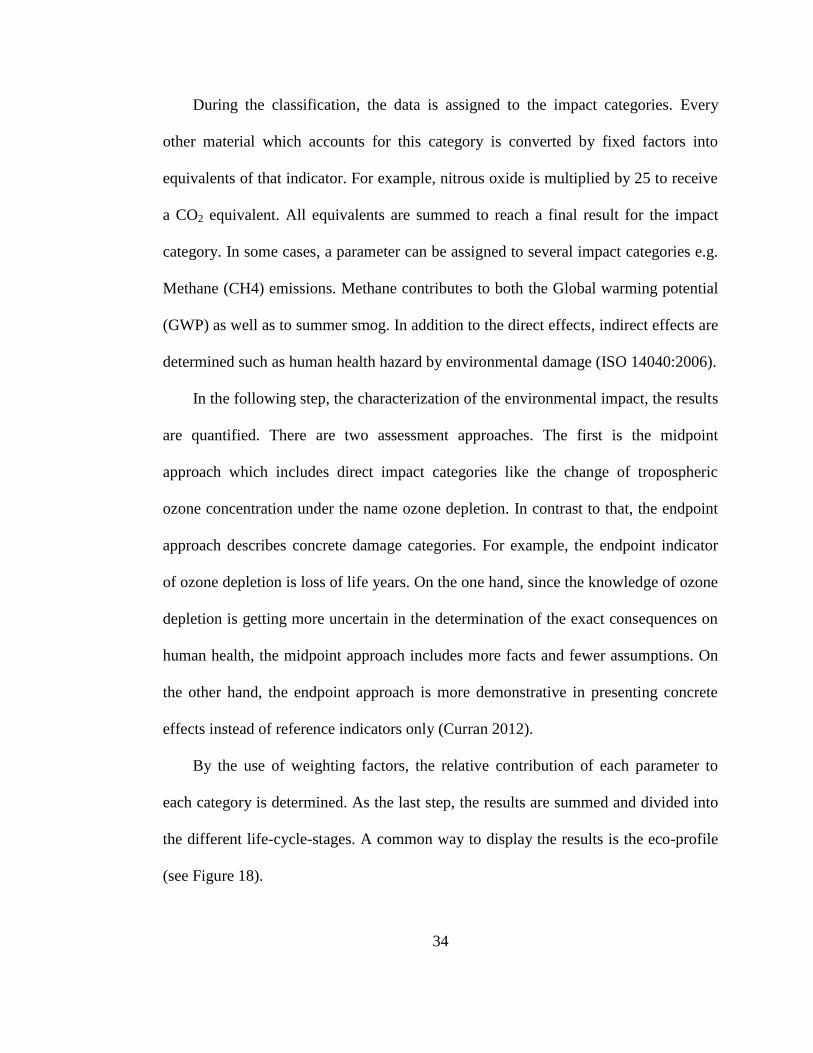
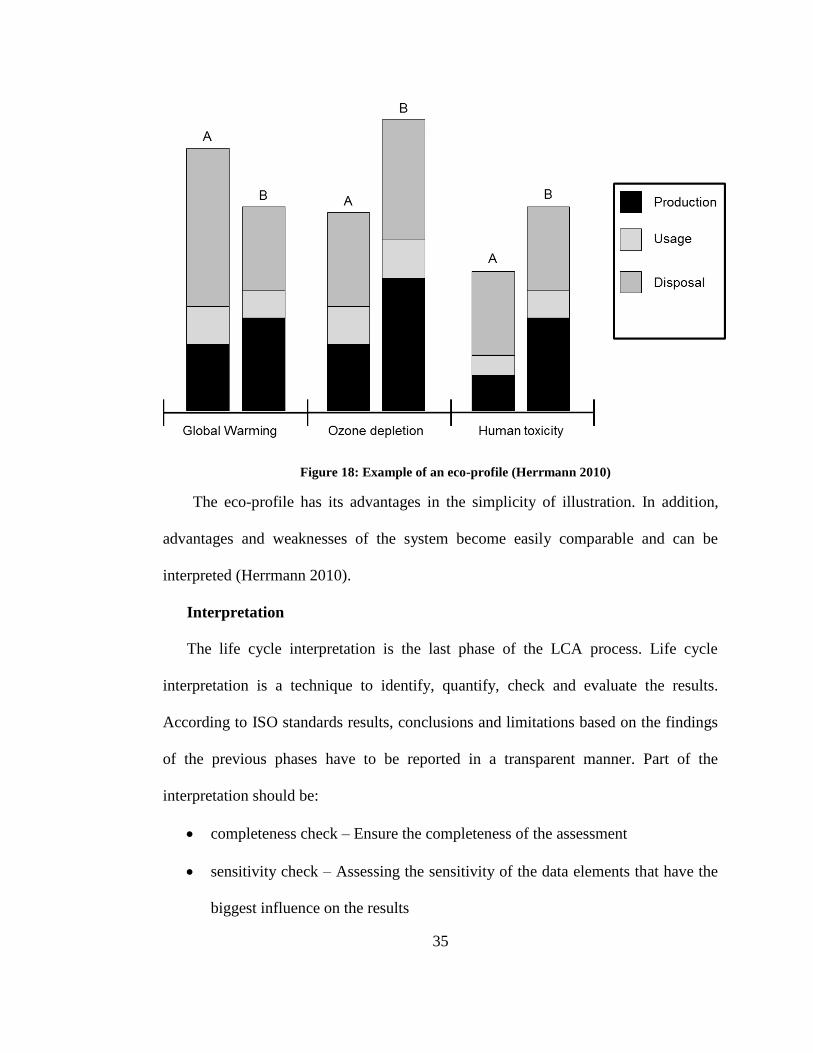
By the use of weighting factors, the relative contribution of each parameter to
each category is determined. As the last step, the results are summed and divided into
the different life-cycle-stages. A common way to display the results is the eco-profile
(see Figure 18).
35
Figure 18: Example of an eco-profile (Herrmann 2010)
The eco-profile has its advantages in the simplicity of illustration. In addition,
advantages and weaknesses of the system become easily comparable and can be
interpreted (Herrmann 2010).
Interpretation
The life cycle interpretation is the last phase of the LCA process. Life cycle
interpretation is a technique to identify, quantify, check and evaluate the results.
According to ISO standards results, conclusions and limitations based on the findings
of the previous phases have to be reported in a transparent manner. Part of the
interpretation should be:
completeness check – Ensure the completeness of the assessment
sensitivity check – Assessing the sensitivity of the data elements that have the
biggest influence on the results
36
consistency check – evaluate the consistency of the analysis including system
boundaries, data collection and impact categories for each alternative
These steps ensure that the LCA was conducted correctly according to ISO standards
and that the results are not biased. The results can provide information that can be
used by decision-makers to get a better understanding of the environmental and health
impacts associated with each alternative. This information includes the environmental
pros and cons of each alternative, but it does not include any information about
technical feasibility, cost or social acceptance (Klöpffer and Grahl 2014).
Simplified LCA
A major problem of LCA is the required time and cost to perform this study. In
addition, data availability is often critical and therefore one of the most important
criterions for the decision regarding whether a full LCA can be conducted or not.
Alternatives to the full LCA are the Simplified (Streamlined) or Screening LCA,
which are less complex and require less detailed data sets. Both versions, which are in
practice often not clearly separated, work primarily with easy available or estimated
data and also allows to the omission of life cycle phases. Although the results can be
less accurate, both versions can be useful whenever a fast and simple analysis is
sufficient. This is often the case when LCA is needed to enhance decision-making
within internal processes or when different processes are compared. Especially for
decision- making during the design phase, where only very little time is available,
those methods have earned their right to exist. There are different approaches to
simplify the LCA which occurs at two levels (Jensen et al. 2006):
What to do – Omission of parts of the full LCA
37
How to do it – Simplifying procedures of the full LCA
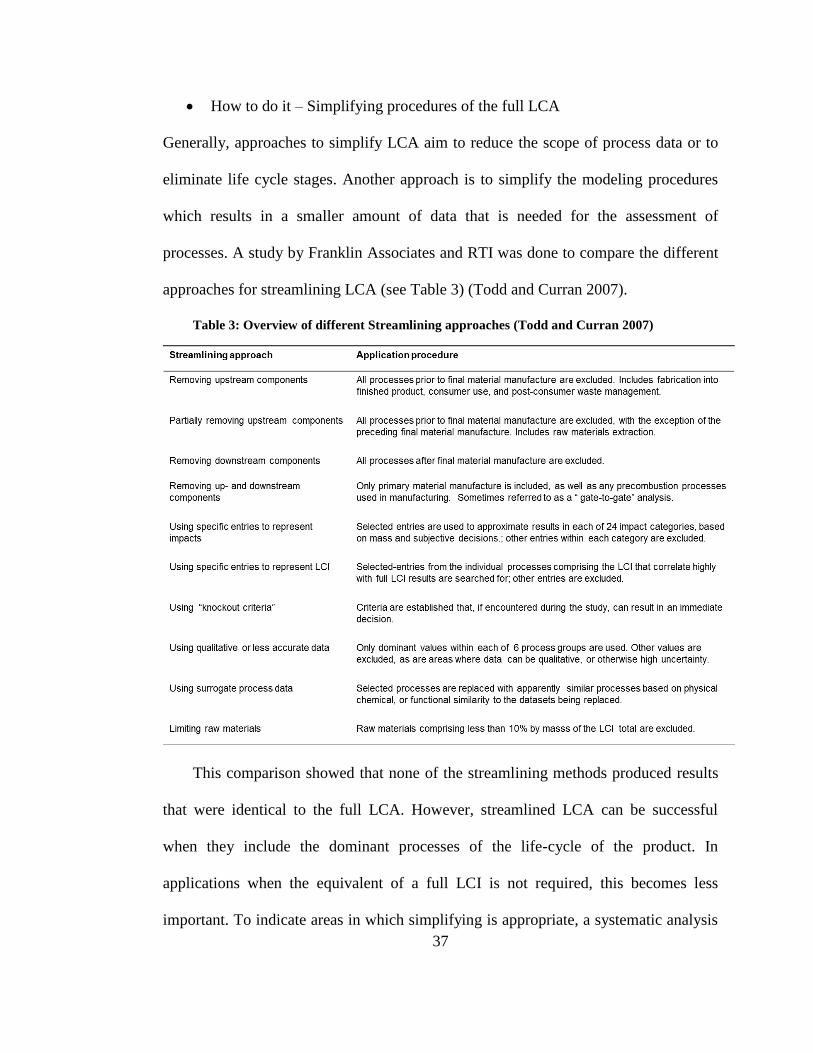
Generally, approaches to simplify LCA aim to reduce the scope of process data or to
eliminate life cycle stages. Another approach is to simplify the modeling procedures
which results in a smaller amount of data that is needed for the assessment of
processes. A study by Franklin Associates and RTI was done to compare the different
approaches for streamlining LCA (see Table 3) (Todd and Curran 2007).
Table 3: Overview of different Streamlining approaches (Todd and Curran 2007)
This comparison showed that none of the streamlining methods produced results
that were identical to the full LCA. However, streamlined LCA can be successful
when they include the dominant processes of the life-cycle of the product. In
applications when the equivalent of a full LCI is not required, this becomes less
important. To indicate areas in which simplifying is appropriate, a systematic analysis
38
based upon detailed knowledge of the production systems should be done.
Nonetheless, it should be noted that streamlining LCA will always include the risk of
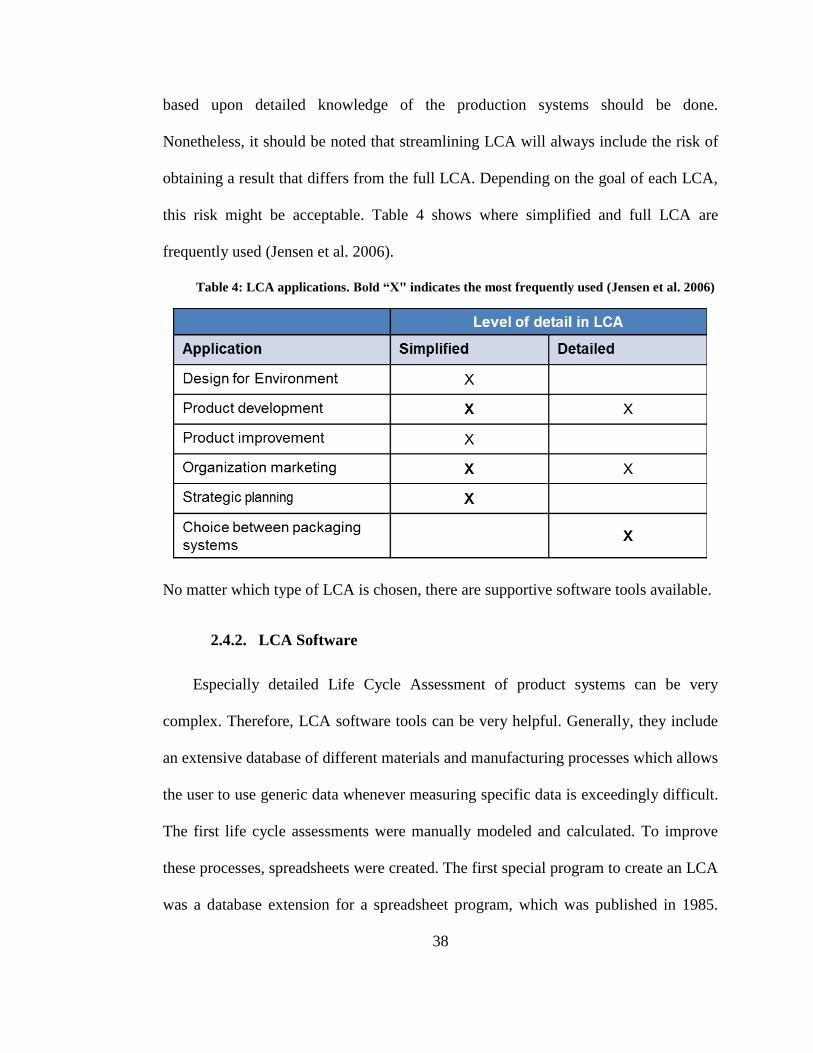
obtaining a result that differs from the full LCA. Depending on the goal of each LCA,
this risk might be acceptable. Table 4 shows where simplified and full LCA are
frequently used (Jensen et al. 2006).
Table 4: LCA applications. Bold “X" indicates the most frequently used (Jensen et al. 2006)
No matter which type of LCA is chosen, there are supportive software tools available.
2.4.2. LCA Software
Especially detailed Life Cycle Assessment of product systems can be very
complex. Therefore, LCA software tools can be very helpful. Generally, they include
an extensive database of different materials and manufacturing processes which allows
the user to use generic data whenever measuring specific data is exceedingly difficult.
The first life cycle assessments were manually modeled and calculated. To improve
these processes, spreadsheets were created. The first special program to create an LCA
was a database extension for a spreadsheet program, which was published in 1985.
39
With the increasing amount of data, extensive product life cycles and policy
requirements for reporting environmental impacts of product systems, the need for
further specific and user-friendly software solutions became more necessary. While
the first approaches were project-based or in-house developments, today there are a lot
more software solutions available on the market (Luedemann and Feig 2014).
2.4.3. Value Stream Mapping
Value Stream Mapping (VSM) is a method that helps to understand and draw the
flow of material and information as a product makes its way through the value stream.
Therefore, every value-added and non-value-added action within the production flow
from raw material until the shipping process is taken into account. The focus of the
VSM is on cost reduction through eliminating non-value-added activities and
unnecessary wait times via applying a management philosophy which focuses on
identifying and eliminating waste from each step in the production chain respective of
time, motion and resources alike throughout a product’s value stream, known as lean
(Rother and Shook 2003).
However, the VSM does not provide any information about the process energy
consumption or consumables. As a consequence, it does not give any conclusion of
how much of each of those actually serve the value adding process steps. The primary
shortcoming of traditional VSM is the lack of metrics to assess environmental and
societal aspects of sustainability performance. In an effort to build upon and improve
traditional VSM to capture additional sustainability aspects of the product flow and
make this method more useful for identifying the environmental impact of a value
40
stream, different approaches were made (Brown et al. 2014). The EPA developed two
toolkits: a lean and environmental toolkit and a lean energy toolkit. The first tool seeks
to reduce the environmental waste such as pollutants and any hazardous materials used
in production, while the other tool focuses on monitoring the energy consumption
within the manufacturing system. Both tools collect data for each process and evaluate
the environmental impact, allowing improvements to be targeted to necessary areas.
The toolkits also mention how to add an EHS (Environmental, Health, and Safety)
stamp to identify manufacturing processes with EHS opportunities (EPA 2007).
Based on the ideas of EPA, Faulkner et al (2012) developed Sustainable VSM (Sus-
VSM), a tool that determines the sustainability of a process by using a comprehensive
set of different metrics such as: process water, raw material usage, energy
consumption, and social impact.
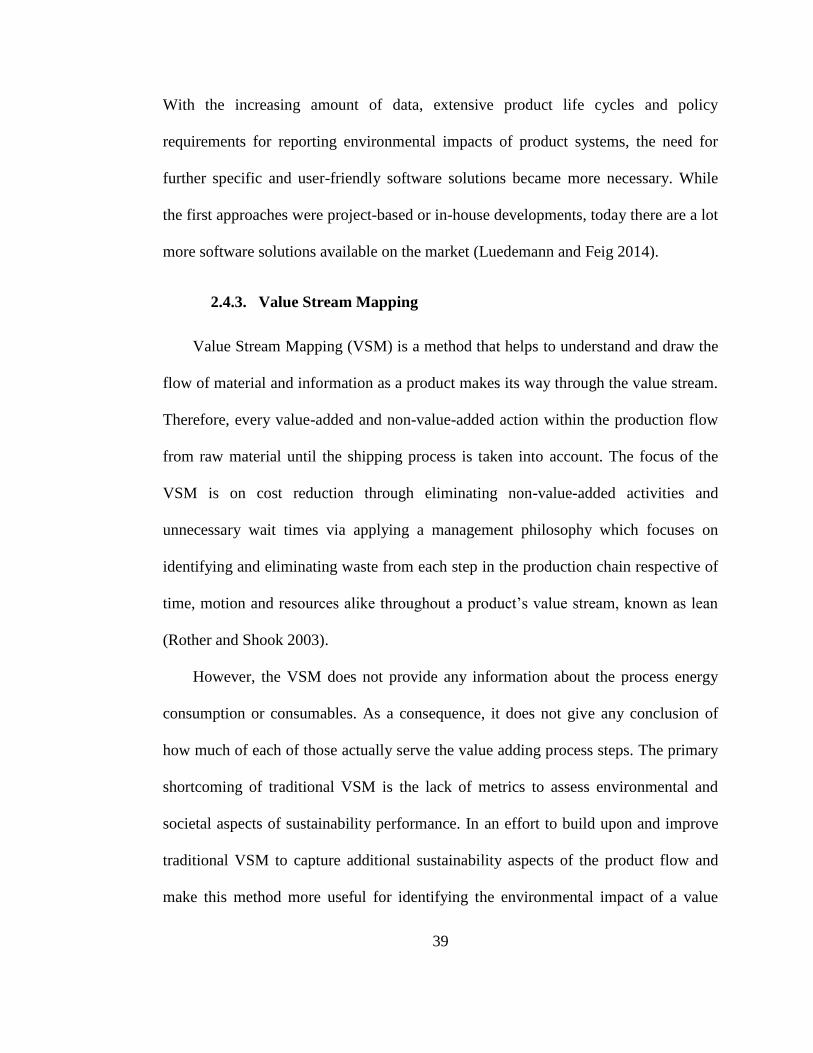
Water, oils, and coolants are used in various manufacturing operations and often
large quantities are needed which have a large potential for environmental
improvement. The fluids are tracked by the amount needed, used, and lost in each of
the process steps. This is visualized by a three-box system below each process cell
(see Figure 19) (Faulkner and Badurdeen 2014).
Figure 19: Visual Representation of Process Water on Sus-VSM (Faulkner et al. 2012)
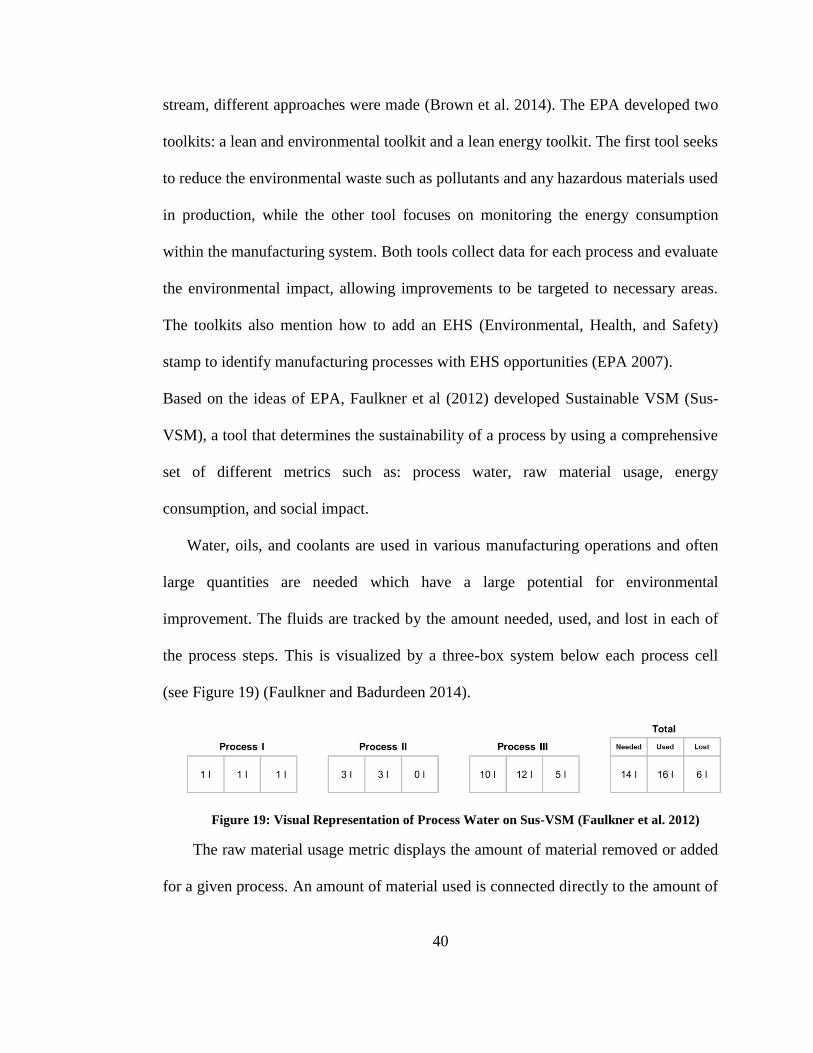
The raw material usage metric displays the amount of material removed or added
for a given process. An amount of material used is connected directly to the amount of
41
processing time that is needed to create a product and to energy consumption of the
process. To visualize this, the Sus-VSM records the raw material metric by utilizing a
dotted-line for the initial mass while the material added and removed during the
process is recorded above and below the dotted-line, respectively (see Figure 20)
(Brown et al. 2014).
Figure 20: Visual Representation of Raw Material Usage on Sus-VSM (Brown et al. 2014)
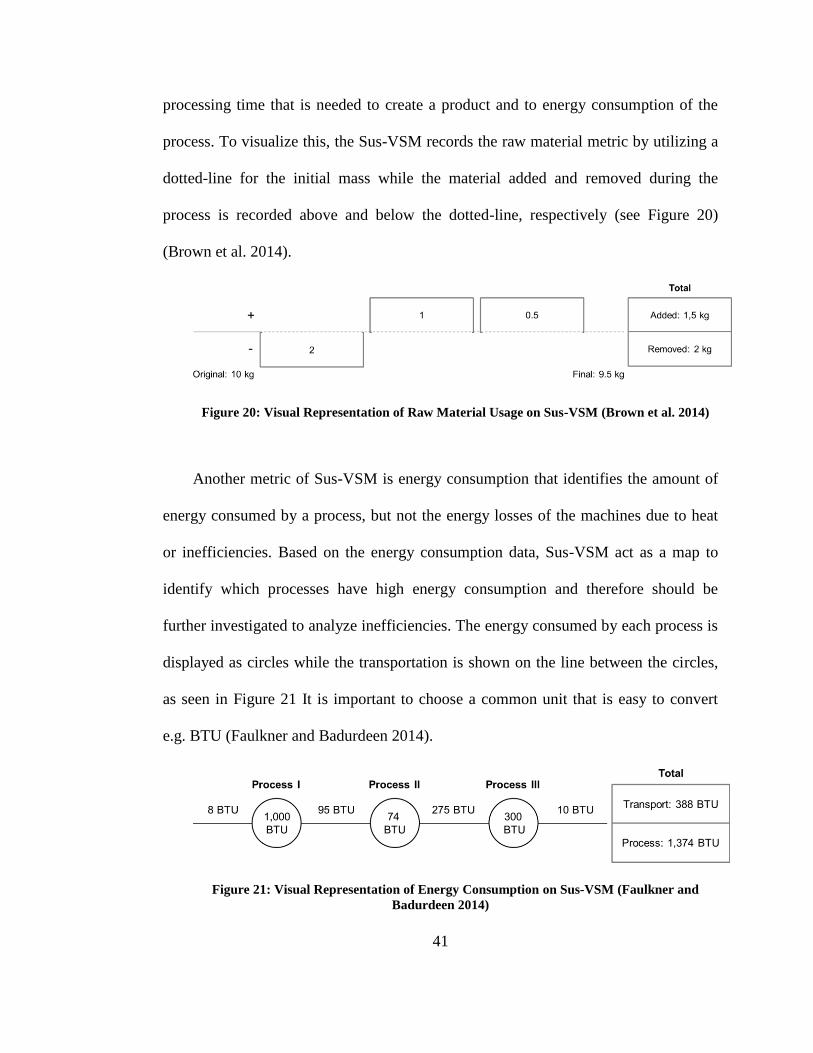
Another metric of Sus-VSM is energy consumption that identifies the amount of
energy consumed by a process, but not the energy losses of the machines due to heat
or inefficiencies. Based on the energy consumption data, Sus-VSM act as a map to
identify which processes have high energy consumption and therefore should be
further investigated to analyze inefficiencies. The energy consumed by each process is
displayed as circles while the transportation is shown on the line between the circles,
as seen in Figure 21 It is important to choose a common unit that is easy to convert
e.g. BTU (Faulkner and Badurdeen 2014).
Figure 21: Visual Representation of Energy Consumption on Sus-VSM (Faulkner and
Badurdeen 2014)
42
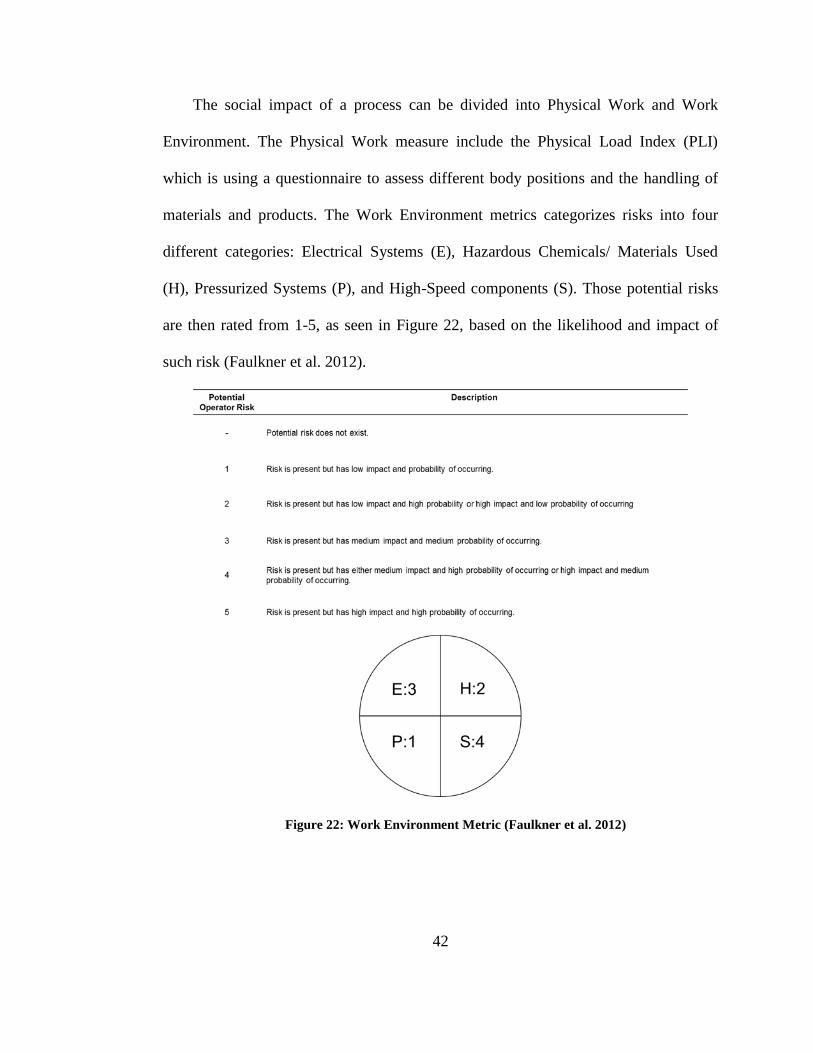
The social impact of a process can be divided into Physical Work and Work
Environment. The Physical Work measure include the Physical Load Index (PLI)
which is using a questionnaire to assess different body positions and the handling of
materials and products. The Work Environment metrics categorizes risks into four
different categories: Electrical Systems (E), Hazardous Chemicals/ Materials Used
(H), Pressurized Systems (P), and High-Speed components (S). Those potential risks
are then rated from 1-5, as seen in Figure 22, based on the likelihood and impact of
such risk (Faulkner et al. 2012).
Figure 22: Work Environment Metric (Faulkner et al. 2012)
43
By identifying risky processes an organization can react and install proper
controls to improve the safety of their employees as well as reduce the potential risks
(Faulkner and Badurdeen 2014).
Sus-VSM was applied successfully by Brown et al. (2014) to various
manufacturing systems showing how the method can provide a baseline for comparing
the performance of different products and processes (Brown et al. 2014). Therefore,
VSM and especially Sus-VSM is a powerful tool to measure the environmental impact
of manufacturing processes and help companies visualize how this impact is related to
the value stream of the product.
2.5. Environmental impact of manufacturing processes
Manufacturing offers many opportunities for reducing environmental impact by
utilizing resources more efficiently or by using new greener technology of
manufacturing. Since there is a large variety of manufacturing technologies it can be
difficult for decision-makers to select the most sustainable one. Analyzing processes
information can help to identify the environmental impact and enables better decision
making (Dornfeld 2011). The following subchapters include a comprehensive review
of the environmental impact of the most common manufacturing processes. This
includes the traditional group of machining which can be divided into: drilling,
turning, milling, and grinding. In addition, the review includes casting, welding and
coating processes.
44
2.5.1. Machining
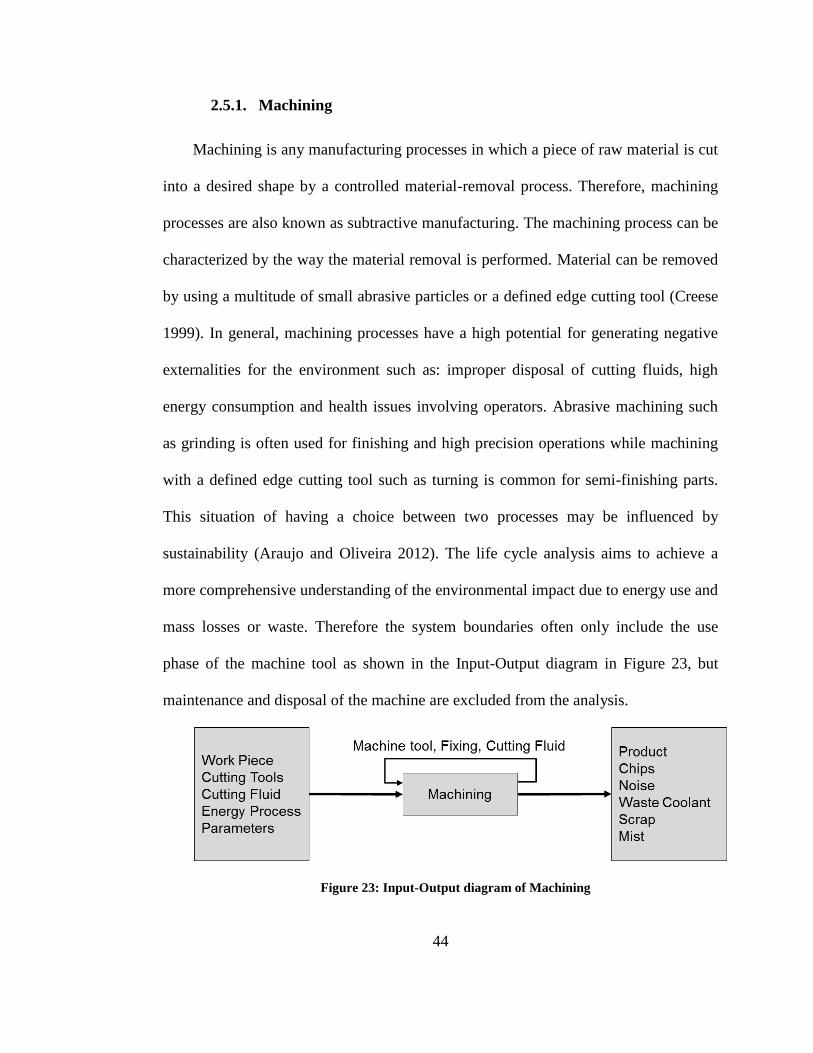
Machining is any manufacturing processes in which a piece of raw material is cut
into a desired shape by a controlled material-removal process. Therefore, machining
processes are also known as subtractive manufacturing. The machining process can be
characterized by the way the material removal is performed. Material can be removed
by using a multitude of small abrasive particles or a defined edge cutting tool (Creese
1999). In general, machining processes have a high potential for generating negative
externalities for the environment such as: improper disposal of cutting fluids, high
energy consumption and health issues involving operators. Abrasive machining such
as grinding is often used for finishing and high precision operations while machining
with a defined edge cutting tool such as turning is common for semi-finishing parts.
This situation of having a choice between two processes may be influenced by
sustainability (Araujo and Oliveira 2012). The life cycle analysis aims to achieve a
more comprehensive understanding of the environmental impact due to energy use and
mass losses or waste. Therefore the system boundaries often only include the use
phase of the machine tool as shown in the Input-Output diagram in Figure 23, but
maintenance and disposal of the machine are excluded from the analysis.
Figure 23: Input-Output diagram of Machining
45
Environmental impact due to energy consumption
The required energy for machining depends on different variables. The variables
can be ranked by their influence on the energy consumption (Dixit et al. 2012):
1. Material properties of the work piece
2. Feed rate f (mm/revolution)
3. Cutting speed V (m/min)
4. Size of the work piece
5. Cutting time
6. Coolant
7. Tool wear
8. Part holding fixture
9. Geometry and set-up
To calculate the required energy only the first five variables will be into taken
account. In the first step, the machining time 𝑡𝑚𝑎𝑐ℎ𝑖𝑛𝑖𝑛𝑔 and power 𝑃𝑚𝑎𝑐ℎ𝑖𝑛𝑖𝑛𝑔 must be
determined and can be calculated from the variables above. Depending on the given
material, a representative cutting speed can selected from the literature. This optimum
speed is affected by many factors such as (Kalla et al. 2010):
composition, hardness and thermal conductivity of material
width and depth of cut (roughing or finishing)
efficiency of cutting fluid
type and condition of the machine
Knowing the material, depth and length of the cut, the machining energy can be
calculated. In addition to the actual machining process, the idle and basic energies
must be included (Zein 2012).
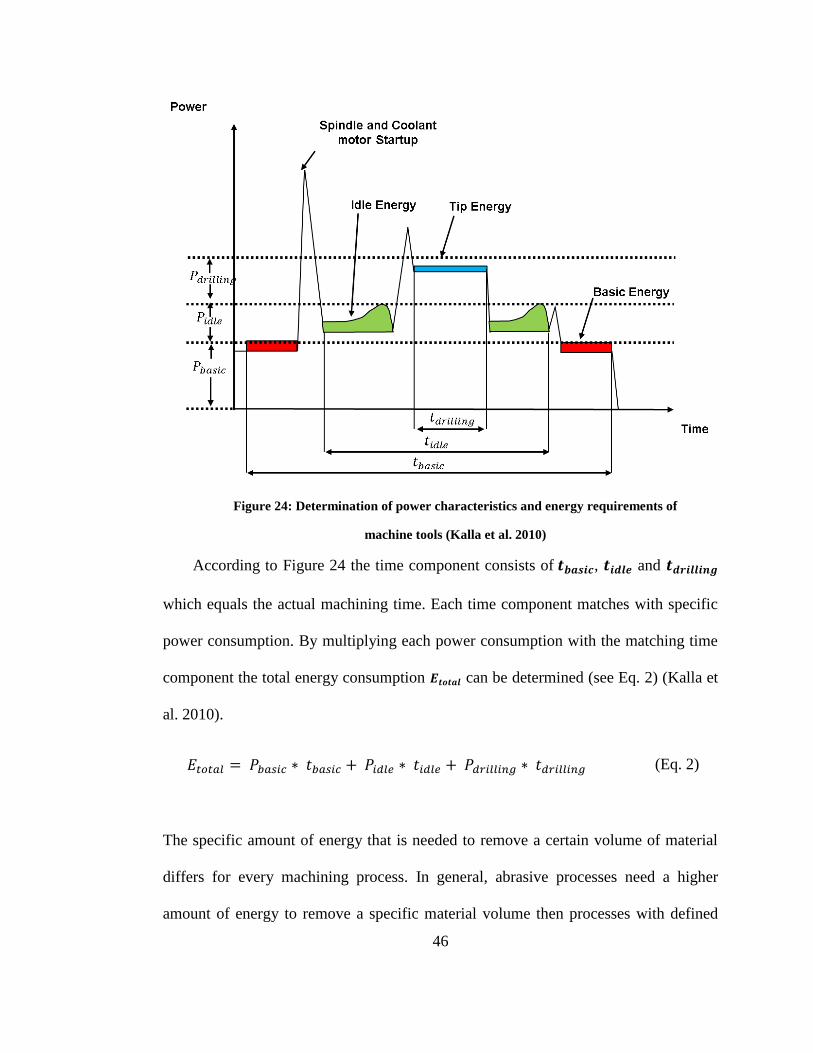
46
Figure 24: Determination of power characteristics and energy requirements of
machine tools (Kalla et al. 2010)
According to Figure 24 the time component consists of 𝒕𝒃𝒂𝒔𝒊𝒄, 𝒕𝒊𝒅𝒍𝒆 and 𝒕𝒅𝒓𝒊𝒍𝒍𝒊𝒏𝒈
which equals the actual machining time. Each time component matches with specific
power consumption. By multiplying each power consumption with the matching time
component the total energy consumption 𝑬𝒕𝒐𝒕𝒂𝒍 can be determined (see Eq. 2) (Kalla et
al. 2010).
𝐸𝑡𝑜𝑡𝑎𝑙 = 𝑃𝑏𝑎𝑠𝑖𝑐 ∗ 𝑡𝑏𝑎𝑠𝑖𝑐 + 𝑃𝑖𝑑𝑙𝑒 ∗ 𝑡𝑖𝑑𝑙𝑒 + 𝑃𝑑𝑟𝑖𝑙𝑙𝑖𝑛𝑔 ∗ 𝑡𝑑𝑟𝑖𝑙𝑙𝑖𝑛𝑔 (Eq. 2)
The specific amount of energy that is needed to remove a certain volume of material
differs for every machining process. In general, abrasive processes need a higher
amount of energy to remove a specific material volume then processes with defined
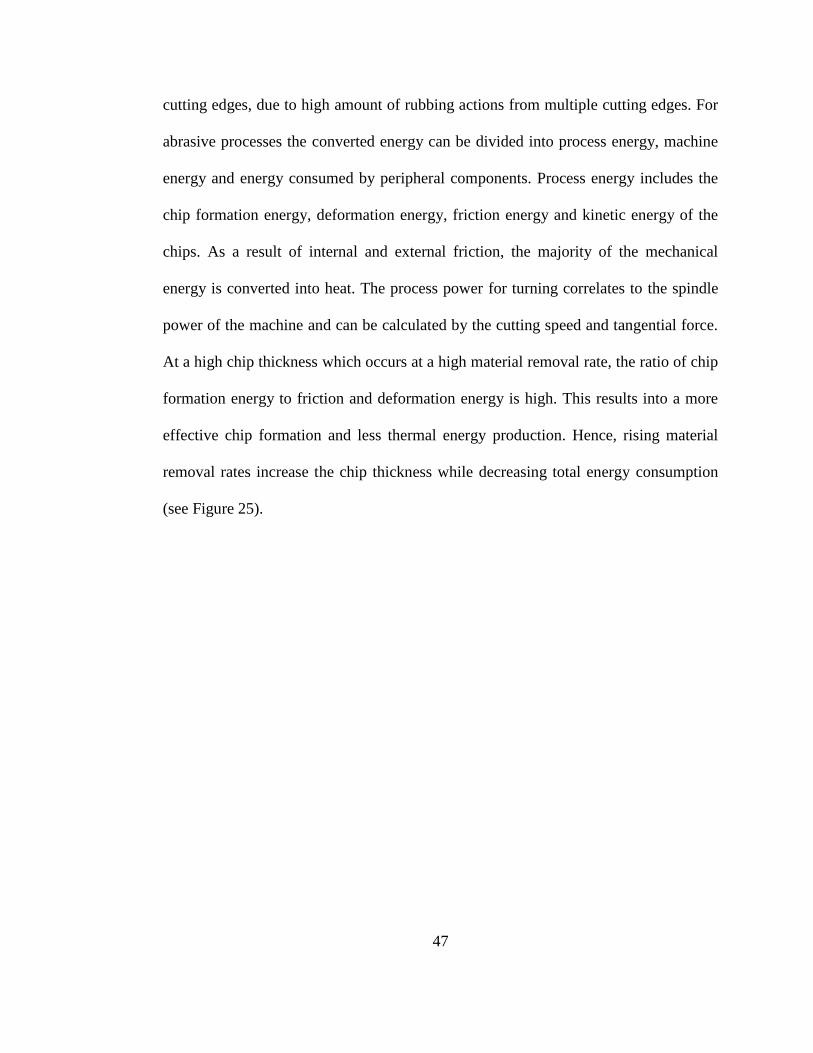
47
cutting edges, due to high amount of rubbing actions from multiple cutting edges. For
abrasive processes the converted energy can be divided into process energy, machine
energy and energy consumed by peripheral components. Process energy includes the
chip formation energy, deformation energy, friction energy and kinetic energy of the
chips. As a result of internal and external friction, the majority of the mechanical
energy is converted into heat. The process power for turning correlates to the spindle
power of the machine and can be calculated by the cutting speed and tangential force.
At a high chip thickness which occurs at a high material removal rate, the ratio of chip
formation energy to friction and deformation energy is high. This results into a more
effective chip formation and less thermal energy production. Hence, rising material
removal rates increase the chip thickness while decreasing total energy consumption
(see Figure 25).
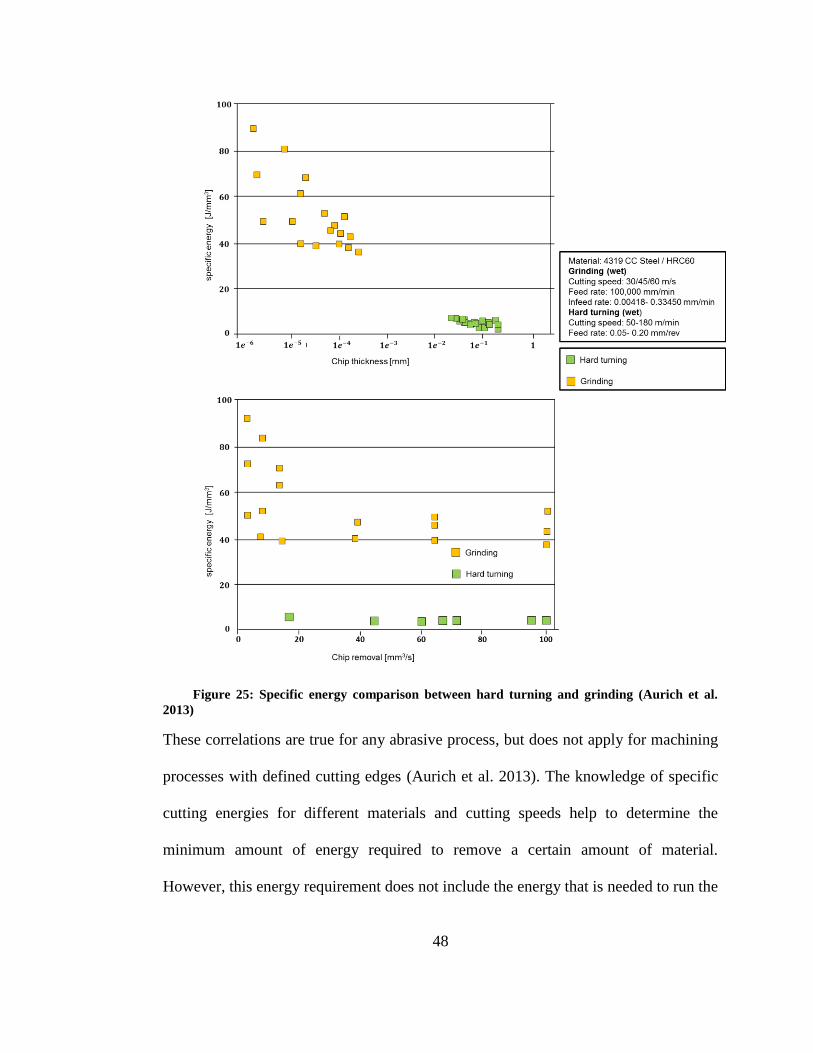
48
Figure 25: Specific energy comparison between hard turning and grinding (Aurich et al.
2013)
These correlations are true for any abrasive process, but does not apply for machining
processes with defined cutting edges (Aurich et al. 2013). The knowledge of specific
cutting energies for different materials and cutting speeds help to determine the
minimum amount of energy required to remove a certain amount of material.
However, this energy requirement does not include the energy that is needed to run the
49
auxiliary equipment such as: automated tool changers or coolant pumps. Such
equipment often requires a constant energy independent of whether or not a part is
being produced. Therefore, it is important to calculate or measure the total system
energy requirements for material removal. In an approach by Dahmus and Gutowski
different machining scenarios were modelled to analyze the total energy requirements
based on real machining data and various assumptions about operating and idle times.
With this approach a rough estimation about the total energy requirements can be done
(Dahmus and Gutowski 2004).
Environmental impact of waste stream
The environmental impact due to waste stream during the machining process can
be split up into solid, liquid and gas/aerosol. In case a dry machining process is used,
there is no liquid waste stream (see Table 5).
Table 5: Waste stream for drilling (Dixit et al. 2012)
The work piece material loss due to machining can be specified as chip
mass 𝑚𝑆. The chip mass can be calculated by multiplying the volume of material
removed 𝑉𝑟𝑒𝑚𝑜𝑣𝑎𝑙 and the density of the work piece material 𝜌𝑚𝑎𝑡𝑒𝑟𝑖𝑎𝑙. The liquid
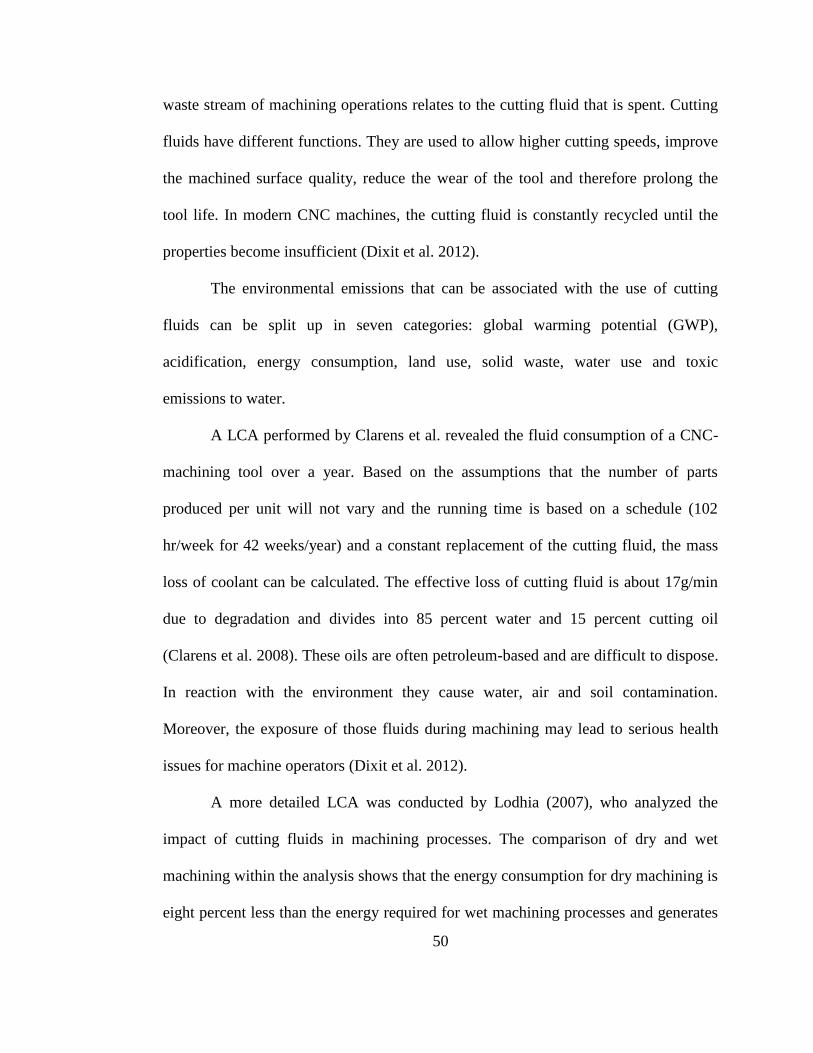
50
waste stream of machining operations relates to the cutting fluid that is spent. Cutting
fluids have different functions. They are used to allow higher cutting speeds, improve
the machined surface quality, reduce the wear of the tool and therefore prolong the
tool life. In modern CNC machines, the cutting fluid is constantly recycled until the
properties become insufficient (Dixit et al. 2012).
The environmental emissions that can be associated with the use of cutting
fluids can be split up in seven categories: global warming potential (GWP),
acidification, energy consumption, land use, solid waste, water use and toxic
emissions to water.
A LCA performed by Clarens et al. revealed the fluid consumption of a CNC-
machining tool over a year. Based on the assumptions that the number of parts
produced per unit will not vary and the running time is based on a schedule (102
hr/week for 42 weeks/year) and a constant replacement of the cutting fluid, the mass
loss of coolant can be calculated. The effective loss of cutting fluid is about 17g/min
due to degradation and divides into 85 percent water and 15 percent cutting oil
(Clarens et al. 2008). These oils are often petroleum-based and are difficult to dispose.
In reaction with the environment they cause water, air and soil contamination.
Moreover, the exposure of those fluids during machining may lead to serious health
issues for machine operators (Dixit et al. 2012).
A more detailed LCA was conducted by Lodhia (2007), who analyzed the
impact of cutting fluids in machining processes. The comparison of dry and wet
machining within the analysis shows that the energy consumption for dry machining is
eight percent less than the energy required for wet machining processes and generates
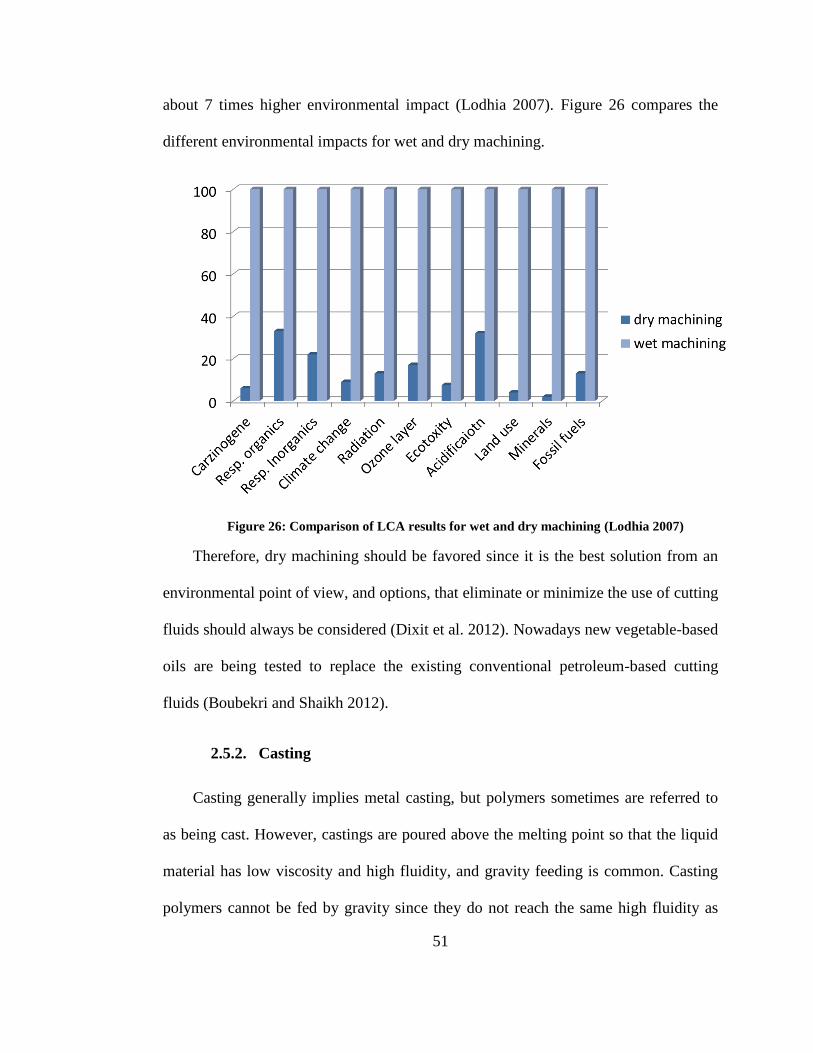
51
about 7 times higher environmental impact (Lodhia 2007). Figure 26 compares the
different environmental impacts for wet and dry machining.
Figure 26: Comparison of LCA results for wet and dry machining (Lodhia 2007)
Therefore, dry machining should be favored since it is the best solution from an
environmental point of view, and options, that eliminate or minimize the use of cutting
fluids should always be considered (Dixit et al. 2012). Nowadays new vegetable-based
oils are being tested to replace the existing conventional petroleum-based cutting
fluids (Boubekri and Shaikh 2012).
2.5.2. Casting
Casting generally implies metal casting, but polymers sometimes are referred to
as being cast. However, castings are poured above the melting point so that the liquid
material has low viscosity and high fluidity, and gravity feeding is common. Casting
polymers cannot be fed by gravity since they do not reach the same high fluidity as
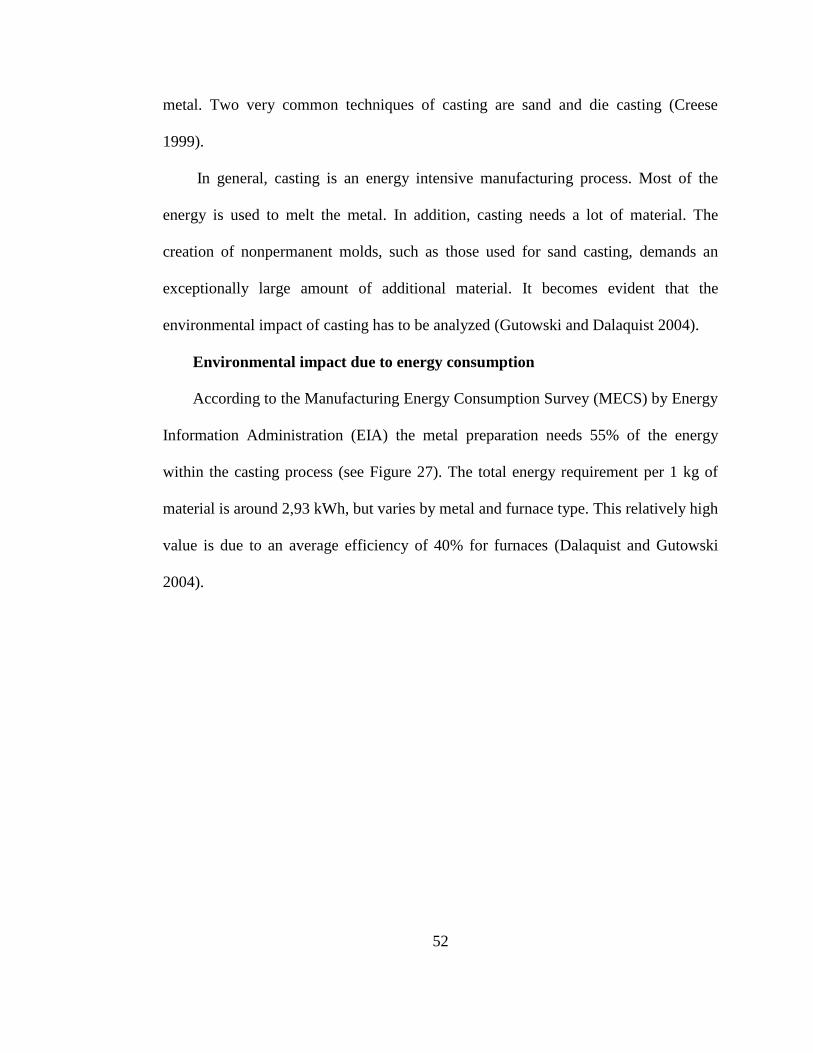
52
metal. Two very common techniques of casting are sand and die casting (Creese
1999).
In general, casting is an energy intensive manufacturing process. Most of the
energy is used to melt the metal. In addition, casting needs a lot of material. The
creation of nonpermanent molds, such as those used for sand casting, demands an
exceptionally large amount of additional material. It becomes evident that the
environmental impact of casting has to be analyzed (Gutowski and Dalaquist 2004).
Environmental impact due to energy consumption
According to the Manufacturing Energy Consumption Survey (MECS) by Energy
Information Administration (EIA) the metal preparation needs 55% of the energy
within the casting process (see Figure 27). The total energy requirement per 1 kg of
material is around 2,93 kWh, but varies by metal and furnace type. This relatively high
value is due to an average efficiency of 40% for furnaces (Dalaquist and Gutowski
2004).
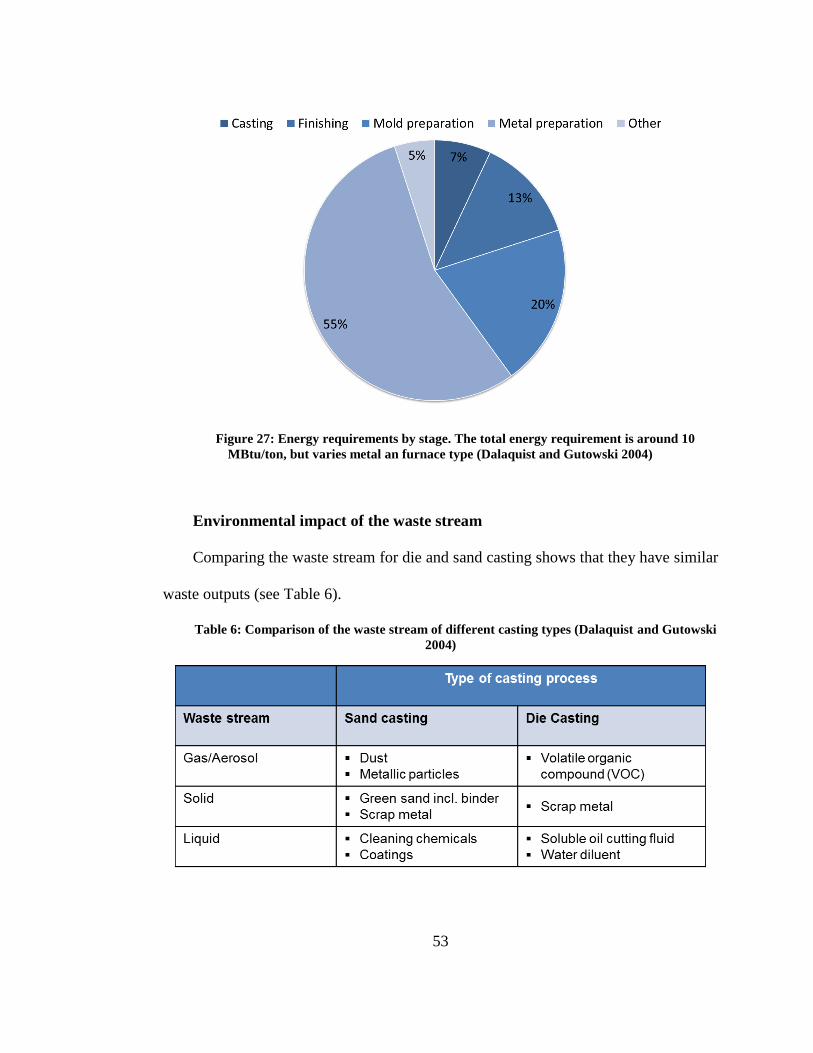
53
Figure 27: Energy requirements by stage. The total energy requirement is around 10
MBtu/ton, but varies metal an furnace type (Dalaquist and Gutowski 2004)
Environmental impact of the waste stream
Comparing the waste stream for die and sand casting shows that they have similar
waste outputs (see Table 6).
Table 6: Comparison of the waste stream of different casting types (Dalaquist and Gutowski
2004)
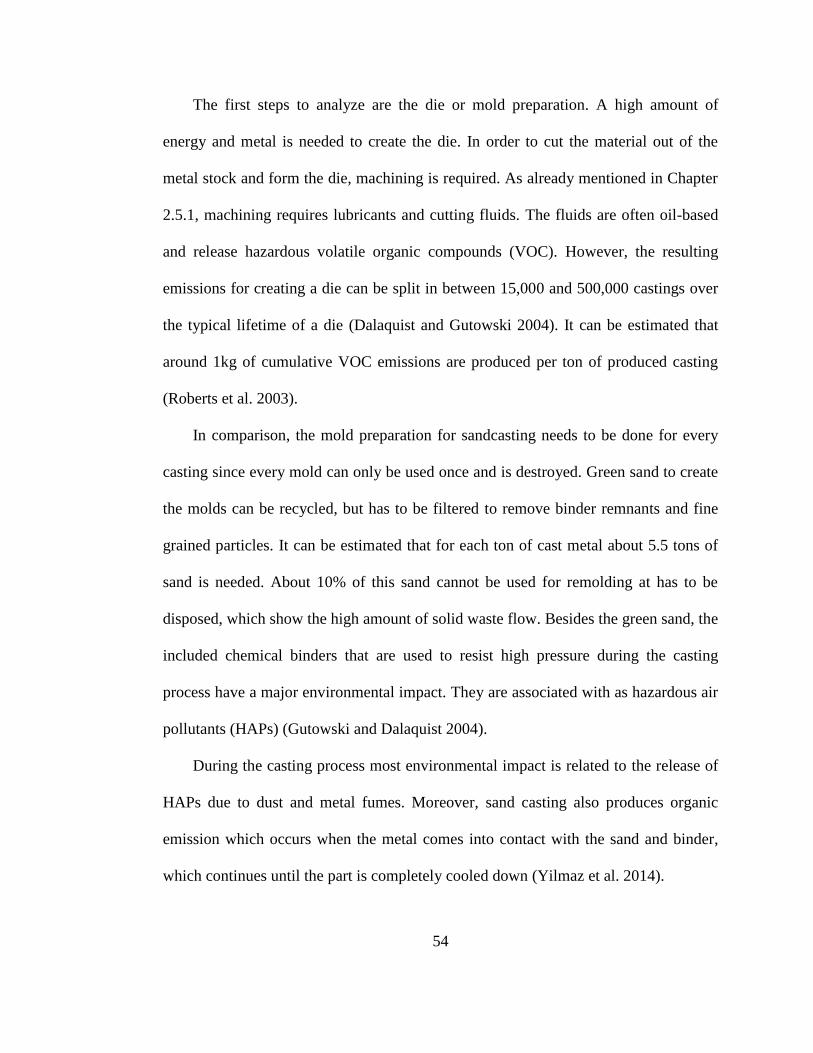
54
The first steps to analyze are the die or mold preparation. A high amount of
energy and metal is needed to create the die. In order to cut the material out of the
metal stock and form the die, machining is required. As already mentioned in Chapter
2.5.1, machining requires lubricants and cutting fluids. The fluids are often oil-based
and release hazardous volatile organic compounds (VOC). However, the resulting
emissions for creating a die can be split in between 15,000 and 500,000 castings over
the typical lifetime of a die (Dalaquist and Gutowski 2004). It can be estimated that
around 1kg of cumulative VOC emissions are produced per ton of produced casting
(Roberts et al. 2003).
In comparison, the mold preparation for sandcasting needs to be done for every
casting since every mold can only be used once and is destroyed. Green sand to create
the molds can be recycled, but has to be filtered to remove binder remnants and fine
grained particles. It can be estimated that for each ton of cast metal about 5.5 tons of
sand is needed. About 10% of this sand cannot be used for remolding at has to be
disposed, which show the high amount of solid waste flow. Besides the green sand, the
included chemical binders that are used to resist high pressure during the casting
process have a major environmental impact. They are associated with as hazardous air
pollutants (HAPs) (Gutowski and Dalaquist 2004).
During the casting process most environmental impact is related to the release of
HAPs due to dust and metal fumes. Moreover, sand casting also produces organic
emission which occurs when the metal comes into contact with the sand and binder,
which continues until the part is completely cooled down (Yilmaz et al. 2014).
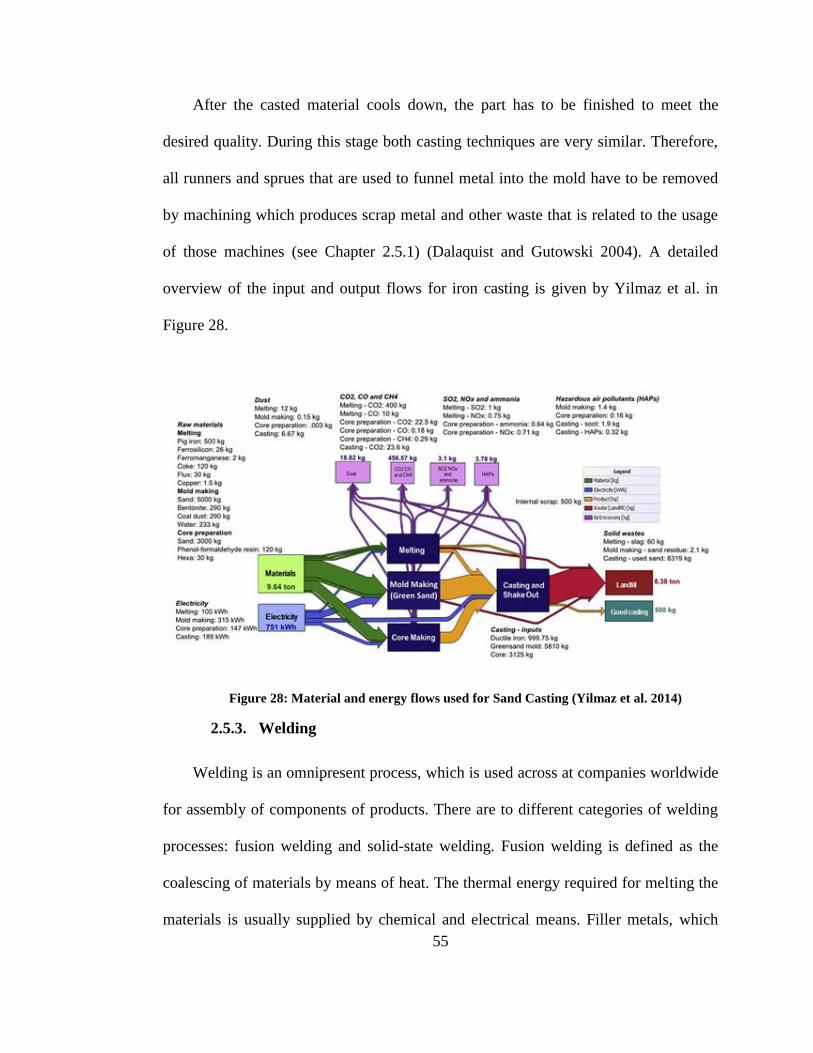
55
After the casted material cools down, the part has to be finished to meet the
desired quality. During this stage both casting techniques are very similar. Therefore,
all runners and sprues that are used to funnel metal into the mold have to be removed
by machining which produces scrap metal and other waste that is related to the usage
of those machines (see Chapter 2.5.1) (Dalaquist and Gutowski 2004). A detailed
overview of the input and output flows for iron casting is given by Yilmaz et al. in
Figure 28.
Figure 28: Material and energy flows used for Sand Casting (Yilmaz et al. 2014)
2.5.3. Welding
Welding is an omnipresent process, which is used across at companies worldwide
for assembly of components of products. There are to different categories of welding
processes: fusion welding and solid-state welding. Fusion welding is defined as the
coalescing of materials by means of heat. The thermal energy required for melting the
materials is usually supplied by chemical and electrical means. Filler metals, which
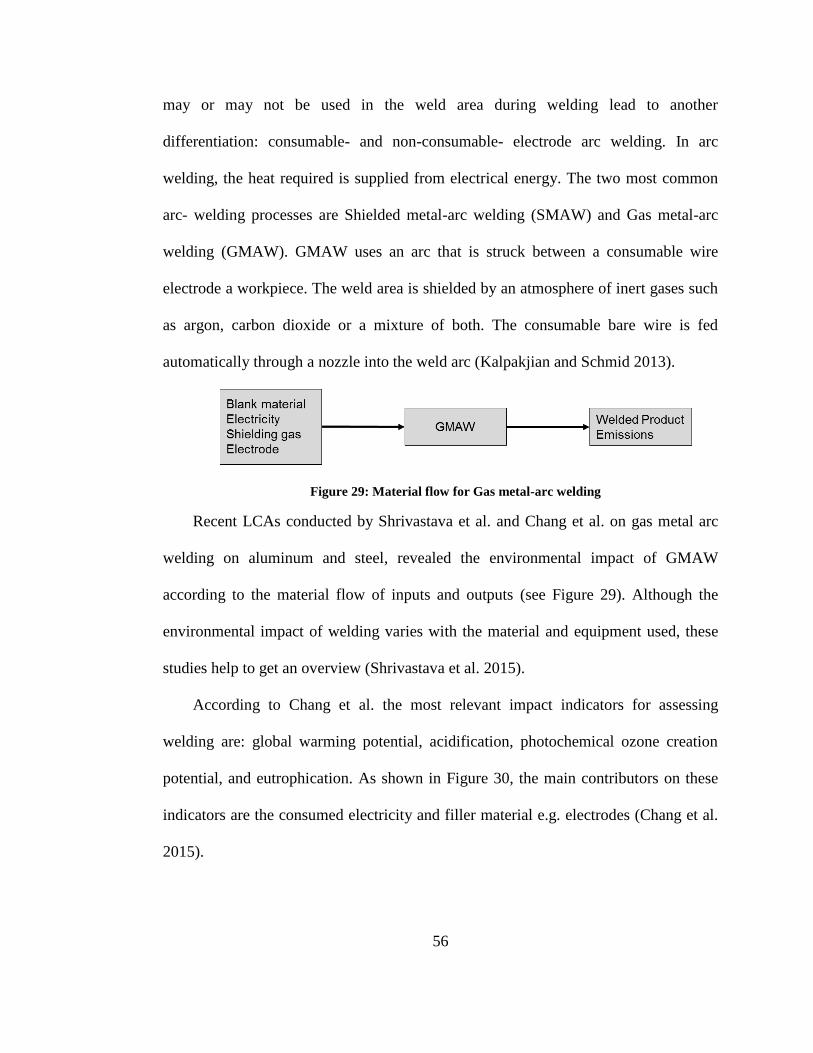
56
may or may not be used in the weld area during welding lead to another
differentiation: consumable- and non-consumable- electrode arc welding. In arc
welding, the heat required is supplied from electrical energy. The two most common
arc- welding processes are Shielded metal-arc welding (SMAW) and Gas metal-arc
welding (GMAW). GMAW uses an arc that is struck between a consumable wire
electrode a workpiece. The weld area is shielded by an atmosphere of inert gases such
as argon, carbon dioxide or a mixture of both. The consumable bare wire is fed
automatically through a nozzle into the weld arc (Kalpakjian and Schmid 2013).
Figure 29: Material flow for Gas metal-arc welding
Recent LCAs conducted by Shrivastava et al. and Chang et al. on gas metal arc
welding on aluminum and steel, revealed the environmental impact of GMAW
according to the material flow of inputs and outputs (see Figure 29). Although the
environmental impact of welding varies with the material and equipment used, these
studies help to get an overview (Shrivastava et al. 2015).
According to Chang et al. the most relevant impact indicators for assessing
welding are: global warming potential, acidification, photochemical ozone creation
potential, and eutrophication. As shown in Figure 30, the main contributors on these
indicators are the consumed electricity and filler material e.g. electrodes (Chang et al.
2015).
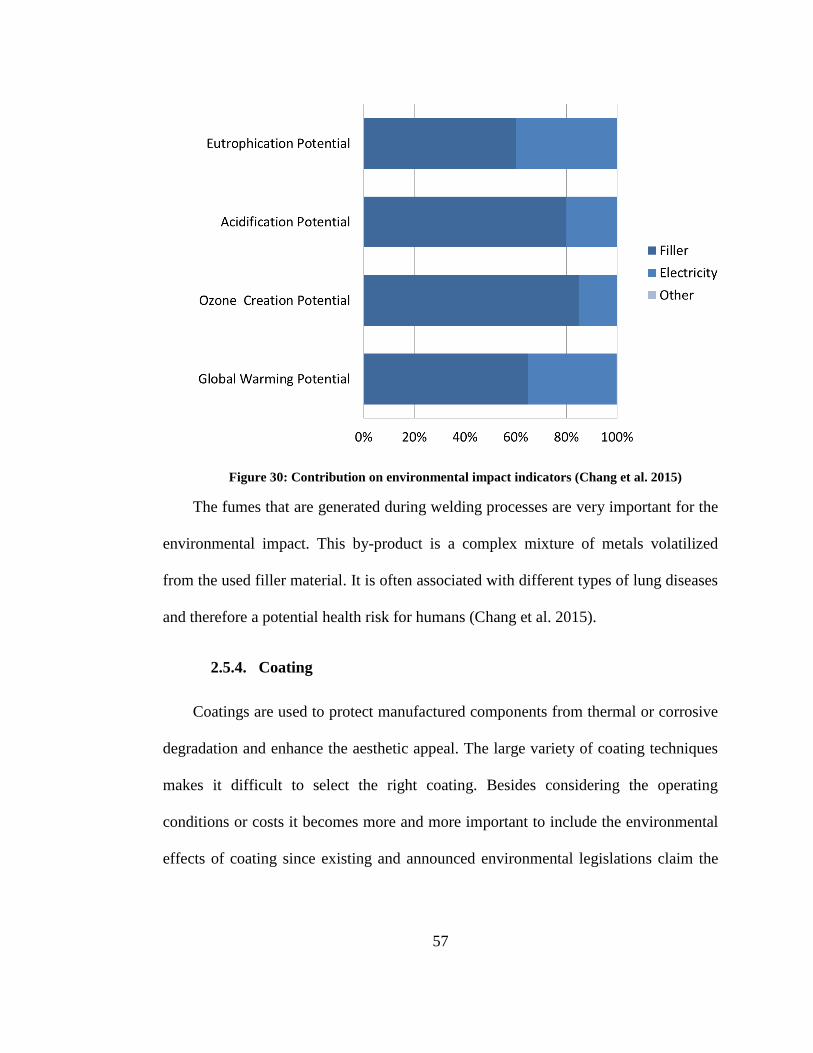
57
Figure 30: Contribution on environmental impact indicators (Chang et al. 2015)
The fumes that are generated during welding processes are very important for the
environmental impact. This by-product is a complex mixture of metals volatilized
from the used filler material. It is often associated with different types of lung diseases
and therefore a potential health risk for humans (Chang et al. 2015).
2.5.4. Coating
Coatings are used to protect manufactured components from thermal or corrosive
degradation and enhance the aesthetic appeal. The large variety of coating techniques
makes it difficult to select the right coating. Besides considering the operating
conditions or costs it becomes more and more important to include the environmental
effects of coating since existing and announced environmental legislations claim the
58
reduction of volatile organic compounds and other hazardous waste (Asthana et al.
2006).
2.6. Computer Aided Cost Estimation
In the past, the assessment of manufacturability and production costs has been
conducted based on the construction of prototypes and physical tests during the
development of a product (Ostwald 1992). Manufacturing prototypes often requires
specific tools which have to be designed and produced, and then future design changes
require tool adjustments or even replacement by a new tool. This part of product
development can be very time consuming and costly. One approach to address this
problem is by using Computer Aided Engineering Cost (CACE) software which can
help to estimate product costs and make statements about manufacturability. There
exists already a large variety of software packages on the market, however they are
mainly based the Activity-Based Costing (ABC) or on the analysis of 3D-CAD data to
calculate the costs of production (Niazi et al. 2006).
Activity-Based Costing is focused to allocating overheads for each process step
during production based on their origins of consumption. Software based on ABC is
often very flexible and suitable for different manufacturing processes. The user can
select from different machine types and adjust process data such as cycle time, the
amount of scrap or energy consumption according to his individual machine (Drury
1992). This makes this type of software very flexible since it can virtually model every
manufacturing process. However, CACE software based on ABC requires a high
availability of reliable and accurate production data, as well as high level of user
59
knowledge (Micro Estimating Systems 2012). In the following section the three most
important software tools are presented.
DFM Concurrent Costing Software
The DFM Concurrent Costing 2.3 software is part of the software package
"Design for Manufacture and Assembly" of the company Boothroyd Dewhurst, Inc.
and is divided into the programs "Design for Assembly" and "DFM Concurrent
Costing". The software is a hybrid tool that generates cost estimates based on the 3D-
CAD files or by manual entry of all input data and definition of assembly steps by the
user. DFM Concurrent Costing uses a library with a wide range of equipment for
machining, forging, casting, and various assembly operations (Boothroyd Dewhurst
2015).
Siemens Teamcenter Pro Calc
The Perfect ProCalc software exists since the year 2000 and was developed by the
company Tsetinis. During that time the software was mainly to estimate costs in the
German car industry. In 2012, the Siemens software was bought and integrated into
Siemens software package called Siemens PLM. Perfect ProCalc uses the ABC
approach to analyze costs and has an extensive database of some 300 regions and
more than 3,000 types of machines. This allows rapid evaluation of cost effects of the
transfer of production from regions with high labor costs to other low-wage countries.
Perfect ProCalc also provides tools for calculating cycle times and allows the user to
import available documents (e.g. 2D drawings, photographs and Excel Calculation)
available (Siemens PLM Software 2015).
60
aPriori
The software aPriori developed by a company of the same name, estimates cost
based geometric data derived from a 3D CAD file. aPriori is focused on the costing of
various metals and plastics including their processing and surface treatment. A special
feature of aPriori is the Virtual Production Environment (VPE), which includes pre-
configured setups for different regions regarding rates for labor, cost per square meter,
energy, as well as typical overheads of suppliers. In the standard library eight other
VPEs including the United States are available. Furthermore, aPriori is the only CACE
software that supports the user by choosing between different manufacturing processes
based on generic data. This is a very helpful feature when new product designs or
manufacturing lines have to be planned while detailed cost information is not available
(Apriori Inc. 2015).
2.7. Need for a framework to assess sustainability and cost
This chapter demonstrated that the manufacturing industry is a main consumer of
natural resources and main producer of environmental impacts. Knowing this makes
companies highly responsible towards their environment. Sustainable manufacturing is
one way to decrease the environmental impact of a company. Before a company can
start to enhance their processes towards more sustainable manufacturing, it is
necessary to identify unsustainable manufacturing steps. Therefore, it is important to
evaluate the environmental impacts of each manufacturing step in order to derive how
they contribute to the environmental impact of the complete manufacturing process.
61
Comparing those measurements with data from a cost analysis helps to reveal
potential cost savings that go along with sustainable manufacturing.
Even though the literature review from Chapter 2 indicates that several tools and
frameworks are already available to assess sustainability, it also demonstrates that
results vary depending on the subject of investigation and the required insight
knowledge and efforts to use those tools is significant. Moreover, most frameworks
focus primarily on a single measurement such as energy or water consumption.
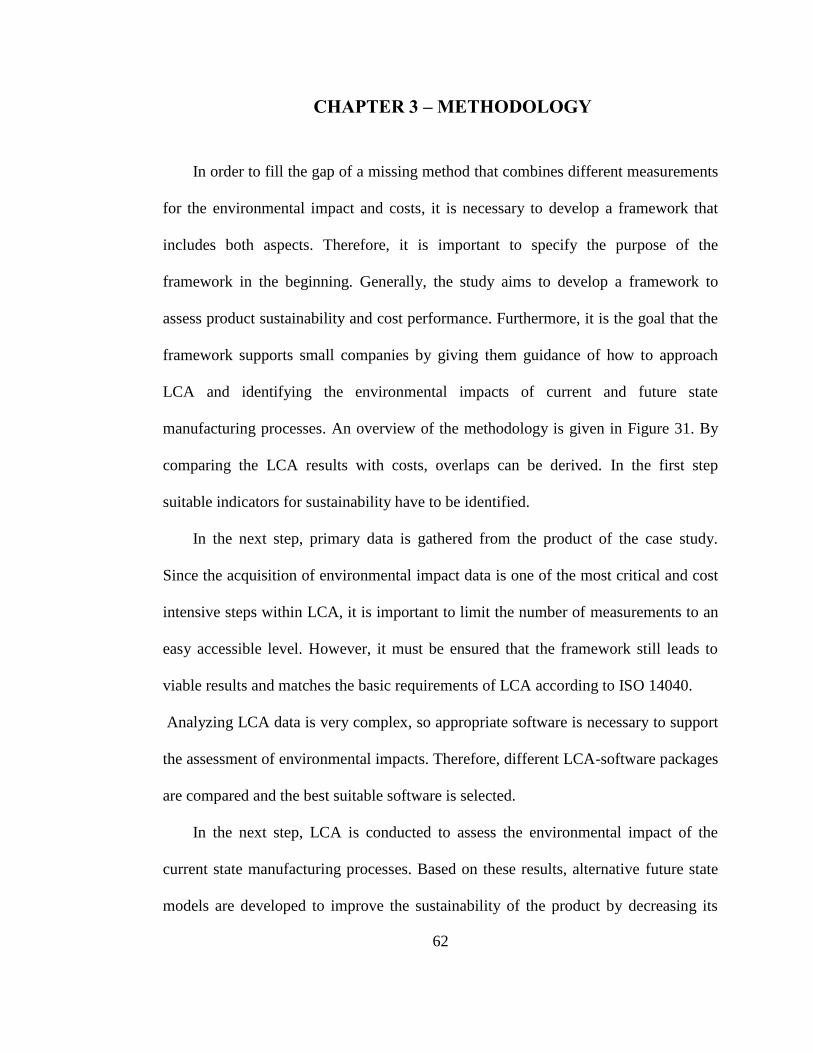
62
3. CHAPTER 3 – METHODOLOGY
In order to fill the gap of a missing method that combines different measurements
for the environmental impact and costs, it is necessary to develop a framework that
includes both aspects. Therefore, it is important to specify the purpose of the
framework in the beginning. Generally, the study aims to develop a framework to
assess product sustainability and cost performance. Furthermore, it is the goal that the
framework supports small companies by giving them guidance of how to approach
LCA and identifying the environmental impacts of current and future state
manufacturing processes. An overview of the methodology is given in Figure 31. By
comparing the LCA results with costs, overlaps can be derived. In the first step
suitable indicators for sustainability have to be identified.
In the next step, primary data is gathered from the product of the case study.
Since the acquisition of environmental impact data is one of the most critical and cost
intensive steps within LCA, it is important to limit the number of measurements to an
easy accessible level. However, it must be ensured that the framework still leads to
viable results and matches the basic requirements of LCA according to ISO 14040.
Analyzing LCA data is very complex, so appropriate software is necessary to support
the assessment of environmental impacts. Therefore, different LCA-software packages
are compared and the best suitable software is selected.
In the next step, LCA is conducted to assess the environmental impact of the
current state manufacturing processes. Based on these results, alternative future state
models are developed to improve the sustainability of the product by decreasing its
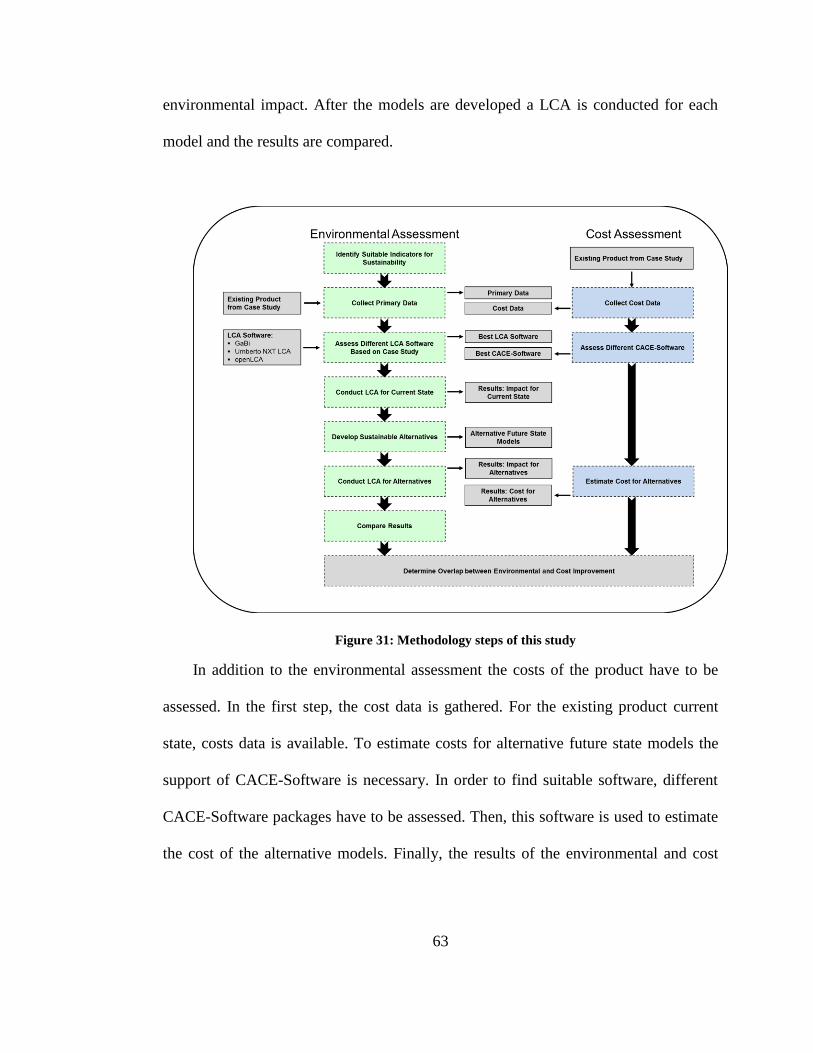
63
environmental impact. After the models are developed a LCA is conducted for each
model and the results are compared.
Figure 31: Methodology steps of this study
In addition to the environmental assessment the costs of the product have to be
assessed. In the first step, the cost data is gathered. For the existing product current
state, costs data is available. To estimate costs for alternative future state models the
support of CACE-Software is necessary. In order to find suitable software, different
CACE-Software packages have to be assessed. Then, this software is used to estimate
the cost of the alternative models. Finally, the results of the environmental and cost
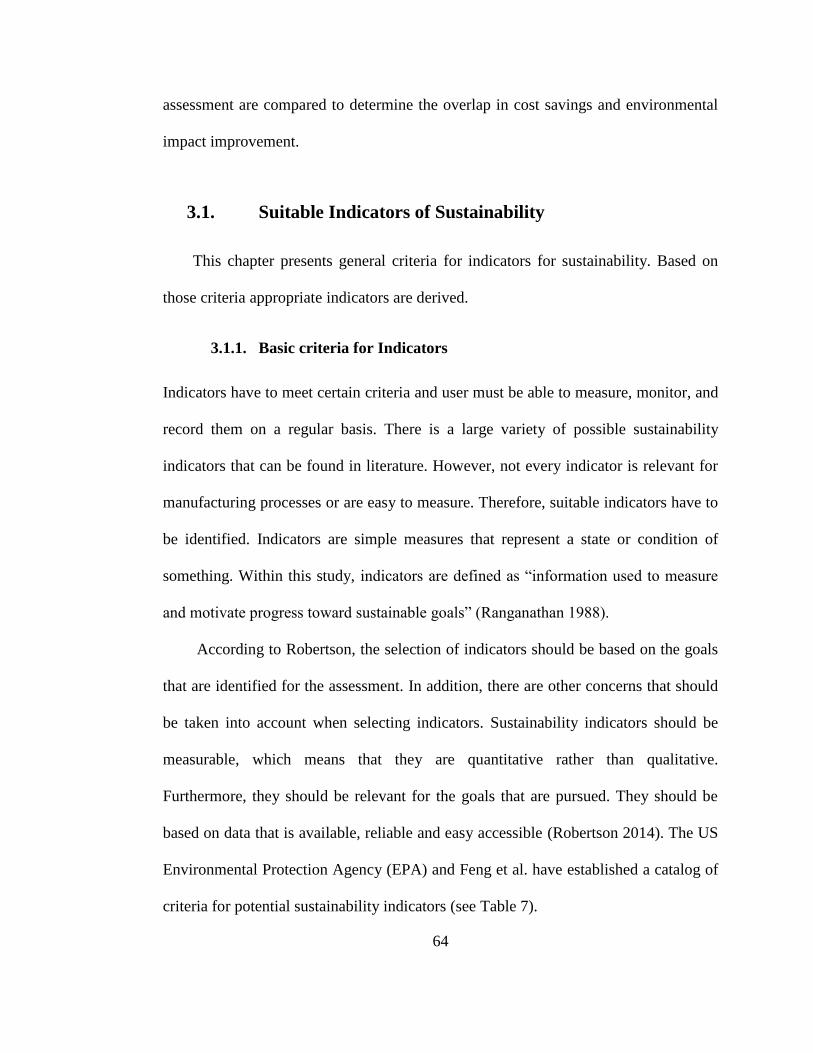
64
assessment are compared to determine the overlap in cost savings and environmental
impact improvement.
3.1. Suitable Indicators of Sustainability
This chapter presents general criteria for indicators for sustainability. Based on
those criteria appropriate indicators are derived.
3.1.1. Basic criteria for Indicators
Indicators have to meet certain criteria and user must be able to measure, monitor, and
record them on a regular basis. There is a large variety of possible sustainability
indicators that can be found in literature. However, not every indicator is relevant for
manufacturing processes or are easy to measure. Therefore, suitable indicators have to
be identified. Indicators are simple measures that represent a state or condition of
something. Within this study, indicators are defined as “information used to measure
and motivate progress toward sustainable goals” (Ranganathan 1988).
According to Robertson, the selection of indicators should be based on the goals
that are identified for the assessment. In addition, there are other concerns that should
be taken into account when selecting indicators. Sustainability indicators should be
measurable, which means that they are quantitative rather than qualitative.
Furthermore, they should be relevant for the goals that are pursued. They should be
based on data that is available, reliable and easy accessible (Robertson 2014). The US
Environmental Protection Agency (EPA) and Feng et al. have established a catalog of
criteria for potential sustainability indicators (see Table 7).
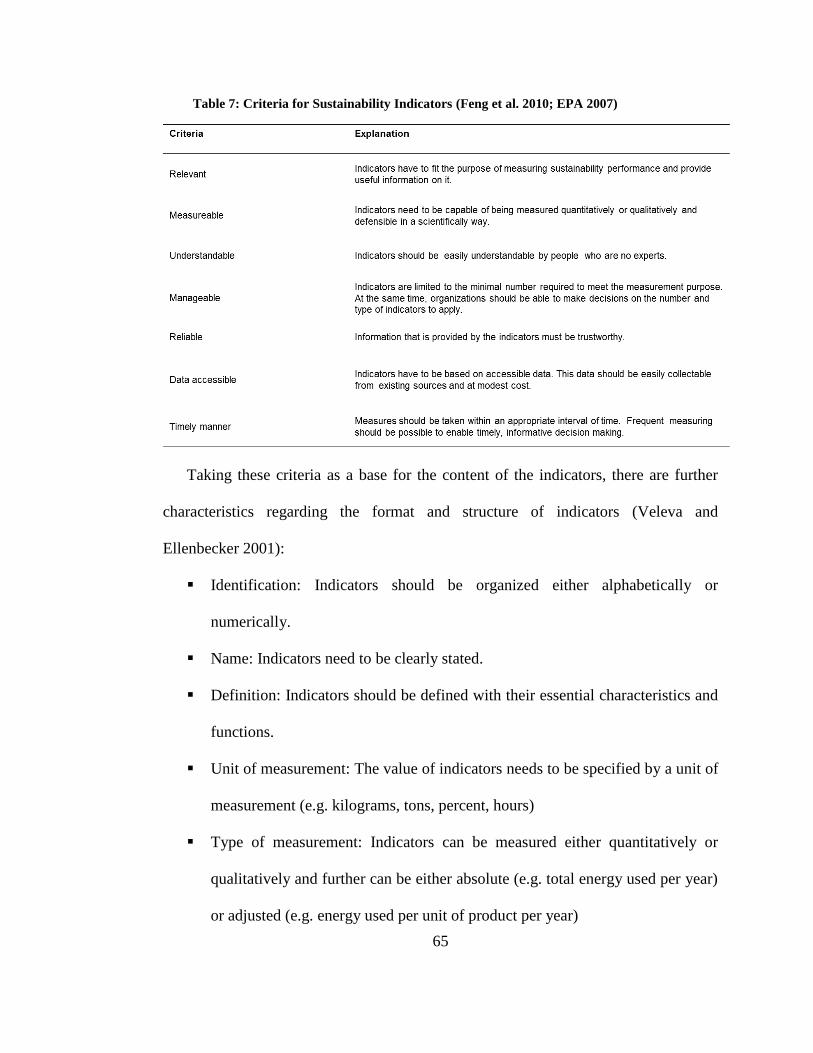
65
Table 7: Criteria for Sustainability Indicators (Feng et al. 2010; EPA 2007)
Taking these criteria as a base for the content of the indicators, there are further
characteristics regarding the format and structure of indicators (Veleva and
Ellenbecker 2001):
Identification: Indicators should be organized either alphabetically or
numerically.
Name: Indicators need to be clearly stated.
Definition: Indicators should be defined with their essential characteristics and
functions.
Unit of measurement: The value of indicators needs to be specified by a unit of
measurement (e.g. kilograms, tons, percent, hours)
Type of measurement: Indicators can be measured either quantitatively or
qualitatively and further can be either absolute (e.g. total energy used per year)
or adjusted (e.g. energy used per unit of product per year)
66
Period of measurement: Indicators have to be measured over a defined period
of time (e.g. year, month, work shift)
The listed criteria in Table 7 and characteristics that are listed above are helpful to
select the right indicators and order them appropriately.
3.1.2. Identifying Indicators for Sustainability
According to the three different dimensions of sustainability, environment, social
and economy suitable indicators for each dimension have to be derived. Every
dimension is directly related to specific issue(s).
Issues for Environmental Sustainability
The environmental impact is traditionally the most crucial dimension in terms of
sustainability, and it is the dimension discussed in most detail in the literature. Hence,
a lot of different tools are available that address this dimension and evaluate
environmental sustainability. In general they can be divided into two main issues:
Natural resources: This issue evaluates the use of energy, water and raw
material as well as the amount of waste that is being created during the
production of a product.
Pollution: This issue assesses the contribution of the manufacturing process to
climate change and global warming.
Issues for Social Sustainability
Issues related to the social dimension of sustainability are becoming more and
more important for the public. Therefore, there are different issues that belong to the
social dimension of sustainability:
67
Health and Safety (Human toxicity)
Work satisfaction and development
Equal opportunities and perspectives
However, only health and safety is taken into account with regard to
manufacturing processes. It focuses on the security and wellbeing of employees that
could be exposed to hazardous materials and substances.
Issues for Economic Sustainability
Issues regarding the economic dimension of sustainability are focused on the
financial stability or profit of the evaluated subject. Furthermore, economic
sustainability often includes issues related to investment and expenditures on future
development. Meanwhile, none of those issues relates directly to specific
manufacturing processes and therefore will not directly be included as indicators for
sustainability. However, costs are included as parameters in the CACE-simulation.
After defining the different issues for each dimension of sustainability and the
general criteria for indicators, the next step is to define a number of key indicators that
meet all the criteria. Generally, this research aims to use quantitative indicators, since
they are more objective and less biased than qualitative ones. It should also be possible
to express each indicator in relative terms and not only in absolute terms to ensure that
manufacturing steps can be compared easily. The identified key indicators for this
framework are summarized in Table 8.
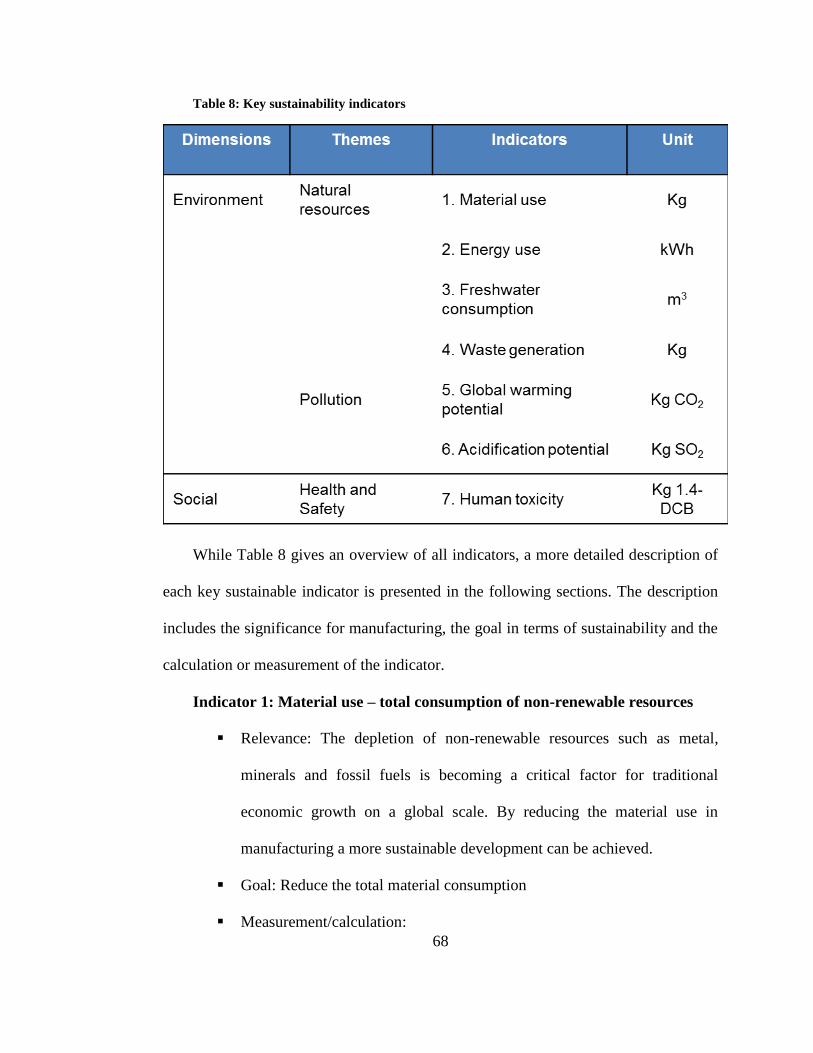
68
Table 8: Key sustainability indicators
While Table 8 gives an overview of all indicators, a more detailed description of
each key sustainable indicator is presented in the following sections. The description
includes the significance for manufacturing, the goal in terms of sustainability and the
calculation or measurement of the indicator.
Indicator 1: Material use – total consumption of non-renewable resources
Relevance: The depletion of non-renewable resources such as metal,
minerals and fossil fuels is becoming a critical factor for traditional
economic growth on a global scale. By reducing the material use in
manufacturing a more sustainable development can be achieved.
Goal: Reduce the total material consumption
Measurement/calculation:
69
The total consumption of non-renewable resources is measured by adding
up all material that is used within one manufacturing step.
Indicator 2: Energy use – total consumption of non-renewable energy
resources
Relevance: A main goal for sustainable manufacturing is to reduce the
energy consumption of non-renewable resources such as coal and other
fossil fluids. More efficient manufacturing processes and switching to
renewable energy resources, such as sun or wind. Moreover, energy from
non-renewable resources is directly related to increasing air pollution,
depletion of fossil fuels and global warming. As explained in chapter 2,
manufacturing processes are often very energy intensive, which makes
this indicator so significant for this framework.
Goal: Reduce the energy consumption
Measurement/Calculation: The energy use can be measured with different
devices, if the power supply is accessible. In case the power supply is not
accessible, the energy use can be roughly calculated by measuring cycle
time and multiplying it with the theoretical maximal energy demand given
by the manufacturer of the machine.
Indicator 3: Waste generation – total generation
Relevance: According to EUROSTAT, the United States generates
7,080,000 thousand tons annually only during manufacturing/production
(Twardowska et al. 2004). Similar amounts of waste are generated in
70
countries all over the world. This high amount of waste causes major
environmental problems such as pollution and the release of toxic
substances that cause harm to humans and the ecosystem.
Goal: Reduce the waste generation
Measurement/ Calculation: The amount of solid waste generated per
process unit. The waste is either measured directly or by measured using
the weight the blank part before manufacturing and afterwards. The
weight difference is used to measure the generated waste.
Indicator 4: Global Warming Potential (GWP)
Relevance: Global warming potential measures the contribution of a
particular gas to global warming, by comparing this gas on a relative scale
with carbon dioxide. As shown in Table 9 , carbon dioxide is assigned to a
GWP value of 1. Global warming is related to warming up sea water and
melting glaciers, which changes the earth ecosystem significantly.
Manufacturing often contributes large amount of emissions to global
warming.
Goal: Reduce emissions and slow down the process of global warming
Measurement/ Calculation: GWP is difficult to measure. However, the
GWP can be calculated by measuring the quantity of emission released
during the manufacturing process and multiplying it with the equivalent
factor of that emission relative to carbon dioxide (see Table 9). This
calculation is often done within the used LCA-Software packages.
Indicator 5: Acidification potential (AP)
71
Relevance: Acidification potential measures the contribution to the
acidification of a particular gas and compares it at a relative scale with
sulfur dioxide. As shown in Table 9, sulfur dioxide is assigned a value of
1. Gases with acidification potential can be absorbed by plants and soils,
which then lead to decreased biomass and poor soil quality. Furthermore,
surface water may be acidified, resulting in poor water quality.
Goal: Reduce emissions of acid gases.
Calculation/Measurement: AP is difficult to measure. However, the AP
can be calculated by measuring the quantity of emission released during
the manufacturing process and multiplying it with the equivalent factor of
that emission relative to sulfur dioxide (see Table 9). This calculation is
often done within the used LCA-Software packages.
Indicator 6: Human Toxicity (HT)
Relevance: Hazardous materials are mainly chemicals or mixtures of
chemicals that are toxic, flammable or can cause other injury to humans.
In order to protect worker’s health and safety they should be protected
from those types of materials.
Goal: Reduce usage of hazardous material.
Calculation/Measurement: HT is difficult to measure. HT describes the
expected health effects of materials depending on the concentration and
probability of effects. This calculation is often done within the used LCA-
Software packages
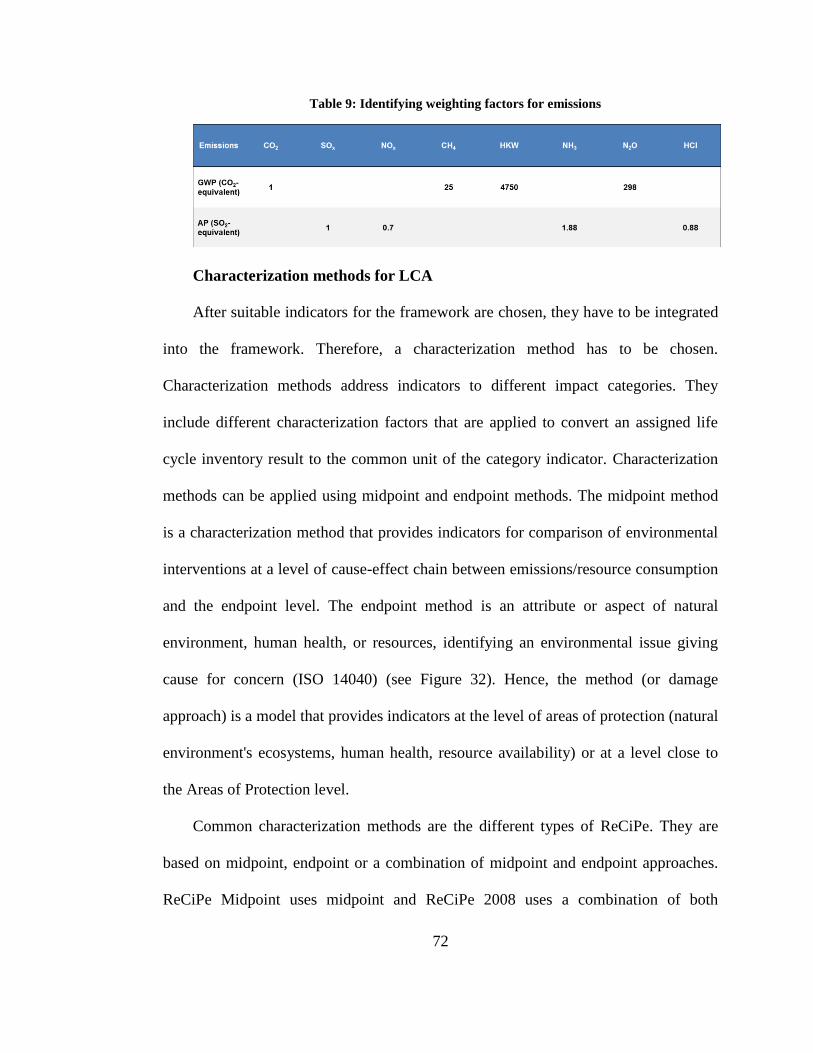
72
Table 9: Identifying weighting factors for emissions
Characterization methods for LCA
After suitable indicators for the framework are chosen, they have to be integrated
into the framework. Therefore, a characterization method has to be chosen.
Characterization methods address indicators to different impact categories. They
include different characterization factors that are applied to convert an assigned life
cycle inventory result to the common unit of the category indicator. Characterization
methods can be applied using midpoint and endpoint methods. The midpoint method
is a characterization method that provides indicators for comparison of environmental
interventions at a level of cause-effect chain between emissions/resource consumption
and the endpoint level. The endpoint method is an attribute or aspect of natural
environment, human health, or resources, identifying an environmental issue giving
cause for concern (ISO 14040) (see Figure 32). Hence, the method (or damage
approach) is a model that provides indicators at the level of areas of protection (natural
environment's ecosystems, human health, resource availability) or at a level close to
the Areas of Protection level.
Common characterization methods are the different types of ReCiPe. They are
based on midpoint, endpoint or a combination of midpoint and endpoint approaches.
ReCiPe Midpoint uses midpoint and ReCiPe 2008 uses a combination of both
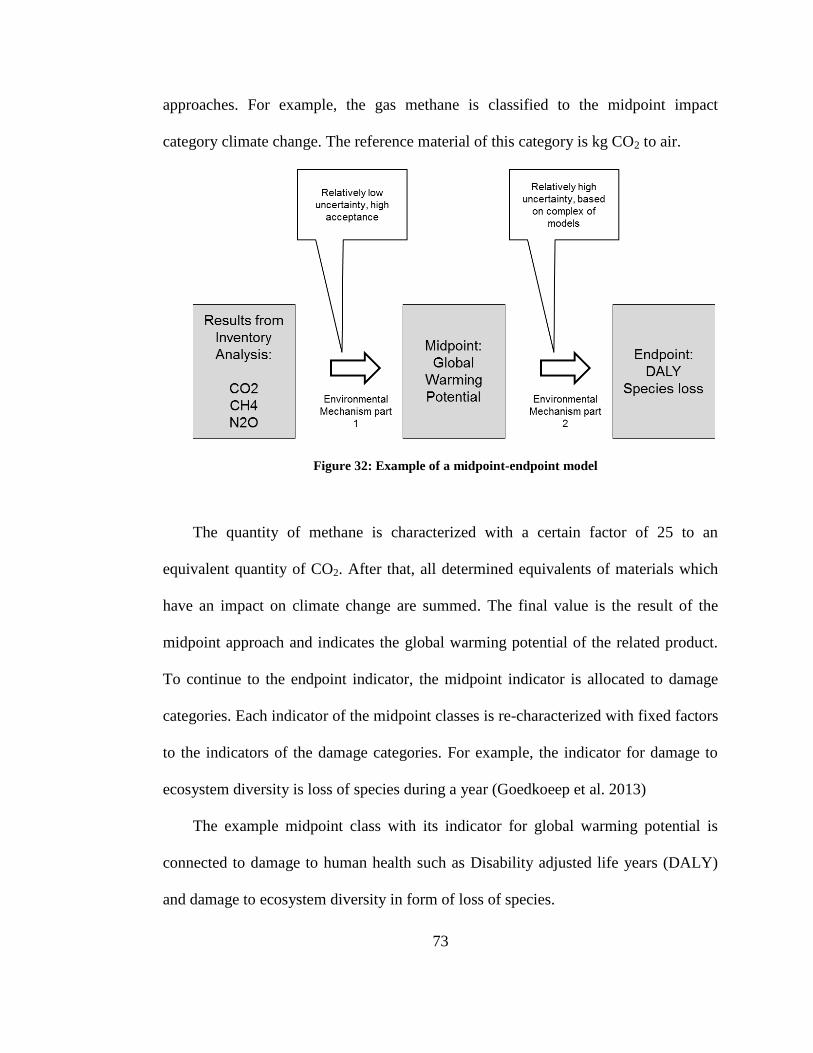
73
approaches. For example, the gas methane is classified to the midpoint impact
category climate change. The reference material of this category is kg CO2 to air.
Figure 32: Example of a midpoint-endpoint model
The quantity of methane is characterized with a certain factor of 25 to an
equivalent quantity of CO2. After that, all determined equivalents of materials which
have an impact on climate change are summed. The final value is the result of the
midpoint approach and indicates the global warming potential of the related product.
To continue to the endpoint indicator, the midpoint indicator is allocated to damage
categories. Each indicator of the midpoint classes is re-characterized with fixed factors
to the indicators of the damage categories. For example, the indicator for damage to
ecosystem diversity is loss of species during a year (Goedkoeep et al. 2013)
The example midpoint class with its indicator for global warming potential is
connected to damage to human health such as Disability adjusted life years (DALY)
and damage to ecosystem diversity in form of loss of species.
74
The last step of the ReCiPe endpoint method is called normalization. The
endpoint damage indicators are converted to the unit points with weighting factors
(Althaus et al. 2010). The factors depend on three different cultural perspectives. The
individualist is optimistic that future technology is able to solve today's problems. In
contrast to that, the egalitarian is cautious and rates impacts more negatively. In the
middle lies the hierarchist perspective (Goedkoop 2014). As this is the weighting
which is often used in scientific models, the hierarchist perspective is applied in this
study, too. After the normalization process, one point represents the thousandth part of
the annual ecological load of an average European (Herrmann 2010).
The existence of methods addressing midpoints and others addressing endpoints
is justified and is legitimate given that the choice of method is intricately linked to the
product/activity under assessment. However, for this research the ReCiPe Midpoint
approach is chosen, since this approach is highly accepted for scientific research
because of the relatively low uncertainty. Furthermore, this approach expresses the
environmental impact in reference indicators such as m3, kg CO2, kg SO2 or 1.4-
Dichlorobenzene (DCB) and can be compared more easily with other references.
According to the indicators in Table 8, following indicators were selected from the
ReCiPe Midpoint approach:
Climate change, Global Warming Potential (GWP100) in kg CO2 equivalent
Human toxicity (HT) in kg 1.4.DCB equivalent
Acidification potential (AP100), AP 100 in kg SO2 equivalent
All other indicators, such as material use, waste generation and energy consumption
can be derived directly and do not need an equivalent ReCiPe indicator.
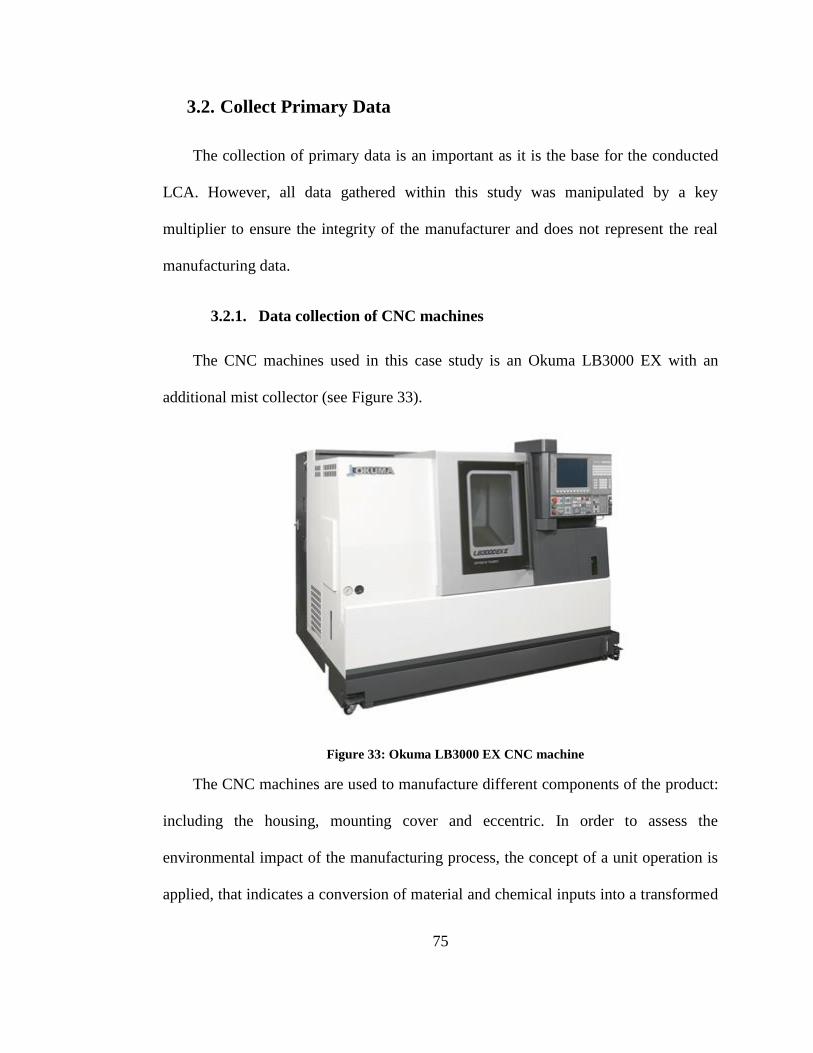
75
3.2. Collect Primary Data
The collection of primary data is an important as it is the base for the conducted
LCA. However, all data gathered within this study was manipulated by a key
multiplier to ensure the integrity of the manufacturer and does not represent the real
manufacturing data.
3.2.1. Data collection of CNC machines
The CNC machines used in this case study is an Okuma LB3000 EX with an
additional mist collector (see Figure 33).
Figure 33: Okuma LB3000 EX CNC machine
The CNC machines are used to manufacture different components of the product:
including the housing, mounting cover and eccentric. In order to assess the
environmental impact of the manufacturing process, the concept of a unit operation is
applied, that indicates a conversion of material and chemical inputs into a transformed
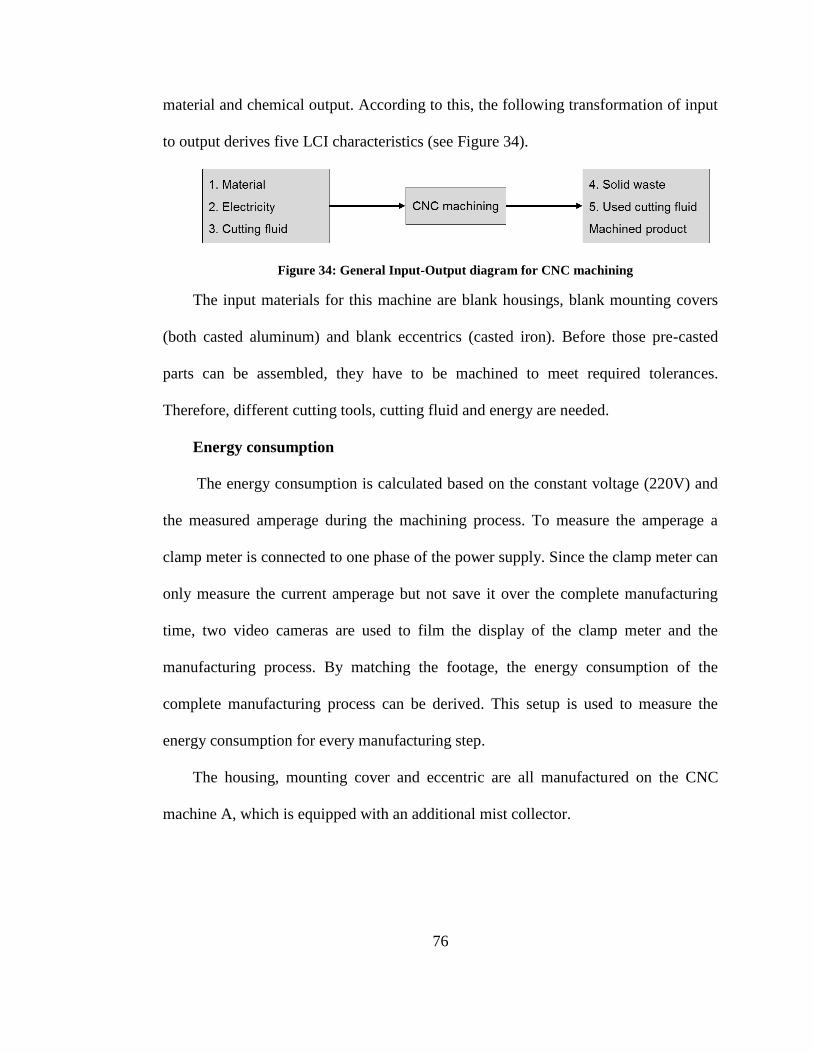
76
material and chemical output. According to this, the following transformation of input
to output derives five LCI characteristics (see Figure 34).
Figure 34: General Input-Output diagram for CNC machining
The input materials for this machine are blank housings, blank mounting covers
(both casted aluminum) and blank eccentrics (casted iron). Before those pre-casted
parts can be assembled, they have to be machined to meet required tolerances.
Therefore, different cutting tools, cutting fluid and energy are needed.
Energy consumption
The energy consumption is calculated based on the constant voltage (220V) and
the measured amperage during the machining process. To measure the amperage a
clamp meter is connected to one phase of the power supply. Since the clamp meter can
only measure the current amperage but not save it over the complete manufacturing
time, two video cameras are used to film the display of the clamp meter and the
manufacturing process. By matching the footage, the energy consumption of the
complete manufacturing process can be derived. This setup is used to measure the
energy consumption for every manufacturing step.
The housing, mounting cover and eccentric are all manufactured on the CNC
machine A, which is equipped with an additional mist collector.
77
Material usage and solid waste generation
To measure the material usage all blank components are weighed on a scale
before they are machined. After the machining all components are weighed again, and
the difference of weight is accounted as waste. In the case study, most of the waste is
scrap metal. Since most of the blank components have slightly different weight and
dimensions for each component, five samples were measured. Based on the
measurements of the different samples, a mean value for each component and
manufacturing process is derived.
Cutting fluid consumption
The fluid is used as a coolant and also lubricates the cutting surfaces. It is
difficult to measure the cutting fluid consumption because it is constantly recycled
within the CNC machine until the properties of the fluid become inadequate.
Moreover, due to other losses such as evaporation and spillage, the cutting fluid has to
be replenished on a regular basis. To estimate the cutting fluid consumption, an
approach by Clarens et al. was chosen. It is assumed that the number of parts produced
per unit time will not vary depending on the cutting fluid replacement. In Clarens
approach, the machining time associated with one year of manufacturing and is based
on a schedule of 102 hours of machining per week. The CNC machine used in his
studies was equipped with a 208 L (55 gallon) tank to provide cutting fluid to the
cutting zone. The 208L/machine is recycled within the process until it is disposed of
after two weeks. Assuming cutting fluid is used 204 hr/ 2 weeks, then the cutting fluid
loss is 208L per (204*60) minute, which is 0.017 L/min or about 17 g/min as the
effective loss of cutting fluid due to degradation (Clarens et al. 2008).
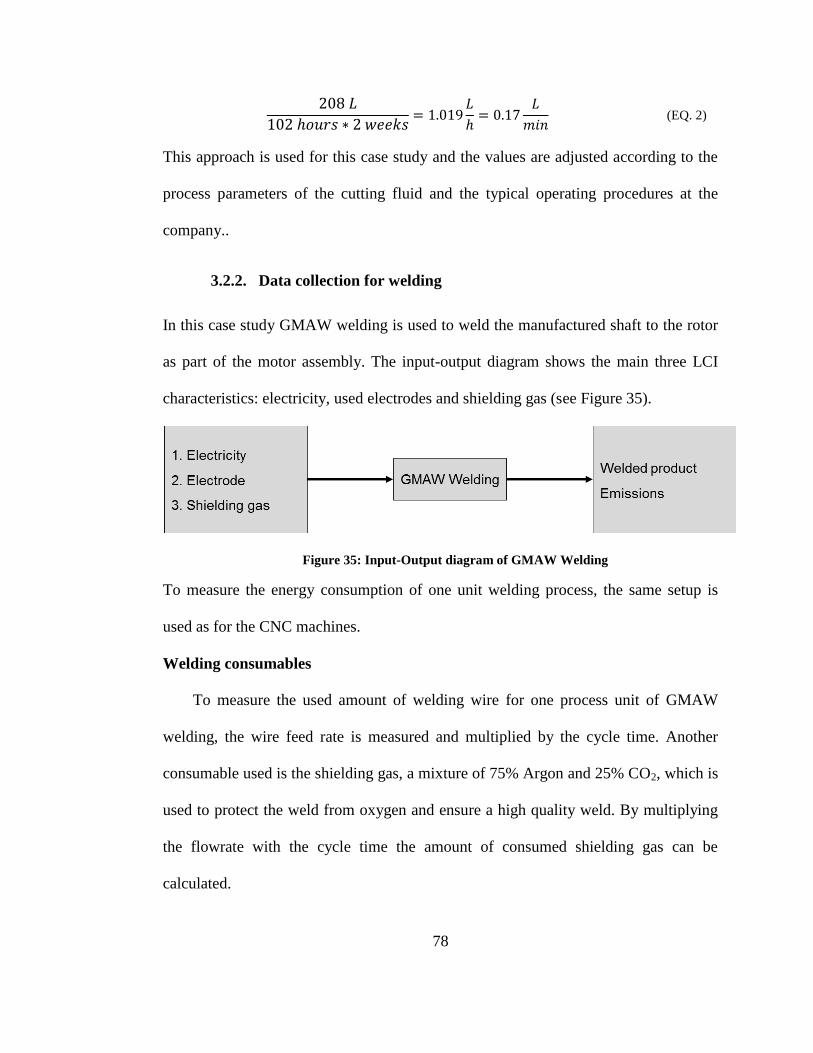
78
208 𝐿
102 ℎ𝑜𝑢𝑟𝑠 ∗ 2 𝑤𝑒𝑒𝑘𝑠= 1.019
𝐿
ℎ= 0.17
𝐿
𝑚𝑖𝑛 (EQ. 2)
This approach is used for this case study and the values are adjusted according to the
process parameters of the cutting fluid and the typical operating procedures at the
company..
3.2.2. Data collection for welding
In this case study GMAW welding is used to weld the manufactured shaft to the rotor
as part of the motor assembly. The input-output diagram shows the main three LCI
characteristics: electricity, used electrodes and shielding gas (see Figure 35).
Figure 35: Input-Output diagram of GMAW Welding
To measure the energy consumption of one unit welding process, the same setup is
used as for the CNC machines.
Welding consumables
To measure the used amount of welding wire for one process unit of GMAW
welding, the wire feed rate is measured and multiplied by the cycle time. Another
consumable used is the shielding gas, a mixture of 75% Argon and 25% CO2, which is
used to protect the weld from oxygen and ensure a high quality weld. By multiplying
the flowrate with the cycle time the amount of consumed shielding gas can be
calculated.
79
3.2.3. Data collection of painting process
The product is painted with a paint spray gun which uses compressed air to
spread the lacquer on the component. To calculate the amount of lacquer that is used
for one process unit, the paint jar attached to the paint gun is filled up with paint and
the weight is measured on a scale, then the product is painted and after that the jar gets
weighed again. In order to avoid inaccuracies this process is repeated five times and an
average consumption is calculated.
3.3. Selecting Appropriate LCA Software
As mentioned in Chapter 2, there is different software available for LCA.
Although they all fulfill the purpose of supporting the user to conduct a Life Cycle
Assessment, they differ in price and optional functions. This comparison includes the
educational versions of Umberto NXT LCA, GaBi and the full version of openLCA.
Collecting data to conduct an LCA can be very time consuming and expensive, so it is
helpful to access generic data to fill in data gap. Data may be collected and transferred
to the software manually or automatically imported from a database via an interface.
In such databases are independent from the LCA-Software and have to be integrated
into the software. LCA data are based on product and elementary flows, which are
related to environmental effects in the form of emissions. These flows are often
multiple linked to additional data sets such as inputs and outputs for energy supply,
transport, chemicals, materials and manufacturing processes. Some data bases are
available for free, while others have to be bought. The most important free available
80
LCA databases are: the European Reference Life Cycle Database (ELCD), the
National Renewable Energy Laboratory Data Base (NREL) and the New Energy
Externalities Developments for Sustainability (NEEDS). One of the world's leading
commercial databases is the Ecoinvent Database. Ecoinvent includes more than 9000
generic data sets.
In the following chapter, three of the most common LCA software tools
(OpenLCA, GaBi, Umberto NXT LCA) will be presented and evaluated by the
following criteria:
Availability of free or educational licenses (1): Costs can often be the first
burden for small companies when trying new methods. Moreover, since the
intention is to use this software for research purposes an educational option is
useful.
Includes extensive database (2): As mentioned in Chapter 2, data collection
can be difficult and very time consuming. Existing databases that include
generic data such as emissions to air due to the production of electricity can fill
in gaps where collecting data is impossible or very time consuming.
Easy import of databases (3): Some software tools do not include database
from the beginning, however they have the option to import external databases.
User friendliness and flexibility (4): LCA tools should have a user friendly
interface that is comparable to common software such as Microsoft Office. The
amount of time to learn how to use the software should be appropriate to the
results you can achieve with this software.
81
Transparency (5): LCA calculations should be transparent for the user to track
down each result in order to find mistakes.
Each tool is tested by working through available tutorials and on a custom product.
Then, based on the criteria above, each software is evaluated.
GaBi
GaBi was developed by PE International. A trial version is available for free
but can only be used for 30 days. Furthermore, it only includes a “test” database that is
not based on real measurement or calculations. The price for the full version is about
$1000 and has to be paid on an annual basis(1). Besides that, an educational version is
available that allows students and universities to use an educational version of GaBi
for free. This version includes a smaller version of GaBis own database, which makes
an import of an external database unnecessary (2,3).
Before developing the first product system, the Gabi database has to be
activated and a project plan has to be created. On this plan object from the database
can be pasted and connected with arrows. A search function helps to find the right
process easily. In addition, custom processes can be created. Therefore, all materials
used have to be identified manually. Different processes are connected with each other
by product or waste flows. The available tutorial of a paper clip helps new users get
started (see Figure 36). In addition, there are video tutorials available that explain step
by step how to use the software. While the design of the main interface is very user
friendly, adding new processes and connecting them can be complicated and time
consuming (4). The main reason for this is that the program does not tolerate small
mistakes. Whenever user individual processes or materials are created the limited
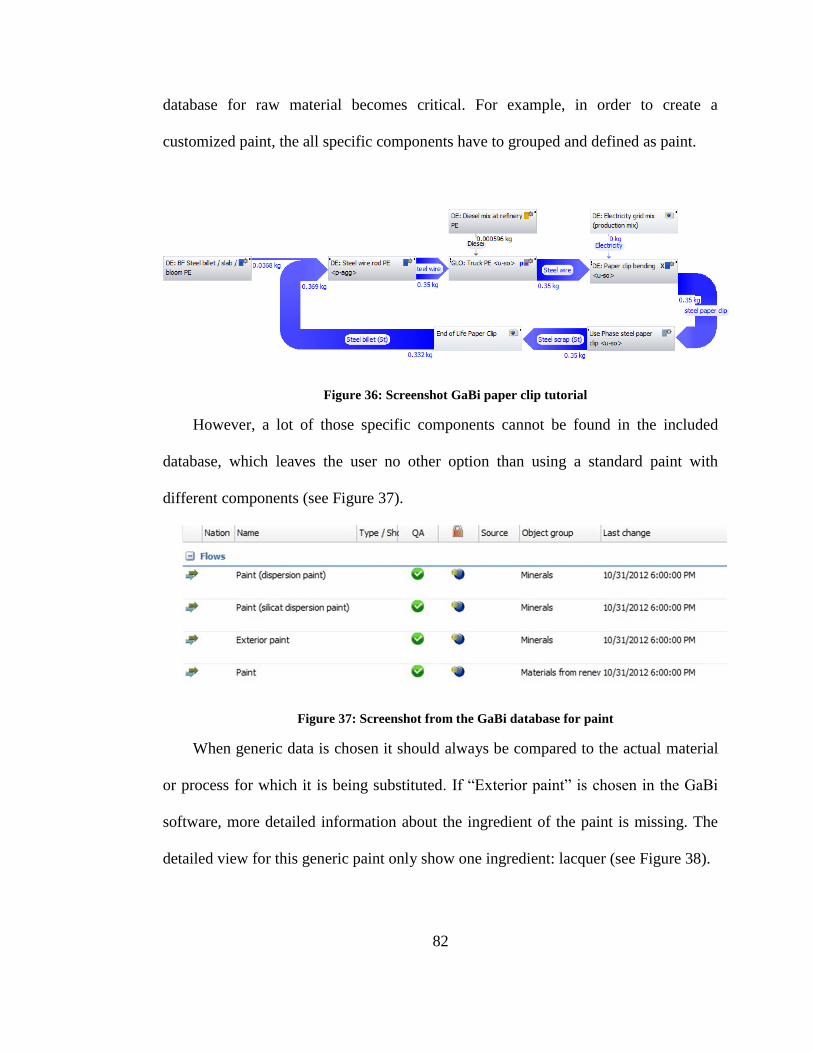
82
database for raw material becomes critical. For example, in order to create a
customized paint, the all specific components have to grouped and defined as paint.
Figure 36: Screenshot GaBi paper clip tutorial
However, a lot of those specific components cannot be found in the included
database, which leaves the user no other option than using a standard paint with
different components (see Figure 37).
Figure 37: Screenshot from the GaBi database for paint
When generic data is chosen it should always be compared to the actual material
or process for which it is being substituted. If “Exterior paint” is chosen in the GaBi
software, more detailed information about the ingredient of the paint is missing. The
detailed view for this generic paint only show one ingredient: lacquer (see Figure 38).
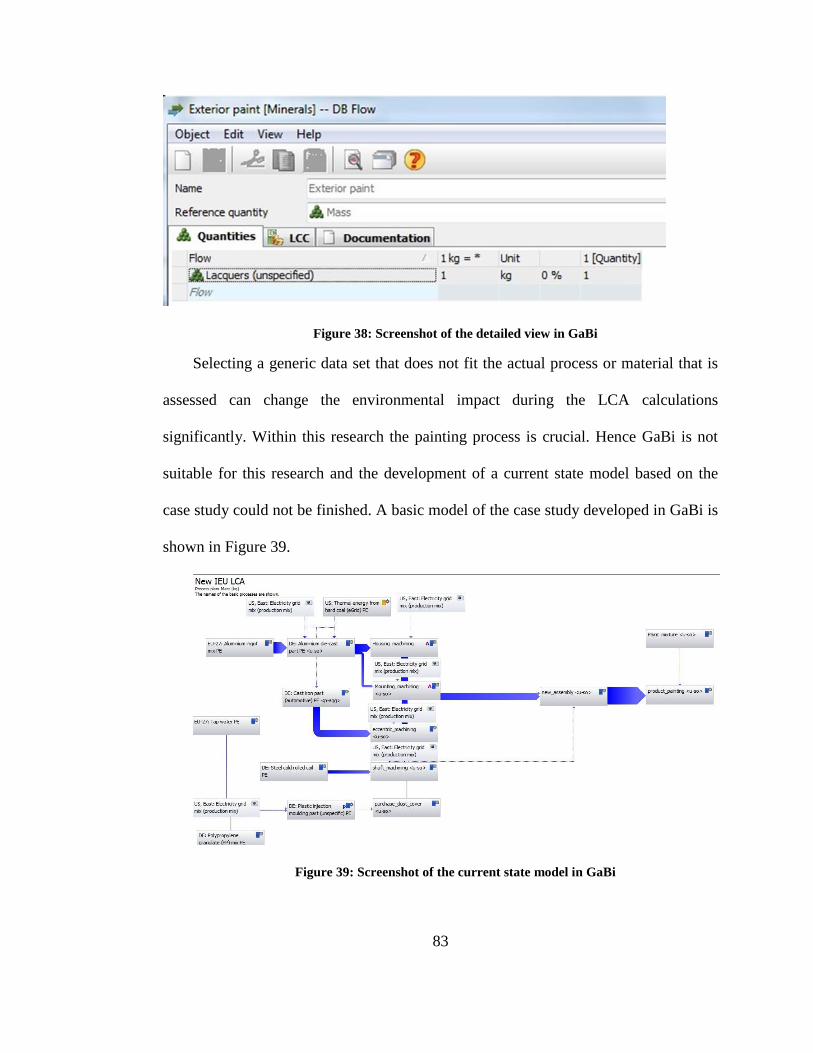
83
Figure 38: Screenshot of the detailed view in GaBi
Selecting a generic data set that does not fit the actual process or material that is
assessed can change the environmental impact during the LCA calculations
significantly. Within this research the painting process is crucial. Hence GaBi is not
suitable for this research and the development of a current state model based on the
case study could not be finished. A basic model of the case study developed in GaBi is
shown in Figure 39.
Figure 39: Screenshot of the current state model in GaBi
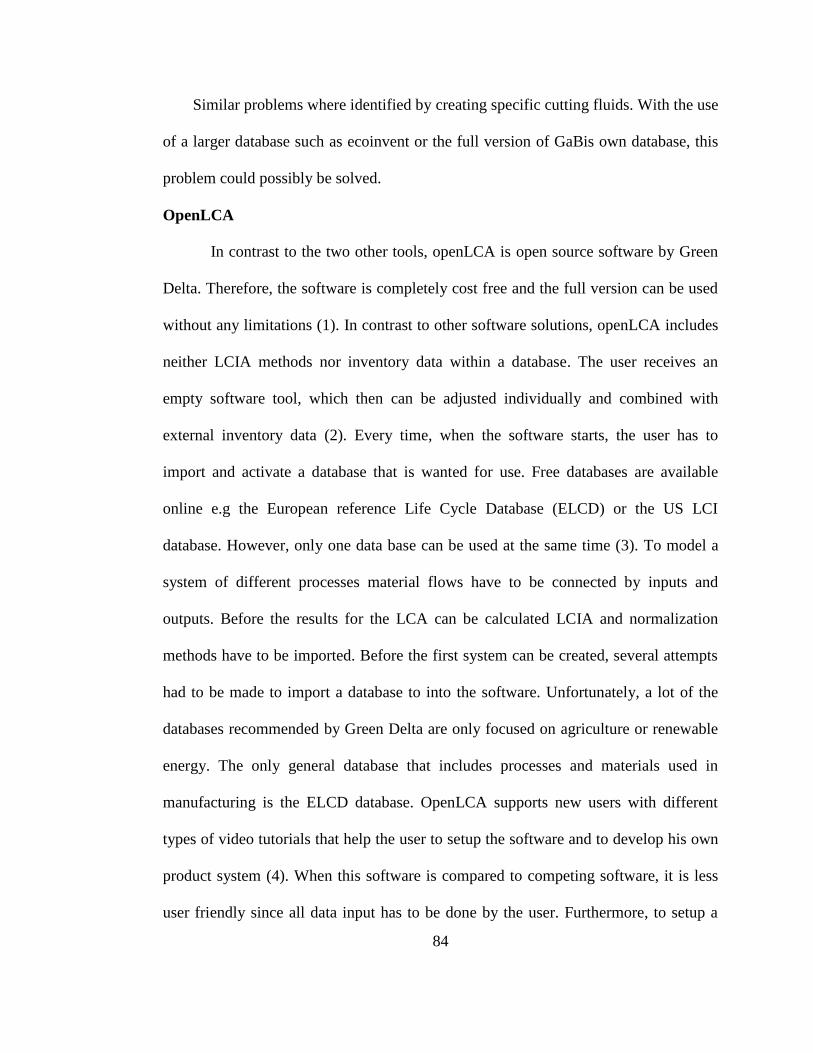
84
Similar problems where identified by creating specific cutting fluids. With the use
of a larger database such as ecoinvent or the full version of GaBis own database, this
problem could possibly be solved.
OpenLCA
In contrast to the two other tools, openLCA is open source software by Green
Delta. Therefore, the software is completely cost free and the full version can be used
without any limitations (1). In contrast to other software solutions, openLCA includes
neither LCIA methods nor inventory data within a database. The user receives an
empty software tool, which then can be adjusted individually and combined with
external inventory data (2). Every time, when the software starts, the user has to
import and activate a database that is wanted for use. Free databases are available
online e.g the European reference Life Cycle Database (ELCD) or the US LCI
database. However, only one data base can be used at the same time (3). To model a
system of different processes material flows have to be connected by inputs and
outputs. Before the results for the LCA can be calculated LCIA and normalization
methods have to be imported. Before the first system can be created, several attempts
had to be made to import a database to into the software. Unfortunately, a lot of the
databases recommended by Green Delta are only focused on agriculture or renewable
energy. The only general database that includes processes and materials used in
manufacturing is the ELCD database. OpenLCA supports new users with different
types of video tutorials that help the user to setup the software and to develop his own
product system (4). When this software is compared to competing software, it is less
user friendly since all data input has to be done by the user. Furthermore, to setup a
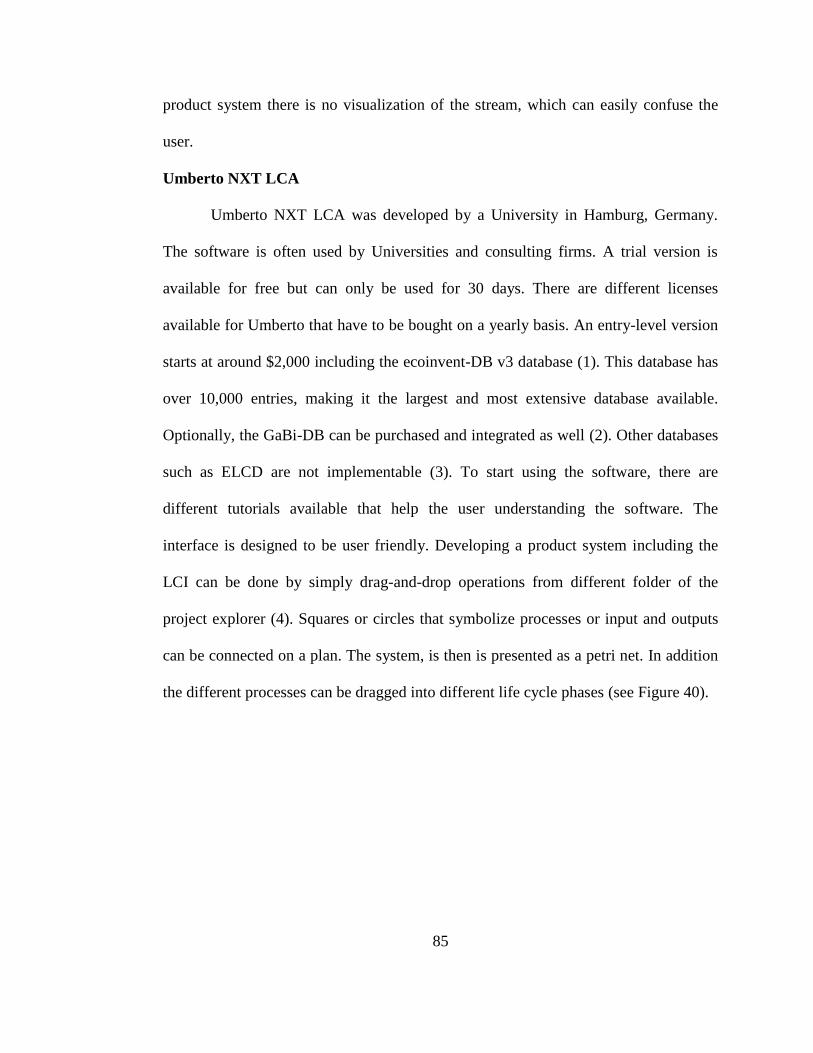
85
product system there is no visualization of the stream, which can easily confuse the
user.
Umberto NXT LCA
Umberto NXT LCA was developed by a University in Hamburg, Germany.
The software is often used by Universities and consulting firms. A trial version is
available for free but can only be used for 30 days. There are different licenses
available for Umberto that have to be bought on a yearly basis. An entry-level version
starts at around $2,000 including the ecoinvent-DB v3 database (1). This database has
over 10,000 entries, making it the largest and most extensive database available.
Optionally, the GaBi-DB can be purchased and integrated as well (2). Other databases
such as ELCD are not implementable (3). To start using the software, there are
different tutorials available that help the user understanding the software. The
interface is designed to be user friendly. Developing a product system including the
LCI can be done by simply drag-and-drop operations from different folder of the
project explorer (4). Squares or circles that symbolize processes or input and outputs
can be connected on a plan. The system, is then is presented as a petri net. In addition
the different processes can be dragged into different life cycle phases (see Figure 40).
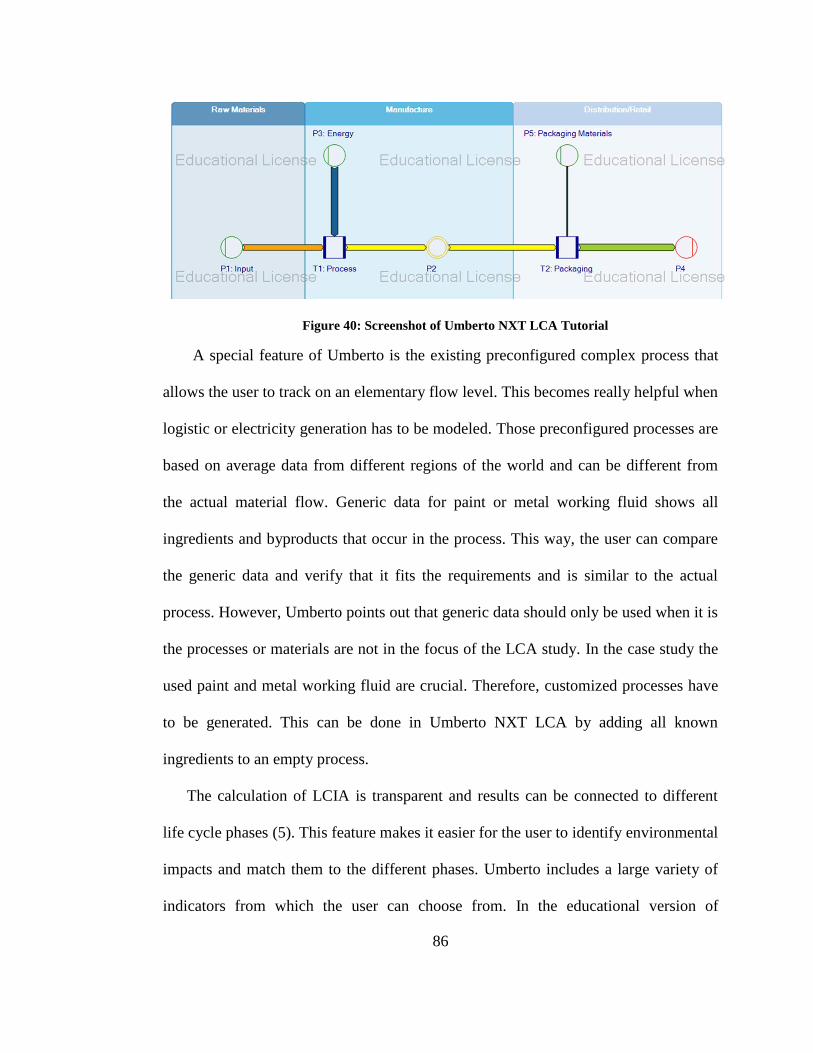
86
Figure 40: Screenshot of Umberto NXT LCA Tutorial
A special feature of Umberto is the existing preconfigured complex process that
allows the user to track on an elementary flow level. This becomes really helpful when
logistic or electricity generation has to be modeled. Those preconfigured processes are
based on average data from different regions of the world and can be different from
the actual material flow. Generic data for paint or metal working fluid shows all
ingredients and byproducts that occur in the process. This way, the user can compare
the generic data and verify that it fits the requirements and is similar to the actual
process. However, Umberto points out that generic data should only be used when it is
the processes or materials are not in the focus of the LCA study. In the case study the
used paint and metal working fluid are crucial. Therefore, customized processes have
to be generated. This can be done in Umberto NXT LCA by adding all known
ingredients to an empty process.
The calculation of LCIA is transparent and results can be connected to different
life cycle phases (5). This feature makes it easier for the user to identify environmental
impacts and match them to the different phases. Umberto includes a large variety of
indicators from which the user can choose from. In the educational version of
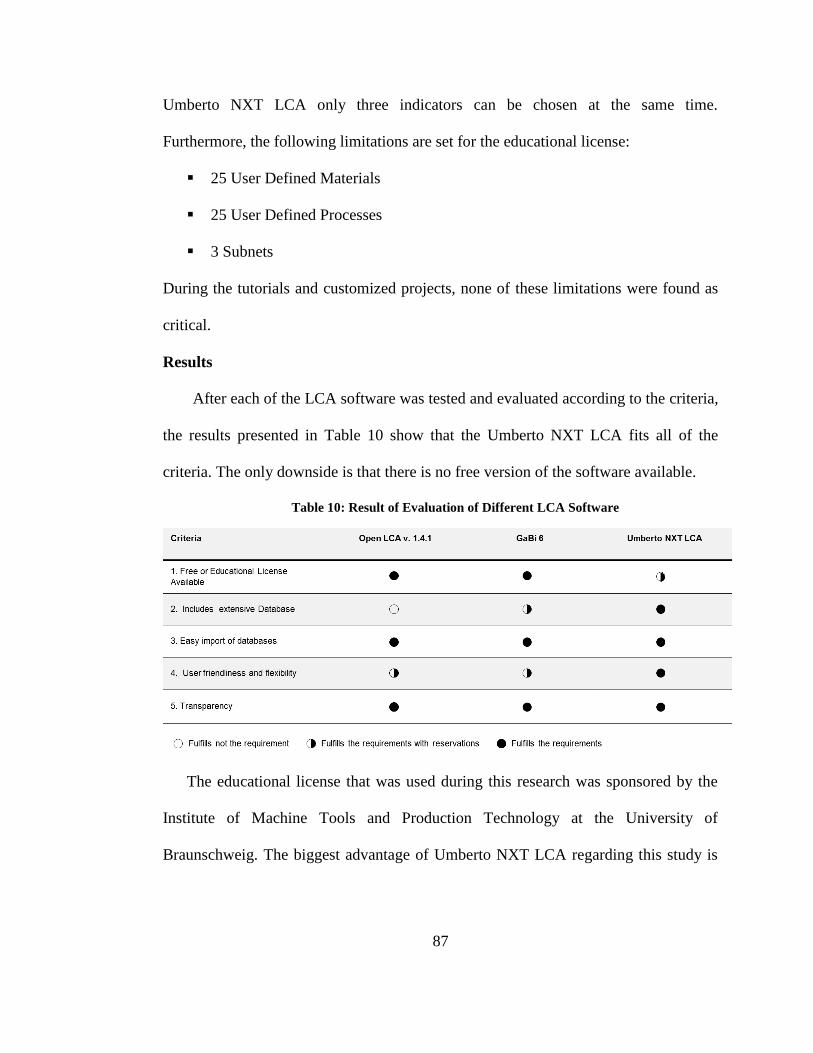
87
Umberto NXT LCA only three indicators can be chosen at the same time.
Furthermore, the following limitations are set for the educational license:
25 User Defined Materials
25 User Defined Processes
3 Subnets
During the tutorials and customized projects, none of these limitations were found as
critical.
Results
After each of the LCA software was tested and evaluated according to the criteria,
the results presented in Table 10 show that the Umberto NXT LCA fits all of the
criteria. The only downside is that there is no free version of the software available.
Table 10: Result of Evaluation of Different LCA Software
The educational license that was used during this research was sponsored by the
Institute of Machine Tools and Production Technology at the University of
Braunschweig. The biggest advantage of Umberto NXT LCA regarding this study is
88
that the included ecoinvent database provided a large variety of generic data, while
other software include a smaller database or no database at all.
3.4. Selecting CACE Software
As mentioned in Chapter 2, CACE software can help to estimate manufacturing
costs, which becomes necessary when no real cost measurement is available. This can
be the case when changes in the design of the product or the manufacturing processes
are made. By including CACE software in this framework, costs can be estimated and
compared with the environmental impact whenever there is no real cost data available.
Based on the case study, basic requirements for CACE software can be derived. This
section compares the aPriori, Concurrent Costing 2.3 and Siemens Pro Calc as
examples of CACE software and evaluates their suitability for this research.
For the evaluation five criteria are determined in order to select software that
allows the most accurate simulation of case study. To derive accurate results the
individual adaption of the manufacturing steps is very important. An import from 3D
CAD data makes the cost analysis easier, since geometric data is available and no
manual entry is needed. For the purpose of this research it is important that the CACE
software includes the calculation of the needed inventory material. Furthermore, the
calculation of cycle times is important, since the cycle time is essential to calculate
labor costs. As the last criterion, it is important that the software is easy to use and
supports the user during the optimization process. This means, that the software
supports the user during the selection of material and assists to discover weaknesses in
the process. If a criterion satisfied to the full extent, the software is rewarded with a
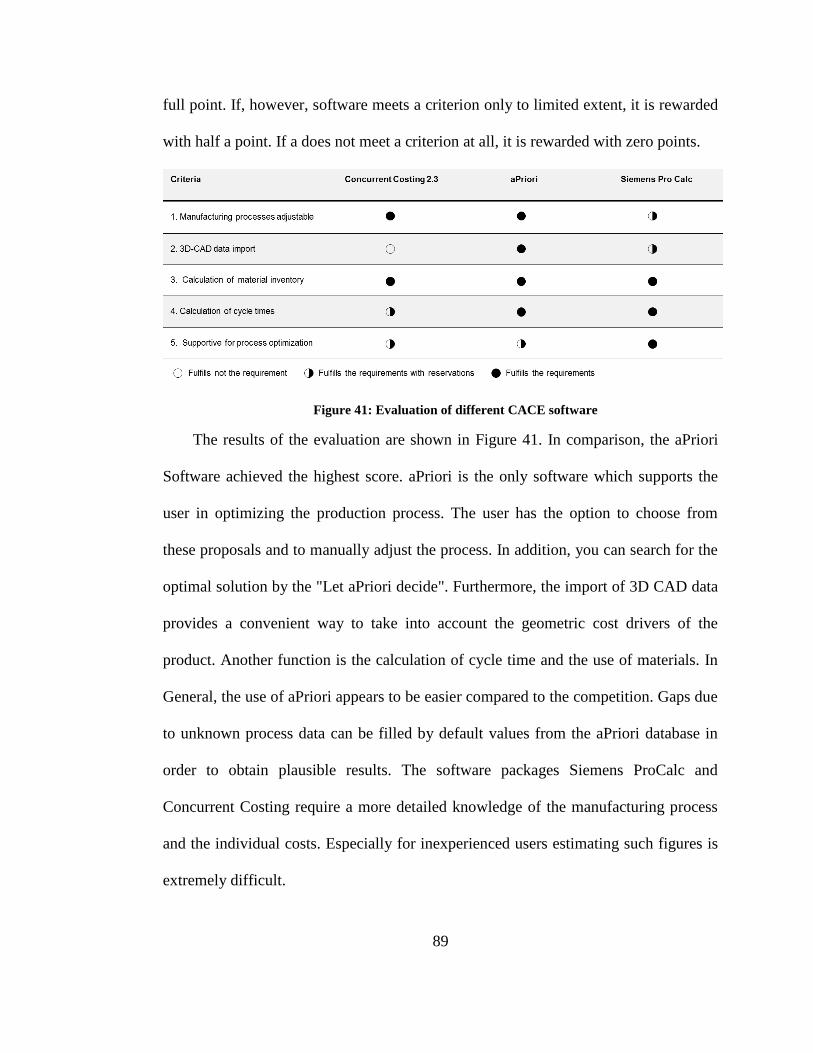
89
full point. If, however, software meets a criterion only to limited extent, it is rewarded
with half a point. If a does not meet a criterion at all, it is rewarded with zero points.
Figure 41: Evaluation of different CACE software
The results of the evaluation are shown in Figure 41. In comparison, the aPriori
Software achieved the highest score. aPriori is the only software which supports the
user in optimizing the production process. The user has the option to choose from
these proposals and to manually adjust the process. In addition, you can search for the
optimal solution by the "Let aPriori decide". Furthermore, the import of 3D CAD data
provides a convenient way to take into account the geometric cost drivers of the
product. Another function is the calculation of cycle time and the use of materials. In
General, the use of aPriori appears to be easier compared to the competition. Gaps due
to unknown process data can be filled by default values from the aPriori database in
order to obtain plausible results. The software packages Siemens ProCalc and
Concurrent Costing require a more detailed knowledge of the manufacturing process
and the individual costs. Especially for inexperienced users estimating such figures is
extremely difficult.
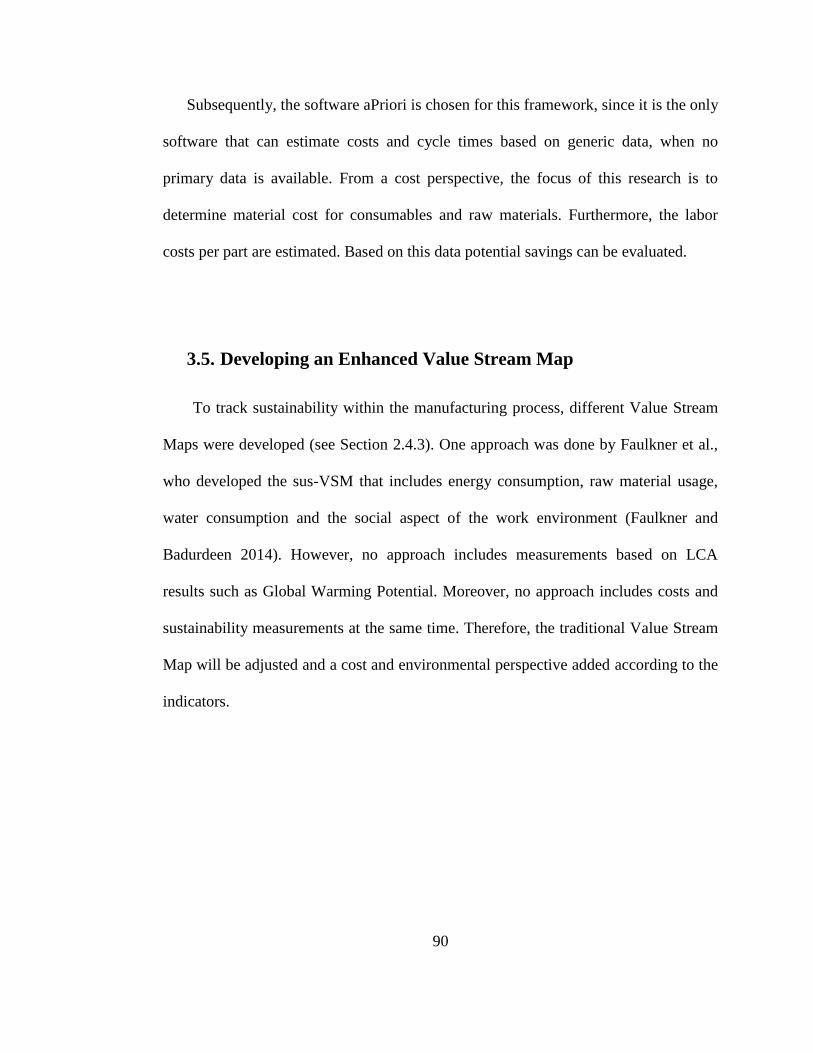
90
Subsequently, the software aPriori is chosen for this framework, since it is the only
software that can estimate costs and cycle times based on generic data, when no
primary data is available. From a cost perspective, the focus of this research is to
determine material cost for consumables and raw materials. Furthermore, the labor
costs per part are estimated. Based on this data potential savings can be evaluated.
3.5. Developing an Enhanced Value Stream Map
To track sustainability within the manufacturing process, different Value Stream
Maps were developed (see Section 2.4.3). One approach was done by Faulkner et al.,
who developed the sus-VSM that includes energy consumption, raw material usage,
water consumption and the social aspect of the work environment (Faulkner and
Badurdeen 2014). However, no approach includes measurements based on LCA
results such as Global Warming Potential. Moreover, no approach includes costs and
sustainability measurements at the same time. Therefore, the traditional Value Stream
Map will be adjusted and a cost and environmental perspective added according to the
indicators.
91
Figure 42: Example of the adjusted VSM
As it can be seen in Figure 42, in the adjusted VSM, the traditional measures such
as cycle time (CT), change over time (C/O) and Uptime are shown in the first box
underneath. The next box includes the results of the LCA. In the last box the costs are
presented.
CT (s)=
C/O( min)=
Uptime (%)=
Material use (kg)=
Waste generation (kg)=
Energy use (kWh)=
GWP (kg CO2 eq.)=
AP (kg SO2 eq.)=
HT (kg 1.4 DCB eq.)=
Cost ($)= 23.86
2304.18
71.53
Machining Housing
110
40
88
200
3583
220
7732.93
0 0
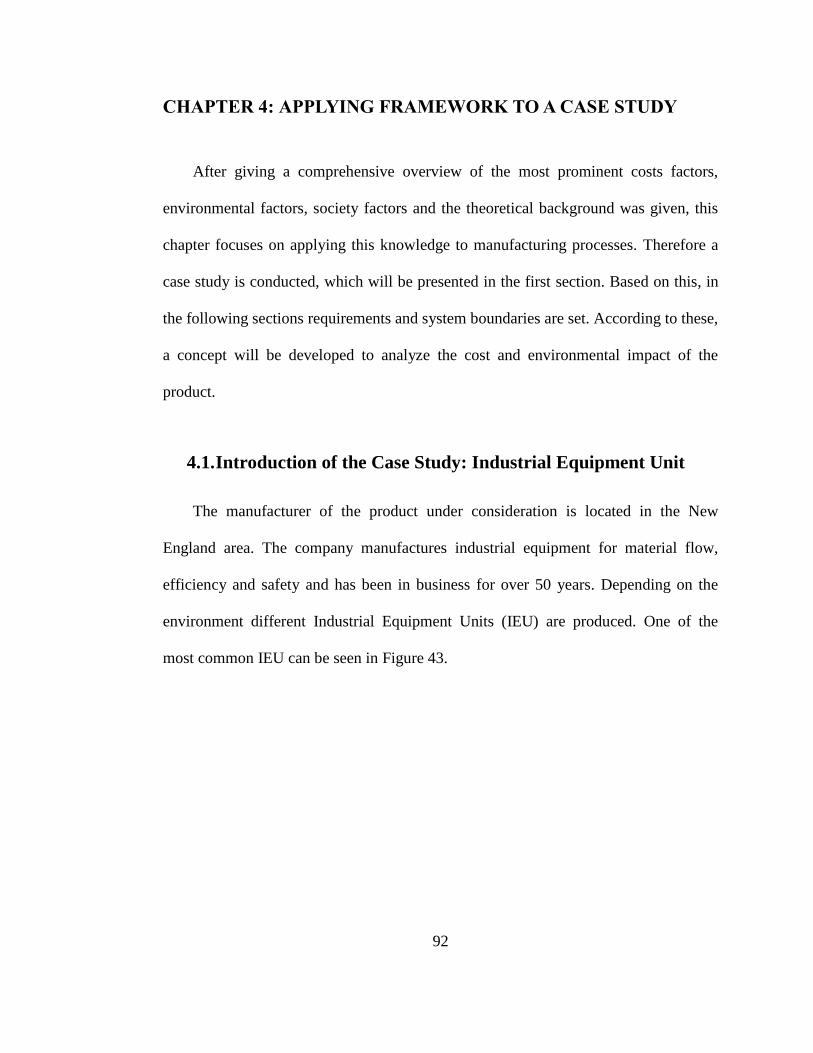
92
CHAPTER 4: APPLYING FRAMEWORK TO A CASE STUDY
After giving a comprehensive overview of the most prominent costs factors,
environmental factors, society factors and the theoretical background was given, this
chapter focuses on applying this knowledge to manufacturing processes. Therefore a
case study is conducted, which will be presented in the first section. Based on this, in
the following sections requirements and system boundaries are set. According to these,
a concept will be developed to analyze the cost and environmental impact of the
product.
4.1. Introduction of the Case Study: Industrial Equipment Unit
The manufacturer of the product under consideration is located in the New
England area. The company manufactures industrial equipment for material flow,
efficiency and safety and has been in business for over 50 years. Depending on the
environment different Industrial Equipment Units (IEU) are produced. One of the
most common IEU can be seen in Figure 43.

93
Figure 43: Industrial Equipment Unit
This tool shakes off materials from the inside to mobile equipment for example:
Fertilizer spreaders and Farm equipment
ice control and sand spreaders
dump trucks
concrete pumps
Therefore the device is mounted on the outside of the equipment (see Figure 44).
94
Figure 44: IEU mounted to the body of a truck
To get a better understanding of the main components of the product are presented.
4.1.1. Main components of the product
The main components of the IEU consist of the housing, eccentric, mounting
cover, motor assembly and dust cover. Besides those main components, there are
different other smaller components that are needed for the assembly. This includes
screws and bearing balls (see Figure 45).
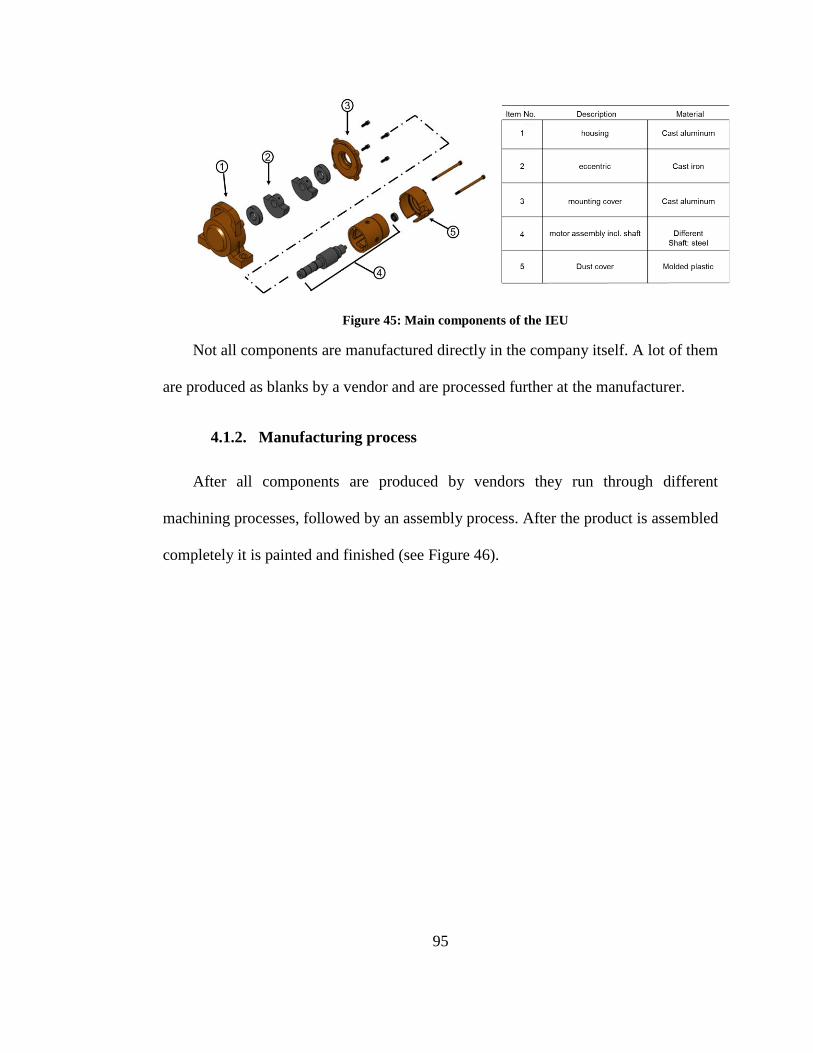
95
Figure 45: Main components of the IEU
Not all components are manufactured directly in the company itself. A lot of them
are produced as blanks by a vendor and are processed further at the manufacturer.
4.1.2. Manufacturing process
After all components are produced by vendors they run through different
machining processes, followed by an assembly process. After the product is assembled
completely it is painted and finished (see Figure 46).
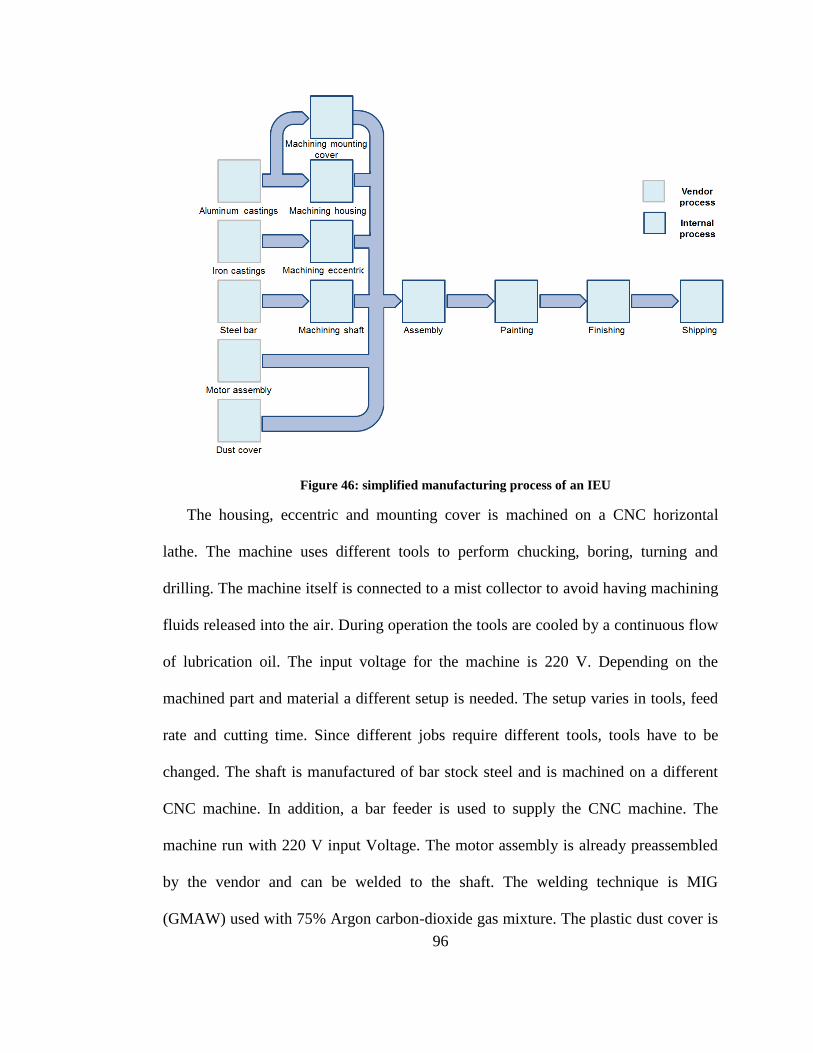
96
Figure 46: simplified manufacturing process of an IEU
The housing, eccentric and mounting cover is machined on a CNC horizontal
lathe. The machine uses different tools to perform chucking, boring, turning and
drilling. The machine itself is connected to a mist collector to avoid having machining
fluids released into the air. During operation the tools are cooled by a continuous flow
of lubrication oil. The input voltage for the machine is 220 V. Depending on the
machined part and material a different setup is needed. The setup varies in tools, feed
rate and cutting time. Since different jobs require different tools, tools have to be
changed. The shaft is manufactured of bar stock steel and is machined on a different
CNC machine. In addition, a bar feeder is used to supply the CNC machine. The
machine run with 220 V input Voltage. The motor assembly is already preassembled
by the vendor and can be welded to the shaft. The welding technique is MIG
(GMAW) used with 75% Argon carbon-dioxide gas mixture. The plastic dust cover is
97
delivered ready for assembly by the vendor. The assembly process is done manually
and only uses man power and different types of sealers. The next process is the
painting of the complete part. The solvent based lacquer is applied with a paint
spraying gun that uses compressed air. After the paint is air dried, the product gets
finished and packaged for shipping.
4.2. Application of Life Cycle Assessment
4.2.1. Goal and scope definition
The goal of the assessment of the manufacturing process is to determine impacts
of the system on the environments and humans. In that process, data has to be
collected, evaluated and visualized. As a consequence, the awareness for negative
effects is increased. In addition, the model can be used to create future state
manufacturing processes and helps to optimize the current processes.
Three models are constructed. The first model shows the current state of the
manufacturing process. The second model is an improved future state process with
lower environmental impact and that provides potential cost savings. The results of
both models are compared to determine the intensity of reduction of environmental
impacts due to the implemented optimizations. Furthermore, there will be a
differentiation in the scope of the assessment. One model will include all of the
environmental impact during upstream processes such as generation of new material
and resource extraction. The second model will only focus on the environmental
98
impact during the manufacturing steps within the company. According to this, the
functional unit is defined.
Functional unit
As explained earlier, the functional unit is used to clarify the system boundaries
and the interdependence within the production system. The functional unit is defined
as the manufacturing of one IEU, including all main parts. With this definition, the
manufacturing process can be compared to other manufacturing processes or
optimizations of the current process.
System boundaries
System boundaries include several aspects. The assessment does not include the
whole life cycle of the product. The first model includes the current manufacturing
processes of the product within the company and all upstream processes such as raw
material extraction and production of blank parts. All downstream processes such as
finishing, shipping and usage are excluded. (see Figure 47).
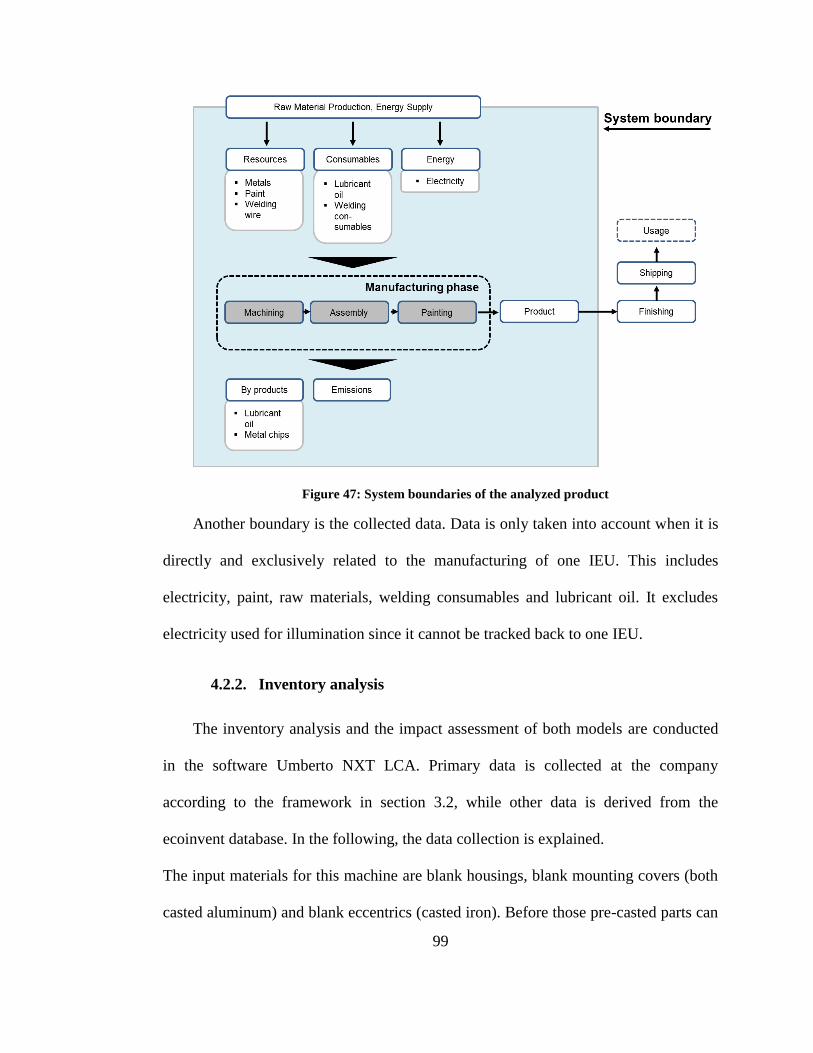
99
Figure 47: System boundaries of the analyzed product
Another boundary is the collected data. Data is only taken into account when it is
directly and exclusively related to the manufacturing of one IEU. This includes
electricity, paint, raw materials, welding consumables and lubricant oil. It excludes
electricity used for illumination since it cannot be tracked back to one IEU.
4.2.2. Inventory analysis
The inventory analysis and the impact assessment of both models are conducted
in the software Umberto NXT LCA. Primary data is collected at the company
according to the framework in section 3.2, while other data is derived from the
ecoinvent database. In the following, the data collection is explained.
The input materials for this machine are blank housings, blank mounting covers (both
casted aluminum) and blank eccentrics (casted iron). Before those pre-casted parts can
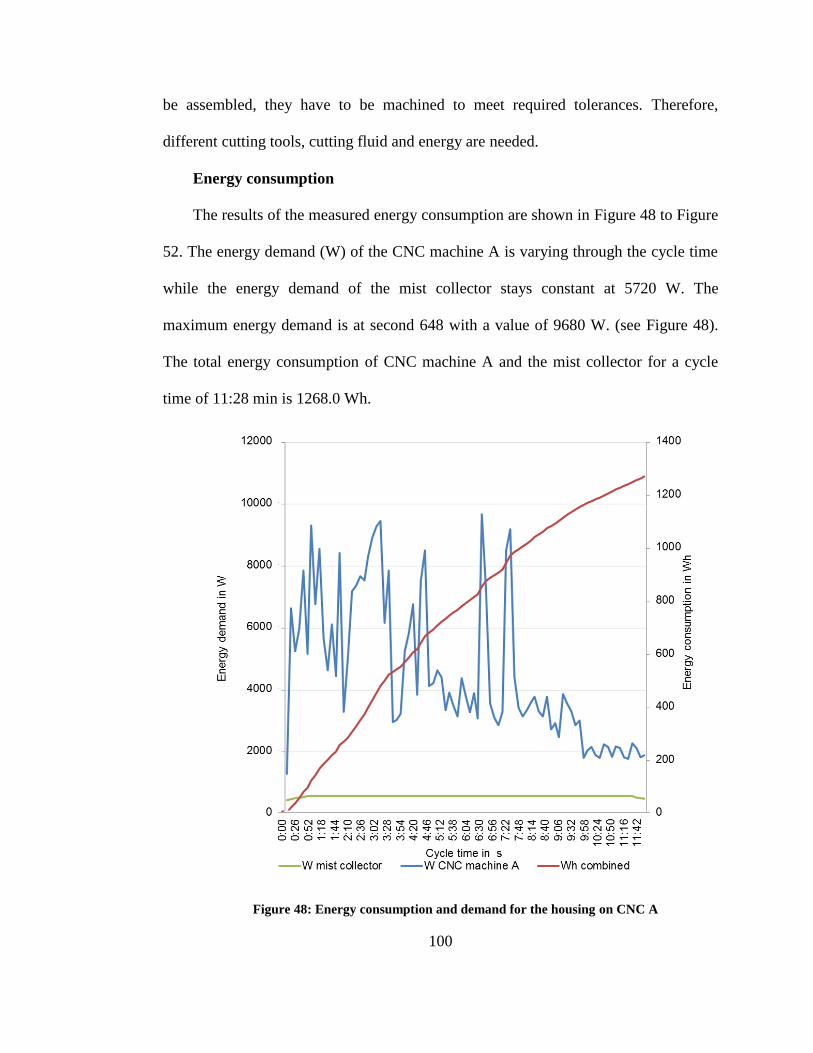
100
be assembled, they have to be machined to meet required tolerances. Therefore,
different cutting tools, cutting fluid and energy are needed.
Energy consumption
The results of the measured energy consumption are shown in Figure 48 to Figure
52. The energy demand (W) of the CNC machine A is varying through the cycle time
while the energy demand of the mist collector stays constant at 5720 W. The
maximum energy demand is at second 648 with a value of 9680 W. (see Figure 48).
The total energy consumption of CNC machine A and the mist collector for a cycle
time of 11:28 min is 1268.0 Wh.
Figure 48: Energy consumption and demand for the housing on CNC A
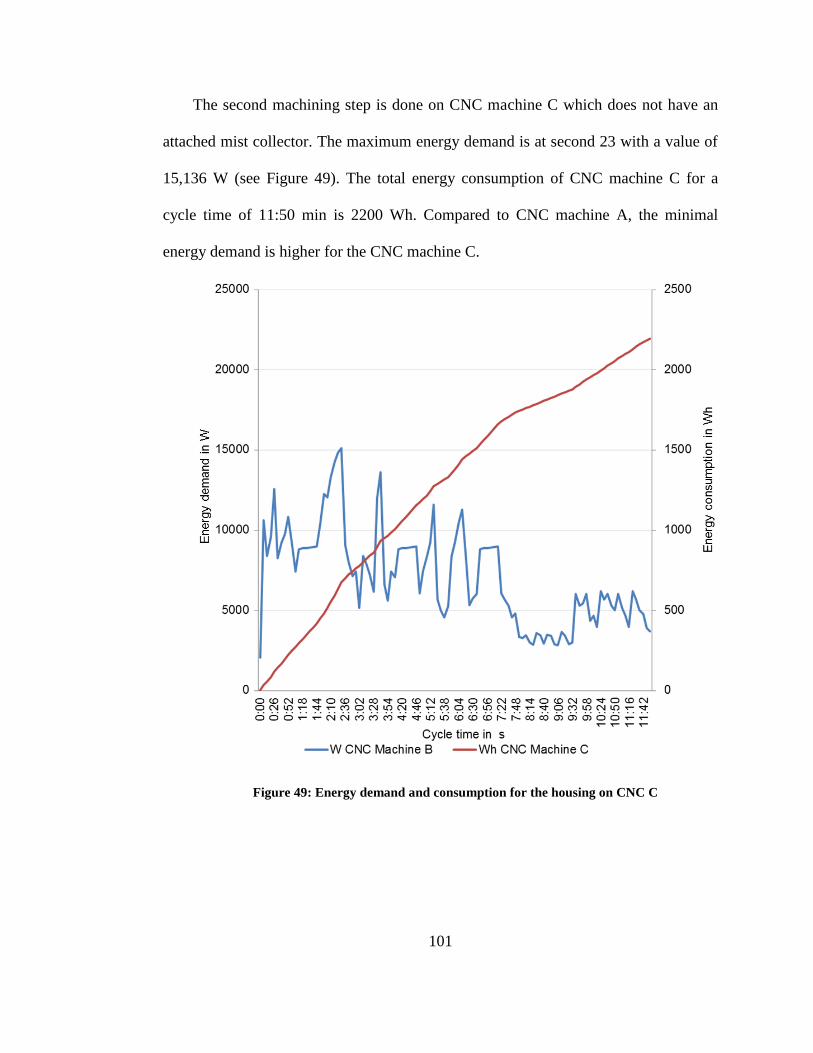
101
The second machining step is done on CNC machine C which does not have an
attached mist collector. The maximum energy demand is at second 23 with a value of
15,136 W (see Figure 49). The total energy consumption of CNC machine C for a
cycle time of 11:50 min is 2200 Wh. Compared to CNC machine A, the minimal
energy demand is higher for the CNC machine C.
Figure 49: Energy demand and consumption for the housing on CNC C
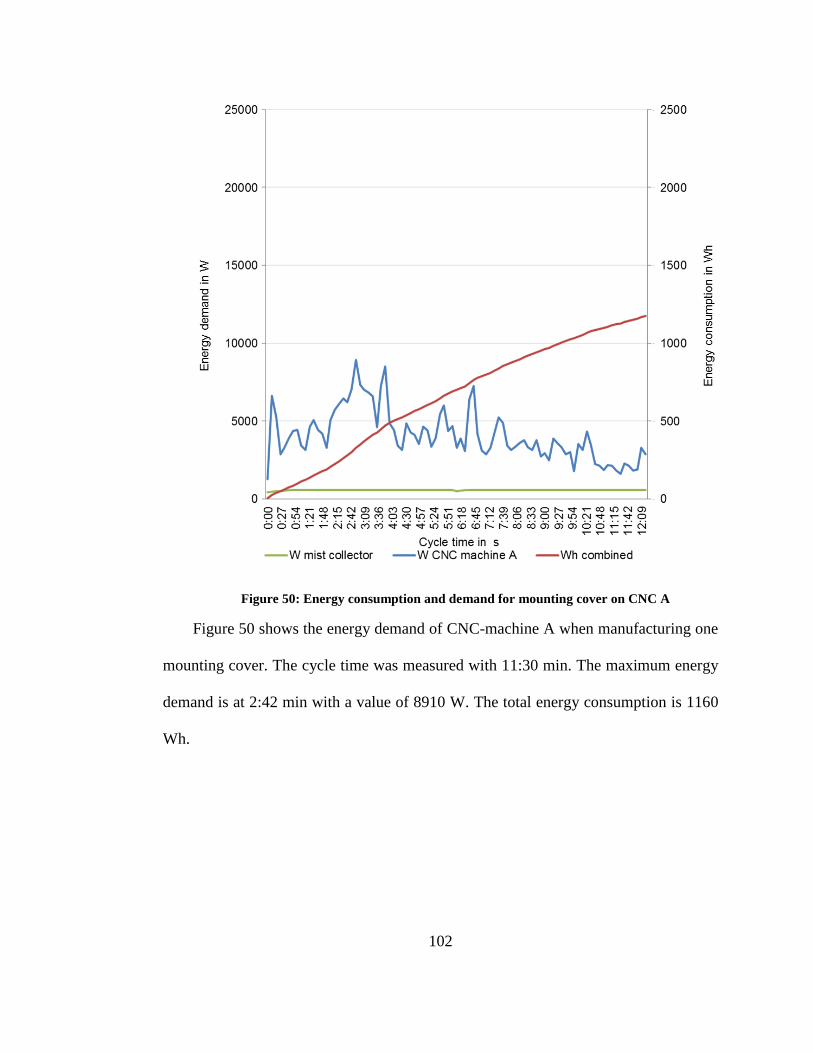
102
Figure 50: Energy consumption and demand for mounting cover on CNC A
Figure 50 shows the energy demand of CNC-machine A when manufacturing one
mounting cover. The cycle time was measured with 11:30 min. The maximum energy
demand is at 2:42 min with a value of 8910 W. The total energy consumption is 1160
Wh.
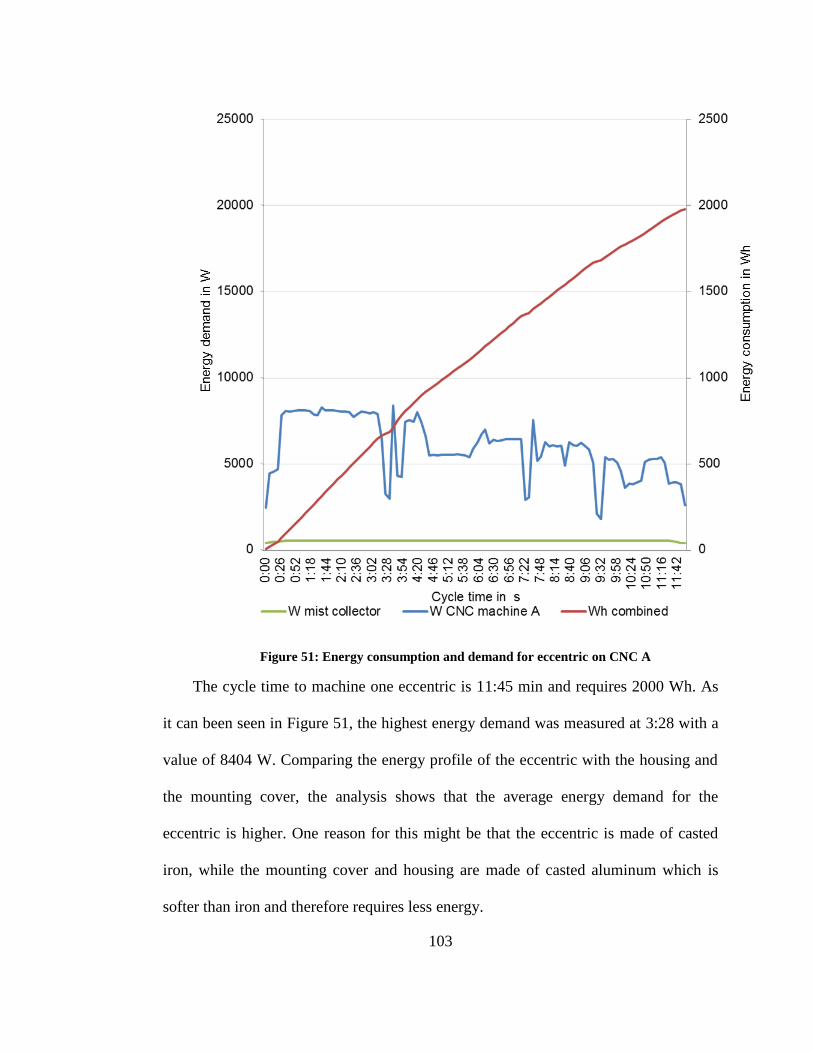
103
Figure 51: Energy consumption and demand for eccentric on CNC A
The cycle time to machine one eccentric is 11:45 min and requires 2000 Wh. As
it can been seen in Figure 51, the highest energy demand was measured at 3:28 with a
value of 8404 W. Comparing the energy profile of the eccentric with the housing and
the mounting cover, the analysis shows that the average energy demand for the
eccentric is higher. One reason for this might be that the eccentric is made of casted
iron, while the mounting cover and housing are made of casted aluminum which is
softer than iron and therefore requires less energy.
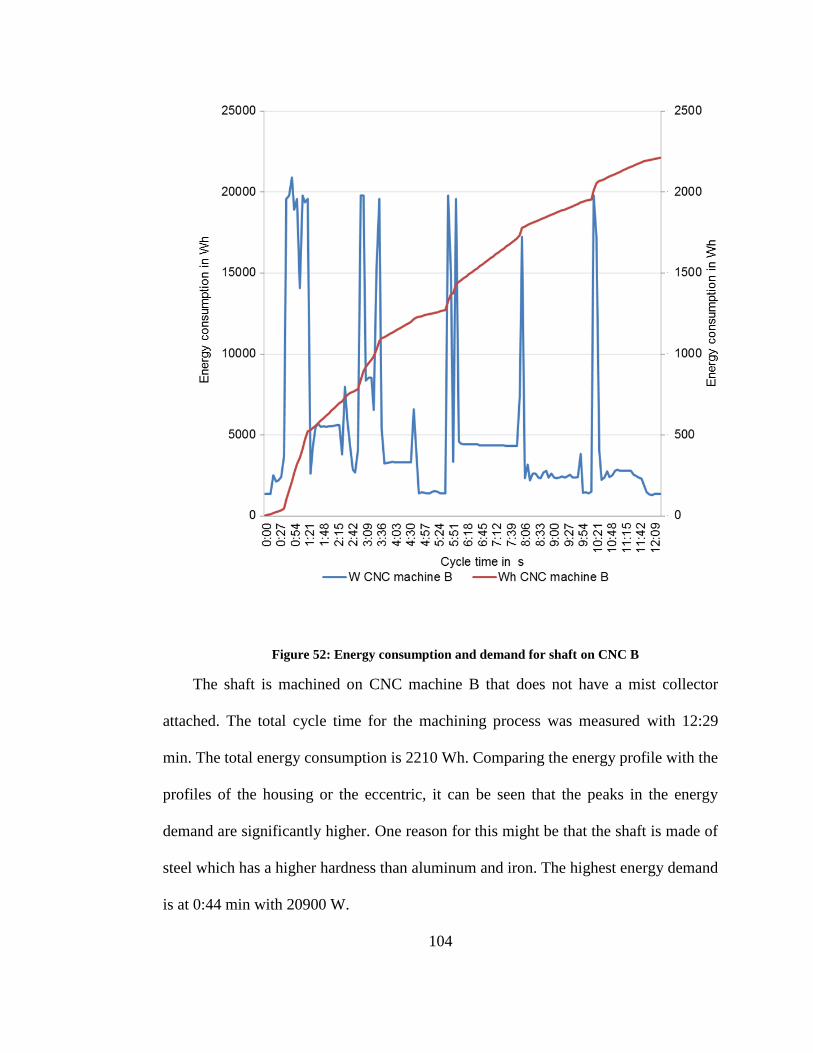
104
Figure 52: Energy consumption and demand for shaft on CNC B
The shaft is machined on CNC machine B that does not have a mist collector
attached. The total cycle time for the machining process was measured with 12:29
min. The total energy consumption is 2210 Wh. Comparing the energy profile with the
profiles of the housing or the eccentric, it can be seen that the peaks in the energy
demand are significantly higher. One reason for this might be that the shaft is made of
steel which has a higher hardness than aluminum and iron. The highest energy demand
is at 0:44 min with 20900 W.
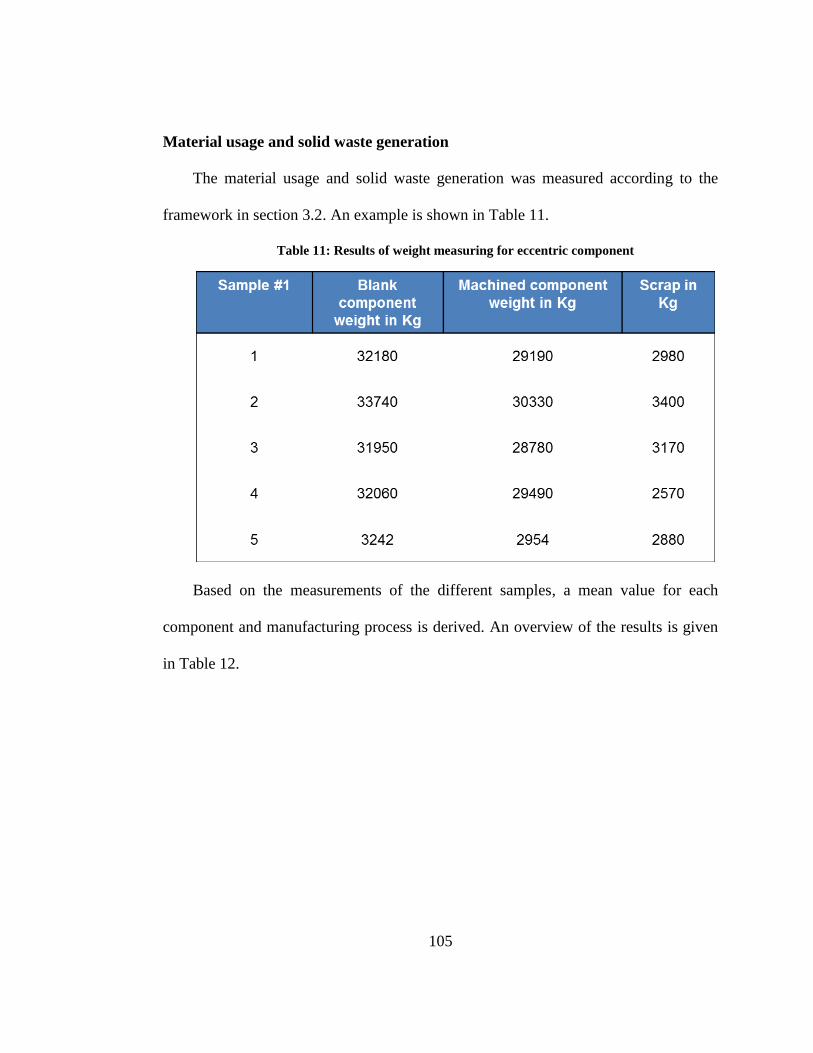
105
Material usage and solid waste generation
The material usage and solid waste generation was measured according to the
framework in section 3.2. An example is shown in Table 11.
Table 11: Results of weight measuring for eccentric component
Based on the measurements of the different samples, a mean value for each
component and manufacturing process is derived. An overview of the results is given
in Table 12.
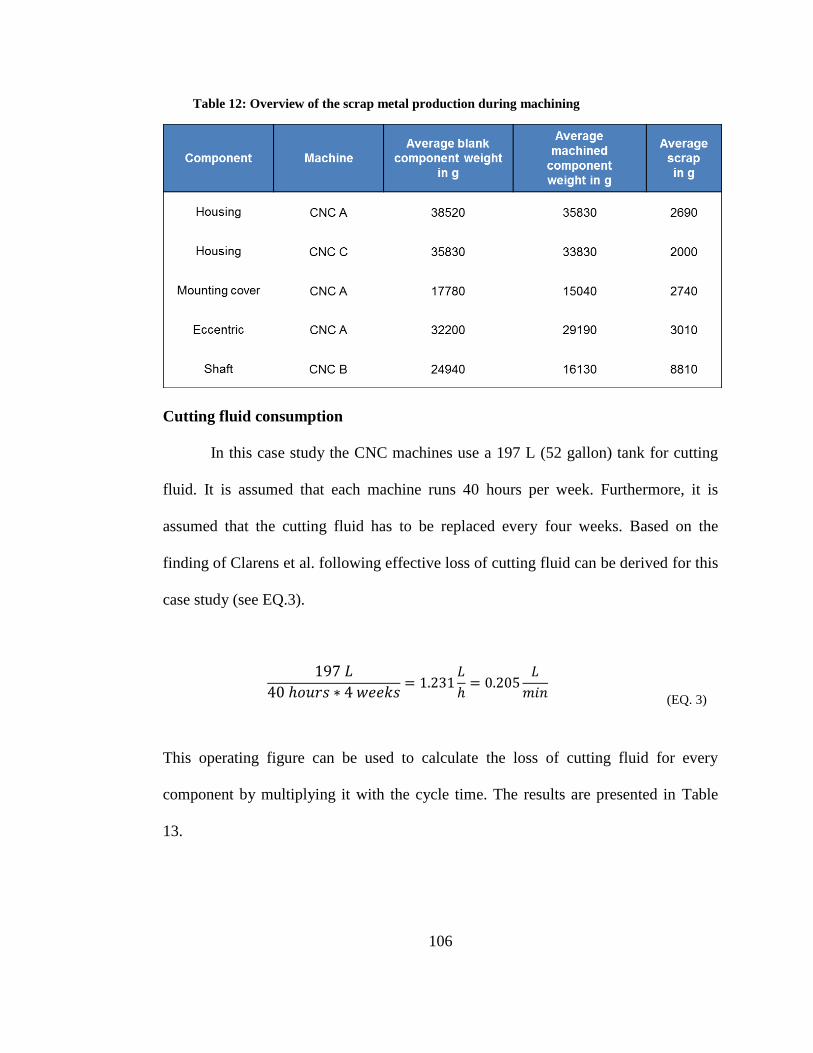
106
Table 12: Overview of the scrap metal production during machining
Cutting fluid consumption
In this case study the CNC machines use a 197 L (52 gallon) tank for cutting
fluid. It is assumed that each machine runs 40 hours per week. Furthermore, it is
assumed that the cutting fluid has to be replaced every four weeks. Based on the
finding of Clarens et al. following effective loss of cutting fluid can be derived for this
case study (see EQ.3).
197 𝐿
40 ℎ𝑜𝑢𝑟𝑠 ∗ 4 𝑤𝑒𝑒𝑘𝑠= 1.231
𝐿
ℎ= 0.205
𝐿
𝑚𝑖𝑛
(EQ. 3)
This operating figure can be used to calculate the loss of cutting fluid for every
component by multiplying it with the cycle time. The results are presented in Table
13.
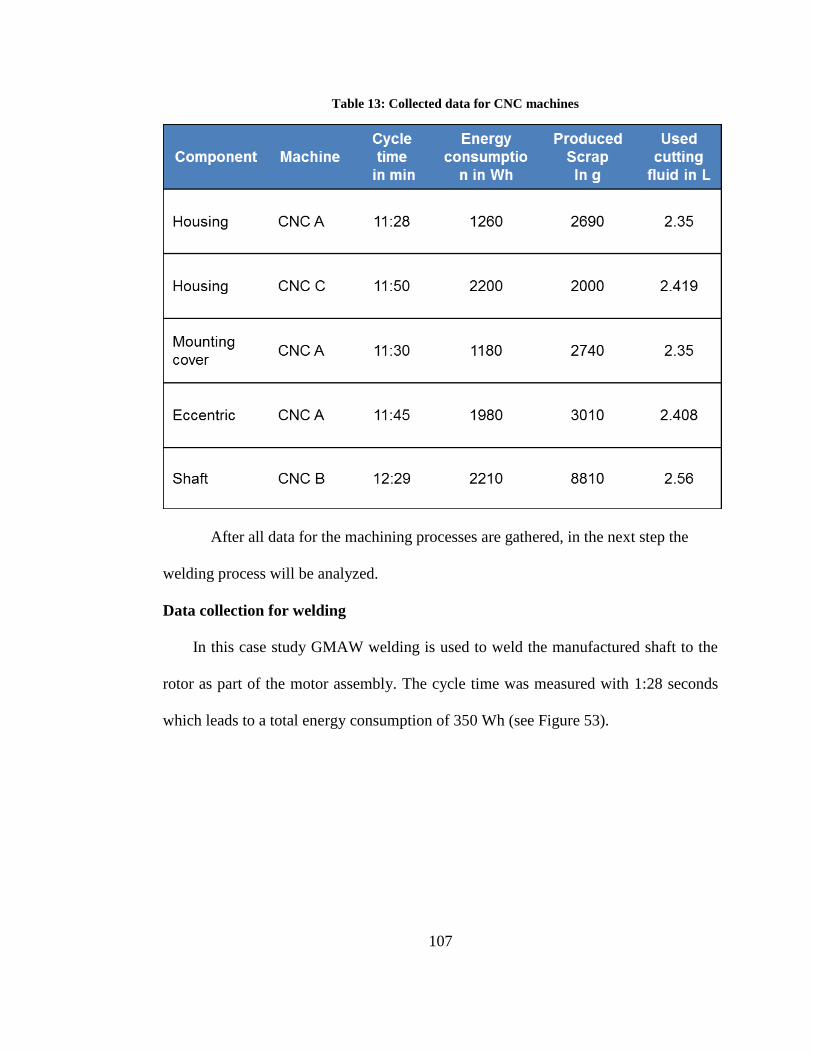
107
Table 13: Collected data for CNC machines
After all data for the machining processes are gathered, in the next step the
welding process will be analyzed.
Data collection for welding
In this case study GMAW welding is used to weld the manufactured shaft to the
rotor as part of the motor assembly. The cycle time was measured with 1:28 seconds
which leads to a total energy consumption of 350 Wh (see Figure 53).
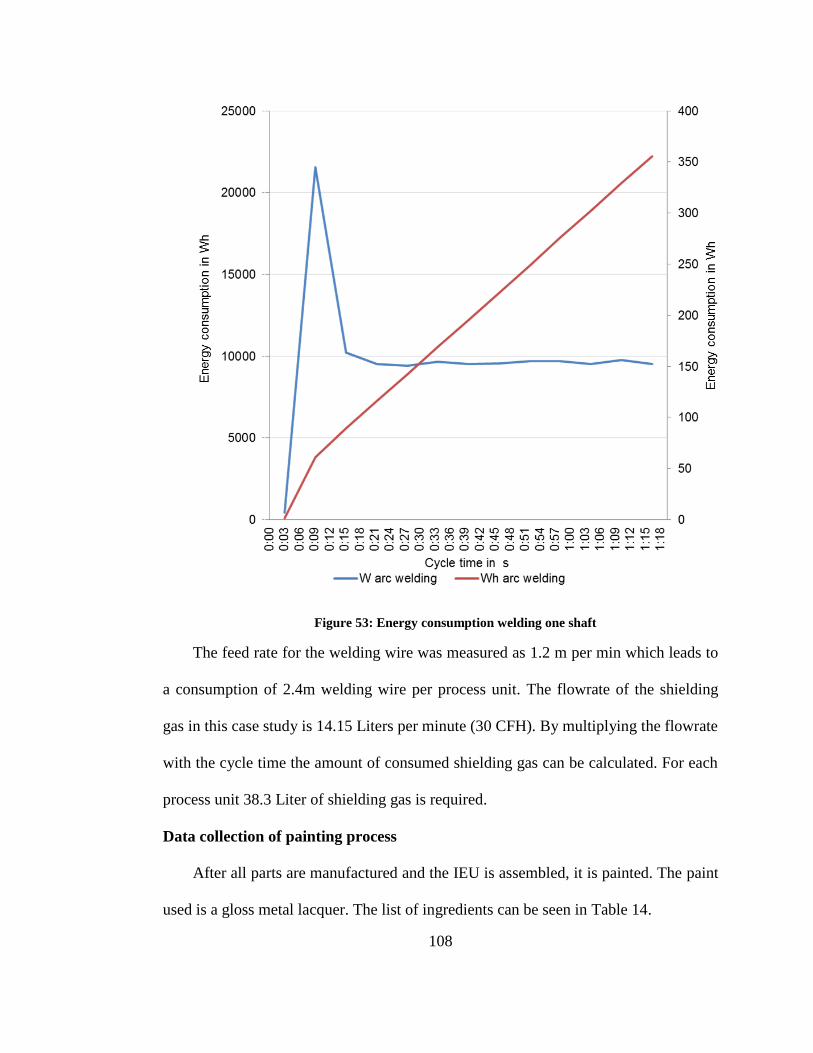
108
Figure 53: Energy consumption welding one shaft
The feed rate for the welding wire was measured as 1.2 m per min which leads to
a consumption of 2.4m welding wire per process unit. The flowrate of the shielding
gas in this case study is 14.15 Liters per minute (30 CFH). By multiplying the flowrate
with the cycle time the amount of consumed shielding gas can be calculated. For each
process unit 38.3 Liter of shielding gas is required.
Data collection of painting process
After all parts are manufactured and the IEU is assembled, it is painted. The paint
used is a gloss metal lacquer. The list of ingredients can be seen in Table 14.
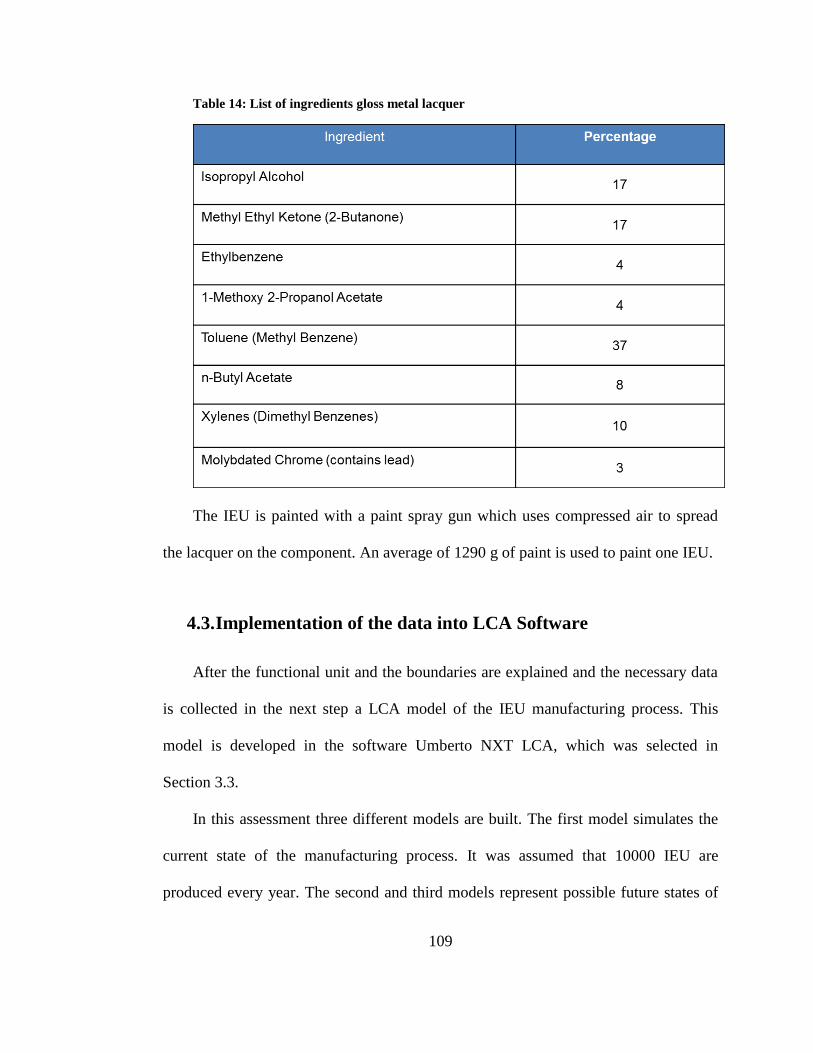
109
Table 14: List of ingredients gloss metal lacquer
The IEU is painted with a paint spray gun which uses compressed air to spread
the lacquer on the component. An average of 1290 g of paint is used to paint one IEU.
4.3. Implementation of the data into LCA Software
After the functional unit and the boundaries are explained and the necessary data
is collected in the next step a LCA model of the IEU manufacturing process. This
model is developed in the software Umberto NXT LCA, which was selected in
Section 3.3.
In this assessment three different models are built. The first model simulates the
current state of the manufacturing process. It was assumed that 10000 IEU are
produced every year. The second and third models represent possible future states of
110
the manufacturing process. They are developed based on the results of the current state
LCA. To goal is to reduce the overall environmental impact by replacing
manufacturing processes which have high environmental impacts or modifying them
to reduce their impact. Within the models different changes regarding single
manufacturing processes are conducted. These changes are all theoretical and based on
other research. However, it is not within the scope of this research to perform these
changes in the actual manufacturing system. The basic construction of both models is
the same as Model 1 shown in Figure 54. In the following, the current state model and
the two future state models are presented.
4.3.1. Model 1: Current State
The current state model is divided into the phases: raw material, manufacture and
distribution/ retail. However, the focus of the LCA is on the manufacturing phase and
the upstream processes. In the first phase which is called Raw Material all raw
material processes such as aluminum casting, iron casting, steel production and
injection molding take place. The raw material processes are marked as light green
squares. Each process needs different inputs presented as green circles and outputs
presented as red circles. However, all raw material processes are modeled based on
generic data as shown in Table 15. The preconfigured processes from the database are
used, since it is beyond reasonable efforts to gather primary data. The blank castings
used in this case study, for example, were produced in a foundry in China.
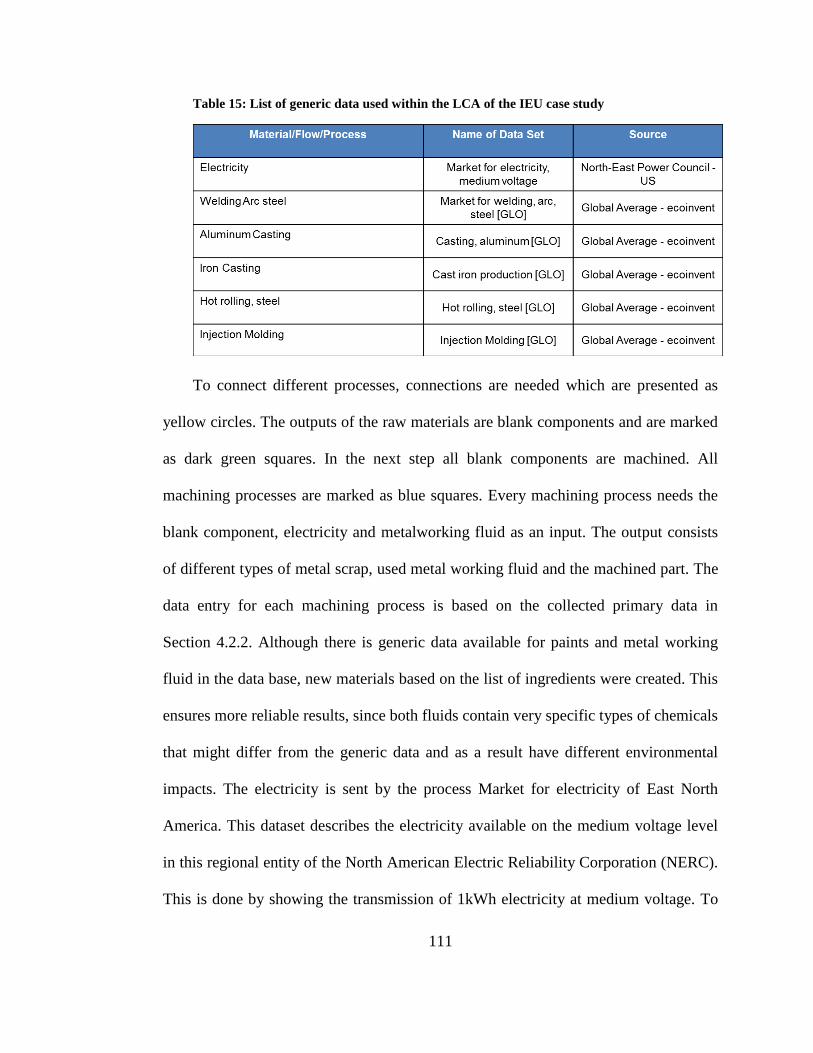
111
Table 15: List of generic data used within the LCA of the IEU case study
To connect different processes, connections are needed which are presented as
yellow circles. The outputs of the raw materials are blank components and are marked
as dark green squares. In the next step all blank components are machined. All
machining processes are marked as blue squares. Every machining process needs the
blank component, electricity and metalworking fluid as an input. The output consists
of different types of metal scrap, used metal working fluid and the machined part. The
data entry for each machining process is based on the collected primary data in
Section 4.2.2. Although there is generic data available for paints and metal working
fluid in the data base, new materials based on the list of ingredients were created. This
ensures more reliable results, since both fluids contain very specific types of chemicals
that might differ from the generic data and as a result have different environmental
impacts. The electricity is sent by the process Market for electricity of East North
America. This dataset describes the electricity available on the medium voltage level
in this regional entity of the North American Electric Reliability Corporation (NERC).
This is done by showing the transmission of 1kWh electricity at medium voltage. To
112
weld the shaft and the rotor together, electricity, welding wire and welding gas are
used as inputs. To create those inputs generic data from the database is used (see Table
15).This is admissible, since the generic data matches the characteristics of the
material used in the case study. The dust cover component is made out of molded
plastic and requires no further machining. It can directly be assembled after its arrival
at the company. The assembly of all parts is done manually with the support of a
screwdriver. In the last step the painting process is modeled. Figure 54 shows the
developed model of the manufacturing process. After the model is completed, the
impact assessment is conducted.
4.3.2. Model 2: Coconut-oil based cutting fluid and powder coating
The second model represents an optimized version of the IEU manufacturing
process. In the optimized model, all machining processes use coconut oil based
metalworking fluid instead of conventional mineral based metalworking fluid. The
fluid was modeled according to the results of the research of Perera. This
metalworking fluid contains water (90%), coconut oil (7%) and emulsifier (3%),
which are classified as nontoxic (Perera, G. I. P. 2014). For the model it is assumed,
that the same amount of fluid is needed for the machining processes as before.
Furthermore, it is assumed that the change of the fluid does not change the required
energy consumption during the machining process and is as durable as the mineral
based metalworking fluid. Those assumption are justified based on the results of
Lawal et al. 2012.
113
In addition the current painting process was replaced by a generic powder coating
process from the ecoinvent database.
4.3.3. Model 3: unpainted IEU
Model 3 is based on the current state model, but does not use any type of surface
finish such as lacquer or powder coating. This proposed design change is reasonable
since the housing and all other parts that protect the inside of the IEU are made of
aluminum and therefore are already rust-resistant. However, there could be other
positive or negative effects to the functionality of the product if the surfaces are left
entirely uncoated. For example, the long-term product durability could be affected.
From a marketing perspective, some brand recognition could be lost if the company
does not use its signature paint color on all outer components. Alternatively, the
company could capitalize on the product design change by promoting a “new,
environmentally friendly” uncoated alternative that lowers costs for customers and
promotes their interest in environmental sustainability.
4.4. LCA Results
4.4.1. Model 1: Current State
The first result of the assessment is demonstrated in Figure 54. The so called
Sankey diagram shows the flow of mass and energy in the supply system of model 1.
Different types of flows can be selected or all flows can be selected at the same time.
Every material has another color. The width of the arrows presents the dimension of
the mass or energy flow.

114
The Sankey diagram gives first visualization of the important flows of a product
system within the different life cycle phases. Hereby, extensive flows are able to be
determined. In case of the IEU, the material flows for the aluminum casting in the life
cycle phase for raw materials is the largest flow within the model. Since the Sankey
diagram displays the arrows in proportion to all other flows and the aluminum casting
is very dominant, every other flow appears to be very thin or is even hard to identify.
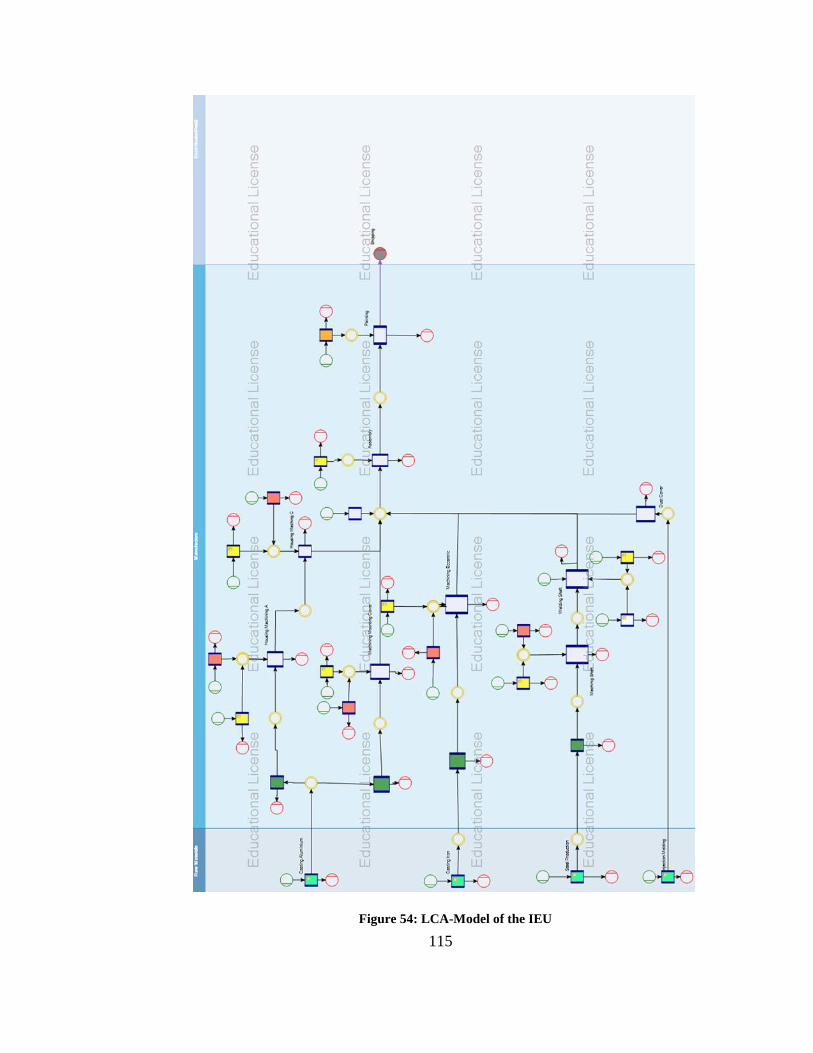
115
Figure 54: LCA-Model of the IEU
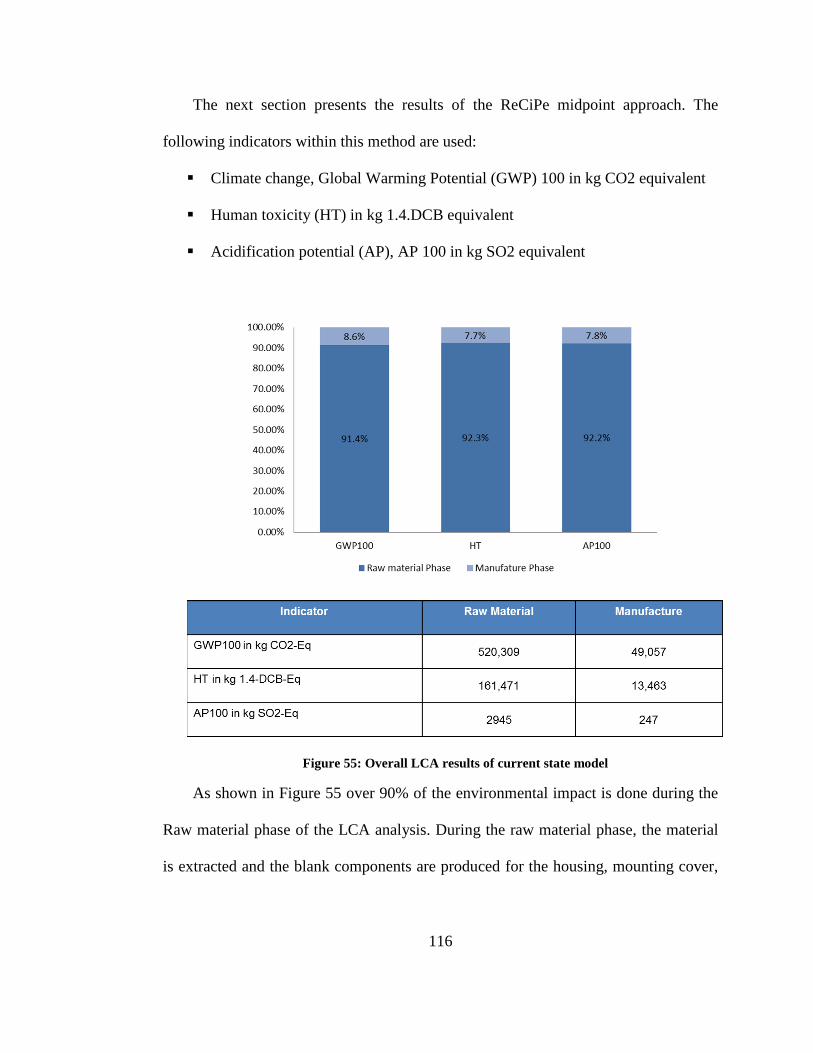
116
The next section presents the results of the ReCiPe midpoint approach. The
following indicators within this method are used:
Climate change, Global Warming Potential (GWP) 100 in kg CO2 equivalent
Human toxicity (HT) in kg 1.4.DCB equivalent
Acidification potential (AP), AP 100 in kg SO2 equivalent
Figure 55: Overall LCA results of current state model
As shown in Figure 55 over 90% of the environmental impact is done during the
Raw material phase of the LCA analysis. During the raw material phase, the material
is extracted and the blank components are produced for the housing, mounting cover,
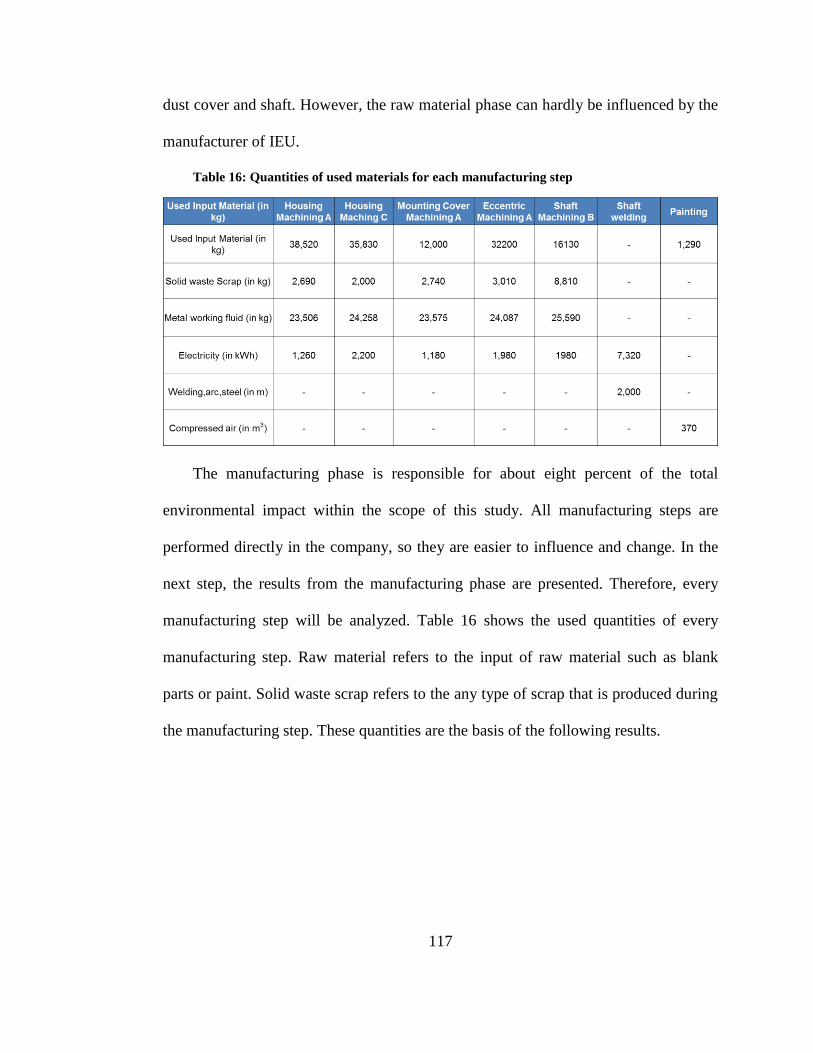
117
dust cover and shaft. However, the raw material phase can hardly be influenced by the
manufacturer of IEU.
Table 16: Quantities of used materials for each manufacturing step
The manufacturing phase is responsible for about eight percent of the total
environmental impact within the scope of this study. All manufacturing steps are
performed directly in the company, so they are easier to influence and change. In the
next step, the results from the manufacturing phase are presented. Therefore, every
manufacturing step will be analyzed. Table 16 shows the used quantities of every
manufacturing step. Raw material refers to the input of raw material such as blank
parts or paint. Solid waste scrap refers to the any type of scrap that is produced during
the manufacturing step. These quantities are the basis of the following results.
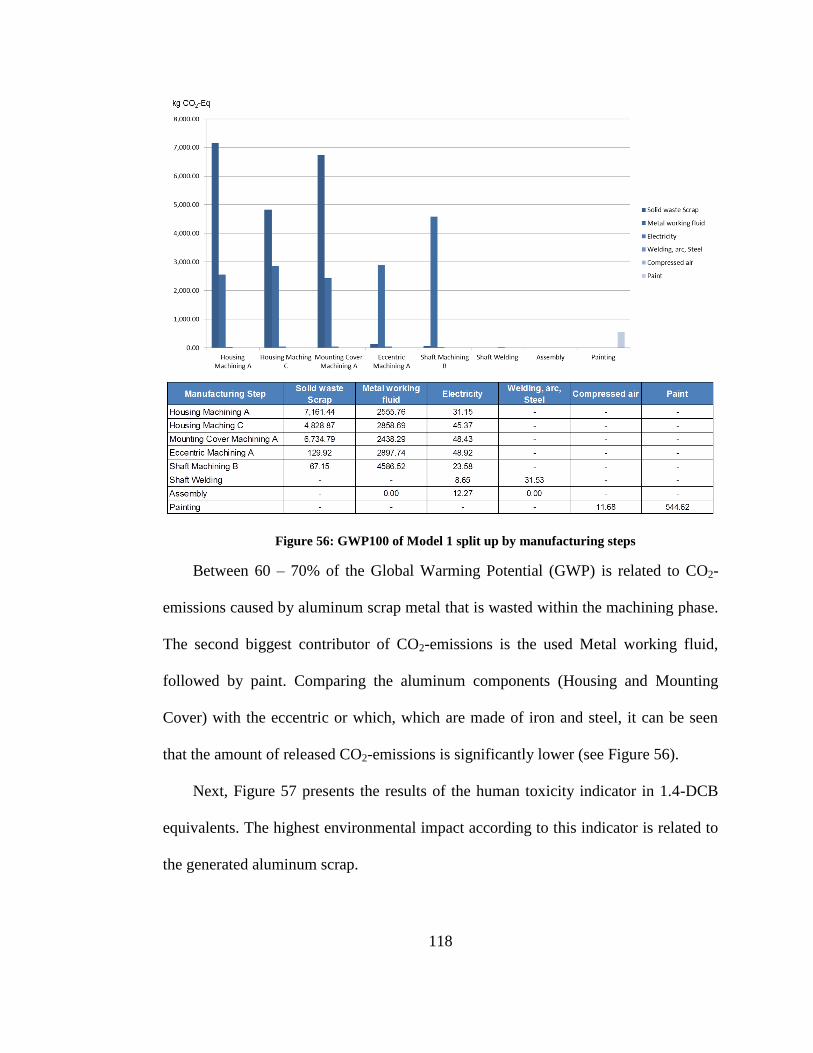
118
Figure 56: GWP100 of Model 1 split up by manufacturing steps
Between 60 – 70% of the Global Warming Potential (GWP) is related to CO2-
emissions caused by aluminum scrap metal that is wasted within the machining phase.
The second biggest contributor of CO2-emissions is the used Metal working fluid,
followed by paint. Comparing the aluminum components (Housing and Mounting
Cover) with the eccentric or which, which are made of iron and steel, it can be seen
that the amount of released CO2-emissions is significantly lower (see Figure 56).
Next, Figure 57 presents the results of the human toxicity indicator in 1.4-DCB
equivalents. The highest environmental impact according to this indicator is related to
the generated aluminum scrap.
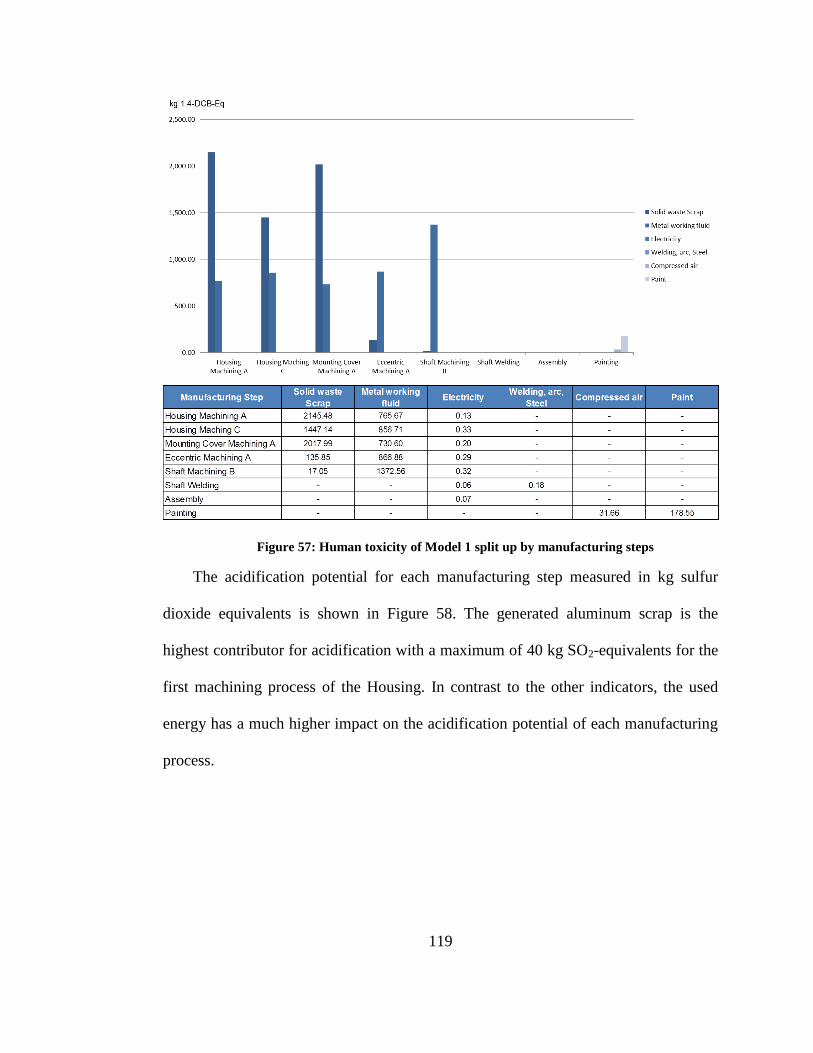
119
Figure 57: Human toxicity of Model 1 split up by manufacturing steps
The acidification potential for each manufacturing step measured in kg sulfur
dioxide equivalents is shown in Figure 58. The generated aluminum scrap is the
highest contributor for acidification with a maximum of 40 kg SO2-equivalents for the
first machining process of the Housing. In contrast to the other indicators, the used
energy has a much higher impact on the acidification potential of each manufacturing
process.
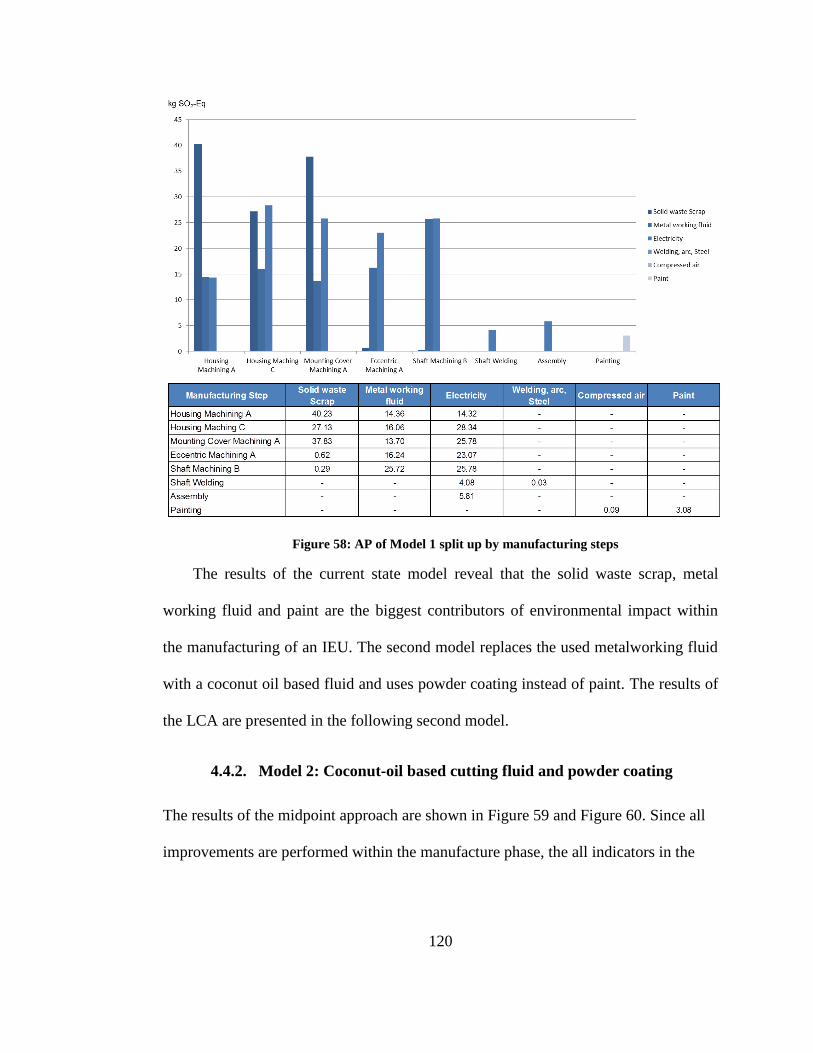
120
Figure 58: AP of Model 1 split up by manufacturing steps
The results of the current state model reveal that the solid waste scrap, metal
working fluid and paint are the biggest contributors of environmental impact within
the manufacturing of an IEU. The second model replaces the used metalworking fluid
with a coconut oil based fluid and uses powder coating instead of paint. The results of
the LCA are presented in the following second model.
4.4.2. Model 2: Coconut-oil based cutting fluid and powder coating
The results of the midpoint approach are shown in Figure 59 and Figure 60. Since all
improvements are performed within the manufacture phase, the all indicators in the
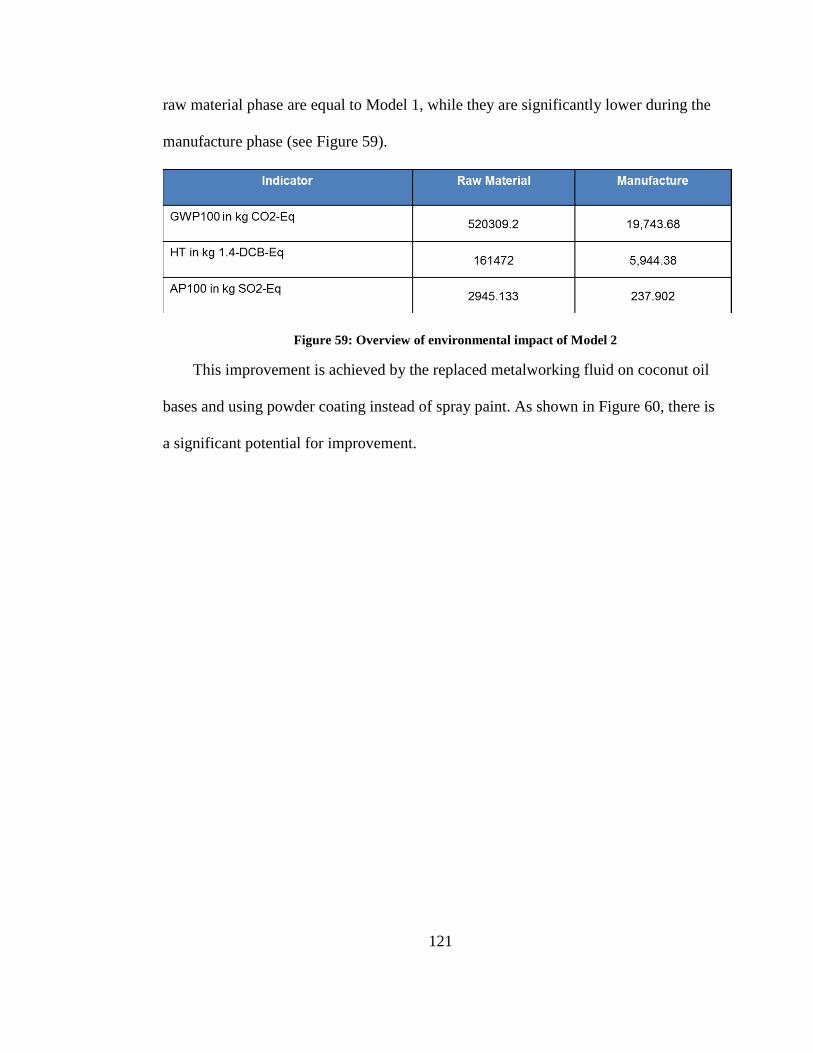
121
raw material phase are equal to Model 1, while they are significantly lower during the
manufacture phase (see Figure 59).
Figure 59: Overview of environmental impact of Model 2
This improvement is achieved by the replaced metalworking fluid on coconut oil
bases and using powder coating instead of spray paint. As shown in Figure 60, there is
a significant potential for improvement.
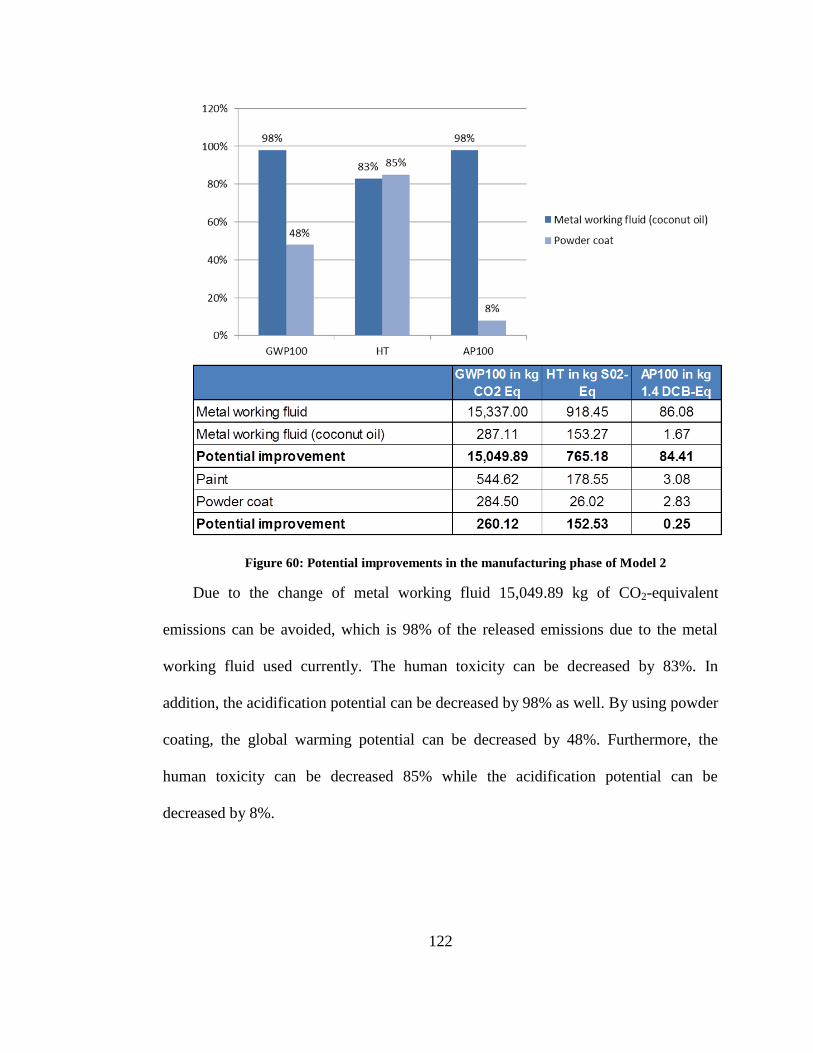
122
Figure 60: Potential improvements in the manufacturing phase of Model 2
Due to the change of metal working fluid 15,049.89 kg of CO2-equivalent
emissions can be avoided, which is 98% of the released emissions due to the metal
working fluid used currently. The human toxicity can be decreased by 83%. In
addition, the acidification potential can be decreased by 98% as well. By using powder
coating, the global warming potential can be decreased by 48%. Furthermore, the
human toxicity can be decreased 85% while the acidification potential can be
decreased by 8%.
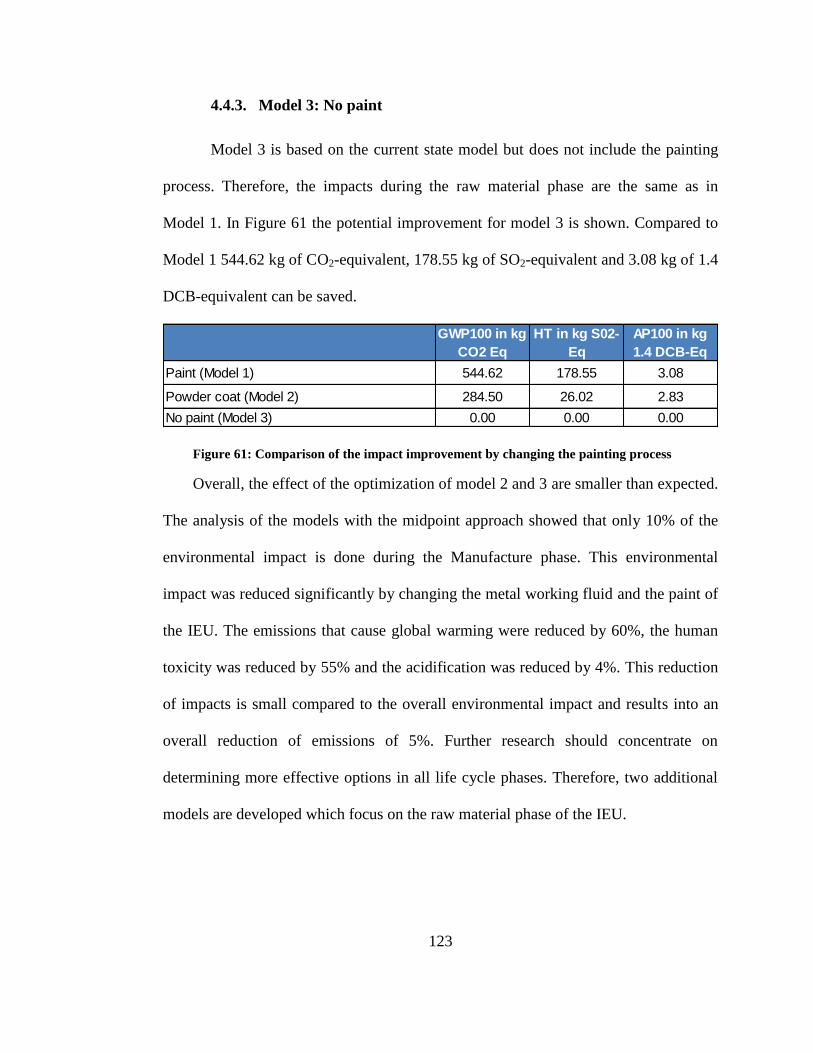
123
4.4.3. Model 3: No paint
Model 3 is based on the current state model but does not include the painting
process. Therefore, the impacts during the raw material phase are the same as in
Model 1. In Figure 61 the potential improvement for model 3 is shown. Compared to
Model 1 544.62 kg of CO2-equivalent, 178.55 kg of SO2-equivalent and 3.08 kg of 1.4
DCB-equivalent can be saved.
Figure 61: Comparison of the impact improvement by changing the painting process
Overall, the effect of the optimization of model 2 and 3 are smaller than expected.
The analysis of the models with the midpoint approach showed that only 10% of the
environmental impact is done during the Manufacture phase. This environmental
impact was reduced significantly by changing the metal working fluid and the paint of
the IEU. The emissions that cause global warming were reduced by 60%, the human
toxicity was reduced by 55% and the acidification was reduced by 4%. This reduction
of impacts is small compared to the overall environmental impact and results into an
overall reduction of emissions of 5%. Further research should concentrate on
determining more effective options in all life cycle phases. Therefore, two additional
models are developed which focus on the raw material phase of the IEU.
GWP100 in kg
CO2 Eq
HT in kg S02-
Eq
AP100 in kg
1.4 DCB-Eq
Paint (Model 1) 544.62 178.55 3.08
Powder coat (Model 2) 284.50 26.02 2.83
No paint (Model 3) 0.00 0.00 0.00
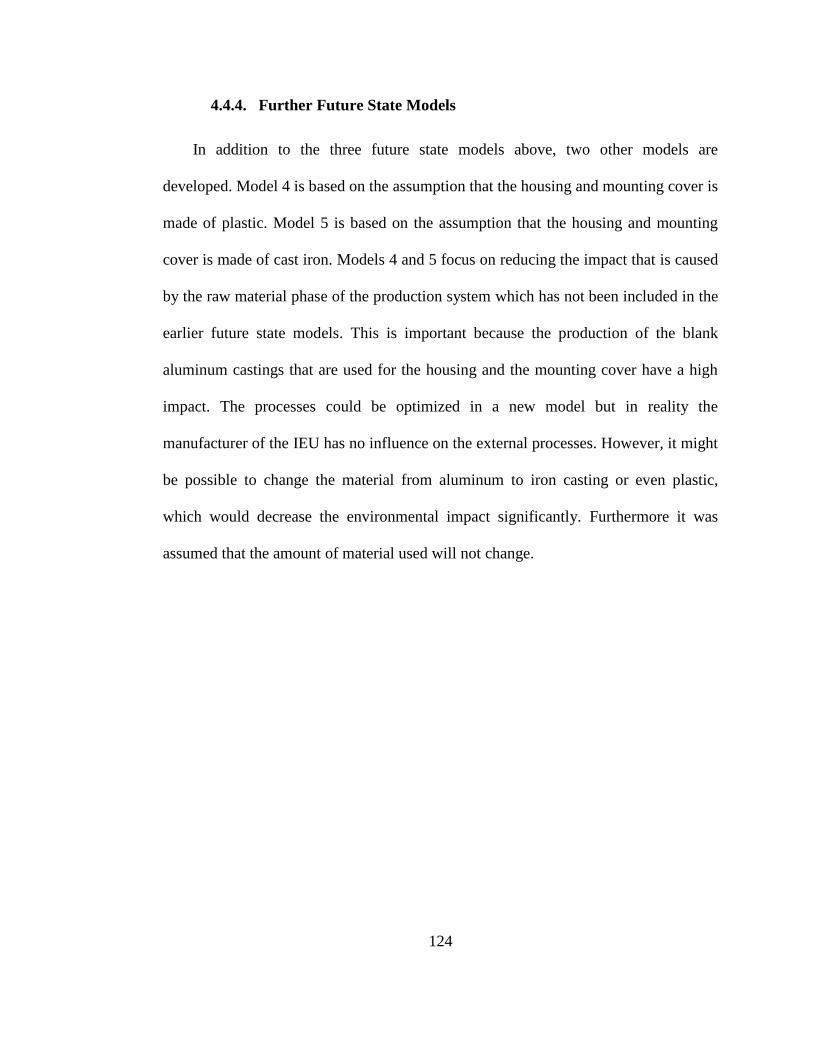
124
4.4.4. Further Future State Models
In addition to the three future state models above, two other models are
developed. Model 4 is based on the assumption that the housing and mounting cover is
made of plastic. Model 5 is based on the assumption that the housing and mounting
cover is made of cast iron. Models 4 and 5 focus on reducing the impact that is caused
by the raw material phase of the production system which has not been included in the
earlier future state models. This is important because the production of the blank
aluminum castings that are used for the housing and the mounting cover have a high
impact. The processes could be optimized in a new model but in reality the
manufacturer of the IEU has no influence on the external processes. However, it might
be possible to change the material from aluminum to iron casting or even plastic,
which would decrease the environmental impact significantly. Furthermore it was
assumed that the amount of material used will not change.
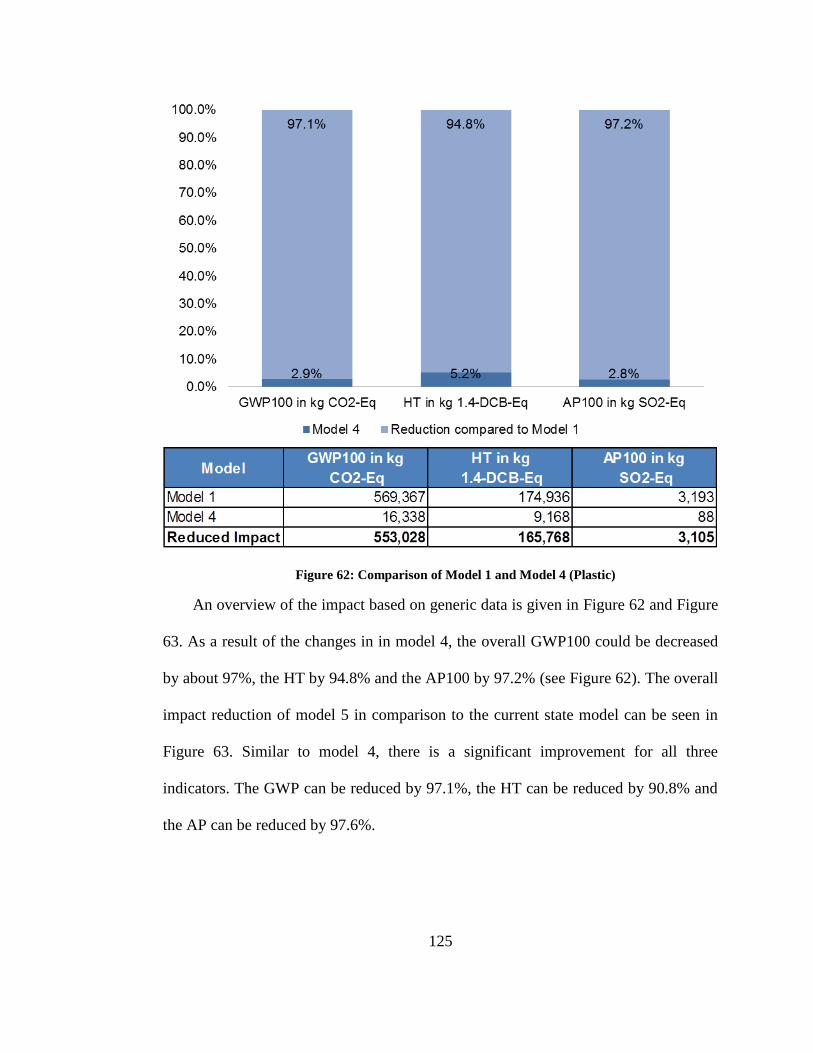
125
Figure 62: Comparison of Model 1 and Model 4 (Plastic)
An overview of the impact based on generic data is given in Figure 62 and Figure
63. As a result of the changes in in model 4, the overall GWP100 could be decreased
by about 97%, the HT by 94.8% and the AP100 by 97.2% (see Figure 62). The overall
impact reduction of model 5 in comparison to the current state model can be seen in
Figure 63. Similar to model 4, there is a significant improvement for all three
indicators. The GWP can be reduced by 97.1%, the HT can be reduced by 90.8% and
the AP can be reduced by 97.6%.
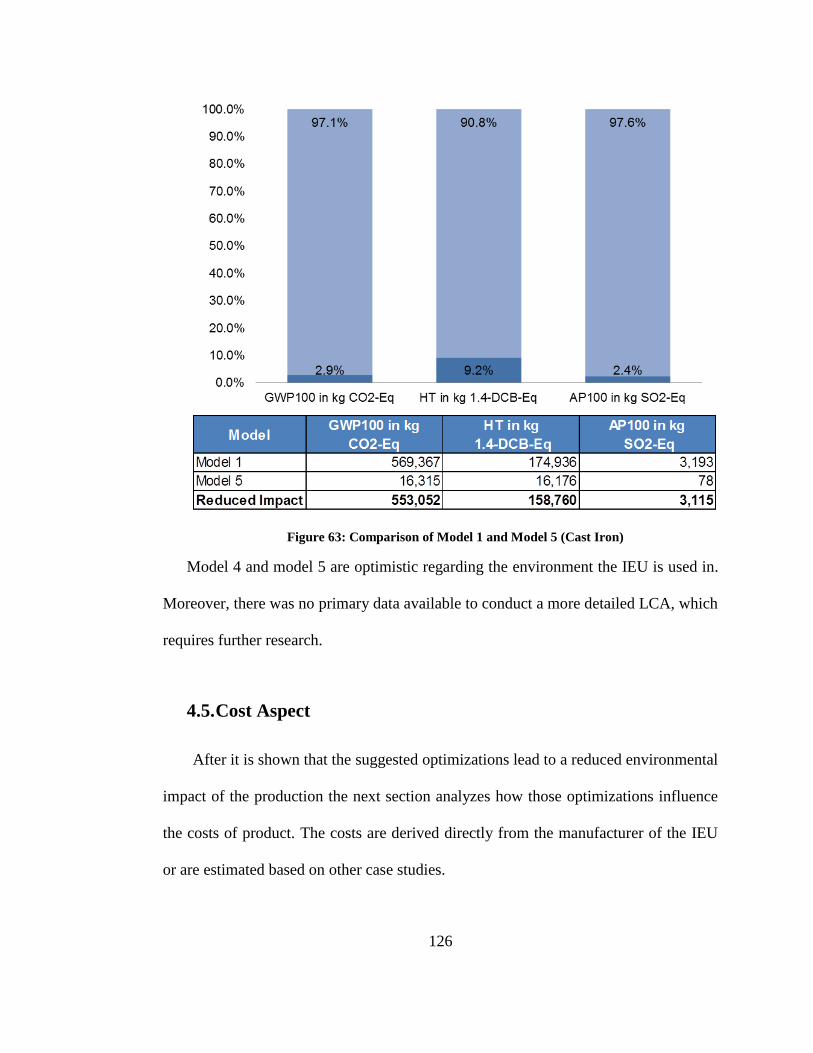
126
Figure 63: Comparison of Model 1 and Model 5 (Cast Iron)
Model 4 and model 5 are optimistic regarding the environment the IEU is used in.
Moreover, there was no primary data available to conduct a more detailed LCA, which
requires further research.
4.5. Cost Aspect
After it is shown that the suggested optimizations lead to a reduced environmental
impact of the production the next section analyzes how those optimizations influence
the costs of product. The costs are derived directly from the manufacturer of the IEU
or are estimated based on other case studies.
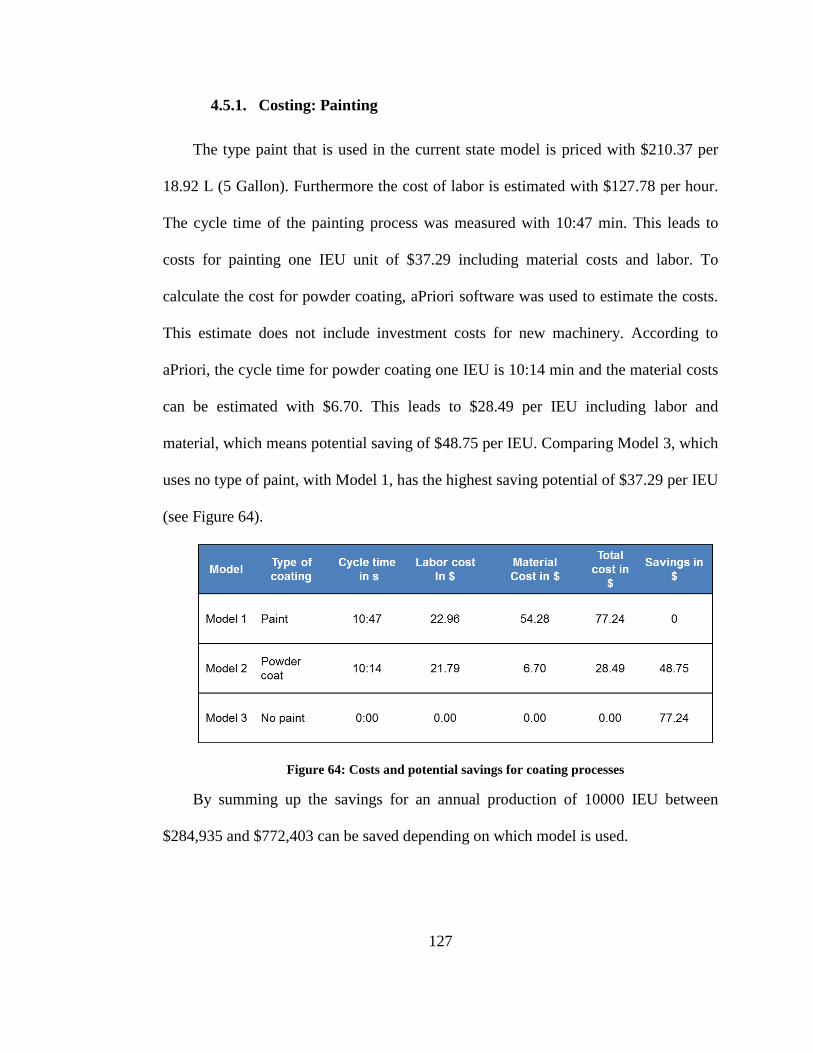
127
4.5.1. Costing: Painting
The type paint that is used in the current state model is priced with $210.37 per
18.92 L (5 Gallon). Furthermore the cost of labor is estimated with $127.78 per hour.
The cycle time of the painting process was measured with 10:47 min. This leads to
costs for painting one IEU unit of $37.29 including material costs and labor. To
calculate the cost for powder coating, aPriori software was used to estimate the costs.
This estimate does not include investment costs for new machinery. According to
aPriori, the cycle time for powder coating one IEU is 10:14 min and the material costs
can be estimated with $6.70. This leads to $28.49 per IEU including labor and
material, which means potential saving of $48.75 per IEU. Comparing Model 3, which
uses no type of paint, with Model 1, has the highest saving potential of $37.29 per IEU
(see Figure 64).
Figure 64: Costs and potential savings for coating processes
By summing up the savings for an annual production of 10000 IEU between
$284,935 and $772,403 can be saved depending on which model is used.
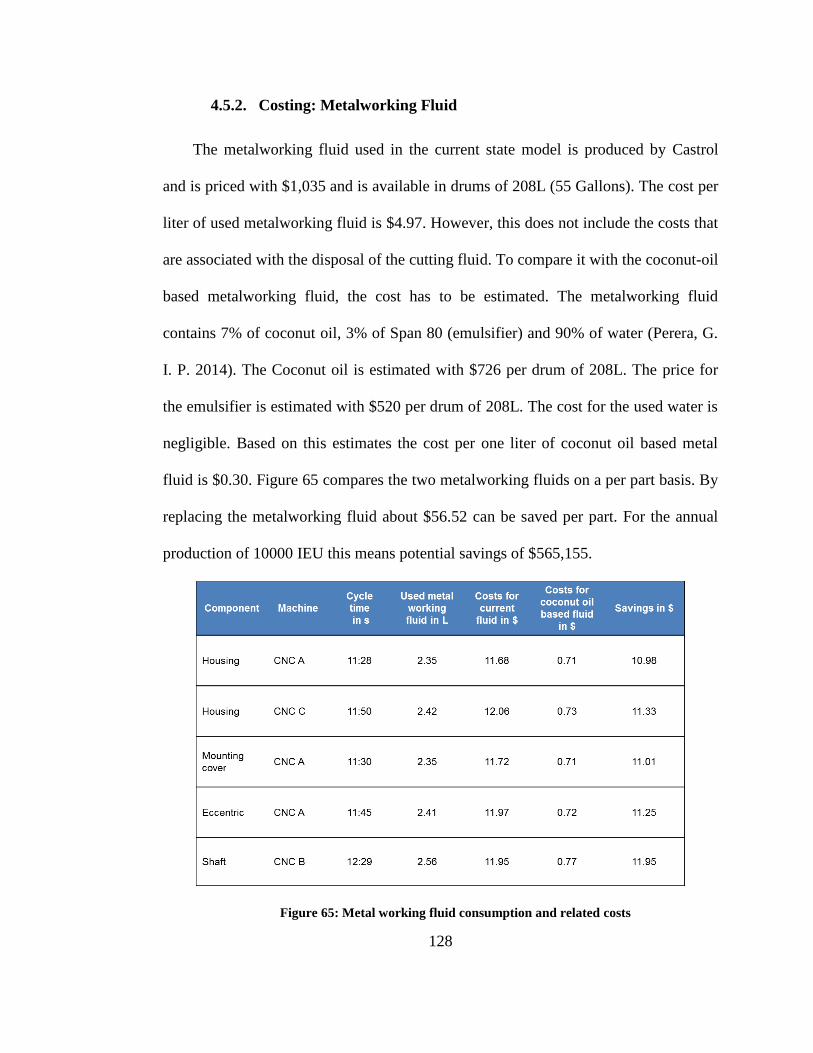
128
4.5.2. Costing: Metalworking Fluid
The metalworking fluid used in the current state model is produced by Castrol
and is priced with $1,035 and is available in drums of 208L (55 Gallons). The cost per
liter of used metalworking fluid is $4.97. However, this does not include the costs that
are associated with the disposal of the cutting fluid. To compare it with the coconut-oil
based metalworking fluid, the cost has to be estimated. The metalworking fluid
contains 7% of coconut oil, 3% of Span 80 (emulsifier) and 90% of water (Perera, G.
I. P. 2014). The Coconut oil is estimated with $726 per drum of 208L. The price for
the emulsifier is estimated with $520 per drum of 208L. The cost for the used water is
negligible. Based on this estimates the cost per one liter of coconut oil based metal
fluid is $0.30. Figure 65 compares the two metalworking fluids on a per part basis. By
replacing the metalworking fluid about $56.52 can be saved per part. For the annual
production of 10000 IEU this means potential savings of $565,155.
Figure 65: Metal working fluid consumption and related costs
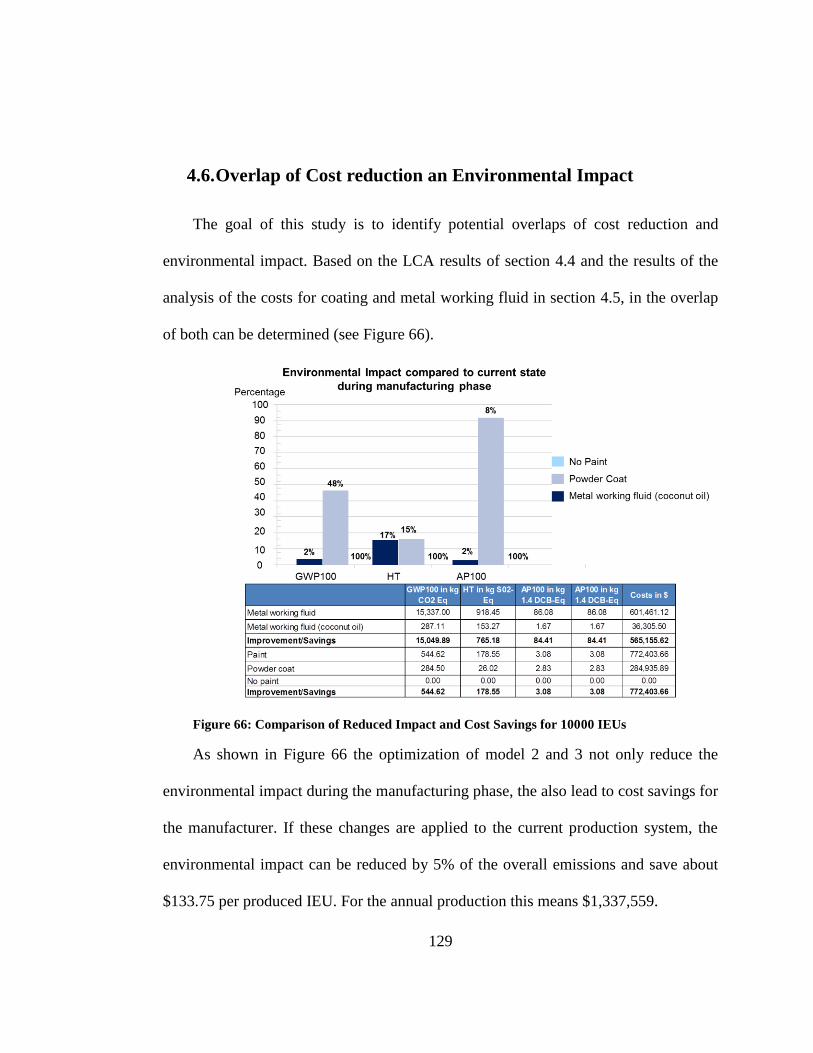
129
4.6. Overlap of Cost reduction an Environmental Impact
The goal of this study is to identify potential overlaps of cost reduction and
environmental impact. Based on the LCA results of section 4.4 and the results of the
analysis of the costs for coating and metal working fluid in section 4.5, in the overlap
of both can be determined (see Figure 66).
Figure 66: Comparison of Reduced Impact and Cost Savings for 10000 IEUs
As shown in Figure 66 the optimization of model 2 and 3 not only reduce the
environmental impact during the manufacturing phase, the also lead to cost savings for
the manufacturer. If these changes are applied to the current production system, the
environmental impact can be reduced by 5% of the overall emissions and save about
$133.75 per produced IEU. For the annual production this means $1,337,559.
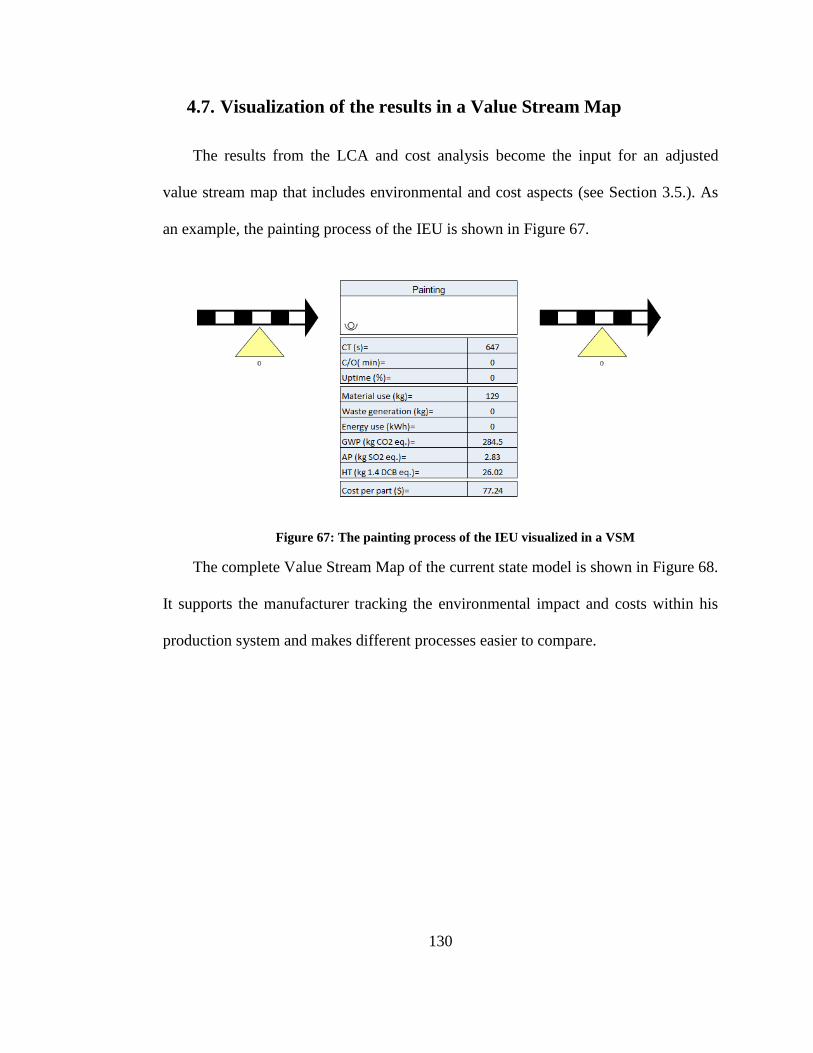
130
4.7. Visualization of the results in a Value Stream Map
The results from the LCA and cost analysis become the input for an adjusted
value stream map that includes environmental and cost aspects (see Section 3.5.). As
an example, the painting process of the IEU is shown in Figure 67.
Figure 67: The painting process of the IEU visualized in a VSM
The complete Value Stream Map of the current state model is shown in Figure 68.
It supports the manufacturer tracking the environmental impact and costs within his
production system and makes different processes easier to compare.
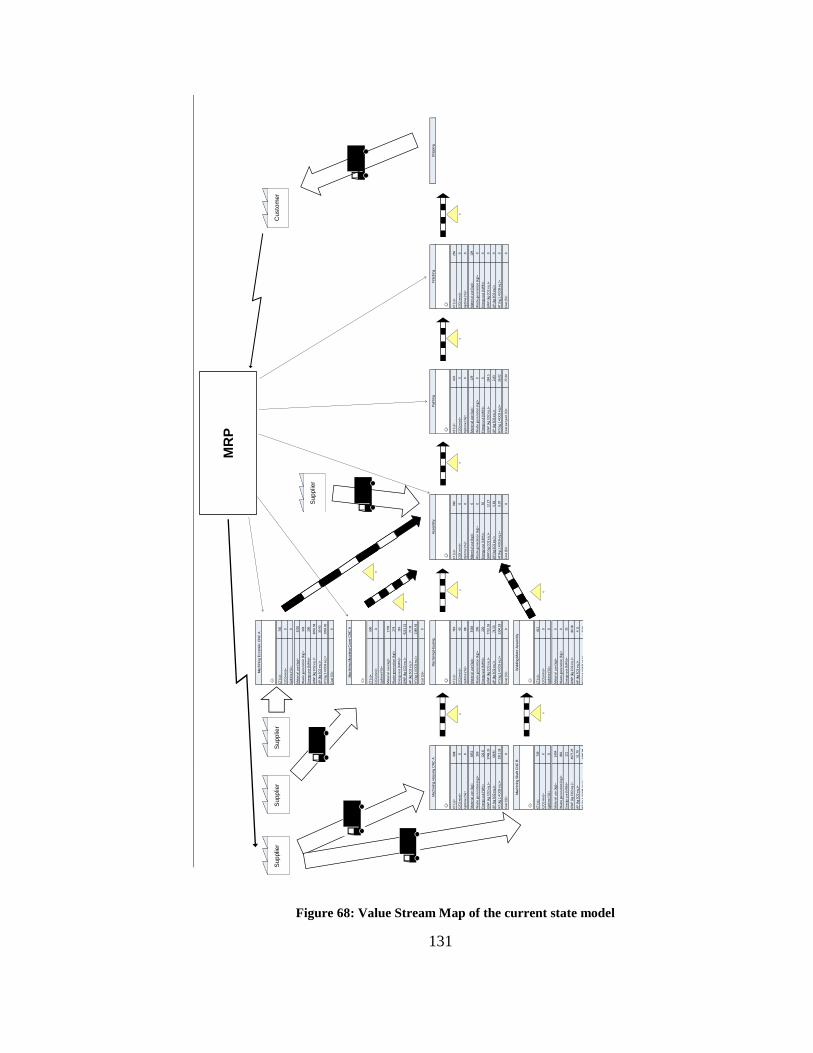
131
Figure 68: Value Stream Map of the current state model
CT
(s)=
C/O
( m
in)=
Up
tim
e (
%)=
Mat
eri
al u
se (
kg)=
Was
te g
en
era
tio
n (
kg)=
Ene
rgy
use
(kW
h)=
GW
P (
kg C
O2
eq
.)=
AP
(kg
SO
2 e
q.)
=
HT
(kg
1.4
DC
B e
q.)
=
Co
st (
$)=
CT
(s)=
C/O
( m
in)=
Up
tim
e (
%)=
Mat
eri
al u
se (
kg)=
Was
te g
en
era
tio
n (
kg)=
Ene
rgy
use
(kW
h)=
GW
P (
kg C
O2
eq
.)=
AP
(kg
SO
2 e
q.)
=
HT
(kg
1.4
DC
B e
q.)
=
Co
st (
$)=
CT
(s)=
CT
(s)=
CT
(s)=
CT
(s)=
CT
(s)=
C/O
( m
in)=
C/O
( m
in)=
C/O
( m
in)=
C/O
( m
in)=
C/O
( m
in)=
Up
tim
e (
%)=
Up
tim
e (
%)=
Up
tim
e (
%)=
Up
tim
e (
%)=
Up
tim
e (
%)=
Mat
eri
al u
se (
kg)=
Mat
eri
al u
se (
kg)=
Mat
eri
al u
se (
kg)=
Mat
eri
al u
se (
kg)=
Mat
eri
al u
se (
kg)=
Was
te g
en
era
tio
n (
kg)=
Was
te g
en
era
tio
n (
kg)=
Was
te g
en
era
tio
n (
kg)=
Was
te g
en
era
tio
n (
kg)=
Was
te g
en
era
tio
n (
kg)=
Ene
rgy
use
(W
h)=
Ene
rgy
use
(kW
h)=
Ene
rgy
use
(kW
h)=
Ene
rgy
use
(kW
h)=
Ene
rgy
use
(kW
h)=
GW
P (
kg C
O2
eq
.)=
GW
P (
kg C
O2
eq
.)=
GW
P (
kg C
O2
eq
.)=
GW
P (
kg C
O2
eq
.)=
GW
P (
kg C
O2
eq
.)=
AP
(kg
SO
2 e
q.)
=A
P (
kg S
O2
eq
.)=
AP
(kg
SO
2 e
q.)
=A
P (
kg S
O2
eq
.)=
AP
(kg
SO
2 e
q.)
=
HT
(kg
1.4
DC
B e
q.)
=H
T (k
g 1.
4 D
CB
eq
.)=
HT
(kg
1.4
DC
B e
q.)
=H
T (k
g 1.
4 D
CB
eq
.)=
HT
(kg
1.4
DC
B e
q.)
=
Co
st (
$)=
Co
st (
$)=
Co
st (
$)=
Co
st p
er
par
t ($
)=C
ost
($)
=
CT
(s)=
CT
(s)=
C/O
( m
in)=
C/O
( m
in)=
Up
tim
e (
%)=
Up
tim
e (
%)=
Mat
eri
al u
se (
kg)=
Mat
eri
al u
se (
kg)=
Was
te g
en
era
tio
n (
kg)=
Was
te g
en
era
tio
n (
kg)=
Ene
rgy
use
(kW
h)=
Ene
rgy
use
(kW
h)=
GW
P (
kg C
O2
eq
.)=
GW
P (
kg C
O2
eq
.)=
AP
(kg
SO
2 e
q.)
=A
P (
kg S
O2
eq
.)=
HT
(kg
1.4
DC
B e
q.)
=H
T (k
g 1.
4 D
CB
eq
.)=
Co
st (
$)=
Co
st (
$)=
1389
.93
0.24
00
221
35
4677
.25
40.1
8
51.7
94.
11
2494
0
881
0
749
612
00
00
Machin
ing S
haft C
NC
BW
eld
ing M
oto
r A
ssem
bly
00
077
.24
0
2911
.28
2304
.18
0.07
26.0
20
9748
.35
7732
.93
12.2
728
4.5
0
68.9
171
.53
5.81
2.83
0
269
200
00
0
126.
822
050
00
3852
3583
012
912
90
088
00
0
Ship
pin
g
688
710
780
647
250
Machin
ing H
ousin
g C
NC
AM
achin
ing H
ousin
gA
ssem
bly
Pain
ting
Fin
ishin
g
040
00
116
9221
.51
77.3
1
1389
.93
0690 0
1778
274
3076
.58
39.9
3
1003
.02
0
Machin
ing M
ountin
g C
ove
r C
NC
A0 0
3220
301
200
Machin
ing E
ccentr
ic C
NC
A
705
0 0
00
00
0
0
0
MR
P
Su
pp
lier
Su
pp
lier
Su
pp
lier
Su
pp
lier
Cu
sto
me
r
132
CHAPTER 5 – CONCLUSION
In the beginning of the study, the basic concept of sustainability and sustainable
manufacturing was presented. Additionally, a comprehensive literature review of the
main environmental impact factors during manufacturing was given. Furthermore,
Life Cycle Assessment was explained and different versions of the method were
introduced. Finally, different manufacturing processes and their environmental impact
were presented.
Sustainability assessment including costs are still rare and are not considered
sufficiently. Besides the aspect of increasing sustainability in manufacturing, the study
also compared improved sustainability with its effects on the costs of manufacturing.
The framework that was developed in this research includes different sustainable
indicators according to the three dimensions of sustainability. These indicators were
evaluated due to criteria that were selected for different issues. Furthermore, the
framework includes the use of LCA software. Therefore, different software was
evaluated and ranked. To include the cost aspects, CACE-Software was selected to
estimate costs for improvements. Finally, all results were represented in a Value
Stream Map, where the indicators for environmental impacts and cost were added.
Based on the given framework, a case study was conducted to test the usability of
the framework. The analyzed product was an Industrial Equipment Unit from a
manufacturing company. After the main components and the manufacturing process of
the IEU were explained a LCA of the current state was performed. As part of the LCA
133
primary data such as: energy consumption, scrap production and waste generation
were collected.
The scope of the LCA was to evaluate the environmental impact of
manufacturing processes and to identify the biggest contributors of emissions.
Therefore the software Umberto NXT LCA was used with the ReCiPe midpoint
method. Two types of models were developed based on the collected data. The first
model presents the current state of the system while the other types of models
simulated an optimized future state version. In one of the future state models, the
mineral based metalworking fluid is replaced by a coconut-oil based fluid. In another,
the painting process is replaced by either a powder coating process or by an uncoated
option. The LCA showed that greatest impacts are due to the production of blank
aluminum casting, which is an external process in the raw material phase and not
under the influence of the manufacturer. However, the optimizations in model 2 lead
to an overall reduction of impacts by 5%. By including cost aspects in the analysis, it
was shown that the optimizations in model 2 and 3 would also have economic benefits
for the manufacturer. By applying the changes of model 2 $56.52 can be saved per
IEU produced. By applying the changes of model 3 about $77.24 can be saved per
IEU produced.
5.1. Discussion
In this section the reliability of the models that were developed reviewed. In
addition, the defined goals are discussed. The first point of discussion is the model
software itself. Umberto NXT LCA is a European software which might not consider
134
the different environmental mechanisms within the United States. This might
influence the characterization of emissions or the determination of the indicators. This
software setup cannot be adjusted. In contrast to that, processes can be chosen due to
their origin. For example, the market for electricity in the East North America is
chosen to respect the national characteristics for energy production and distribution.
However, this adjustment is not possible for all processes. The market location for
aluminum and iron castings is chosen as a global market because there is no other
option. Since there is no other LCA software or database specially developed for the
United States, this point of critique cannot be changed and is accepted.
The next point is the input data. The results of section 4.2 are used for the models.
The reliability of these measures can be stated as satisfying. The problem is that
collected data like the cycle times and energy consumptions of the machining
processes are mixed with calculated values like the amount of metal working fluid.
The CNC-machines used for the manufacturing of the IEU also manufacture other
products; hence it was not possible to measure the actual consumption. Therefore, the
calculation is considered as acceptable, but not ideal. These shortcomings result in
several research options in the future.
5.2. Further research
The most important tasks are the reduction of solid scrap such as aluminum, iron
and steel. This could be achieved by using blank components which are closer to the
final dimensions of the components and require less machining. This would also
decrease energy and metalworking fluid consumption. Alternatively, further research
135
should investigate if it is realistic to change the material of any components to plastic
or iron casting. For the iron casting it has to be investigated whether the extra weight
of the product leads to higher shipping costs and whether these costs exceed the
potential savings in comparison to cast aluminum. Furthermore, higher weight also
leads to higher fuel consumption during transportation which causes a higher
environmental impact during the shipping phase.
Another task for further research would be to include the customer opinion on the
product, since it is important for the company to convince the customers that all
changes did not adversely influence the quality of the product. Further research could
also investigate if customers might be willing to pay more for an environmentally
friendly product. Furthermore, changing to unpainted versions of the IEU also
includes losing a distinctive design feature and recognition value of the brand from a
signature paint color. Investigating the impact of this design change can be another
task for further research.
5.3. Contribution
This study contributes a successful example of how Life Cycle Assessment of a
production process in a small company with limited resources can be conducted. The
assessment identified the processes and materials that are responsible for a high
amount of the environmental impact. It was also found that most of the environmental
impact of the IEU is contributed during the raw material phase. This emphasizes the
importance of Life Cycle Assessment to get to a better understanding of where in the
product life cycle the environmental impact occurs. It also demonstrates the idea that
136
most of the costs and environmental impact from a product are determined early in the
design process, in this case through material selection decisions. Thus, companies that
want to lower costs and environmental impact should pay close attention to these
decisions.
By developing future state models it was shown that there is potential for further
enhancements of the current production process that can lead to less environmental
impact. Furthermore, it was shown that there is an overlap of sustainability and cost
reduction. The findings can encourage companies to conduct LCA and produce their
products more sustainable, which would not only help to keep our planet clean it also
would also save the companies’ money.
137
BIBLIOGRAPHY
DIN 51385:2013-12, 12/2013: Schmierstoffe - Bearbeitungsmedien für die
Umformung und Zerspanung von Werkstoffen. Online available:
http://www.nmp.din.de/cmd?artid=193537339&bcrumblevel=1&contextid=nmp&s
ubcommitteeid=54763937&level=tpl-art-
detailansicht&committeeid=54738983&languageid=de, Last updated: 29.07.2015.
ISO 14040:2006, 2006: ISO 14040 Environmental management - Life cycle
assessment - Principles and framework.
Allwood, Julian M.; Ashby, Michael F.; Gutowski, Timothy G.; Worrell, Ernst (2013):
Material efficiency: providing material services with less material production. In:
Philosophical transactions. Series A, Mathematical, physical, and engineering
sciences 371 (1986), S. 20120496. DOI: 10.1098/rsta.2012.0496.
Allwood, Julian M.; Cullen, Jonathan M.; Milford, Rachel L. (2010): Options for
achieving a 50% cut in industrial carbon emissions by 2050. In: Environ. Sci.
Technol. 44 (6), S. 1888–1894. DOI: 10.1021/es902909k.
Althaus, H. J.; Bauer, C.; Doka, G.; Dones, R.; Frischknecht, R.; Hellweg, S. (2010):
Implementation of Life Cycle Imapct Assessement Metods: ecoinvent report No. 3.
Hg. v. r. v. Hischier und B. Weidema. Swiss Centre for Life Cycle Inventories.
Dübendorf. Online available:
https://inis.iaea.org/search/download.aspx?RN=41028089&redURL=http://www.ia
138
ea.org/inis/collection/NCLCollectionStore/_Public/41/028/41028089.pdf, last
updated: 08.08.2015.
Alves, S. A.; Oliveira, J. (2006): Development of new cutting fluid for grinding
process adjusting mechanical performance and environmental impact. In: Journal
of Materials Processing Technology 179 (1-3), S. 185–189. DOI:
10.1016/j.jmatprotec.2006.03.090.
Apostolos, Fysikopoulos (2013): Energy Efficiency of Manufacturing Processes: A
Critical Review. In: Forty Sixth CIRP Conference on Manufacturing Systems
(vol.7), S. 628–633.
Araujo, Juliano Bezerra de; Oliveira (2012): Evaluation of Two Competing Machining
Processes Based on Sustainability Indicators. In: David A. Dornfeld und Barbara S.
Linke (Hg.): Leveraging Technology for a Sustainable World. Berlin, Heidelberg:
Springer Berlin Heidelberg, S. 317–322.
Asthana, Rajiv; Kumar, Ashok; Dahotre, Narendra B. (2006): Materials Science in
Manufacturing. Amsterdam: Elsevier.
Aurich, J. C.; Linke, B.; Hauschild, M.; Carrella, M.; Kirsch, B. (2013): Sustainability
of abrasive processes. In: CIRP Annals - Manufacturing Technology 62 (2), S. 653–
672. DOI: 10.1016/j.cirp.2013.05.010.
Boothroyd, G.; Dewhurst, Peter; Knight, W. A. (2011): Product design for
manufacture and assembly. 3rd ed. Boca Raton, Fl: CRC Press (Manufacturing
engineering and materials processing, 74).
139
Boothroyd, Geoffrey; Knight, Winston A. (2006): Fundamentals of machining and
machine tools. 3rd ed. Boca Raton, FL: Taylor & Francis (Mechanical
engineering).
Boubekri, Nourredine; Shaikh, Vasim (2012): Machining Using Minimum Quantity
Lubrication: A Technology for Sustainability. In: International Journal of Applied
Science and Technology (2).
Brown, A.; Amundson, J.; Badurdeen, F. (2014): Sustainable value stream mapping
(Sus-VSM) in different manufacturing system configurations: application case
studies. In: Journal of Cleaner Production 85, S. 164–179. DOI:
10.1016/j.jclepro.2014.05.101.
Bullinger, H.-J; Warschat, J. (1995): Concurrent simultaneous engineering systems.
The way to successful product development. Berlin, New York: Springer.
Bullinger, Hans J.; Spath, Dieter; Warnecke, Hans J.; Westkämper, Engelbert (2008):
Handbuch Unternehmensorganisation. Strategien, Planung, Umsetzung. 3., neu
bearb. Aufl. Berlin: Springer Berlin (VDI).
Chang, Ya-Ju; Sproesser, Gunther; Neugebauer, Sabrina; Wolf, Kirana; Scheumann,
René; Pittner, Andreas et al. (2015): Environmental and Social Life Cycle
Assessment of Welding Technologies. In: Procedia CIRP 26, S. 293–298. DOI:
10.1016/j.procir.2014.07.084.
140
Christiansen, K. (1997): Simplifying LCA: just a cut? Final report from the SETAC-
Europe LCA screening and streamlining working group. Bruxelles: SETAC-
Europe.
Clarens, Andres F.; Zimmerman, Julie B.; Keoleian, Greg A.; Hayes, Kim F.; Skerlos,
Steven J. (2008): Comparison of Life Cycle Emissions and Energy Consumption
for Environmentally Adapted Metalworking Fluid Systems. In: Environ. Sci.
Technol. 42 (22), S. 8534–8540. DOI: 10.1021/es800791z.
Creese, Robert C. (1999): Introduction to manufacturing processes and materials. New
York: Marcel Dekker (Manufacturing engineering and materials processing, 54).
Curran, Mary Ann (2012): Life cycle assessment handbook. A guide for
environmentally sustainable products. Hoboken, N.J., Salem, Mass.: Wiley;
Scrivener.
Dahmus, J. B.; Gutowski, Timothy G. (2004): An Environmental Analysis of
Machining. In: Jeffrey B. Dahmus und Timothy G. Gutowski (Hg.): An
environmental analysis of machining. ASME 2004 International Mechanical
Engineering Congress and Exposition. Anaheim, California, USA, November 13 –
19, 2004. Massachusetts Institute of Technology, S. 643–652.
Dalaquist, S.; Gutowski, Timothy G. (2004): Life Cycle Analysis of Conventional
Manufacturing Techniques: Sand Casting. In: Jeffrey B. Dahmus und Timothy G.
Gutowski (Hg.): An environmental analysis of machining. ASME 2004
International Mechanical Engineering Congress and Exposition. Anaheim,
141
California, USA, November 13 – 19, 2004. Massachusetts Institute of Technology,
S. 630–637.
Deloitte (2009): Finding the green in today’s shoppers Sustainability trends and new
shopper insights.
Dixit, U.S; Sarma, D.K; Davim, J. Paulo (Hg.) (2012): Environmentally Friendly
Machining. Boston, MA: Springer US (SpringerBriefs in Applied Sciences and
Technology).
Dornfeld, David (2011): Leveraging Manufacturing for a Sustainable Future. In:
Jürgen Hesselbach und Christoph Herrmann (Hg.): Glocalized Solutions for
Sustainability in Manufacturing. Berlin, Heidelberg: Springer Berlin Heidelberg, S.
17–21.
Dresdner, S. (2003): The principles of sustainability. In: Bus. Strat. Env. 12 (5), S.
341. DOI: 10.1002/bse.360.
Drury, Colin (1992): Management and cost accounting. 3rd ed. London, New York:
Chapman & Hall (The Chapman & Hall series in accounting and finance).
Dyckhoff, Harald; Spengler, Thomas Stefan (2007): Produktionswirtschaft. Eine
Einführung für Wirtschaftsingenieure ; mit 10 Tabellen. 2., verb. Aufl. Berlin,
Heidelberg, New York: Springer (Springer-Lehrbuch).
EPA (2007): The Lean and Environment Toolkit. Hg. v. United States Environmental.
Online available: http://www.epa.gov/lean/environment/toolkits/energy/index.htm,
last updated 01.07.2015.
142
Eskilander, S. (2001): Design For Automatic Assembly. A Method For Product
Design: DFA2. Stockholm.
Europe INNOVA (2012): Guide to resource efficiency in manufacturing: Expe riences
from improving resource efficiency in manufacturing companies. Brüssel.
Eversheim, W. (2013): Organisation in Der Produktionstechnik. Konstruktion:
Springer Verlag.
Eversheim, Walter; Bochtler, Wolfgang; Laufenberg, Ludger (1995): Simultaneous
engineering. Erfahrungen aus der Industrie für die Industrie. Berlin, New York:
Springer-Verlag.
Faulkner, W.; Templeton, W.; Gullett, D.; Badurdeen, F. (2012): Visualizing
Sustainability Performance of Manufacturing Systems Using Sustainable Value
Stream Mapping (Sus-VSM). In: Proceedings of the 2012 International Conference
on Industrial Engineering and Operations Management, Instanbul Turkey, July 3-6.
Faulkner, William; Badurdeen, Fazleena (2014): Sustainable Value Stream Mapping
(Sus-VSM): methodology to visualize and assess manufacturing sustainability
performance. In: Journal of Cleaner Production 85, S. 8–18. DOI:
10.1016/j.jclepro.2014.05.042.
Feng, S. C.; Jung, Jong-Yun; Joung, C.-B.; Li, G. (2010): Development Overview of
Sustainable Manufacturing Metrics. Proceedings of the 17th CIRP International
Conference on Life Cycle Engineering Li. Online available:
http://www.sustainelectronics.illinois.edu/NSFworkshop/Reading/Development%2
143
0Overview%20of%20Sustainable%20Manufacturing%20Metrics.pdf, last updated:
03.08.2015.
Gaubinger, Kurt; Rabl Michael,Scott, Swan; Werani, Thomas (2014): Innovation and
product management. A holistic and practical approach to uncertainty reduction
(Springer Texts in Business and Economics).
Goedkoeep, M.; Heijungs, R.; Huijbregts, M., Schryver, A.; Struijs, J. (2013): ReCiPE
2008: Report I: Characterisation. Hg. v. Ministerie van Volkshuivesting
Ruimtelijke Ordening en Milieubeheer. Online available http://www.lcia-
recipe.net/, last updated 08.08.2015.
Goedkoop, M. (2014): Characterisation - ReCiPe. Hg. v. M. Goedkoop. Online
available: http://www.lcia-recipe.net/characterisation-and-normalisation-factors,
last updated: 08.08.2015.
Grzesik, Wit (2008): Advanced machining processes of metallic materials. Theory,
modelling and applications. Oxford, Boston: Elsevier.
Guinée, J. B. (2006): Handbook on life cycle assessment. Operational guide to the ISO
standards. Dordrecht, Boston: Kluwer Academic Publishers (Eco-efficiency in
industry and science, v. 7).
Gutowski, Timothy; Dahmus, Jeffrey; Thiriez, Alex (2006): Elektrical Energy
Requirements for Manufacturing Processes. In: 13th CIRP International
Conference of Life Cycle Engineering (vol), S. 564–579.
144
Gutowski, Timothy G.; Dalaquist, S. (2004): Life cycle analysis of conventional
manufacturing techniques: die casting. In: Jeffrey B. Dahmus und Timothy G.
Gutowski (Hg.): An environmental analysis of machining. ASME 2004
International Mechanical Engineering Congress and Exposition. Anaheim,
California, USA, November 13 – 19, 2004. Massachusetts Institute of Technology,
S. 690–697.
Hauf, M.: (2014): Nachhaltige Entwicklung: Grundlagen und Umsetzung. München:
De Gruyter Oldenbourg.
Hendrickson, Chris T.; Lave, Lester B.; Matthews, H. Scott (2006): Environmental life
cycle assessment of goods and services. An input-output approach. Washington,
DC: Resources for the Future (RFF Press).
Herrmann, Christoph (2010): Ganzheitliches Life Cycle Management. Nachhaltigkeit
und Lebenszyklusorientierung in Unternehmen. Berlin, Heidelberg: Springer-
Verlag Berlin Heidelberg (VDI-Buch).
Hesselbach, Jürgen; Herrmann, Christoph (Hg.) (2011): Glocalized Solutions for
Sustainability in Manufacturing. Berlin, Heidelberg: Springer Berlin Heidelberg.
Hinrichsen, Don (1989): Our common future. A reader's guide. London, Washington,
D.C.: Earthscan.
Huang, G. Q. (1996): Design for X. Concurrent engineering imperatives. Dordrecht:
Springer Netherlands.
145
Jensen, A.; Hoffmann, L.; Moller, B.; Schmidt, A. (2006): Life Cycle Assessement. A
guide to approaches, experiences and information sources. Hg. v. European
Environment Agency (6). Online available:
http://www.epa.gov/nrmrl/std/lca/pdfs/Issue20report20No206.pdf last updated:
23.07.2015.
Kalla, D.; Twomey, J.; Overcash, M. (2010): Methodology for systematic analysis and
improvement of manufacturing unit process life cycle inventory (UPLCI). Online
available: Dr. Devi Kalla, Dr. Janet Twomey, and Dr. Michael Overcash, last
updated: 25.06.2015.
Kalpakjian, Serope; Schmid, Steven R. (2013): Manufacturing engineering and
technology. Seventh edition. Upper Saddle River,NJ: Prentice Hall.
Keeble, Brian R. (1988): The Brundtland report: ‘Our common future’. In: Medicine
and War 4 (1), S. 17–25. DOI: 10.1080/07488008808408783.
Klöpffer, Walter (2012): Background and future prospects in life cycle assessment
(LCA compendium).
Klöpffer, Walter; Grahl, B. (2014): Life cycle assessment (LCA). A guide to best
practice.
Lawal, S. A.; Choudhury, I. A.; Nukman, Y. (2012): Application of vegetable oil-
based metalworking fluids in machining ferrous metals—A review. In:
International Journal of Machine Tools and Manufacture 52 (1), S. 1–12. DOI:
10.1016/j.ijmachtools.2011.09.003.
146
Lindahl, M. (2006): Engineering designers' experience of design for environment
methods and tools – Requirement definitions from an interview study. In: Journal
of Cleaner Production 14 (5), S. 487–496.
Linne, S.; Schwarz M. ( 2003): Handbuch nachhaltige Entwicklung. Opladen: Leske
and Budrich.
Ljungberg, Lennart Y. (2007): Materials selection and design for development of
sustainable products. In: Materials & Design 28 (2), S. 466–479. DOI:
10.1016/j.matdes.2005.09.006.
Lodhia, C. (2007): A Macro level environmental performance comparison: dry
machining process vs wet machining process. Wichita State University, Wichita.
Luedemann, L.; Feig, K. (2014): Comparison of software solutions for Life Cycle
Assessment (LCA) – a software ergonomic analysis. In: Logistics Journal: nicht
referierte Veröffentlichungen 2014.
Meadows, Donella H. (1972): The Limits to growth;. A report for the Club of Rome's
project on the predicament of mankind. New York: Universe Books (Potomac
Associates books).
Micro Estimating Systems (2012): What is Computer Aided Estimating? Hg. v. Micro
Estimating Systems Inc. Online available:
http://www.microest.com/articles/WhatIsCAE.pdf, last updated: 29.07.2015.
NACFAM (2009): Sustainable Manufacturing. With assistance of National Council
for Advanced Manufacturing. Hg. v. The National Council for Advanced
147
Manufacturing. Online
available:http://www.nacfam.org/PolicyInitiatives/SustainableManufacturing/tabid/
64/Default.apsx, last updated: 27.07.2015.
Niazi, Adnan; Dai, Jian S.; Balabani, Stavroula; Seneviratne, Lakmal (2006): Product
Cost Estimation: Technique Classification and Methodology Review. In: J. Manuf.
Sci. Eng. 128 (2), S. 563. DOI: 10.1115/1.2137750.
O'Riordan, Tim (2004): Environmental science, sustainability and politics. In: Trans
Inst Br Geog 29 (2), S. 234–247. DOI: 10.1111/j.0020-2754.2004.00127.x.
Ostwald, Phillip F. (1992): Engineering cost estimating. 3rd ed. Englewood Cliffs,
N.J.: Prentice Hall.
Perera, G. I. P. (2014): White Coconut Oil Based Emulsion as a Metal Working Fluid
during Turning. In: International Journal of Applied Engineering Research 9 (21).
Ponn, Josef; Lindemann, Udo (2008): Konzeptentwicklung und Gestaltung
technischer Produkte. Optimierte Produkte - systematisch von Anforderungen zu
Konzepten. Berlin, Heidelberg: Springer (VDI).
Ranganathan, J. (1988): Sustainability Rulers: Measuring Corportate Environmental
and Social Performance. Sustainable Enterprise Perspectives. World Source
Institute. Washington, DC. Online available:
http://www.wri.org/sites/default/files/pdf/sustainability_rulers.pdf, last updated:
03.08.2015.
148
Roberts, M.; Hu, E.; Nahavandi, S.: The fifth Asia Pacific Conference on Sustainable
Energy and Environmental Technologies, Wellington, New Zealand, 8-11 May
2005. In: Special Issue for The Review of Japan Macro-Engineers, S. 256–260.
Robertson, Margaret (2014): Sustainability principles and practice. 1. publ. London
u.a.: Routledge. Online available: http://lib.myilibrary.com?id=568794.
Rose, Catherine Michelle (2001): Design for environment. A method for formulatin
product end-of-life strategies. Ann Arbor, Mich.
Rother, Mike; Shook, John (2003): Learning to see. Value stream mapping to create
value and eliminate muda. Version 1.3. Brookline, MA: Lean Enterprise Institute.
Savitz, Andrew W.; Weber, Karl (2007): The sustainability sweet spot. In: Environ.
Qual. Manage. 17 (2), S. 17–28. DOI: 10.1002/tqem.20161.
Schenk, Michael; Müller, Egon; Wirth, Siegfried (2014): Fabrikplanung und
Fabrikbetrieb. Methoden für die wandlungsfähige, vernetzte und
ressourceneffiziente Fabrik. 2., vollst. überarb. und erw. Aufl. Berlin [u.a.]:
Springer Vieweg.
Seliger, Günther (2007): Sustainability in Manufacturing. Berlin, Heidelberg: Springer
Berlin Heidelberg.
Shashidhara, Y. M.; Jayaram, S. R. (2010): Vegetable oils as a potential cutting
fluid—An evolution. In: Tribology International 43 (5-6), S. 1073–1081. DOI:
10.1016/j.triboint.2009.12.065.
149
Shrivastava, Amber; Krones, Manuela; Pfefferkorn, Frank E. (2015): Comparison of
energy consumption and environmental impact of friction stir welding and gas
metal arc welding for aluminum. In: CIRP Journal of Manufacturing Science and
Technology 9, S. 159–168. DOI: 10.1016/j.cirpj.2014.10.001.
Simonen, Kathrina (2014): Life cycle assessment. First edition. London: Routledge
(PocketArchitecture: technical design series).
Stephenson, David A.; Agapiou, John S. (2006): Metal cutting theory and practice.
2nd ed. Boca Raton, FL: CRC Taylor & Francis (Manufacturing engineering and
materials processing, 68).
Tan, X.C; Liu, F.; Cao, H.J; Zhang, H. (2002): A decision-making framework model
of cutting fluid selection for green manufacturing and a case study. In: Journal of
Materials Processing Technology 129 (1-3), S. 467–470. DOI: 10.1016/S0924-
0136(02)00614-3.
Thamling, N.; Seefeldt, F.; Glöckner, U. (2010): Rolle und Bedeutung von
Energieeffizienz und Energiedienstleistungen in KMU. Hg. v. Prognos AG. Basel.
Theis, T.; Tomkin, J. (2012): Sustainability: A Comprehensive Foundation. Hg. v.
Rice University Connexions. Houston, Texas. Online available:
https://archive.org/details/ost-earth-sciences-col11325, last updated: 27.07.2015.
Thiede, Sebastian (2012): Energy efficiency in manufacturing systems. Berlin, New
York: Springer (Sustainable production, life cycle engineering and management).
150
Todd, J. A.; Curran, M. A. (2007): Streamlined Life-Cycle Assessment: A Final
Report from the SETAC North America Streamlined LCA Workgroup. Hg. v.
Society of Environmental Toxicology and Chemistry (SETAC). Online available:
http://www.ce.cmu.edu/~hsm/lca2007/readings/streamlined-lca.pdf, last updated:
23.07.2105.
Twardowska, Irena; Allen, Herbert E.; Kettrup, A. A.; Lacy, W. J. (2004): Solid
waste. Assessment, monitoring and remediation. 1st ed. Amsterdam: Elsevier
(Waste management series (Pergamon (Firm)), v. 4).
United Nations (2013): Sustainable Development. United Nations. Online available:
http://sustainabledevelopment.un.org/csd.html, last updated: 28.07.2015.
United Nations (2011): Develepment-ed globalization: Towards sustainable and
inclusive development path. New York and Geneva: United Nations publication.
http://unctad.org/en/docs/tdxiii_report_en.pdf, last updated: 28.07.2015
United Nations (2005): General Assembly World Summit Outcome, Resolution
New York and Geneva: United Nations publication.
http://data.unaids.org/Topics/UniversalAccess/worldsummitoutcome_resolution_24oct
2005_en.pdf last updated: 11.07.2015
Veleva, Vesela; Ellenbecker, Michael (2001): Indicators of sustainable production:
framework and methodology. In: Journal of Cleaner Production 9 (6), S. 519–549.
DOI: 10.1016/S0959-6526(01)00010-5.
151
Westkämper, Engelbert (2006): Einführung in die Organisation der Produktion.
Berlin, Heidelberg: Springer-Verlag Berlin Heidelberg (Springer-Lehrbuch).
Windsor, Samuel E. (2011): An introduction to green process management.
Milwaukee, Wis: ASQ Quality Press.
Yilmaz, Ozge; Anctil, Annick; Karanfil, Tanju (2014): LCA as a decision support tool
for evaluation of best available techniques (BATs) for cleaner production of iron
casting. In: Journal of Cleaner Production. DOI: 10.1016/j.jclepro.2014.02.022.
Zein, André (2012): Transition towards energy efficient machine tools. Heidelberg,
New York: Springer (Sustainable production, life cycle engineering and
management).