Embed Size (px)
Citation preview
-'s'
K/
AD-A238 396 NWCTP...8
Coso Monitoring ProgramOctober 1989 Through September 1990
byJ. H. Monahan
andD. E. Condon
Comarco Weapons Support Divisionfor the
Public Works Department
JANUARY 1991
NAVAL WEAPONS CENTERCHINA LAKE, CA 93555-6001
Approved for public release; distributionis unlimited.
91-05066

Naval Weapons Center
FOREWORD
This report presents the status of the Coso Monitoring Program conducted forthe period October 1989 through Septerrher 1990 by the Naval Weapons Center(NWC), China Lake, Calif. The investigation, funded under the NWC CosoGeothermal Development Program, is being conducted to provide baseline informationon hydrology and surface geothermal activity in the Coso Hot Springs area.
Comarco personnel aided in the successful completion of the 1989-90 CosoMonitoring Program under contract N60530-88-D-0019 for the Public WorksDepartment, NWC.
This report was reviewed for technical accuracy by Steven C. Bjomstad andJames A. Whelan.
Approved byUnder authority of
J. R. WILLIAMS D. W. COOKCdr., CEC, U.S. Navy Capt., U.S. NavyPublic Works Officer Commander24 January 1991
Released for publication byW. B. PORTERTechnical Director
NWC Technical Publication 7138
Published by ............................................ .... Public Works DepartmentCollation .................................................................... Cover, 70 leavesFirst printing ...................................................................... 175 copies
Public reporting burden for this collecion of Information Is eustimated to aveag I hour per response, including the time for reviewing Instructions. searching existing deaabourcee, gathering andmaiintaining thre data needed, and owneatng and reiiiewing the collection of information. Send comrments regarding thes burden estimrate or any other aspect of this colIectn of informatiion, includngsuggestions for reducing tisa burden, to Washington Headquarters Services. Directorate for Informnation, Operations anid Reports. 1215 Jefferson Davis Highway, Suite 1204. Arlington. VA220-4O anid to thie Off" of Managentw end! Budget. Paperworkr Reductio Prt 1ed (0704-0188), Washington. DC 205031.
1. AGENCY USE ONLY (Leave blank) 12. RE PORT DATE 3. REPORT TYPE AND DATES COVERED
I Jan 1991 1 Oct 89 -- 30 Sep 904. TITLE AND SUBTITLE S. FUNDING NUMBERS
COSO MONITORING PROGRAM, N60530-88-D-0019OCTOBER 1989 THROUGH SEPTEMBER 1990
6. AUTHOR(S)
Monahan, J. H., and Condon, D. E.
7. PERFORMING ORGANIZATION NAME(S) AND ADDRESS(ES) 6. PERFORING ORGAIZATIONREPORT NUMBER
Naval Weapons CenterChina Lake, CA 93555-6001 NWC TP 7138
9. SPONSORING/MONITORING AGENCY NAME(S) AND ADDRESS(ES) 10. SPONSORING/MONITORINGAGENCY REPORT NUMBER
ii. SUPPLEMENTARY NOTES
12s. DISTRIBUTION/AVAILABIUITY STATEMENT 12b. DISTRIBUTION CODE
A statement; public release; distribution unlimitedI
13. ABSTRACT (Max nlm 200 worode)
(U) The Coso Monitoring Program is a continuing effort in support of the development of the Navy's geothermal resourceswithin the Known Geothermal Resource Area (KGRA). Data are presented on the monitoring of Steamn flow rates andtemperatures, water levels in ponds and wells, water chemistry, and rainfall in the Coso Hot Springs Resort Area. A monthlyphotographic essay of the mud pots and pools shows the variation of surface water levels throughout the year.
14. SUBJECT TERMS IS. NUMBER OF PAGES
Coso Monitoring Program Steamn Flow, Coso Hot Springs Barometric Pressure 138Environmental Monitoring Water Analysis 18. PRICE CODE
Geothe'rmal Development Water Level, Coso Hot Springs ____
17. SECURITY CLASSIFICATION 1S. RECURITY CLARSIFICATION is1. SECURITY CLASSIFICATION 120. LIMITATION OF ABSTRACTOF REPOR UF iHIS PAGIIs OF ABSTRACTI
Unclassified Unclassified Unclassif ied SAR
NSN 740-125500 Standard Form 298 (Rev. 2.89)Prescried by AN SI Sid. 219-18298-102
UNCLASSIFIEDSECURrY CLASSIFICATION OF THIS PAGE (Wbe Des Emwa)
Standrd Form 2US Back (Rev. 2-"0SECURITY CLASSIFICATION OF THIS PAGE
UNCLASSIFIED
*7 L
NWCTP 7138
CONTENTS ,-
Introduction .................................................................................... 5
Temperature and Steam Flow Monitoring .................................................. 5Devils Kitchen ..................................................... ............. 94P-2 (Two-Inch Steam Well) ....................................................... 94H-4 (Eight-Inch "Stove Pipe" Well) ............................................. 144A-2 and 4A-3 (Schober's Resort Wells) .................................... 15
Coso Mud Pot Photographic Investigation ................................................. 20
Water Level Monitoring .................................................................... 33Observation Wells .................................................................. 33South Pool ........................................................................... 33
Rainfall at Coso Resort Area and Rose Valley ............................................. 38
Coso Hot Springs Mini-Weather Recording Station .................................... 45
Water Analysis of Coso Hot Springs Area Sites .................................... 464 K -1 .................................................................................... 55
Temperature Recordings of the Coso Resort Area Wells ............................... 55
Other Geothermal Activity at Coso Hot Springs .......................................... 60West Canyons ........................................................................ 60Mud Crater 4KC-8 .................................................................. 60Mud Crater 4KC-9 .................................................................. 60Mud Crater 4KC-10 .............................................................. 61Activity East of the Resort and Northeast of South Pool ....................... 614H-8 (Coso Well No. 1) .......................................................... 614A-2 Through 4A-5, 4A-13 Through 4A-17(Schober's Resort Wells) ....... 634H-1, 2, 3, and 7 (Coso Resort Corrosion Array) ............................... 63
Summary ....................................................................................... 63
Plans For 1991 .............................................................................. 64
R eferences ...................................................................................... 65
App, ..6ices:A. Daily Steam Flow Data .................................. 67B. FOaily Temperature Data ...................................................... 93C. Well Temperature Data ........................................................ 111
1
NWC TP 7138
Figures:1. Coso Known Geothermal Resource Area Monitoring Sites ................ 72. Coso Hot Springs Monitoring Sites ........................................... 83. Devils Kitchen Steam Flow .................................................... 104. 4P-2 (Two-Inch Steam Well) Flow ........................................... 115. 4P-2 (Two-Inch Steam Well) Flow, 18 June Through 28 September ..... 126. 4P-z (Two-Inch Steam Well) Steam Temperature ........................... 137. 4H-4 (Eight-Inch "Stove Pipe" Well) Steam Flow ........................ 158. 4A-2 and 4A-3 (Schober's Resort Wells) Steam Flow ..................... 179. 4A-2 and 4A-3 (Schober's Resort Wells) Steam Temperature ............. 18
10. 4A-2 and 4A-3 (Schober's Resort Wells) Ambient Temperature ........... 1911. Coso Mud Pots, 3 October 1989 ............................................ 2112. Coso Mud Pots, 6 November 1989 ......................................... 2213. Coso Mud Pots, 4 December 1989 ........................................... 2314. Coso Mud Pots, 2 January 1990 ............................................ 2415. Coso Mud Pots, 12 February 1990 ........................................... 2516. Coso Mud Pots, 5 March 1990 ............................................. 2617. Coso Mud Pots, 2 April 1990 ................................................ 2718. Coso Mud Pots, 14 May 1990 ................................................ 2819. Coso Mud Pots, 4 June 1990 ............................................. 2920. Coso Mud Pots, 2 July 1990 .................................................. 3021. Coso Mud Pots, 9 August 1990 ............................................ 3122. Coso Mud Pots, 4 September 1990 ...................................... 3223. South Pool Elevations, January 1980 Through September 1990 .......... 3624. South Pool Elevation and Temperature, October 1988
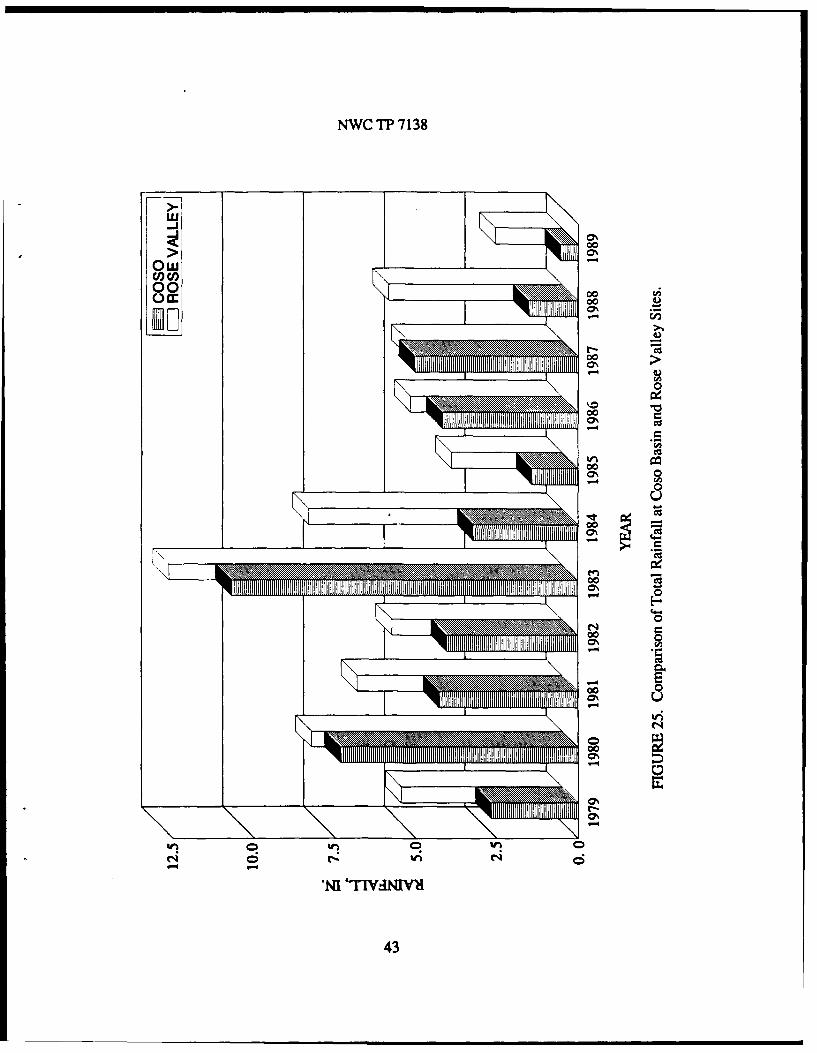
Through September 1990 ...................................................... 3725. Comparison of Total Rainfall at Coso Basin and Rose Valley,
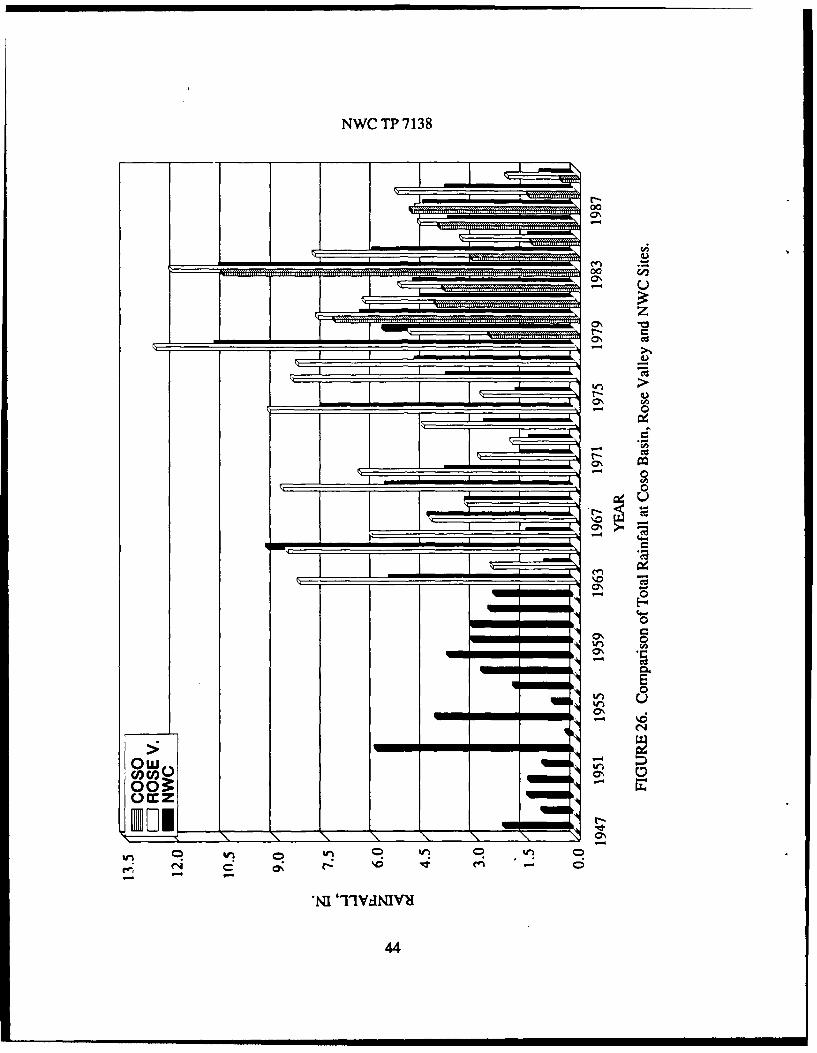
by Y ear ............................................................................ 4326. Comparison of Total Rainfall at Coso Basin, Rose Valley,
and NWC Sites, by Year ...................................................... 4427. Barometric Pressure Readings ................................................ 4528. Graph of Chemical Analysis, Well 4K-1 ................................... 5529. Temperature Profile, 4H-8 (Coso Well No. 1) ............................... 5630. Temperature Profile, Well 4K-I ............................................. 5731. Temperature Profile, Well 4P-1 .............................................. 5832. Temperature Profile, Well 4A-4 ............................................. 5933. Aerial Photo of Coso Resort Area, 19 July 1989 ........................... 62
Tables:1. Monitoring Functions and Locations .......................................... 62. Devils Kitchen Statistical Steam Flow ......................................... 93. 4P-2 (Two-Inch Steam Well) Statistical Steam Flow ........................ 144. 4P-2 (Two-Inch Steam Well) Statistical Steam Temperature ............... 145. 4H-4 (Eight-Inch "Sto,c Pipe" Well) Statistical Steam Flow ............. 166. 4A-- and 4A-3 (Schober's Resort Wells) Statistical Steam Flow .......... 207. 4A-2 and 4A-3 (Schober's Resort Wells) Statistical Steam
Tem perature ...................................................................... 208. Obse ;aftn Well Water Level Data, Depth to Water ....................... 349. South Pool Elevation and Temperature Changes ............................ 35
2
NvWCT "P 7138
10. Rainfall Recorded at Coso Monitoring Stations, Inches ................... 3911. Rose Valley Cumulative Rainfall ............................................. 4012. IWV, Rose Valley, and Coso Basin Rainfall Comparison, 1947
Through 1989 ................................................................... 4113. Chemical Analysis of Devils Kitchen Stream ................................. 4614. Chemical Analysis of Well OB-I ........................................... 4715. Chemicai Analysis of Well 4P-1 .............................................. 4816. Chemical Analysis of Well 4K-i ............................................. 4917. Chemical Analysis of South Pool ............................................. 5018. Chemical Analysis of Coso Well 4KC-10 .................................... 5119. Chemical Analysis of Mudfield Runoff ...................................... 5220. Chemical Analysis of Well 4H-8 ............................................. 5321. Chemical Analysis of Well 4H-4 ............................................. 54
ACKNOWLEDGEMENT
The authors would like to acknowledge Eugene M. Edwards, Comarco,Weapons Support Division, for his photographic contributions to this report.
3
NWCTP 7138
INTRODUCTION
The Coso Monitoring Program was initiated in 1978 to gather baseline data onthe surface and near surface geothermal activity at Devils Kitchen and Coso HotSprings, the main thermal sites within the Coso Known Geothermal Resource Area(Coso KGRA). This report represents the thirteenth year of continual baseline datacollection.
Numerous changes occurred at the thermal sites in the past year. Some are acontinuation of work begun in 1989 and reported in the last report, and others are newchanges in response to physical events that occurred in 1990. For example, datacollection was interrupted at two sites when physical activity made it necessary toreconfigure the collection mechanisms. A mini-weather data station was also installed inthe area. These activities will all be discussed in the individual site discussions.
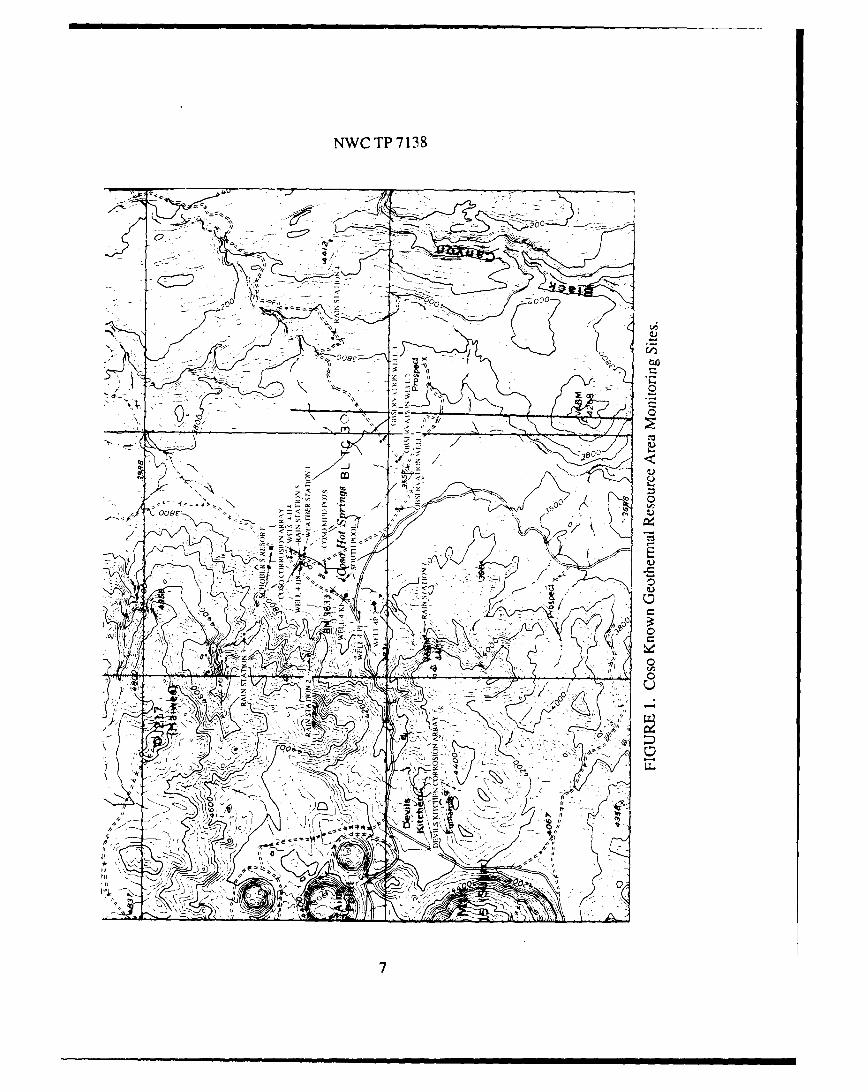
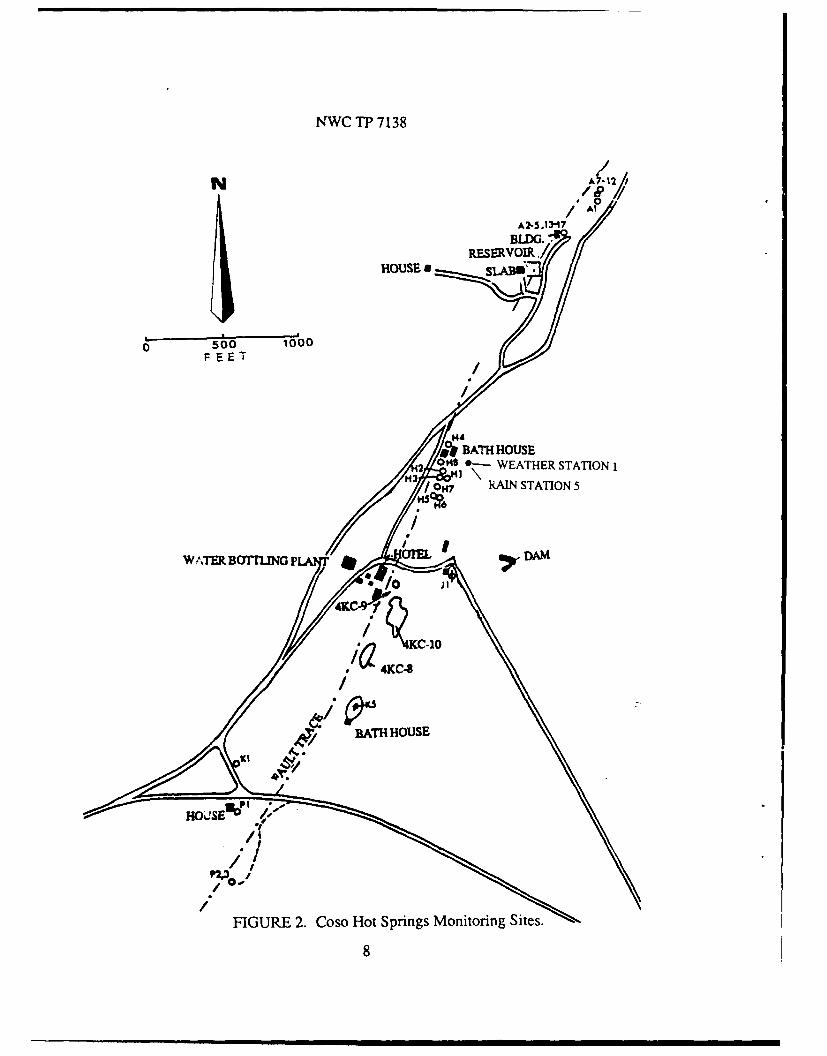
Monitored sites of the Coso Hot Springs area and type of data collected at eachsite are presented in Table 1. The location of each site is shown in Figures 1 and 2.
TEMPERATURE AND STEAM FLOW MONITORING
Steam flow and temperature are measured at several sites in the Coso HotSprings area. One monitoring site is located within Devils Kitchen, and the otherstations are located along the Airport Lake-Coso Hot Springs Fault. Temperature dataare used as collected, while the steam flow data are converted from graph units to steamflow in pounds per hour. The conversion factors for the steam data are calculated usingthe standard orifice equation for gas flow. The Barton pressure differential meters andtemperature recorders were calibrated during the months of April and May.
5

NWC TP 7138
TABLE 1. Monitoring Functions and Locatizns.
~~ 0
Monitored Sites3 3
Schober's Resort(4A-2, 3) .............. X X xX
Eight-Inch SteamWell (4H-4)............ X
Coso Well No.1I(4H-8)..................... Xb x X
Two-Inch Steam Well(4P-2) ................. X X
Well 4P-1I .................. X X X
Well 4K- I......... Xb x xDevils Kitchen........... X X
Observation Well No. 1 Xa X
Observation Well No. 2 xa
Observation Well No. 3 xa
South Pool................ xa x x x
Weather Station No. 1 .... -C -C - - - -
a. Weekly monitoring.b. Less than weekly.c. Hydrothermograph in- talled in September 1990 for test chart. Data
collection started 1 October 1990
6
NWC TP 7138
-N , 0
-77
NWC TP 7138
IAlA2.5,.1317
BLDG..RESERVOIR .
HOUSE&a
0 500 lo00F EE T
RATH HOUSE2 ON$ 0-~ WEATHER STATION 1
3 N RAIN STATION 5
FIGRE . osoHotSping Moitrin Sies
W -'XR BOTLJNGP D8
NWCTP7138
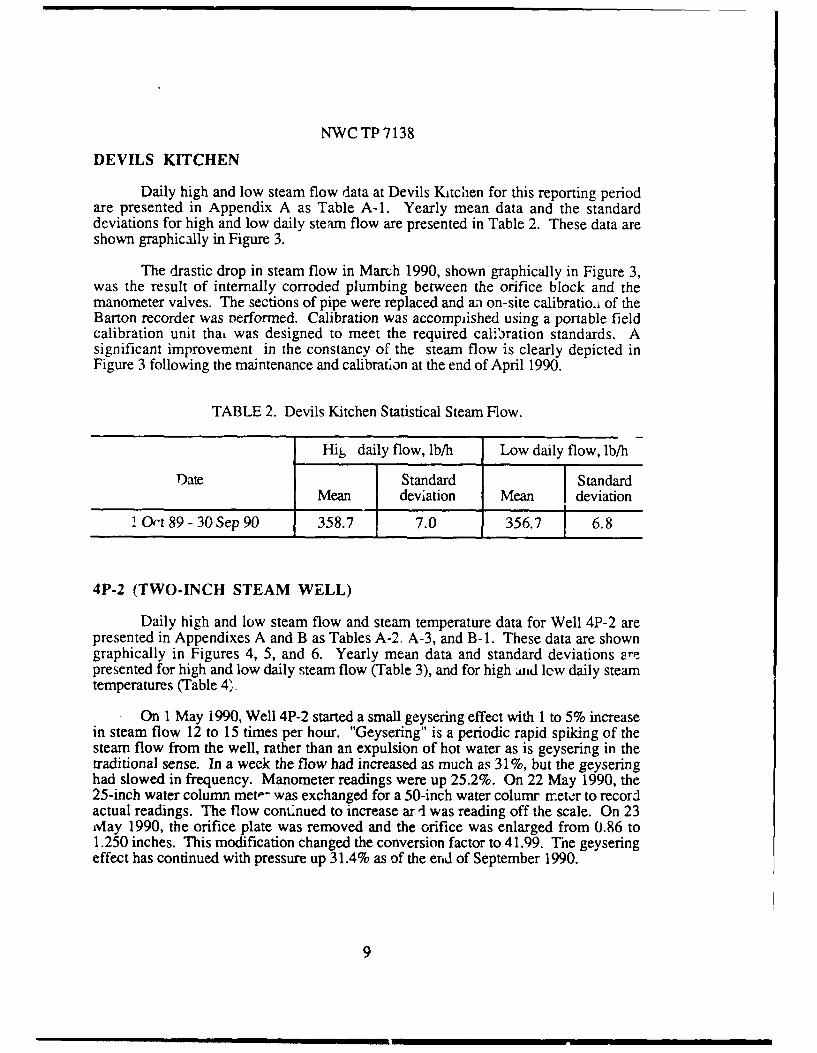
DEVILS KITCHEN
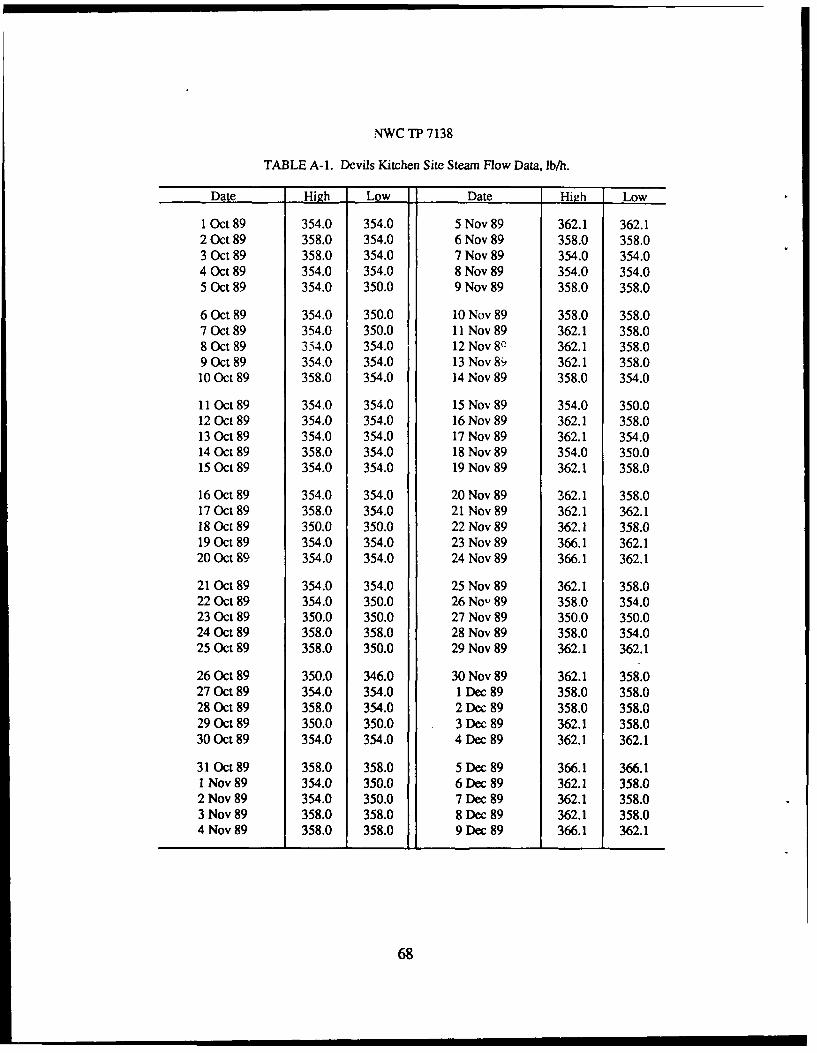
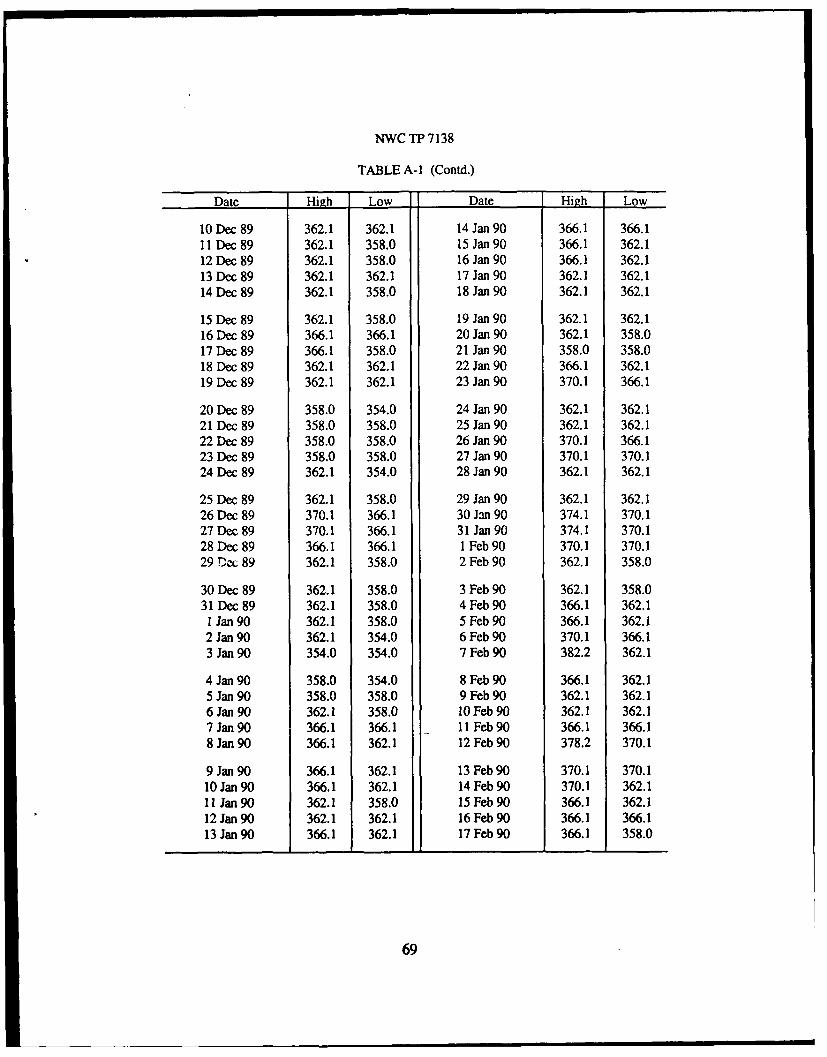
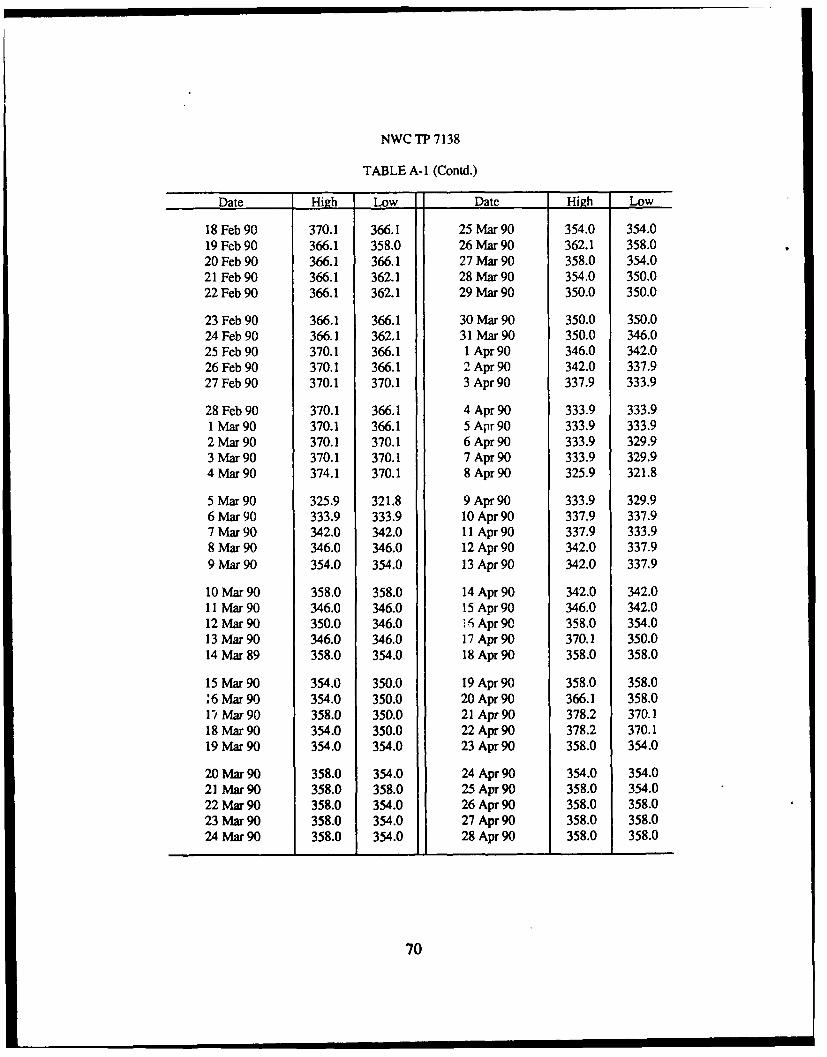
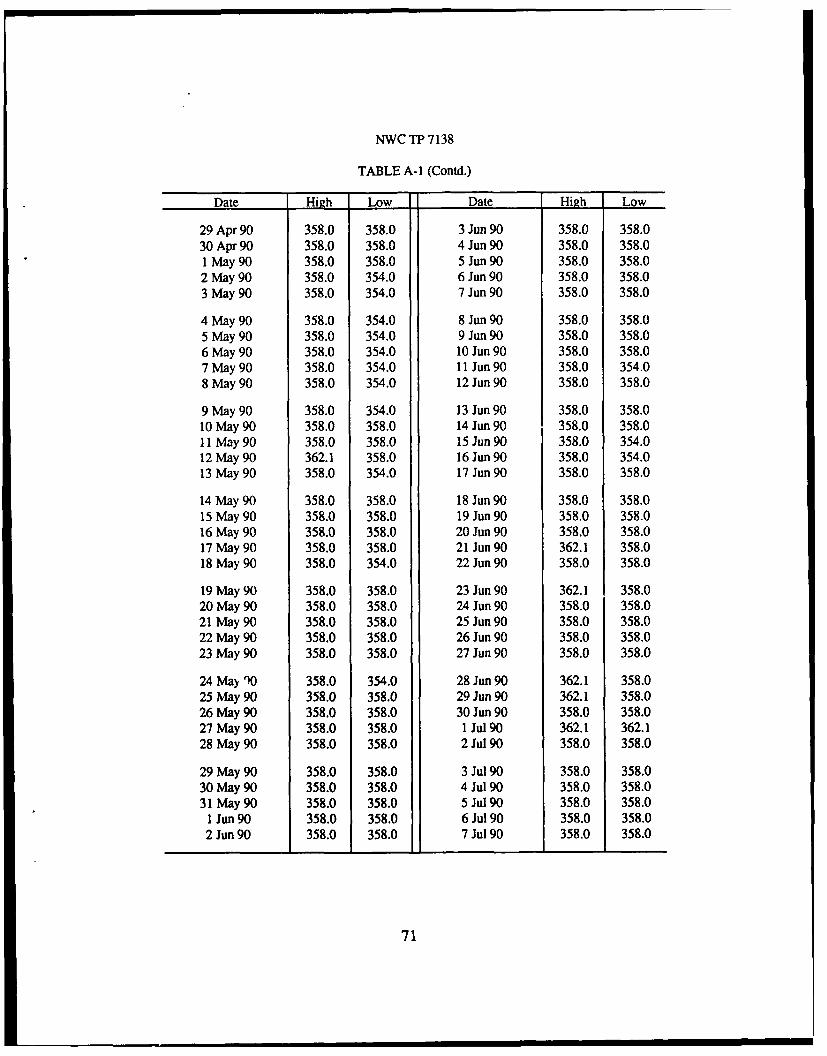
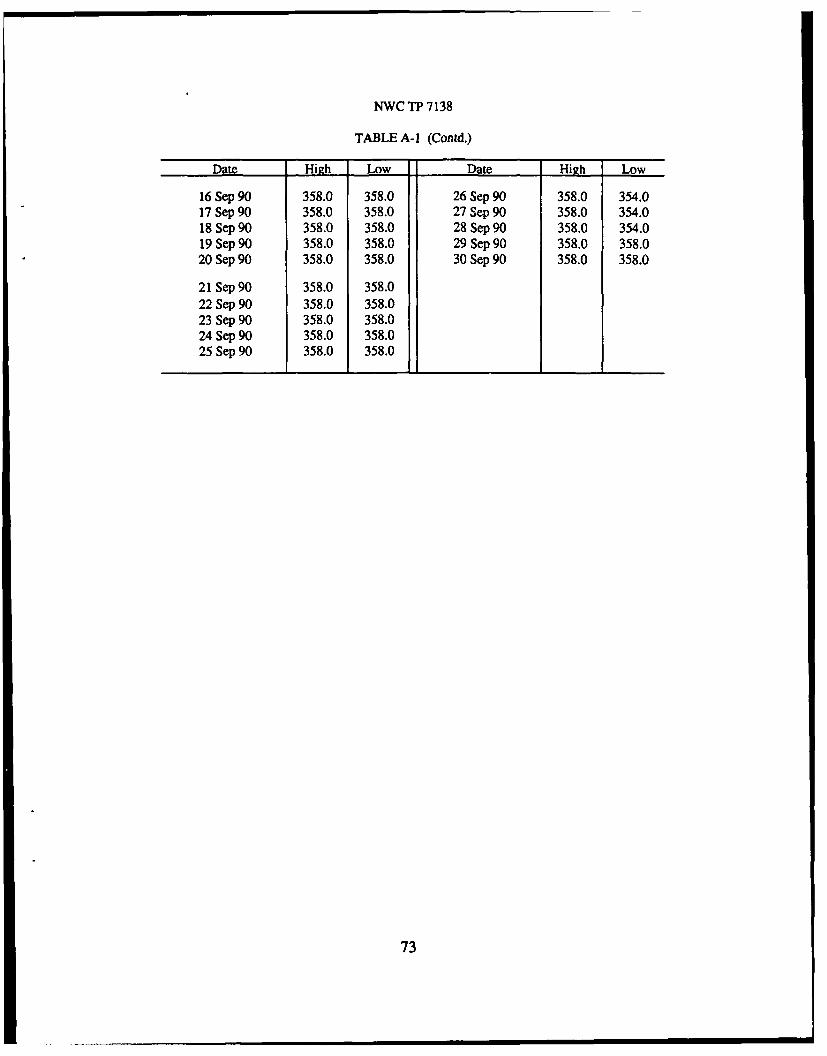
Daily high and low steam flow data at Devils Kitchen for this reporting periodare presented in Appendix A as Table A-1. Yearly mean data and the standarddeviations for high and low daily steam flow are presented in Table 2. These data areshown graphically in Figure 3.
The drastic drop in steam flow in March 1990, shown graphically in Figure 3,was the result of internally corroded plumbing between the orifice block and themanometer valves. The sections of pipe were replaced and an on-site calibratio.i of theBarton recorder was nerformed. Calibration was accompiished using a portable fieldcalibration unit thak was designed to meet the required calibration standards. Asignificant improvement in the constancy of the steam flow is clearly depicted inFigure 3 following the maintenance and calibration at the end of April 1990.
TABLE 2. Devils Kitchen Statistical Steam Flow.
Hig daily flow, lb/h Low daily flow, lb/h
Date Standard StandardMean deviation Mean deviation
I Oct 89 - 30Sep 90 358.7 7.0 356.7 6.8
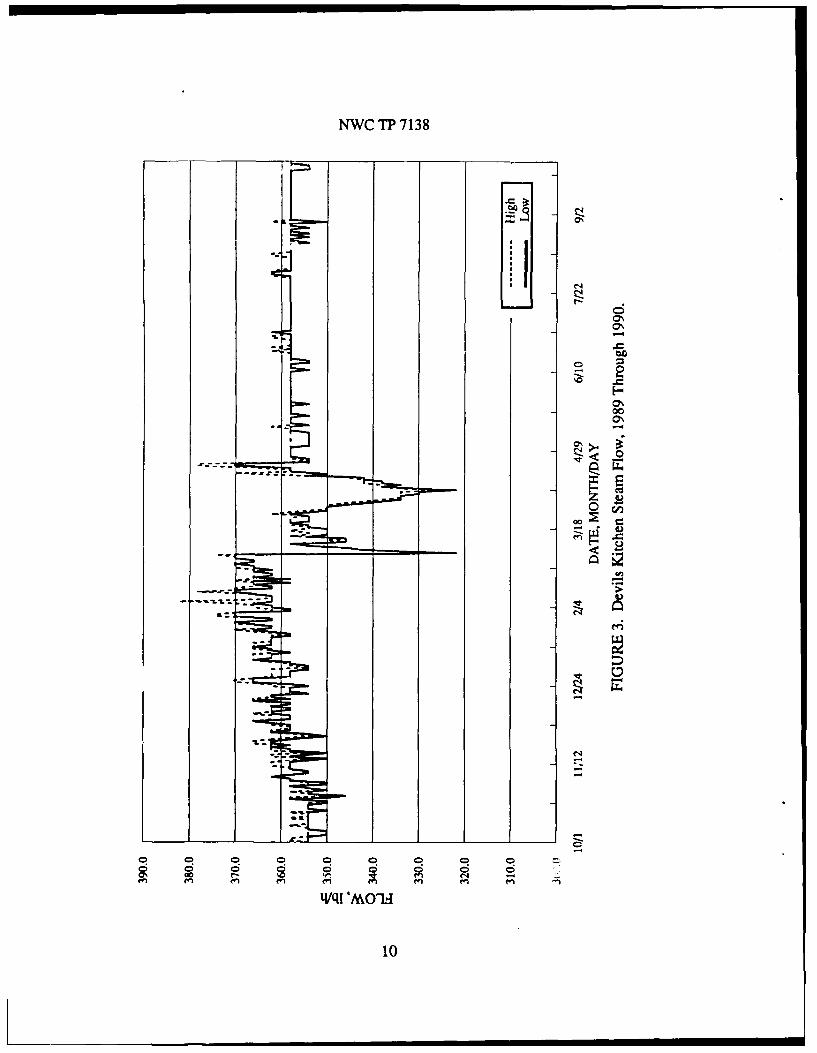
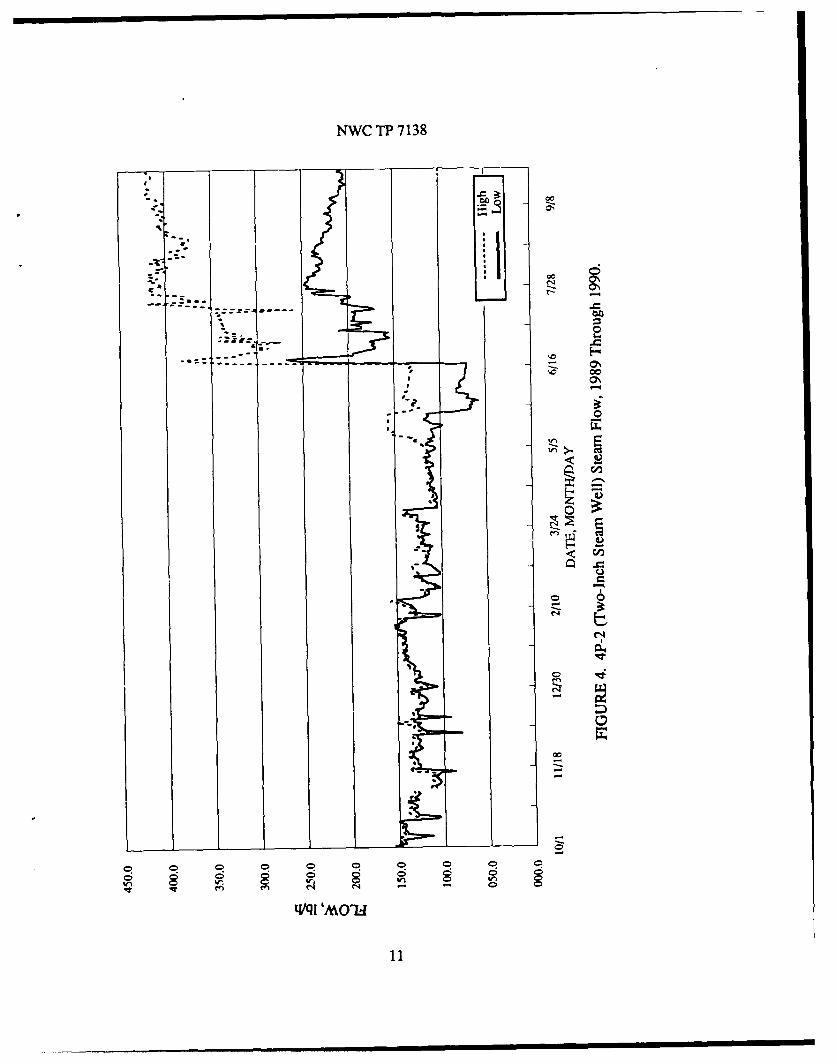
4P-2 (TWO-INCH STEAM WELL)
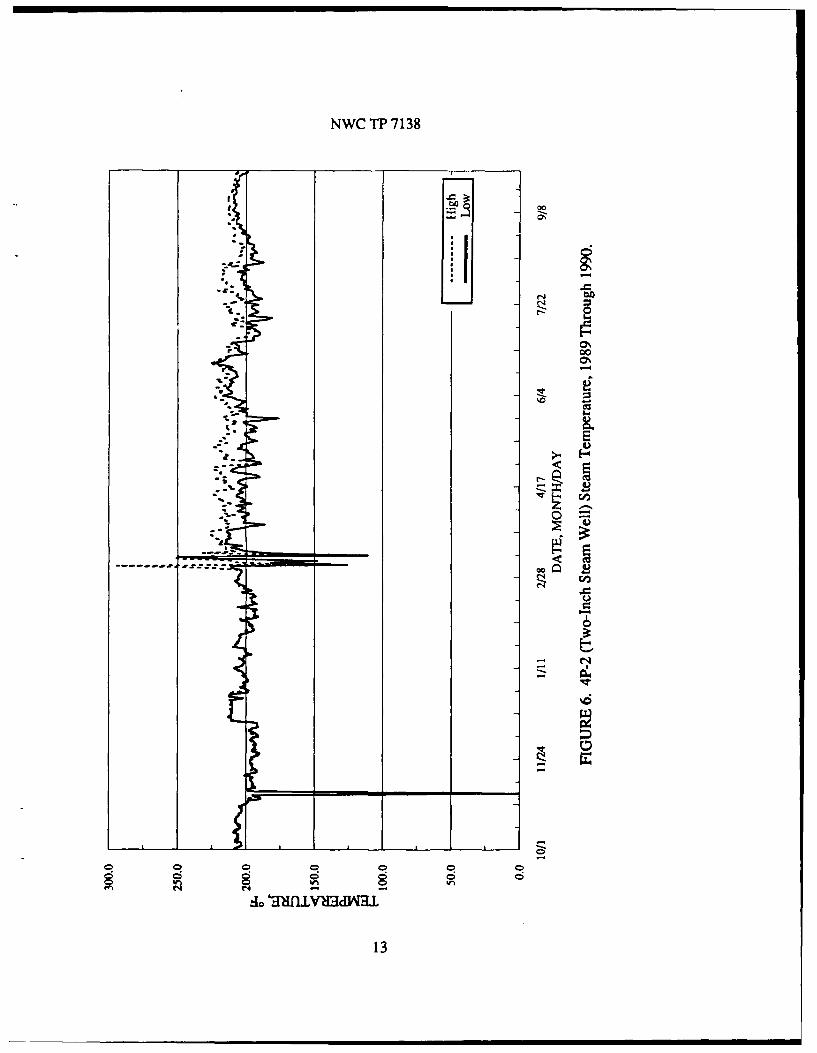
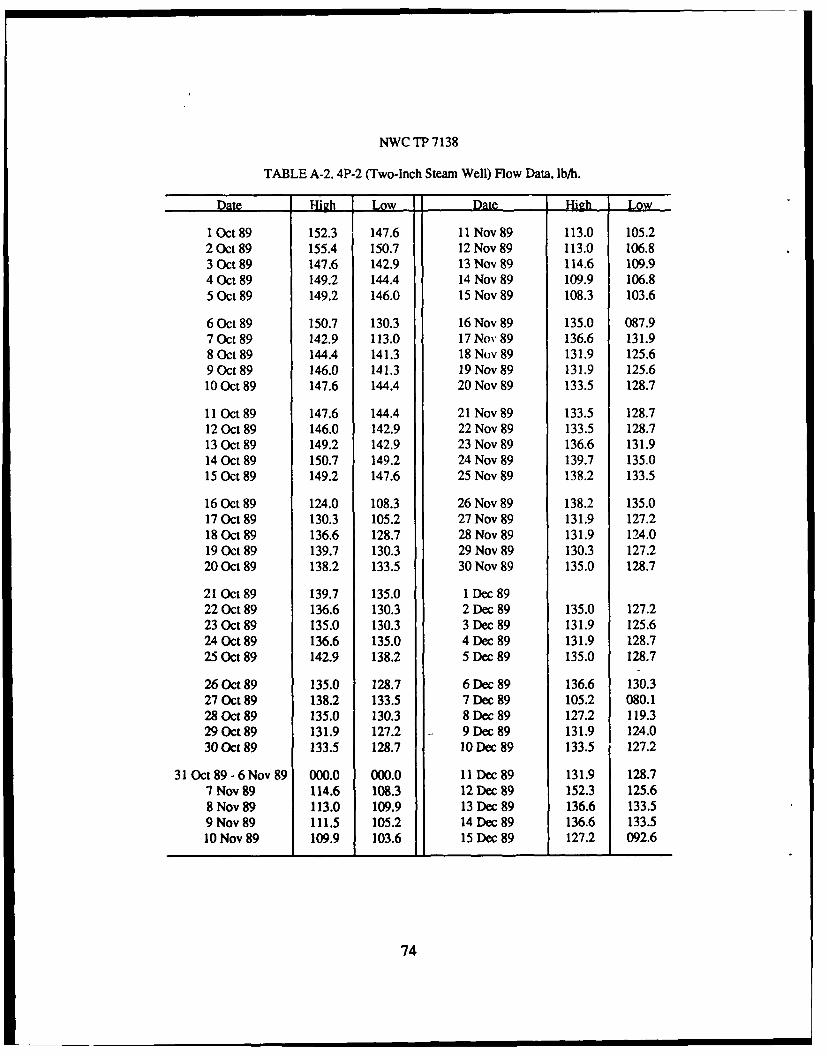
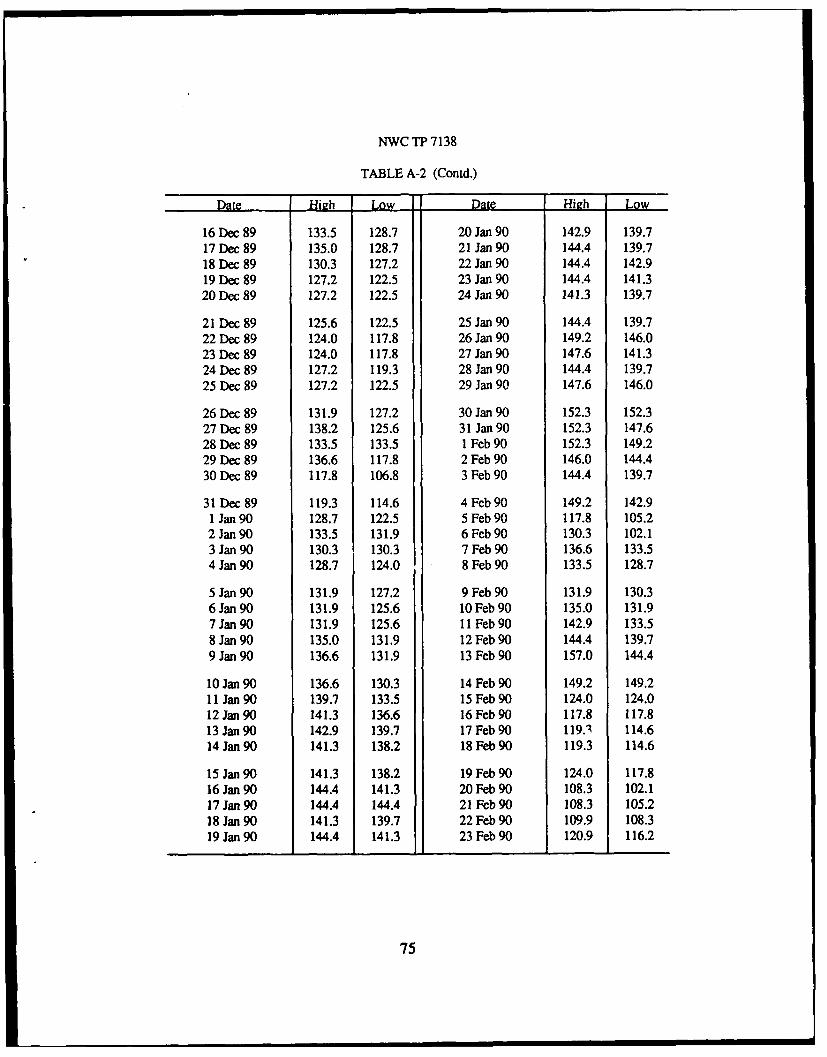
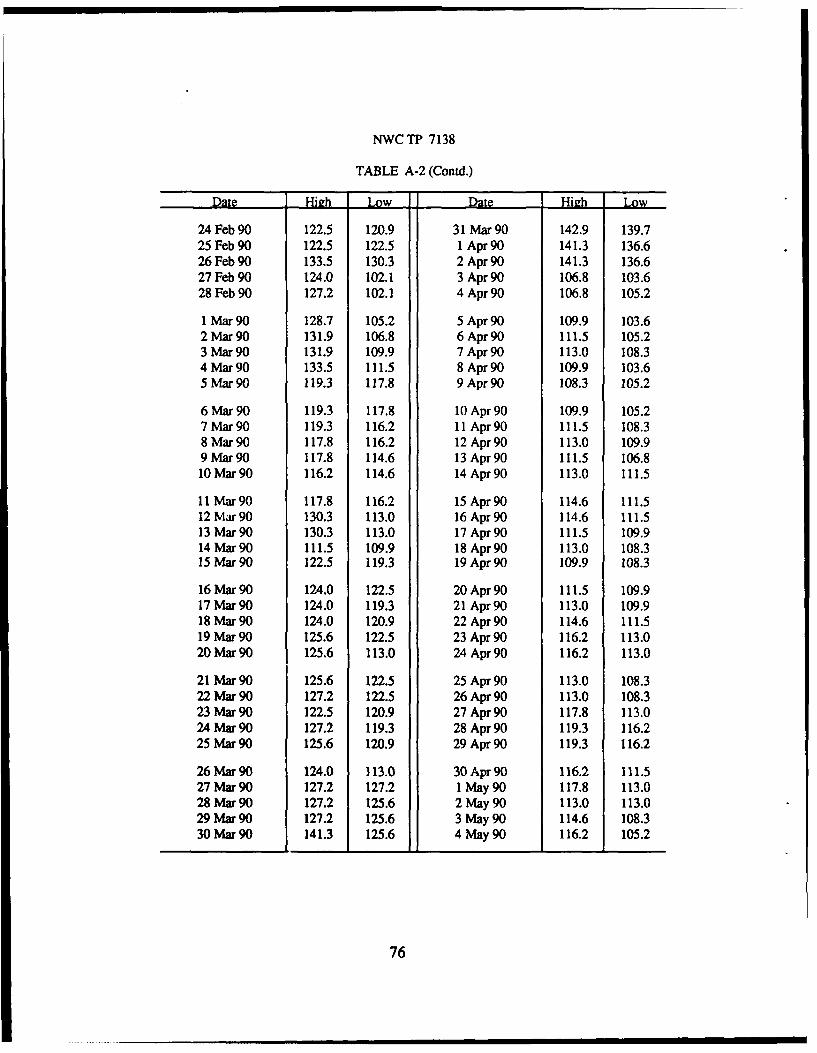
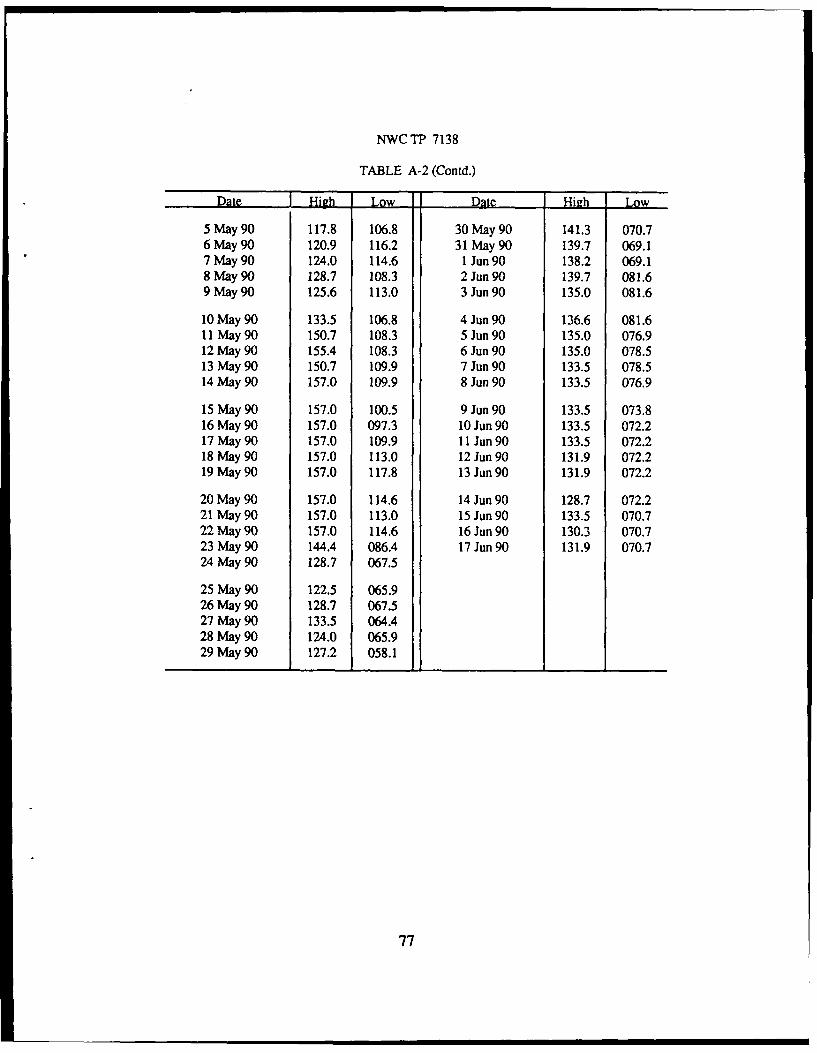
Daily high and low steam flow and steam temperature data for Well 4P-2 arepresented in Appendixes A and B as Tables A-2. A-3, and B-1. These data are showngraphically in Figures 4, 5, and 6. Yearly mean data and standard deviations ar'epresented for high and low daily steam flow (Table 3), and for high and low daily steamtemperatures (Table 4),.
On 1 May i990, Well 4P-2 started a small geysering effect with 1 to 5% increasein steam flow 12 to 15 times per hour. "Geysering" is a periodic rapid spiking of thesteam flow from the well, rather than an expulsion of hot water as is geysering in thetraditional sense. In a week the flow had increased as much as 31%, but the geyseringhad slowed in frequency. Manometer readings were up 25.2%. On 22 May 1990, the25-inch water column met'- was exchanged for a 50-inch water columr rnetr to recordactual readings. The flow continued to increase ar.I was reading off the scale. On 23May 1990, the orifice plate was removed and the orifice was enlarged from 0.86 to1.250 inches. This modification changed the conversion factor to 41.99. The geyseringeffect has continued with pressure up 31.4% as of the end of September 1990.
9
NWC TP 7138
t i I
00
C4C
w/qi 'MO1A
10
NWC TP 7138
00
0'.
CaCOO
- ---- 0%
U. I
o 0
S -
'L'ql 'McTOq
11
NWC TP 7138
U!
00
00
SI-4
U*S. C,
en C4
q/qlA&U)
'I.12
NWC TP 7138
- 00
4. r4
0
* Cu
13-
NWC TP 7138
Well 4P-2 has been unstable for recording data since June 1989. The Bartonmeter was calibrated, serviced, zeroed, and balanced several times prior to the constantreadable geysering.
TABLE 3. 4P-2 (Two-Inch Steam Well) Statistical Steam Flow.
High daily flow, lb/h Low daily flow, lb/h
Date Standard StandardMean deviation Mean deviation
I Oct 89 - 30 Sep 90 202.8 115.3 144.5 47.7
TABLE 4. 4P-2 (Two-Inch Steam Well) Statistical Steam Temperature.
High daily temperature, OF Low daily temperature, OF
Date Standard StandardMean deviation Mean deviation
1 Oct 89 - 30 Sep 90 207.8 15.2 200.3 14.6
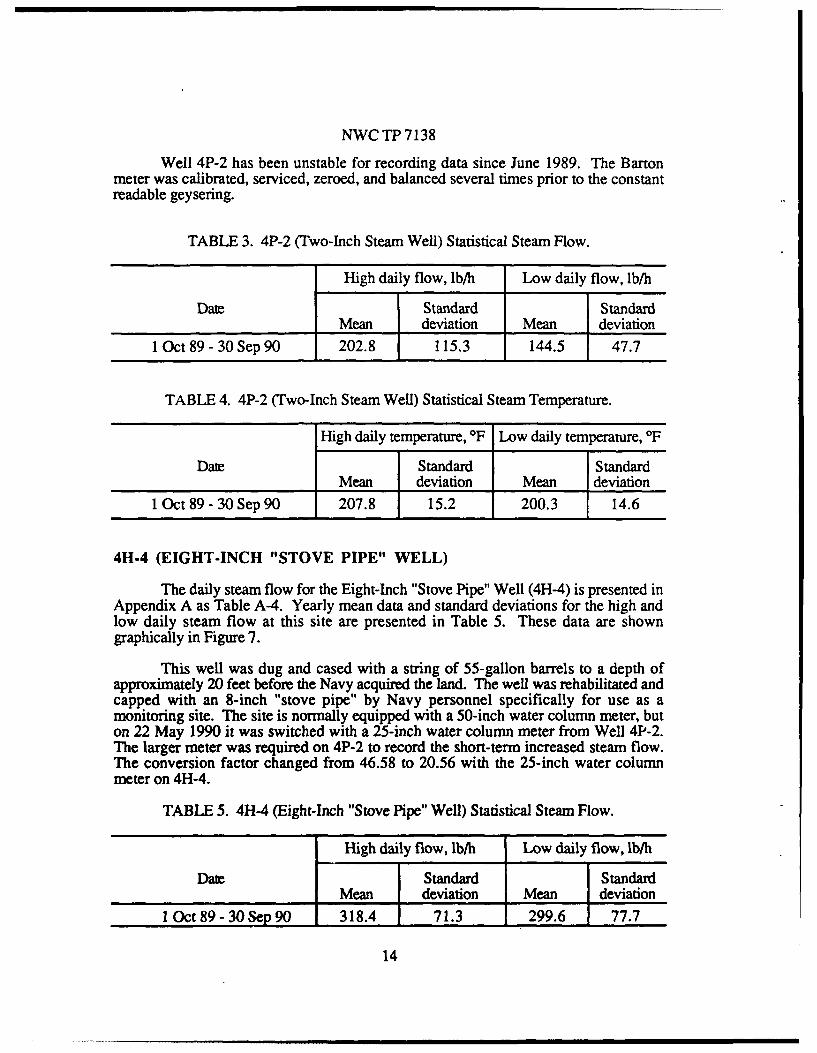
4H-4 (EIGHT-INCH "STOVE PIPE" WELL)
The daily steam flow for the Eight-Inch "Stove Pipe" Well (4H-4) is presented inAppendix A as Table A-4. Yearly mean data and standard deviations for the high andlow daily steam flow at this site are presented in Table 5. These data are showngraphically in Figure 7.
This well was dug and cased with a string of 55-gallon barrels to a depth ofapproximately 20 feet before the Navy acquired the land. The well was rehabilitated andcapped with an 8-inch "stove pipe" by Navy personnel specifically for use as amonitoring site. The site is normally equipped with a 50-inch water column meter, buton 22 May 1990 it was switched with a 25-inch water column meter from Well 4P-2.The larger meter was required on 4P-2 to record the short-term increased steam flow.The conversion factor changed from 46.58 to 20.56 with the 25-inch water columnmeter on 4H-4.
TABLE 5. 4H-4 (Eight-Inch "Stove Pipe" Well) Statistical Steam Flow.
High daily flow, lb/h Low daily flow, lb/h
Date Standard StandardMean deviation Mean deviation
I Oct 89 - 30 Sep 90 318.4 71.3 299.6 77.7
14
NWCTP7138
(~J- -. 0~.
~2
- .5H -
4.
q.
.1*0%000%a -
0
i
1~
'a...
"-9-
- oc~~
-C
C
(~
-S
S.?-
.~. .~.
r-~.
I2
____ ____ ____ ____ ~..1. ____ ____0
0 0 0 0 0 0 9 0 9
'vqi 'MO~U
15
NWC TP 7138
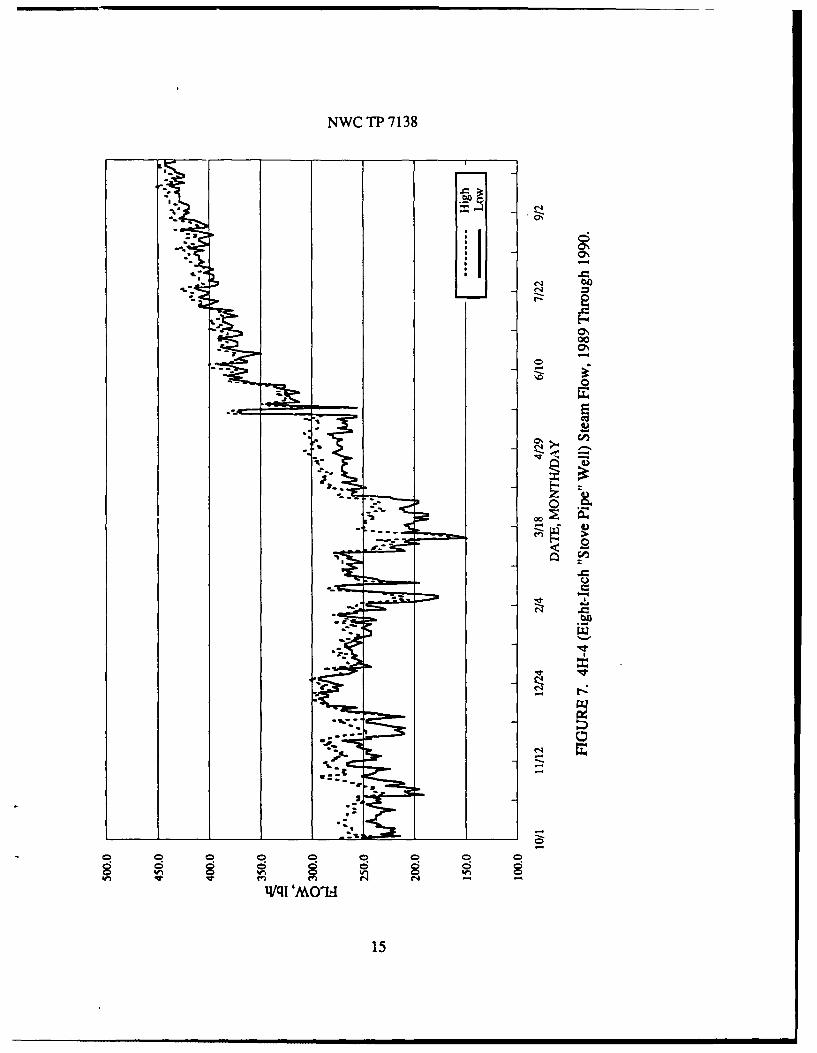
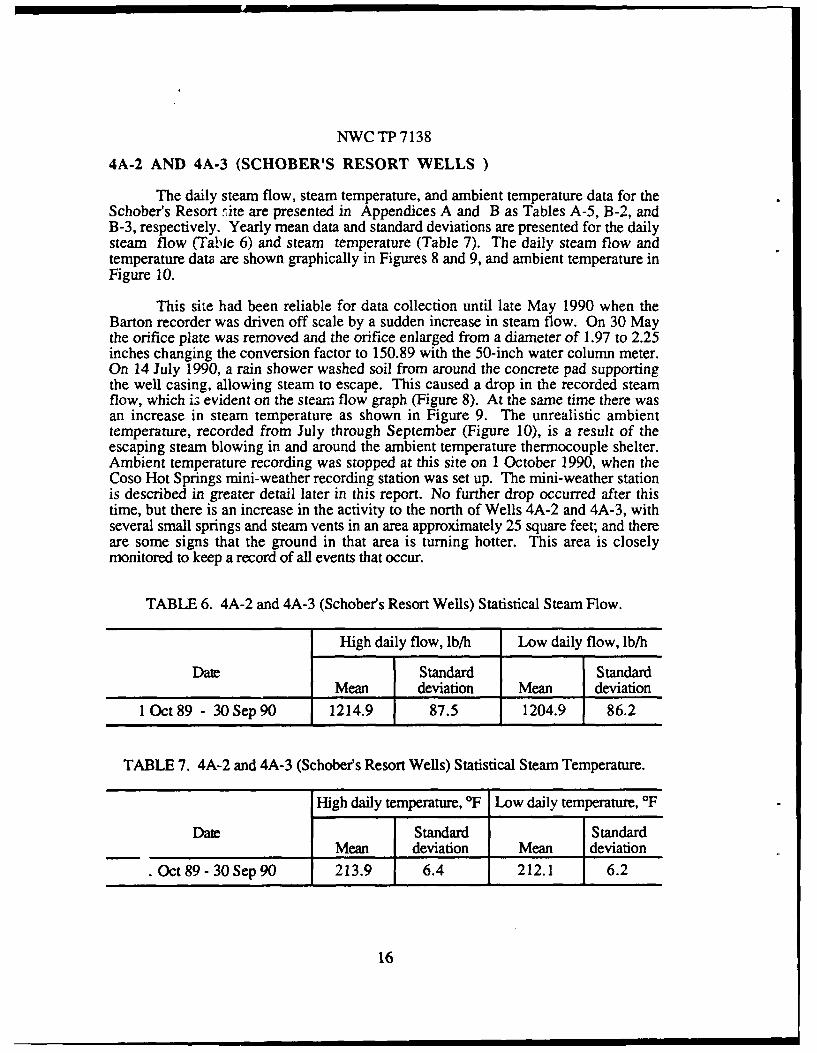
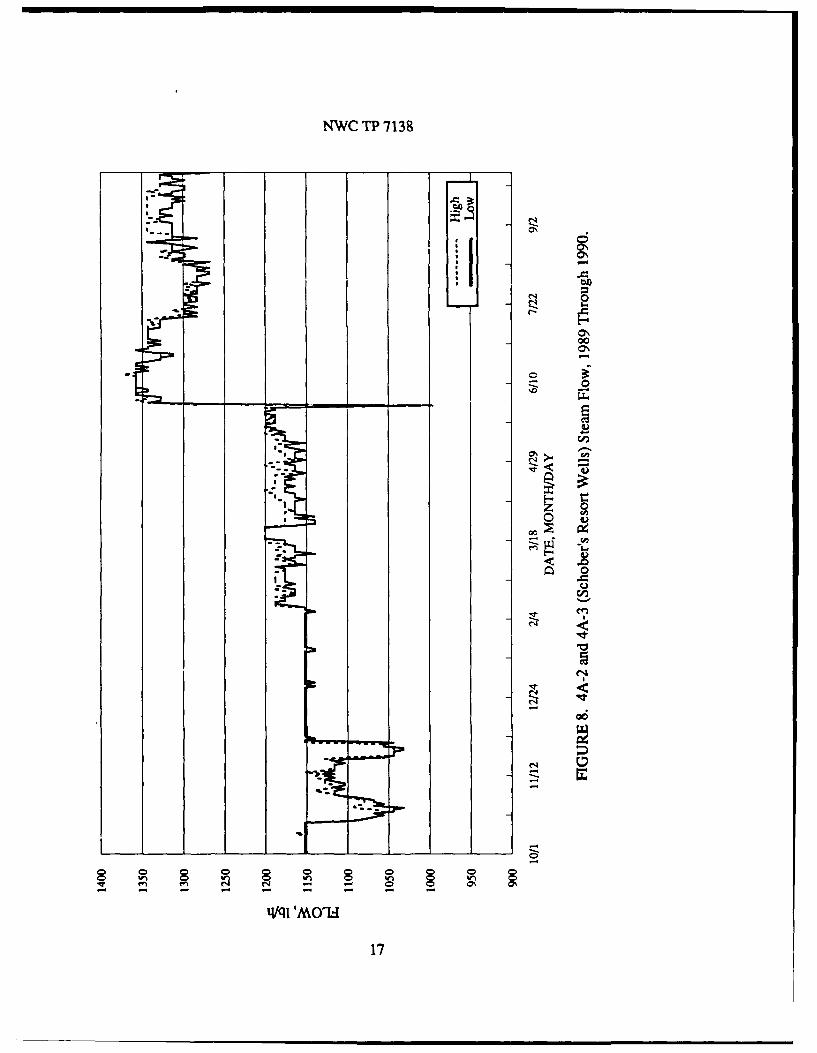
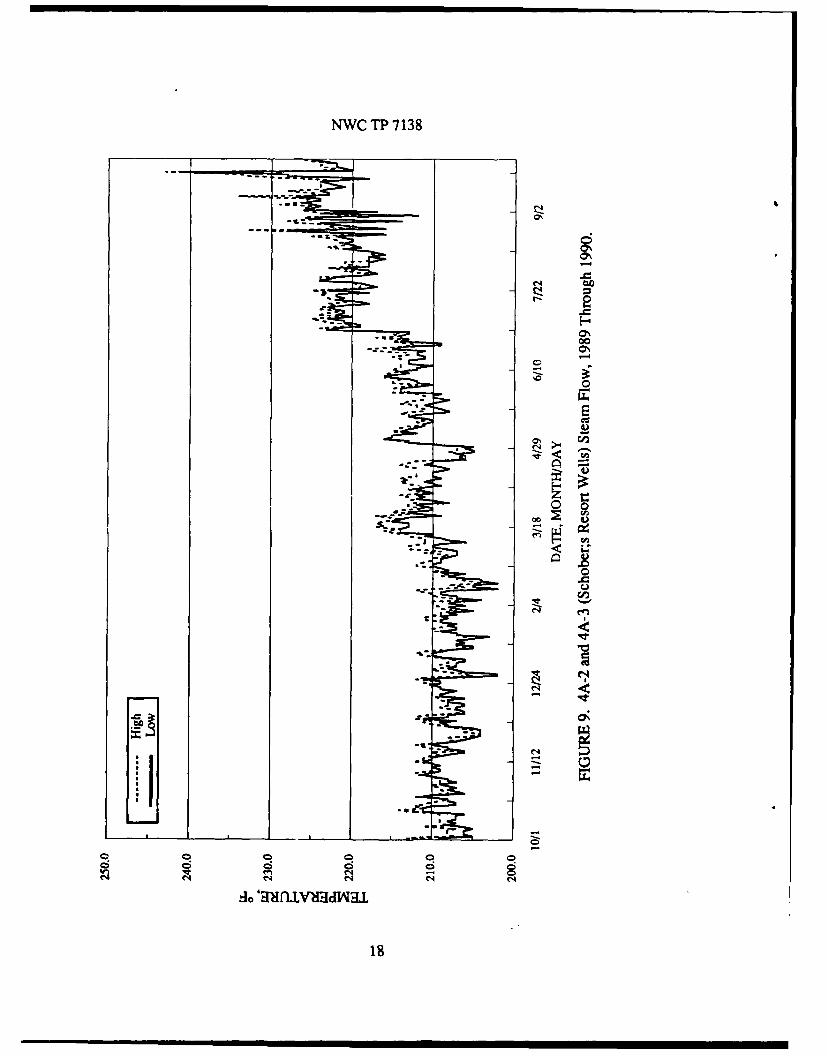
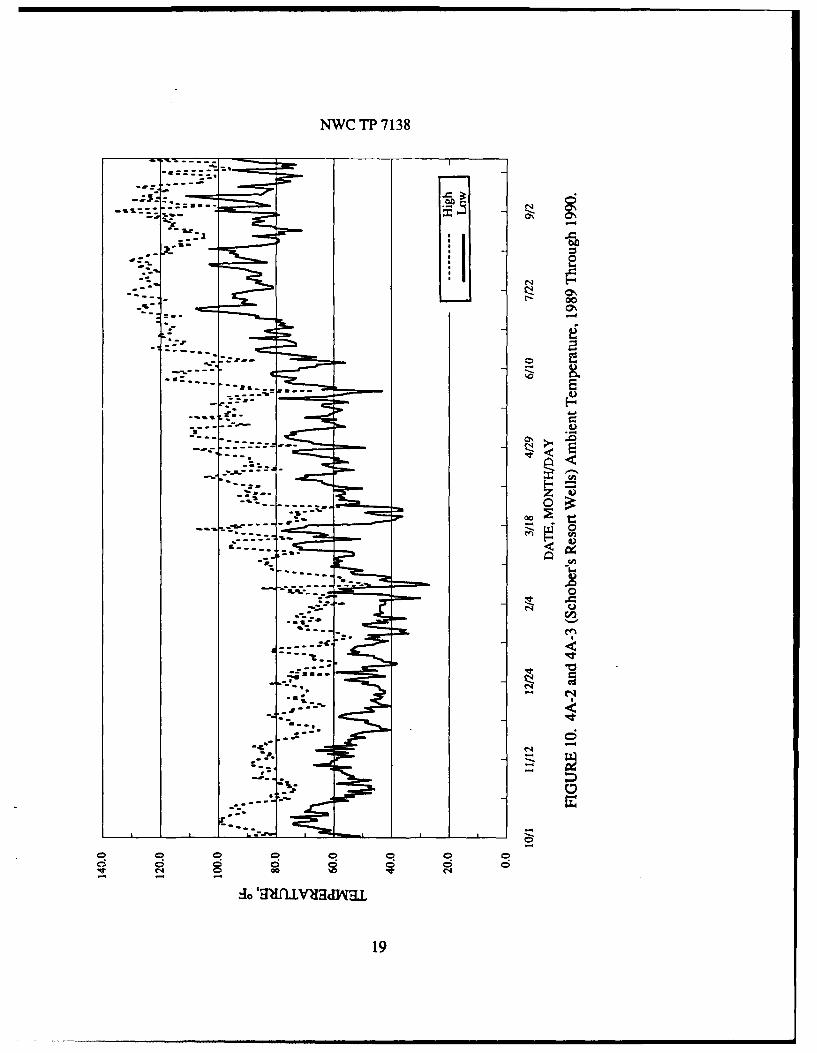
4A-2 AND 4A-3 (SCHOBER'S RESORT WELLS)
The daily steam flow, steam temperature, and ambient temperature data for theSchober's Resort -lite are presented in Appendices A and B as Tables A-5, B-2, andB-3, respectively. Yearly mean data and standard deviations are presented for the dailysteam flow (Table 6) and steam temperature (Table 7). The daily steam flow andtemperature data are shown graphically in Figures 8 and 9, and ambient temperature inFigure 10.
This site had been reliable for data collection until late May 1990 when theBarton recorder was driven off scale by a sudden increase in steam flow. On 30 Maythe orifice plate was removed and the orifice enlarged from a diameter of 1.97 to 2.25inches changing the conversion factor to 150.89 with the 50-inch water column meter.On 14 July 1990, a rain shower washed soil from around the concrete pad supportingthe well casing, allowing steam to escape. This caused a drop in the recorded steamflow, which is evident on the steam flow graph (Figure 8). At the same time there wasan increase in steam temperature as shown in Figure 9. The unrealistic ambienttemperature, recorded from July through September (Figure 10), is a result of theescaping steam blowing in and around the ambient temperature thermocouple shelter.Ambient temperature recording was stopped at this site on 1 October 1990, when theCoso Hot Springs mini-weather recording station was set up. The mini-weather stationis described in greater detail later in this report. No further drop occurred after thistime, but there is an increase in the activity to the north of Wells 4A-2 and 4A-3, withseveral small springs and steam vents in an area approximately 25 square feet; and thereare some signs that the ground in that area is turning hotter. This area is closelymonitored to keep a record of all events that occur.
TABLE 6. 4A-2 and 4A-3 (Schober's Resort Wells) Statistical Steam Flow.
High daily flow, lb/h Low daily flow, lb/h
Date Standard StandardMean deviation Mean deviation
1 Oct 89 - 30 Sep 90 1214.9 87.5 1204.9 86.2
TABLE 7. 4A-2 and 4A-3 (Schober's Resort Wells) Statistical Steam Temperature.
High daily temperature, 'F Low daily temperature, 'F
Date Standard StandardMean deviation Mean deviation
SOct 89- 30 Sep 90 213.9 6.4 212.1 6.2
16
NWC TP 7138
-L Ji
00
0
LI-
ell%
t~ql IA00
17%
NWC TP 7138
-- U
00
cn
N--
- a
._:jee
1-
- " ---
d o o A
18
NWC TP 7138
.. :6 '
°- -- ---
----------
/ °--
19
NWC TP 7138
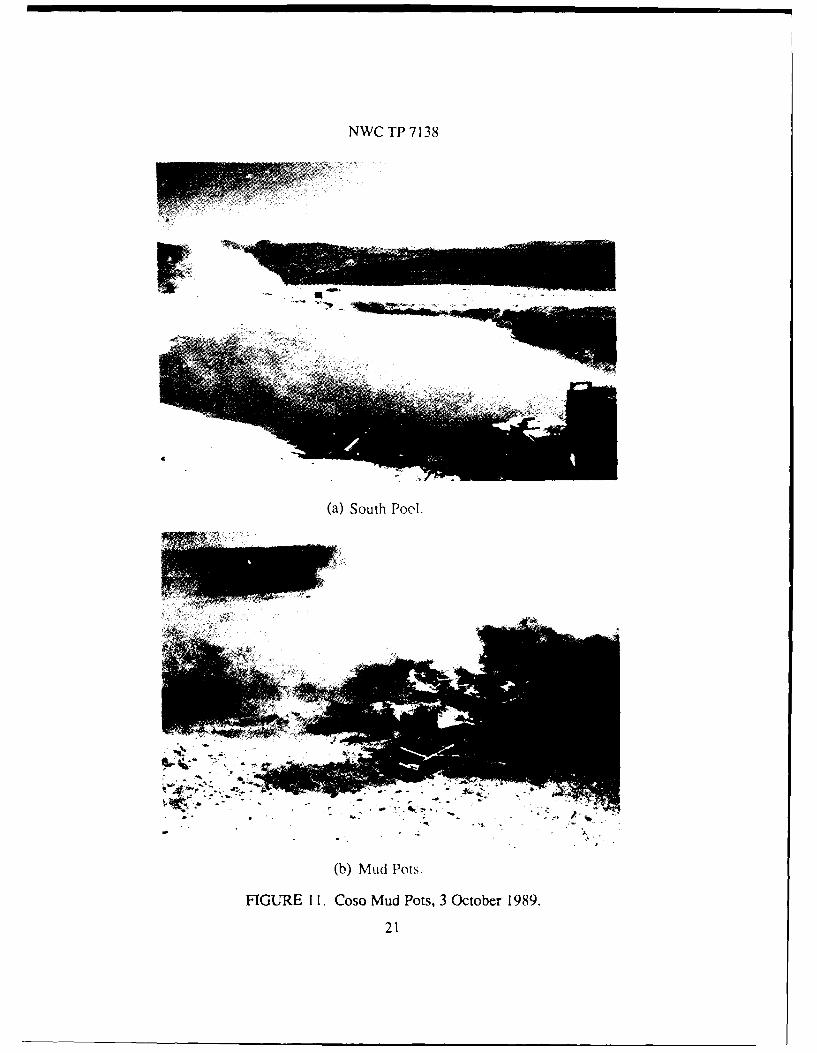
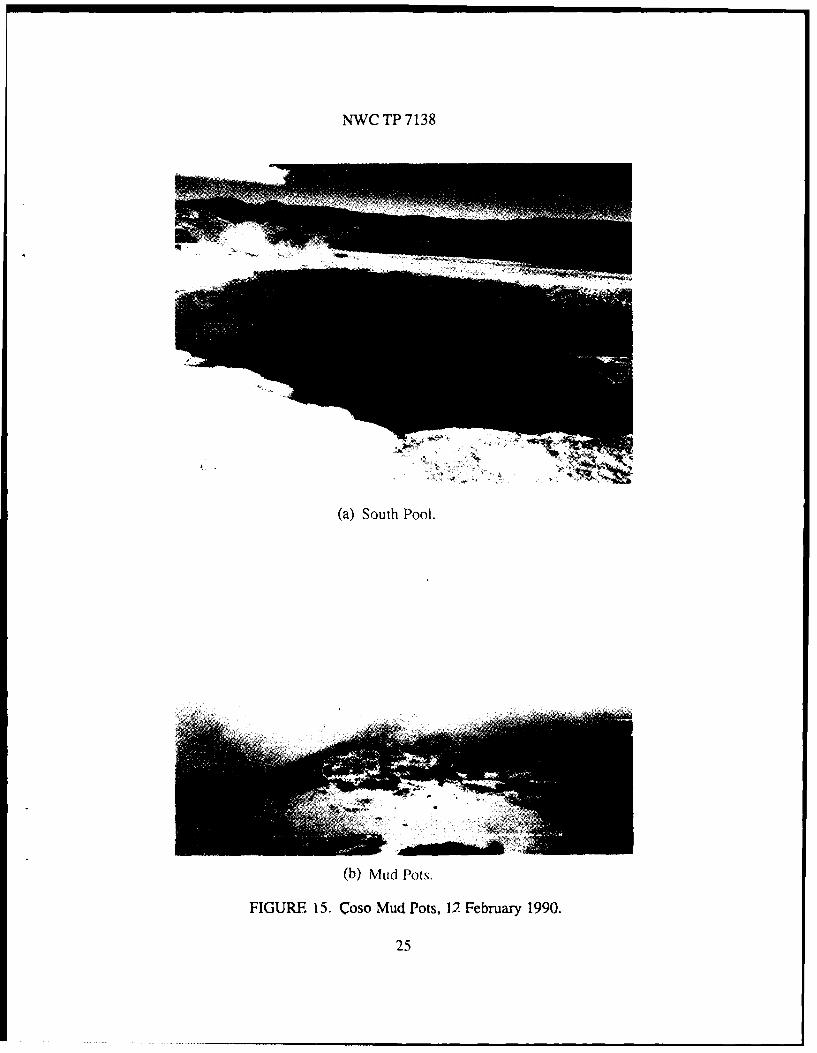
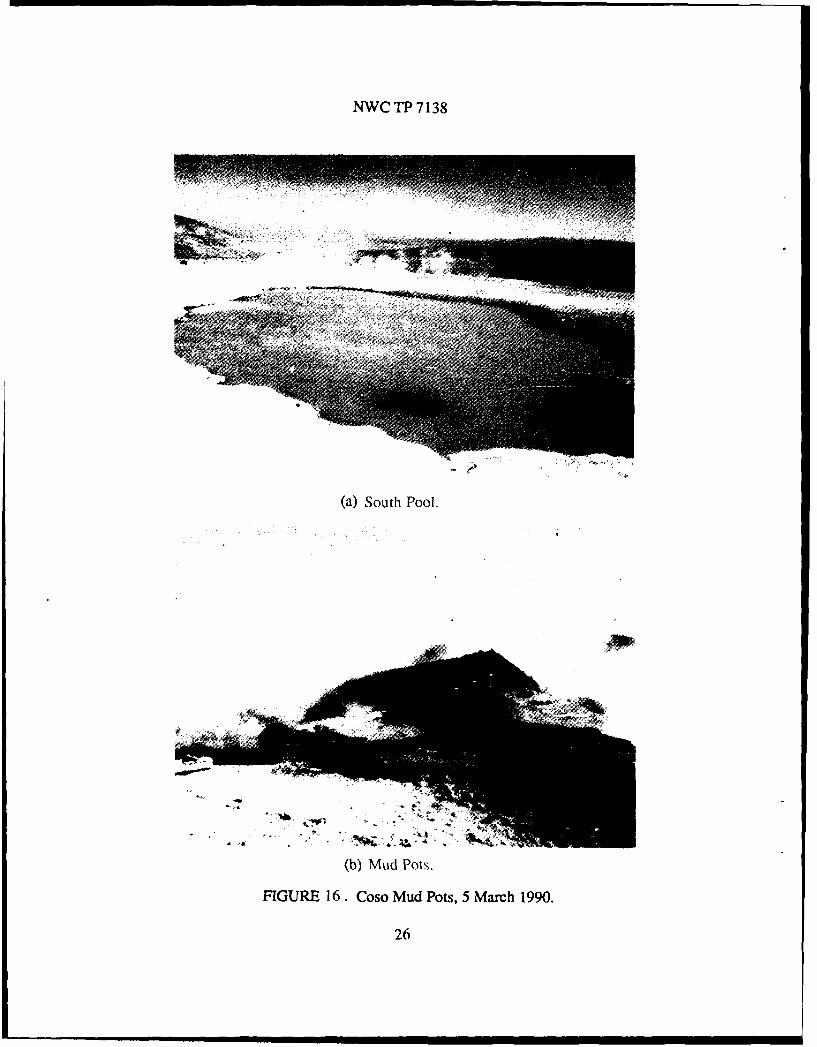
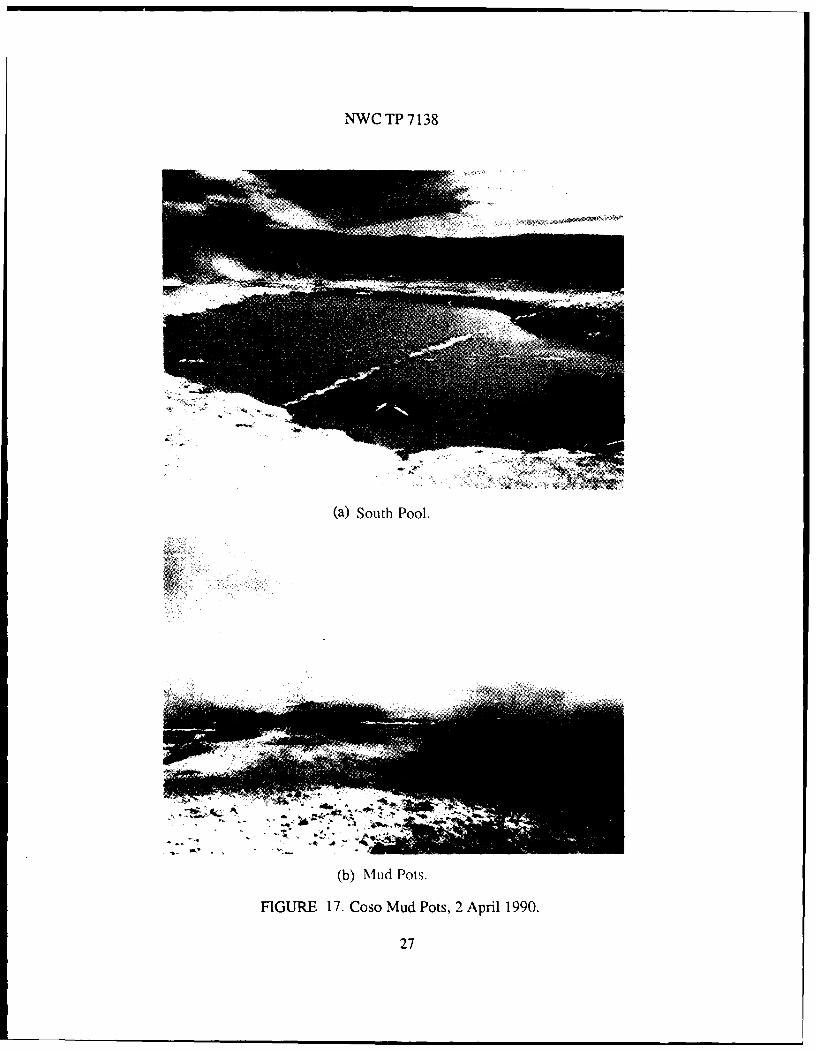
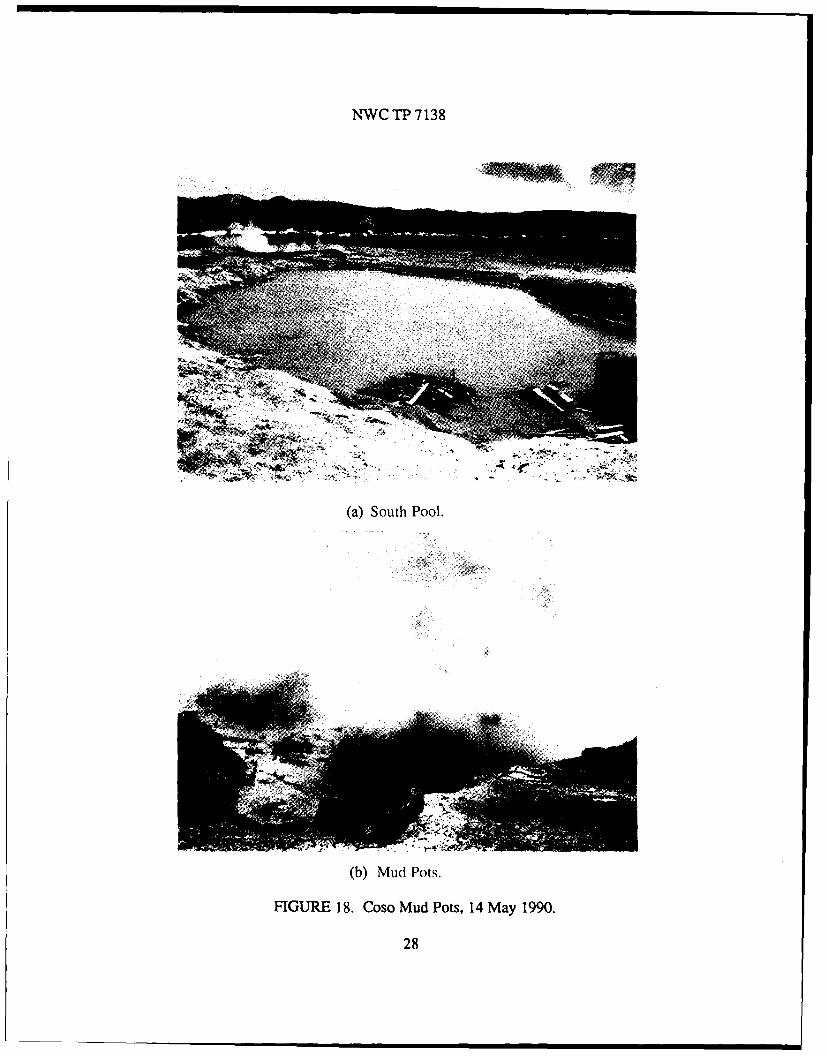
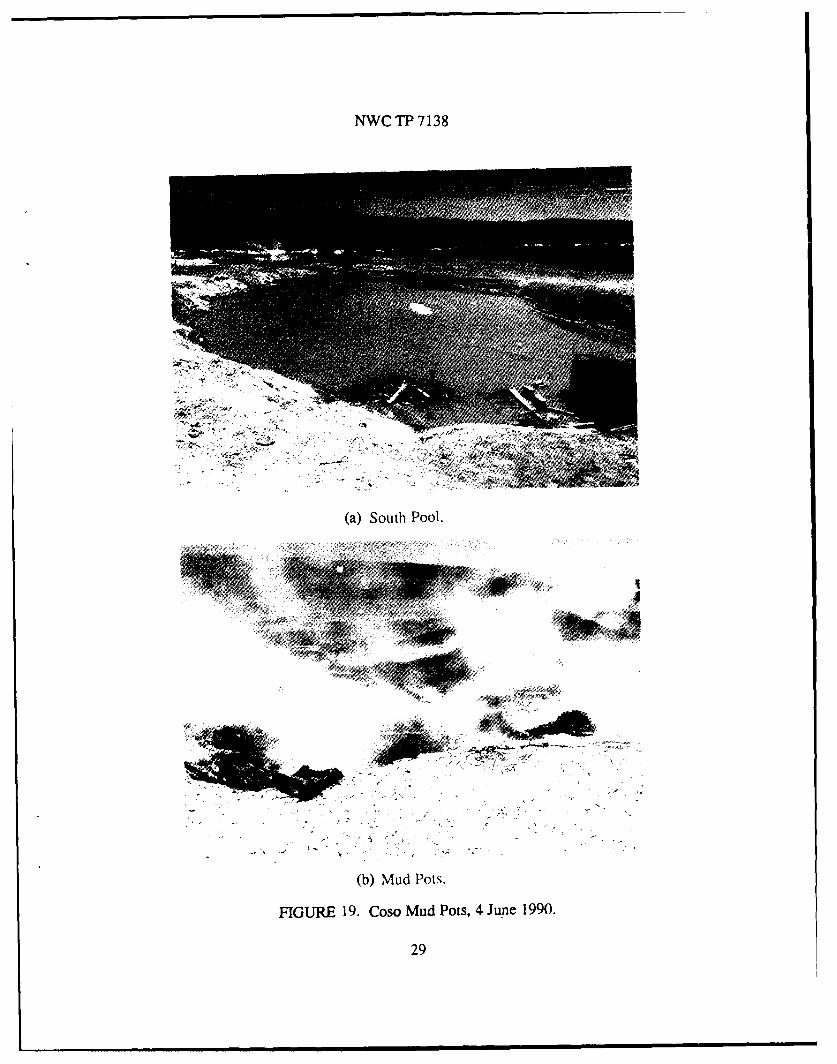
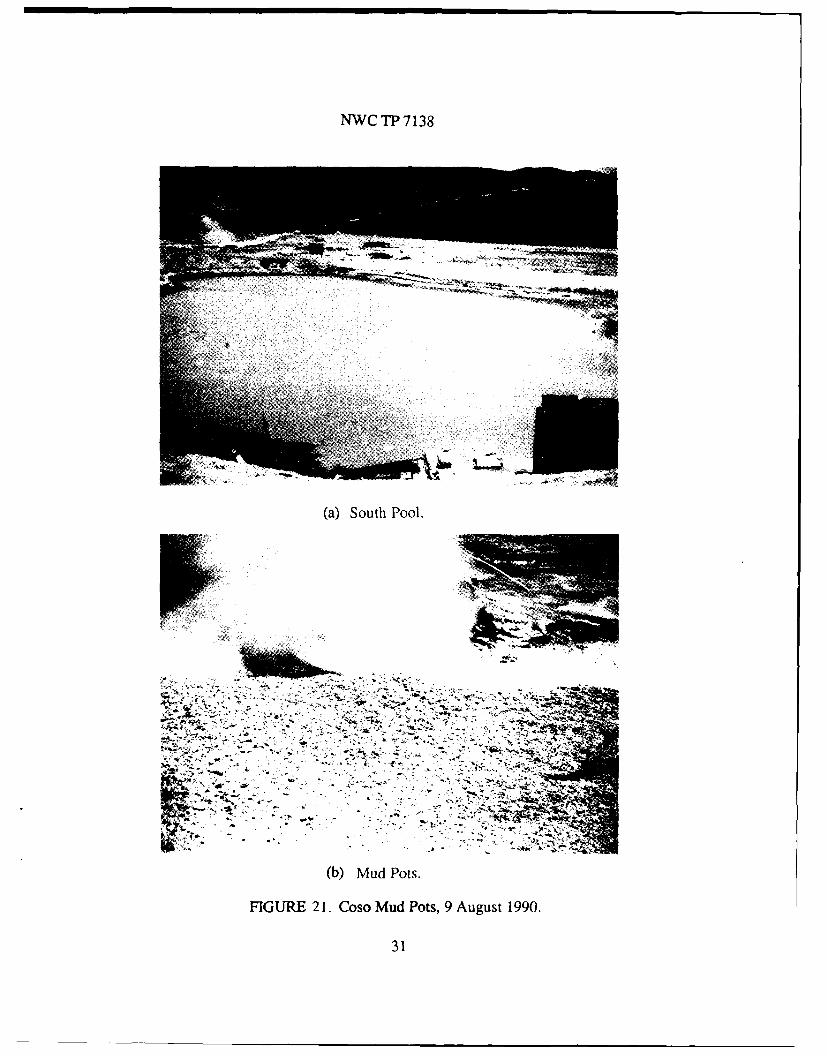
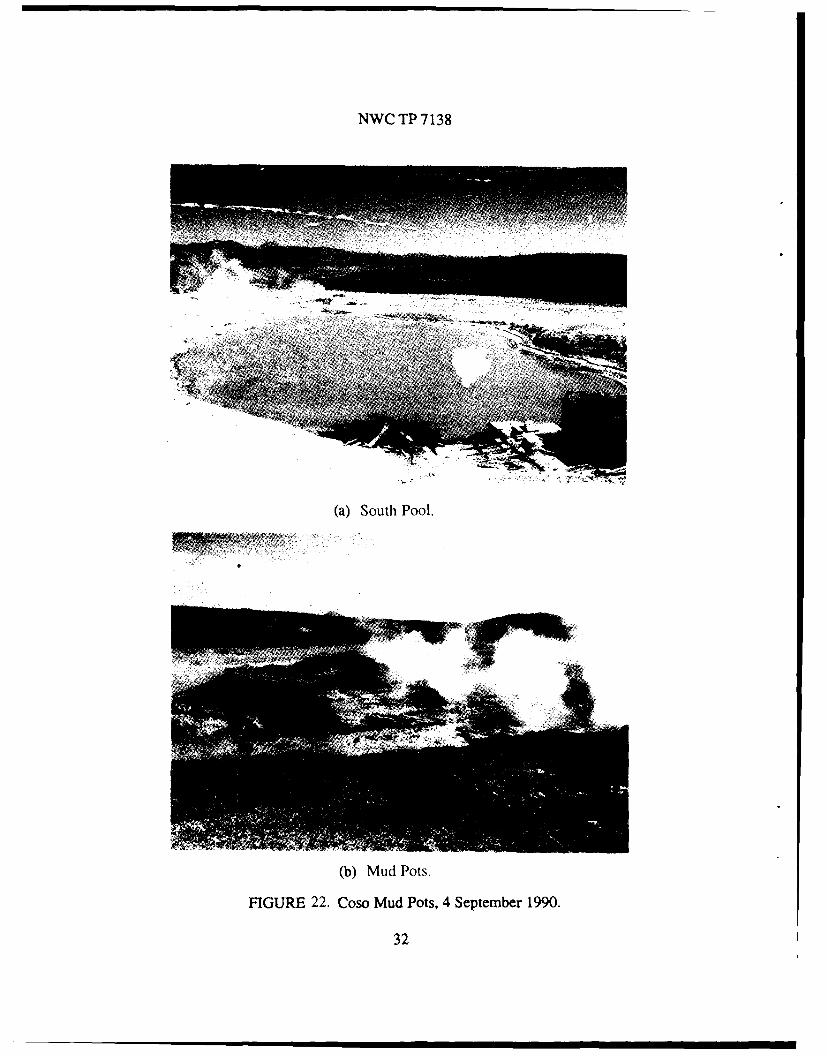
COSO MUD POT PHOTOGRAPHIC INVESTIGATION
A weekly photographic investigation was initiated in January 1978 to documentthe fluctuation in fluid levels in several of the more prominent mud pots in the CosoKGRA. This project has continued into the steam production and power-generationstages of the geothermal development.
Figures 11 through 22 illustrate seasonal variations in fluid levels at two CosoResort sites. The largest pool is the South Pool, which is located inside a circularexcavation along the Airport Lake - Coso Hot Springs scarp approximately 1000 feetsouth of the main resort area. The second site previously included three mud potslocated in the fenced compound adjacent to and south of the Main Coso Resort building.As can be seen in the photographs, the area of these mud pots has been impacted byincreased thermal activity caused by the blow-out of the adjacent old resort wells. Themud pots have been almost non-existent since December when they were filled withmud from 4KC-10 until they were completely overtaken and became a part of 4KC-10in April. A complete weekly photographic series is maintained by the Naval WeaponsCenter (NWC) Geothermal Program Office.
20
NWC TP 7138
(a) South Pool.
Sr
(b) Mud Pots.
FIGURE 11. Coso Mud Pots, 3 October 1989.
21
NWC TP 7138
(a) South Pool.
(b) Mud Pots.
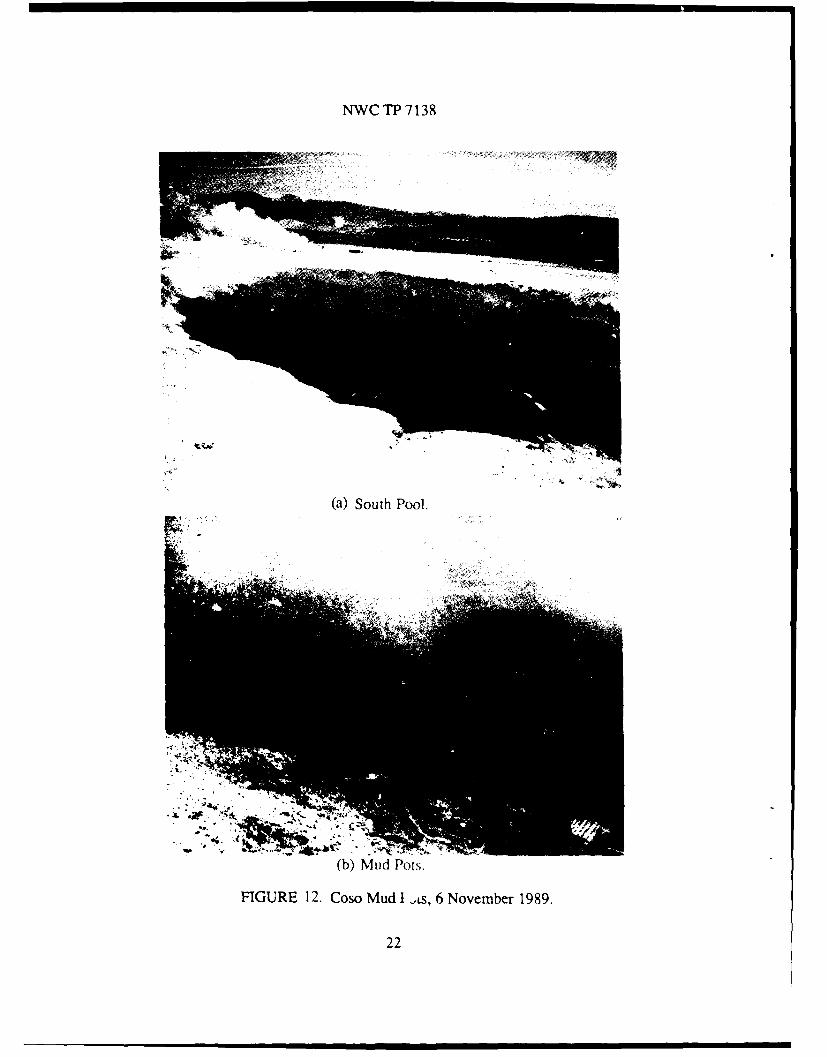
FIGURE 12. Coso Mud I .s, 6 November 1989.
22
NWC TP 7138
(a) South Puol.
(b) Mud Pots.
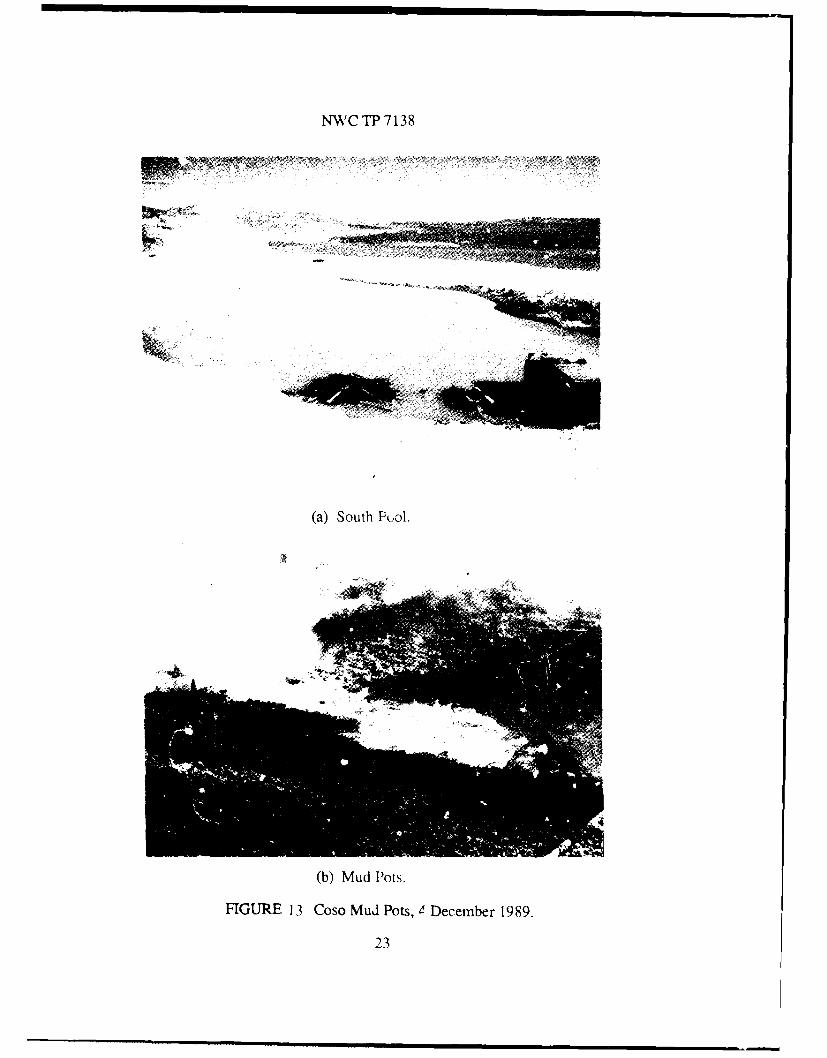
FIGURE 13 Coso Mud Pots, c December 1989.
23
NWC TP 7138
ASW
(a) South Pool.
(b) Mud( POts,
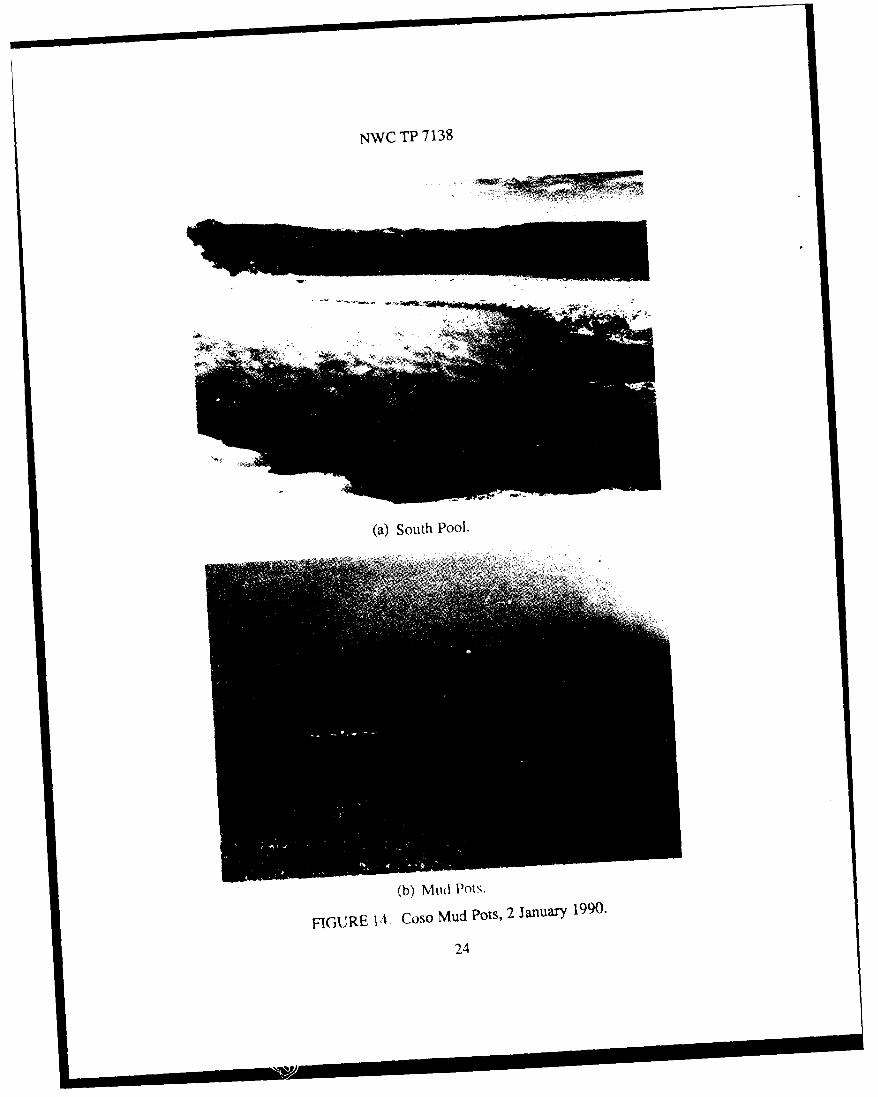
FIGURE 14', Coso Mud Pots, 2 January 1990-
24
NWC TP 7138
(a) South Pool.
(b) Mud Pots.
FIGURE 15. Coso Mud Pots, 12 February 1990.
25
NWC TP 7138
(a) South Pool.
(b) Mud Pots.
FIGURE 16. Coso Mud Pots, 5 March 1990.
26
NWC TP 7138
(a) South Pool.
(b) Mud Pots.
FIGURE 17. Coso Mud Pots, 2 April 1990.
27
NWC TP 7138
(a) South Pool.
19 W
(b) Mud Pots.
FIGURE 18. Coso Mud Pots, 14 May 1990.
28
NWC TP 7138
(a) South Pool.
(b) Mud Pots.
FIGURE 19. Coso Mud Pots, 4 June 1990.
29

NWC TP 7138
(a) South Pool.
(b) Mud Pots.
FIGURE 20. Coso Mud Pots, 2 July 1990.
30
NWC TP 7138
(a) South Pool.
(b) Mud Pots.
FIGURE 21. Coso Mud Pots, 9 August 1990.
31
NWC TP 7138
t 7 - 411 " ....
(a) South Pool.
"CIL
(b) Mud Pots.
FIGURE 22. Coso Mud Pots, 4 September 1990.
32
NWC TP 7138
WATER LEVEL MONITORING
OBSERVATION WELLS
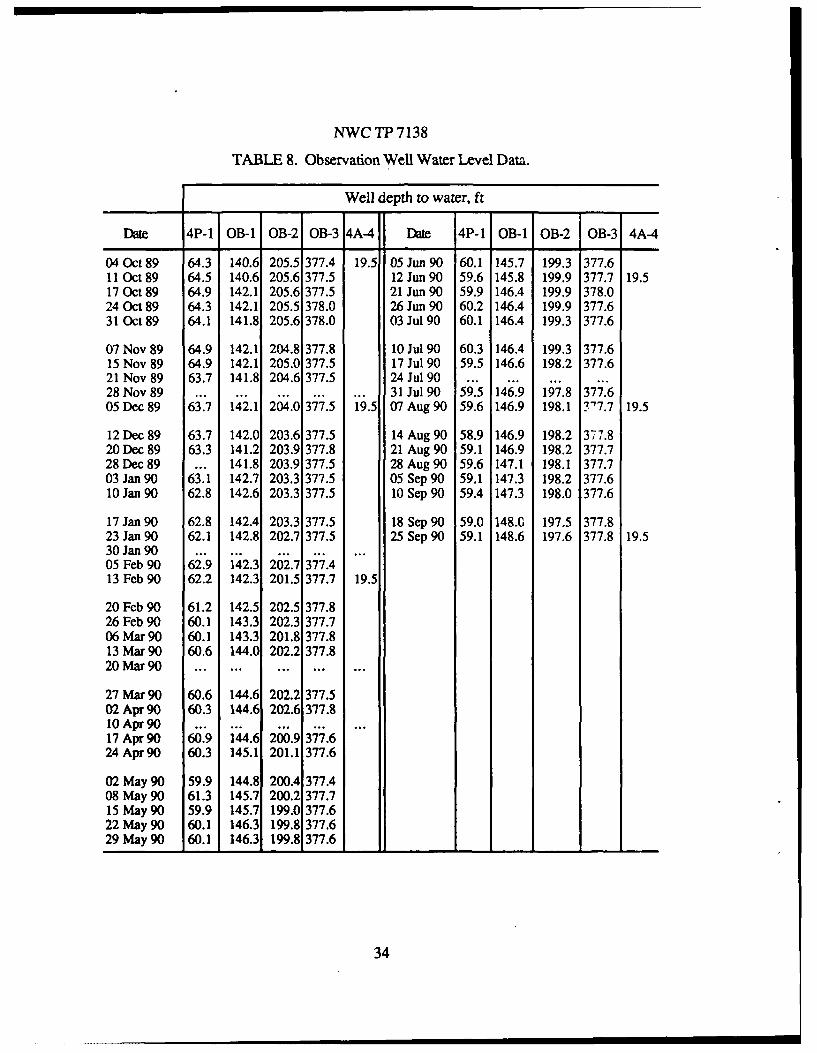
Water levels are monitored in seven wells in the Coso Hot Springs area. Theyare taken weekly at Well 4P-1, Observation Wells (OB) 1, 2 and 3, and intermittently atWells 4H-8, 4K-1 and 4H-4. At Well 4P-1 and the three Observation Wells, waterlevels are measured by pressurizing a water-filled pipe with nitrogen and reading thepressure when the water has been forced from the pipe. Manometer readings are alsotaken at this time to compare readings for accuracy. Due to the violent boiling in Well4H-8, direct water level measurement is difficult. The well level is determined at Wells4H-8 and 4K-1 based on temperature logging equipment. Wells 4K-1 and 4H-4 aremeasured with a Fisher electric water level meter. Water levels for weekly monitoredwells are given in Table 8.
Well 4P-I has had a 6-foot rise in water level since March 1989. Although thechemistry of the water has been somewhat variable this reporting period, the lastanalysis report (August 1990) is essentially the same as previous years. There appearsto be a rise in the steam condensate level around the well that matches the rise in theSouth Pool.
OB-l and OB-2 are located in the main drainage of Coso Wash about 1,000 feetapart. Except for recovery of an occasional water sample, neither well has been pumpedsince 1987. Both wells produce water from stream and valley fill sediments. SinceMarch 1989, the water level in OB-I has dropped about 9 feet while the water level inOB-2 has risen about 12 feet in the same period. While we believe that OB-1 isshowing effects of the long-term drought, there also appears to be some sort ofequilibration of the water table going on in the area of these two wells.
The water level in OB-3 rose slightly during this same period (an approximate1.5 foot net gain). This well is completed in the basalt flows that border Coso Wash onits east side.
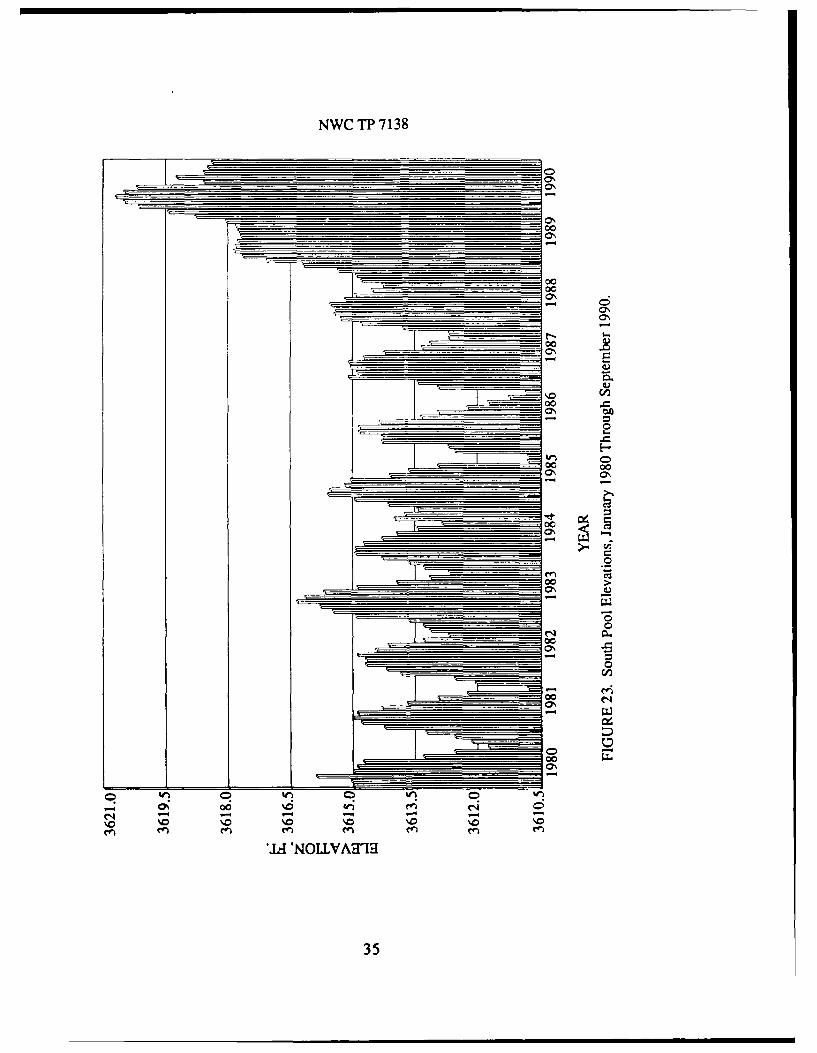
SOUTH POOL
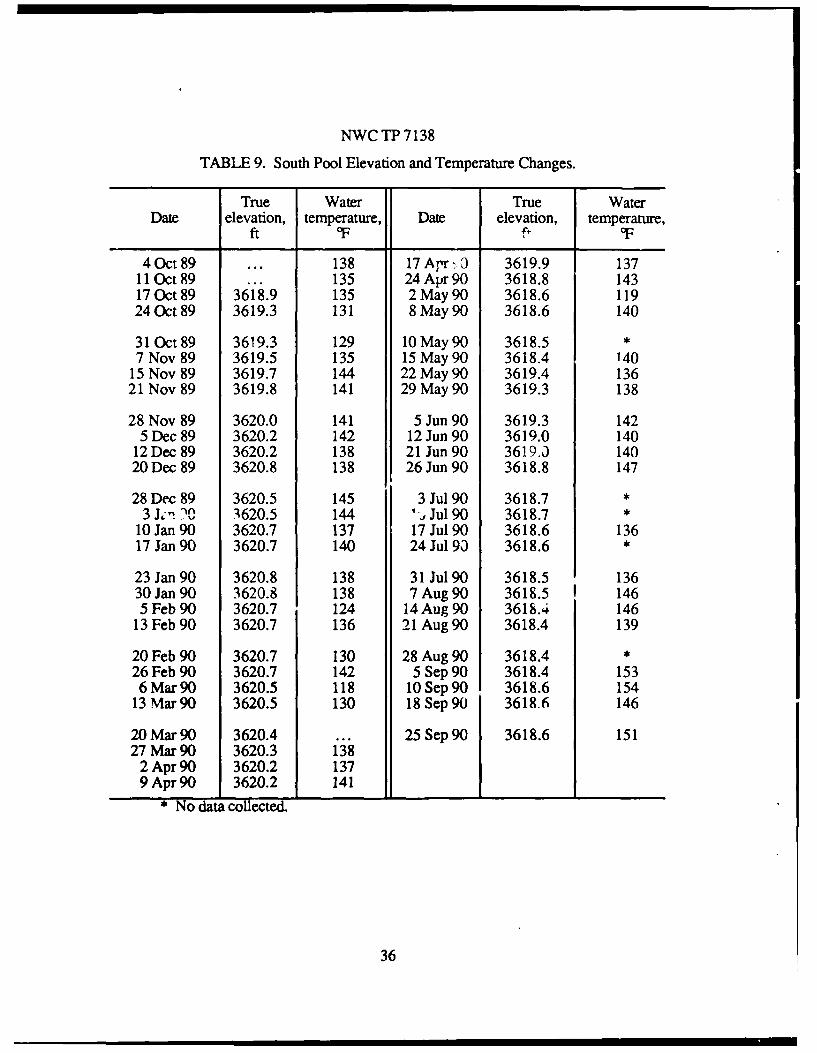
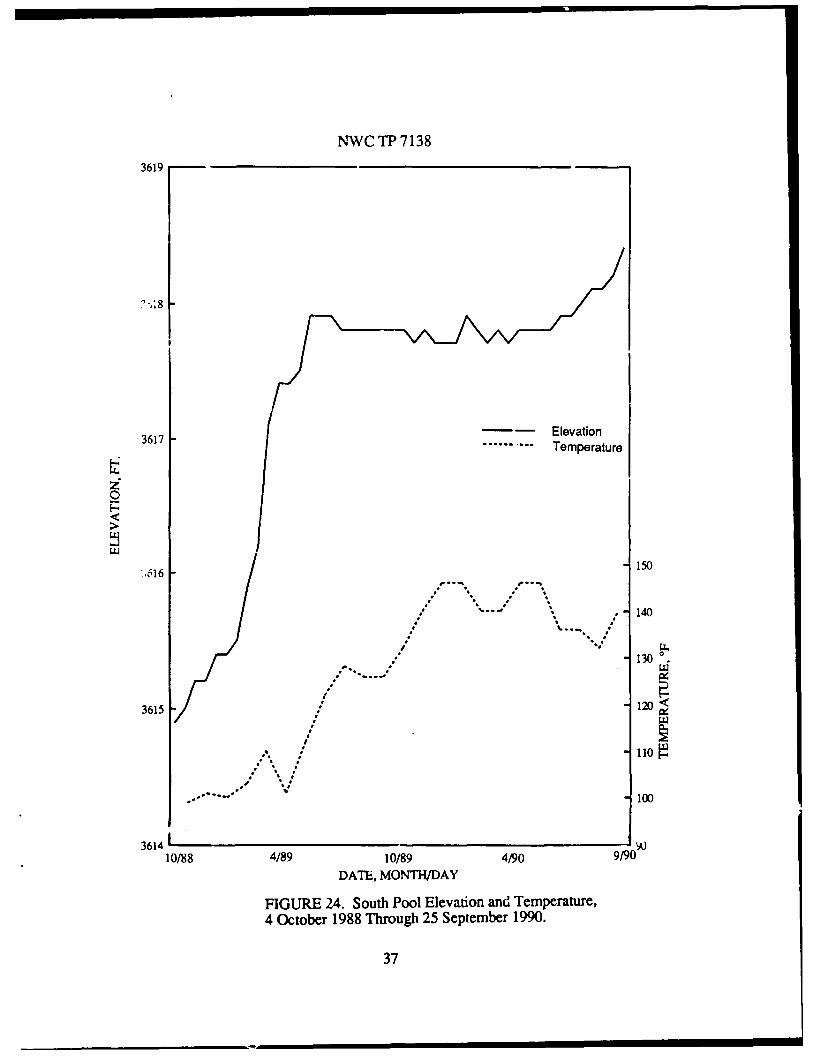
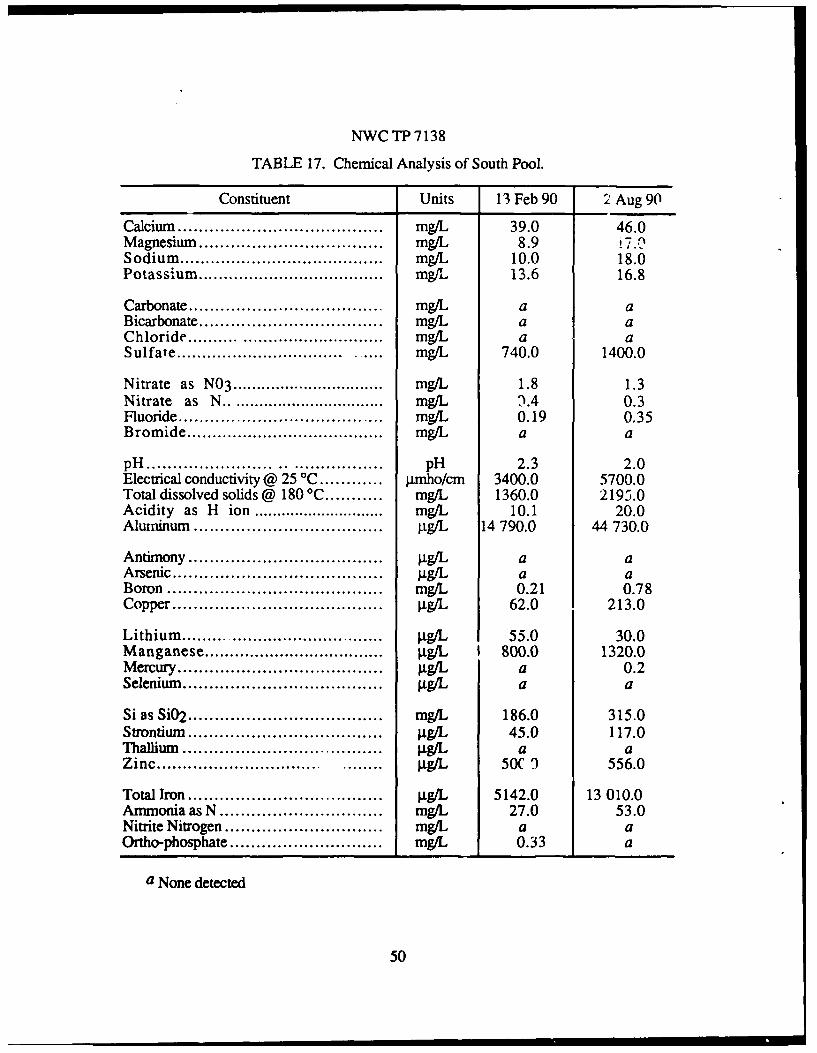
The South Pool water level continued the patterns of seasonal fluctuation (2 to4 feet) that it has always shown, while maintaining an average elevation that is severalfeet higher than that of the early reporting years. This trend can be seen graphically inFigure 23. An elevation scale, graduated in tenths of feet was placed at a surveyed pointto accurately monitor the water level. Several points around South Pool were surveyedagain this year for validation and verification of elevation. The high water level this yearwas 3620.75 feet with a low of 3618.4 feet, and an average water temperature range of143 to 147*F. Water levels and temperature are recorded weekly. These data arepresented in Table 9 and Figure 24.
33
NWC TP 7138
TABLE 8. Observation Well Water Level Data.
Well depth to water, ft
Date 4P-1 OB-1 OB-2 OB-3 4A-4 Date 4P-1 0B-1 OB-2 OB-3 4A-4
04 Oct 89 64.3 140.6 205.5 377.4 19.5 05 Jun 90 60.1 145.7 199.3 377.611 Oct 89 64.5 140.6 205.6 377.5 12 Jun 90 59.6 145.8 199.9 377.7 19.517 Oct89 64.9 142.1 205.6 377.5 21 Jun 90 59.9 146.4 199.9 378.024 Oct 89 64.3 142.1 205.5 378.0 26 Jun 90 60.2 146.4 199.9 377.631 Oct89 64.1 141.8 205.6 378.0 03 Jul 90 60.1 146.4 199.3 377.6
07 Nov 89 64.9 142.1 204.8 377.8 10 Jul 90 60.3 146.4 199.3 377.615 Nov 89 64.9 142.1 205.0 377.5 17 Jul 90 59.5 146.6 198.2 377.621 Nov 89 63.7 141.8 204.6 377.5 24 Jul 90 ...
28 Nov 89 ... ... ... ... ... 31 Jul 90 59.5 146.9 197.8 377.605 Dec 89 63.7 142.1 204.0 377.5 19.5 07 Aug 90 59.6 146.9 198.1 -'7.7 19.5
12 Dec 89 63.7 142.0 203.6 377.5 14 Aug 90 58.9 146.9 198.2 3-7.820Dec89 63.3 141.2 203.9 377.8 21Aug90 59.1 146.9 198.2 377.728 Dec 89 ... 141.8 203.9 377.5 28 Aug 90 59.6 147.1 198.1 377.703 Jan 90 63.1 142.7 203.3 377.5 05 Sep 90 59.1 147.3 198.2 377.610 Jan 90 62.8 142.6 203.3 377.5 10 Sep 90 59.4 147.3 198.0 377.6
17 Jan 90 62.8 142.4 203.3 377.5 18 Sep 90 59.0 148.0 197.5 377.823 Jan 90 62.1 142.8 202.7 377.5 25 Sep 90 59.1 148.6 197.6 377.8 19.530 Jan 90..30Jn90... ... ...
05 Feb 90 62.9 142.3 202.7 377.413 Feb 90 62.2 142.3 201.5 377.7 19.5
20 Feb 90 61.2 142.5 202.5 377.826 Feb 90 60.1 143.3 202.3 377.706 Mar 90 60.1 143.3 201.8 377.813 Mar 90 60.6 144.0 202.2 377.820 Mar 90 ... ... ... ...
27 Mar 90 60.6 144.6 202.2 377.502 Apr 90 60.3 144.6 202.6 377.810 Apr90 ... ...17 Apr90 60.9 144.6 200.9 377.624 Apr 90 60.3 145.1 201.1 377.6
02 May 90 59.9 144.8 200.4 377.408 May 90 61.3 145.7 200.2 377.715 May 90 59.9 145.7 199.0 377.622 May 90 60.1 146.3 199.8 377.629 May 90 60.1 146.3 199.8 377.6
34
NWC TP 7138
IjON
-00
00
00
00 0
EE 00 0>
000
0
00
00 _
000
en enfn e
*JA 'NUVA9N
350
NWC TP 7138
TABLE 9. South Pool Elevation and Temperature Changes.
True Water True WaterDate elevation, temperature, Date elevation, temperature,
ft F fl. j F
4Oct 89 ... 138 17AprK) 3619.9 13711 Oct89 ... 135 24 Apr 90 3618.8 14317 Oct 89 3618.9 135 2 May 90 3618.6 11924 Oct89 3619.3 131 8 May 90 3618.6 140
31 Oct 89 3619.3 129 10 May 90 3618.5 *7 Nov 89 3619.5 135 15 May 90 3618.4 140
15 Nov 89 3619.7 144 22 May 90 3619.4 13621 Nov 89 3619.8 141 29 May 90 3619.3 138
28 Nov 89 3620.0 141 5 Jun 90 3619.3 1425 Dec 89 3620.2 142 12 Jun 90 3619.0 140
12 Dec 89 3620.2 138 21 Jun 90 3619.0 14020 Dec 89 3620.8 138 26 Jun 90 3618.8 147
28 Dec 89 3620.5 145 3 Jul 90 3618.7 *3 J,'If 3620.5 144 'It, Jul 90 3618.7 *
10 Jan 90 3620.7 137 17 Jul 90 3618.6 13617 Jan 90 3620.7 140 24 Jul 93 3618.6 *
23 Jan 90 3620.8 138 31 Jul 90 3618.5 13630 Jan 90 3620.8 138 7 Aug 90 3618.5 1 1465 Feb 90 3620.7 124 14 Aug 90 3618.4 146
13 Feb 90 3620.7 136 21 Aug 90 3618.4 139
20 Feb 90 3620.7 130 28 Aug 90 3618.4 *26 Feb 90 3620.7 142 5 Sep 90 3618.4 1536 Mar 90 3620.5 118 10 Sep 90 3618.6 154
13 Mar 90 3620.5 130 18 Sep 90 3618.6 146
20 Mar 90 3620.4 ... 25 Sep 90 3618.6 15127 Mar90 3620.3 138
2 Apr 90 3620.2 1379 Apr 90 3620.2 141
* No data collected.
36
NWC TP 71383619
7r)18
-61 Elevation3617.......... Temperature
2C
LLU,616 ,150
110
6160
3 614 140
* I
; 120 1<3615 .
I11
I
°.*" ... °100
10/88 4/89 10/89 4/90 9/90DATE, MONTH/DAY
FIGURE 24. South Pool Elevation and Temperature,
4 October 1988 Through 25 September 1990.
37
NWC TP 7138
RAINFALL AT COSO RESORT AREA AND ROSE VALLEY
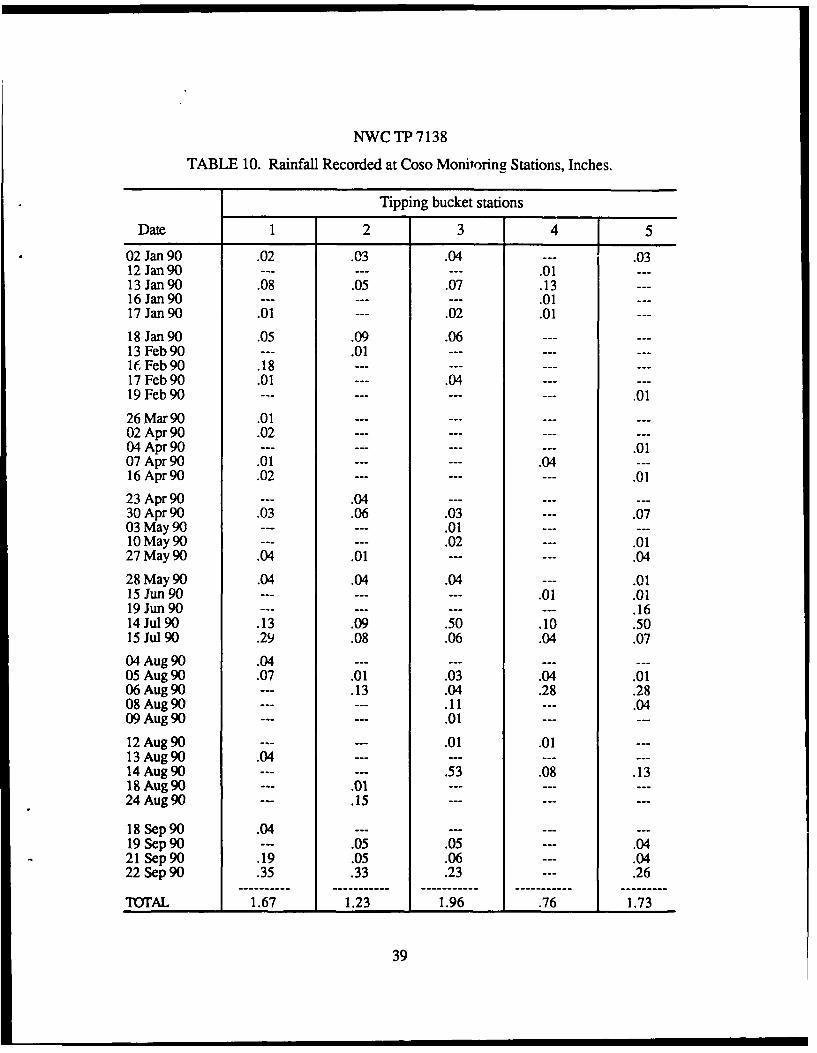
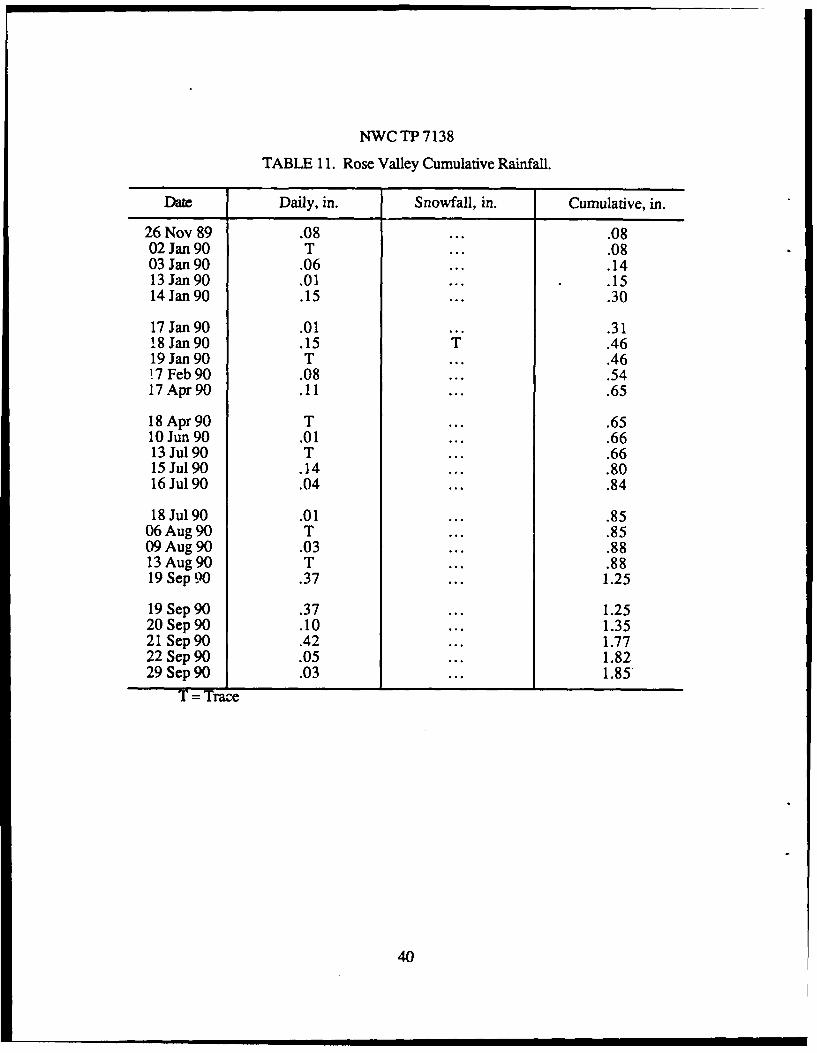
Rainfall in the Coso Hot Springs basin is monitored at five sites as shown inFigure 1. Instrumentation at each site consists of a battery operated long-term stripi corder that is triggered by a tipping bucket. This year there were no interruptions torainfall data collection due to equipment failures. Rain stations are checked for properoperation prior to any weather front that may bring rain to the area.
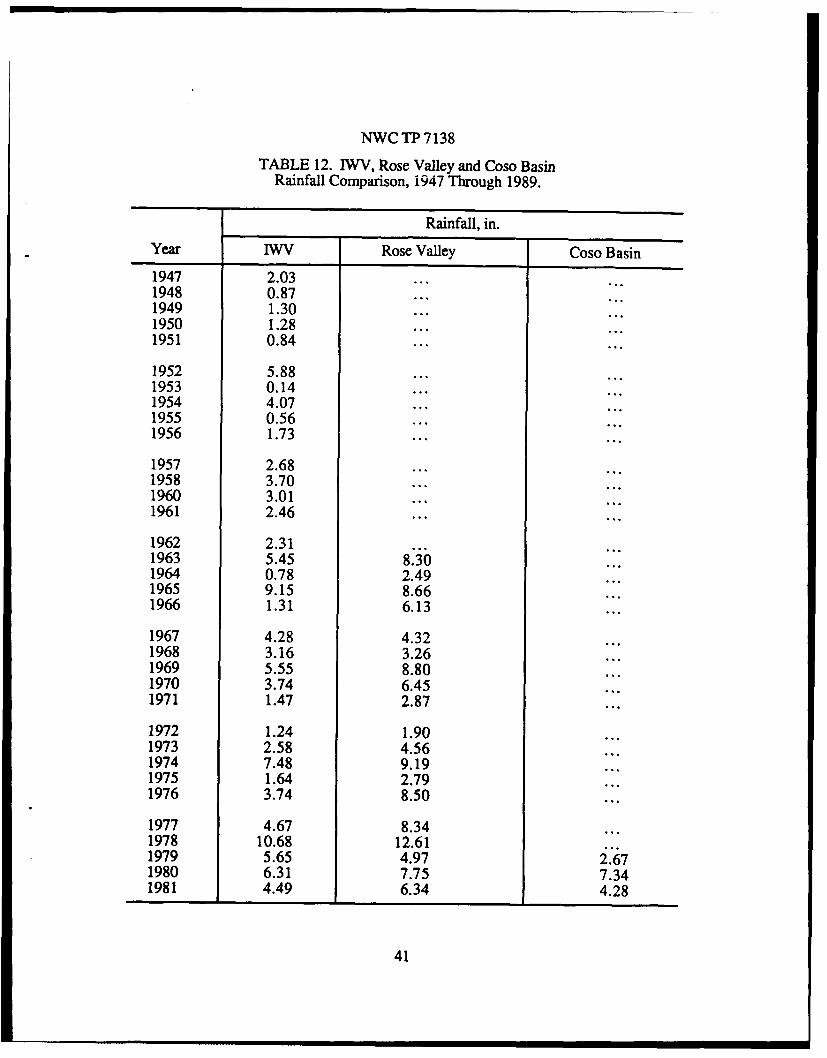
Data from the Coso Stations presented in Table 10 shows daily and cumulativerainfall. The Rose Valley data (Table 11) is collected at the Los Angeles Department ofWater and Power (LADWP) Haiwee Reservoir Plant. As shown in Figures 25 and 26,the Coso area generally receives less annual rainfall than Rose Valley. This significantdifference in rainfall between two such closely situated areas is not unusual given thenature of high-desert storms.
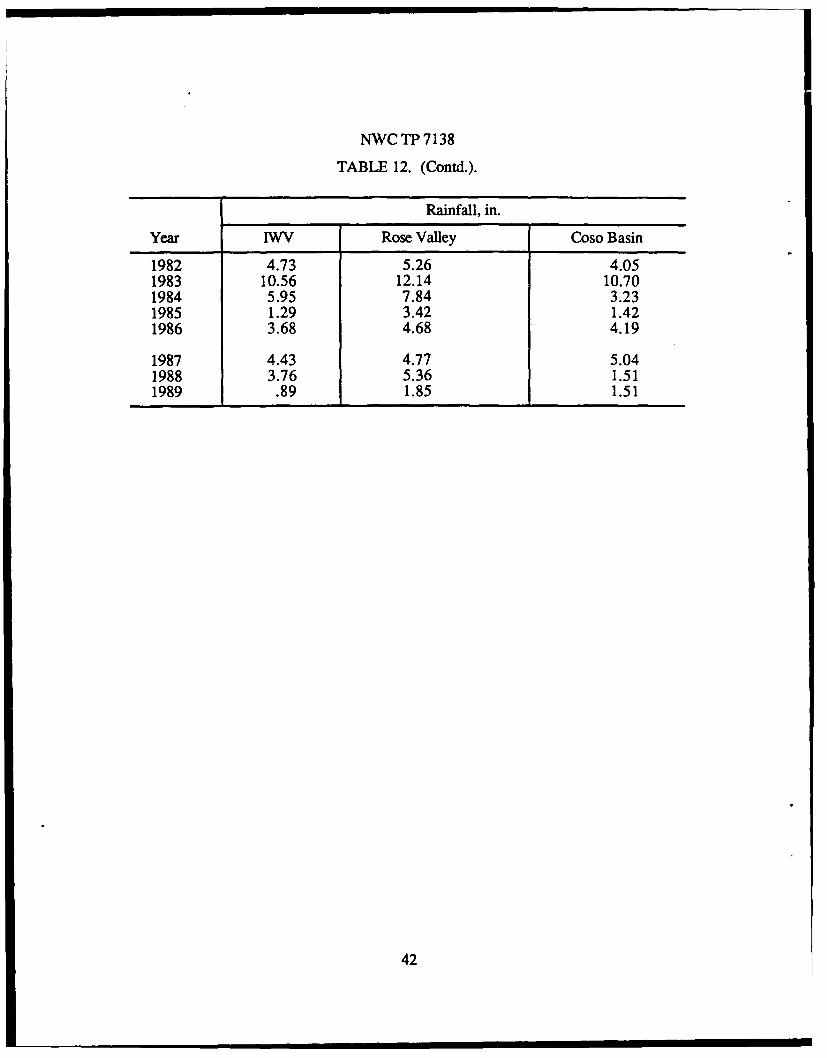
Comparative rainfall data for Coso Basin, Rose Valley, and Indian Wells Valley(IWV) can be found in Table 12. The Indian Wells Valley data was gathered atArmitage Field, NWC, and was provided by a NWC meteorologist.
38
NWC TP 7138
TABLE 10. Rainfall Recorded at Coso Monitoring Stations, Inches.
Tipping bucket stations
Date 1 2 3 4 5
02 Jan 90 .02 .03 .04 --- .0312 Jan 90 .........-. 01 ---13 Jan 90 .08 .05 .07 .1316 Jan 90 .........-. 01 ---17 Jan 90 .01 .02 .01
18 Jan 90 .05 .09 .06 ......13 Feb 90 --- .01 .........16 Feb 90 .18 ............17 Feb 90 .01 --- .04 ......19 Feb 90 ............. 01
26 M ar 90 .01 .........02 Apr 90 .02 ............04 Apr 90 ............ .0107 Apr 90 .01 .0416 Apr 90 .02 ......... .0123 Apr 90 --- .04 ---....30 Apr 90 .03 .06 .03 .0703 May 90 ... .01 ---10 May 90 .- -- .02 --- .0127 May 90 .04 .01 .04
28 May 90 .04 .04 .04 --- .0115 Jun 90 .01 .0119 Jun 90 ............-. 1614 Jul 90 .13 .09 .50 .10 .5015 Jul 90 .29 .08 .06 .04 .07
04 Aug 90 .04 ............05 Aug 90 .07 .01 .03 .04 .0106 Aug 90 --- .13 .04 .28 .2808 Aug 90 ... .11 --- .0409 Aug 90 --- .01 ---
12 Aug 90 --- .01 .01 ---13 Aug 90 .04 ............14 Aug 90 ---...-. 53 .08 .1318 Aug 90 .0124 Aug 90 .15 ......
18 Sep 90 .04 ---........19 Sep 90 .05 .05 .0421 Sep 90 .19 .05 .06 --- .0422 Sep 90 .35 .33 .23 .26
TOTAL 1.67 1.23 1.96 .76 1.73
39
NWC TP 7138
TABLE 11. Rose Valley Cumulative Rainfall.
Date Daily, in. Snowfall, in. Cumulative, in.
26 Nov 89 .08 ... .0802 Jan 90 T ... .0803 Jan 90 .06 ... .1413 Jan 90 .01 .... 1514 Jan 90 .15 ... .30
17 Jan 90 .01 .3118 Jan 90 .15 T .4619 Jan 90 T ... .4617 Feb 90 .08 ... .5417 Apr 90 .11 .... 65
18 Apr 90 T .... 6510 Jun 90 .01 ... .6613 Jul90 T ... .6615 Jul 90 .14 ... .8016 Jul 90 .04 ... .84
18 Jul 90 .01 ... .8506 Aug 90 T ... .8509 Aug 90 .03 ... .8813 Aug 90 T .... 8819 Sep 90 .37 ... 1.25
19 Sep 90 .37 ... 1.2520 Sep 90 .10 ... 1.3521 Sep 90 .42 ... 1.7722 Sep 90 .05 ... 1.8229 Sep 90 .03 ... 1.85
T = Trace
40
NWC TP 7138
TABLE 12. IWV, Rose Valley and Coso BasinRainfall Comparison, i947 Through 1989.
Rainfall, in.
Year IWv Rose Valley Coso Basin
1947 2.03 ......1948 0.87 ......1949 1.30 ......1950 1.28 ...1951 0.84 ...
1952 5.88 ...1953 0.14 ......1954 4.07 ...1955 0.56 ......1956 1.73 ......
1957 2.68 ...1958 3.70 ......1960 3.01 ......1961 2.46 ......
1962 2.311963 5.45 8.301964 0.78 2.491965 9.15 8.66 ...1966 1.31 6.13
1967 4.28 4.321968 3.16 3.26 ...1969 5.55 8.80 ...1970 3.74 6.45 ...1971 1.47 2.87
1972 1.24 1.90 ...1973 2.58 4.561974 7.48 9.19 ...1975 1.64 2.79 ...1976 3.74 8.50
1977 4.67 8.341978 10.68 12.611979 5.65 4.97 2.671980 6.31 7.75 7.341981 4.49 6.34 4.28
41
NWC TP 7138
TABLE 12. (Contd.).
Rainfall, in.
Year IWV Rose Valley Coso Basin
1982 4.73 5.26 4.051983 10.56 12.14 10.701984 5.95 7.84 3.231985 1.29 3.42 1.421986 3.68 4.68 4.19
1987 4.43 4.77 5.041988 3.76 5.36 1.511989 .89 1.85 1.51
42
NWC TP 7138
w-0J
0 w%000
00
00 00 C
00
C
000
0002
00
'127 ........
C14 0 l- InCtl C
430
NWC TP 7138
00
u
_ C
- - -Ez
____ [ ___ ~ E
d-
Ow__0
0_ co_ 0_ 0_ _
003 - __
oI -
M~~ r- CUm
44_ __ _ _ __ m 0

NWC TP 7138
COSO HOT SPRINGS MINIRECORDING STATION
The Coso Hot Springs mini-weather recording station consists of an instrumentshelter, Model 8120-1, a microbaragraph Model 7010-1, and a Hi-Q hygrothermographmodel 5020-1, manufactured by Weathermeasure Weathertronics, a division ofQualmetrics, Inc., Sacramento, California.
The microbaragraph was in place 9 August 1990. A test chart was run from 9 to13 August when data collection was begun. This year's data reflect relative pressurechanges rather than absolute barometric pressure at the elevation or the weather station.A graph of these data is shown in Figure 27. Comparing the barametric pressure datawith changes in activity in the Coso Hot Springs KGRA will provide a betterunderstanding of how barometric pressure affects these occurrences.
The hygrothermograph was put in place to record the ambient temperature andthe relative humidity of the area with minimal influence from blowing steam. Datacollection from the hygrothermograph began 1 October 1990. The data will be depictedin the 1990-91 report.
998
9% ........ High996o LO
994
992
rA1
990!
988
9864
e
I994 I V~ .
9s , "me X' , tN"
982 ,
980
8/14t90 821/90 8/28,90 9/4,90 9/11,90 9/18,90 9/25190
DATE
FIGURE 27. Barometric Pressure Readings.
45
NWC TP 7138
WATER ANALYSIS OF COSO HOTSPRINGS AREA SITES
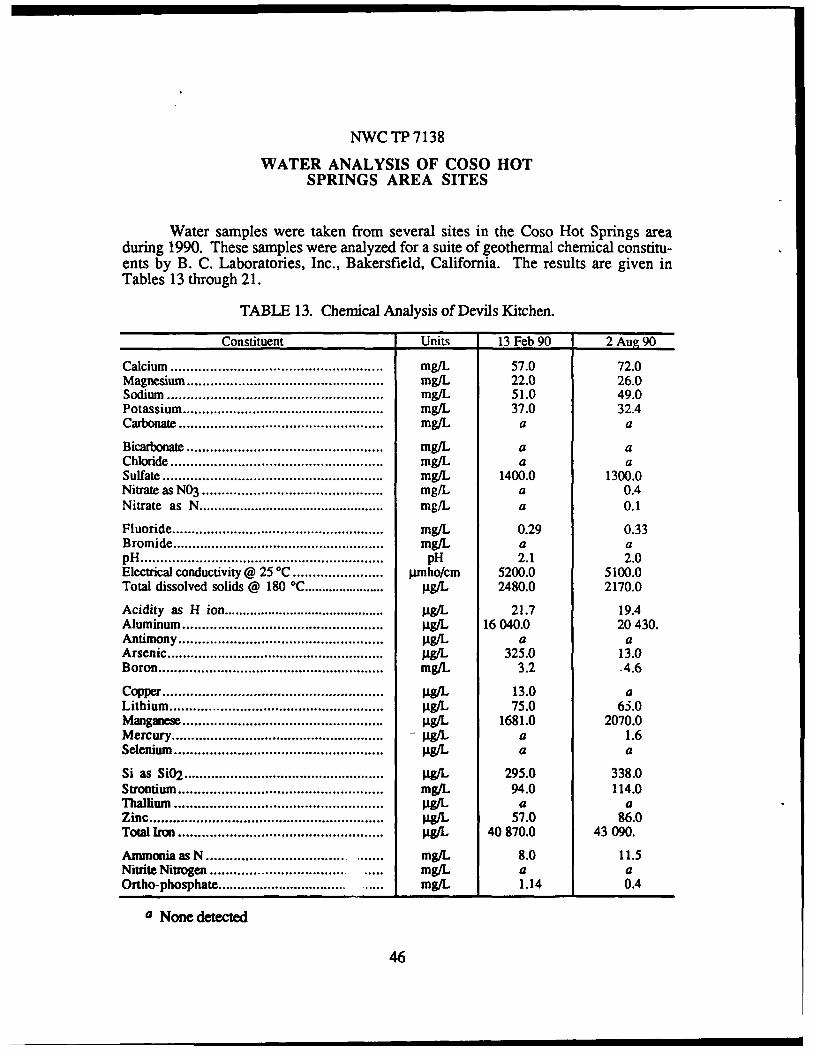
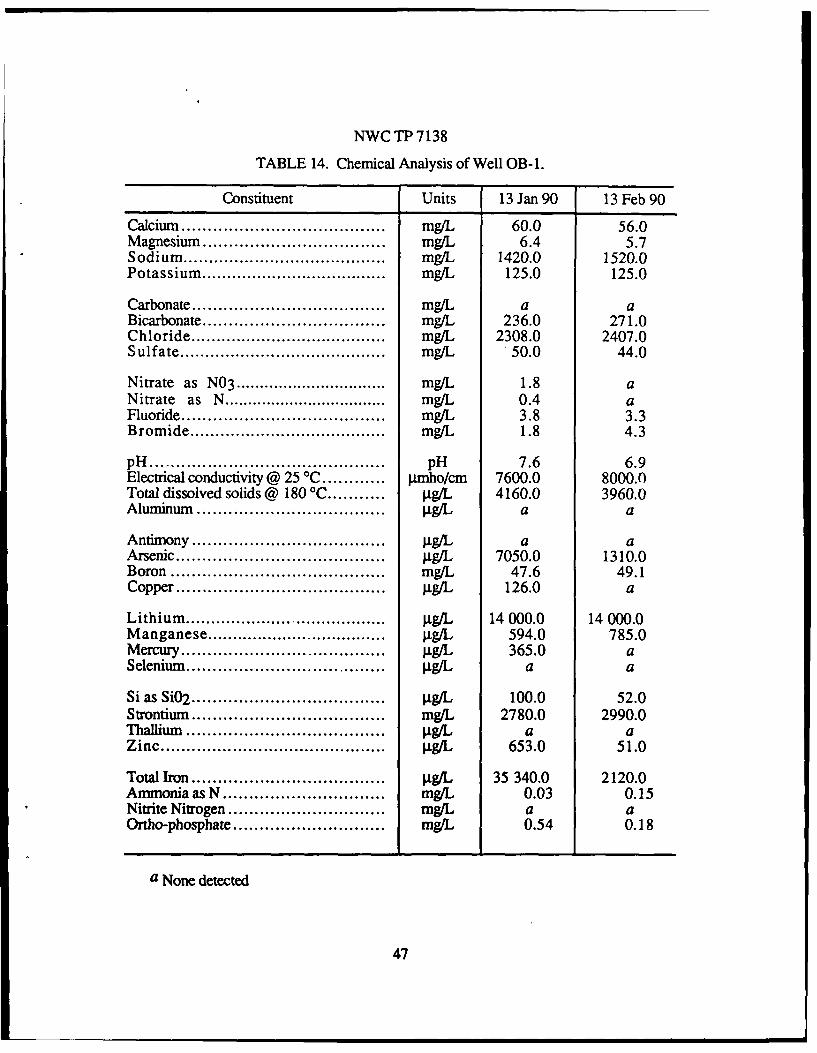
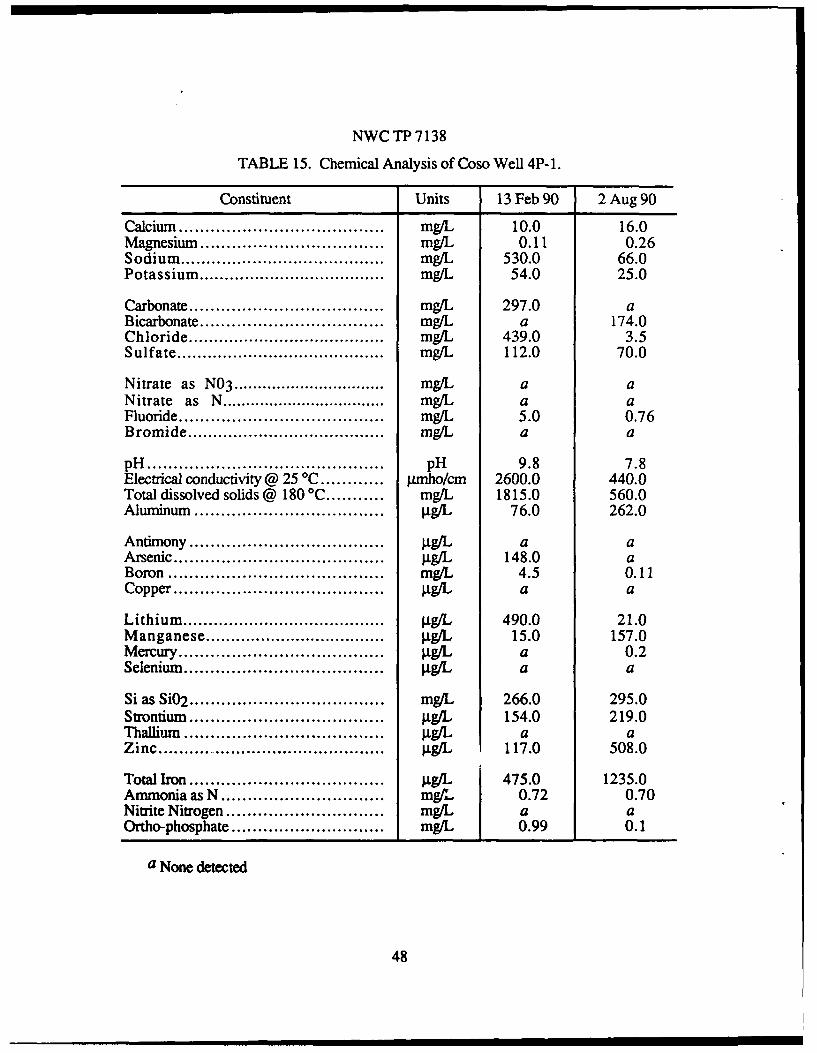
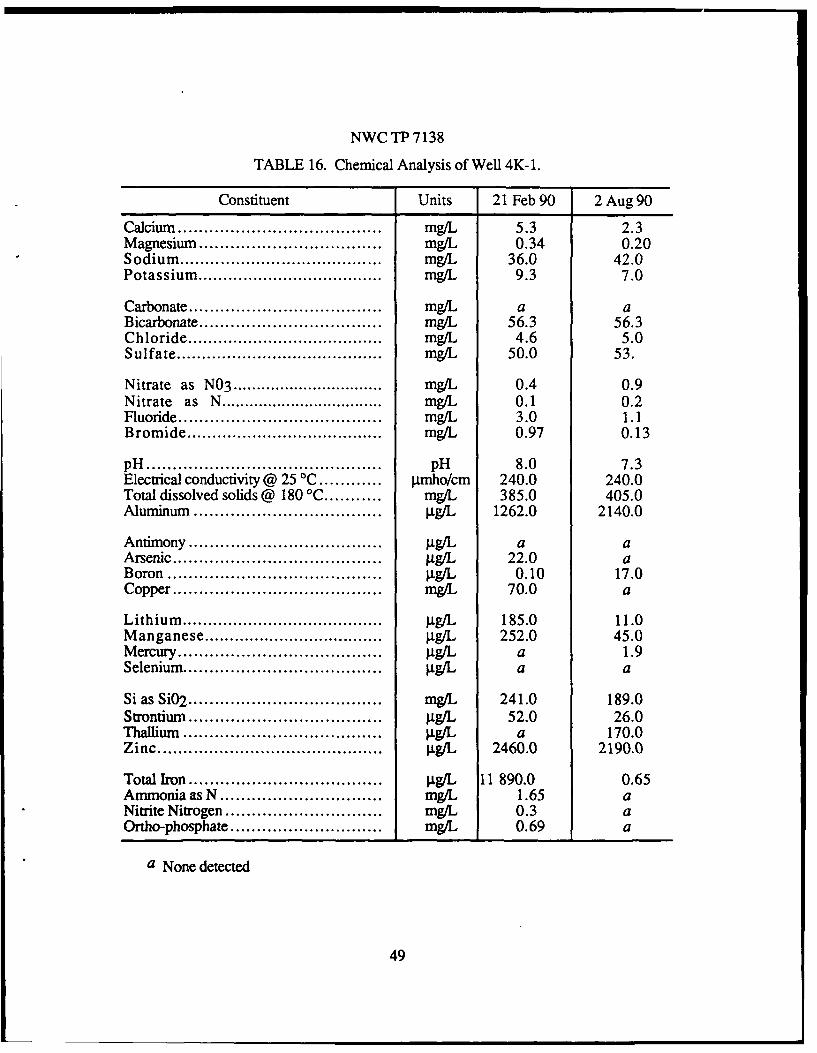
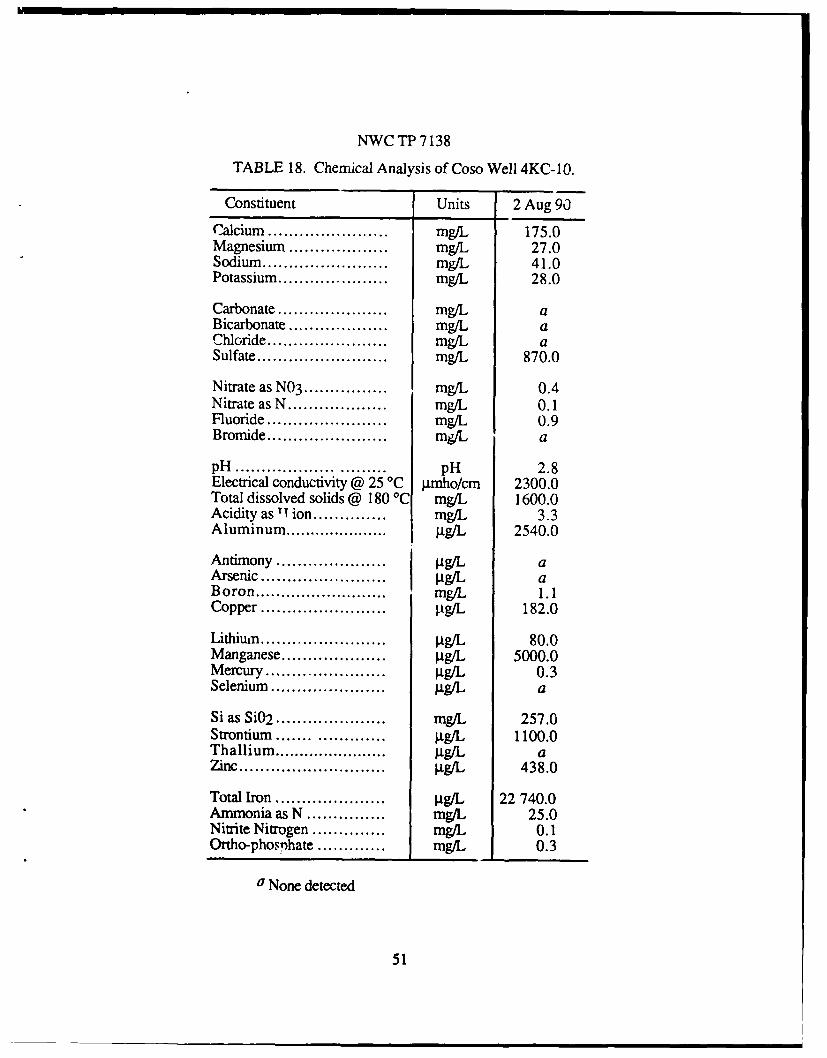
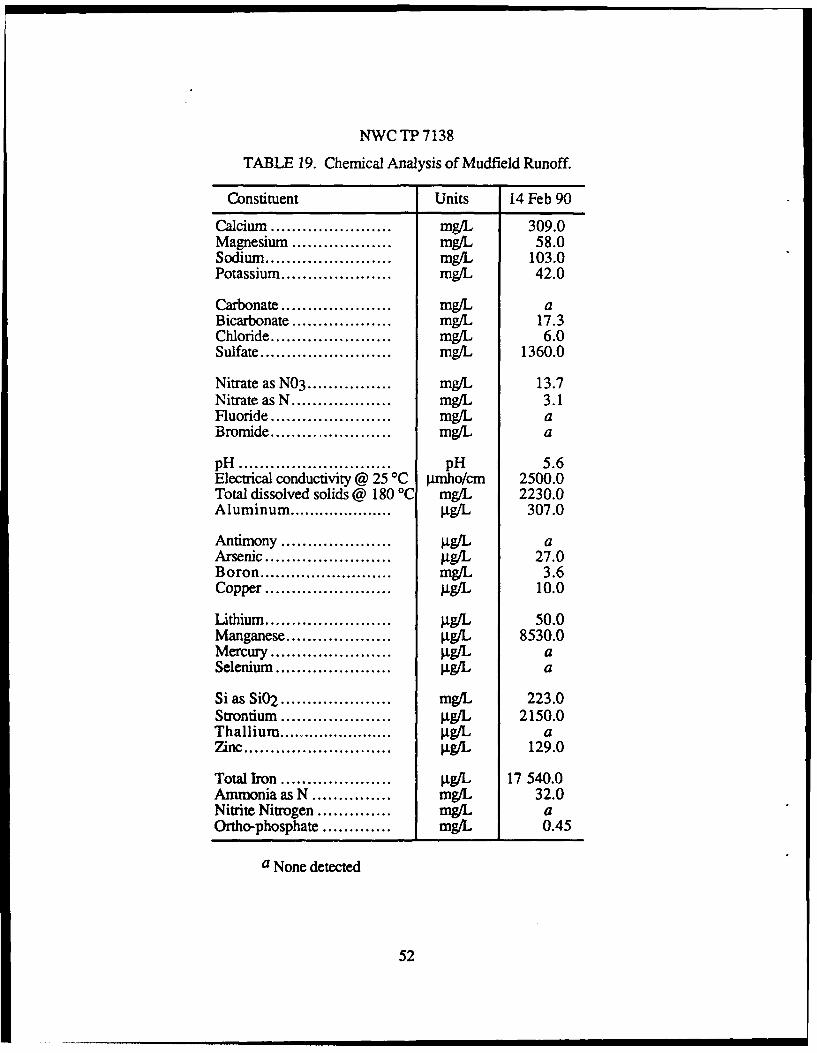
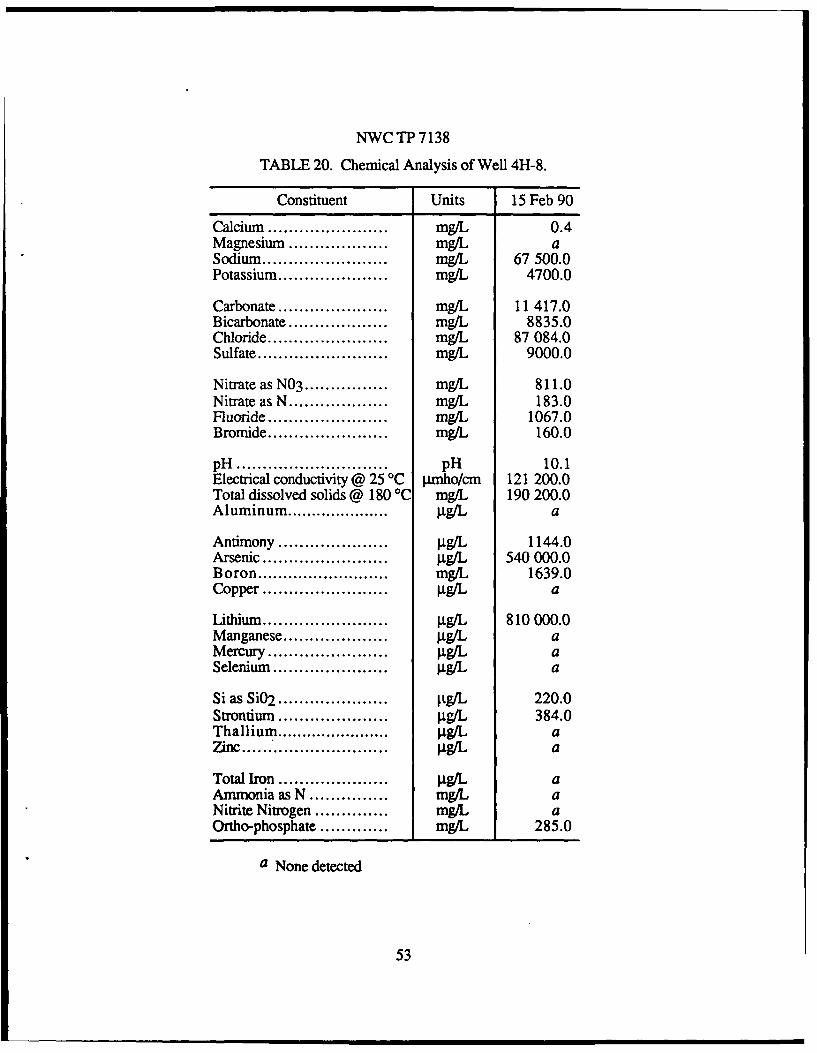
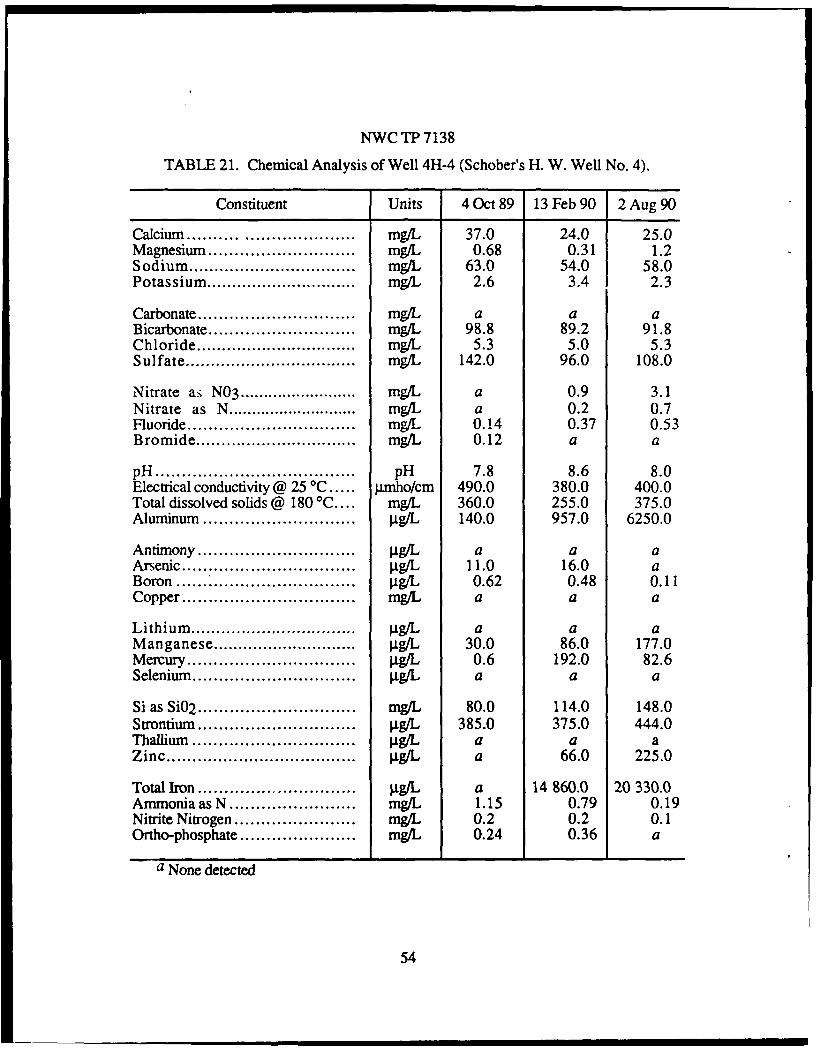
Water samples were taken from several sites in the Coso Hot Springs areaduring 1990. These samples were analyzed for a suite of geothermal chemical constitu-ents by B. C. Laboratories, Inc., Bakersfield, California. The results are given inTables 13 through 21.
TABLE 13. Chemical Analysis of Devils Kitchen.
Constituent Units 13 Feb 90 2 Aug 90
Calcium ...................................................... mg/L 57.0 72.0Magnesium .................................................. mg/L 22.0 26.0Sodium ....................................................... mg/L 51.0 49.0Potassium .................................................... mg/L 37.0 32.4Carbonate .................................................... mg/L a a
Bicarbonate ............................ mg/L a aChloride ...................................................... mg/L a aSulfate ........................................................ mg/L 1400.0 1300.0Nitrate as N03 .............................................. mg/L a 0.4Nitrate as N .................................................. mg/L a 0.1
Fluoride ....................................................... mg/L 0.29 0.33Bromide ....................................................... mg/L a apH .............................................................. pH 2.1 2.0Electrical conductivity @ 25 *C ....................... limho/cm 5200.0 5100.0Total dissolved solids @ 180 *C ....................... lg/L 2480.0 2170.0
Acidity as H ion ............................................ tg/L 21.7 19.4Aluminum .................................................. tg/L 16 040.0 20 430.Antimony .................................................... Jtg/L a aArsenic ........................................................ pg/L 325.0 13.0Boron .......................................................... mg/L 3.2 -4.6
Copper ........................................................ Ag/L 13.0 aLithium ....................................................... ig/L 75.0 65.0Manganese ................................................. . t.9g/L 1681.0 2070.0Mercury ....................................................... - Jlg/L a 1.6Selenium ..................................................... g/L a a
Si as SiO2 .................................................... g/L 295.0 338.0Strontium .................................................... mg/L 94.0 114.0Thallium ........................... Pg/L a aZinc ........................................................... 9g/L 57.0 86.0Total Iron ................................................... Pg/L 40870.0 43090.Ammonia as N ........................ mg/L 8.0 11.5Nitrite Nitrogen .................................. mg/L a aOrtho-phosphate ...................... mg/L 1.14 0.4
a None detected
46
NWC TP 7138
TABLE 14. Chemical Analysis of Well OB-1.
Constituent Units 13 Jan 90 13 Feb 90
Calcium ....................................... mg/L 60.0 56.0Magnesium ................................... mg/L 6.4 5.7Sodium ........................................ mg/L 1420.0 1520.0Potassium ..................................... mg/L 125.0 125.0
Carbonate ..................................... mg/L a aBicarbonate ................................... mg/L 236.0 271.0Chloride ....................................... mg/L 2308.0 2407.0Sulfate ......................................... mg/L 50.0 44.0
Nitrate as N03 ................................ mg/L 1.8 aNitrate as N ................................... mg/L 0.4 aFluoride ....................................... mg/L 3.8 3.3Bromide ....................................... mg/L 1.8 4.3
pH........................................... pH 7.6 6.9Electrical conductivity @ 25 OC ............ pmho/cm 7600.0 8000.0Total dissolved solids @ 180 C .......... .g/L 4160.0 3960.0Aluminum ................................... tg/L a a
Antimony ..................................... jig/L a aArsenic ........................................ ig/L 7050.0 1310.0Boron ......................................... mg/L 47.6 49.1Copper ........................................ Ig/L 126.0 a
Lithium ........................................ Ig/L 14 000.0 14 000.0Manganese ................................... . t9g/L 594.0 785.0Mercury ....................................... 9g/L 365.0 aSelenium ...................................... 11g/L a a
Si as SiO2 .................................... tg/L 100.0 52.0Strontium ..................................... mg/L 2780.0 2990.0Thallium ........................... g/L a aZinc ............................................ 9g/L 653.0 51.0
Total Iron ..................................... tg/L 35340.0 2120.0Ammonia as N ............................... mg/L 0.03 0.15Nitrite Nitrogen .............................. mg/L a aOrtho-phosphate ............................. mg/L 0.54 0.18
a None detected
47
NWC TP 7138
TABLE 15. Chemical Analysis of Coso Well 4P-1.
Constituent Units 13 Feb 90 2 Aug 90
Calcium ....................................... mg/L 10.0 16.0Magnesium ................................... mg/L 0.11 0.26Sodium ........................................ mgL 530.0 66.0Potassium ..................................... mg/L 54.0 25.0
Carbonate ..................................... mg/L 297.0 aBicarbonate ................................... mg/L a 174.0Chloride ....................................... mg/L 439.0 3.5Sulfate ......................................... mg/L 112.0 70.0
Nitrate as N03 ................................ mg/L a aNitrate as N ................................... mg/L a aFluoride ....................................... mg/L 5.0 0.76Bromide ....................................... mg/L a a
pH ............................................. pH 9.8 7.8Electrical conductivity @ 25 *C ........... mho/cm 2600.0 440.0Total dissolved solids @ 180 *C ........... mg/L 1815.0 560.0Aluminum .................................... jg/L 76.0 262.0
Antimony .................................... .. tg/L a aArsenic ........................................ tg/L 148.0 aBoron ......................................... mg/L 4.5 0.11Copper ........................................ ±g/L a a
Lithium ....................................... .tg/L 490.0 21.0Manganese .................................... tg/L 15.0 157.0Mercury ..................................... .. 1/L a 0.2Selenium ...................................... pg/L a a
Si as Si02 ............ . . . . . . . . . . . . . . . . . . . . . . . . . mg/L 266.0 295.0Strontium ..................................... 9g/L 154.0 219.0Thallium ........................... g/L a aZinc ............................................. Ig/L 117.0 508.0
Total Iron ..................................... . g/L 475.0 1235.0Ammonia as N ............................... mg/L I 0.72 0.70Nitrite Nitrogen .............................. mg/L a aOrtho-phosphate ............................. mg/L 0.99 0.1
a None detected
48
NWC TP 7138
TABLE 16. Chemical Analysis of Well 4K-1.
Constituent Units 21 Feb 90 2 Aug 90
Calcium ....................................... mg/L 5.3 2.3Magnesium ................................... mg/L 0.34 0.20Sodium ........................................ mg/L 36.0 42.0Potassium ..................................... mg/L 9.3 7.0
Carbonate ..................................... mg/L a aBicarbonate ................................... mg/L 56.3 56.3Chloride ....................................... mg/L 4.6 5.0Sulfate ......................................... mg/L 50.0 53.
Nitrate as N03 ................................ mg/L 0.4 0.9Nitrate as N ................................... mg/L 0.1 0.2Fluoride ....................................... mg/L 3.0 1.1Bromide ....................................... mg/L 0.97 0.13
pH ............................................. pH 8.0 7.3Electrical conductivity @ 25 0C ............ gmho/cm 240.0 240.0Total dissolved solids @ 180 'C ........... mg/L 385.0 405.0Aluminum ................................... tg/L 1262.0 2140.0
Antimony .................................... tg/L a aArsenic ........................................ Ag/L 22.0 aBoron ........................................ t9g/L 0.10 17.0Copper ........................................ mg/L 70.0 a
Lithium ....................................... tg/L 185.0 11.0Manganese ................................... tg/L 252.0 45.0Mercury ...................................... . tgg/L a 1.9Selenium ..................................... pg/L a a
Si as SiO2 ..................................... mg/L 241.0 189.0Strontium .................................... . tgg/L 52.0 26.0Thallium . ............................ ig/L a 170.0Zinc ........................................... . g/L 2460.0 2190.0
Total Iron ..................................... jtg/L 11 890.0 0.65Ammonia as N ............................... mg/L 1.65 aNitrite Nitrogen .............................. mg/L 0.3 aOrtho-phosphate ............................. mgL 0.69 a
a None detected
49
NWC TP 7138
TABLE 17. Chemical Analysis of South Pool.
Constituent Units 13 Feb 90 2 Aug 90
Calcium ....................................... mg/L 39.0 46.0Magnesium ................................... mg/L 8.9 .Sodium ........................................ mg/L 10.0 18.0Potassium ..................................... mg/L 13.6 16.8
Carbonate ..................................... mg/L a aBicarbonate ................................... mg/L a aChloride ...................................... mg/L a aSulfate ....................................... mg/L 740.0 1400.0
Nitrate as N03 ................................ mg/L 1.8 1.3Nitrate as N .................................. mg/L '.4 0.3Fluoride ....................................... mg/L 0.19 0.35Bromide ....................................... mg/L a a
pH ........................................... pH 2.3 2.0Electrical conductivity @ 25 C ............ pmho/cm 3400.0 5700.0Total dissolved solids @ 180 *C ........... mg/L 1360.0 219.5.0Acidity as H ion ............................. mg/L 10.1 20.0Aluminum .................................... ig/L 14 790.0 44 730.0
Antimony ..................................... . tg/L a aArsenic ........................................ ig/b a aBoron ......................................... mg/L 0.21 0.78Copper ........................................ jg/L 62.0 213.0
Lithium ........................................ ig/L 55.0 30.0Manganese .................................... .tg/L 800.0 1320.0Mercury ....................................... .Ig/L a 0.2Selenium ...................................... Ag/L a a
Si as SiO2 ..................................... mg/L 186.0 315.0Strontium ..................................... Ag/L 45.0 117.0Thallium ...................................... ig/L a aZinc ................................ ........ jg/L 50C 9 556.0
Total Iron ..................................... .jg/L 5142.0 13010.0Ammonia as N ............................... mg/L 27.0 53.0Nitrite Nitrogen .............................. mg/L a aOrtho-phosphate ............................. mg/L 0.33 a
a None detected
50
. , , , ' I '
NWC TP 7138
TABLE 18. Chemical Analysis of Coso Well 4KC-10.
Constituent Units 2 Aug 90
Calcium ....................... mg/L 175.0Magnesium ................... mg/L 27.0Sodium ........................ mg/L 41.0Potassium ..................... mg/L 28.0
Carbonate ..................... mg/L aBicarbonate ................... mg/L aChloride ....................... mg/L aSulfate ......................... mg/L 870.0
Nitrate as N03 ................ mg/L 0.4Nitrate as N ................... mg/L 0.1Fluoride ....................... mg/L 0.9Bromide ...................... mg/L a
pH ................... ...... pH 2.8Electrical conductivity @ 25 *C pmho/cm 2300.0Total dissolved solids @ 180 'C mgiL 1600.0Acidity as T ion .............. mg/L 3.3Aluminum ..................... pg/L 2540.0
Antimony ..................... tg/L aArsenic ........................ 9g/L aBoron .......................... mg/L 1.1Copper ...................... .tg/L 182.0
Lithium ....................... 9g/L 80.0Manganese .................... 9g/L 5000.0Mercury ...................... pg/L 0.3Selenium ..................... 9g/L- a
Si as SiO2 ..................... mg/L 257.0Strontium .................... 9g/L 1100.0Thallium ...................... .pg/L aZinc ............................ Ig/ 438.0
Total Iron .................... 9.tg/L 22 740.0Ammonia as N ............... mg/L 25.0Nitrite Nitrogen .............. mg/L 0.1Ortho-phosphate ............. mg/L 0.3
"None detected
51
NWC TP 7138
TABLE 19. Chemical Analysis of Mudfield Runoff.
Constituent Units 14 Feb 90
Calcium ....................... mg/L 309.0Magnesium ................... mg/L 58.0Sodium ........................ mg/L 103.0Potassium ..................... mg/L 42.0
Carbonate ..................... mg/L aBicarbonate ................... mg/L 17.3Chloride ....................... mg/L 6.0Sulfate ......................... mg/L 1360.0
Nitrate as N03 ................ mg/L 13.7Nitrate as N ................... mg/L 3.1Fluoride ....................... mg/L aBromide ....................... mg/L a
pH ............................. pH 5.6Electrical conductivity @ 25 *C pWmho/cm 2500.0Total dissolved solids @ 180 'C mg/L 2230.0Aluminum ................... .tg/L 307.0
Antimony ..................... gg/L aArsenic ........................ Ag/L 27.0Boron .......................... mg/L 3.6Copper ........................ g/L 10.0
Lithium ....................... 9g/L 50.0Manganese .................... Pg/L 8530.0Mercury ...................... 9g/L aSelenium ...................... tg/L a
Si as SiO2 ..................... mg/L 223.0Strontium ..................... 9g/L 2150.0Thallium ...................... .tgg/L aZinc ............................ gg/L 129.0
Total Iron ..................... gg/L 17 540.0Ammonia as N ............... mg/L 32.0Nitrite Nitrogen .............. mg/L aOrtho-phosphate ............. mg/L 0.45
a None detected
52
NWC TP 7138
TABLE 20. Chemical Analysis of Well 4H-8.
Constituent Units 15 Feb 90
Calcium ....................... mg/L 0.4Magnesium ................... mg/L aSodium ........................ mg/L 67 500.0Potassium ..................... mg/L 4700.0
Carbonate ..................... mg/L 11417.0Bicarbonate ................... mg/L 8835.0Chloride ....................... mg/L 87 084.0Sulfate ......................... mg/L 9000.0
Nitrate as N03 ................ mg/L 811.0Nitrate as N ................... mg/L 183.0Fluoride ....................... mg/L 1067.0Bromide ....................... mg/L 160.0
pH ............................. pH 10.1Electrical conductivity @ 25 C pmho/cm 121 200.0Total dissolved solids @ 180 *C mg/L 190 200.0Aluminum .................... .g/L a
Antimony ..................... ag/L 1144.0Arsenic ........................ ag/L 540000.0Boron .......................... mg/L 1639.0Copper ....................... g/L a
Lithium ........................ ag/L 810000.0Manganese ................... . g/L aMercury ....................... lg/L aSelenium ...................... ag/L a
Si as Si02 ..................... g/L 220.0Strontium ..................... ag/L 384.0Thallium .................... 9ag/b aZinc ......................... 9.g/L a
Total Iron ..................... ag/L aAmmonia as N ............... mg/L aNitrite Nitrogen .............. mg/L aOrtho-phosphate ............. mg/L 285.0
a None detected
53
NWC TP 7138
TABLE 21. Chemical Analysis of Well 4H-4 (Schober's H. W. Well No. 4).
Constituent Units 4 Oct 89 13 Feb 90 2 Aug 90
Calcium .......... . . .............. mg/L 37.0 24.0 25.0Magnesium ............................ mg/L 0.68 0.31 1.2Sodium ................................. mg/L 63.0 54.0 58.0Potassium .............................. mg/L 2.6 3.4 2.3
Carbonate .............................. mg/L a a aBicarbonate ............................ mg/L 98.8 89.2 91.8Chloride ................................ mg/L 5.3 5.0 5.3Sulfate .................................. mg/L 142.0 96.0 108.0
Nitrate ai N03 ......................... mg/L a 0.9 3.1Nitrate as N ............................ mg/L a 0.2 0.7Fluoride ................................ mg/L 0.14 0.37 0.53Bromide ................................ mg/L 0.12 a a
pH ...................................... pH 7.8 8.6 8.0Electrical conductivity @ 25 'C ..... tmho/cm 490.0 380.0 400.0Total dissolved solids @ 180 *C .... mg/L 360.0 255.0 375.0Aluminum ............................ .tg/L 140.0 957.0 6250.0
Antimony .............................. gg/L a a aArsenic ................................ .tg/L 11.0 16.0 aBoron ................................. .tg/L 0.62 0.48 0.11Copper ................................. mg/L a a a
Lithium ................................ .j9g/L a a aManganese ............................. . tg/L 30.0 86.0 177.0Mercury ................................ .9g/L 0.6 192.0 82.6Selenium .............................. I.g/L a a a
Si as Si02 .............................. mg/L 80.0 114.0 148.0Strontium ............................. . tgg/L 385.0 375.0 444.0Thallium ...................... g/L a a aZinc .................................... pg/L a 66.0 225.0
Total Iron .............................. . 1g/L a 14 860.0 20 330.0Ammonia as N ........................ mg/L 1.15 0.79 0.19Nitrite Nitrogen ....................... mg.L 0.2 0.2 0.1Ortho-phosphate ...................... mg/L 0.24 0.36 a
a None detected
54
NWC TP 7138
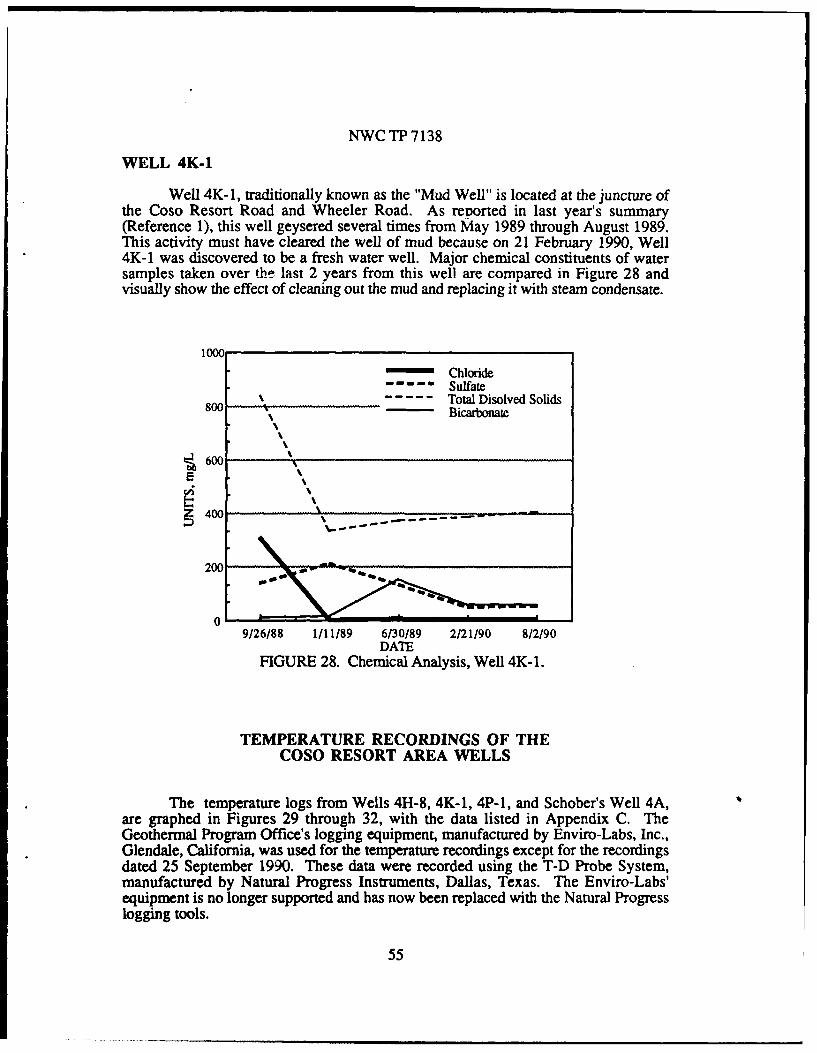
WELL 4K-1
Well 4K- 1, traditionally known as the "Mud Well" is located at the juncture ofthe Coso Resort Road and Wheeler Road. As reported in last year's summary(Reference 1), this well geysered several times from May 1989 through August 1989.This activity must have cleared the well of mud because on 21 February 1990, Well4K-1 was discovered to be a fresh water well. Major chemical constituents of watersamples taken over the last 2 years from this well are compared in Figure 28 andvisually show the effect of cleaning out the mud and replacing it with steam condensate.
1000-Chloride
Sulfate8 Total Disolved Solids
800 Bicarbonate
600 %,
400 X .200 -- - --- -
019/26/88 1/11/89 6/30/89 2/21/90 8/2/90
DATEFIGURE 28. Chemical Analysis, Well 4K-1.
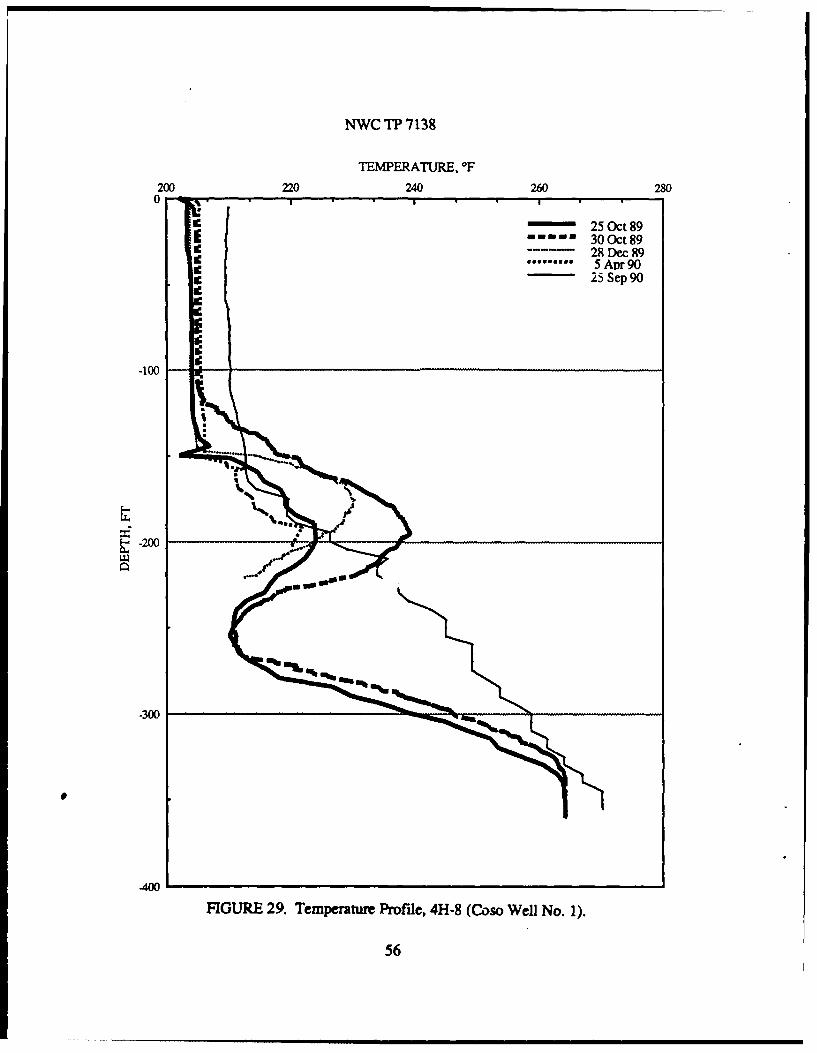
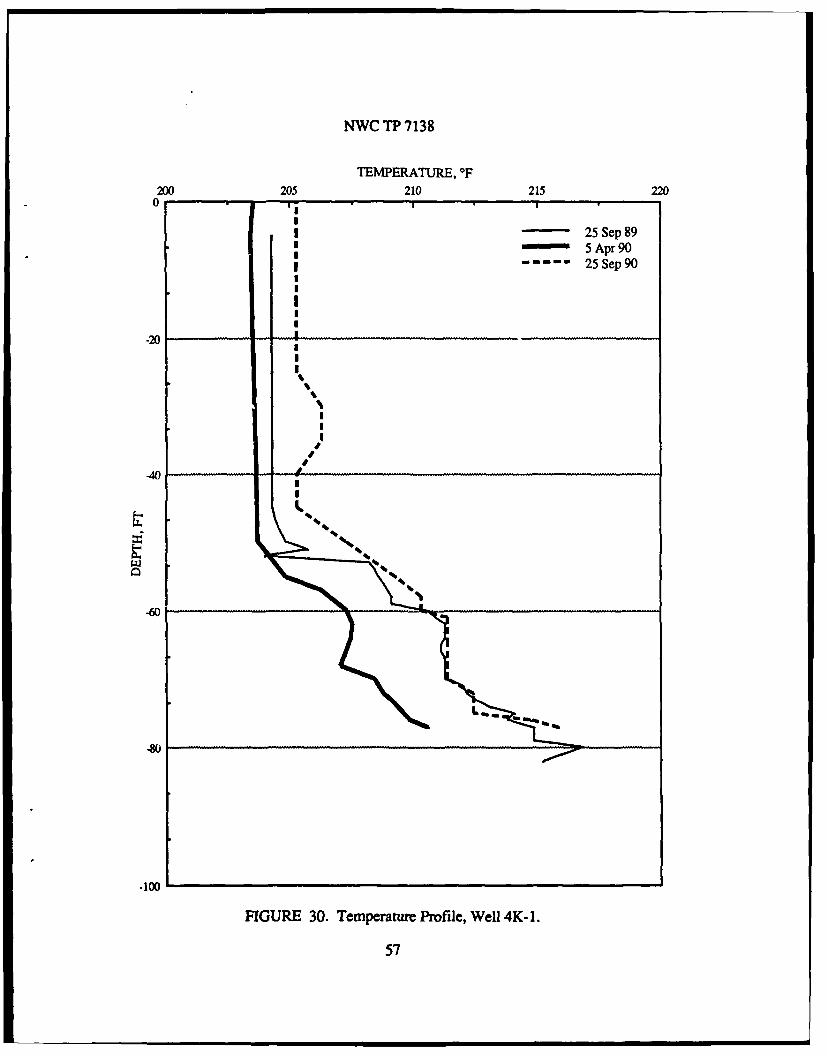
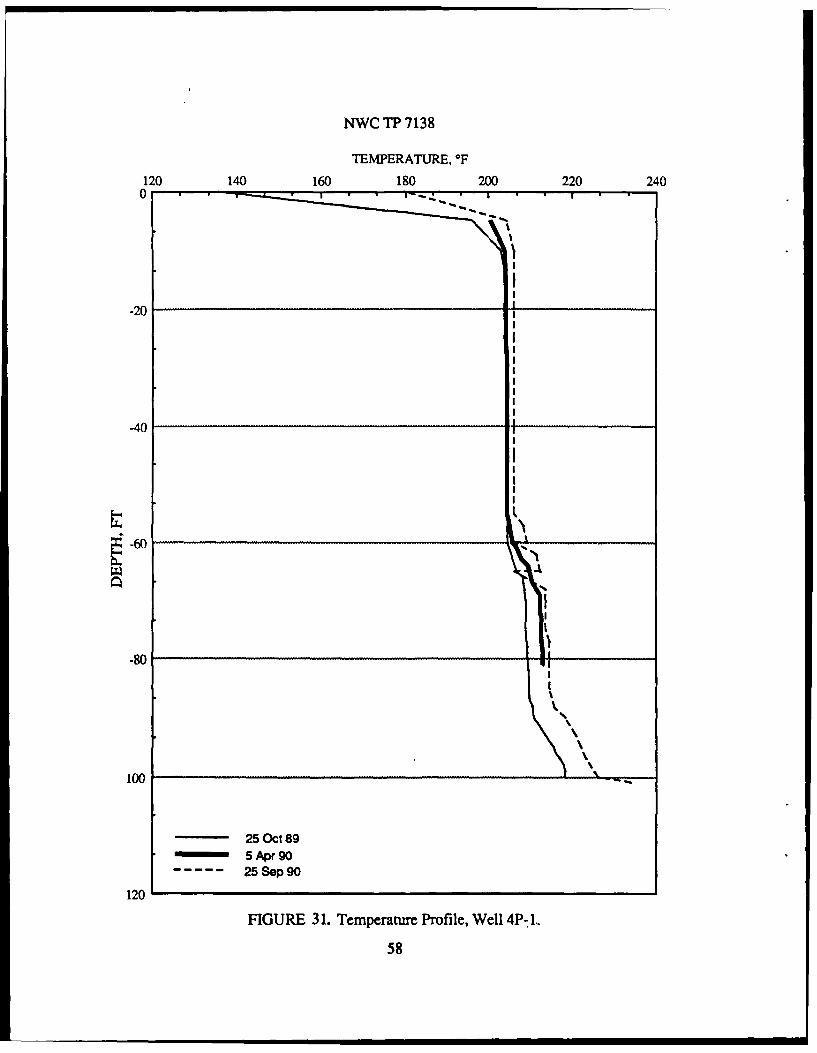
TEMPERATURE RECORDINGS OF THECOSO RESORT AREA WELLS
The temperature logs from Wells 4H-8, 4K-1, 4P-1, and Schober's Well 4A,are graphed in Figures 29 through 32, with the data listed in Appendix C. TheGeothermal Program Office's logging equipment, manufactured by Enviro-Labs, Inc.,Glendale, California, was used for the temperature recordings except for the recordingsdated 25 September 1990. These data were recorded using the T-D Probe System,manufactured by Natural Progress Instruments, Dallas, Texas. The Enviro-Labs'equipment is no longer supported and has now been replaced with the Natural Progresslogging tools.
55
NWC TP 7138
TEMPERATURE. TF
200 220 240 260 2800
25 Oct 89* mmmu30 Oct 89
--- 28 Dec R9*WW**~* 5 5Apr90
25 Sep 90
-100-
~-200----
-300 -"m sf
400
FIGURE 29. Tempm~ture Profile, 4H-8 (Coso Well No. 1).
56
NWC TP 7138
TEMPERATURE, OF
200 205 210 215 2200 '1 " *
0I
- 25 Sep 89S5 Apr 90
-25 Sep 90
-20 - III
AO4
III
II
-60 --- -- ----
II
-100
FIGURE 30. Temperature Profile, Well 4K-1.
57
NWC TP 7138
TEMPERATURE, OF
120 140 160 180 200 220 240
-20
-40
-80
100
25 Oct 895 Apr 90
----- 25 Sep 90
120
FIGURE 3 1. Temperature Profile, Well 4P- 1.
58
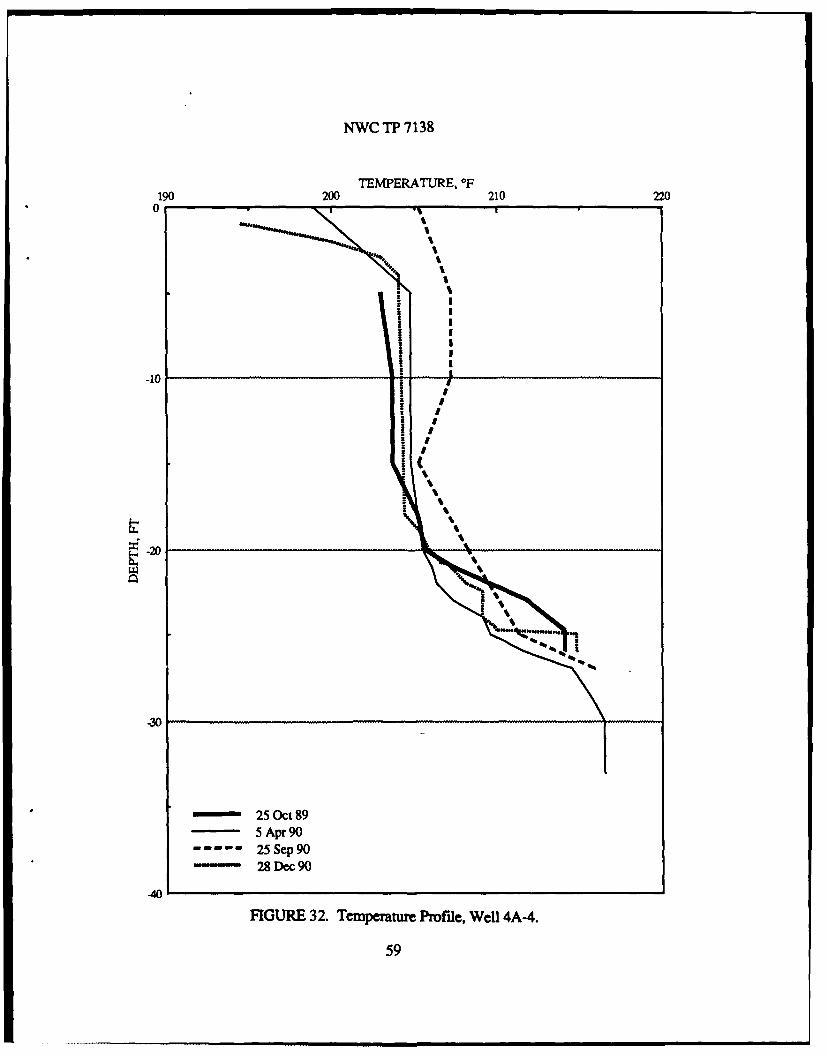
NWC TP 7138
TEMPERATURE, TF190 200 210 220
0 IS
'%
-30
25 Oct 85 Apr 925Sep9
-28 De9
FIGUE 32 Teperaure rofle, eil A-459
NWC TP 7138
OTHER GEOTHERMAL ACTIVITY AT COSO HOT SPRINGS
WEST CANYONS
Two canyons directly west of the main resort (below Rain Gauge No. 2) havelarge areas of warm ground and small areas of thermhl alteration, particularly in thebedrock of the canyon floors. The warm ground is evidenced by a lack of vegetationand the winter snow melt patterns. The smaller sites are perennially hot with steamingground and occasionally flowing hot springs. These sites are visited monthly to monitorany changes that occur. During the period of this report, there were four springsdocumented. Two of the springs display sporadic activity, emitting steam and water fora short time before returning again to a dormant state. The flow of the other two springshas remained constant with only slight variations in size. Three steam vents have alsoremained active emitting a constant but small steam flow. There is little evidence of anyincreased activity in the remaining canyon areas, but they will continue to be monitoredclos 'y.
MUD CRATER 4KC-8
Mud Crater 4KC-8 was the first large mud crater to form during this new periodof activity. It began to grow in August 1988 and by February 1989 had reached a sizeof 50 by 80 feet. During October 1989 a slight increase in activity began along the westside of the crater. The activity has continued through this reporting period, with newsteam vents and flowing springs along the south, west and north ends, some of whichhave grown into small craters and joined the main crater enlarging its overall size.
MUD CRATER 4KC-9
Mud Crater 4KC-9 is in the vicinity of an old Well (4K-7) and was the firstactivity in this area to grow into a crater. For a short period last year, the activity in4KC-9 subsided while at the same time Mud Crater 4KC-10 was rapidly growing. Inearly October 1989 a steam vent appeared approximately 25 feet north of 4KC-9. In2 weeks it had grown into another mud crater 15 feet in diameter, perking with waterand occasionally throwing mud 15 to 20 feet in the air. Activity in both craterscontinued at a steady pace until they joined together in May 1990. At this time the waterlevel began to diminish, and by late June there was little activity in the crater except forsmall steam vents. Activity resumed in the northern portion of the crater (newestaddition) in September, and 4KC-9 began throwing mud and growing toward 4KC-10.As of 30 September, activity in the original area of 4KC-9 had not resumed but isanticipated.
60
NWC TP 7138
MUD CRATER 4KC-10
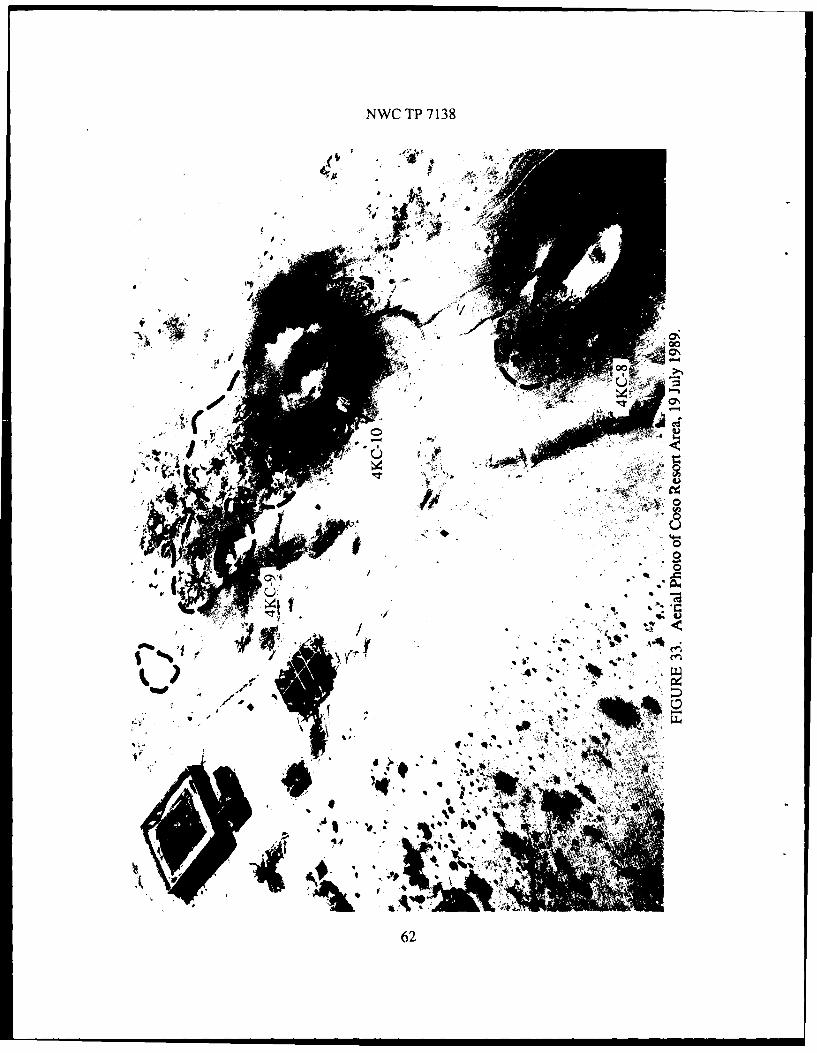
The area that Mud Crater 4KC-10 now covers probably encompasses the oldresort wells 4K-2, -3, and -4. There is no visible evidence of old well casings, butnumerous sections of 2-inch pipe are along the north bank east of the old monitoringsite. In late November 1989 4KC-10 started throwing mud as high as 80 feet. Duringthe first week of December the three monitored mud pots (red, brown, and grey) wereovercome by the activity and are now a part of 4KC-10 crater. In early February4KC-10 had joined with the area north of the Lattice House, leaving a low level island.In late Febnmary, the activity decreased and the water level began to go down. Currentlythere is a crater with an approximate diameter of 150 feet. The dashed black line inFigure 33 shows the area encompassed by the mud craters as of 30 September 1990.
ACTIVITY EAST OF THE RESORT ANDNORTHEAST OF SOUTH POOL
An area east of the resort and northeast of South Pool contains several sites ofminor thermal activity, including small steamers, pots, and hot ground. As stated in the1988-89 report (Reference 1), two rather large craters have also formed (one red andone grey) due to increased thermal activity. The red crater is now approximately 35 feetin diameter and occasionally throws mud 20 to 25 feet in the air. The grey crater isapproximately 15 by 25 feet and also throws mud, but it is much less active than the redcrater. The craters may be the result of failed casings in uncharted wells in the area.The remainder of this area has not shown any drastic change in activity.
4H-8 (COSO WELL NO. 1)
Coso Well No. 1 was dug by NWC in 1967 to a depth of 375 feet and casedwith a 4-inch pipe to 370 feet. An attempt was made to log the well temperature on28 December 1989, but the temperature probe would only go 221 feet. On 5 April asecond attempt was made, reaching a depth of 203.6 feet. Clearing of the well wasbegun on 5 July. Blowing out the well with compressed air was tried, but theobstruction remained. A 13-inch lead weight was then lowered to the obstruction,where it was raised and dropped repeatedly from about 10 feet, after several attempts theweight broke through the obstruction and continued down the well. A galvanized pipewas then lowered until it reached the obstruction and raised and lowered until it brokethrough the obstruction. Blowing out the well was attempted again and successfullycompleted. Large pieces of hard, baked materials came out and the well started tosteam. Temperature logging was a success on 25 September. The well casing hasremained clear with a good steam flow since completion of descaling the well casing.
61
NWC TP 7138
41
*Amp0D
62.
NWC TP 7138
4A-2 THROUGH 4A-5, 4A-13 THROUGH4A-17 (SCHOBER'S RESORT WELLS)
On 3 October 1989, a hot water well was found 5 feet from the southeast comerof the bath house. The well is an uncased 8-inch well, 31 feet deep with a water level of19 feet six inches The water temperature is 206'F. Chemical analysis of the water canbe found in Table 14. A dry steam well was also located 75 feet south of the bathhouse, which has been properly closed and cemented.
4H-1, 2, 3, AND 7 (COSO RESORTCORROSION ARRAY WELLS)
As stated in the 1988-89 report (Reference 1), data has not been collected fromthis site since 6 June 1989, when all equipment was removed to facilitate repairs to thewells. As of this report, repair of the wells is still unfunded.
SUMMARY
During this reporting period (1 October 1989 through 30 September 1990) Well4P-2 began surging with short bursts of steam, and the steam flow increased at 4A-2and 4A-3 (Schober's Resort Wells). In response to this activity, a larger flow meterfrom 4H-4 was exchanged with the one at 4P-2, and orifices were enlarged at Wells4P-2, 4A-2, and 4A-3. A microbaragraph was put in place to monitor changes inbarometric pressure. This unit, along with the hygrothermograph installed in the Fall1990, and the rainfall stations will give a more complete record of weather conditionsthat affect the activity in the area.
New water well temperature logging equipment was purchased due to failure ofthe previous equipment and lack of repair availability. Temperature logging of Well4H-8 was hampered by a blockage in the well bore which had to be cleared repeatedly.This blockage appears to be the result of boiling inside the well and the formation ofdeposits around the boiling.
As part of a general effort to cleanup and improve the safety of the area, theCoso Resort Corrosion Array was torn down; and valves and other salvageablematerials were turned into the Department of Defense Property Disposal/ReutilizationBranch. The barbed wire fencing is being repaired and extended to enclose the areas ofgreatest hydrothermal activity.
63
NWCTI 7138
PLANS FOR 1991
The plans for 1991 are to: (1) closely monitor the increased activity at the CosoResort Area; (2) continue the extension of barbed wire fencing around the Coso MudPots and Schober's area to limit access and increase safety; (3) begin collecting relativehumidity and more accurate temperature data with the newly installedhygrothermograph; (4) upgrade computer hardware and rewrite neceqsary programs tobetter retrieve and use data collected from Barton meters, weather station recorders, andother miscellaneous sites.
64
NWC TP 7138
REFERENCES
Naval Weapons Center. Coso Monitoring Program, October 1989 ThroughSeptember 1990, by S. C. Bjornstad, J. H. Mzrnahan and E. M. Eawards.China Lake, Calif., NWC, March 1990. 1 12 pp. (NWC TP 7056, publicationUNCLASSIFIED.)
65
NWC TP 7138
Appendix A
DAILY STEAM FLOW DATA
67
NWC TP 7138
TABLE A-1. Devils Kitchen Site Steam Flow Data, lb/h.
Date High Low Date High Low
1 Oct 89 354.0 354.0 5 Nov 89 362.1 362.12 Oct 89 358.0 354.0 6 Nov 89 358.0 358.03 Oct 89 358.0 354.0 7 Nov 89 354.0 354.04 Oct 89 354.0 354.0 8 Nov 89 354.0 354.05 Oct 89 354.0 350.0 9 Nov 89 358.0 358.0
6 Oct 89 354.0 350.0 10 Nov 89 358.0 358.07 Oct 89 354.0 350.0 11 Nov 89 362.1 358.08 Oct 89 354.0 354.0 12 Nov 80 362.1 358.09 Oct 89 354.0 354.0 13 Nov 8, 362.1 358.010 Oct 89 358.0 354.0 14 Nov 89 358.0 354.0
11 Oct 89 354.0 354.0 15 Nov 89 354.0 350.012 Oct 89 354.0 354.0 16 Nov 89 362.1 358.013 Oct 89 354.0 354.0 17 Nov 89 362.1 354.014 Oct 89 358.0 354.0 18 Nov 89 354.0 350.015 Oct 89 354.0 354.0 19 Nov 89 362.1 358.0
16 Oct 89 354.0 354.0 20 Nov 89 362.1 358.017 Oct 89 358.0 354.0 21 Nov 89 362.1 362.118 Oct 89 350.0 350.0 22 Nov 89 362.1 358.019 Oct 89 354.0 354.0 23 Nov 89 366.1 362.120 Oct 89 354.0 354.0 24 Nov 89 366.1 362.1
21 Oct 89 354.0 354.0 25 Nov 89 362.1 358.022 Oct 89 354.0 350.0 26 No" 89 358.0 354.023 Oct 89 350.0 350.0 27 Nov 89 350.0 350.024 Oct 89 358.0 358.0 28 Nov 89 358.0 354.025 Oct 89 358.0 350.0 29 Nov 89 362.1 362.1
26 Oct 89 350.0 346.0 30 Nov 89 362.1 358.027 Oct 89 354.0 354.0 1 Dec 89 358.0 358.028 Oct 89 358.0 354.0 2 Dec 89 358.0 358.029 Oct 89 350.0 350.0 3 Dec 89 362.1 358.030 Oct 89 354.0 354.0 4 Dec 89 362.1 362.1
31 Oct 89 358.0 358.0 5 Dec 89 366.1 366.11 Nov 89 354.0 350.0 6 Dec 89 362.1 358.02 Nov 89 354.0 350.0 7 Dec 89 362.1 358.03 Nov 89 358.0 358.0 8 Dec 89 362.1 358.04 Nov 89 358.0 358.0 9 Dec 89 366.1 362.1
68
NWC TP 7138
TABLE A-I (Contd.)
Date High Low Date High Low
10 Dec 89 362.1 362.1 14 Jan 90 366.1 366.111 Dec 89 362.1 358.0 15 Jan 90 366.1 362.112 Dec 89 362.1 358.0 16 Jan 90 366.1 362.113 Dec 89 362.1 362.1 17 Jan 90 362.1 362.114 Dec 89 362.1 358.0 18 Jan 90 362.1 362.1
15 Dec 89 362.1 358.0 19 Jan 90 362.1 362.116 Dec 89 366.1 366.1 20 Jan 90 362.1 358.017 Dec 89 366.1 358.0 21 Jan 90 358.0 358.018 Dec 89 362.1 362.1 22 Jan 90 366.1 362.119 Dec 89 362.1 362.1 23 Jan 90 370.1 366.1
20 Dec 89 358.0 354.0 24 Jan 90 362.1 362.121 Dec 89 358.0 358.0 25 Jan 90 362.1 362.122 Dec 89 358.0 358.0 26 Jan 90 370.1 366.123 Dec 89 358.0 358.0 27 Jan 90 370.1 370.124 Dec 89 362.1 354.0 28 Jan 90 362.1 362.1
25 Dec 89 362.1 358.0 29 Jan 90 362.1 362.126 Dec 89 370.1 366.1 30 Jan 90 374.1 370.127 Dec 89 370.1 366.1 31 Jan 90 374.1 370.128 Dec 89 366.1 366.1 1 Feb 90 370.1 370.129 Dcc 89 362.1 358.0 2 Feb 90 362.1 358.0
30 Dec 89 362.1 358.0 3 Feb 90 362.1 358.031 Dec 89 362.1 358.0 4 Feb 90 366.1 362.11 Jan 90 362.1 358.0 5 Feb 90 366.1 362.12 Jan 90 362.1 354.0 6 Feb 90 370.1 366.13 Jan 90 354.0 354.0 7 Feb 90 382.2 362.1
4 Jan 90 358.0 354.0 8 Feb 90 366.1 362.15 Jan 90 358.0 358.0 9 Feb 90 362.1 362.16 Jan 90 362.1 358.0 10 Feb 90 362.1 362.17 Jan 90 366.1 366.1 11 Feb90 366.1 366.18 Jan 90 366.1 362.1 12 Feb 90 378.2 370.1
9 Jan 90 366.1 362.1 13 Feb 90 370.1 370.110 Jan 90 366.1 362.1 14 Feb 90 370.1 362.111 Jan 90 362.1 358.0 15 Feb 90 366.1 362.112 Jan 90 362.1 362.1 16 Feb 90 366.1 366.113 Jan 90 366.1 362.1 17 Feb 90 366.1 358.0
69
NWC TP 7138
TABLE A-I (Contd.)
Date High Low Date High Low
18 Feb 90 370.1 366.1 25 Mar 90 354.0 354.019 Feb 90 366.1 358.0 26 Mar 90 362.1 358.020 Feb 90 366.1 366.1 27 Mar 90 358.0 354.021 Feb 90 366.1 362.1 28 Mar 90 354.0 350.022 Feb 90 366.1 362.1 29 Mar 90 350.0 350.0
23 Feb 90 366.1 366.1 30 Mar 90 350.0 350.024 Feb 90 366.1 362.1 31 Mar 90 350.0 346.025 Feb 90 370.1 366.1 1 Apr 90 346.0 342.026 Feb 90 370.1 366.1 2 Apr 90 342.0 337.927 Feb 90 370.1 370.1 3 Apr 90 337.9 333.9
28 Feb 90 370.1 366.1 4 Apr 90 333.9 333.9I Mar 90 370.1 366.1 5 Apr 90 333.9 333.92 Mar 90 370.1 370.1 6 Apr90 333.9 329.93 Mar 90 370.1 370.1 7 Apr 90 333.9 329.94 Mar 90 374.1 370.1 8 Apr 90 325.9 321.8
5 Mar 90 325.9 321.8 9 Apr 90 333.9 329.96 Mar 90 333.9 333.9 10 Apr 90 337.9 337.97 Mar 90 342.0 342.0 11 Apr 90 337.9 333.98 Mar 90 346.0 346.0 12 Apr 90 342.0 337.9
9 Mar 90 354.0 354.0 13 Apr 90 342.0 337.9
10 Mar 90 358.0 358.0 14 Apr 90 342.0 342.011 Mar 90 346.0 346.0 15 Apr 90 346.0 342.012 Mar 90 350.0 346.0 16 Apr 90 358.0 354.013 Mar 90 346.0 346.0 17 Apr 90 370.1 350.014 Mar 89 358.0 354.0 18 Apr 90 358.0 358.0
15 Mar 90 354.0 350.0 19 Apr 90 358.0 358.0;6 Mar 90 354.0 350.0 20 Apr 90 366.1 358.01D Mar90 358.0 350.0 21 Apr90 378.2 370.118 Mar 90 354.0 350.0 22 Apr 90 378.2 370.119 Mar 90 354.0 354.0 23 Apr 90 358.0 354.0
20 Mar 90 358.0 354.0 24 Apr 90 354.0 354.021 Mar 90 358.0 358.0 25 Apr 90 358.0 354.022 Mar 90 358.0 354.0 26 Apr 90 358.0 358.023 Mar 90 358.0 354.0 27 Apr 90 358.0 358.024 Mar 90 358.0 354.0 28 Apr 90 358.0 358.0
70
NWC TP 7138
TABLE A-I (Contd.)
Date High Low Date High Low
29 Apr 90 358.0 358.0 3 Jun 90 358.0 358.030 Apr 90 358.0 358.0 4 Jun 90 358.0 358.01 May 90 358.0 358.0 5 Jun 90 358.0 358.02 May 90 358.0 354.0 6 Jun 90 358.0 358.03 May 90 358.0 354.0 7 Jun 90 358.0 358.0
4 May 90 358.0 354.0 8 Jun 90 358.0 358.05 May 90 358.0 354.0 9 Jun 90 358.0 358.06 May 90 358.0 354.0 10 Jun 90 358.0 358.07 May 90 358.0 354.0 11 Jun 90 358.0 354.08 May 90 358.0 354.0 12 Jun 90 358.0 358.0
9 May 90 358.0 354.0 13 Jun 90 358.0 358.010 May 90 358.0 358.0 14 Jun 90 358.0 358.011 May 90 358.0 358.0 15 Jun 90 358.0 354.012 May 90 362.1 358.0 16 Jun 90 358.0 354.013 May 90 358.0 354.0 17 Jun 90 358.0 358.0
14 May 90 358.0 358.0 18 Jun 90 358.0 358.015 May 90 358.0 358.0 19 Jun 90 358.0 358.016 May 90 358.0 358.0 20 Jun 90 358.0 358.017 May 90 358.0 358.0 21 Jun 90 362.1 358.018 May 90 358.0 354.0 22 Jun 90 358.0 358.0
19 May 90 358.0 358.0 23 Jun 90 362.1 358.020 May 90 358.0 358.0 24 Jun 90 358.0 358.021 May 90 358.0 358.0 25 Jun 90 358.0 358.022 May 90 358.0 358.0 26 Jun 90 358.0 358.023 May 90 358.0 358.0 27 Jun 90 358.0 358.0
24 May ')0 358.0 354.0 28 Jun 90 362.1 358.025 May 90 358.0 358.0 29 Jun 90 362.1 358.026 May 90 358.0 358.0 30 Jun 90 358.0 358.027 May 90 358.0 358.0 1 Jul90 362.1 362.128 May 90 358.0 358.0 2 Jul 90 358.0 358.0
29 May 90 358.0 358.0 3 Jul 90 358.0 358.030 May 90 358.0 358.0 4 Jul 90 358.0 358.031 May 90 358.0 358.0 5 Jul90 358.0 358.0
1 Jun 90 358.0 358.0 6 Jul 90 358.0 358.02 Jun 90 358.0 358.0 7 Jul 90 358.0 358.0
71

NWC TP 7138
TABLE A-I (Contd.)
Date High Low Date High Low
8 Jul90 358.0 358.0 12 Aug 90 362.1 358.09 Jul 90 358.0 358.0 13 Aug 90 358.0 358.010 Jul 90 358.0 358.0 14 Aug 90 358.0 358.011 Jul 90 358.0 358.0 15 Aug 90 358.0 358.012 Jul 90 358.0 358.0 16 Aug 90 358.0 358.0
13 Jul 90 358.0 358.0 17 Aug 90 358.0 358.014 Jul 90 358.0 358.0 18 Aug 90 358.0 354.015 Jul 90 358.0 358.0 19 Aug 90 358.0 358.016 Jul 90 358.0 358.0 20 Aug 90 358.0 358.017 Jul 90 358.0 358.0 21 Aug 90 358.0 354.0
18 Jul 90 358.0 358.0 22 Aug 90 358.0 358.019 Jul 90 358.0 358,0 23 Aug 90 358.0 354.020 Jul 90 358.0 358.0 24 Aug 90 358.0 358.021 Jul 90 358.0 358.0 25 Aug 90 358.0 358.022 Jul 90 358.0 358.0 26 Aug 90 358.0 354.0
23 Jul 90 358.0 358.0 27 Aug 90 358.0 358.024 Jul 90 358.0 358.0 28 Aug 90 358.0 358.025 Jul 90 358.0 358.0 29 Aug 90 362.1 350.026 Jul 90 358.0 358.0 30 Aug 90 358.0 358.027 Jul 90 358.0 358.0 31 Aug 90 358.0 358.0
28 Jul 90 358.0 358.0 1 Sep 90 358.0 358.029 Jul 90 358.0 358.0 2 Sep 90 358.0 358.030 Jul 90 358.0 358.0 3 Sep 90 358.0 358.031 Jul 90 362.1 358.0 4 Sep 90 358.0 358.01 Aug 90 362.1 362.1 5 Sep 90 358.0 358.0
2 Aug 90 362.1 362.1 6 Sep 90 358.0 358.03 Aug 90 362.1 358.0 7 Sep 90 358.0 358.04 Aug 90 358.0 358.0 8 Sep 90 358.0 358.05 Aug 90 358.0 358.0 9 Sep 90 358.0 358.06 Aug 90 358.0 358.0 10 Sep 90 358.0 358.0
7 Aug 90 358.0 358.0 11 Sep 90 358.0 358.08 Aug 90 358.0 358.0 12 Sep 90 358.0 358.09 Aug 90 358.0 358.0 13 Sep 90 358.0 358.010 Aug 90 358.0 358.0 14 Sep 90 358.0 358.011 Aug 90 362.1 358.0 15 Sep 90 358.0 358.0
72
NWCTP 7138
TABLE A-I (Contd.)
Date High Low Date High Low
16 Sep 90 358.0 358.0 26 Sep 90 358.0 354.017 Sep 90 358.0 358.0 27 Sep 90 358.0 354.018 Sep 90 358.0 358.0 28 Sep 90 358.0 354.019 Sep 90 358.0 358.0 29 Sep 90 358.0 358.020 Sep 90 358.0 358.0 30 Sep 90 358.0 358.0
21 Sep 90 358.0 358.022 Sep 90 358.0 358.023 Sep 90 358.0 358.024 Sep 90 358.0 358.025 Sep 90 358.0 358.0
73
NWC TP 7138
TABLE A-2. 4P-2 (Two-Inch Steam Well) Flow Data, lb/h.
Date High Low Date High Low
1 Oct 89 152.3 147.6 11 Nov 89 113.0 105.22 Oct 89 155.4 150.7 12 Nov 89 113.0 106.83 Oct 89 147.6 142.9 13 Nov 89 114.6 109.94 Oct 89 149.2 144.4 14 Nov 89 109.9 106.85 Oct 89 149.2 146.0 15 Nov 89 108.3 103.6
6 Oct 89 150.7 130.3 16 Nov 89 135.0 087.97 Oct 89 142.9 113.0 17 Nov 89 136.6 131.98 Oct 89 144.4 141.3 18 Nov 89 131.9 125.69 Oct 89 146.0 141.3 19 Nov 89 131.9 125.610 Oct 89 147.6 144.4 20 Nov 89 133.5 128.7
11 Oct 89 147.6 144.4 21 Nov 89 133.5 128.712 Oct 89 146.0 142.9 22 Nov 89 133.5 128.713 Oct 89 149.2 142.9 23 Nov 89 136.6 131.914 Oct 89 150.7 149.2 24 Nov 89 139.7 135.015 Oct 89 149.2 147.6 25 Nov 89 138.2 133.5
16 Oct 89 124.0 108.3 26 Nov 89 138.2 135.017 Oct 89 130.3 105.2 27 Nov 89 131.9 127.218 Oct 89 136.6 128.7 28 Nov 89 131.9 124.019 Oct 89 139.7 130.3 29 Nov 89 130.3 127.220 Oct 89 138.2 133.5 30 Nov 89 135.0 128.7
21 Oct 89 139.7 135.0 1 Dec 8922 Oct 89 136.6 130.3 2 Dec 89 135.0 127.223 Oct 89 135.0 130.3 3 Dec 89 131.9 125.624 Oct 89 136.6 135.0 4 Dec 89 131.9 128.725 Oct 89 142.9 138.2 5 Dec 89 135.0 128.7
26 Oct 89 135.0 128.7 6 Dec 89 136.6 130.327 Oct 89 138.2 133.5 7 Dec 89 105.2 080.128 Oct 89 135.0 130.3 8 Dec 89 127.2 119.329 Oct 89 131.9 127.2 - 9 Dec 89 131.9 124.030 Oct 89 133.5 128.7 10 Dec 89 133.5 127.2
31 Oct 89- 6 Nov 89 000.0 000.0 11 Dec 89 131.9 128.77 Nov 89 114.6 108.3 12 Dec 89 152.3 125.68 Nov 89 113.0 109.9 13 Dec 89 136.6 133.59 Nov 89 111.5 105.2 14 Dec 89 136.6 133.510 Nov 89 109.9 103.6 15 Dec 89 127.2 092.6
74
NWC TP 7138
TABLE A-2 (Contd.)
Date High Low Date High Low
16 Dec 89 133.5 128.7 20 Jan 90 142.9 139.717 Dec 89 135.0 128.7 21 Jan 90 144.4 139.718 Dec 89 130.3 127.2 22 Jan 90 144.4 142.919 Dec 89 127.2 122.5 23 Jan 90 144.4 141.320 Dec 89 127.2 122.5 24 Jan 90 141.3 139.7
21 Dec 89 125.6 122.5 25 Jan 90 144.4 139.722 Dec 89 124.0 117.8 26 Jan 90 149.2 146.023 Dec 89 124.0 117.8 27 Jan 90 147.6 141.324 Dec 89 127.2 119.3 28 Jan 90 144.4 139.725 Dec 89 127.2 122.5 29 Jan 90 147.6 146.0
26 Dec 89 131.9 127.2 30 Jan 90 152.3 152.327 Dec 89 138.2 125.6 31 Jan 90 152.3 147.628 Dec 89 133.5 133.5 1 Feb 90 152.3 149.229 Dec 89 136.6 117.8 2 Feb 90 146.0 144.430 Dec 89 117.8 106.8 3 Feb 90 144.4 139.7
31 Dec 89 119.3 114.6 4 Feb 90 149.2 142.91 Jan 90 128.7 122.5 5 Feb 90 117.8 105.22 Jan 90 133.5 131.9 6 Feb 90 130.3 102.13 Jan 90 130.3 130.3 7 Feb 90 136.6 133.54 Jan 90 128.7 124.0 8 Feb 90 133.5 128.7
5 Jan 90 131.9 127.2 9 Feb 90 131.9 130.36 Jan 90 131.9 125.6 10 Feb 90 135.0 131.97 Jan 90 131.9 125.6 11 Feb 90 142.9 133.58 Jan 90 135.0 131.9 12 Feb 90 144.4 139.79 Jan 90 136.6 131.9 13 Feb 90 157.0 144.4
10 Jan 90 136.6 130.3 14 Feb 90 149.2 149.211 Jan 90 139.7 133.5 15 Feb 90 124.0 124.012 Jan 90 141.3 136.6 16 Feb 90 117.8 117.813 Jan 90 142.9 139.7 17 Feb 90 119.1 114.614 Jan 90 141.3 138.2 18 Feb 90 119.3 114.6
15 Jan 90 141.3 138.2 19 Feb 90 124.0 117.816 Jan 90 144.4 141.3 20 Feb 90 108.3 102.117 Jan 90 144.4 144.4 21 Feb 90 108.3 105.218 Jan 90 141.3 139.7 22 Feb 90 109.9 108.319 Jan 90 144.4 141.3 23 Feb 90 120.9 116.2
75
NWC TP 7138
TABLE A-2 (Contd.)
Date High Low Date High Low
24 Feb 90 122.5 120.9 31 Mar 90 142.9 139.725 Feb 90 122.5 122.5 1 Apr 90 141.3 136.626 Feb 90 133.5 130.3 2 Apr 90 141.3 136.627 Feb 90 124.0 102.1 3 Apr 90 106.8 103.628 Feb 90 127.2 102.1 4 Apr 90 106.8 105.2
1 Mar 90 128.7 105.2 5 Apr 90 109.9 103.62 Mar 90 131.9 106.8 6 Apr 90 111.5 105.23 Mar90 131.9 109.9 7 Apr90 113.0 108.34 Mar 90 133.5 111.5 8 Apr90 109.9 103.65 Mar90 119.3 117.8 9 Apr90 108.3 105.2
6 Mar 90 119.3 117.8 10 Apr 90 109.9 105.27 Mar90 119.3 116.2 11Apr90 111.5 108.38 Mar90 117.8 116.2 12 Apr90 113.0 109.99 Mar90 117.8 114.6 13 Apr90 111.5 106.810 Mar 90 116.2 114.6 14 Apr 90 113.0 111.5
11 Mar90 117.8 116.2 15 Apr90 114.6 111.512 Mar 90 130.3 113.0 16 Apr 90 114.6 111.513 Mar90 130.3 113.0 17 Apr90 111.5 109.914 Mar90 111.5 109.9 18 Apr90 113.0 108.315 Mar 90 122.5 119.3 19 Apr 90 109.9 108.3
16 Mar 90 124.0 122.5 20 Apr 90 111.5 109.917 Mar90 124.0 119.3 21 Apr90 113.0 109.918 Mar 90 124.0 120.9 22 Apr 90 114.6 111.519 Mar 90 125.6 122.5 23 Apr 90 116.2 113.020 Mar 90 125.6 113.0 24 Apr90 116.2 113.0
21 Mar 90 125.6 122.5 25 Apr 90 113.0 108.322 Mar 90 127.2 122.5 26 Apr 90 113.0 108.323 Mar90 122.5 120.9 27 Apr90 117.8 113.024 Mar 90 127.2 119.3 28 Apr 90 119.3 116.225 Mar90 125.6 120.9 29 Apr90 119.3 116.2
26 Mar 90 124.0 113.0 30 Apr 90 116.2 111.527 Mar 90 127.2 127.2 1 May 90 117.8 113.028 Mar 90 127.2 125.6 2 May 90 113.0 113.029 Mar 90 127.2 125.6 3 May 90 114.6 108.330 Mar 90 141.3 125.6 4 May 90 116.2 105.2
76
NWC TP 7138
TABLE A-2 (Contd.)
Date igh Lw Date High Low
5 May 90 117.8 106.8 30 May 90 141.3 070.76 May 90 120.9 116.2 31 May 90 139.7 069.17 May 90 124.0 114.6 1 Jun 90 138.2 069.18 May 90 128.7 108.3 2 Jun 90 139.7 081.69 May 90 125.6 113.0 3 Jun 90 135.0 081.6
10 May 90 133.5 106.8 4 Jun 90 136.6 081.611 May 90 150.7 108.3 5 Jun 90 135.0 076.912 May 90 155.4 108.3 6 Jun 90 135.0 078.513 May 90 150.7 109.9 7 Jun 90 133.5 078.514 May 90 157.0 109.9 8 Jun 90 133.5 076.9
15 May 90 157.0 100.5 9 Jun 90 133.5 073.816 May 90 157.0 097.3 10 Jun 90 133.5 072.217 May 90 157.0 109.9 11 Jun 90 133.5 072.218 May 90 157.0 113.0 12 Jun 90 131.9 072.219 May 90 157.0 117.8 13 Jun 90 131.9 072.2
20 May 90 157.0 114.6 14 Jun 90 128.7 072.221 May 90 157.0 113.0 15 Jun 90 133.5 070.722 May 90 157.0 114.6 16 Jun 90 130.3 070.723 May 90 144.4 086.4 17 Jun 90 131.9 070.724 May 90 128.7 067.5
25 May 90 122.5 065.926 May 90 128.7 067.527 May 90 133.5 064.428 May 90 124.0 065.929 May 90 127.2 058.1
77

NWC TP 7138
TABLE A-3. 4P-2 (Two-Inch Steam Well) Flow Data, lb/h.(18 June 1990 through 28 September 1990)
Date Time High Low Date Time High Lo w
18 Jun 90 0040 319.1 189.0 19 Jun 90 1525 382.1 268.70103 314.9 189.0 1620 377.9 268.70157 314.9 180.6 1730 386.3 272.90230 314.9 184.8 1840 386.3 268.70300 310.7 189.0 2020 377.9 268.7
0330 310.7 189.0 2120 386.3 264.50402 314.9 189.0 221 ; 382.1 264.50450 306.5 193.2 2340 382.1 264.50520 310.7 193.2 20 Jun 90 0100 377.9 264.50630 314.9 193.2 0205 382.1 264.5
0700 314.9 197.4 0340 386.3 264.50740 323.3 197.4 0500 394.7 264.50815 323.3 197.4 0645 377.9 264.50900 319.1 201.6 0830 390.5 264.51155 331.7 201.6 1000 386.3 264.5
1330 356.9 214.1 1100 377.9 264.51458 361.1 222.5 1230 394.7 264.51602 365.3 226.7 1320 394.7 264.51710 361.1 235.1 1400 386.3 264.51855 361.1 239.3 1615 377.9 268.7
1900 361.1 239.3 1705 377.9 272.92115 361.1 235.1 1855 386.3 272.92225 369.5 235.1 2020 369.5 272.92320 352.7 235.1 2200 369.5 272.9
19 Jun 90 0045 356.9 235.1 2325 386.3 272.9
0200 365.3 239.3 21 Jun 90 0010 394.7 268.70315 369.5 243.5 0100 382.1 260.30455 369.5 239.3 0130 386.3 256.10602 377.9 243.5 0220 382.1 251.90855 373.7 243.5 0305 356.9 247.7
0905 386.3 247.7 0455 365.3 247.71025 382.1 239.3 0550 361.1 243.51200 373.7 251.9 0620 361.1 243.51302 382.1 260.3 1715 361.1 243.51410 369.5 264.5 105 365.3 239.3
78

NWC TP 7138
TABLE A-3 (Contd.)
Date Time Hi !R Low Date Time High Low
21 jun 90 0900 365.3 239.3 22 Jun 90 1000 327.5 197.40950 356.9 235.1 1030 33P 9 193.21010 352.7 235.1 1105 323.3 189.01100 356.9 239.3 1155 327.5 189.01155 344.3 239.3 1225 331.7 184.8
1240 344.3 239.3 1300 323.3 184.81325 352.7 239.3 1340 327.5 184.81405 344.3 239.3 1405 331.7 184.81455 352.7 239.3 1450 314.9 184.81525 352.7 235.1 1530 319.1 184.8
1605 348.5 235.1 1605 319.1 184.81650 348.5 235.1 1650 323.3 184.81710 344.3 230.9 1710 310.7 184.81755 344.3 230.9 1755 331.7 184.81815 340.1 230.9 1830 3?7.5 184.8
1855 335.9 226.7 1900 323.3 184.81930 331.7 226.7 1955 323.3 180.62005 335.9 226.7 2030 314.9 180.62055 335.9 222.5 2100 323.3 180.62110 335.9 222.5 2150 319.1 180.6
2155 335.9 218.3 2155 327.5 184.82230 331.7 218.3 2220 327.5 184.82300 331.7 210.0 2300 323.3 184.82330 344.3 243.5 2350 310.7 184.8
22 Jun 90 0010 340.1 239.3 23 Jun 90 0035 331.7 189.0
0050 344.3 239.3 0105 319.1 189.00125 331.7 230.9 0150 323.3 189.00200 331.7 226.7 0220 323.3 189.00230 327.5 222.5 0305 331.7 210.00300 327.5 222.5 0355 327.5 210.0
0335 323.3 218.3 0420 314.9 201.60415 323.3 210.0 0500 323.3 201.60455 319.1 205.8 0555 331.7 201.60530 310.7 201.6 0635 327.5 189.00600 327.5 197.4 0730 323.3 189.0
0630 319.1 201.6 0800 323.3 184.80710 327.5 201.6 0850 314.9 184.80800 331.7 201.6 0920 302.3 184.80840 335.9 197.4 1000 302.3 180.60900 327.5 197.4 1100 319.1 197.4
79
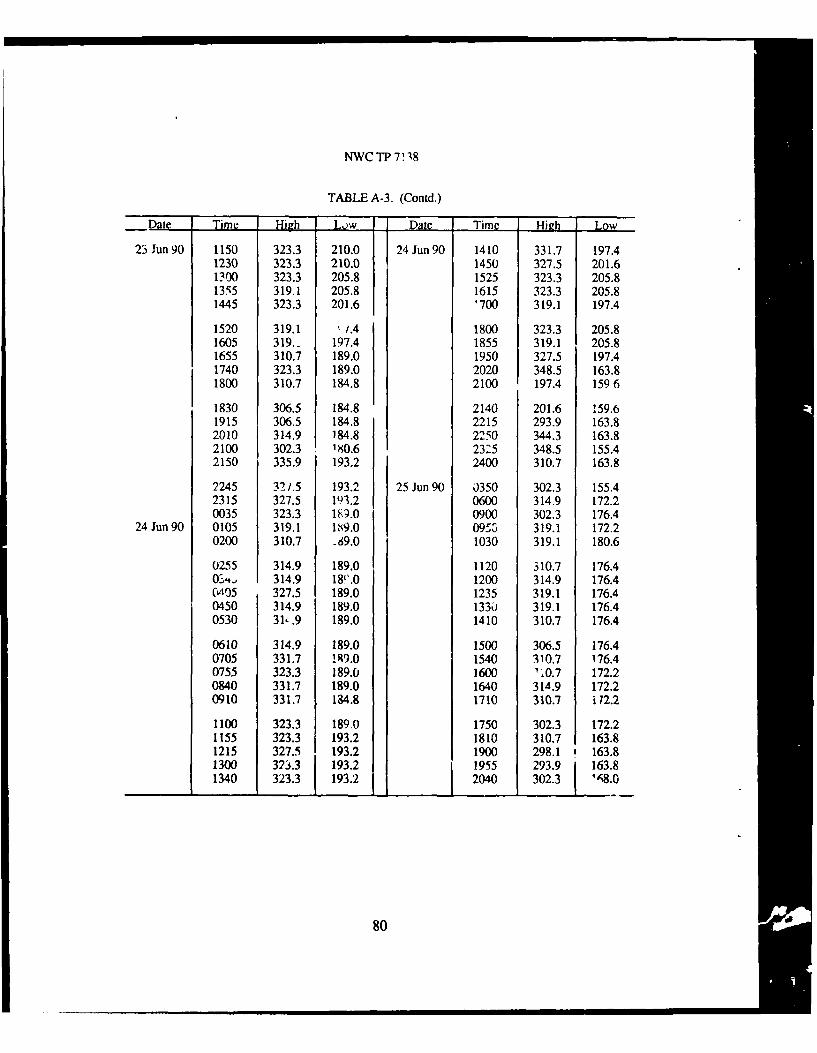
NWC TP 7!38
TABLE A-3. (Contd.)
Date Time High Low Date Time High Low
23 Jun 90 1150 323.3 210.0 24 Jun 90 1410 331.7 197.41230 323.3 210.0 1450 327.5 201.61300 323.3 205.8 1525 323.3 205.81355 319.1 205.8 1615 323.3 205.81445 323.3 201.6 '700 319.1 197.4
1520 319.1 /.4 1800 323.3 205.81605 319.. 197.4 1855 319.1 205.81655 310.7 189.0 1950 327.5 197.41740 323.3 189.0 2020 348.5 163.81800 310.7 184.8 2100 197.4 1596
1830 306.5 184.8 2140 201.6 159.61915 306.5 184.8 2215 293.9 163.82010 314.9 184.8 2250 344.3 163.82100 302.3 1 0.6 23z5 348.5 155.42150 335.9 193.2 2400 310.7 163.8
2245 32/.5 193.2 25 Jun 90 0350 302.3 155.42315 327.5 193.2 0600 314.9 172.20035 323.3 19.0 0900 302.3 176.4
24 Jun 90 0105 319.1 1 9.0 0955 319.1 172.20200 310.7 .69.0 1030 319.1 180.6
0255 314.9 189.0 1120 310.7 176.403,-,, 314.9 18".0 1200 314.9 176.4C9405 327.5 189.0 1235 319.1 176.40450 314.9 189.0 1330 319.1 176.40530 31i.9 189.0 1410 310.7 176.4
0610 314.9 189.0 1500 306.5 176.40705 331.7 !99.0 1540 310.7 176.40755 323.3 189.0 1600 ",0.7 172.20840 331.7 189.0 1640 314.9 172.20910 331.7 184.8 1710 310.7 i 12.2
1100 323.3 189.0 1750 302.3 172.21155 323.3 193.2 1810 310.7 163.81215 327.5 193.2 1900 298.1 0 163.81300 323.3 193.2 1955 293.9 163.81340 323.3 193.2 2040 302.3 '68.0
80

NWC TP 7138
TABLE A-3. (Contd.)
Date Time High Low Date Time High Low
25 Jun 90 2105 302.3 168.0 26 Jun 90 2205 306.5 168.02155 302.3 168.0 2255 302.3 172.22225 222.5 168.0 2355 302.3 168.02300 239.3 168.0 27 Jun 90 0100 302.3 168.0
26 Jun 90 0005 306.5 168.0 0155 298.1 168.0
0055 306.5 172.2 0200 302.3 168.00130 306.5 168.0 0220 293.9 168.00200 310.7 168.0 0240 302.3 168.00255 314.9 172.2 0320 302.3 168.00330 310.7 168.0 0400 306.5 172.2
0410 302.3 168.0 0450 302.3 176.40510 302.3 168.0 0525 306.5 176.40600 314.9 163.8 0600 306.5 176.4C6i50 314.9 168.0 0655 302.3 176.A0720 310.7 163.8 0750 310.7 176.4
0755 302.3 155.4 0810 31j. f; 180.60840 310.7 163.8 0830 298.1 184.80910 306.5 163.8 0920 298.1 184.81000 314.9 163.8 1000 306.5 184.81040 176.4 172.2 1030 302.3 180.6
1120 180.6 176.4 1105 302.3 180.61200 314.9 180.6 1140 205.8 180.61250 314.9 184.8 1210 306.5 180.61335 319.1 176.4 1235 310.7 176.41410 306.5 180.6 1310 306.5 176.4
1455 310.7 176.4 1400 306.5 172.21520 319.1 180.6 1430 302.3 172.21630 302.3 172.2 1415 298.1 168.01705 310.7 168.0 1500 302.3 168.01755 302.3 172.2 1540 306.5 168.0
1920 3107 172.2 1730 3j6.5 168.02000 310.7 168.0 1820 289.7 172.22050 306.5 168.0 1920 298.1 172.22115 302.3 172.2 2000 293.9 172.2
81
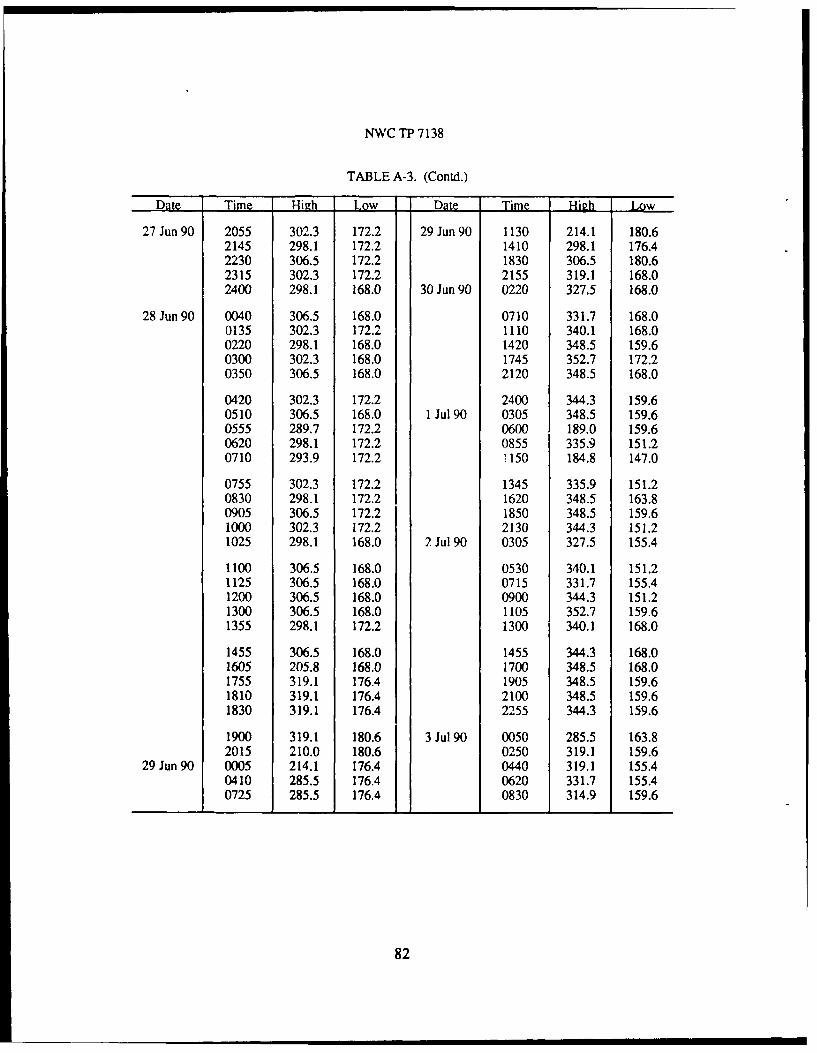
NWC TP 7138
TABLE A-3. (Contd.)
Dat Time High Low Date Time High Low
27 Jun 90 2055 302.3 172.2 29 Jun 90 1130 214.1 180.62145 298.1 172.2 1410 298.1 176.42230 306.5 172.2 1830 306.5 180.62315 302.3 172.2 2155 319.1 168.02400 298.1 168.0 30 Jun 90 0220 327.5 168.0
28 Jun 90 0040 306.5 168.0 0710 331.7 168.00135 302.3 172.2 1110 340.1 168.00220 298.1 168.0 1420 348.5 159.60300 302.3 168.0 1745 352.7 172.20350 306.5 168.0 2120 348.5 168.0
0420 302.3 172.2 2400 344.3 159.60510 306.5 168.0 1 Jul 90 0305 348.5 159.60555 289.7 172.2 0600 189.0 159.60620 298.1 172.2 0855 335.9 151.20710 293.9 172.2 150 184.8 147.0
0755 302.3 172.2 1345 335.9 151.20830 298.1 172.2 1620 348.5 163.80905 306.5 172.2 1850 348.5 159.61000 302.3 172.2 2130 344.3 151.21025 298.1 168.0 2 Jul 90 0305 327.5 155.4
1100 306.5 168.0 0530 340.1 151.21125 306.5 168.0 0715 331.7 155.41200 306.5 168.0 0900 344.3 151.21300 306.5 168.0 1105 352.7 159.61355 298.1 172.2 1300 340.1 168.0
1455 306.5 168.0 1455 344.3 168.01605 205.8 168.0 1700 348.5 168.01755 319.1 176.4 1905 348.5 159.61810 319.1 176.4 2100 348.5 159.61830 319.1 176.4 2255 344.3 159.6
1900 319.1 180.6 3 Jul90 0050 285.5 163.82015 210.0 180.6 0250 319.1 159.6
29 Jun 90 0005 214.1 176.4 0440 319.1 155.40410 285.5 176.4 0620 331.7 155.40725 285.5 176.4 0830 314.9 159.6
82
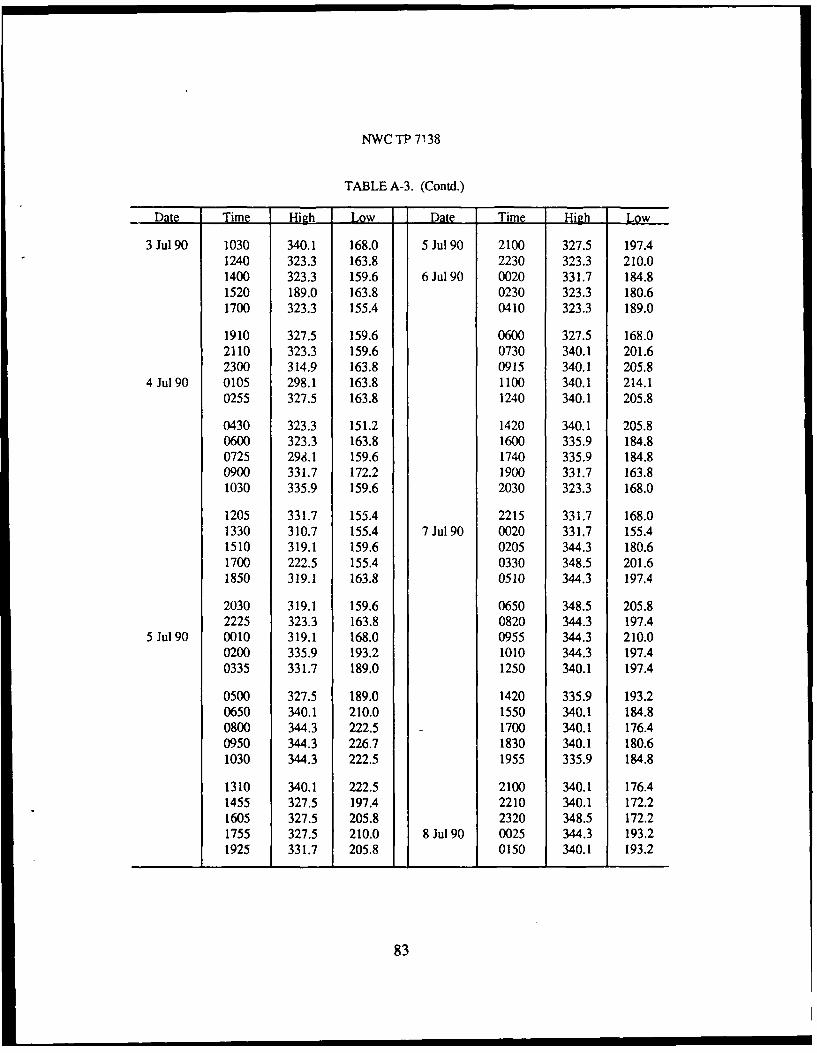
NWCTP 7138
TABLE A-3. (Contd.)
Date Time High Low Date Time High Low
3 Jul90 1030 340.1 168.0 5 Jul 90 2100 327.5 197.41240 323.3 163.8 2230 323.3 210.01400 323.3 159.6 6 Jul 90 0020 331.7 184.81520 189.0 163.8 0230 323.3 180.61700 323.3 155.4 0410 323.3 189.0
1910 327.5 159.6 0600 327.5 168.02110 323.3 159.6 0730 340.1 201.62300 314.9 163.8 0915 340.1 205.8
4 Jul 90 0105 298.1 163.8 1100 340.1 214.10255 327.5 163.8 1240 340.1 205.8
0430 323.3 151.2 1420 340.1 205.80600 323.3 163.8 1600 335.9 184.80725 298.1 159.6 1740 335.9 184.80900 331.7 172.2 1900 331.7 163.81030 335.9 159.6 2030 323.3 168.0
1205 331.7 155.4 2215 331.7 168.01330 310.7 155.4 7 Jul 90 0020 331.7 155.41510 319.1 159.6 0205 344.3 180.61700 222.5 155.4 0330 348.5 201.61850 319.1 163.8 0510 344.3 197.4
2030 319.1 159.6 0650 348.5 205.82225 323.3 163.8 0820 344.3 197.4
5 Jul 90 0010 319.1 168.0 0955 344.3 210.00200 335.9 193.2 1010 344.3 197.40335 331.7 189.0 1250 340.1 197.4
0500 327.5 189.0 1420 335.9 193.20650 340.1 210.0 1550 340.1 184.80800 344.3 222.5 1700 340.1 176.40950 344.3 226.7 1830 340.1 180.61030 344.3 222.5 1955 335.9 184.8
1310 340.1 222.5 2100 340.1 176.41455 327.5 197.4 2210 340.1 172.21605 327.5 205.8 2320 348.5 172.21755 327.5 210.0 8 Jul 90 0025 344.3 193.21925 331.7 205.8 0150 340.1 193.2
83
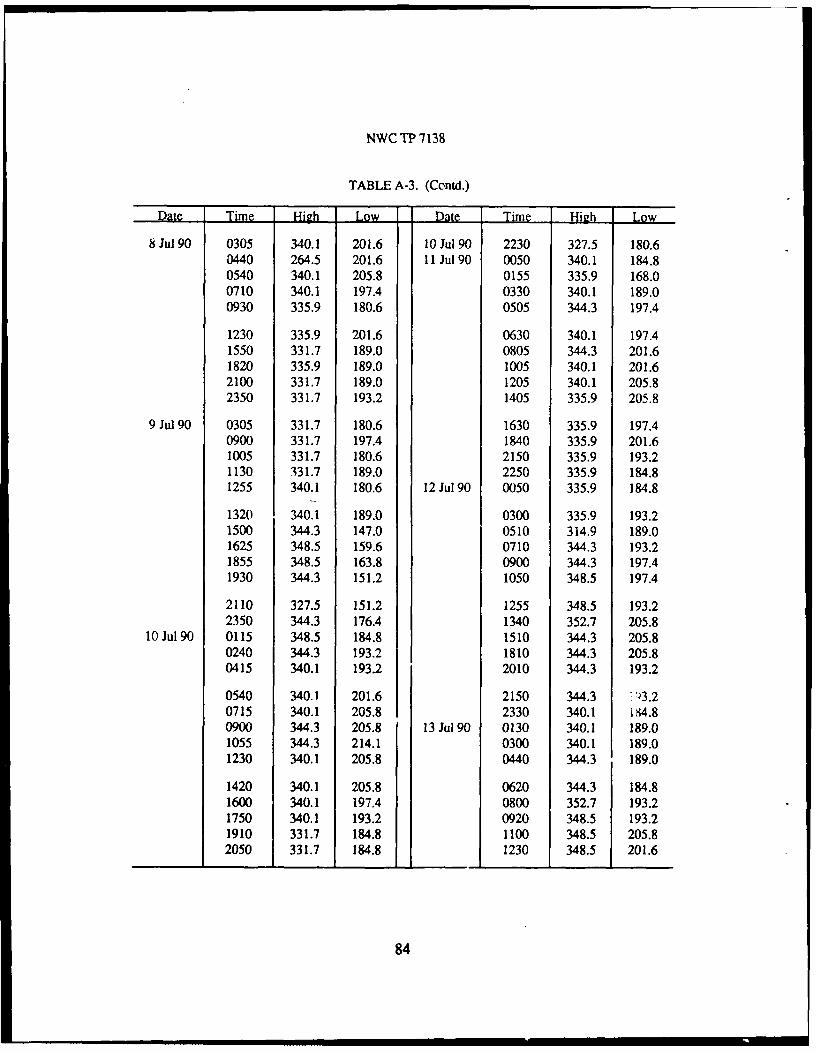
NWC TP 7138
TABLE A-3. (Contd.)
Date Time High Low Date Time Hi h Low
8 Jul 90 0305 340.1 201.6 10 Jul 90 2230 327.5 180.60440 264.5 201.6 11 Jul 90 0050 340.1 184.80540 340.1 205.8 0155 335.9 168.00710 340.1 197.4 0330 340.1 189.00930 335.9 180.6 0505 344.3 197.4
1230 335.9 201.6 0630 340.1 197.41550 331.7 189.0 0805 344.3 201.61820 335.9 189.0 1005 340.1 201.62100 331.7 189.0 1205 340.1 205.82350 331.7 193.2 1405 335.9 205.8
9 Jul90 0305 331.7 180.6 1630 335.9 197.40900 331.7 197.4 1840 335.9 201.61005 331.7 180.6 2150 335.9 193.21130 331.7 189.0 2250 335.9 184.81255 340.1 180.6 12 Jul 90 0050 335.9 184.8
1320 340.1 189.0 0300 335.9 193.21500 344.3 147.0 0510 314.9 189.01625 348.5 159.6 0710 344.3 193.21855 348.5 163.8 0900 344.3 197.41930 344.3 151.2 1050 348.5 197.4
2110 327.5 151.2 1255 348.5 193.22350 344.3 176.4 1340 352.7 205.8
10 Jul 90 0115 348.5 184.8 1510 344.3 205.80240 344.3 193.2 1810 344.3 205.80415 340.1 193.2 2010 344.3 193.2
0540 340.1 201.6 2150 344.3 :'-)3.20715 340.1 205.8 2330 340.1 i,$4.80900 344.3 205.8 13 Jul 90 0130 340.1 189.01055 344.3 214.1 0300 340.1 189.01230 340.1 205.8 0440 344.3 189.0
1420 340.1 205.8 0620 344.3 184.81600 340.1 197.4 0800 352.7 193.21750 340.1 193.2 0920 348.5 193.21910 331.7 184.8 1100 348.5 205.82050 331.7 184.8 1230 348.5 201.6
84
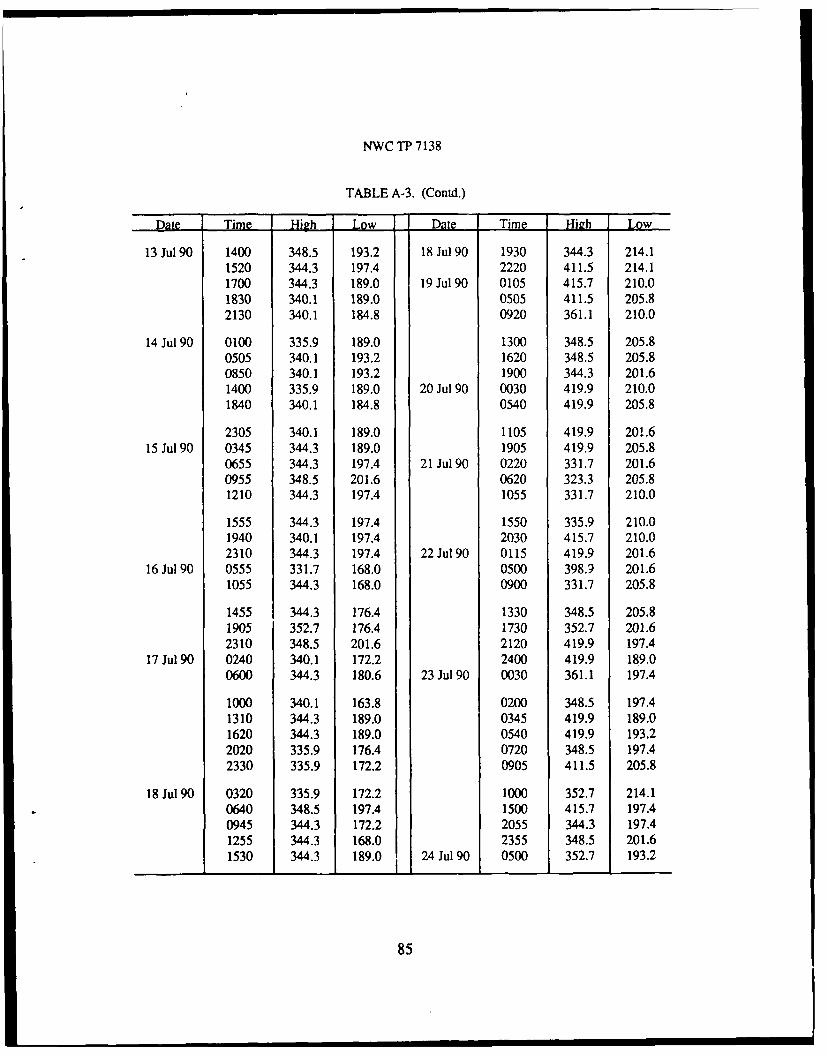
NWC TP 7138
TABLE A-3. (Contd.)
Date Time High Low D T High Low
13 Jul 90 1400 348.5 193.2 18 Jul 90 1930 344.3 214.11520 344.3 197.4 2220 411.5 214.11700 344.3 189.0 19 Jul 90 0105 415.7 210.01830 340.1 189.0 0505 411.5 205.82130 340.1 184.8 0920 361.1 210.0
14 Jul 90 0100 335.9 189.0 1300 348.5 205.80505 340.1 193.2 1620 348.5 205.80850 340.1 193.2 1900 344.3 201.61400 335.9 189.0 20 Jul 90 0030 419.9 210.01840 340.1 184.8 0540 419.9 205.8
2305 340.1 189.0 1105 419.9 201.615 Jul 90 0345 344.3 189.0 1905 419.9 205.8
0655 344.3 197.4 21 Jul 90 0220 331.7 201.60955 348.5 201.6 0620 323.3 205.81210 344.3 197.4 1055 331.7 210.0
1555 344.3 197.4 1550 335.9 210.01940 340.1 197.4 2030 415.7 210.02310 344.3 197.4 22 Jul90 0115 419.9 201.6
16 Jul 90 0555 331.7 168.0 0500 398.9 201.61055 344.3 168.0 0900 331.7 205.8
1455 344.3 176.4 1330 348.5 205.81905 352.7 176.4 1730 352.7 201.62310 348.5 201.6 2120 419.9 197.4
17 Jul 90 0240 340.1 172.2 2400 419.9 189.00600 344.3 180.6 23 Jul 90 0030 361.1 197.4
1000 340.1 163.8 0200 348.5 197.41310 344.3 189.0 0345 419.9 189.01620 344.3 189.0 0540 419.9 193.22020 335.9 176.4 0720 348.5 197.42330 335.9 172.2 0905 411.5 205.8
18 Jul 90 0320 335.9 172.2 1000 352.7 214.10640 348.5 197.4 1500 415.7 197.40945 344.3 172.2 2055 344.3 197.41255 344.3 168.0 2355 348.5 201.61530 344.3 189.0 24 Jul 90 0500 352.7 193.2
85
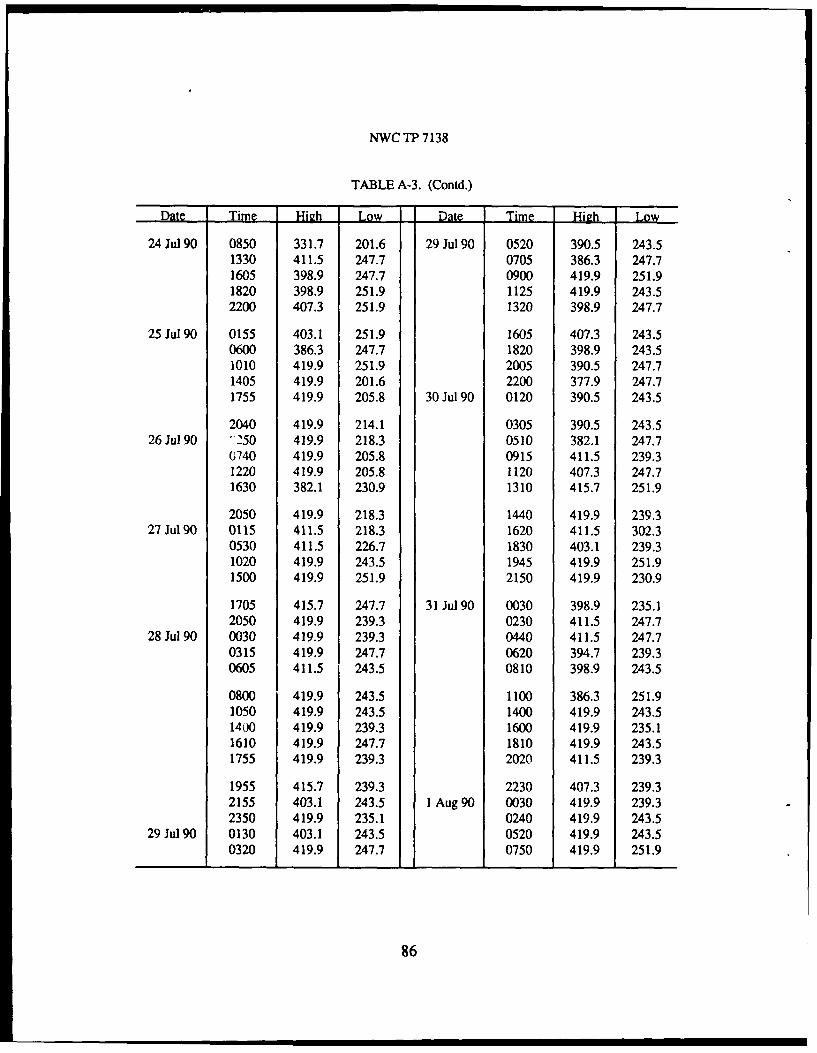
NWC TP 7138
TABLE A-3. (Contd.)
Date Time High Low Date Time High Low
24 Jul 90 0850 331.7 201.6 29 Jul 90 0520 390.5 243.51330 411.5 247.7 0705 386.3 247.71605 398.9 247.7 0900 419.9 251.91820 398.9 251.9 1125 419.9 243.52200 407.3 251.9 1320 398.9 247.7
25 Jul 90 0155 403.1 251.9 1605 407.3 243.50600 386.3 247.7 1820 398.9 243.51010 419.9 251.9 2005 390.5 247.71405 419.9 201.6 2200 377.9 247.71755 419.9 205.8 30 Jul 90 0120 390.5 243.5
2040 419.9 214.1 0305 390.5 243.526 Jul 90 '250 419.9 218.3 0510 382.1 247.7
0740 419.9 205.8 0915 411.5 239.31220 419.9 205.8 1120 407.3 247.71630 382.1 230.9 1310 415.7 251.9
2050 419.9 218.3 1440 419.9 239.327 Jul90 0115 411.5 218.3 1620 411.5 302.3
0530 411.5 226.7 1830 403.1 239.31020 419.9 243.5 1945 419.9 251.91500 419.9 251.9 2150 419.9 230.9
1705 415.7 247.7 31 Jul 90 0030 398.9 235.12050 419.9 239.3 0230 411.5 247.7
28 Jul 90 0030 419.9 239.3 0440 411.5 247.70315 419.9 247.7 0620 394.7 239.30605 411.5 243.5 0810 398.9 243.5
0800 419.9 243.5 1100 386.3 251.91050 419.9 243.5 1400 419.9 243.51400 419.9 239.3 1600 419.9 235.11610 419.9 247.7 1810 419.9 243.51755 419.9 239.3 2020 411.5 239.3
1955 415.7 239.3 2230 407.3 239.32155 403.1 243.5 1 Aug 90 0030 419.9 239.32350 419.9 235.1 0240 419.9 243.5
29 Jul90 0130 403.1 243.5 0520 419.9 243.50320 419.9 247.7 0750 419.9 251.9
86
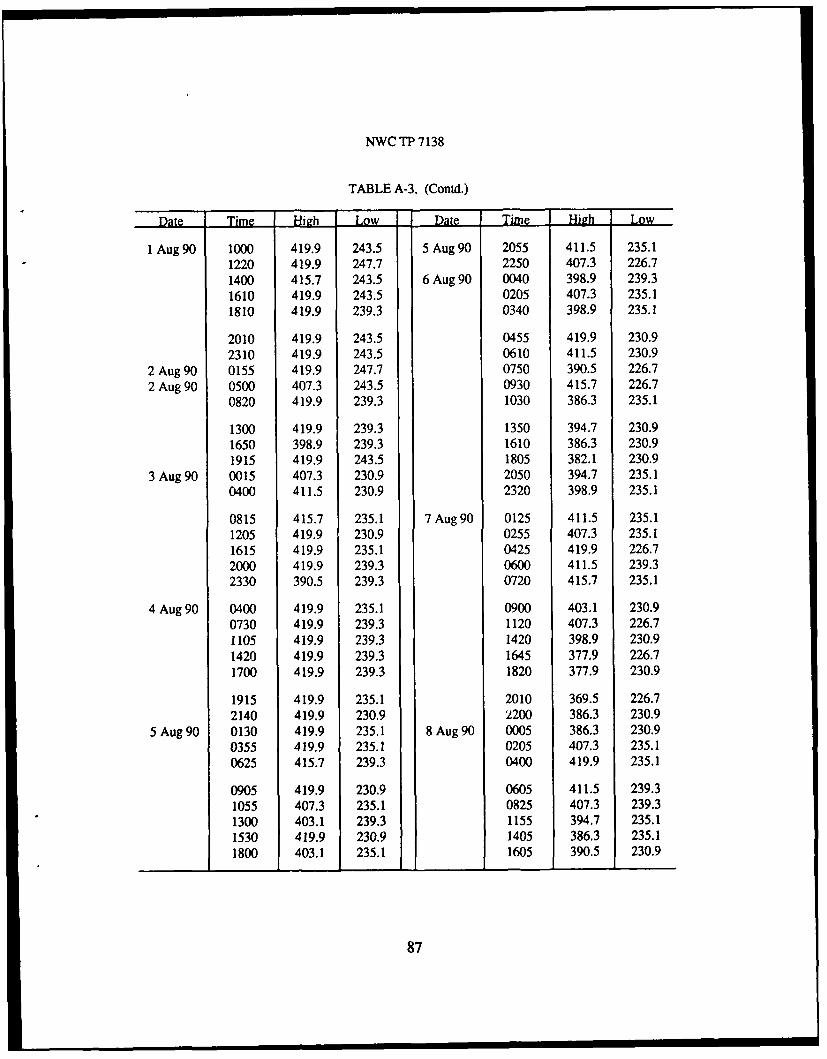
NWC TP 7138
TABLE A-3. (Contd.)
Date Time Hih Low Date Time High Low
1 Aug 90 1000 419.9 243.5 5 Aug 90 2055 411.5 235.11220 419.9 247.7 2250 407.3 226.71400 415.7 243.5 6 Aug 90 0040 398.9 239.31610 419.9 243.5 0205 407.3 235.11810 419.9 239.3 0340 398.9 235.1
2010 419.9 243.5 0455 419.9 230.92310 419.9 243.5 0610 411.5 230.9
2 Aug 90 0155 419.9 247.7 0750 390.5 226.72 Aug 90 0500 407.3 243.5 0930 415.7 226.7
0820 419.9 239.3 1030 386.3 235.1
1300 419.9 239.3 1350 394.7 230.91650 398.9 239.3 1610 386.3 230.91915 419.9 243.5 1805 382.1 230.9
3 Aug 90 0015 407.3 230.9 2050 394.7 235.10400 411.5 230.9 2320 398.9 235.1
0815 415.7 235.1 7 Aug 90 0125 411.5 235.11205 419.9 230.9 0255 407.3 235.11615 419.9 235.1 0425 419.9 226.72000 419.9 239.3 0600 411.5 239.32330 390.5 239.3 0720 415.7 235.1
4 Aug 90 0400 419.9 235.1 0900 403.1 230.90730 419.9 239.3 1120 407.3 226.71105 419.9 239.3 1420 398.9 230.9
1420 419.9 239.3 1645 377.9 226.71700 419.9 239.3 1820 377.9 230.9
1915 419.9 235.1 2010 369.5 226.72140 419.9 230.9 2200 386.3 230.9
5 Aug 90 0130 419.9 235.1 8 Aug 90 0005 386.3 230.90355 419.9 235.1 0205 407.3 235.10625 415.7 239.3 0400 419.9 235.1
0905 419.9 230.9 0605 411.5 239.31055 407.3 235.1 0825 407.3 239.31300 403.1 239.3 1155 394.7 235.11530 419.9 230.9 1405 386.3 235.11800 403.1 235.1 1605 390.5 230.9
87
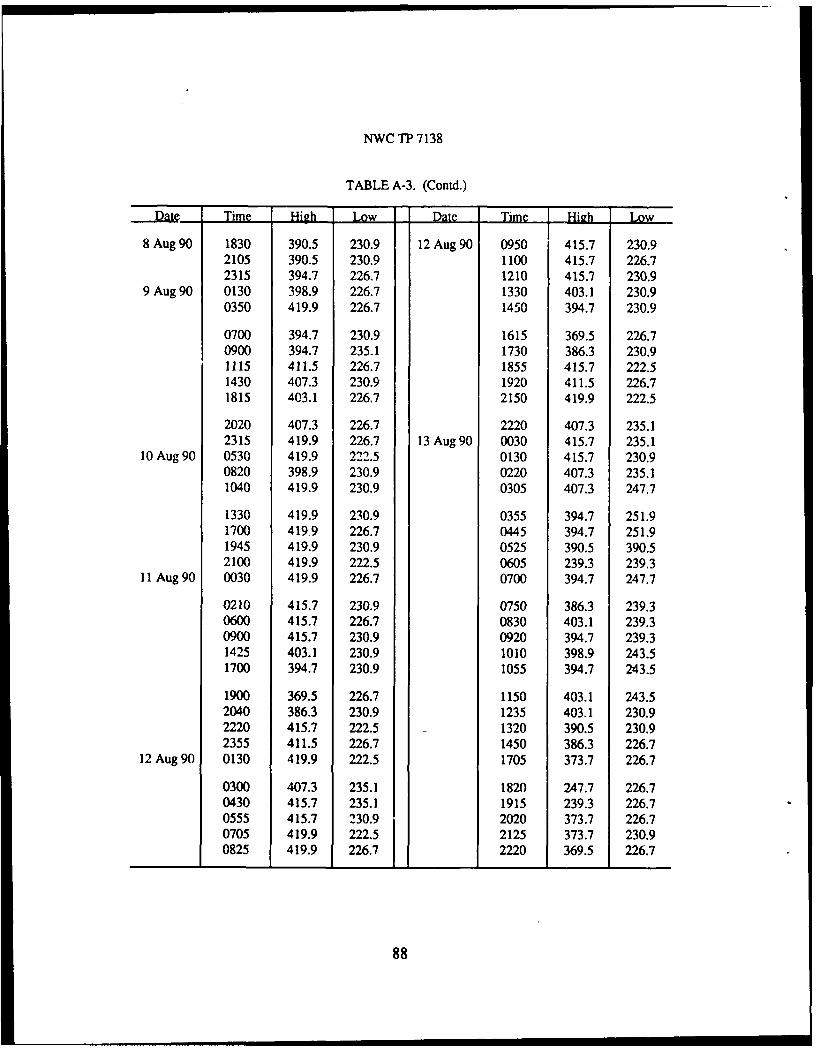
NWC TP 7138
TABLE A-3. (Contd.)
Date Time High Low Date Time High Low
8 Aug 90 1830 390.5 230.9 12 Aug 90 0950 415.7 230.92105 390.5 230.9 1100 415.7 226.72315 394.7 226.7 1210 415.7 230.9
9 Aug 90 0130 398.9 226.7 1330 403.1 230.90350 419.9 226.7 1450 394.7 230.9
0700 394.7 230.9 1615 369.5 226.70900 394.7 235.1 1730 386.3 230.91115 411.5 226.7 1855 415.7 222.51430 407.3 230.9 1920 411.5 226.71815 403.1 226.7 2150 419.9 222.5
2020 407.3 226.7 2220 407.3 235.12315 419.9 226.7 13 Aug 90 0030 415.7 235.1
10 Aug 90 0530 419.9 222.5 0130 415.7 230.90820 398.9 230.9 0220 407.3 235.11040 419.9 230.9 0305 407.3 247.7
1330 419.9 230.9 0355 394.7 251.91700 419.9 226.7 0445 394.7 251.91945 419.9 230.9 0525 390.5 390.52100 419.9 222.5 0605 239.3 239.3
11 Aug 90 0030 419.9 226.7 0700 394.7 247.7
0210 415.7 230.9 0750 386.3 239.30600 415.7 226.7 0830 403.1 239.30900 415.7 230.9 0920 394.7 239.31425 403.1 230.9 1010 398.9 243.51700 394.7 230.9 1055 394.7 243.5
1900 369.5 226.7 1150 403.1 243.52040 386.3 230.9 1235 403.1 230.92220 415.7 222.5 1320 390.5 230.92355 411.5 226.7 1450 386.3 226.7
12 Aug 90 0130 419.9 222.5 1705 373.7 226.7
0300 407.3 235.1 1820 247.7 226.70430 415.7 235.1 1915 239.3 226.70555 415.7 230.9 2020 373.7 226.70705 419.9 222.5 2125 373.7 230.90825 419.9 226.7 2220 369.5 226.7
88
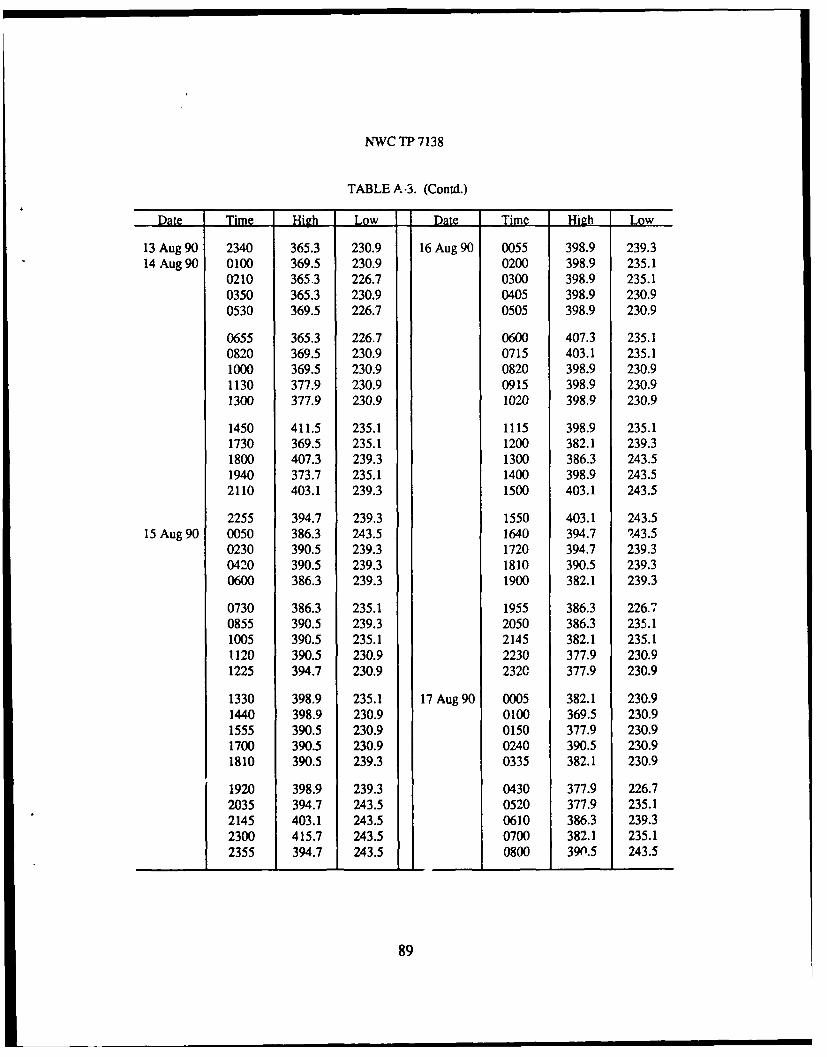
NWC TP7138
TABLE A-3. (Contd.)
Date Time High Low Date Time High Low
13 Aug 90 2340 365.3 230.9 16 Aug 90 0055 398.9 239.314 Aug 90 0100 369.5 230.9 0200 398.9 235.1
0210 365,3 226.7 0300 398.9 235.10350 365.3 230.9 0405 398.9 230.90530 369.5 226.7 0505 398.9 230.9
0655 365.3 226.7 0600 407.3 235.10820 369.5 230.9 0715 403.1 235.11000 369.5 230.9 0820 398.9 230.91130 377.9 230.9 0915 398.9 230.91300 377.9 230.9 1020 398.9 230.9
1450 411.5 235.1 1115 398.9 235.11730 369.5 235.1 1200 382.1 239.31800 407.3 239.3 1300 386.3 243.51940 373.7 235.1 1400 398.9 243.52110 403.1 239.3 1500 403.1 243.5
2255 394.7 239.3 1550 403.1 243.515 Aug 90 0050 386.3 243.5 1640 394.7 243.5
0230 390.5 239.3 1720 394.7 239.30420 390.5 239.3 1810 390.5 239.30600 386.3 239.3 1900 382.1 239.3
0730 386.3 235.1 1955 386.3 226.70855 390.5 239.3 2050 386.3 235.11005 390.5 235.1 2145 382.1 235.11120 390.5 230.9 2230 377.9 230.91225 394.7 230.9 232C 377.9 230.9
1330 398.9 235.1 17 Aug 90 0005 382.1 230.91440 398.9 230.9 0100 369.5 230.91555 390.5 230.9 0150 377.9 230.91700 390.5 230.9 0240 390.5 230.91810 390.5 239.3 0335 382.1 230.9
1920 398.9 239.3 0430 377.9 226.72035 394.7 243.5 0520 377.9 235.12145 403.1 243.5 0610 386.3 239.32300 415.7 243.5 0700 382.1 235.12355 394.7 243.5 0800 390.5 243.5
89
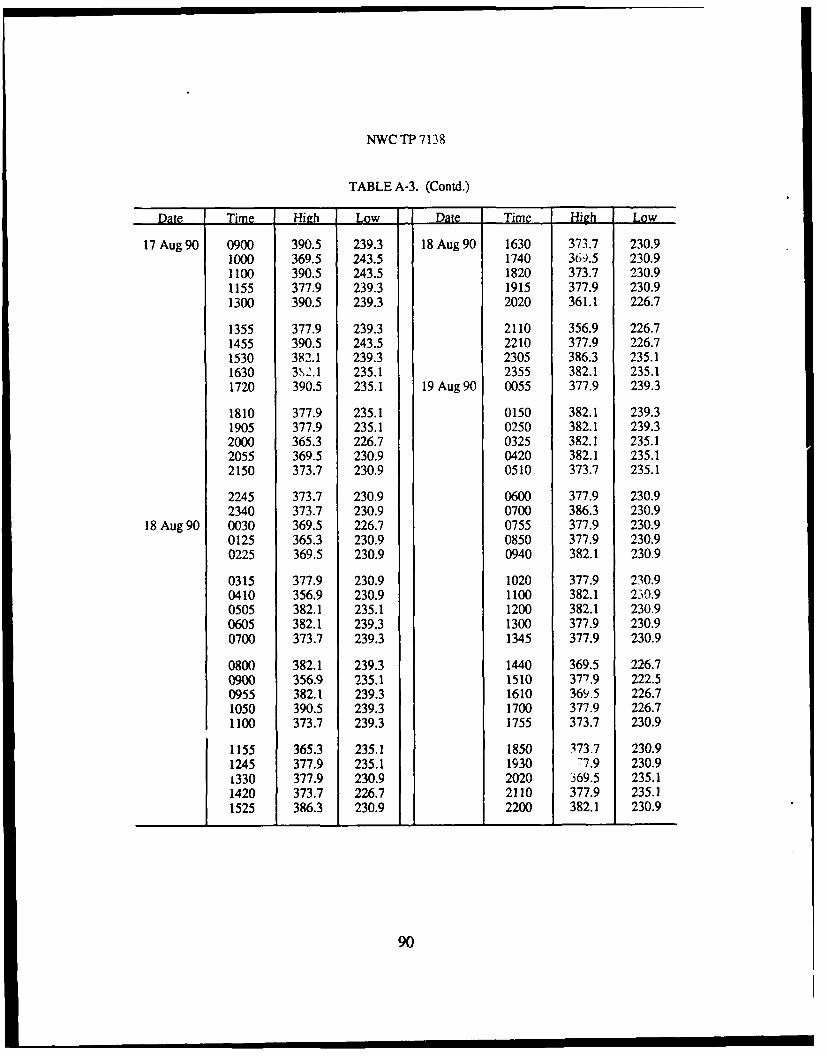
NWC TP 7138
TABLE A-3. (Contd.)
Date Time High Low Date Time High L oLw
17 Aug 90 0900 390.5 239.3 18 Aug 90 1630 373.7 230.91000 369.5 243.5 1740 36-).5 230.91100 390.5 243.5 1820 373.7 230.91155 377.9 239.3 1915 377.9 230.91300 390.5 239.3 2020 361.1 226.7
1355 377.9 239.3 2110 356.9 226.71455 390.5 243.5 2210 377.9 226.71530 382.1 239.3 2305 386.3 235.11630 3,S,2.1 235.1 2355 382.1 235.11720 390.5 235.1 19 Aug 90 0055 377.9 239.3
1810 377.9 235.1 0150 382.1 239.31905 377.9 235.1 0250 382.1 239.32000 365.3 226.7 0325 382.1 235.12055 369.5 230.9 0420 382.1 235.12150 373.7 230.9 0510 373.7 235.1
2245 373.7 230.9 0600 377.9 230.92340 373.7 230.9 0700 386.3 230.9
18 Aug 90 0030 369.5 226.7 0755 377.9 230.90125 365.3 230.9 0850 377.9 230.90225 369.5 230.9 0940 382.1 230.9
0315 377.9 230.9 1020 377.9 230.90410 356.9 230.9 1100 382.1 230.90505 382.1 235.1 1200 382.1 230.90605 382.1 239.3 1300 377.9 230.90700 373.7 239.3 1345 377.9 230.9
0800 382.1 239.3 1440 369.5 226.70900 356.9 235.1 1510 377.9 222.50955 382.1 239.3 1610 369.5 226.71050 390.5 239.3 1700 377.9 226.71100 373.7 239.3 1755 373.7 230.9
1155 365.3 235.1 1850 373.7 230.91245 377.9 235.1 1930 77.9 230.9i330 377.9 230.9 2020 369.5 235.11420 373.7 226.7 2110 377.9 235.11525 386.3 230.9 2200 382.1 230.9
90
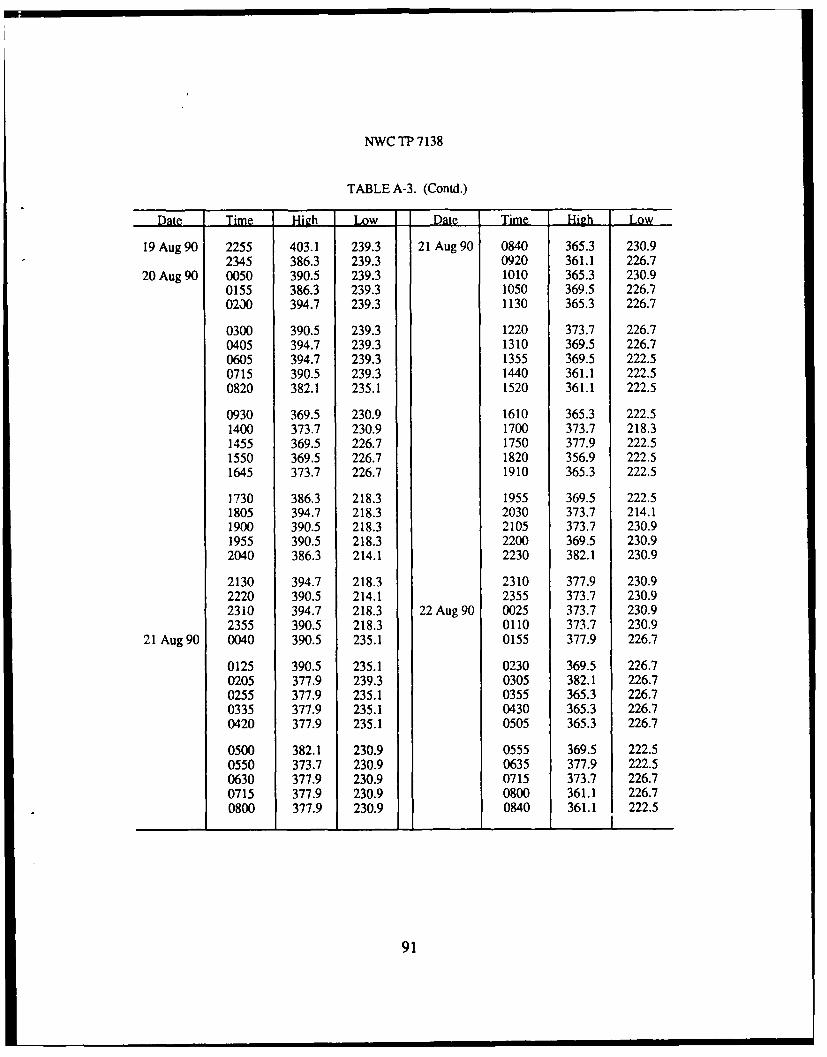
NWC TP 7138
TABLE A-3. (Contd.)
Date Time High Low Date Time High Low
19 Aug 90 2255 403.1 239.3 21 Aug 90 0840 365.3 230.92345 386.3 239.3 0920 361.1 226.7
20 Aug 90 0050 390.5 239.3 1010 365.3 230.90155 386.3 239.3 1050 369.5 226.70230 394.7 239.3 1130 365.3 226.7
0300 390.5 239.3 1220 373.7 226.70405 394.7 239.3 1310 369.5 226.70605 394.7 239.3 1355 369.5 222.50715 390.5 239.3 1440 361.1 222.50820 382.1 235.1 1520 361.1 222.5
0930 369.5 230.9 1610 365.3 222.51400 373.7 230.9 1700 373.7 218.31455 369.5 226.7 1750 377.9 222.51550 369.5 226.7 1820 356.9 222.51645 373.7 226.7 1910 365.3 222.5
1730 386.3 218.3 1955 369.5 222.51805 394.7 218.3 2030 373.7 214.11900 390.5 218.3 2105 373.7 230.91955 390.5 218.3 2200 369.5 230.92040 386.3 214.1 2230 382.1 230.9
2130 394.7 218.3 2310 377.9 230.92220 390.5 214.1 2355 373.7 230.92310 394.7 218.3 22 Aug 90 0025 373.7 230.92355 390.5 218.3 0110 373.7 230.9
21 Aug 90 0040 390.5 235.1 0155 377.9 226.7
0125 390.5 235.1 0230 369.5 226.70205 377.9 239.3 0305 382.1 226.70255 377.9 235.1 0355 365.3 226.70335 377.9 235.1 0430 365.3 226.70420 377.9 235.1 0505 365.3 226.7
0500 382.1 230.9 0555 369.5 222.50550 373.7 230.9 0635 377.9 222.50630 377.9 230.9 0715 373.7 226.70715 377.9 230.9 0800 361.1 226.70800 377.9 230.9 0840 361.1 222.5
91
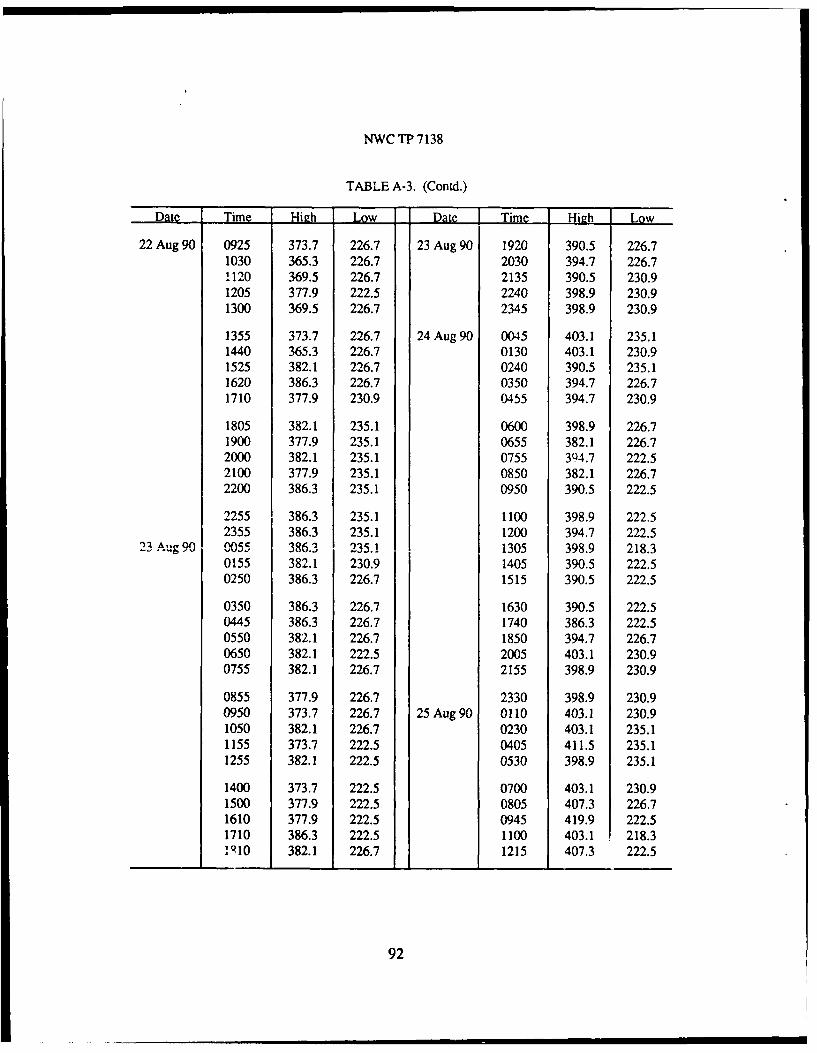
NWC TP 7138
TABLE A-3. (Contd.)
Date Time Hih Low Date Time High Low
22 Aug 90 0925 373.7 226.7 23 Aug 90 1920 390.5 226.71030 365.3 226.7 2030 394.7 226.71120 369.5 226.7 2135 390.5 230.91205 377.9 222.5 2240 398.9 230.91300 369.5 226.7 2345 398.9 230.9
1355 373.7 226.7 24 Aug 90 0045 403.1 235.11440 365.3 226.7 0130 403.1 230.91525 382.1 226.7 0240 390.5 235.11620 386.3 226.7 0350 394.7 226.71710 377.9 230.9 0455 394.7 230.9
1805 382.1 235.1 0600 398.9 226.71900 377.9 235.1 0655 382.1 226.72000 382.1 235.1 0755 394.7 222.52100 377.9 235.1 0850 382.1 226.72200 386.3 235.1 0950 390.5 222.5
2255 386.3 235.1 1100 398.9 222.52355 386.3 235.1 1200 394.7 222.5
23 Aug 90 0055 386.3 235.1 1305 398.9 218.30155 382.1 230.9 1405 390.5 222.50250 386.3 226.7 1515 390.5 222.5
0350 386.3 226.7 1630 390.5 222.50445 386.3 226.7 1740 386.3 222.50550 382.1 226.7 1850 394.7 226.70650 382.1 222.5 2005 403.1 230.90755 382.1 226.7 2155 398.9 230.9
0855 377.9 226.7 2330 398.9 230.90950 373.7 226.7 25 Aug 90 0110 403.1 230.91050 382.1 226.7 0230 403.1 235.11155 373.7 222.5 0405 411.5 235.11255 382.1 222.5 0530 398.9 235.1
1400 373.7 222.5 0700 403.1 230.91500 377.9 222.5 0805 407.3 226.71610 377.9 222.5 0945 419.9 222.51710 386.3 222.5 1100 403.1 218.3PIO 382.1 226.7 1215 407.3 222.5
92
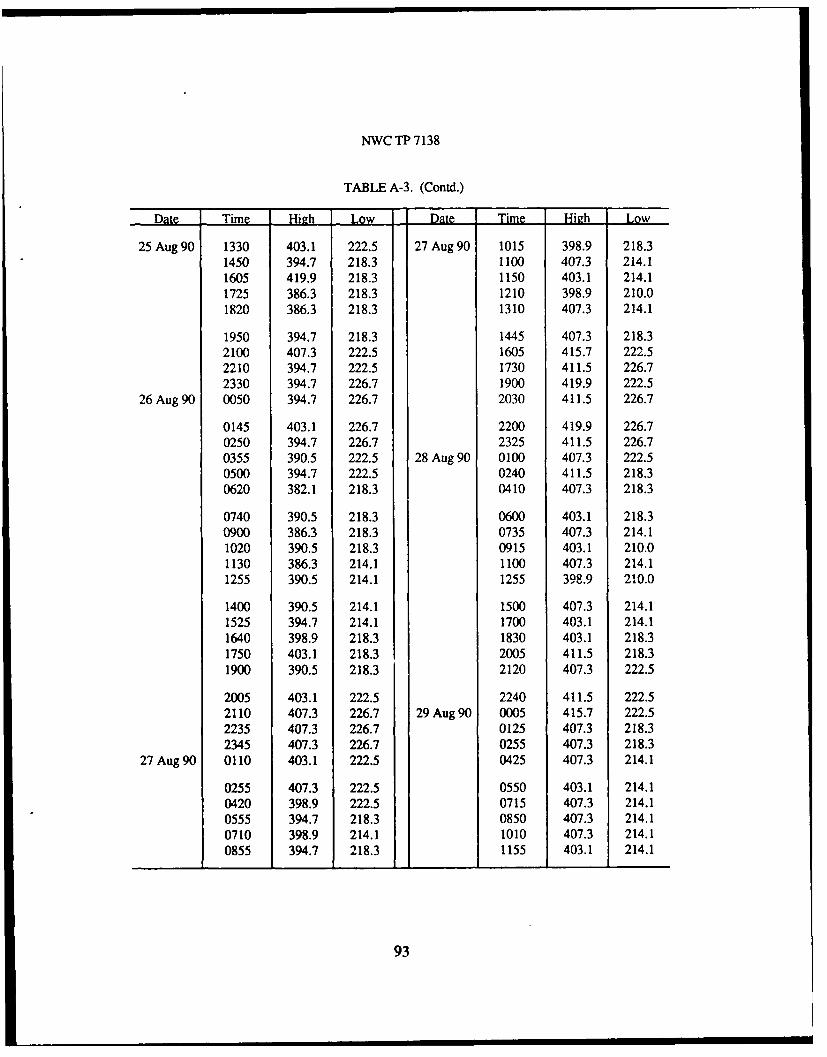
NWC TP 7138
TABLE A-3. (Contd.)
Date Time Hiah Low Date Time High Low
25 Aug 90 1330 403.1 222.5 27 Aug 90 1015 398.9 218.31450 394.7 218.3 1100 407.3 214.11605 419.9 218.3 1150 403.1 214.11725 386.3 218.3 1210 398.9 210.01820 386.3 218.3 1310 407.3 214.1
1950 394.7 218.3 1445 407.3 218.32100 407.3 222.5 1605 415.7 222.52210 394.7 222.5 1730 411.5 226.72330 394.7 226.7 1900 419.9 222.5
26 Aug 90 0050 394.7 226.7 2030 411.5 226.7
0145 403.1 226.7 2200 419.9 226.70250 394.7 226.7 2325 411.5 226.70355 390.5 222.5 28 Aug 90 0100 407.3 222.50500 394.7 222.5 0240 411.5 218.30620 382.1 218.3 0410 407.3 218.3
0740 390.5 218.3 0600 403.1 218.30900 386.3 218.3 0735 407.3 214.11020 390.5 218.3 0915 403.1 210.01130 386.3 214.1 1100 407.3 214.11255 390.5 214.1 1255 398.9 210.0
1400 390.5 214.1 1500 407.3 214.11525 394.7 214.1 1700 403.1 214.11640 398.9 218.3 1830 403.1 218.31750 403.1 218.3 2005 411.5 218.31900 390.5 218.3 2120 407.3 222.5
2005 403.1 222.5 2240 411.5 222.52110 407.3 226.7 29 Aug 90 0005 415.7 222.52235 407.3 226.7 0125 407.3 218.32345 407.3 226.7 0255 407.3 218.3
27 Aug 90 0110 403.1 222.5 0425 407.3 214.1
0255 407.3 222.5 0550 403.1 214.10420 398.9 222.5 0715 407.3 214.10555 394.7 218.3 0850 407.3 214.10710 398.9 214.1 1010 407.3 214.10855 394.7 218.3 1155 403.1 214.1
93
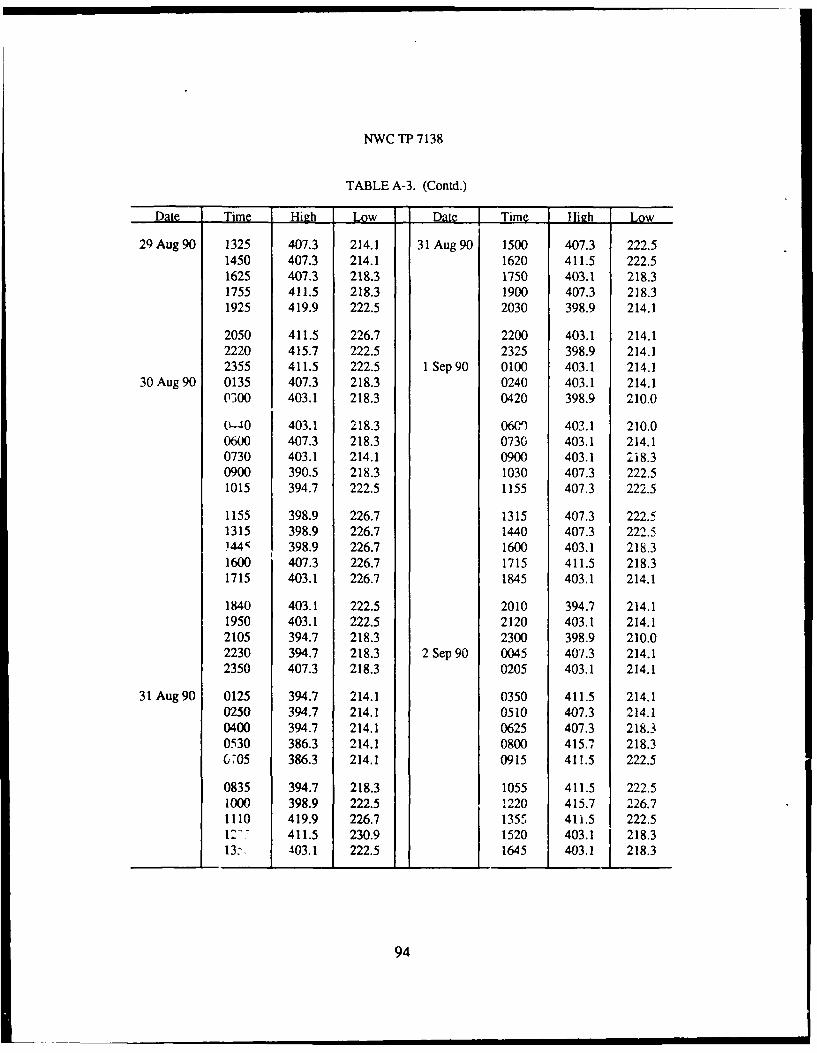
NWC TP 7138
TABLE A-3. (Contd.)
Date Time High Low Date Time Htigh Low
29 Aug 90 1325 407.3 214.1 31 Aug 90 1500 407.3 222.51450 407.3 214.1 1620 411.5 222.51625 407.3 218.3 1750 403.1 218.31755 411.5 218.3 1900 407.3 218.31925 419.9 222.5 2030 398.9 214.1
2050 411.5 226.7 2200 403.1 214.12220 415.7 222.5 2325 398.9 214.12355 411.5 222.5 1 Sep 90 0100 403.1 214.1
30 Aug 90 0135 407.3 218.3 0240 403.1 214.10300 403.1 218.3 0420 398.9 210.0
("-40 403.1 218.3 060') 403.1 210.00600 407.3 218.3 0730 403.1 214.10730 403.1 214.1 0900 403.1 2i8.30900 390.5 218.3 1030 407.3 222.51015 394.7 222.5 1155 407.3 222.5
1155 398.9 226.7 1315 407.3 222.51315 398.9 226.7 1440 407.3 222.5144; 398.9 226.7 1600 403.1 218.31600 407.3 226.7 1715 411.5 218.31715 403.1 226.7 1845 403.1 214.1
1840 403.1 222.5 2010 394.7 214.11950 403.1 222.5 2120 403.1 214.12105 394.7 218.3 2300 398.9 210.02230 394.7 218.3 2 Sep 90 0045 407.3 214.12350 407.3 218.3 0205 403.1 214.1
31 Aug 90 0125 394.7 214.1 0350 411.5 214.10250 394.7 214.1 0510 407.3 214.10400 394.7 214.1 0625 407.3 218.30530 386.3 214.1 0800 415.7 218.3G,705 386.3 214.1 0915 411.5 222.5
0835 394.7 218.3 1055 411.5 222.51000 398.9 222.5 1220 415.7 226.71110 419.9 226.7 1355 411.5 222.512
"7 411.5 230.9 1520 403.1 218.3
13:, 403.1 222.5 1645 403.1 218.3
94
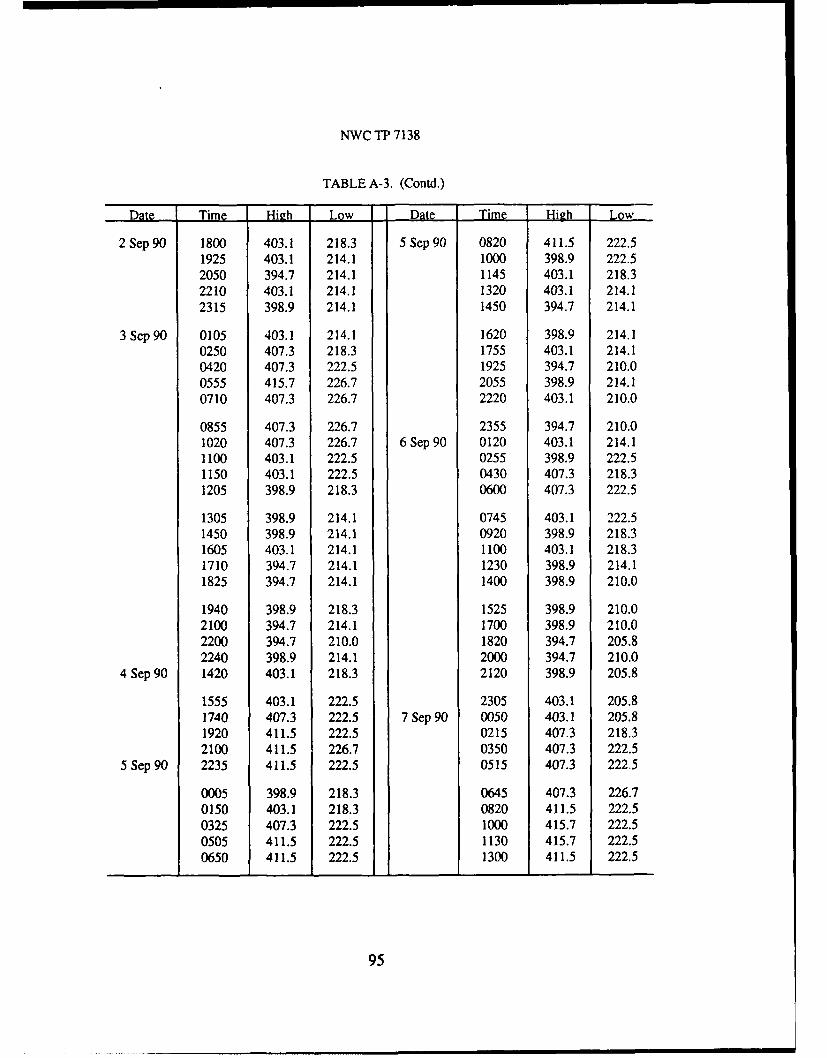
NWC TP 7138
TABLE A-3. (Contd.)
Date Time High Low Date Time High Low
2 Sep 90 1800 403.1 218.3 5 Sep 90 0820 411.5 222.51925 403.1 214.1 1000 398.9 222.52050 394.7 214.1 1145 403.1 218.32210 403.1 214.1 1320 403.1 214.12315 398.9 214.1 1450 394.7 214.1
3 Sep 90 0105 403.1 214.1 1620 398.9 214.10250 407.3 218.3 1755 403.1 214.10420 407.3 222.5 1925 394.7 210.00555 415.7 226.7 2055 398.9 214.10710 407.3 226.7 2220 403.1 210.0
0855 407.3 226.7 2355 394.7 210.01020 407.3 226.7 6 Sep 90 0120 403.1 214.11100 403.1 222.5 0255 398.9 222.51150 403.1 222.5 0430 407.3 218.31205 398.9 218.3 0600 407.3 222.5
1305 398.9 214.1 0745 403.1 222.51450 398.9 214.1 0920 398.9 218.31605 403.1 214.1 1100 403.1 218.31710 394.7 214.1 1230 398.9 214.11825 394.7 214.1 1400 398.9 210.0
1940 398.9 218.3 1525 398.9 210.02100 394.7 214.1 1700 398.9 210.02200 394.7 210.0 1820 394.7 205.82240 398.9 214.1 2000 394.7 210.0
4 Sep 90 1420 403.1 218.3 2120 398.9 205.8
1555 403.1 222.5 2305 403.1 205.81740 407.3 222.5 7 Sep 90 0050 403.1 205.81920 411.5 222.5 0215 407.3 218.32100 411.5 226.7 0350 407.3 222.5
5 Sep 90 2235 411.5 222.5 0515 407.3 222.5
0005 398.9 218.3 0645 407.3 226.70150 403.1 218.3 0820 411.5 222.50325 407.3 222.5 1000 415.7 222.50505 411.5 222.5 1130 415.7 222.50650 411.5 222.5 1300 411.5 222.5
95
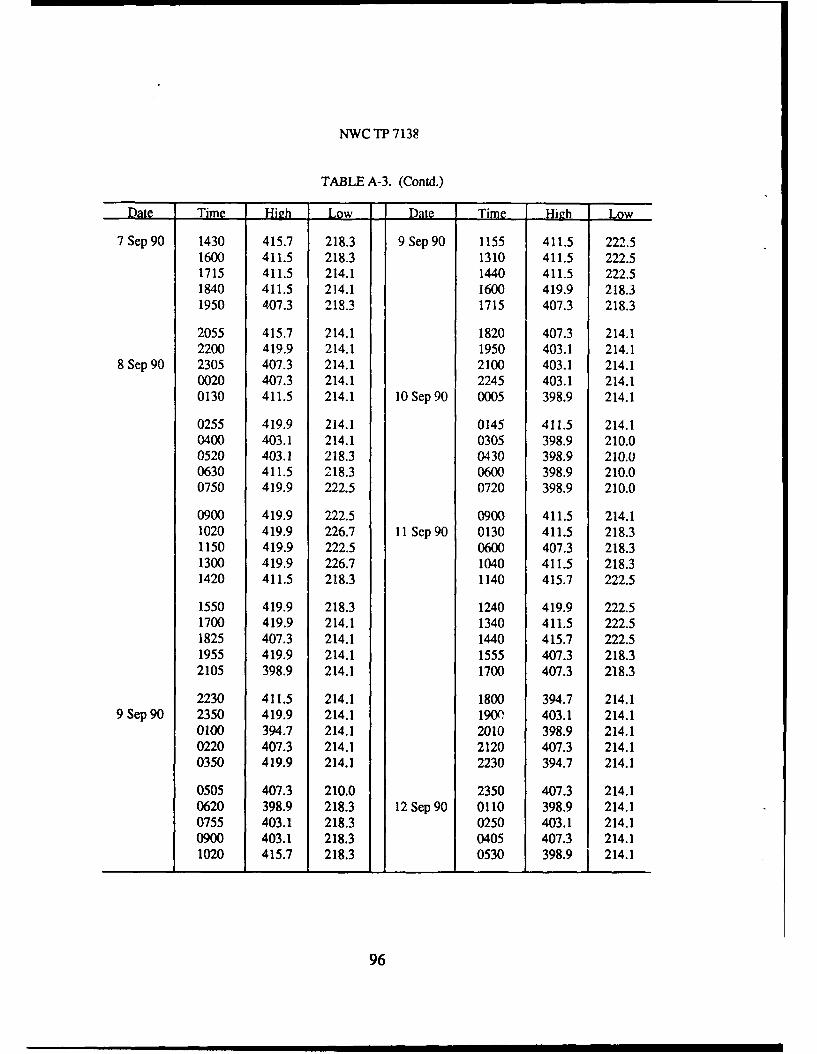
NWC TP 7138
TABLE A-3. (Contd.)
Date Time High Low Date Time High Low
7 Sep 90 1430 415.7 218.3 9 Sep 90 1155 411.5 222.51600 411.5 218.3 1310 411.5 222.51715 411.5 214.1 1440 411.5 222.51840 411.5 214.1 1600 419.9 218.31950 407.3 218.3 1715 407.3 218.3
2055 415.7 214.1 1820 407.3 214.12200 419.9 214.1 1950 403.1 214.1
8 Sep 90 2305 407.3 214.1 2100 403.1 214.10020 407.3 214.1 2245 403.1 214.10130 411.5 214.1 10 Sep 90 0005 398.9 214.1
0255 419.9 214.1 0145 411.5 214.10400 403.1 214.1 0305 398.9 210.00520 403.1 218.3 0430 398.9 210.00630 411.5 218.3 0600 398.9 210.00750 419.9 222.5 0720 398.9 210.0
0900 419.9 222.5 0900 411.5 214.11020 419.9 226.7 11 Sep 90 0130 411.5 218.31150 419.9 222.5 0600 407.3 218.31300 419.9 226.7 1040 411.5 218.31420 411.5 218.3 1140 415.7 222.5
1550 419.9 218.3 1240 419.9 222.51700 419.9 214.1 1340 411.5 222.51825 407.3 214.1 1440 415.7 222.51955 419.9 214.1 1555 407.3 218.32105 398.9 214.1 1700 407.3 218.3
2230 411.5 214.1 1800 394.7 214.19 Sep 90 2350 419.9 214.1 1900 403.1 214.1
0100 394.7 214.1 2010 398.9 214.10220 407.3 214.1 2120 407.3 214.10350 419.9 214.1 2230 394.7 214.1
0505 407.3 210.0 2350 407.3 214.10620 398.9 218.3 12 Sep 90 0110 398.9 214.10755 403.1 218.3 0250 403.1 214.10900 403.1 218.3 0405 407.3 214.11020 415.7 218.3 0530 398.9 214.1
96
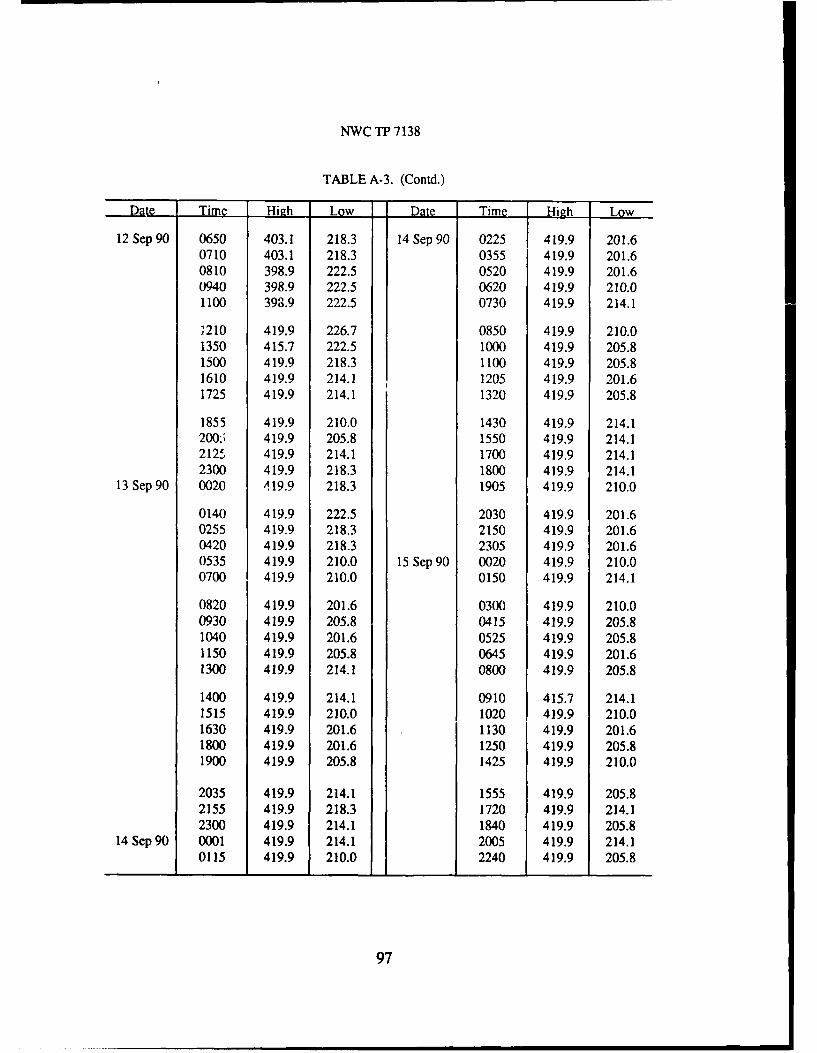
NWC TP 7138
TABLE A-3. (Contd.)
Date Time High Low Date Time High Low
12 Sep 90 0650 403.1 218.3 14 Sep 90 0225 419.9 201.60710 403.1 218.3 0355 419.9 201.60810 398.9 222.5 0520 419.9 201.60940 398.9 222.5 0620 419.9 210.01100 398.9 222.5 0730 419.9 214.1
1210 419.9 226.7 0850 419.9 210.01350 415.7 222.5 1000 419.9 205.81500 419.9 218.3 1100 419.9 205.81610 419.9 214.1 1205 419.9 201.61725 419.9 214.1 1320 419.9 205.8
1855 419.9 210.0 1430 419.9 214.1200:; 419.9 205.8 1550 419.9 214.121215 419.9 214.1 1700 419.9 214.12300 419.9 218.3 1800 419.9 214.1
13 Sep 90 0020 i 19.9 218.3 1905 419.9 210.0
0140 419.9 222.5 2030 419.9 201.60255 419.9 218.3 2150 419.9 201.60420 419.9 218.3 2305 419.9 201.60535 419.9 210.0 15 Sep 90 0020 419.9 210.00700 419.9 210.0 0150 419.9 214.1
0820 419.9 201.6 0300 419.9 210.00930 419.9 205.8 0415 419.9 205.81040 419.9 201.6 0525 419.9 205.81150 419.9 205.8 0645 419.9 201.61300 419.9 214.1 0800 419.9 205.8
1400 419.9 214.1 0910 415.7 214.11515 419.9 210.0 1020 419.9 210.01630 419.9 201.6 1130 419.9 201.61800 419.9 201.6 1250 419.9 205.81900 419.9 205.8 1425 419.9 210.0
2035 419.9 214.1 1555 419.9 205.82155 419.9 218.3 1720 419.9 214.12300 419.9 214.1 1840 419.9 205.8
14 Sep 90 0001 419.9 214.1 2005 419.9 214.10115 419.9 210.0 2240 419.9 205.8
97
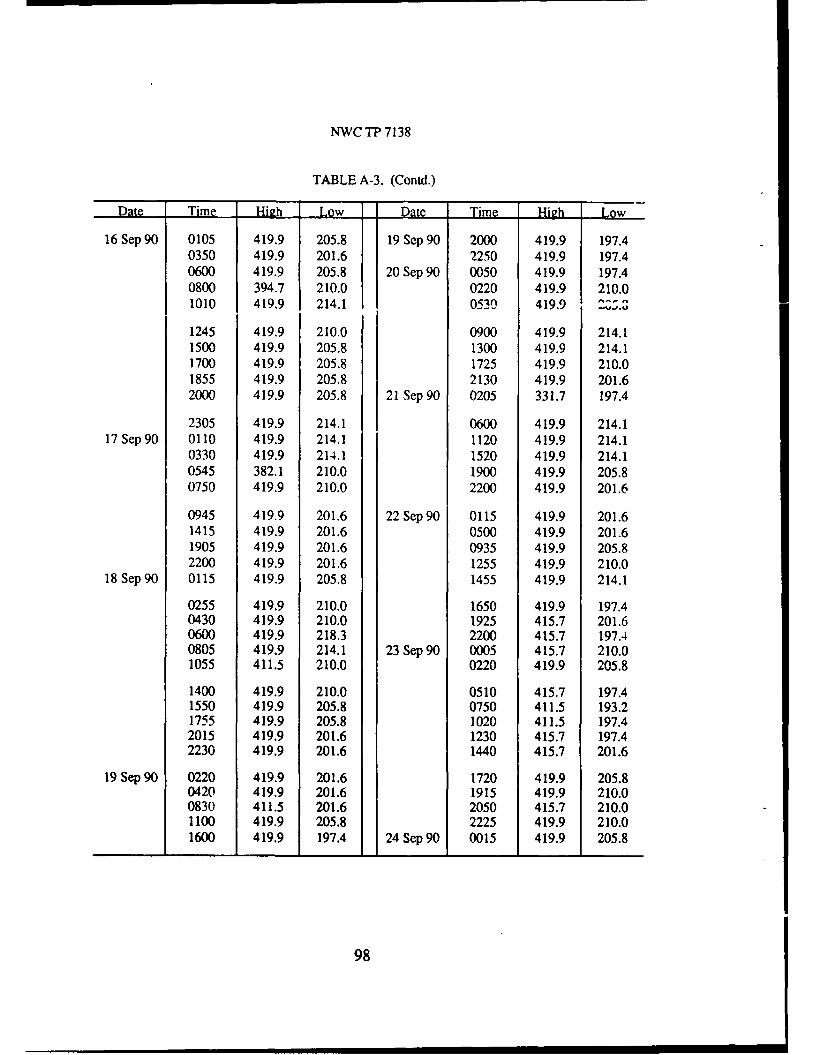
NWC TP 7138
TABLE A-3. (Contd.)
Date Time High Low Date Time High Low
16 Sep 90 0105 419.9 205.8 19 Sep 90 2000 419.9 197.40350 419.9 201.6 2250 419.9 197.40600 419.9 205.8 20 Sep 90 0050 419.9 197.40800 394.7 210.0 0220 419.9 210.01010 419.9 214.1 0530 419.9 .
1245 419.9 210.0 0900 419.9 214.11500 419.9 205.8 1300 419.9 214.11700 419.9 205.8 1725 419.9 210.01855 419.9 205.8 2130 419.9 201.62000 419.9 205.8 21 Sep 90 0205 331.7 197.4
2305 419.9 214.1 0600 419.9 214.117 Sep 90 0110 419.9 214.1 1120 419.9 214.1
0330 419.9 214.1 1520 419.9 214.10545 382.1 210.0 1900 419.9 205.80750 419.9 210.0 2200 419.9 201.6
0945 419.9 201.6 22 Sep 90 0115 419.9 201.61415 419.9 201.6 0500 419.9 201.61905 419.9 201.6 0935 419.9 205.82200 419.9 201.6 1255 419.9 210.0
18 Sep 90 0115 419.9 205.8 1455 419.9 214.1
0255 419.9 210.0 1650 419.9 197.40430 419.9 210.0 1925 415.7 201.60600 419.9 218.3 2200 415.7 197.40805 419.9 214.1 23 Sep 90 0005 415.7 210.01055 411.5 210.0 0220 419.9 205.8
1400 419.9 210.0 0510 415.7 197.41550 419.9 205.8 0750 411.5 193.21755 419.9 205.8 1020 411.5 197.42015 419.9 201.6 1230 415.7 197.42230 419.9 201.6 1440 415.7 201.6
19 Sep 90 0220 419.9 201.6 1720 419.9 205.80420 419.9 201.6 1915 419.9 210.00830 411.5 201.6 2050 415.7 210.01100 419.9 205.8 2225 419.9 210.01600 419.9 197.4 24 Sep 90 0015 419.9 205.8
98
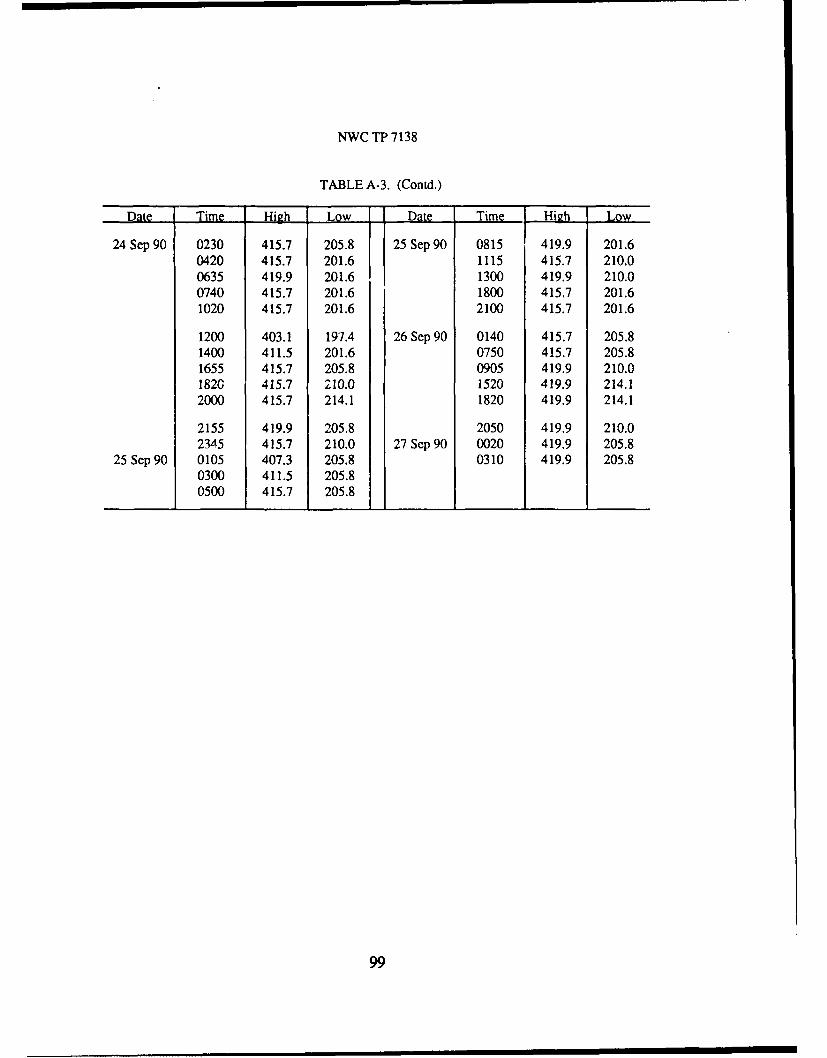
NWC TP 7138
TABLE A-3. (Contd.)
Date Time High Low D Time High Low
24 Sep 90 0230 415.7 205.8 25 Sep 90 0815 419.9 201.60420 415.7 201.6 1115 415.7 210.00635 419.9 201.6 1300 419.9 210.00740 415.7 201.6 1800 415.7 201.61020 415.7 201.6 2100 415.7 201.6
1200 403.1 197.4 26 Sep 90 0140 415.7 205.81400 411.5 201.6 0750 415.7 205.81655 415.7 205.8 0905 419.9 210.01820 415.7 210.0 1520 419.9 214.12000 415.7 214.1 1820 419.9 214.1
2155 419.9 205.8 2050 419.9 210.02345 415.7 210.0 27 Sep 90 0020 419.9 205.8
25 Sep 90 0105 407.3 205.8 0310 419.9 205.80300 411.5 205.80500 415.7 205.8
99
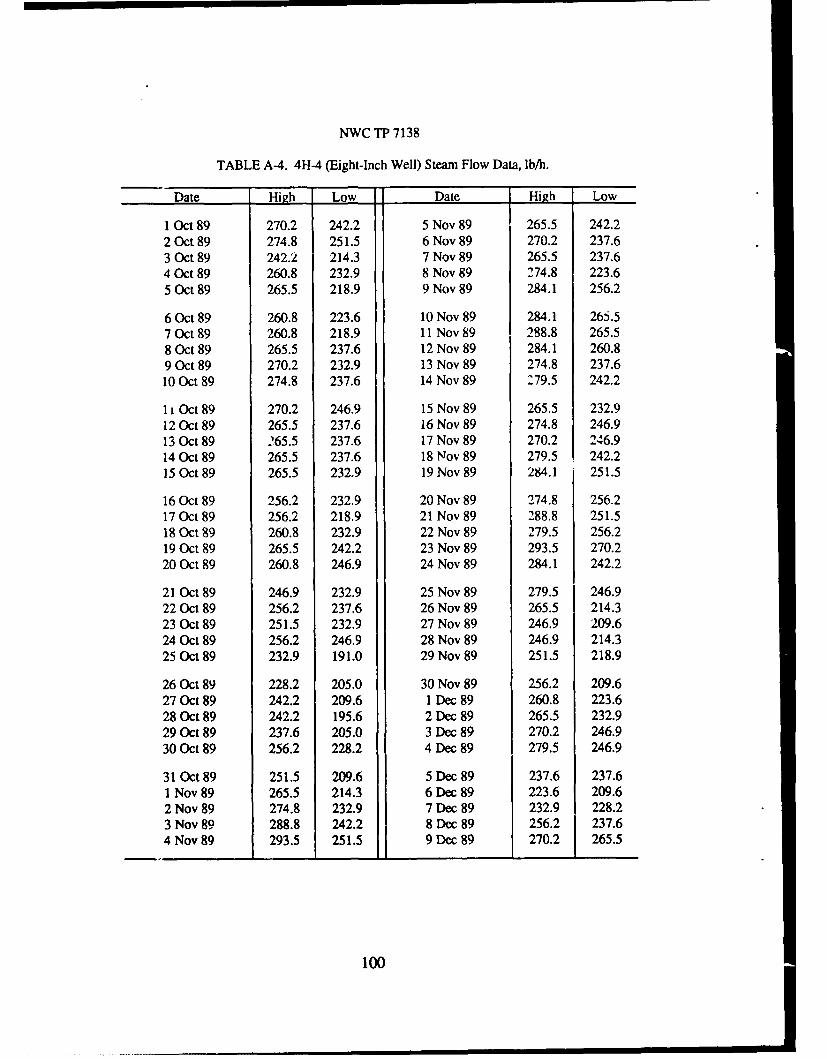
NWC TP 7138
TABLE A-4. 4H-4 (Eight-Inch Well) Steam Flow Data, lb/h.
Date High Low Date High Low
1 Oct 89 270.2 242.2 5 Nov 89 265.5 242.22 Oct 89 274.8 251.5 6 Nov 89 270.2 237.63 Oct 89 242.2 214.3 7 Nov 89 265.5 237.64 Oct 89 260.8 232.9 8 Nov 89 274.8 223.65 Oct 89 265.5 218.9 9 Nov 89 284.1 256.2
6 Oct 89 260.8 223.6 10 Nov 89 284.1 265.57 Oct 89 260.8 218.9 11 Nov 89 288.8 265.58 Oct 89 265.5 237.6 12 Nov 89 284.1 260.89 Oct 89 270.2 232.9 13 Nov 89 274.8 237.610 Oct 89 274.8 237.6 14 Nov 89 279.5 242.2
11 Oct 89 270.2 246.9 15 Nov 89 265.5 232.912 Oct 89 265.5 237.6 16 Nov 89 274.8 246.913 Oct 89 265.5 237.6 17 Nov 89 270.2 246.914 Oct 89 265.5 237.6 18 Nov 89 279.5 242.215 Oct89 265.5 232.9 19 Nov 89 284.1 251.5
16 Oct 89 256.2 232.9 20 Nov 89 274.8 256.217 Oct 89 256.2 218.9 21 Nov 89 288.8 251.518 Oct 89 260.8 232.9 22 Nov 89 279.5 256.219 Oct 89 265.5 242.2 23 Nov 89 293.5 270.220 Oct 89 260.8 246.9 24 Nov 89 284.1 242.2
21 Oct 89 246.9 232.9 25 Nov 89 279.5 246.922 Oct 89 256.2 237.6 26 Nov 89 265.5 214.323 Oct 89 251.5 232.9 27 Nov 89 246.9 209.624 Oct 89 256.2 246.9 28 Nov 89 246.9 214.325 Oct 89 232.9 191.0 29 Nov 89 251.5 218.9
26 Oct 89 228.2 205.0 30 Nov 89 256.2 209.627 Oct 89 242.2 209.6 1 Dec 89 260.8 223.628 Oct 89 242.2 195.6 2 Dec 89 265.5 232.929 Oct 89 237.6 205.0 3 Dec 89 270.2 246.930 Oct 89 256.2 228.2 4 Dec 89 279.5 246.9
31 Oct 89 251.5 209.6 5 Dec 89 237.6 237.61 Nov 89 265.5 214.3 6 Dec 89 223.6 209.62 Nov 89 274.8 232.9 7 Dec 89 232.9 228.23 Nov 89 288.8 242.2 8 Dec 89 256.2 237.64 Nov 89 293.5 251.5 9 Dec 89 270.2 265.5
100
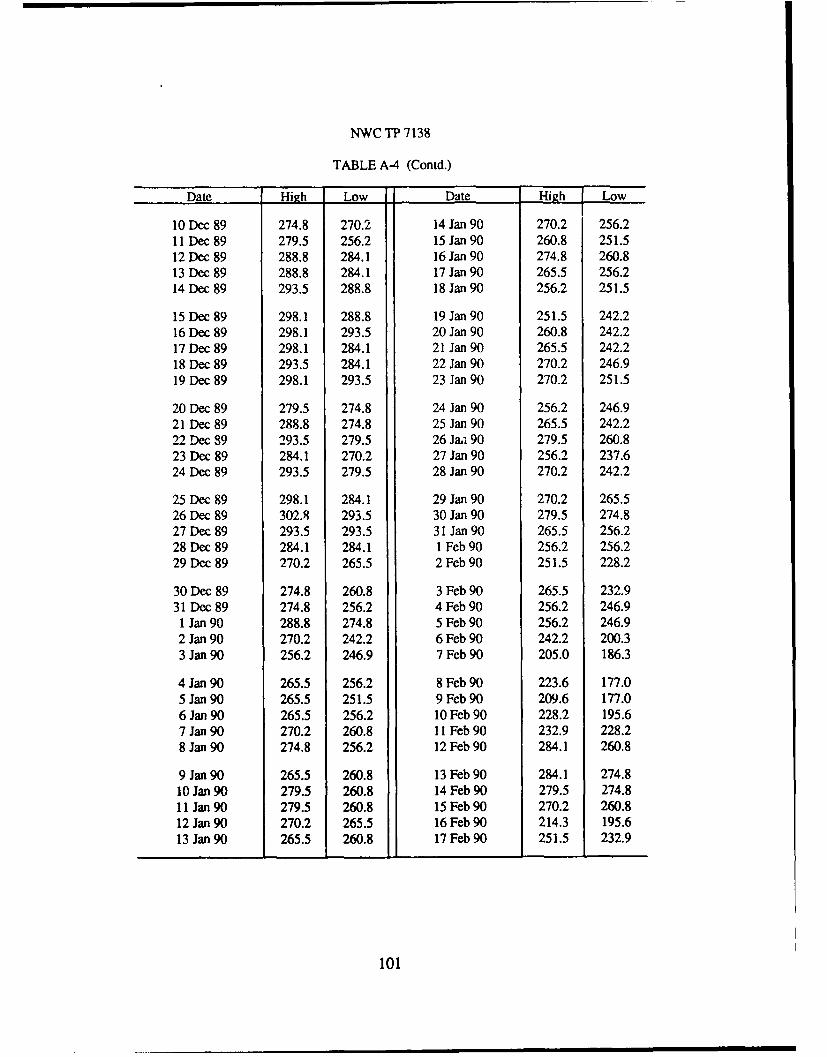
NWC TP 7138
TABLE A-4 (Contd.)
Date Hisgh Low Date High ILow
10 Dec 89 274.8 270.2 14 Jan 90 270.2 256.211 Dec 89 279.5 256.2 15 Jan 90 260.8 251.512 Dec 89 288.8 284.1 16 Jan 90 274.8 260.813 Dec 89 288.8 284.1 17 Jan 90 265.5 256.214 Dec 89 293.5 288.8 18 Jan 90 256.2 251.5
15 Dec 89 298.1 288.8 19 Jan 90 251.5 242.216 Dec 89 298.1 293.5 20 Jan 90 260.8 242.217 Dec 89 298.1 284.1 21 Jan 90 265.5 242.218 Dec 89 293.5 284.1 22 Jan 90 270.2 246.919 Dec 89 298.1 293.5 23 Jan 90 270.2 251.5
20 Dec 89 279.5 274.8 24 Jan 90 256.2 246.921 Dec 89 288.8 274.8 25 Jan 90 265.5 242.222 Dec 89 293.5 279.5 26 Ja, 90 279.5 260.823 Dec 89 284.1 270.2 27 Jan 90 256.2 237.624 Dec 89 293.5 279.5 28 Jan 90 270.2 242.2
25 Dec 89 298.1 284.1 29 Jan 90 270.2 265.526 Dec 89 302.8 293.5 30 Jan 90 279.5 274.827 Dec 89 293.5 293.5 31 Jan 90 265.5 256.228 Dec 89 284.1 284.1 1 Feb 90 256.2 256.229 Dec 89 270.2 265.5 2 Feb 90 251.5 228.2
30 Dec 89 274.8 260.8 3 Feb 90 265.5 232.931 Dec 89 274.8 256.2 4 Feb 90 256.2 246.91 Jan 90 288.8 274.8 5 Feb 90 256.2 246.92 Jan 90 270.2 242.2 6 Feb 90 242.2 200.33 Jan 90 256.2 246.9 7 Feb 90 205.0 186.3
4 Jan 90 265.5 256.2 8 Feb 90 223.6 177.05 Jan 90 265.5 251.5 9 Feb 90 209.6 177.06 Jan 90 265.5 256.2 10 Feb 90 228.2 195.67 Jan 90 270.2 260.8 II Feb 90 232.9 228.28 Jan 90 274.8 256.2 12 Feb 90 284.1 260.8
9 Jan 90 265.5 260.8 13 Feb 90 284.1 274.810 Jan 90 279.5 260.8 14 Feb 90 279.5 274.811 Jan 90 279.5 260.8 15 Feb 90 270.2 260.812 Jan 90 270.2 265.5 16 Feb 90 214.3 195.613 Jan 90 265.5 260.8 17 Feb 90 251.5 232.9
101
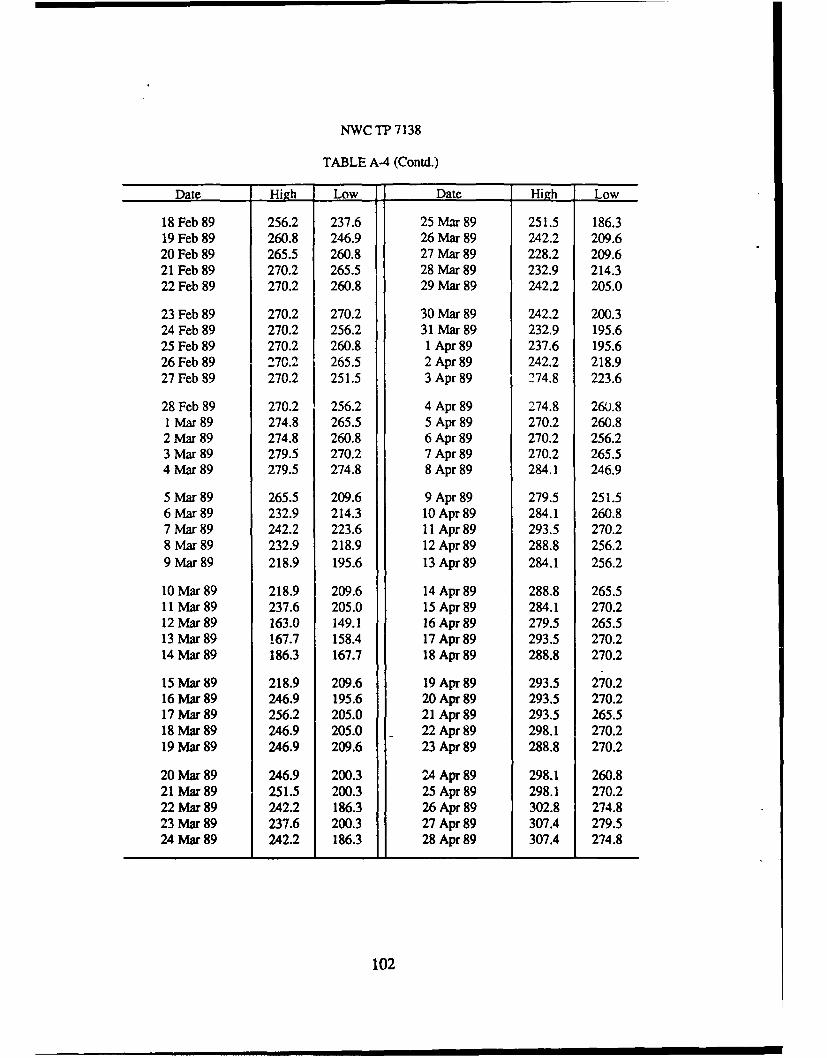
NWC TP 7138
TABLE A-4 (Contd.)
Date High Low Date High Low
18 Feb 89 256.2 237.6 25 Mar 89 251.5 186.319 Feb 89 260.8 246.9 26 Mar 89 242.2 209.620 Feb 89 265.5 260.8 27 Mar 89 228.2 209.621 Feb 89 270.2 265.5 28 Mar 89 232.9 214.322 Feb 89 270.2 260.8 29 Mar 89 242.2 205.0
23 Feb 89 270.2 270.2 30 Mar 89 242.2 200.324 Feb 89 270.2 256.2 31 Mar 89 232.9 195.625 Feb 89 270.2 260.8 1 Apr 89 237.6 195.626 Feb 89 270.2 265.5 2 Apr 89 242.2 218.927 Feb 89 270.2 251.5 3 Apr 89 274.8 223.6
28 Feb 89 270.2 256.2 4 Apr 89 274.8 260.81 Mar 89 274.8 265.5 5 Apr 89 270.2 260.82 Mar 89 274.8 260.8 6 Apr 89 270.2 256.23 Mar 89 279.5 270.2 7 Apr 89 270.2 265.54 Mar 89 279.5 274.8 8 Apr 89 284.1 246.9
5 Mar 89 265.5 209.6 9 Apr 89 279.5 251.56 Mar 89 232.9 214.3 10 Apr 89 284.1 260.87 Mar 89 242.2 223.6 11 Apr 89 293.5 270.28 Mar 89 232.9 218.9 12 Apr 89 288.8 256.29 Mar 89 218.9 195.6 13 Apr 89 284.1 256.2
10 Mar 89 218.9 209.6 14 Apr 89 288.8 265.511 Mar 89 237.6 205.0 15 Apr 89 284.1 270.212 Mar 89 163.0 149.1 16 Apr 89 279.5 265.513 Mar 89 167.7 158.4 17 Apr 89 293.5 270.214 Mar 89 186.3 167.7 18 Apr 89 288.8 270.2
15 Mar 89 218.9 209.6 19 Apr 89 293.5 270.216 Mar 89 246.9 195.6 20 Apr 89 293.5 270.217 Mar 89 256.2 205.0 21 Apr 89 293.5 265.518 Mar 89 246.9 205.0 22 Apr 89 298.1 270.219 Mar 89 246.9 209.6 23 Apr 89 288.8 270.2
20 Mar 89 246.9 200.3 24 Apr 89 298.1 260.821 Mar 89 251.5 200.3 25 Apr 89 298.1 270.222 Mar 89 242.2 186.3 26 Apr 89 302.8 274.823 Mar 89 237.6 200.3 27 Apr 89 307.4 279.524 Mar 89 242.2 186.3 28 Apr 89 307.4 274.8
102
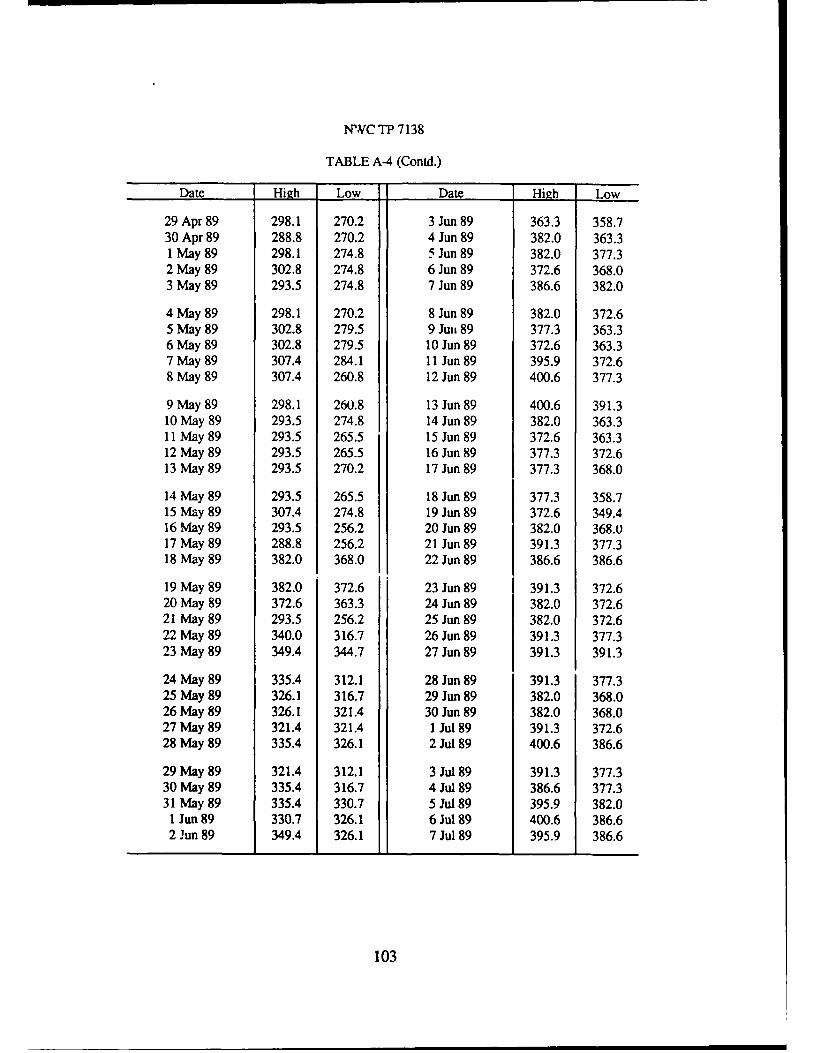
NWC TP 7138
TABLE A-4 (Contd.)
Date High Low Date High Low
29 Apr 89 298.1 270.2 3 Jun 89 363.3 358.730 Apr 89 288.8 270.2 4 Jun 89 382.0 363.31 May 89 298.1 274.8 5 Jun 89 382.0 377.32 May 89 302.8 274.8 6 Jun 89 372.6 368.03 May 89 293.5 274.8 7 Jun 89 386.6 382.0
4 May 89 298.1 270.2 8 Jun 89 382.0 372.65 May 89 302.8 279.5 9 Jun 89 377.3 363.36 May 89 302.8 279.5 10 Jun 89 372.6 363.37 May 89 307.4 284.1 11 Jun 89 395.9 372.68 May 89 307.4 260.8 12 Jun 89 400.6 377.3
9 May 89 298.1 260.8 13 Jun 89 400.6 391.310 May 89 293.5 274.8 14 Jun 89 382.0 363.311 May 89 293.5 265.5 15 Jun 89 372.6 363.312 May 89 293.5 265.5 16 Jun 89 377.3 372.613 May 89 293.5 270.2 17 Jun 89 377.3 368.0
14 May 89 293.5 265.5 18 Jun 89 377.3 358.715 May 89 307.4 274.8 19 Jun 89 372.6 349.416 May 89 293.5 256.2 20 Jun 89 382.0 368.017 May 89 288.8 256.2 21 Jun 89 391.3 377.318 May 89 382.0 368.0 22 Jun 89 386.6 386.6
19 May 89 382.0 372.6 23 Jun 89 391.3 372.620 May 89 372.6 363.3 24 Jun 89 382.0 372.621 May 89 293.5 256.2 25 Jun 89 382.0 372.622 May 89 340.0 316.7 26 Jun 89 391.3 377.323 May 89 349.4 344.7 27 Jun 89 391.3 391.3
24 May 89 335.4 312.1 28 Jun 89 391.3 377.325 May 89 326.1 316.7 29 Jun 89 382.0 368.026 May 89 326.1 321.4 30 Jun 89 382.0 368.027 May 89 321.4 321.4 1 Jul 89 391.3 372.628 May 89 335.4 326.1 2 Jul 89 400.6 386.6
29 May 89 321.4 312.1 3 Jul 89 391.3 377.330 May 89 335.4 316.7 4 Jul 89 386.6 377.331 May 89 335.4 330.7 5 Jul 89 395.9 382.01 Jun 89 330.7 326.1 6 Jul89 400.6 386.62 Jun 89 349.4 326.1 7 Jul 89 395.9 386.6
103
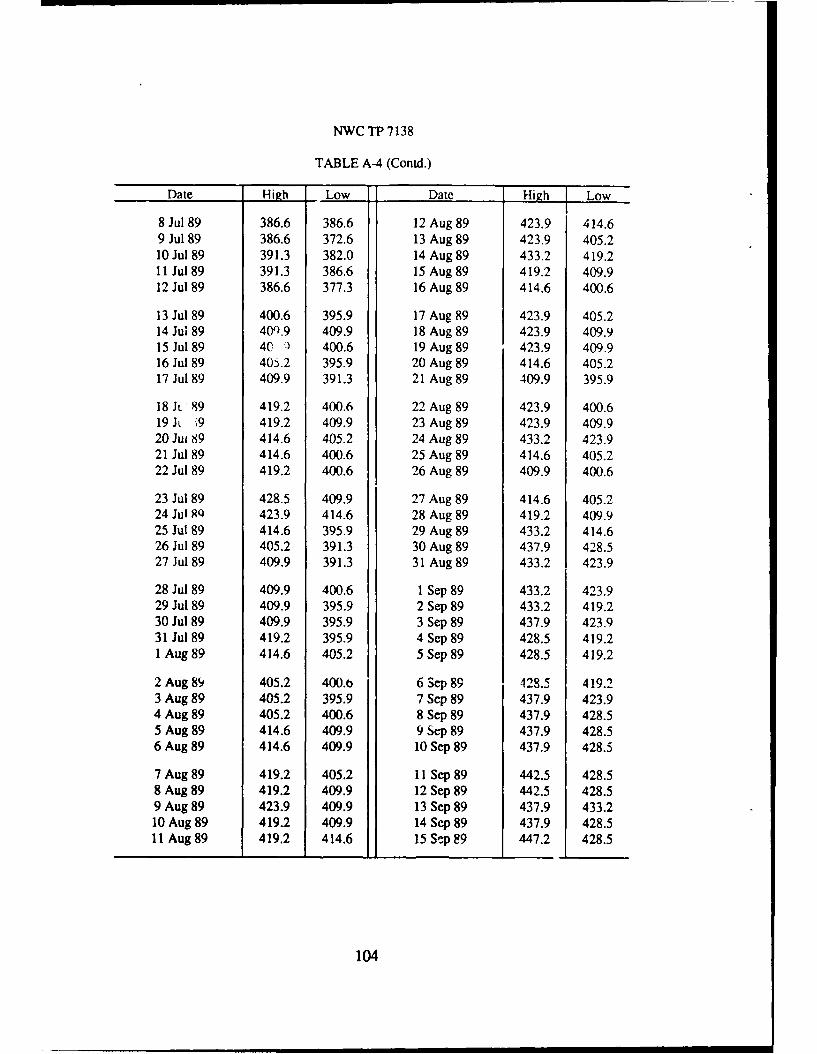
NWC TP 7138
TABLE A-4 (Contd.)
Date High Low Date High Low
8 Jul 89 386.6 386.6 12 Aug 89 423.9 414.69 Jul 89 386.6 372.6 13 Aug 89 423.9 405.210 Jul 89 391.3 382.0 14 Aug 89 433.2 419.211 Jul 89 391.3 386.6 15 Aug 89 419.2 409.912 Jul 89 386.6 377.3 16 Aug 89 414.6 400.6
13 Jul 89 400.6 395.9 17 Aug 89 423.9 405.214 Jul 89 409.9 409.9 18 Aug 89 423.9 409.915 Jul 89 40 1 400.6 19 Aug 89 423.9 409.916 Jul 89 405.2 395.9 20 Aug 89 414.6 405.217 Jul 89 409.9 391.3 21 Aug 89 409.9 395.9
18 Jt 89 419.2 400.6 22 Aug 89 423.9 400.619 Jt ;9 419.2 409.9 23 Aug 89 423.9 409.920 Jui 89 414.6 405.2 24 Aug 89 433.2 423.921 Jul 89 414.6 400.6 25 Aug 89 414.6 405.222 Jul 89 419.2 400.6 26 Aug 89 409.9 400.6
23 Jul 89 428.5 409.9 27 Aug 89 414.6 405.224 Jul RQ 423.9 414.6 28 Aug 89 419.2 409.925 Jul 89 414.6 395.9 29 Aug 89 433.2 414.626 Jul 89 405.2 391.3 30 Aug 89 437.9 428.527 Jul 89 409.9 391.3 31 Aug 89 433.2 423.9
28 Jul 89 409.9 400.6 1 Sep 89 433.2 423.929 Jul 89 409.9 395.9 2 Sep 89 433.2 419.230 Jul 89 409.9 395.9 3 Sep 89 437.9 423.931 Jul 89 419.2 395.9 4 Sep 89 428.5 419.21 Aug 89 414.6 405.2 5 Sep 89 428.5 419.2
2 Aug 89 405.2 400.6 6 Sep 89 4128." 419.23 Aug 89 405.2 395.9 7 Sep 89 437.9 423.94 Aug 89 405.2 400.6 8 Sep 89 437.9 428.55 Aug 89 414.6 409.9 9 Sep 89 437.9 428.56 Aug 89 414.6 409.9 10 Sep 89 437.9 428.5
7 Aug 89 419.2 405.2 11 Sep 89 442.5 428.58 Aug 89 419.2 409.9 12 Sep 89 442.5 428.59 Aug 89 423.9 409.9 13 Sep 89 437.9 433.210 Aug 89 419.2 409.9 14 Sep 89 437.9 428.511 Aug 89 419.2 414.6 15 Sep 89 447.2 428.5
104

NWC TP 7138
TABLE A-4 (Contd.)
Date High Low Date High Low
16 Sep 89 451.8 437.9 26 Sep 89 447.2 437.917 Sep 89 437.9 433.2 27 Sep 89 451.8 442.518 Sep 89 433.2 423.9 28 Sep 89 442.5 442.519 Sep 89 442.5 433.2 29 Sep 89 442.5 433.220 Sep 89 437.9 433.2 30 Sep 89 442.5 433.2
21 Sep 89 428.5 423.922 Sep 89 433.2 423.923 Sep 89 442.5 428.524 Sep 89 442.5 433.225 Sep 89 442.5 433.2
105

NWC TP 7138
TABLE A-5. 4A-2 and 4A-3 (Schober's Resort Wells) Steam Flow Data, lb/h.
Date High Low Date High Low
1 Oct 89 1152.0 1152.0 5 Nov 89 1128.0 1104.02 Oct 89 1152.0 1152.0 6 Nov89 1116.0 1116.03 Oct 89 1152.0 1152.0 7 Nov 89 1116.0 1104.04Oct89 1152.0 1152.0 8Nov89 1128.0 11( 05 Oct 89 1152.0 1152.0 9 Nov 89 1128.0 Ili 0
6Oct 89 1152.0 1152.0 10 Nov 89 1128.0 1128.07 Oct 89 1152.0 1152.0 11 Nov89 1140.0 1116.08 Oct89 1152.0 1152.0 12 Nov 89 1140.0 1128.09 Oct 89 1152.0 1152.0 13 Nov 89 1128.0 1116.010Oct 89 1152.0 1152.0 14 Nov 89 1152.0 1128.0
11 Oct89 1152.0 1152.0 15 Nov 89 1128.0 1116.012 Oct 89 1164.0 1152.0 16 Nov 89 1116.0 1116.013 Oct 89 1152.0 1152.0 17 Nov89 1116.0 1116.014 Oct 89 1152.0 1152.0 18 Nov 89 1116.0 1116.015 Oct 89 1152.0 1152.0 19 Nov 89 1116.0 1104.0
16 Oct 89 1152.0 1152.0 20 Nov 89 1116.0 1116.017 Oct 89 1152.0 1152.0 21 Nov 89 1128.0 1104.018 Oct 89 1152.0 1152.0 22 Nov 89 1104.0 1056.019 Oct 89 1092.0 1092.0 23 Nov 89 1044.0 1044.020 Oct 89 1080.0 1080.0 24 Nov 89 1044.0 1044.0
21 Oct 89 1068.0 1068.0 25 Nov 89 1044.0 1044.022 Oct 89 1068.0 1056.0 26 Nov 89 1044.0 1032.023 Oct 89 1068.0 1068.0 27 Nov 89 1044.0 1032.024 Oct 89 1056.0 1044.0 28 Nov 89 1056.0 1056.025 Oct 89 1068.0 1044.0 29 Nov 89 1056.0 1056.0
26 Oct 89 1092.0 1032.0 30 Nov 89 1152.0 1044.027 Oct 89 1092.0 1068.0 1 Dec 89 1152.0 1152.028 Oct 89 1080.0 1056.0 2 Dec 89 1152.0 1140.029 Oct 89 1080.0 1068.0 3 Dec 89 1152.0 1152.030 Oct 89 1080.0 1068.0 4 Dec 89 1152.0 1152.0
31 Oct 89 1092.0 1080.0 5 Dec 89 1152.0 1152.01 Nov 89 1104.0 1104.0 6 Dec 89 1152.0 1152.02 Nov 89 1116.0 1116.0 7 Dec 89 1152.0 1152.03 Nov 89 1128.0 1116.0 0 Dec 89 1152.0 1152.04 Nov 89 1140.0 1116.0 9 Dec 89 1152.0 1152.0
106
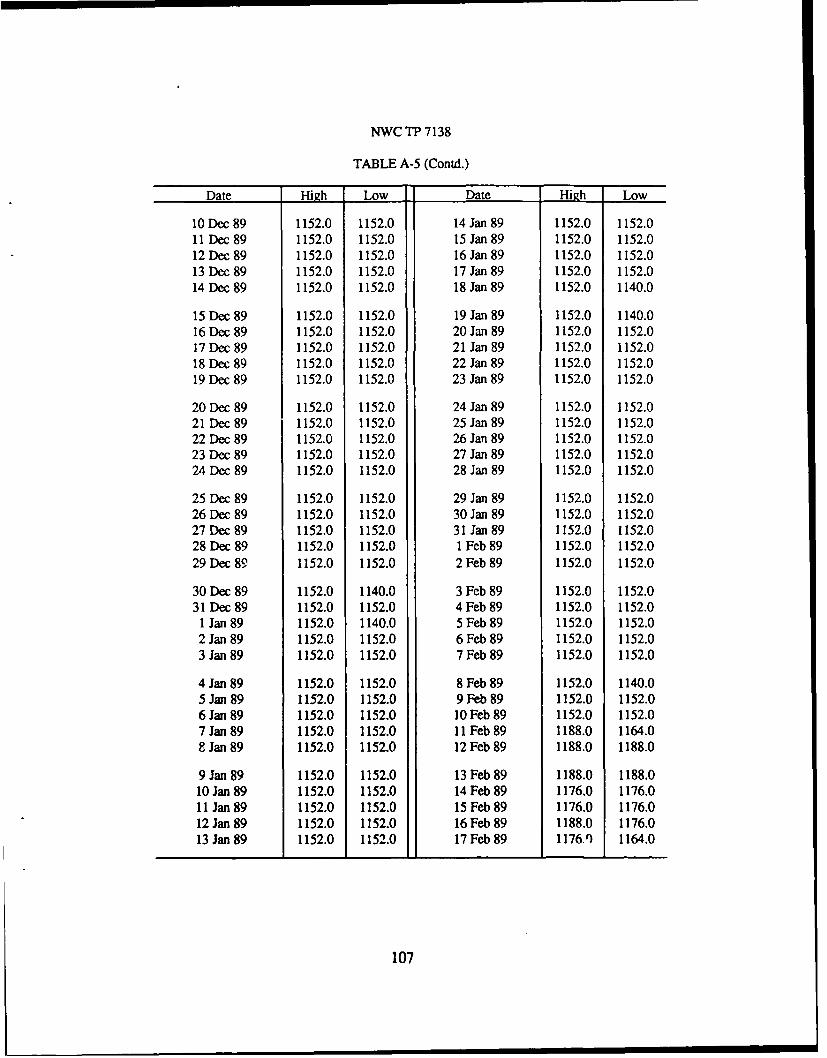
NWC TP 7138
TABLE A-5 (Contd.)
Date High Low Date High Low
10 Dec 89 1152.0 1152.0 14 Jan 89 1152.0 1152.011 Dec 89 1152.0 1152.0 15 Jan 89 1152.0 1152.012 Dec 89 1152.0 1152.0 16 Jan 89 1152.0 1152.013 Dec 89 1152.0 1152.0 17 Jan 89 1152.0 1152.014 Dec 89 1152.0 1152.0 18 Jan 89 1152.0 1140.0
15 Dec 89 1152.0 1152.0 19 Jan 89 1152.0 1140.016 Dec 89 1152.0 1152.0 20Jan 89 1152.0 1152.017 Dec 89 1152.0 1152.0 21 Jan 89 1152.0 1152.018 Dec 89 1152.0 1152.0 22 Jan 89 1152.0 1152.019 Dec 89 1152.0 1152.0 23 Jan 89 1152.0 1152.0
20 Dec 89 1152.0 1152.0 24 Jan 89 1152.0 1152.021 Dec 89 1152.0 1152.0 25 Jan 89 1152.0 1152.022 Dec 89 1152.0 1152.0 26 Jan 89 1152.0 1152.023 Dec 89 1152.0 1152.0 27 Jan 89 1152.0 1152.024 Dec 89 1152.0 1152.0 28 Jan 89 1152.0 1152.0
25 Dec 89 1152.0 1152.0 29 Jan 89 1152.0 1152.026 Dec 89 1152.0 1152.0 30 Jan 89 1152.0 1152.027 Dec 89 1152.0 1152.0 31 Jan 89 1152.0 1152.028 Dec 89 1152.0 1152.0 1 Feb 89 1152.0 1152.029 Dec 89 1152.0 1152.0 2 Feb 89 1152.0 1152.0
30 Dec 89 1152.0 1140.0 3 Feb 89 1152.0 1152.031 Dec 89 1152.0 1152.0 4 Feb 89 1152.0 1152.01 Jan 89 1152.0 1140.0 5 Feb 89 1152.0 1152.02 Jan 89 1152.0 1152.0 6 Feb 89 1152.0 1152.03 Jan 89 1152.0 1152.0 7 Feb 89 1152.0 1152.0
4 Jan 89 1152.0 1152.0 8 Feb 89 1152.0 1140.05 Jan 89 1152.0 1152.0 9 Feb 89 1152.0 1152.06 Jan 89 1152.0 1152.0 10 Feb 89 1152.0 1152.07 Jan 89 1152.0 1152.0 11 Feb 89 1188.0 1164.08 Jan 89 1152.0 1152.0 12 Feb 89 1188.0 1188.0
9 Jan 89 1152.0 1152.0 13 Feb 89 1188.0 1188.010 Jan 89 1152.0 1152.0 14 Feb 89 1176.0 1176.011 Jan 89 1152.0 1152.0 15 Feb 89 1176.0 1176.012 Jan 89 1152.0 1152.0 16 Feb 89 1188.0 1176.013 Jan 89 1152.0 1152.0 17 Feb 89 11761) 1164.0
107
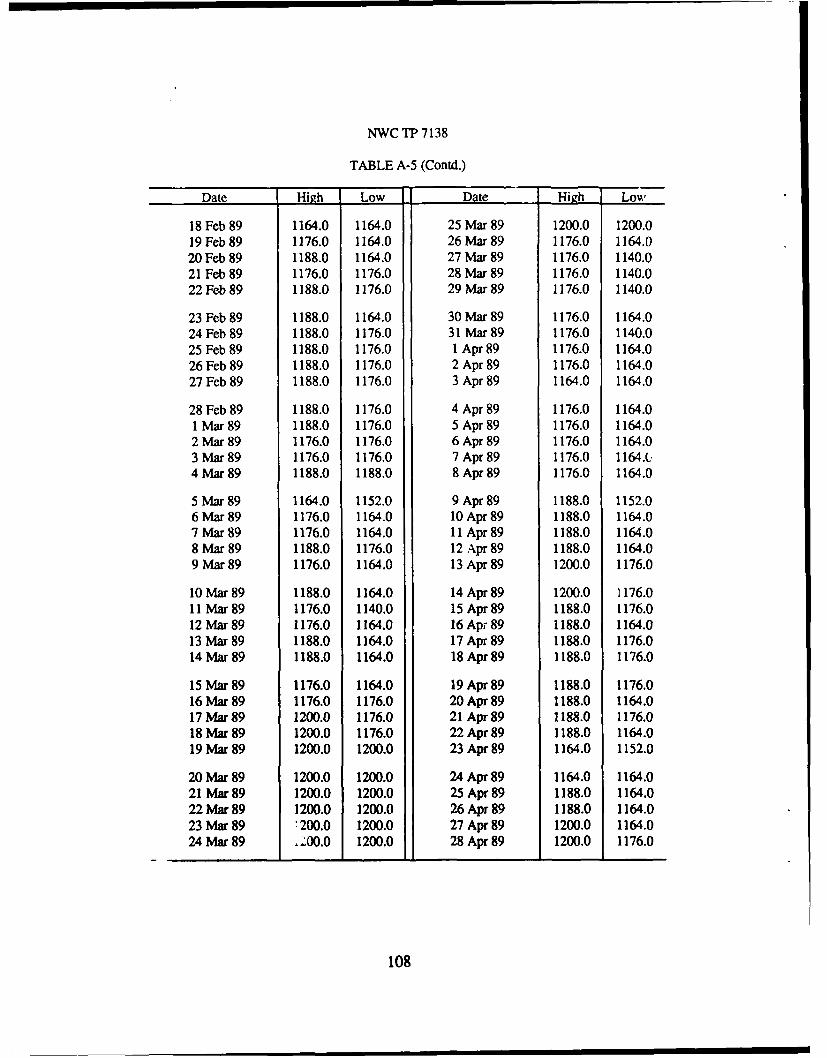
NWC TP 7138
TABLE A-5 (Contd.)
Date High Low Date Hih Low
18 Feb 89 1164.0 1164.0 25 Mar 89 1200.0 1200.019 Feb 89 1176.0 1164.0 26 Mar 89 1176.0 1164.020 Feb 89 1188.0 1164.0 27 Mar 89 1176.0 1140.021 Feb 89 1176.0 1176.0 28 Mar 89 1176.0 1140.022 Feb 89 1188.0 1176.0 29 Mar 89 1176.0 1140.0
23 Feb 89 1188.0 1164.0 30 Mar 89 1176.0 1164.024 Feb 89 1188.0 1176.0 31 Mar 89 1176.0 1140.025 Feb 89 1188.0 1176.0 1 Apr 89 1176.0 1164.026 Feb 89 1188.0 1176.0 2 Apr 89 1176.0 1164.027 Feb 89 1188.0 1176.0 3 Apr 89 1164.0 1164.0
28 Feb 89 1188.0 1176.0 4 Apr 89 1176.0 1164.01 Mar89 1188.0 1176.0 5 Apr89 1176.0 1164.02 Mar 89 1176.0 1176.0 6 Apr 89 1176.0 1164.03 Mar 89 1176.0 1176.0 7 Apr 89 1176.0 1164.,4 Mar89 1188.0 1188.0 8 Apr89 1176.0 1164.0
5 Mar 89 1164.0 1152.0 9 Apr 89 1188.0 1152.06 Mar 89 1176.0 1164.0 10 Apr 89 1188.0 1164.07 Mar 89 1176.0 1164.0 11 Apr 89 1188.0 1164.08 Mar 89 1188.0 1176.0 12 Apr 89 1188.0 1164.09 Mar 89 1176.0 1164.0 13 Apr 89 1200.0 1176.0
10 Mar 89 1188.0 1164.0 14 Apr 89 1200.0 1176.011 Mar 89 1176.0 1140.0 15 Apr 89 1188.0 1176.012 Mar89 1176.0 1164.0 16 Apr 89 1188.0 1164.013 Mar 89 1188.0 1164.0 17 Apr 89 1188.0 1176.014 Mar 89 1188.0 1164.0 18 Apr89 1188.0 1176.0
15 Mar 89 1176.0 1164.0 19 Apr 89 1188.0 1176.016 Mar 89 1176.0 1176.0 20 Apr 89 1188.0 1164.017 Mar 89 1200.0 1176.0 21Apr89 1188.0 1176.018 Mar 89 1200.0 1176.0 22 Apr 89 1188.0 1164.019 Mar 89 1200.0 1200.0 23 Apr 89 1164.0 1152.0
20 Mar 89 1200.0 1200.0 24 Apr 89 1164.0 1164.021 Mar89 1200.0 1200.0 25 Apr 89 1188.0 1164.022 Mar 89 1200.0 1200.0 26 Apr 89 1188.0 1164.023 Mar 89 '200.0 1200.0 27 Apr 89 1200.0 1164.024 Mar 89 .200.0 1200.0 28 Apr 89 1200.0 1176.0
108
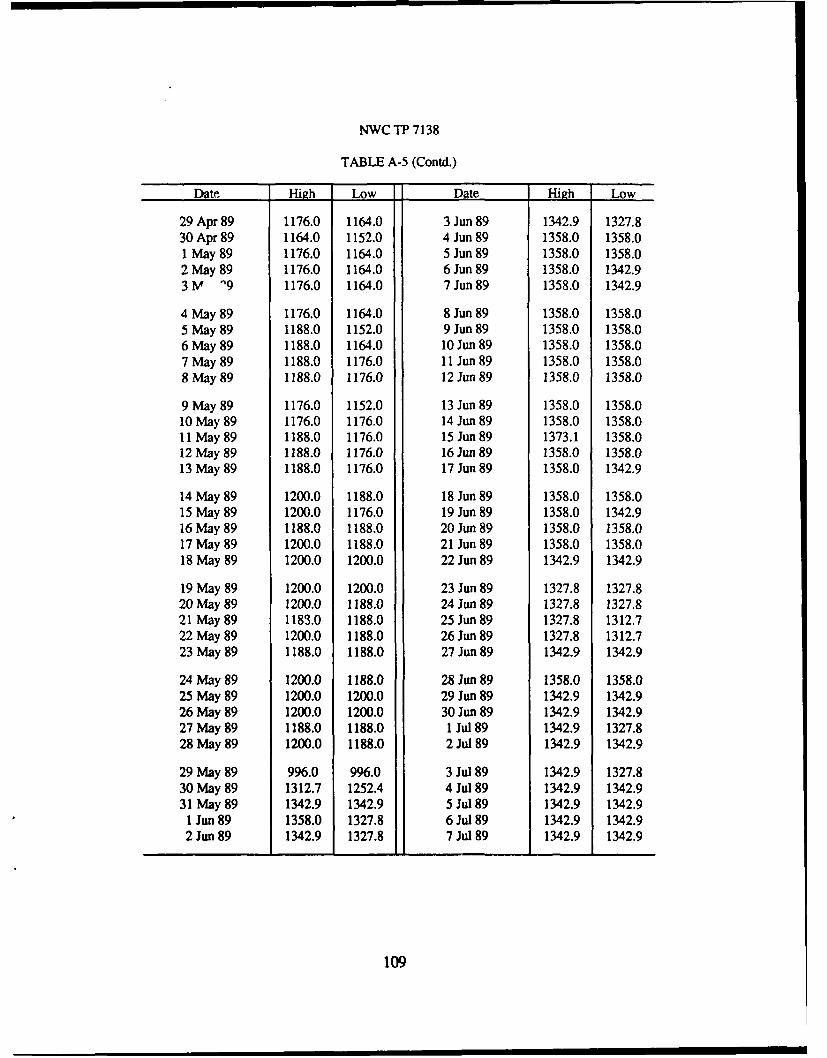
NWC TP 7138
TABLE A-5 (Contd.)
Date High Low Date High Low
29 Apr 89 1176.0 1164.0 3 Jun 89 1342.9 1327.830 Apr 89 1164.0 1152.0 4 Jun 89 1358.0 1358.01 May 89 1176.0 1164.0 5 Jun 89 1358.0 1358.02 May 89 1176.0 1164.0 6 Jun 89 1358.0 1342.93 M "9 1176.0 1164.0 7 Jun 89 1358.0 1342.9
4 May 89 1176.0 1164.0 8 Jun 89 1358.0 1358.05 May 89 1188.0 1152.0 9 Jun 89 1358.0 1358.06 May 89 1188.0 1164.0 10 Jun 89 1358.0 1358.07 May 89 1188.0 1176.0 11 Jun 89 1358.0 1358.08 May 89 1188.0 1176.0 12 Jun 89 1358.0 1358.0
9 May 89 1176.0 1152.0 13 Jun 89 1358.0 1358.010 May 89 1176.0 1176.0 14 Jun 89 1358.0 1358.011 May 89 1188.0 1176.0 15 Jun 89 1373.1 1358.012 May 89 1188.0 1176.0 16 Jun 89 1358.0 1358.013 May 89 1188.0 1176.0 17 Jun 89 1358.0 1342.9
14 May 89 1200.0 1188.0 18 Jun 89 1358.0 1358.015 May 89 1200.0 1176.0 19 Jun 89 1358.0 1342.916 May 89 1188.0 1188.0 20 Jun 89 1358.0 1358.017 May 89 1200.0 1188.0 21 Jun 89 1358.0 1358.018 May 89 1200.0 1200.0 22 Jun 89 1342.9 1342.9
19 May 89 1200.0 1200.0 23 Jun 89 1327.8 1327.820 May 89 1200.0 1188.0 24 Jun 89 1327.8 1327.821 May 89 1183.0 1188.0 25 Jun 89 1327.8 1312.722 May 89 1200.0 1188.0 26 Jun 89 1327.8 1312.723 May 89 1188.0 1188.0 27 Jun 89 1342.9 1342.9
24 May 89 1200.0 1188.0 28 Jun 89 1358.0 1358.025 May 89 1200.0 1200.0 29 Jun 89 1342.9 1342.926 May 89 1200.0 1200.0 30 Jun 89 1342.9 1342.927 May 89 1188.0 1188.0 1 Jul 89 1342.9 1327.828 May 89 1200.0 1188.0 2 Jul 89 1342.9 1342.9
29 May 89 996.0 996.0 3 Jul 89 1342.9 1327.830 May 89 1312.7 1252.4 4 Jul 89 1342.9 1342.931 May 89 1342.9 1342.9 5 Jul 89 1342.9 1342.9
1 Jun 89 1358.0 1327.8 6 Jul 89 1342.9 1342.92 Jun 89 1342.9 1327.8 7 Jul 89 1342.9 1342.9
109
NWC TP 7138
Appendix B
DAILY TEMPERATURE DATA
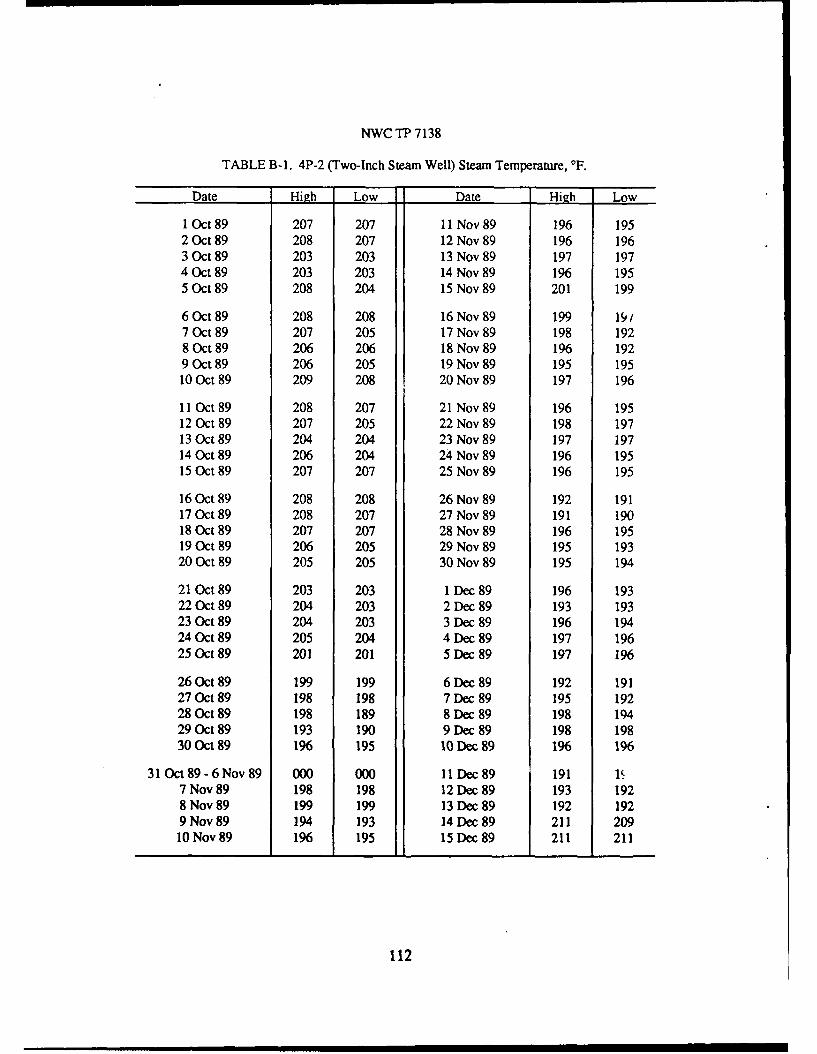
NWC TP 7138
TABLE B-1. 4P-2 (Two-Inch Steam Well) Steam Temperature, *F.
Date High Low Date High Low
1 Oct 89 207 207 11 Nov 89 196 1952 Oct 89 208 207 12 Nov 89 196 1963 Oct 89 203 203 13 Nov 89 197 1974 Oct 89 203 203 14 Nov 89 196 1955 Oct 89 208 204 15 Nov 89 201 199
6 Oct89 208 208 16 Nov 89 199 19/7 Oct 89 207 205 17 Nov 89 198 1928 Oct 89 206 206 18 Nov 89 196 1929 Oct 89 206 205 19 Nov 89 195 19510 Oct 89 209 208 20 Nov 89 197 196
11 Oct 89 208 207 21 Nov 89 196 19512 Oct 89 207 205 22 Nov 89 198 19713 Oct 89 204 204 23 Nov 89 197 19714 Oct 89 206 204 24 Nov 89 196 19515 Oct 89 207 207 25 Nov 89 196 195
16 Oct 89 208 208 26 Nov 89 192 19117 Oct 89 208 207 27 Nov 89 191 19018 Oct89 207 207 28 Nov 89 196 19519 Oct 89 206 205 29 Nov 89 195 19320 Oct 89 205 205 30 Nov 89 195 194
21 Oct 89 203 203 1 Dec 89 196 19322 Oct 89 204 203 2 Dec 89 193 19323 Oct 89 204 203 3 Dec 89 196 19424 Oct 89 205 204 4 Dec 89 197 19625 Oct 89 201 201 5 Dec 89 197 196
26 Oct 89 199 199 6 Dec 89 192 19127 Oct 89 198 198 7 Dec 89 195 19228 Oct 89 198 189 8 Dec 89 198 19429 Oct 89 193 190 9 Dec 89 198 19830 Oct 89 196 195 10 Dec 89 196 196
31 Oct 89- 6 Nov 89 000 000 11 Dec 89 191 is7 Nov 89 198 198 12 Dec 89 193 1928 Nov 89 199 199 13 Dec 89 192 1929 Nov 89 194 193 14 Dec 89 211 20910 Nov 89 196 195 15 Dec 89 211 211
112
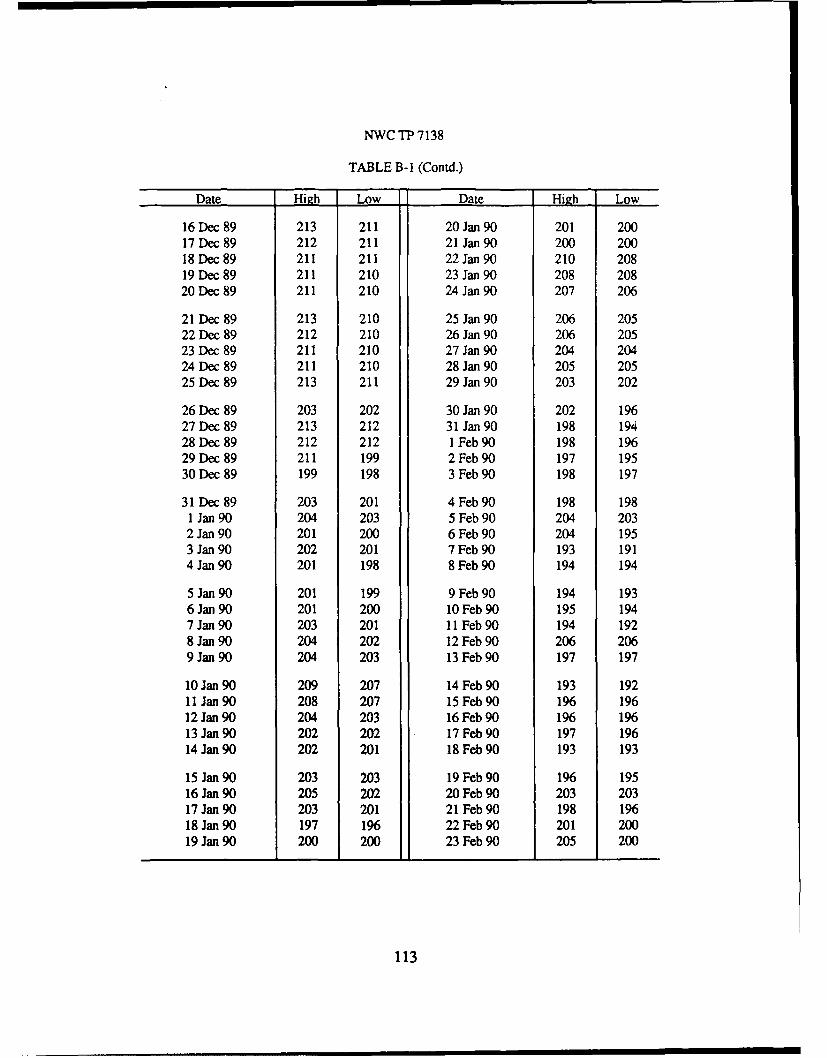
NWC TP 7138
TABLE B- I (Contd.)
Date High Low Date High Low
16 Dec 89 213 211 20 Jan 90 201 20017 Dec 89 212 211 21 Jan90 200 20018 Dec 89 211 211 22 Jan 90 210 20819 Dec 89 211 210 23 Jan 90 208 20820 Dec 89 211 210 24 Jan 90 207 206
21 Dec 89 213 210 25 Jan 90 206 20522 Dec 89 212 210 26 Jan 90 206 20523 Dec 89 211 210 27 Jan 90 204 20424 Dec 89 211 210 28 Jan 90 205 20525 Dec 89 213 211 29 Jan 90 203 202
26 Dec 89 203 202 30 Jan 90 202 19627 Dec 89 213 212 31 Jan 90 198 19428 Dec 89 212 212 1 Feb 90 198 19629 Dec 89 211 199 2 Feb 90 197 19530 Dec 89 199 198 3 Feb 90 198 197
31 Dec 89 203 201 4 Feb 90 198 1981 Jan 90 204 203 5 Feb 90 204 2032 Jan 90 201 200 6 Feb 90 204 1953 Jan 90 202 201 7 Feb 90 193 1914 Jan 90 201 198 8 Feb 90 194 194
5 Jan 90 201 199 9 Feb 90 194 1936 Jan 90 201 200 10 Feb 90 195 1947 Jan 90 203 201 11 Feb 90 194 1928 Jan 90 204 202 12 Feb 90 206 2069 Jan 90 204 203 13 Feb 90 197 197
10 Jan 90 209 207 14 Feb 90 193 19211 Jan 90 208 207 15 Feb 90 196 19612 Jan 90 204 203 16 Feb 90 196 19613 Jan 90 202 202 17 Feb 90 197 19614 Jan 90 202 201 18 Feb 90 193 193
15 Jan 90 203 203 19 Feb 90 196 19516 Jan 90 205 202 20 Feb 90 203 20317 Jan 90 203 201 21 Feb 90 198 19618 Jan 90 197 196 22 Feb 90 201 20019 Jan 90 200 200 23 Feb 90 205 200
113
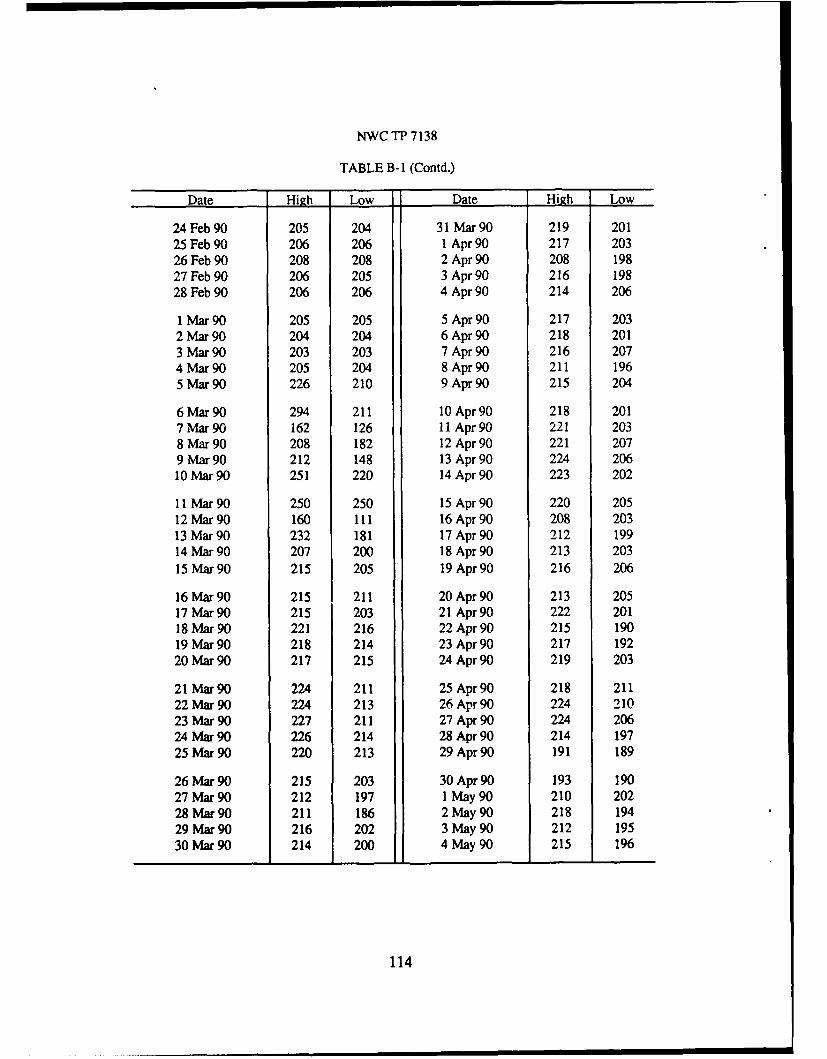
NWC TP 7138
TABLE B-I (Contd.)
Date High Low Date High Low
24 Feb 90 205 204 31 Mar 90 219 20125 Feb 90 206 206 1 Apr 90 217 20326 Feb 90 208 208 2 Apr 90 208 19827 Feb 90 206 205 3 Apr 90 216 19828 Feb 90 206 206 4 Apr 90 214 206
1 Mar 90 205 205 5 Apr 90 217 2032 Mar 90 204 204 6 Apr 90 218 2013 Mar 90 203 203 7 Apr 90 216 2074 Mar 90 205 204 8 Apr 90 211 1965 Mar 90 226 210 9 Apr 90 215 204
6 Mar 90 294 211 10 Apr 90 218 2017 Mar 90 162 126 11 Apr 90 221 2038 Mar 90 208 182 12 Apr 90 221 2079 Mar 90 212 148 13 Apr 90 224 20610 Mar 90 251 220 14 Apr 90 223 202
11 Mar 90 250 250 15 Apr 90 220 20512 Mar 90 160 111 16 Apr 90 208 20313 Mar 90 232 181 17 Apr 90 212 19914 Mar 90 207 200 18 Apr 90 213 203
15 Mar 90 215 205 19 Apr 90 216 206
16 Mar 90 215 211 20 Apr 90 213 20517 Mar 90 215 203 21 Apr 90 222 20118 Mar 90 221 216 22 Apr 90 215 19019 Mar 90 218 214 23 Apr 90 217 19220 Mar 90 217 215 24 Apr 90 219 203
21 Mar90 224 211 25 Apr90 218 21122 Mar 90 224 213 26 Apr 90 224 21023 Mar 90 227 211 27 Apr 90 224 20624 Mar 90 226 214 28 Apr 90 214 19725 Mar 90 220 213 29 Apr90 191 189
26 Mar 90 215 203 30 Apr 90 193 19027 Mar 90 212 197 1 May 90 210 20228 Mar 90 211 186 2 May 90 218 19429 Mar 90 216 202 3 May 90 212 19530 Mar 90 214 200 4 May 90 215 196
114

NWC TP 7138
TABLE B-I (Contd.)
Date High Low Date High Low
5 May 90 216 199 9 Jun 90 915 2116 May 90 219 198 10 Jun 90 215 2127 May 90 219 206 11 Jun 90 218 2098May 90 224 203 12 Jun 90 222 2129 May 90 220 204 13 Jun 90 216 209
10 May 90 214 199 14 Jun 90 212 20611 May 90 219 192 15 Jun 90 212 20712 May 90 215 198 16 Jun 90 217 20713 May 90 217 198 17 Jun 90 217 20914 May 90 216 201 18 Jun 90 217 213
15 May 90 212 201 19 Jun 90 212 21016 May 90 208 193 20 Jun 90 ')?3 21617 May 90 213 197 21 Jun 90 225 22418 May 90 214 192 22 Jun 90 221 21819 May 90 214 195 23 Jun 90 220 215
20 May 90 209 200 24 Jun 90 216 21421 May 90 206 202 25 Jun 90 212 21222 May 90 213 189 26 Jun 90 213 19923 May 90 217 176 27 Jun 90 213 20424 May 90 215 199 28 Jun 90 213 206
25 May 90 205 199 29 Jun 90 207 20526 May 90 211 199 30 Jun 90 214 20527 May 90 209 205 1 Jul90 211 20728 May 90 211 199 2 Jul 90 210 20929 May 90 213 208 3 Jul 90 208 194
30 May 90 216 205 4 Jul90 207 19531 May 90 214 203 5 Jui 90 198 194
1 Jun 90 214 201 6 Jul90 198 1902 Jun 90 219 207 7 Jul90 199 1903 Jun 90 223 210 8 Jul90 193 192
4 Jun 90 222 217 9 Jul90 199 1945 Jun 90 221 211 10 Jul 90 200 1996 Jun 90 216 210 11 Jul 90 212 1927 Jun 90 221 213 12 Jul90 209 2008 Jun 90 222 214 13 Jul90 202 1
115
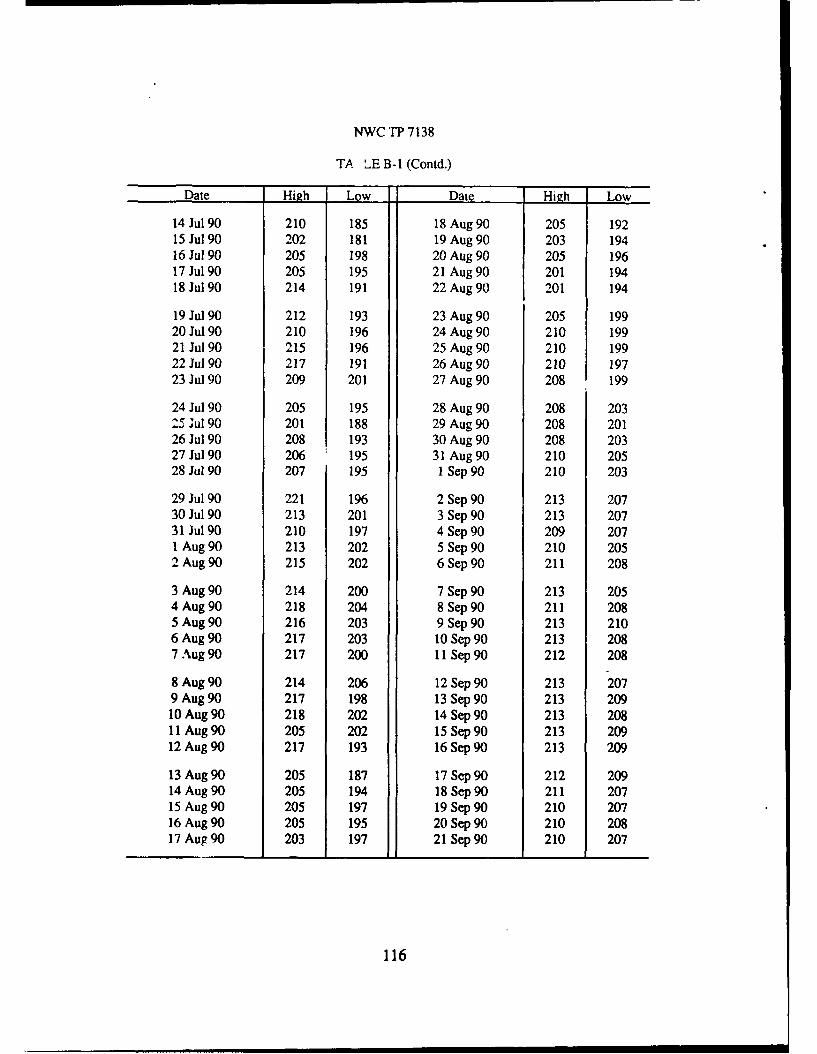
NWC TP 7138
TA LE B-I (Contd.)
Date High Low Date High Low
14 Jul 90 210 185 18 Aug 90 205 19215 Jul 90 202 181 19 Aug 90 203 19416 Jul 90 205 198 20 Aug 90 205 19617 Jul 90 205 195 21 Aug 90 201 19418 Jul 90 214 191 22 Aug 90 201 194
19 Jul 90 212 193 23 Aug 90 205 19920 Jul90 210 196 24 Aug 90 210 19921 Jul 90 215 196 25 Aug 90 210 19922 Jul 90 217 191 26 Aug 90 210 19723 Jul 90 209 201 27 Aug 90 208 199
24 Jul 90 205 195 28 Aug 90 208 203-5 Jul 90 201 188 29 Aug 90 208 201
26 Jul 90 208 193 30 Aug 90 208 20327 Jul 90 206 195 31 Aug 90 210 20528 Jul 90 207 195 1 Sep 90 210 203
29 Jul 90 221 196 2 Sep 90 213 20730 Jul 90 213 201 3 Sep 90 213 20731 Jul90 210 197 4 Sep 90 209 2071 Aug 90 213 202 5 Sep 90 210 2052 Aug 90 215 202 6 Sep 90 211 208
3 Aug 90 214 200 7 Sep 90 213 2054 Aug 90 218 204 8 Sep 90 211 2085 Aug 90 216 203 9 Sep 90 213 2106 Aug 90 217 203 10 Sep 90 213 2087 Aug 90 217 200 11 Sep 90 212 208
8 Aug 90 214 206 12 Sep 90 213 2079 Aug 90 217 198 13 Sep 90 213 20910 Aug 90 218 202 14 Sep 90 213 20811 Aug 90 205 202 15 Sep 90 213 20912 Aug 90 217 193 16 Sep 9 0 213 209
13 Aug 90 205 187 17 Sep 90 212 20914 Aug 90 205 194 18 Sep 90 211 20715 Aug 90 205 197 19 Sep 90 210 20716 Aug 90 205 195 20 Sep 90 210 20817 Aug 90 203 197 21 Sep 90 210 207
116
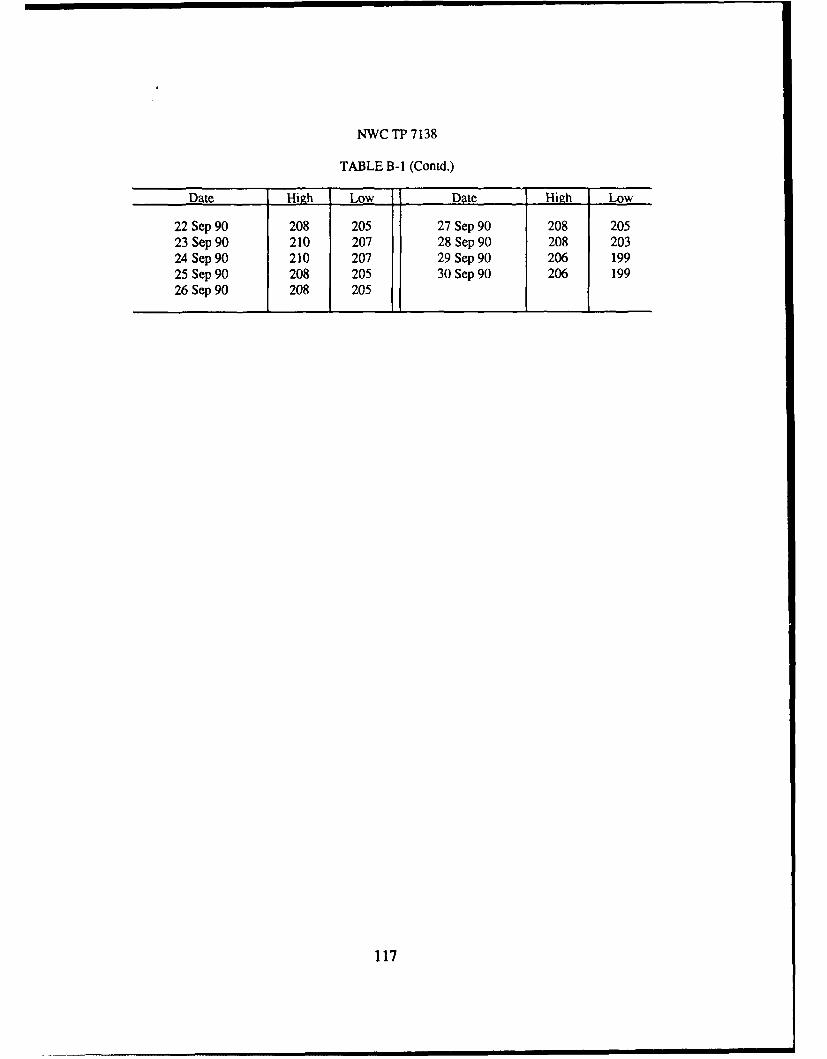
NWC TP 7138
TABLE B-1 (Contd.)
Date High Low Date High Low
22 Sep 90 208 205 27 Sep 90 208 20523 Sep 90 210 207 28 Sep 90 208 20324 Sep 90 210 207 29 Sep 90 206 19925 Sep 90 208 205 30 Sep 90 206 19926 Sep 90 208 205
117
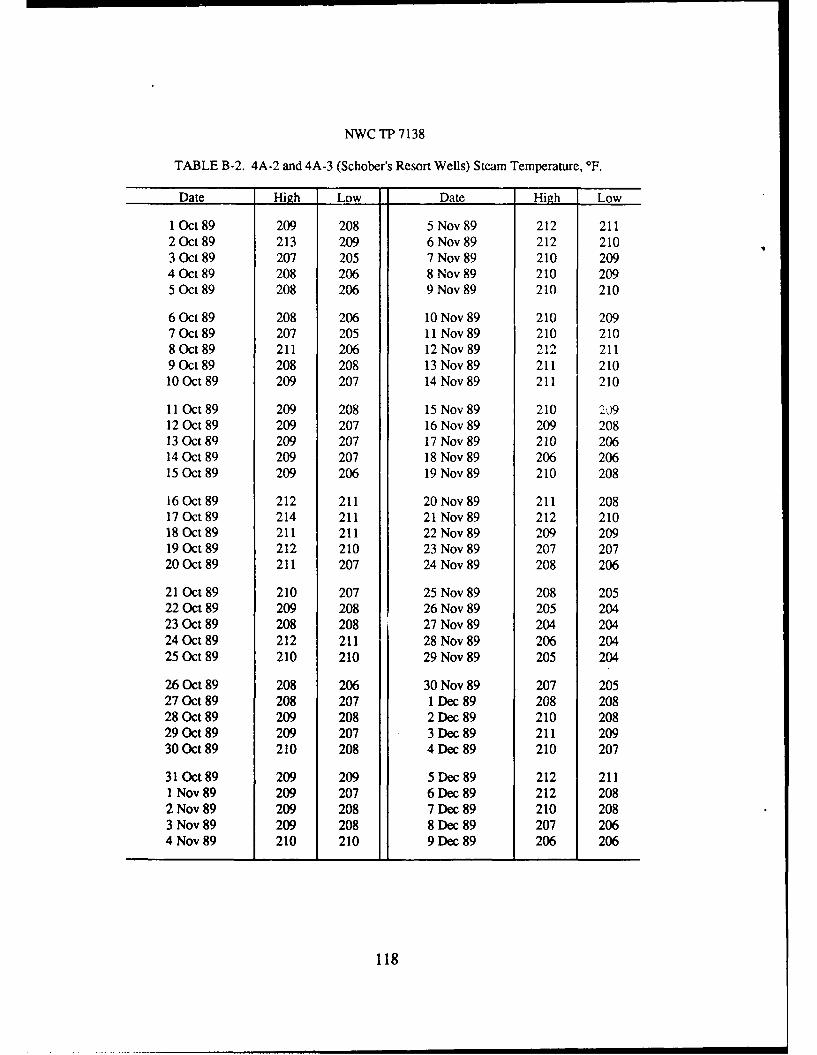
NWC TP 7138
TABLE B-2. 4A-2 and 4A-3 (Schober's Resort Wells) Steam Temperature, IF.
Date High Low Date High Low
1 Oct 89 209 208 5 Nov 89 212 2112 Oct 89 213 209 6 Nov 89 212 2103 Oct 89 207 205 7 Nov 89 210 2094 Oct 89 208 206 8 Nov 89 210 2095 Oct 89 208 206 9 Nov 89 210 210
6 Oct 89 208 206 10 Nov 89 210 2097 Oct 89 207 205 11 Nov 89 210 2108 Oct 89 211 206 12 Nov 89 212 2119 Oct 89 208 208 13 Nov 89 211 21010 Oct 89 209 207 14 Nov 89 211 210
11 Oct 89 209 208 15 Nov 89 210 2-912 Oct 89 209 207 16 Nov 89 209 20813 Oct 89 209 207 17 Nov 89 210 20614 Oct 89 209 207 18 Nov 89 206 20615 Oct 89 209 206 19 Nov 89 210 208
16 Oct 89 212 211 20 Nov 89 211 20817 Oct 89 214 211 21 Nov 89 212 21018 Oct 89 211 211 22 Nov 89 209 20919 Oct 89 212 210 23 Nov 89 207 20720 Oct 89 211 207 24 Nov 89 208 206
21 Oct 89 210 207 25 Nov 89 208 20522 Oct 89 209 208 26 Nov 89 205 20423 Oct 89 208 208 27 Nov 89 204 20424 Oct 89 212 211 28 Nov 89 206 20425 Oct 89 210 210 29 Nov 89 205 204
26 Oct 89 208 206 30 Nov 89 207 20527 Oct 89 208 207 1 Dec 89 208 20828 Oct 89 209 208 2 Dec 89 210 20829 Oct 89 209 207 3 Dec 89 211 20930 Oct 89 210 208 4 Dec 89 210 207
31 Oct 89 209 209 5 Dec 89 212 2111 Nov 89 209 207 6 Dec 89 212 2082 Nov 89 209 208 7 Dec 89 210 2083 Nov 89 209 208 8 Dec 89 207 2064 Nov 89 210 210 9 Dec 89 206 206
118
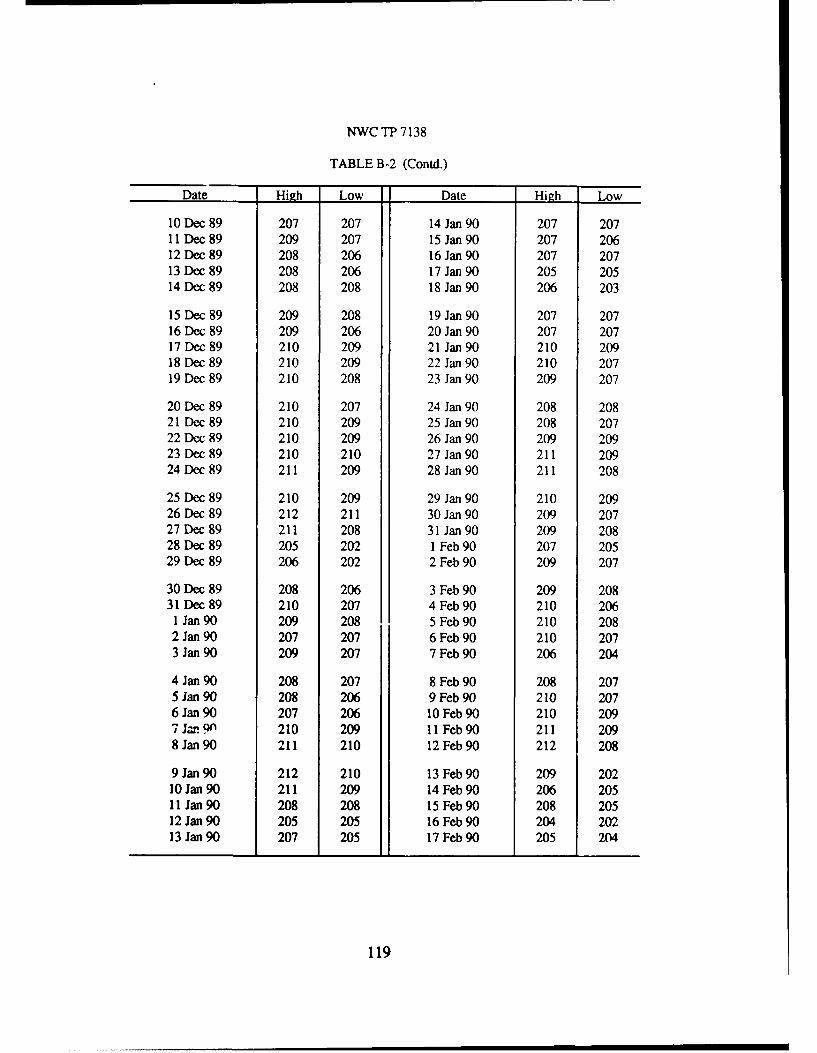
NWC TP 7138
TABLE B-2 (Contd.)
Date High Low Date High Low
10 Dec 89 207 207 14 Jan 90 207 20711 Dec 89 209 207 15 Jan 90 207 20612 Dec 89 208 206 16 Jan 90 207 20713 Dec 89 208 206 17 Jan 90 205 20514 Dec 89 208 208 18 Jan 90 206 203
15 Dec 89 209 208 19 Jan 90 207 20716 Dec 89 209 206 20 Jan 90 207 20717 Dec 89 210 209 21 Jan 90 210 20918 Dec 89 210 209 22 Jan 90 210 20719 Dec 89 210 208 23 Jan 90 209 207
20 Dec 89 210 207 24 Jan 90 208 20821 Dec 89 210 209 25 Jan 90 208 20722 Dec 89 210 209 26 Jan 90 209 20923 Dec 89 210 210 27 Jan 90 211 20924 Dec 89 211 209 28 Jan 90 211 208
25 Dec 89 210 209 29 Jan 90 210 20926 Dec 89 212 211 30 Jan 90 209 20727 Dec 89 211 208 31 Jan 90 209 20828 Dec 89 205 202 1 Feb 90 207 20529 Dec 89 206 202 2 Feb 90 209 207
30 Dec 89 208 206 3 Feb 90 209 20831 Dec 89 210 207 4 Feb 90 210 2061 Jan 90 209 208 5 Feb 90 210 2082 Jan 90 207 207 6 Feb 90 210 2073 Jan 90 209 207 7 Feb 90 206 204
4 Jan 90 208 207 8 Feb 90 208 2075 Jan 90 208 206 9 Feb 90 210 2076 Jan 90 207 206 10 Feb 90 210 2097 Jar 9) 210 209 11 Feb 90 211 2098 Jan 90 211 210 12 Feb 90 212 208
9 Jan 90 212 210 13 Feb 90 209 20210 Jan 90 211 209 14 Feb 90 206 20511 Jan 90 208 208 15 Feb 90 208 20512 Jan 90 205 205 16 Feb 90 204 20213 Jan 90 207 205 17 Feb 90 205 204
119

NWC TP 7138
TABLE B-2 (Contd.)
Date High Low Date Hijgh Low
18 Feb 90 207 204 25 Mar 90 212 21219 Feb 90 207 207 26 Mar 90 215 21320 Feb 90 209 208 27 Mar 90 214 21021 Feb 90 208 206 28 Mar 90 211 21022 Ieb 90 210 209 29 Mar 90 213 211
23 Feb 90 209 208 30 Mar 90 213 21224 Feb 90 209 209 31 Mar 90 212 20825 Feb 90 212 210 1 Apr 90 212 21026 Feb 90 212 210 2 Apr 90 213 21227 Feb 90 211 209 3 Apr 90 213 211
28 Feb 90 210 209 4 Apr 90 214 2121 Mar 90 210 209 5 Apr 90 211 2102 Mar 90 209 208 6 Apr 90 212 2113 Mar 90 208 207 7 Apr 90 213 2124 Mar 90 211 207 8 Apr 90 211 211
5 Mar 90 209 207 9 Apr 90 212 2096 Mar 90 213 208 10 Apr 90 213 2107 Mar 90 213 210 11 Apr 90 214 2118 Mar 90 213 210 12 Apr 90 213 2109 Mar 90 211 209 13 Apr 90 214 209
10 Mar 90 211 206 14 Apr 90 212 21011 Mar 90 211 208 15 Apr 90 212 21012 Mar 90 211 209 16 Apr 90 212 21013 Mar 90 213 211 17 Apr 90 212 20914 Mar 89 213 210 18 Apr90 211 208
15 Mar 90 215 214 19 Apr90 213 20916 Mar 90 216 214 20 Apr 90 214 21117 Mar 90 214 214 21 Apr90 213 21018 Mar 90 217 213 22 Apr 90 212 21019 Mar 90 216 213 23 Apr 90 206 206
20 Mar 90 217 213 24 Apr 90 207 20621 Mar 90 216 215 25 Apr 90 206 20622 Mar 90 214 214 26 Anr 90 207 20723 Mar 90 215 213 27 Apr90 208 20524 Mar 90 217 209 28 Apr 90 207 205
120
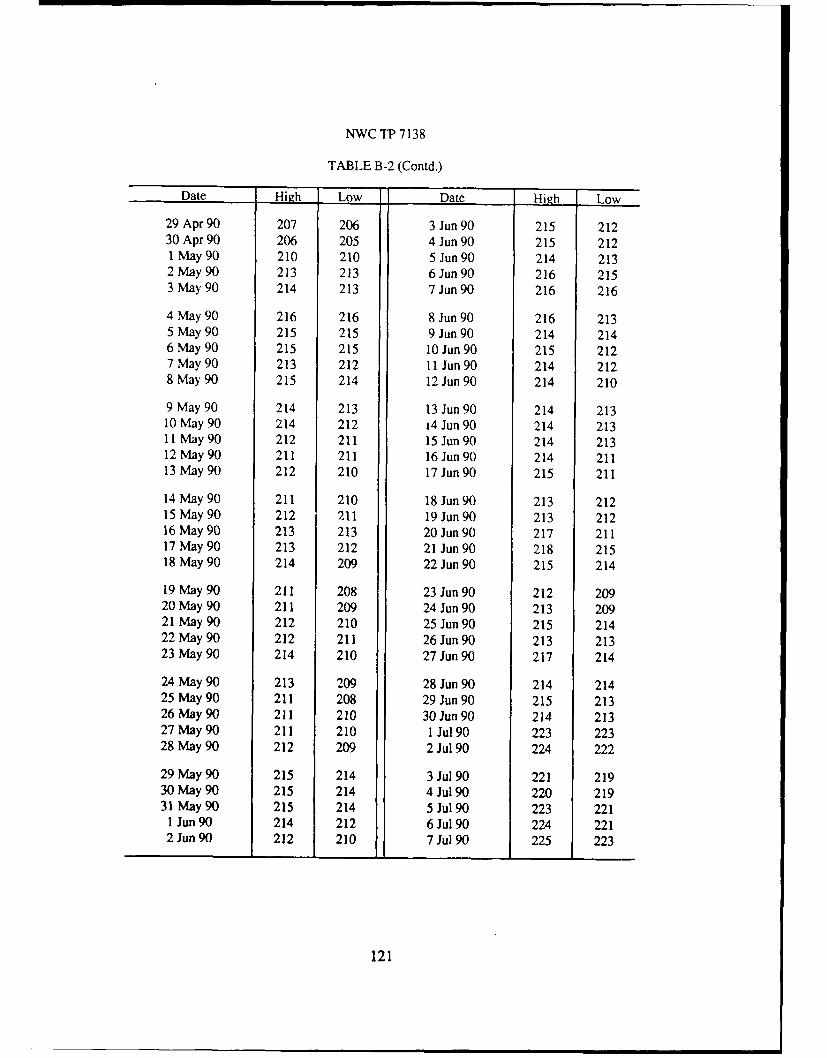
NWC TP 7138
TABLE B-2 (Contd.)
Date High Low Date High Low
29 Apr 90 207 206 3 Jun 90 215 21230 Apr 90 206 205 4 Jun 90 215 2121 May 90 210 210 5 Jun 90 214 2132 May 90 213 213 6 Jun 90 216 2153 May 90 214 213 7 Jun 90 216 216
4 May 90 216 216 8 Jun 90 216 2135 May 90 215 215 9 Jun 90 214 2146 May 90 215 215 10 Jun 90 215 2127 May 90 213 212 11 Jun 90 214 2128 May 90 215 214 12 Jun 90 214 210
9 May 90 214 213 13 Jun 90 214 21310 May 90 214 212 14 Jun 90 214 21311 May 90 212 211 15 Jun 90 214 21312 May 90 211 211 16 Jun 90 214 21113 May 90 212 210 17 Jun90 215 211
14 May 90 211 210 18 Jun 90 213 21215 May 90 212 211 19 Jun 90 213 21216 May 90 213 213 20 Jun 90 217 21117 May 90 213 212 21 Jun 90 218 21518 May 90 214 209 22 Jun 90 215 214
19 May 90 211 208 23 Jun 90 212 20920 May 90 211 209 24 Jun 90 213 20921 May 90 212 210 25 Jun 90 215 21422 May 90 212 211 26 Jun 90 213 21323 May 90 214 210 27 Jun 90 217 214
24 May 90 213 209 28 Jun 90 214 21425 May 90 211 208 29 Jun 90 215 21326 May 90 211 210 30 Jun 90 214 21327 May 90 211 210 1 Jul 90 223 22328 May 90 212 209 2 Jul 90 224 222
29 May 90 215 214 3 Jul 90 221 21930 May 90 215 214 4 Jul 90 220 21931 May 90 215 214 5 Jul90 223 2211 Jun 90 214 212 6 Jul 90 224 2212 Jun 90 212 210 7 Jul 90 225 223
121
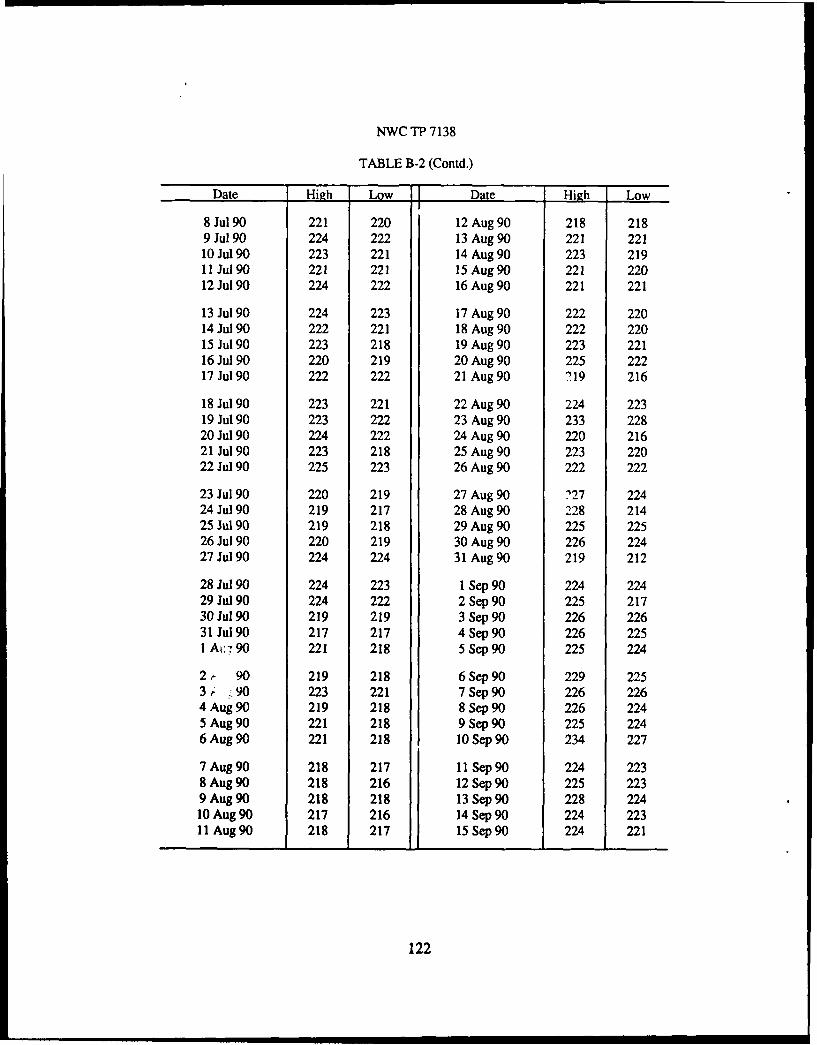
NWC TP 7138
TABLE B-2 (Contd.)
Date High Low I Date High Low
8 Jul90 221 220 12 Aug 90 218 2189 Jul 90 224 222 13 Aug 90 221 22110 Jul90 223 221 14 Aug 90 223 21911 Jul 90 221 221 15 Aug 90 221 22012 Jul 90 224 222 16 Aug 90 221 221
13 Jul90 224 223 17 Aug 90 222 22014 Jul 90 222 221 18 Aug 90 222 22015 Jul90 223 218 19 Aug 90 223 22116 Jul 90 220 219 20 Aug 90 225 22217 Jul 90 222 222 21 Aug 90 219 216
18 Jul90 223 221 22 Aug 90 224 22319 Jul 90 223 222 23 Aug 90 233 22820 Jul 90 224 222 24 Aug 90 220 21621 Jul 90 223 218 25 Aug 90 223 22022 Jul 90 225 223 26 Aug 90 222 222
23 Jul 90 220 219 27 Aug 90 127 22424 Jul 90 219 217 28 Aug 90 228 21425 Jul90 219 218 29 Aug 90 225 22526 Jul 90 220 219 30 Aug 90 226 22427 Jul90 224 224 31 Aug 90 219 212
28 Jul 90 224 223 1 Sep 90 224 22429 Jul90 224 222 2 Sep 90 225 21730 Jul 90 219 219 3 Sep 90 226 22631 Jul90 217 217 4 Sep 90 226 2251 At:-. 90 221 218 5 Sep 90 225 224
2,- 90 219 218 6 Sep 90 229 22531, :.90 223 221 7 Sep 90 226 2264 Aug 90 219 218 8 Sep 90 226 2245 Aug 90 221 218 9 Sep 90 225 2246 Aug 90 221 218 10 Sep 90 234 227
7 Aug 90 218 217 11 Sep 9 0 224 2238 Aug 90 218 216 12 Sep 90 225 2239 Aug 90 218 218 13 Sep 90 228 22410 Aug 90 217 216 14 Sep 9 0 224 22311 Aug90 218 217 15 Sep90 224 221
122
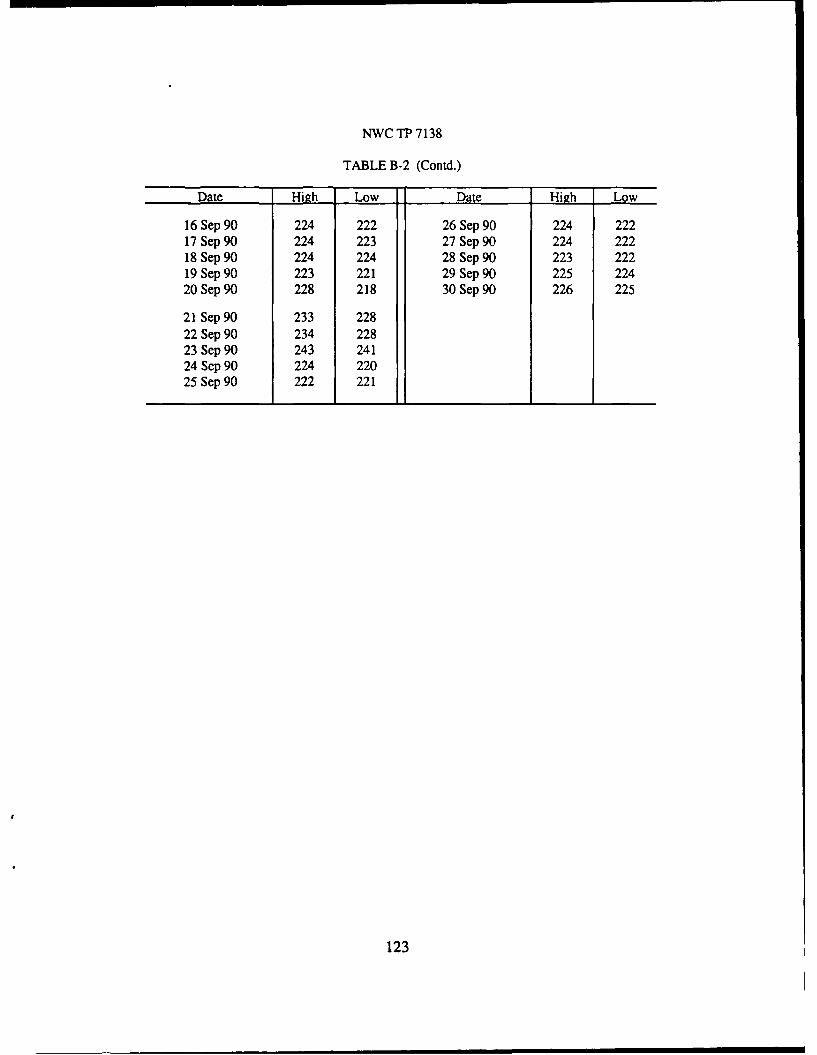
NWC TP 7138
TABLE B-2 (Contd.)
Date High Low Date High Low
16 Sep 90 224 222 26 Sep 90 224 22217 Sep 90 224 223 27 Sep 90 224 22218 Sep 90 224 224 28 Sep 90 223 22219 Sep 90 223 221 29 Sep 90 225 22420 Sep 90 228 218 30 Sep 90 226 225
21 Sep 90 233 22822 Sep 90 234 22823 Sep 90 243 24124 Sep 90 224 22025 Sep 90 222 221
123
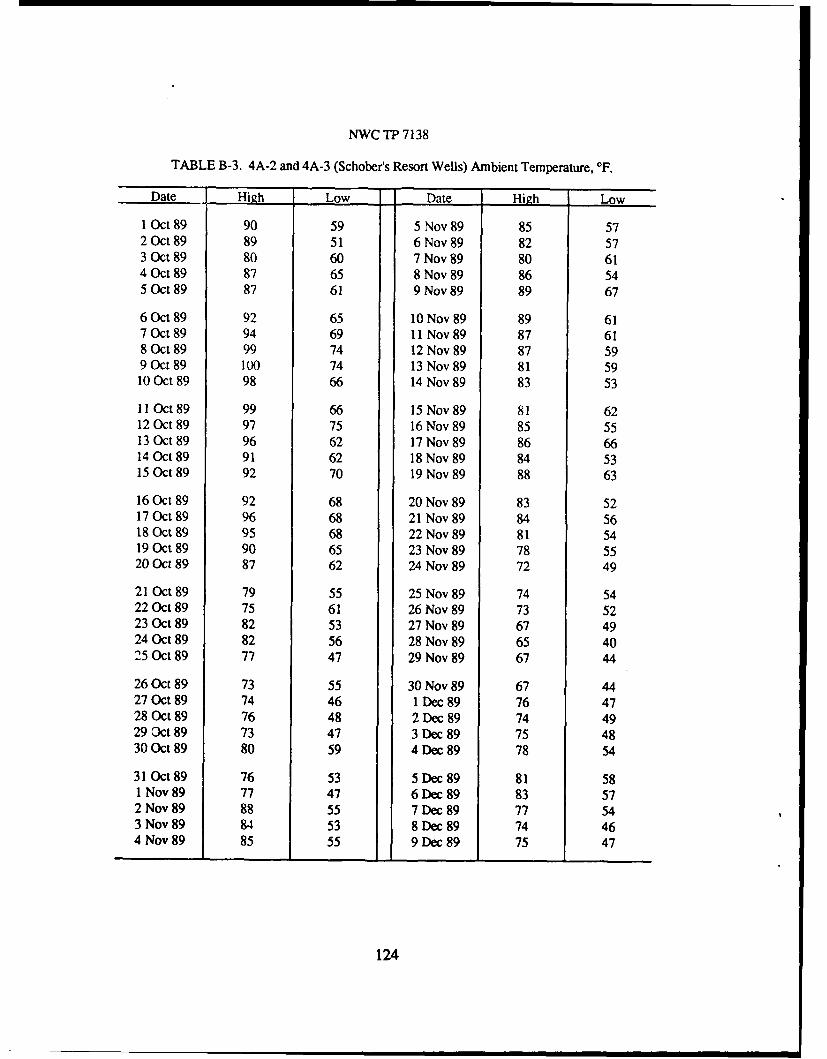
NWC TP 7138
TABLE B-3. 4A-2 and 4A-3 (Schober's Resort Wells) Ambient Temperature, OF,
Date High Low Date High Low
1 Oct 89 90 59 5 Nov 89 85 572 Oct 89 89 51 6 Nov 89 82 573 Oct 89 80 60 7 Nov 89 80 614 Oct 89 87 65 8 Nov 89 86 545 Oct 89 87 61 9 Nov 89 89 67
6 Oct 89 92 65 10 Nov 89 89 617 Oct 89 94 69 11 Nov 89 87 618 Oct 89 99 74 12 Nov 89 87 599 Oct 89 100 74 13 Nov 89 81 5910 Oct 89 98 66 14 Nov 89 83 53
11 Oct 89 99 66 15 Nov 89 81 6212 Oct 89 97 75 16 Nov 89 85 5513 Oct 89 96 62 17 Nov 89 86 6614 Oct 89 91 62 18 Nov 89 84 5315 Oct 89 92 70 19 Nov 89 88 63
16 Oct 89 92 68 20 Nov 89 83 5217 Oct 89 96 68 21 Nov 89 84 5618 Oct 89 95 68 22 Nov 89 81 5419 Oct 89 90 65 23 Nov 89 78 5520 Oct 89 87 62 24 Nov 89 72 49
21 Oct 89 79 55 25 Nov 89 74 5422 Oct89 75 61 26 Nov 89 73 5223 Oct89 82 53 27 Nov 89 67 4924 Oct 89 82 56 28 Nov 89 65 4025 Oct 89 77 47 29 Nov 89 67 44
26 Oct89 73 55 30 Nov 89 67 4427 Oct 89 74 46 1 Dec 89 76 4728 Oct 89 76 48 2 Dec 89 74 4929 Oct 89 73 47 3 Dec 89 75 4830 Oct 89 80 59 4 Dec 89 78 54
31 Oct 89 76 53 5 Dec 89 81 581 Nov 89 77 47 6 Dec 89 83 572 Nov 89 88 55 7 Dec 89 77 543 Nov 89 84 53 8 Dec 89 74 464 Nov 89 85 55 9 Dec 89 75 47
124

NWC TP 7138
TABLE B-3 (Contd.)
Date High Low Date High Low
10 Dec 89 69 49 14 Jan 90 65 4511 Dec 89 63 40 15 Jan 90 61 4112 Dec 89 65 44 16 Jan 90 56 4913 Dec 89 71 45 17 Jan 90 54 4414 Dec 89 70 47 18 Jan 90 58 48
15 Dec 89 76 44 19 Jan 90 58 3416 Dec 89 71 43 20 Jan 90 60 3717 Dec 89 70 46 21 Jan 90 70 3518 Dec 89 70 42 22 Jan 90 73 4319 Dec 89 69 42 23 Jan 90 69 49
20 Dec 89 71 44 24 Jan 90 69 5021 Dec 89 71 44 25 Jan 90 76 4122 Dec 89 75 45 26 Jan 90 64 4523 Dec 89 82 50 27 Jan 90 66 3524 Dec 89 75 48 28 Jan 90 73 43
25 Dec 89 75 56 29 Jan 90 73 4626 Dec 89 72 51 30 Jan 90 69 4327 Dec 89 76 42 31 Jan 90 67 4428 Dec 89 61 47 1 Feb 90 64 4429 Dec 89 75 59 2 Feb 90 69 44
30 Dec 89 73 45 3 Feb 90 64 4431 Dec 89 70 50 4 Feb 90 56 421 Jan 90 63 50 5 Feb 90 65 422 Jan 90 61 39 6 Feb 90 64 443 Jan 90 59 38 7 Feb 90 65 30
4 Jan 90 61 43 8 Feb 90 59 395 Jan 90 67 43 9 Feb 90 66 426 Jan 90 68 46 10 Feb 90 76 627 Jan 90 66 46 11 Feb 90 70 538 Jan 90 72 55 12 Feb 90 85 58
9 Jan 90 81 51 13 Feb 90 72 4510 Jan 90 82 54 14 Feb 90 47 2711 Jan 90 78 53 15 Feb 90 50 3012 Jan 90 69 52 16 Feb 90 58 4113 Jan 90 60 46 17 Feb 90 56 44
125
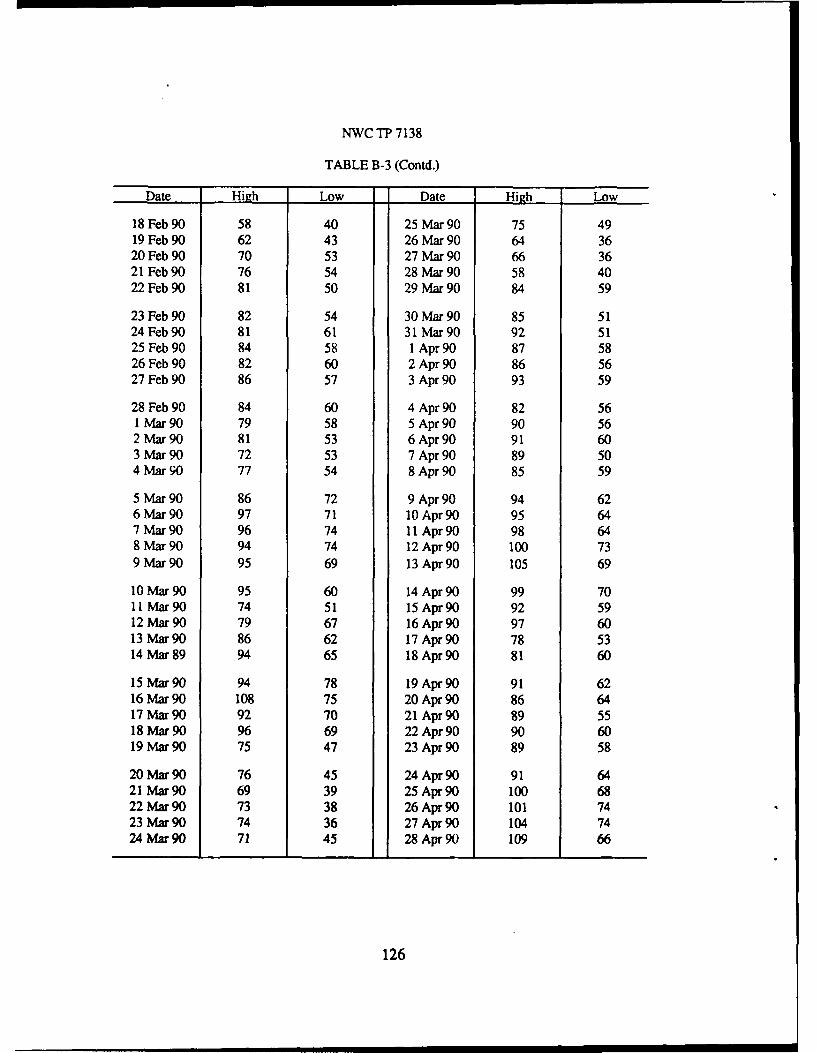
NWC TP 7138
TABLE B-3 (Contd.)
Date High Low Date High Low
18 Feb 90 58 40 25 Mar 90 75 4919 Feb 90 62 43 26 Mar 90 64 3620 Feb 90 70 53 27 Mar 90 66 3621 Feb 90 76 54 28 Mar 90 58 4022 Feb 90 81 50 29 Mar 90 84 59
23 Feb 90 82 54 30 Mar 90 85 5124 Feb 90 81 61 31 Mar 90 92 5125 Feb 90 84 58 1 Apr 90 87 5826 Feb 90 82 60 2 Apr 90 86 5627 Feb 90 86 57 3 Apr 90 93 59
28 Feb 90 84 60 4 Apr 90 82 561 Mar 90 79 58 5 Apr 90 90 562 Mar 90 81 53 6 Apr 90 91 603 Mar 90 72 53 7 Apr 90 89 504 Mar 90 77 54 8 Apr 90 85 59
5 Mar 90 86 72 9 Apr 90 94 626 Mar 90 97 71 10 Apr 90 95 647 Mar 90 96 74 11 Apr 90 98 648 Mar 90 94 74 12 Apr 90 100 739 Mar 90 95 69 13 Apr 90 105 69
10 Mar 90 95 60 14 Apr 90 99 7011 Mar 90 74 51 15 Apr90 92 5912 Mar 90 79 67 16 Apr 90 97 6013 Mar 90 86 62 17 Apr 90 78 5314 Mar 89 94 65 18 Apr 90 81 60
15 Mar 90 94 78 19 Apr 90 91 6216 Mar 90 108 75 20 Apr 90 86 6417 Mar 90 92 70 21 Apr 90 89 5518 Mar 90 96 69 22 Apr 90 90 6019 Mar 90 75 47 23 Apr 90 89 58
20 Mar 90 76 45 24 Apr 90 91 6421 Mar90 69 39 25 Apr90 100 6822 Mar 90 73 38 26 Apr 90 101 7423 Mar 90 74 36 27 Apr 90 104 7424 Mar 90 71 45 28 Apr 90 109 66
126
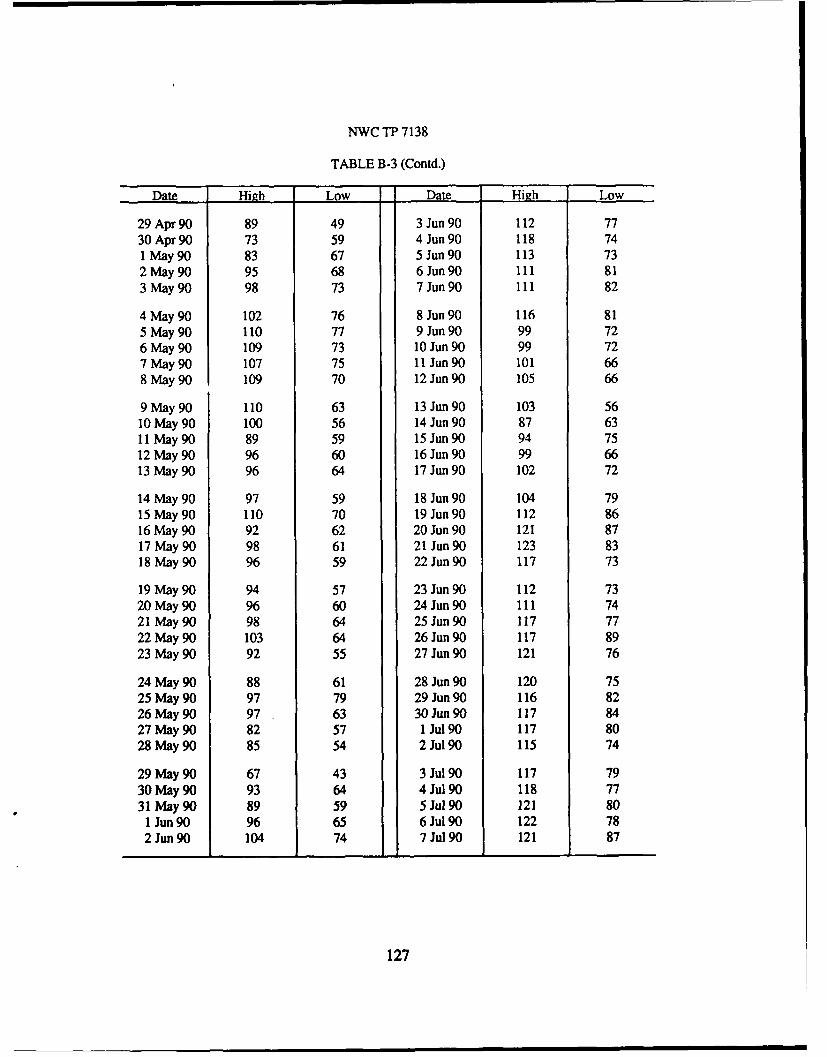
NWC TP 7138
TABLE B-3 (Contd.)
Date High Low Date High Low
29 Apr 90 89 49 3 Jun 90 112 7730 Apr 90 73 59 4 Jun 90 118 741 May 90 83 67 5 Jun 90 113 732 May 90 95 68 6 Jun 90 111 813 May 90 98 73 7 Jun 90 111 82
4 May 90 102 76 8 Jun 90 116 815 May 90 110 77 9 Jun 90 99 726 May 90 109 73 10 Jun 90 99 727 May 90 107 75 11 Jun 90 101 668 May 90 109 70 12 Jun 90 105 66
9 May 90 110 63 13 Jun 90 103 5610 May 90 100 56 14 Jun 90 87 6311 May 90 89 59 15 Jun 90 94 7512 May 90 96 60 16 Jun 90 99 6613 May 90 96 64 17 Jun 90 102 72
14 May 90 97 59 18 Jun 90 104 7915 May 90 110 70 19 Jun 90 112 86
16 May 90 92 62 20 Jun 90 121 8717 May 90 98 61 21 Jun 90 123 8318 May 90 96 59 22 Jun 90 117 73
19 May 90 94 57 23 Jun 90 112 7320 May 90 96 60 24 Jun 90 111 7421 May 90 98 64 25 Jun 90 117 7722 May 90 103 64 26 Jun 90 117 8923 May 90 92 55 27 Jun 90 121 76
24 May 90 88 61 28 Jun 90 120 7525 May 90 97 79 29 Jun 90 116 8226 May 90 97 63 30 Jun 90 117 8427 May 90 82 57 1 Jul90 117 8028 May 90 85 54 2 Jul90 115 74
29 May 90 67 43 3 Jul90 117 7930 May 90 93 64 4 Jul90 118 7731 May 90 89 59 5 Jul 90 121 801 Jun 90 96 65 6 Jul90 122 782 Jun 90 104 74 7 Jul90 121 87
127
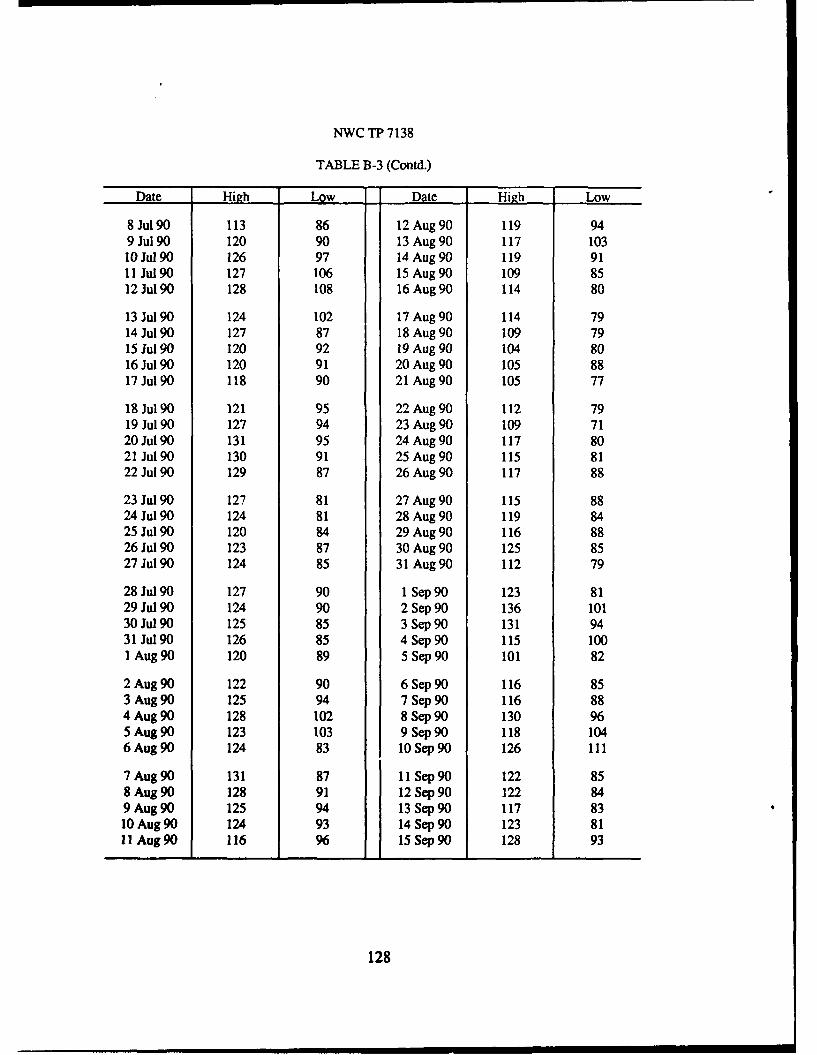
NWC TP 7138
TABLE B-3 (Contd.)
Date High Low Date High Low
8 Jul90 113 86 12 Aug 90 119 949 Jul90 120 90 13 Aug 90 117 10310 Jul 90 126 97 14 Aug 90 119 9111 Jul90 127 106 15 Aug 90 109 8512 Jul90 128 108 16 Aug 90 114 80
13 Jul90 124 102 17 Aug 90 114 7914 Jul90 127 87 18 Aug 90 109 7915 Jul90 120 92 19 Aug 90 104 8016 Jul90 120 91 20 Aug 90 105 8817 Jul 90 118 90 21 Aug 90 105 77
18 Jul90 121 95 22 Aug 90 112 7919 Jul90 127 94 23 Aug 90 109 7120 Jul90 131 95 24 Aug 90 117 8021 Jul90 130 91 25 Aug 90 115 8122 Jul90 129 87 26 Aug 90 117 88
23 Jul 90 127 81 27 Aug 90 115 8824 Jul 90 124 81 28 Aug 90 119 8425 Jul 90 120 84 29 Aug 90 116 8826 Jul 90 123 87 30 Aug 90 125 8527 Jul 90 124 85 31 Aug 90 112 79
28 Jul 90 127 90 1 Sep 90 123 8129 Jul 90 124 90 2 Sep 90 136 10130 Jul90 125 85 3 Sep 90 131 9431 Jul90 126 85 4 Sep 90 115 1001 Aug 90 120 89 5 Sep 90 101 82
2 Aug 90 122 90 6 Sep 90 116 853 Aug 90 125 94 7 Sep 90 116 884 Aug 90 128 102 8 Sep 90 130 965 Aug 90 123 103 9 Sep 90 118 1046 Aug 90 124 83 10 Sep 9 0 126 111
7 Aug 90 131 87 11 Sep 9 0 122 858 Aug 90 128 91 12 Sep 90 122 849 Aug 90 125 94 13 Sep 90 117 8310 Aug 90 124 93 14 Sep 90 123 8111 Aug 90 116 96 15 Sep 9 0 128 93
128
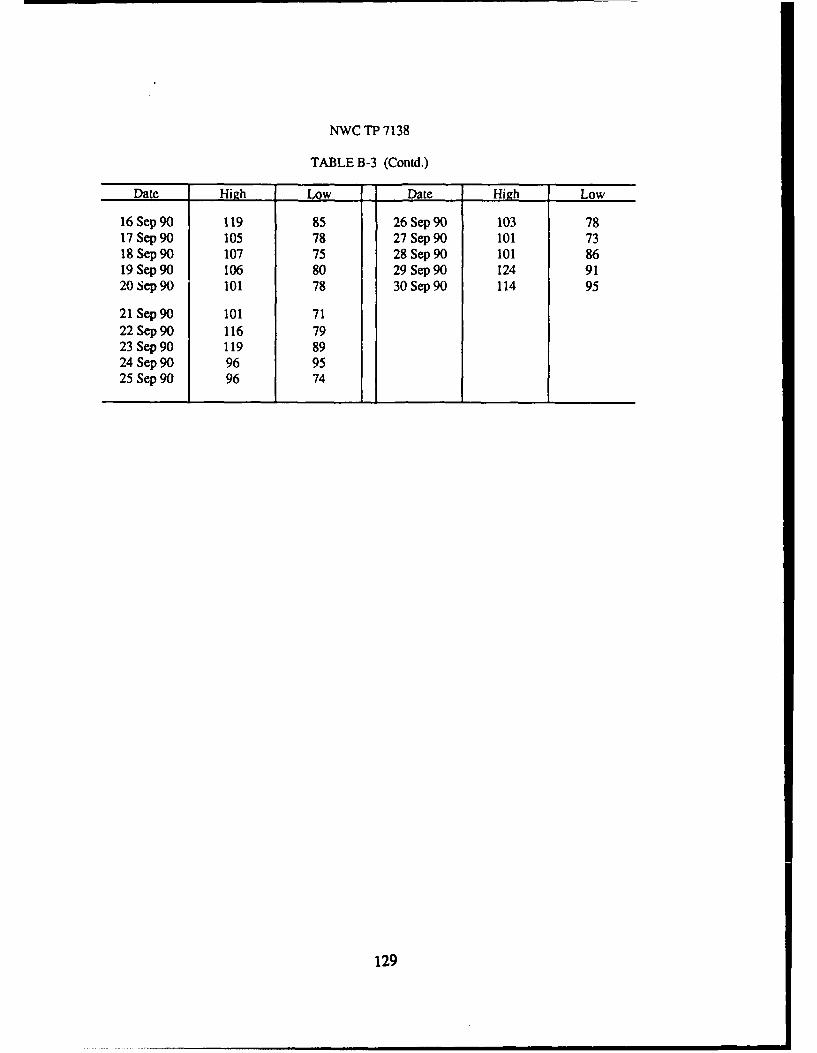
NWC TP 7138
TABLE B-3 (Contd.)
Date High Low Date High Low
16 Sep 90 119 85 26 Sep 90 103 7817 Sep 90 105 78 27 Sep 90 101 7318 Sep 90 107 75 28 Sep 90 101 8619 Sep 90 106 80 29 Sep 90 124 9120 Sep 90 101 78 30 Sep 90 114 95
21 Sep 90 101 7122 Sep 90 116 7923 Sep 90 119 8924 Sep 90 96 9525 Sep 90 96 74
129
NWC TP 7138
Appendix C
WELL TEMPERATURE DATA
131

NWC TP 7138
TABLE C-1. 4H-8 (Coso Well No. 1) Temperatures, 'F.
25 October 1989 30 October 1989
Depth, ft Temp *F Depth, ft Temp *F Depth, ft Temp *F Depth, ft Temp 0F
0 203.36 270 213.44 0 202.10 152 221.1830 203.36 275 216.68 5 204.44 153 221.3635 203.72 280 217.94 10 204.62 155 221.5450 204.08 285 226.76 23 204.80 156 221.90125 204.26 290 229.64 75 204.98 158 222.98
130 204.44 295 234.86 110 205.16 160 223.70135 204.80 300 239.36 112 205.34 161 224.60140 205.34 305 244.76 115 205.52 162 225.14145 206.96 310 248.36 116 205.70 163 226.40150 202.12 315 252.14 118 206.06 164 227.48
152 210.20 320 253.40 120 206.60 165 229.10155 212.18 325 257.36 121 207.50 166 229.46160 214.70 330 260.78 123 208.22 167 229.64165 215.60 335 263.12 125 208.40 168 230.54170 218.30 340 263.84 126 209.30 169 231.08
175 219.02 344 264.02 129 209.66 171 231.62180 219.02 348 264.02 130 210.02 172 232.16185 220.82 350 264.20 131 210.56 173 232.54187 221.72 357 264.20 133 210.92 174 233.24190 223.70 134 211.28 175 233.96
195 224.06 135 212.36 176 234.14200 224.06 136 213.08 177 234.68205 223.34 137 213.26 178 235.22210 222.26 138 214.34 179 235.58215 220.64 139 214.88 180 236.48
220 217.76 140 215.42 181 236.66225 216.68 141 216.14 182 236.84230 215.60 143 216.32 183 237.02235 212.90 145 216.68 184 237.20240 211.28 146 217.04 185 237.38
245 210.74 147 21 40 186 237.34250 210.74 148 21$.40 187 237.92255 210.20 149 217.58 189 238.10260 211.10 150 218.48 190 238.46265 211.64 151 219.74 191 238.64
132
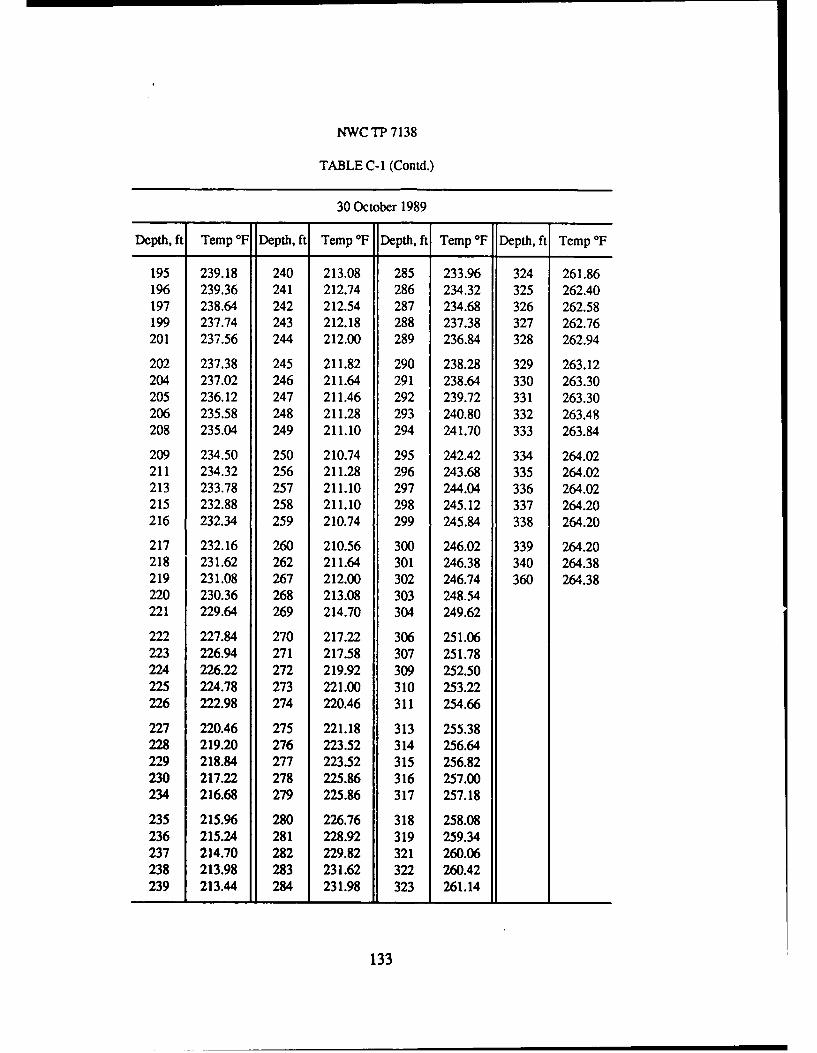
NWC TP 7138
TABLE C-1 (Contd.)
30 October 1989
Depth, ft Temp OF Depth, ft Temp OF Depth, ft Temp OF Depth, ft Temp OF
195 239.18 240 213.08 285 233.96 324 261.86196 239.36 241 212.74 286 234.32 325 262.40197 238.64 242 212.54 287 234.68 326 262.58199 237.74 243 212.18 288 237.38 327 262.76201 237.56 244 212.00 289 236.84 328 262.94
202 237.38 245 211.82 290 238.28 329 263.12204 237.02 246 211.64 291 238.64 330 263.30205 236.12 247 211.46 292 239.72 331 263.30206 235.58 248 211.28 293 240.80 332 263.48208 235.04 249 211.10 294 241.70 333 263.84
209 234.50 250 210.74 295 242.42 334 264.02211 234.32 256 211.28 296 243.68 335 264.02213 233.78 257 211.10 297 244.04 336 264.02215 232.88 258 211.10 298 245.12 337 264.20216 232.34 259 210.74 299 245.84 338 264.20
217 232.16 260 210.56 300 246.02 339 264.20218 231.62 262 211.64 301 246.38 340 264.38219 231.08 267 212.00 302 246.74 360 264.38220 230.36 268 213.08 303 248.54221 229.64 269 214.70 304 249.62
222 227.84 270 217.22 306 251.06223 226.94 271 217.58 307 251.78224 226.22 272 219.92 309 252.50225 224.78 273 221.00 310 253.22226 222.98 274 220.46 311 254.66
227 220.46 275 221.18 313 255.38228 219.20 276 223.52 314 256.64229 218.84 277 223.52 315 256.82230 217.22 278 225.86 316 257.00234 216.68 279 225.86 317 257.18
235 215.96 280 226.76 318 258.08236 215.24 281 228.92 319 259.34237 214.70 282 229.82 321 260.06238 213.98 283 231.62 322 260.42239 213.44 284 231.98 323 261.14
133
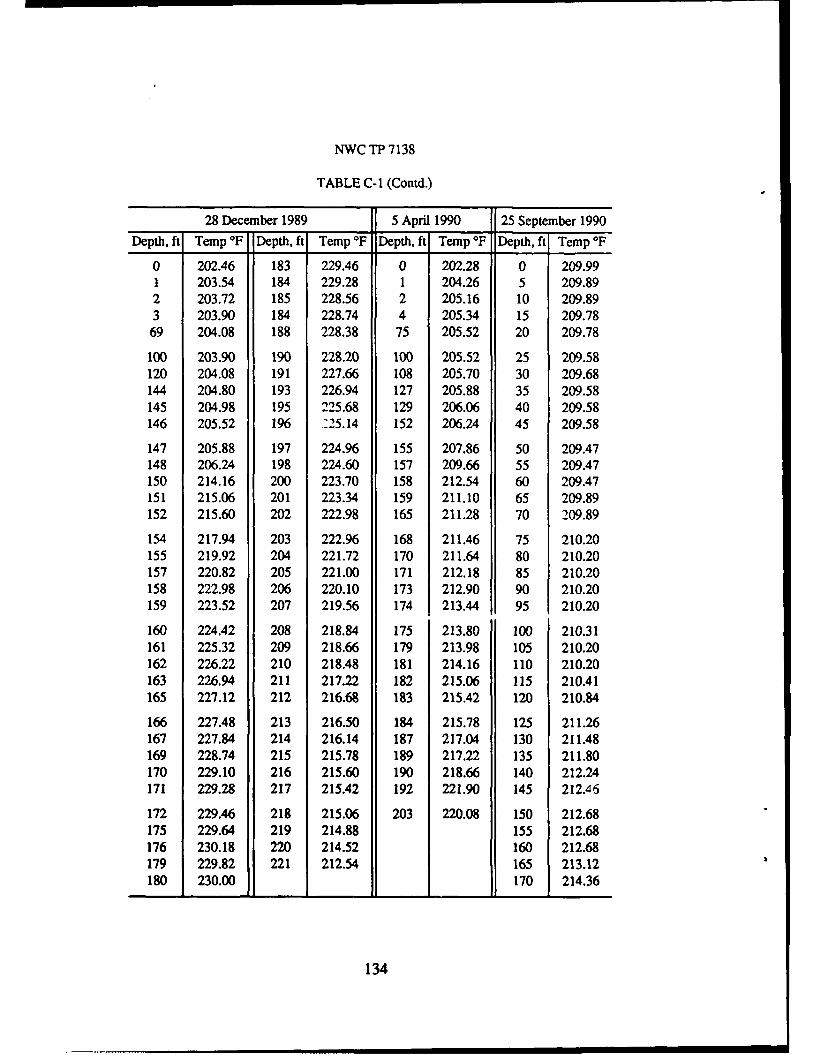
NWC TP 7138
TABLE C-I (Contd.)
28 December 1989 5 April 1990 25 September 1990Depth, ft Temp OF Depth, ft Temp OF Depth, ft Temp *F Depth, ft Temp OF
0 202.46 183 229.46 0 202.28 0 209.991 203.54 184 229.28 1 204.26 5 209.892 203.72 185 228.56 2 205.16 10 209.893 203.90 184 228.74 4 205.34 15 209.7869 204.08 188 228.38 75 205.52 20 209.78
100 203.90 190 228.20 100 205.52 25 209.58120 204.08 191 227.66 108 205.70 30 209.68144 204.80 193 226.94 127 205.88 35 209.58145 204.98 195 225.68 129 206.06 40 209.58146 205.52 196 -25.14 152 206.24 45 209.58
147 205.88 197 224.96 155 207.86 50 209.47148 206.24 198 224.60 157 209.66 55 209.47150 214.16 200 223.70 158 212.54 60 209.47151 215.06 201 223.34 159 211.10 65 209.89152 215.60 202 222.98 165 211.28 70 209.89
154 217.94 203 222.96 168 211.46 75 210.20155 219.92 204 221.72 170 211.64 80 210.20157 220.82 205 221.00 171 212.18 85 210.20158 222.98 206 220.10 173 212.90 90 210.20159 223.52 207 219.56 174 213.44 95 210.20
160 224.42 208 218.84 175 213.80 100 210.31161 225.32 209 218.66 179 213.98 105 210.20162 226.22 210 218.48 181 214.16 110 210.20163 226.94 211 217.22 182 215.06 115 210.41165 227.12 212 216.68 183 215.42 120 210.84
166 227.48 213 216.50 184 215.78 125 211.26167 227.84 214 216.14 187 217.04 130 211.48169 228.74 215 215.78 189 217.22 135 211.80170 229.10 216 215.60 190 218.66 140 212.24171 229.28 217 215.42 192 221.90 145 212.46
172 229.46 218 215.06 203 220.08 150 212.68175 229.64 219 214.88 155 212.68176 230.18 220 214.52 160 212.68179 229.82 221 212.54 165 213.12180 230.00 170 214.36
134
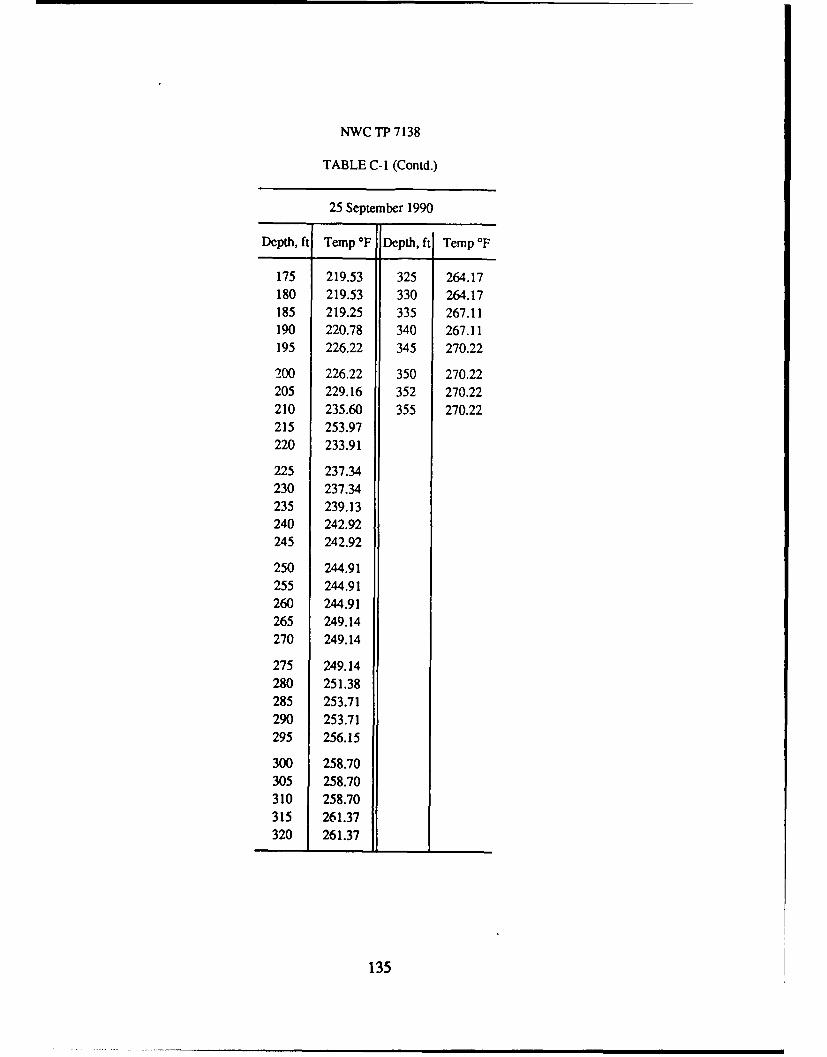
NWC TP 7138
TABLE C-I (Contd.)
25 September 1990
Depth, ft Temp OF Depth, ft Temp 0F
175 219.53 325 264.17180 219.53 330 264.17185 219.25 335 267.11190 220.78 340 267.11195 226.22 345 270.22
200 226.22 350 270.22205 229.16 352 270.22210 235.60 355 270.22215 253.97220 233.91
225 237.34230 237.34235 239.13240 242.92245 242.92
250 244.91255 244.91260 244.91265 249.14270 249.14
275 249.14280 251.38285 253.71290 253.71295 256.15
300 258.70305 258.70310 258.70315 261.37320 261.37
135
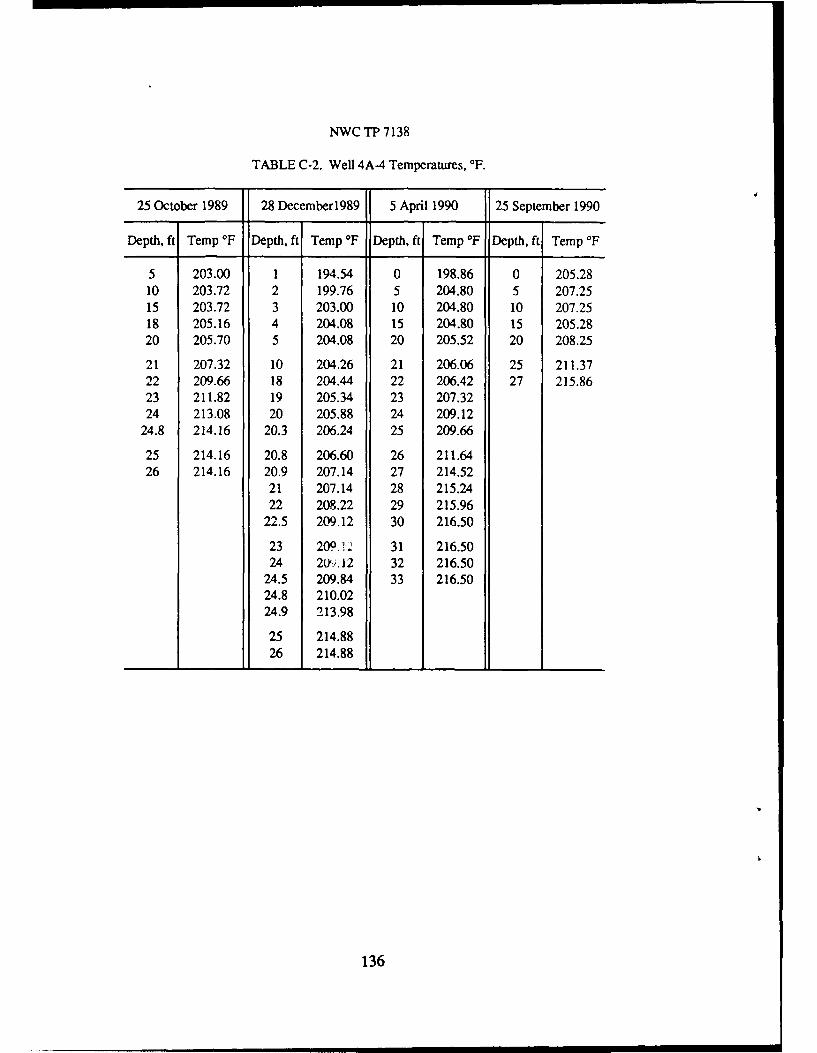
NWC TP 7138
TABLE C-2. Well 4A-4 Temperatures, "F.
25 October 1989 28 December1989 5 April 1990 25 September 1990
Depth, ft Temp *F Depth, ft Temp 'F Depth, ft Temp 'F Depth, ft Temp 'F
5 203.00 1 194.54 0 198.86 0 205.2810 203.72 2 199.76 5 204.80 5 207.2515 203.72 3 203.00 10 204.80 10 207.2518 205.16 4 204.08 15 204.80 15 205.2820 205.70 5 204.08 20 205.52 20 208.25
21 207.32 10 204.26 21 206.06 25 211.3722 209.66 18 204.44 22 206.42 27 215.8623 211.82 19 205.34 23 207.3224 213.08 20 205.88 24 209.12
24.8 214.16 20.3 206.24 25 209.66
25 214.16 20.8 206.60 26 211.6426 214.16 20.9 207.14 27 214.52
21 207.14 28 215.2422 208.22 29 215.96
22.5 209.12 30 216.50
23 209. 22 31 216.5024 2'i. 12 32 216.50
24.5 209.84 33 216.5024.8 210.0224.9 213.98
25 214.8826 214.88
136
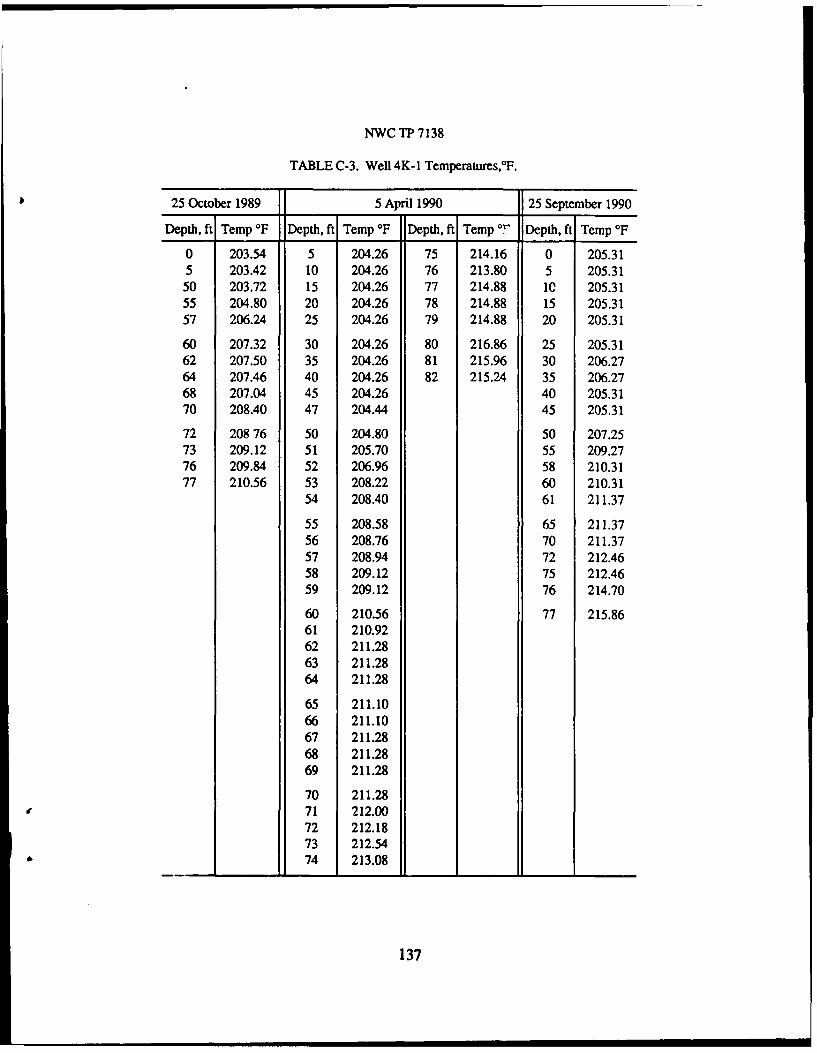
NWC TP 7138
TABLE C-3. Well 4K-I Temperatures, 0F.
25 October 1989 5 April 1990 25 September 1990
Depth, ft Temp OF Depth, ft Temp OF Depth, ft Temp °- Depth, ft Temp OF
0 203.54 5 204.26 75 214.16 0 205.315 203.42 10 204.26 76 213.80 5 205.3150 203.72 15 204.26 77 214.88 IC 205.3155 204.80 20 204.26 78 214.88 15 205.3157 206.24 25 204.26 79 214.88 20 205.31
60 207.32 30 204.26 80 216.86 25 205.3162 207.50 35 204.26 81 215.96 30 206.2764 207.46 40 204.26 82 215.24 35 206.2768 207.04 45 204.26 40 205.3170 208.40 47 204.44 45 205.31
72 208 76 50 204.80 50 207.2573 209.12 51 205.70 55 209.2776 209.84 52 206.96 58 210.3177 210.56 53 208.22 60 210.31
54 208.40 61 211.37
55 208.58 65 211.3756 208.76 70 211.3757 208.94 72 212.4658 209.12 75 212.4659 209.12 76 214.70
60 210.56 77 215.8661 210.9262 211.2863 211.2864 211.28
65 211.1066 211.1067 211.2868 211.2869 211.28
70 211.2871 212.0072 212.1873 212.5474 213.08
137
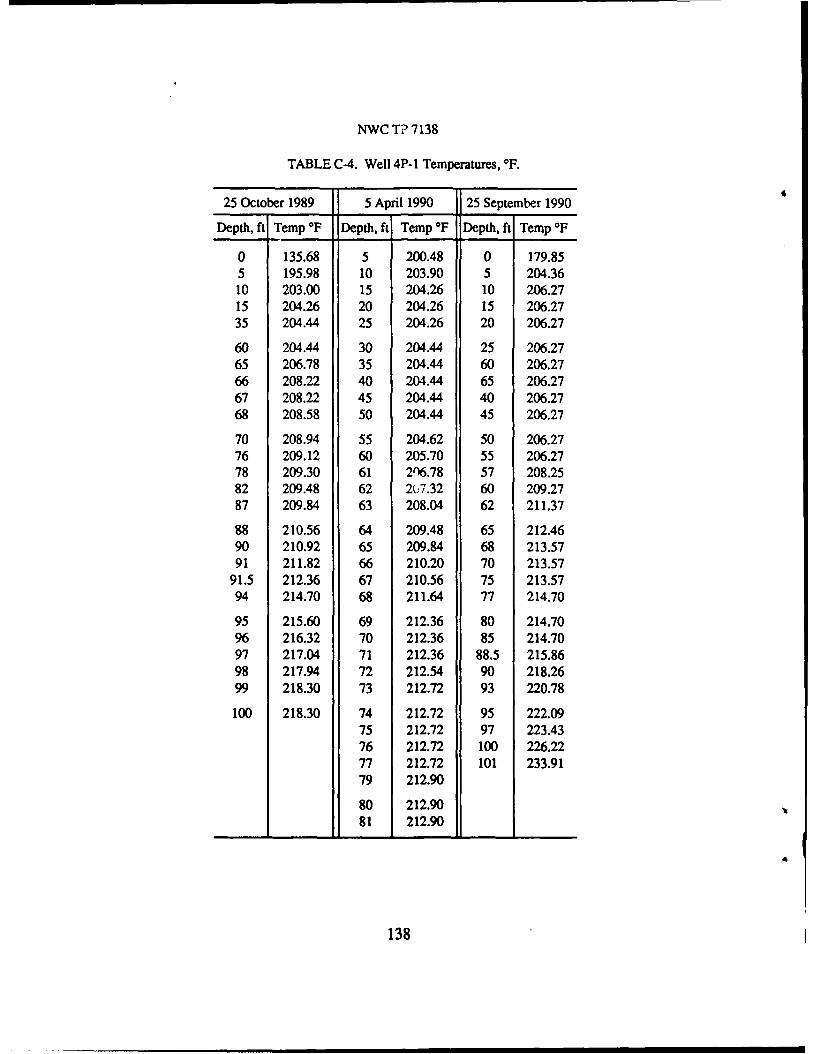
NWC T? 7138
TABLE C-4. Well 4P-1 Temperatures, OF.
25 October 1989 5 April 1990 25 September 1990
Depth, ft Temp OF Depth, ft Temp 0F Depth, ft Temp OF
0 135.68 5 200.48 0 179.855 195.98 10 203.90 5 204.3610 203.00 15 204.26 10 206.2715 204.26 20 204.26 15 206.2735 204.44 25 204.26 20 206.27
60 204.44 30 204.44 25 206.2765 206.78 35 204.44 60 206.2766 208.22 40 204.44 65 206.2767 208.22 45 204.44 40 206.2768 208.58 50 204.44 45 206.27
70 208.94 55 204.62 50 206.2776 209.12 60 205.70 55 206.2778 209.30 61 206.78 57 208.2582 209.48 62 267.32 60 209.2787 209.84 63 208.04 62 211.37
88 210.56 64 209.48 65 212.4690 210.92 65 209.84 68 213.5791 211.82 66 210.20 70 213.57
91.5 212.36 67 210.56 75 213.5794 214.70 68 211.64 77 214.70
95 215.60 69 212.36 80 214.7096 216.32 70 212.36 85 214.7097 217.04 71 212.36 88.5 215.8698 217.94 72 212.54 90 218.2699 218.30 73 212.72 93 220.78
100 218.30 74 212.72 95 222.0975 212.72 97 223.4376 212.72 100 226.2277 212.72 101 233.9179 212.90
80 212.9081 212.90
138
niTI DISnIlEfMO
2 Chief of Naval OperationsOP-413F (1)OP-45 (1)
2 Chief of Naval Research, Arlington (OCNR-126)5 Naval Facilities Engineering Command, Alexandria
FAC-03 (1)FAC-09B (1)FAC-165 (1)FAC-1651 (1)FAC-1653A (1)
1 Naval Facilities Engineering Com-and, Atlantic Division, Norfolk (Utilities Division)I Naval Facilities Engineering Command, Northern Division, Philadelphia (UtilitiesDivision)
1 Naval Facilities Engineering Command, Pacific Division, Pearl Harbor (UtilitiesDivision)
1 Naval Facilities Engineering Command, Southern Division, Charleston (UtilitiesDivision)
5 Naw.1 Facilities Engineering Command, Western Division, San BrunoCode 09B (1)Code 09C (1)Code 16 (1)Code 163 (1)Code 24 (1)
4 Naval Sea Systems CommandSEA-O5H7 (1)SEA-070C (1)Technical Library (2)
3 Space and Naval Warfare Systems Command (SPAWAR-005)1 Commander in Chief, U. S. Pacific Fleet, Pearl Harbor (Code 325)1 Headquarters, U. S. Marine Corps (LFF-2)1 Commander, Third Fleet, Pearl Harbor1 Commander, Seventh Fleet, San Francisco3 Naval Academy, Annapolis
Director of Research (2)Library (1)
5 Naval Civil Engineering Laboratory, Port HuenemeCommanding Officer (1)L70 (1)L70PM (1)L72, D. Holmes (1)Technical Library (1)
2 Naval Energy and Environmental Support Activity, Port HuenemeCode 1101 (1)Code 111A (1)
1 Naval Postgraduate School, Monterey (Library)1 Naval War Co.lege, Newport (Library)1 Navy Energy and Natural Resources Research and Development Office1 Chief of Engineers (DAEN-RDN)1 Headquarters, U. S. Air Force (AF/LEYSF)2 Air Force Academy, Colorado Springs
Code LGSF (1)Library (1)
1 Civil Engineering Center, Tyndall Air Force Base (DEB)2 Defense Technical Information Center, Alexandria1 Department of Energy, San Francisco Operations, Oakland, CA

1 United States Geological Survey, Menlo Park, CA (Library)1 Associated Universities, Incorporated, Ulpton, NY (Brookhaven National LabuoraLory)2 California/Coso Energy, San Francisco, CA (J. L. Moore)
10 Eastern Kern County Resource Conservation District, Ridgecrest, CA1 Los Alamos National Laboratory, Los Alamos, NM (Reports Library)1 Oak Ridge National Laboratory, Oak Ridge, TN (Energy Division)1 The Johns Hopkins University, Applied Physics Laboratory, Laurel, MD1 University of Utah, Salt Lake City, UT (Department of Geology, Dr. J. A. Whelan)1 University of Utah Research Institute, Salt Lake City, UT (Earth Sciences Group)