Embed Size (px)
Citation preview

Cosmic Ray Muons and the Muon Lifetime
Experiment CRM
University of Florida — Department of PhysicsPHY4803L — Advanced Physics Laboratory
Objective
Four scintillation paddles and coincidencetechniques are used to determine the overallflux and angular distribution of cosmic raymuons. The muon lifetime is measured us-ing rare events where, after passage of a muoninto a scintillator is detected, its decay is alsodetected a short time later. The distributionof the decay times provides information aboutthe average muon lifetime. Statistical uncer-tainties appropriate for Poisson variables areemployed throughout the experiment.
Introduction
Cosmic rays are high-energy particles—mostlyprotons and alpha particles with a small frac-tion of heavier nuclei and other subatomic par-ticles such as electrons, positrons and antipro-tons. Their origins in supernovae, quasars,and other exotic astronomical events and howthey acquire their sometimes colossal energy(over 1020 eV) is a topic of current research.
Cosmic ray muons are created when cos-mic rays enter earth’s atmosphere where theyeventually collide with an air molecule and ini-tiate a hadronic shower—a cascade of particles(mostly pions) that may undergo further nu-clear reactions. Neutral pions (π0) decay ininto two gamma rays with a very short life-time less than 10−17 s, which in turn gener-
ate electromagnetic showers (e+, e−, γ) thatare not very penetrating. Charged pions (π+,π−) that do not undergo further nuclear re-actions will decay in-flight into muons (µ+,µ−) and neutrinos (νµ, νµ): π+ → µ+ + νµ,π− → µ− + νµ with a lifetime of 26 nanosec-onds. Both the muon and its correspondingneutrino are classified as leptons — particlesthat do not participate in nuclear reactions.The neutrinos have an extremely tiny capturecross-section, and typically pass through theEarth without any further interactions.
Muons were discovered in cosmic rays byC. Anderson and S.H. Neddermeyer in 1937.There are two kinds of muon, the negative µ−
and its antimatter partner, the positive µ+.They are essentially heavy versions of the elec-tron and its antimatter partner, the positron,having the same spin and charge, but witha mass mµ = 105.66 MeV/c2 approximately207 times larger than the electron. Muonsare unstable — decaying into an electron orpositron and two neutrinos: µ+ → e++νe+νµ,µ− → e− + νe + νµ with an average lifetimeτµ = 2.197µs — about 100 times longer thanthat of the charged pion.
Because the muon undergoes a 3-body de-cay, the kinetic energy of the emitted electronor positron is not fixed but has a broad distri-bution of values with a maximum (endpointenergy) of 53 MeV in the rest frame of themuon. This kind of energy spectrum is similar
CRM 1
CRM 2 Advanced Physics Laboratory
to nuclear beta-decay (another 3-body decay)where a neutron inside a nucleus decays into aproton, an electron, and an anti-neutrino. Infact, the neutrino’s existence was first postu-lated to explain why electrons from beta-decayare not emitted with a fixed energy as wouldbe predicted if the neutron decayed into onlya proton and electron.
Once created, the muon decay is a com-pletely random event that does not depend onits past history. The probability dP of de-cay in the next infinitesimal time interval dtis independent of how long it has lived sincecreation and is given by:
dP = Γdt (1)
where the decay rate Γ is the inverse of thelifetime: Γ = 1/τµ.
This decay process implies that the proba-bility of a muon decay in the interval from t tot+dt (given that the muon exists at t = 0) fol-lows the exponential probability density func-tion:
dPe(t) = Γe−Γtdt (2)
Here, the time t represents the time for a par-ticular decay to occur and will be called a de-cay time. In one part of this experiment, youwill measure a large sample of decay times andcompare with this exponential distribution.
Exercise 1 (a) Explain the difference be-tween dP in Eq. 1 and dPe(t) in Eq. 2. (b)Show that the expectation value for the decaytime 〈t〉— defined as the muon lifetime τµ — isequal to 1/Γ. (c) Show that the muon “half-life” (the time at which half of a large sam-ple of muons will have decayed) is given byt1/2 = τµ ln 2.
The differential flux of cosmic ray muons(per unit time, per unit area, per unit solid
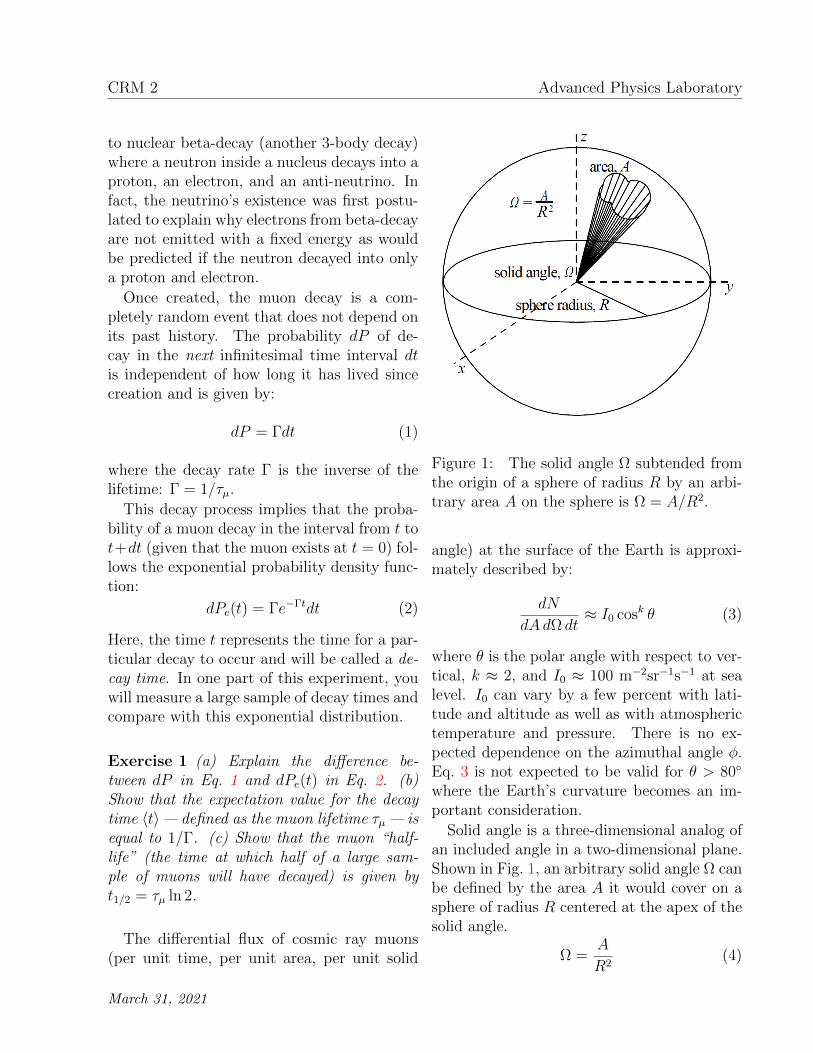
Figure 1: The solid angle Ω subtended fromthe origin of a sphere of radius R by an arbi-trary area A on the sphere is Ω = A/R2.
angle) at the surface of the Earth is approxi-mately described by:
dN
dAdΩ dt≈ I0 cosk θ (3)
where θ is the polar angle with respect to ver-tical, k ≈ 2, and I0 ≈ 100 m−2sr−1s−1 at sealevel. I0 can vary by a few percent with lati-tude and altitude as well as with atmospherictemperature and pressure. There is no ex-pected dependence on the azimuthal angle φ.Eq. 3 is not expected to be valid for θ > 80
where the Earth’s curvature becomes an im-portant consideration.
Solid angle is a three-dimensional analog ofan included angle in a two-dimensional plane.Shown in Fig. 1, an arbitrary solid angle Ω canbe defined by the area A it would cover on asphere of radius R centered at the apex of thesolid angle.
Ω =A
R2(4)
March 31, 2021
Cosmic Ray Muons and the Muon Lifetime CRM 3
Solid angles are expressed in the dimension-less units of steradian, abbreviated sr.1 Onesteradian is the solid angle covered by an areaof 1 m2 on a sphere with a 1 m radius. No-tice that the solid angle for covering the entiresphere (area 4πR2) is 4π sr.
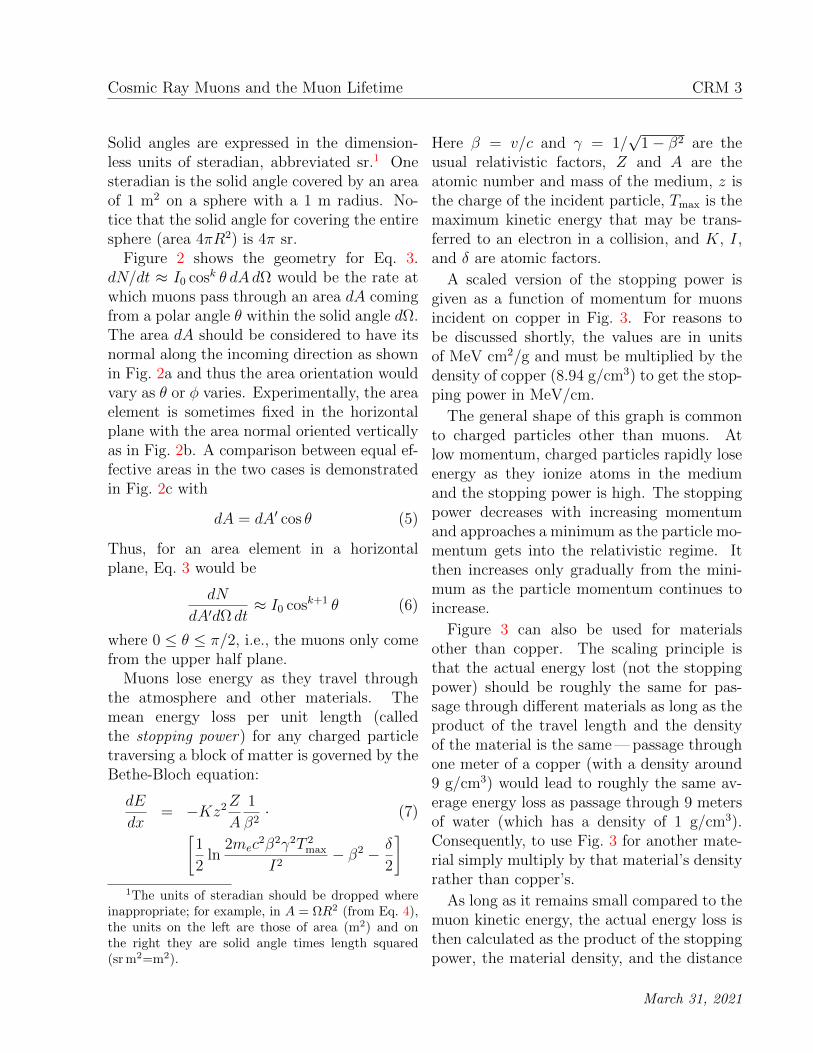
Figure 2 shows the geometry for Eq. 3.dN/dt ≈ I0 cosk θ dAdΩ would be the rate atwhich muons pass through an area dA comingfrom a polar angle θ within the solid angle dΩ.The area dA should be considered to have itsnormal along the incoming direction as shownin Fig. 2a and thus the area orientation wouldvary as θ or φ varies. Experimentally, the areaelement is sometimes fixed in the horizontalplane with the area normal oriented verticallyas in Fig. 2b. A comparison between equal ef-fective areas in the two cases is demonstratedin Fig. 2c with
dA = dA′ cos θ (5)
Thus, for an area element in a horizontalplane, Eq. 3 would be
dN
dA′dΩ dt≈ I0 cosk+1 θ (6)
where 0 ≤ θ ≤ π/2, i.e., the muons only comefrom the upper half plane.
Muons lose energy as they travel throughthe atmosphere and other materials. Themean energy loss per unit length (calledthe stopping power) for any charged particletraversing a block of matter is governed by theBethe-Bloch equation:
dE
dx= −Kz2Z
A
1
β2· (7)[
1
2ln
2mec2β2γ2T 2
max
I2− β2 − δ
2
]1The units of steradian should be dropped where
inappropriate; for example, in A = ΩR2 (from Eq. 4),the units on the left are those of area (m2) and onthe right they are solid angle times length squared(sr m2=m2).
Here β = v/c and γ = 1/√
1− β2 are theusual relativistic factors, Z and A are theatomic number and mass of the medium, z isthe charge of the incident particle, Tmax is themaximum kinetic energy that may be trans-ferred to an electron in a collision, and K, I,and δ are atomic factors.
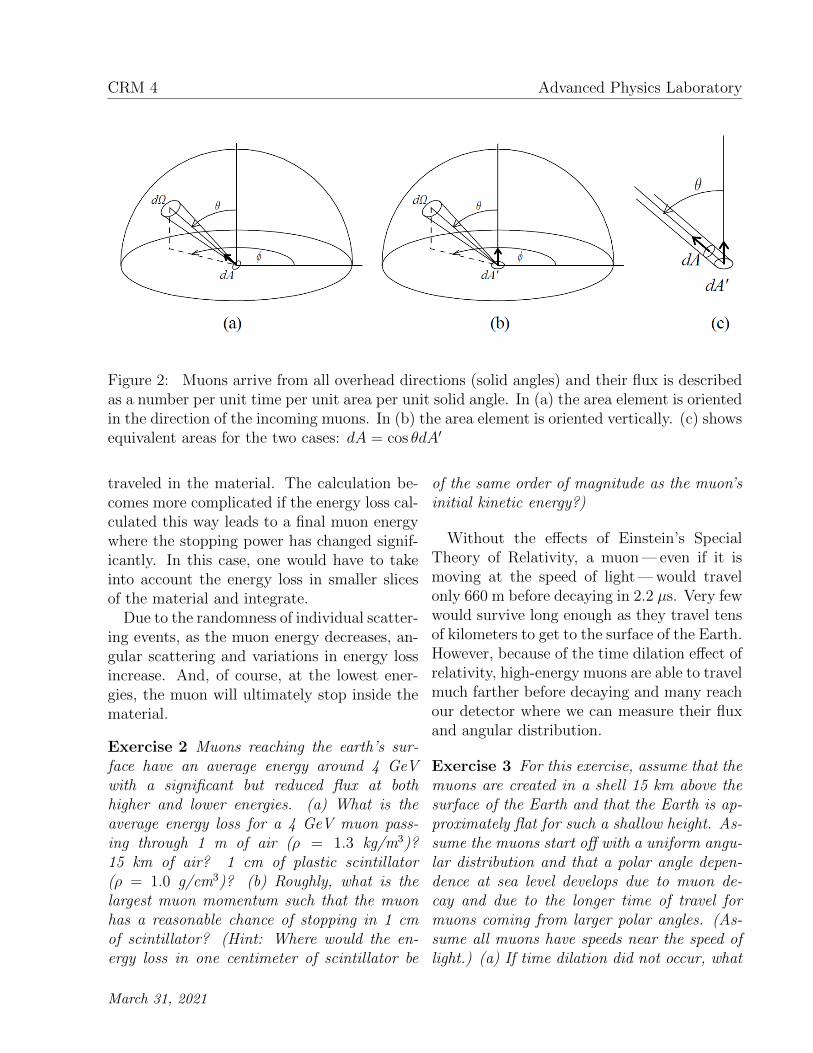
A scaled version of the stopping power isgiven as a function of momentum for muonsincident on copper in Fig. 3. For reasons tobe discussed shortly, the values are in unitsof MeV cm2/g and must be multiplied by thedensity of copper (8.94 g/cm3) to get the stop-ping power in MeV/cm.
The general shape of this graph is commonto charged particles other than muons. Atlow momentum, charged particles rapidly loseenergy as they ionize atoms in the mediumand the stopping power is high. The stoppingpower decreases with increasing momentumand approaches a minimum as the particle mo-mentum gets into the relativistic regime. Itthen increases only gradually from the mini-mum as the particle momentum continues toincrease.
Figure 3 can also be used for materialsother than copper. The scaling principle isthat the actual energy lost (not the stoppingpower) should be roughly the same for pas-sage through different materials as long as theproduct of the travel length and the densityof the material is the same — passage throughone meter of a copper (with a density around9 g/cm3) would lead to roughly the same av-erage energy loss as passage through 9 metersof water (which has a density of 1 g/cm3).Consequently, to use Fig. 3 for another mate-rial simply multiply by that material’s densityrather than copper’s.
As long as it remains small compared to themuon kinetic energy, the actual energy loss isthen calculated as the product of the stoppingpower, the material density, and the distance
March 31, 2021
CRM 4 Advanced Physics Laboratory
Figure 2: Muons arrive from all overhead directions (solid angles) and their flux is describedas a number per unit time per unit area per unit solid angle. In (a) the area element is orientedin the direction of the incoming muons. In (b) the area element is oriented vertically. (c) showsequivalent areas for the two cases: dA = cos θdA′
traveled in the material. The calculation be-comes more complicated if the energy loss cal-culated this way leads to a final muon energywhere the stopping power has changed signif-icantly. In this case, one would have to takeinto account the energy loss in smaller slicesof the material and integrate.
Due to the randomness of individual scatter-ing events, as the muon energy decreases, an-gular scattering and variations in energy lossincrease. And, of course, at the lowest ener-gies, the muon will ultimately stop inside thematerial.
Exercise 2 Muons reaching the earth’s sur-face have an average energy around 4 GeVwith a significant but reduced flux at bothhigher and lower energies. (a) What is theaverage energy loss for a 4 GeV muon pass-ing through 1 m of air (ρ = 1.3 kg/m3)?15 km of air? 1 cm of plastic scintillator(ρ = 1.0 g/cm3)? (b) Roughly, what is thelargest muon momentum such that the muonhas a reasonable chance of stopping in 1 cmof scintillator? (Hint: Where would the en-ergy loss in one centimeter of scintillator be
of the same order of magnitude as the muon’sinitial kinetic energy?)
Without the effects of Einstein’s SpecialTheory of Relativity, a muon — even if it ismoving at the speed of light — would travelonly 660 m before decaying in 2.2 µs. Very fewwould survive long enough as they travel tensof kilometers to get to the surface of the Earth.However, because of the time dilation effect ofrelativity, high-energy muons are able to travelmuch farther before decaying and many reachour detector where we can measure their fluxand angular distribution.
Exercise 3 For this exercise, assume that themuons are created in a shell 15 km above thesurface of the Earth and that the Earth is ap-proximately flat for such a shallow height. As-sume the muons start off with a uniform angu-lar distribution and that a polar angle depen-dence at sea level develops due to muon de-cay and due to the longer time of travel formuons coming from larger polar angles. (As-sume all muons have speeds near the speed oflight.) (a) If time dilation did not occur, what
March 31, 2021
Cosmic Ray Muons and the Muon Lifetime CRM 5
Figure 3: The “scaled” stopping power for muons incident on copper as a function of mo-mentum. The value on the vertical axis must be multiplied by the density of copper in g/cm3
to get the stopping power in MeV/cm of travel. The vertical axis can be multiplied by thedensity of other materials to get the approximate stopping power for that material. Takenfrom The Passage of Particles Through Matter by the Particle Data Group.
fraction of the muons coming straight downwould reach the ground without decaying? De-spite the small size of this fraction, the ob-served rate at sea level might still be possibleif the creation rate in the upper atmospherewere high enough. (b) Still assuming time di-lation did not occur, how would this fractiondepend on θ? For example, determine the ra-tio of the cosmic ray flux at θ = 30 to thatat 0. How does this θ-dependence differ fromthat in Eq. 3?
Occasionally, a low energy muon will cometo rest in one of the scintillators where itcan then decay into an electron or a positron
and two neutrinos. Negatively charged muonscan also decay inside a nucleus of one of thescintillator atoms. The µ− first displaces anatomic electron in the atom and because it is207 times more massive, its orbit is 207 timessmaller than that of the displaced electron.The muon wave function has significant prob-ability inside the nucleus where capture by aproton is possible:
µ− + AZX → A
Z−1X + e− + νµ (8)
This muon decay converts a proton into aneutron, transmuting the nucleus and releas-ing roughly the muon rest mass energy to theneutrino, nucleus and atomic electrons. The
March 31, 2021
CRM 6 Advanced Physics Laboratory
final nuclear state may also be unstable anddecay. Muon capture inside nuclei is a topicrich in experimental and theoretical physicswhich you are encouraged to explore. The neteffect is that this nuclear reaction rate adds tothe vacuum decay rate for the µ− and leadsto a shorter lifetime for negative muons. Inhigh-Z nuclei, this additional decay mode cansignificantly shorten the average muon life-time. However, the muon capture rate scalesas Z4 and in our apparatus, where the plasticscintillator is largely made of carbon and hy-drogen atoms, the effect is fairly small. Ourapparatus sees decays from both muon typesin roughly equal numbers with the predictionthat our data should be a sum of two exponen-tial decays with nearly equal amplitudes andlifetimes — the µ+ lifetime will be the vacuumvalue and the µ− lifetime somewhat shorter.
Particularly when the time constants areof similar size, fitting multi-exponential func-tions presents difficulties that are discussedin the literature. It turns out that the datafrom our muon lifetime experiment will be wellmodeled as a single exponential with a lifetimeparameter that will be shorter than the vac-uum value by approximately 5%.
Measurements
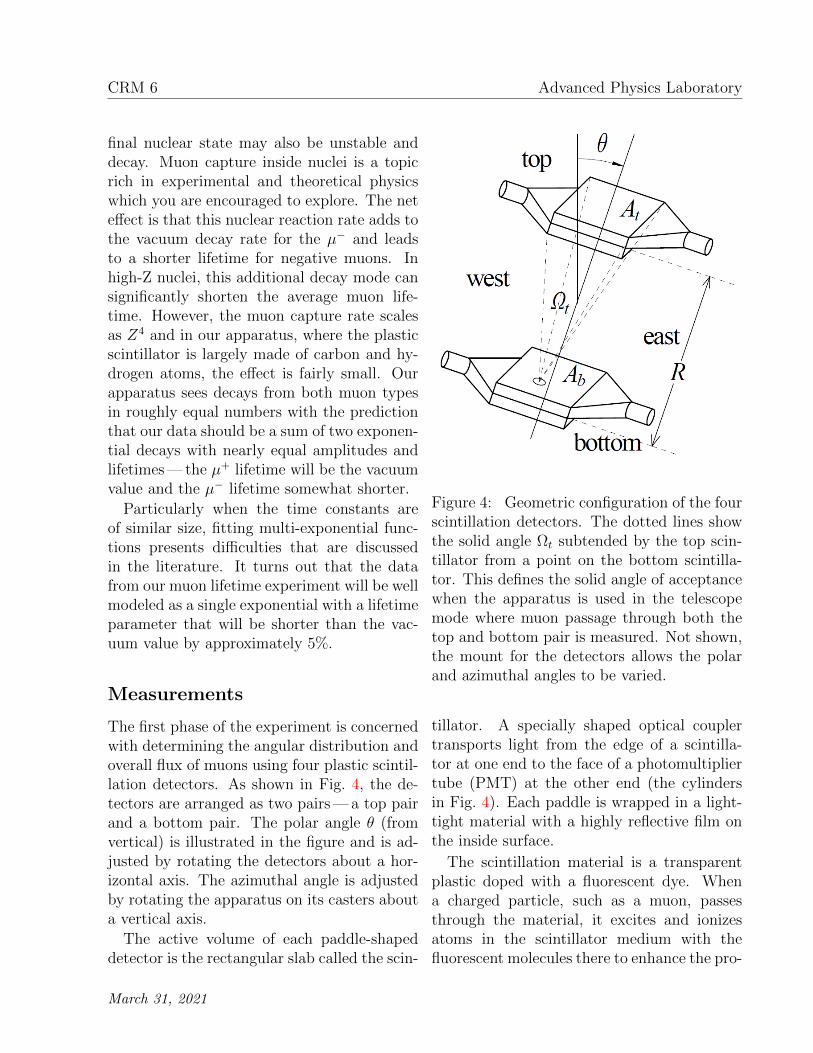
The first phase of the experiment is concernedwith determining the angular distribution andoverall flux of muons using four plastic scintil-lation detectors. As shown in Fig. 4, the de-tectors are arranged as two pairs — a top pairand a bottom pair. The polar angle θ (fromvertical) is illustrated in the figure and is ad-justed by rotating the detectors about a hor-izontal axis. The azimuthal angle is adjustedby rotating the apparatus on its casters abouta vertical axis.
The active volume of each paddle-shapeddetector is the rectangular slab called the scin-
Figure 4: Geometric configuration of the fourscintillation detectors. The dotted lines showthe solid angle Ωt subtended by the top scin-tillator from a point on the bottom scintilla-tor. This defines the solid angle of acceptancewhen the apparatus is used in the telescopemode where muon passage through both thetop and bottom pair is measured. Not shown,the mount for the detectors allows the polarand azimuthal angles to be varied.
tillator. A specially shaped optical couplertransports light from the edge of a scintilla-tor at one end to the face of a photomultipliertube (PMT) at the other end (the cylindersin Fig. 4). Each paddle is wrapped in a light-tight material with a highly reflective film onthe inside surface.
The scintillation material is a transparentplastic doped with a fluorescent dye. Whena charged particle, such as a muon, passesthrough the material, it excites and ionizesatoms in the scintillator medium with thefluorescent molecules there to enhance the pro-
March 31, 2021
Cosmic Ray Muons and the Muon Lifetime CRM 7
duction of photons. The decay of the ex-cited states via spontaneous emission takesonly about ten nanoseconds and the pulsewidth from the PMT is likewise of this order.Roughly one photon is created for each 100 eVof energy loss in the scintillator.
The two scintillators in a pair are mountedface to face making it highly likely that a muonpassing through one will also pass through theother. An event in which a muon passage isdetected simultaneously (within a few tens ofnanoseconds) in two scintillators is called a“double.” For a paddle pair oriented horizon-tally, the muon responsible for a double canpass into any area element in the upper scin-tillator and can be moving in almost any di-rection from straight overhead to nearly hor-izontally, i.e., from within the 2π steradiansof the upper hemisphere. For muons hittingnear the edges of a scintillator, the possiblemuon directions leading to a double becomelimited as some passage directions would notcross into the other scintillator. If the volumenear an edge — say within the thickness of thescintillator — is a small fraction of the total,this effect should be small. Our paddles havea edge fraction over 10%. Nonetheless, as afirst approximation, we will assume, in effect,that the paddles are infinitesimally thin (havean edge fraction of zero) when modeling cer-tain aspects of the apparatus. Take note whenthis assumption is being used and how it mayaffect any conclusions. It surely would havesmall systematic effects when determining theoverall muon flux.
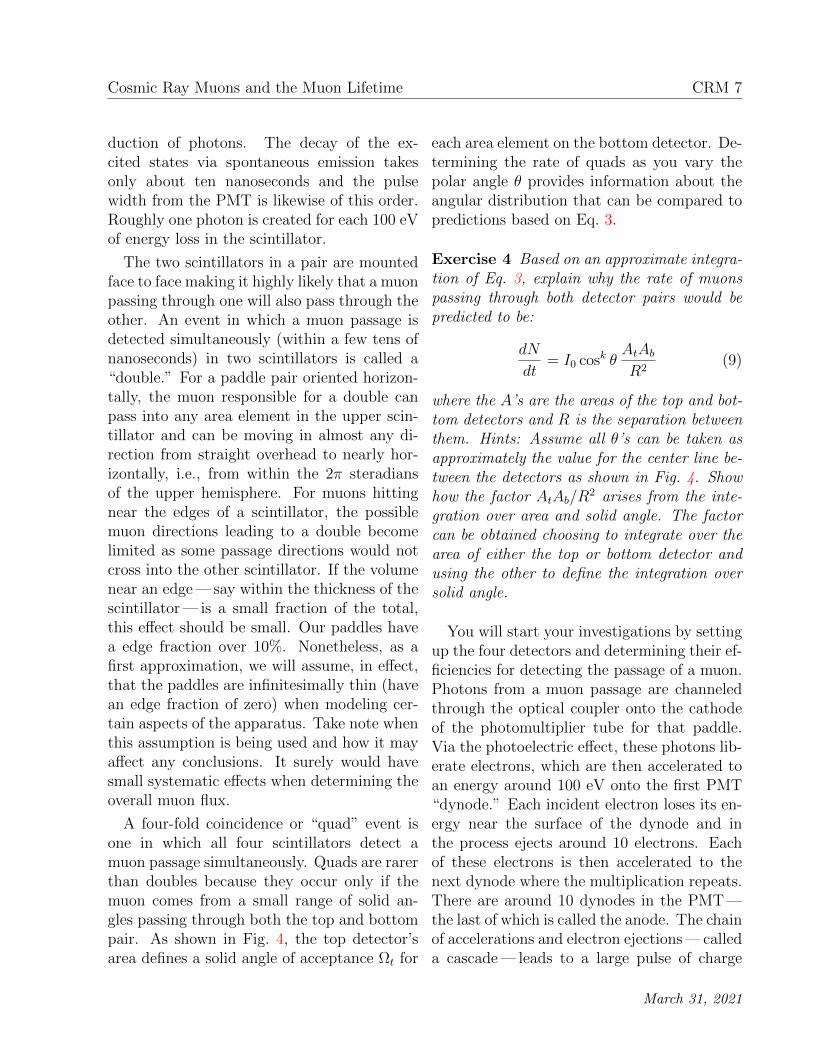
A four-fold coincidence or “quad” event isone in which all four scintillators detect amuon passage simultaneously. Quads are rarerthan doubles because they occur only if themuon comes from a small range of solid an-gles passing through both the top and bottompair. As shown in Fig. 4, the top detector’sarea defines a solid angle of acceptance Ωt for
each area element on the bottom detector. De-termining the rate of quads as you vary thepolar angle θ provides information about theangular distribution that can be compared topredictions based on Eq. 3.
Exercise 4 Based on an approximate integra-tion of Eq. 3, explain why the rate of muonspassing through both detector pairs would bepredicted to be:
dN
dt= I0 cosk θ
AtAbR2
(9)
where the A’s are the areas of the top and bot-tom detectors and R is the separation betweenthem. Hints: Assume all θ’s can be taken asapproximately the value for the center line be-tween the detectors as shown in Fig. 4. Showhow the factor AtAb/R
2 arises from the inte-gration over area and solid angle. The factorcan be obtained choosing to integrate over thearea of either the top or bottom detector andusing the other to define the integration oversolid angle.
You will start your investigations by settingup the four detectors and determining their ef-ficiencies for detecting the passage of a muon.Photons from a muon passage are channeledthrough the optical coupler onto the cathodeof the photomultiplier tube for that paddle.Via the photoelectric effect, these photons lib-erate electrons, which are then accelerated toan energy around 100 eV onto the first PMT“dynode.” Each incident electron loses its en-ergy near the surface of the dynode and inthe process ejects around 10 electrons. Eachof these electrons is then accelerated to thenext dynode where the multiplication repeats.There are around 10 dynodes in the PMT —the last of which is called the anode. The chainof accelerations and electron ejections — calleda cascade — leads to a large pulse of charge
March 31, 2021

CRM 8 Advanced Physics Laboratory
on the anode that raises its voltage for a fewnanoseconds before decaying away.
The pulse amplitude depends on many fac-tors. It is typically large from a muon passagewhich can induce many scintillation photons.A thermionic electron is one that randomlyjumps out of a metal overcoming the potentialbarrier associated with metal’s work functionvia its thermal energy. Such electrons emittedfrom the cathode or a dynode can also initiatea cascade, but the pulse is typically smaller.A room light photon leaking into the detec-tor can also initiate a cascade leading to a de-tectable pulse. All pulses not arising from amuon will be called background pulses.
Because the pulses from the PMT vary insize, they are called analog pulses. Theyare transformed into uniformly shaped digi-tal pulses used for computer processing by adiscriminator module. The Phillips model 730five-channel discriminator we use has five inde-pendent discriminators. Four are used — onefor each detector. A digital output pulse iscreated only if the analog input pulse heightexceeds some user-adjustable minimum, calledthe lower level threshold or LLT. The LLT isadjusted separately for each detector to elimi-nate the small background pulses which occurin large numbers.
You will determine the overall muon flux atthe earth’s surface and its angular distribu-tion. You will also determine the muon life-time by measuring the distribution of time in-tervals between double pulses in the same de-tector. These are not the coincident doublesarising from a single muon passing throughtwo scintillators. They are time-separatedpulses — the first occurring as a muon entersand stops in a scintillator and the second whenthe muon later decays in that same scintilla-tor. The decay time is the interval betweenthese pulses and is predicted to vary randomlyaccording to the exponential distribution dis-
cussed in the introduction. Muon decays arerare events occurring at a rate of about two perminute and consequently it will take overnightor longer runs to get suitable data. Be sure toget one of these long runs started as soon aspossible.
Data acquisition
Four counters in a National Instruments USB-6341 multifunction data acquisition module —together with a LabVIEW Muon program —process and display data about the pulses fromthe four detectors.
All four counters are started simultaneouslyat the beginning of a run and continually in-crement on each pulse from a 100 MHz clock.Thus the count in each counter at any pointin time is the same for all four counters — thetime since starting in units of 10−8 seconds (10ns).
The logic pulses directly from the discrim-inator do not have the correct voltage lev-els to drive the counters and so they arepassed through a home-made, four-channel“level adapter” before they are connected tothe corresponding counter’s gate input. Aseach pulse arrives at the gate, the clock countis latched and saved to a buffer.
The Muon program reads and saves theseclock counts or “timestamps” to a set of fourarrays — one for each detector — containingcontinually increasing timestamps giving thearrival time of each photon detected in thatchannel. Thus, if a muon passes through and“lights up” scintillators 1 and 2 simultane-ously, then the timestamp when that hap-pened would show up in the two correspondingarrays.
The timestamps do not have to be exactlythe same for the program to tag them as coin-cident. The user can adjust the allowed time-stamp separation for which a coincidence will
March 31, 2021

Cosmic Ray Muons and the Muon Lifetime CRM 9
be recorded. Setting this “coincidence time”to 0 would mean the timestamps must be ex-actly the same. Setting it to 1 would meanthey can differ by up to 1 clock pulse (10 ns),2 would mean 20 ns, etc. You should checkhow the coincidence rate depends on the coin-cidence time but the default value of 2 shouldwork well.
The output signal from the level adapter hasa sharp leading edge that reliably triggers atimestamp reading with very little jitter (shotto shot time differences) relative to the truetime the muon lights up the detector. How-ever, the output signal from the level adaptershows some significant oscillations for about80 ns and often triggers a timestamp twice.The software ignores these second timestampsif they are closer than the debounce count — auser-adjustable value in clock cycles that hasa default value of 8 producing an 80 ns “deadtime” after each pulse during which a real sec-ond pulse would go undetected.
The software continually scans the fourtimestamp arrays as they fill and finds the ear-liest in each array. The earliest of these four isthen compared with the other three and anywithin the coincidence time are noted by thesoftware as detectors that fired (or lit) simul-taneously. This information is used to updatevarious counters as described next. The times-tamps of the lit detectors are then deletedfrom the arrays and the process repeats.
Based on the lit detectors, the software con-structs a four bit tag with each bit, 0-3, takingon the value of 1 or 0 depending on whetherdetector, 0-3, fired or not. There are 16 valuesfor a 4-bit datum (called a “nibble” or hex-adecimal digit). Here, the zero value (no de-tectors fired) is not used. The muon programincrements exactly one of the 15 counters as-sociated with that 4-bit tag, which can be de-scribed follows:
Independent singles: when exactly one detec-
tor fires — an array of four integers for thefour detectors in the order 0, 1, 2 and 3.
Independent doubles: when exactly two de-tectors fire simultaneously — an array ofsix integers for the six pairs in the order01, 02, 03, 12, 13, 23.
Independent triples: when exactly three de-tectors fire simultaneously — an array offour integers for the four triples in the or-der 123, 023, 013, 012.
Quads: when all four detectors fire simulta-neously — a single integer.
The counts above would be statistically in-dependent Poisson random variables. Theyare Poisson variables because they occur ran-domly with a fixed probability per unit timeand they are statistically independent becausethey have no counts in common.
There is a second group of counts, called“full” counts, that can be derived from andhas a one-to-one correspondence with the “in-dependent” group. For example, the full sin-gles count for detector 0 is the total num-ber of times detector 0 fired, regardless ofwhether any others fired in coincidence. Thefull triples count for detectors 0, 1, and 2would by the number of times those three firedsimultaneously whether or not detector 3 alsofired. Counts in the independent group willalways be labeled with the independent qual-ifier. Counts in the full group will not be sta-tistically independent and will normally be re-ferred to without a qualifier. In terms of thecounters in the independent group, they are:
Quads: The number of times all four detec-tors fired simultaneously — a single inte-ger. (This is the same counter as in theindependent group.)
Triples: The number of times any three de-tectors fired simultaneously — an array of
March 31, 2021

CRM 10 Advanced Physics Laboratory
four integers for the four triples in the or-der 123, 023, 013, 012. Each triples countis the sum of the corresponding indepen-dent triples plus the quads (because everyquad is also a triple for any combinationof detectors).
Doubles: The number of times each pair ofdetectors fired simultaneously — an arrayof six integers in the order 01, 02, 03, 12,13, 23. Each doubles count is the sumof the corresponding independent doublesplus the appropriate two of the four in-dependent triples (in which the double isalso included) plus the quads (because ev-ery quad is also a double for any two de-tectors).
Singles: The number of times each detectorfired — an array of four integers for thefour detectors in the order 0, 1, 2 and 3.Each singles count is the sum of the cor-responding independent singles plus threeof the six independent doubles (that in-clude the single) plus three of the fourindependent triples (that include the sin-gle) plus the quads (which always includeany single).
The full counts are not statistically indepen-dent because they have common counts. Forexample, any two triples counts have the quadcounts in common; any two singles counts havetheir corresponding doubles count in common.The covariance between any two counters isthe variance of the common counts.
Exercise 5 Consider three independent Pois-son random variables: n′1, n′2, and nc hav-ing means µ′1, µ′2, and µc, respectively. Eachsample of these three variables is used to con-struct two new variables n1 = n′1 + nc andn2 = n′2 +nc so that n1 and n2 have nc countsin common. Show that n1 and n2 will have
means 〈ni〉 = µi = µ′i + µc and variances〈(ni − µi)2〉 = µi, for i = 1, 2 and a covari-ance 〈(n1 − µ1)(n2 − µ2)〉 = µc, i.e., equal tothe common counts.
Recall that the uncertainty of any calcu-lated quantity derived from correlated randomvariables must take into account their covari-ances in addition to their variances. Exer-cise 5 shows that the variance of n1 and n2 istheir distribution’s mean and the covariance isthe mean of the distribution for the commoncounts. Also recall that “square root statis-tics” are appropriate when a sample from aPoisson distribution is greater than 30 or so.The sample value will then be close enoughto its mean to justify using that sample valueas an estimate of the variance, i.e., the uncer-tainty is the square root of the count. Thesame will be true of the covariance. If thecommon counts are greater than 30 or so, theirsample value will also be a good approxima-tion to the covariance.
Procedure
Set-up and initial measurements
1. Measure the dimensions of the scintilla-tors and the separation distance R be-tween the two pairs of detectors. Cal-culate the approximate solid angle of ac-ceptance. Calculate a rough range of θvalues for a particular orientation of thetelescope.
2. Orient the detectors vertically (θ = 0) sothat the scintillators are horizontal.
3. Have the instructor check the cable con-nections to the photomultipliers beforeturning on the high voltage. Make surethat the high voltage is set to NEGA-TIVE. The operating voltage is 2000 Vfor the photomultiplier tubes.
March 31, 2021
Cosmic Ray Muons and the Muon Lifetime CRM 11
4. Examine the pulses from one of the PMTsusing the oscilloscope. Make sure to puta 50 Ω terminator at the oscilloscope in-put using a “tee.” Record the typicalrange of pulse heights and pulse duration(FWHM). Can you see any cable reflec-tions in the signal after the pulse? Howdoes it change when the 50 Ω terminatoris removed?
5. Connect the four photomultiplier out-puts to the bottom four channels of thePhillips five-channel discriminator mod-ule. (The input LEMO connector on thetop channel is a bit flaky.) Make sure theinputs are in numerical order from the topdown (the cables are labeled 0-3) and thatthe switch at the bottom is set for LED,which stands for leading edge discrimina-tion. In this mode, the module puts outa short logic pulse whenever the ampli-tude of the input pulse from the PMT islarger than the LLT (lower level thresh-old). This discrimination step preventsthe processing of smaller pulses, which oc-cur in large numbers from the backgroundwith only a small number due to a muonevent. The LLT for each of the four chan-nels is set around 0.1 V but varies some-what because each detector has a some-what different response and noise level.
6. Examine the output of a discriminator us-ing the oscilloscope. You should see logicpulses with an amplitude of −1 V anda width around 80 ns. Connect the dis-criminator outputs from the top or bot-tom pair of detectors to the two inputs ofthe scope. Triggering on one, you shouldsee an occasional coincidence whenever amuon travels through both detectors.
7. Connect the output of each discriminatorin numerical order to the input (LEMO
connector) of the 4-channel level adapter.Connect the outputs (BNC connectors) ofthe level adapter to the gates of the fourcounters on the data acquisition module(labeled 0-3) in numerical order.
8. Load the Muon program and hit the Lab-VIEW run button to start it. Select a filename where the spreadsheet-compatibledata will be saved as a text file. With thedetectors still oriented vertically (θ = 0),collect data for a few minutes.
Detector efficiencies
Detector efficiencies are needed in order to de-termine the true rates at which muons passthrough the scintillators from the measuredrates. A muon passage through the scintillatorsometimes does not result in a logic pulse. Inthe next step, you will determine the efficiencyor probability for a detector to fire given thata muon passed through that detector.
The best way to determine efficiencies isto measure triples and quads over the sametime interval. Due to the detector arrange-ment, any triple is almost certain evidencethat a muon traversed through the entire tele-scope and must have passed through all fourscintillators. Thus, the fraction of the timethe fourth counter fires given the other threedid is the efficiency for that counter. For ex-ample, to determine the efficiency of counter0, you should record (over some reasonabletime interval) the full number of triples —simultaneous counts in counters 1, 2, and 3(N123) and the number of quads (N0123). Ourhypothesis is that N123 is the total numberof muons that passed through scintillator 0,whether it fired or not. Out of that manychances, N0123 is the number of times detec-tor 0 fired. The efficiency of the detector is
March 31, 2021
CRM 12 Advanced Physics Laboratory
thus
ε0 =N0123
N123
(10)
C.Q. 1 Use propagation of errors to showthat the statistical uncertainty in ε0 would thenbe given by
σε0 =
√ε0(1− ε0)
N123
(11)
To apply POE directly to Eq. 10, you willneed the variances for N0123 and N123 andtheir covariance since it is nonzero. Assumethe counts are large enough to use square-rootstatistics. These two variables have the quadscount in common, so that square root statisticsimply the covariance between N0123 and N123
can be taken as N0123. (a) Determine the un-certainty in ε0, using propagation of error onEq. 10 including these variances and covari-ance.
Alternatively, one can rewrite the formulafor ε0 in terms of the two independent counts:the quads count N0123 and the independenttriples N ′123 = N123−N0123 — triples that werenot in the quads count. The efficiency formulais then the same as Eq. 10,
ε0 =N0123
N ′123 +N0123
(12)
but now written in terms of two independentvariables with no covariance between them. (b)Use propagation of error for independent vari-ables on this equation — again using squareroot statistics.
(c) The efficiency could also be determinedby collecting the coincidence counts in the nu-merator and denominator of Eq. 10 over sep-arate but equal time intervals. In this case,N123 and N0123 would be statistically indepen-dent. Show that in this case the uncertainty inε0 would be given by
σε0 = ε0
√1
N123
+1
N0123
(13)
(d) Using simultaneously collected countsfor which Eq. 11 applies or independently col-lected counts for which Eq. 13 applies, sup-pose both gave 100 triples and 90 quads. Thus,counter 0 has a calculated efficiency ε0 = 0.90in both cases. Determine the uncertainty forboth cases.
9. Calculate the efficiencies of all four detec-tors and check for agreement with the val-ues on the LabVIEW program tab pagelabeled Rates/Efficiencies. Once verified,feel free to use this page.
10. Deduce the true integrated rate dN/dt ofcosmic ray muons crossing the top andbottom pairs — the measured full doublesrates divided by the product of the twodetector efficiencies. Compare the cor-rected dN/dt obtained from the top andbottom pair of detectors. Your compar-isons should include a calculation of thepropagated uncertainty for each.
C.Q. 2 Use the data from a long run (withhorizontal detectors) to answer such questionsas:
What is the approximate rate at whichmuons pass through a top or bottom scintil-lator? What is the approximate rate at whichmuons pass thorough both the top and bottomscintillators? Why is one so much smallerthan the other?
What is the rate of background pulses foreach detector? You should obviously start fromthe independent singles to eliminate countsfrom doubles, triples or quads, but you shouldalso consider the possibility that independentsingles arise not only from background pulsesbut also from muons passing through the topor bottom pair of scintillators and then one ofthe detectors fires but the other does not. Howbig a contribution does this kind of event make
March 31, 2021
Cosmic Ray Muons and the Muon Lifetime CRM 13
to the singles rates? What fraction of the fullsingles from a detector are due to muons?
How do you account for the number of dou-bles in non-adjacent detectors, i.e., with onedetector in the top pair and one in the bot-tom pair? They are far rarer than doubles forthe two adjacent pairs (top or bottom). Mostare from triple or quad events. If these aresubtracted out, however, the remaining inde-pendent doubles are even rarer. As discussednext, some of these independent doubles aredue to random coincidences while others arisefrom a muon passage.
A random double would be created, for ex-ample, when two background pulses — one inone detector and one in the other detector —occur by chance within the coincidence time∆t. As long as ∆t is short enough, backgroundrates of R1 and R2 lead to a random doublesrate of R1R2∆t.2 Explain why ∆t for a coinci-dence count of two clock cycles is 50 ns. Theserandom coincidences would occur for both ad-jacent and non-adjacent detector pairs. Pro-vide an estimate for these rates. Is it a sig-nificant contribution to even the non-adjacent,independent doubles rates?
A double in non-adjacent detectors can alsoarise from a muon passing through all fourscintillators. But rather than producing a quad(if all four detectors fire) or even a triple(if one detector does not fire), an indepen-dent double will be created if exactly two de-tectors do not fire. Estimated this rate fromthe data. Is it a significant contribution to thenon-adjacent independent doubles rates? Arethere other contributions to this rate?
2The logic behind this formula is that it is the ratein one detector, say R1, multiplied by the probabilityR2∆t (which must be small compared to 1) that theother detector pulse will occur in a time window ∆tsuch as to produce a coincidence.
Angular distribution
Next, you will examine the quad rate for co-incidences in all four detectors, i.e., with theapparatus in the “telescope” mode.
11. Measure the four-fold coincidence rate asa function of θ. Be sure to record totalcounts and the acquisition time so youwill also be able to determine the uncer-tainty in any rates.
To change θ, pull out the locking pin,slowly rotate the telescope to the desiredsetting, and then release the pin makingsure it registers back into the hole. Keepan eye out for the HV and signal cablesto the photomultiplier tubes. Rotatingthe telescope brings the cables close tothe top and bottom of the mounting rack.Make sure they pass by cleanly. As yourotate or move the telescope, they can getsnagged on something and damage thePMT or its connectors.
Adjust the mounting rack so the tele-scope points out the window (approxi-mately east) when you are taking data fornonzero θ-values. Take measurements atconsecutive holes of the telescope. Thereis a small offset in the holes so none ofthem line up perfectly vertical or hori-zontal. Take measurements over 90 fromnear vertical (approximately straight upthrough the upper floors of the build-ing) to near horizontal (approximatelystraight out the window). For θ = 90,be sure to also record the doublescount for each paddle pair for use inC.Q. 7. Use an acquisition time at eachangle to get uncertainties smaller thanabout 10% in the quads rate. This willrequire running for a longer time at largerangles.
For a non-zero polar angle (e.g., θ = 30),
March 31, 2021

CRM 14 Advanced Physics Laboratory
the telescope can be pointed out the windowor through the building components above thelab by rotating it to points north, west andsouth. The theory suggests that the muon fluxis independent of the azimuthal angle (φ inFig. 2), but is this what you would observe?
C.Q. 3 (a) Why might your measurementsshow a dependence of the muon flux on the az-imuthal angle? For example, could the earth’smagnetic field have a steering effect? Wouldthere need to be a difference in positive andnegative muon production to see such an ef-fect? Should there be a measurable attenuationof the muons that must go through the upperfloors of the physics building when comparedwith those that must only go through the win-dow?
(b) What is the rough areal density of the at-mosphere for a polar angle of 0 (straight up).What would it be at 45? (The atmosphericareal density is the mass per unit area for acolumn all the way to the top of the atmo-sphere and should have units of kg/m2.) Itcan be obtained from the atmospheric pres-sure, (≈ 105 N/m2), the acceleration of gravity(≈ 10 m/s2) and the polar angle.
(c) Concrete has a mass density of about2400 kg/m3. How thick a slab of concretewould have the same areal density as the at-mosphere?
(d) The two concrete slabs above the lab havea total thickness around 25 cm. Is the build-ing’s areal density above the lab a significantfraction of the atmosphere’s?
12. Set the telescope polar angle to 30. Inthe previous step, you collected quads atthis angle with the telescope pointed eastout the window. Now, collect data atthree other azimuthal angles (every 90,approximately north, west, and south)and try to determine whether or not there
are any significant differences in the coin-cidence rates. Discuss your results.
CHECKPOINT: Procedure should becompleted through Step 10, includingthe determination of the detector effi-ciencies. C.Q. 3 should be answered.An overnight run to determine themuon lifetime should be started. (Readahead for instructions on this investiga-tion.)
Analysis of angular distribution
Make a graph of the four-fold coincidence ratedN/dt as a function of the polar angle. Equa-tion 9 predicts the true rate at which muonspass through both detector pairs and must becorrected for experimental issues. A logicalfitting function becomes:
dN
dt= RB +R0 cosk θ (14)
where dN/dt values are the measured four-foldcoincident rates at each angle — uncorrectedfor detector efficiencies. Their standard de-viations thus depend only on the statisticaluncertainty in the counts acquired to deter-mine them. (The uncertainty in the acqui-sition time is very small and should not con-tribute significantly to any rate uncertainties.)
Compared with Eq. 9, experimental issuesrequire adding the RB term to take into ac-count background counts. Perform a properlyweighted fit of the raw dN/dt taking into ac-count statistical uncertainties only and deter-mine the best-fit values and uncertainties forRB, R0, and k. Use the fitted R0, and its rela-tionship to I0, detector geometry parameters,and detector efficiencies to get an estimate ofI0 and its uncertainty. Is k or its uncertaintyaffected by detector efficiencies or their uncer-tainties?
March 31, 2021
Cosmic Ray Muons and the Muon Lifetime CRM 15
C.Q. 4 Use the doubles rates from a long runat θ = 0 to get another estimate of I0. Youwill need to show that the true rate of muonspassing through each pair would be predicted tobe
dN
dt= I0
2πA
k + 2(15)
[Hint: Does Eq. 3 or Eq. 6 apply? Why?The integration over area gives the factor A.The differential solid angle dΩ correspondingto differential variations in the polar and az-imuthal angles is given by dΩ = sin θ dθ dφ.The integration over all solid angles in the up-per hemisphere gives the other factors.] Cor-rect for detector efficiencies to determine I0
from each pair’s measured coincidence rateand compare with the I0 obtained from the fitto the angular distribution.
C.Q. 5 How do your data support time di-lation in Special Relativity? [Hint: comparethe fitted results with the predictions of Exer-cise 3.]
Muon Lifetime
In this part of the experiment you will measurethe distribution of decay times for muons thatstop inside one of the scintillators. You willmeasure the time difference between an ini-tial PMT pulse created as a low-energy muonenters and stops inside one of the scintillatorsand a later pulse arising from the decay of thatmuon into an electron and two neutrinos.
Energy must be conserved as the muon’s 106MeV rest mass energy is transformed in thedecay. A small amount (0.511 MeV) goes intothe rest mass of the electron or positron cre-ated. Much of the energy goes undetected tothe neutrino’s kinetic energy. The energy re-lied on for detection is the kinetic energy ofthe electron or positron created in the decay.This quantity ranges up to a maximum around
53 MeV but has a broad range of values be-low. Like a muon, the electron or positron ion-izes atoms inside the scintillator material andmany scintillation photons are created. Be-cause of its relatively low energy, the stoppingpower in the scintillator is relatively high andthe detection probability should be as good orbetter than it is for a muon passage.
The algorithm to find muons decaying in-side a scintillator treats the top and bottompaddle pair independently. For each pair, theprogram looks for a “start” event. A goodchoice would be a double in that pair. Mostof the time, this represents a muon passingcompletely through both scintillators and nodecay event will be found. Rarely but mea-surably, however, this start event will be a lowenergy muon traversing the upper scintillatorof a pair and stopping in the lower. Based onthis assumption for the start event, we shouldthen expect the lower scintillator to occasion-ally light up within a few microseconds whenthe stopped muon decays.
It is just about as likely that a low en-ergy muon will stop in the upper scintillator —never making it to the lower scintillator. Thus,we also take a start event as an independentsingle in the upper scintillator (one not in co-incidence with a pulse in the lower scintilla-tor). Most of the time this start event willbe a background pulse, but in rare instancesit will be a muon stopping in the upper scin-tillator. In this case, we should then expectthe decay scintillation to occur in the upperscintillator.
Thus, after saving the timestamp of thestart event — either a double or an indepen-dent single in the upper scintillator, the pro-gram switches to looking for a stop event — asingle in the lower or upper scintillator, re-spectively, depending on the start event. Ifthe program finds a stop event, it saves thetimestamp for this event and starts looking
March 31, 2021
CRM 16 Advanced Physics Laboratory
for a new start event.The timestamp difference between the start
and stop event then increments that channel ina 2000-bin frequency histogram. The spacingbetween bins is 1 clock cycle (10 ns). That is,if the timestamp difference is 100 clock cycles(1 µs), channel 100 in the frequency histogramis incremented.
If a stop event is not detected after 2000clock pulses (20 µs), the start pulse is ignored(no bin is incremented) and a new start pulseis sought.
13. Set the telescope to its vertical orienta-tion (θ = 0). Real muon decays andrandom coincidences occur at around oneor two per minute. Much lower or muchhigher rates probably indicate a problem.To get enough events for an analysis, col-lect data for at least 24 hours, and ideallyfor several days. Processed data, not thefour timestamp arrays, are saved ev-ery 43 seconds and when you hit the stopbutton. Look at this file to see the obvi-ous pattern starting with the total time(in seconds) followed by the 15 indepen-dent counter values. Following the coun-ters values there will be four side-by-sidecolumns giving the histogram frequenciesfor time intervals associated with possi-ble muon decays (i.e. stop pulses) in theupper and lower paddles of the top pairfollowed by two more columns for stoppulses in the upper and lower paddles ofthe bottom pair.
The interval measuring part of the softwarethat makes the histograms has a minimumtime that defaults to 30 clock cycles (300 ns).It is user adjustable. If you set this minimumto zero and collect data for a long run, yourhistograms would show statistically significantand relatively narrow spikes at times that cor-respond to cable reflections. In fact, up to four
spikes can be observed spaced every 65 ns fromthe previous one. (65 ns is the time it takesfor a pulse to reflect from the discriminatorinput, reflect again at the PMT, and returnto the discriminator input where it might trig-ger another logic pulse.) The histogram spikescan be observed out to a time of around 270 ns(four reflections) and render data in this rangeand below corrupted by the spikes and unus-able for analysis. Hence the 300 ns (30 clockcycle) min time. Of course, it is difficult tounderstand how a stop pulse from a fourth re-flection could be observed in the histogram.Why wasn’t the interval already stopped bya logic pulse from a prior reflection? In anycase, there might be a real muon decay stoppulse that will arrive after this time. Thusstop pulses before the min time are ignoredand the software continues looking for a stoppulse for the current start pulse.
Analysis of Lifetime Data
Sum all four histogram columns to get a sin-gle histogram for a fit. Fit the decay timehistogram to a combination of an exponentialand a flat background. That is, the predictedmean for each histogram bin i is given by:
yfiti = A+Be−ti/τ (16)
where A, B, and τ are the fitting parametersand ti is the time corresponding to the bin.The justification for this fitting function canbe found in the addendum: Muon LifetimeMeasurement with a link on the course webpage for this experiment.
Consecutive histogram bins are separatedby the 10 ns clock period, which you can as-sume is highly accurate and should not be afactor in the error analysis for the muon life-time. As discussed in the statistical analysisbook, to perform the fit, you can either max-imize the Poisson log-likelihood function or,
March 31, 2021
Cosmic Ray Muons and the Muon Lifetime CRM 17
equivalently, use iterated least squares. Forthe latter technique, the chi-square is mini-mized with respect to A, B and τ using σ2
i
fixed at the value yfiti from the prior minimiza-
tion. The σ2i should be updated after the fit
to the new yfiti and fixed there for the next chi-
square minimization. Continue iterating untilthe yfit
i converge. When finished, calculate thefitting parameter covariance matrix or use the∆χ2 = 1 rule to determine the uncertainty inthe muon lifetime.
If you set the min time below the default 30clock cycle value, you will have to make surethe chi-square or log-likelihood sum excludesthe first few channels which will all be zerodue to the debouncing part of the software al-gorithm. And you should also exclude the twoor three groups of channels near the front ofthe histogram which will have frequencies wellabove the predictions and are due to one ormore reflections of pulses at the ends of thecables. They can be easily eliminated fromthe fit by starting the sum just after the en-hancement due to the last reflection. If youused the default min time, all counts below 30will be zero, and your sum should start afterthat.
C.Q. 6 (a) How does your measurement ofthe muon lifetime compare to expectations?(b) Convert the fitted background level (param-eter A of the fit) to a rate (by dividing by theacquisition time) and compare it with a predic-tion that this rate arises from random eventsnot associated with muon decay.
For the prediction, treat each paddle pairseparately and add the results. Recall thatfor each pair, there are two possible start/stopevent pairs and each possibility adds a com-ponent to the background rate. Only a tinyfraction of start events will ever get a stopevent within the 20 µs limit and so the randomcomponent rate in any bin associated with ei-ther start/stop possibility is equal to the rate
of start events (either a full double or an in-dependent single in the upper detector) timesthe probability for a random stop event (a fullsingle in either the lower or upper detector, re-spectively) to occur in the time interval associ-ated with that bin. The probability of a randomstop event occurring in any 10 ns bin intervalis the rate of that stop event times 10 ns.
(c) Use the fit parameters B and τ (for thehistogram sum for both paddle pairs) to de-termine the number of muons that decay inthe either scintillator of either pair. Hint:the fitted number of counts in the exponen-tial component of the histogram at any ti isn(ti) = A exp(−ti/τ). Sum this quantity overall ti by converting the sum to an integral∑
n(ti) =1
∆t
∑n(ti)∆t
=1
∆t
∫n(ti) dt (17)
where ∆t is the bin size. Use this number andthe acquisition time to calculate the rate ofmuons decaying in any scintillator. Expressthis rate as a fraction of the rate at whichmuons pass into either scintillator pair (thesum of the doubles rate for each pair) Thisfraction is then an estimate of the probabil-ity that a muon passing into a scintillator pairwill stop and decay in that pair.
C.Q. 7 Optional conversation question:“How often do muons decay in your body?”Or: “How often do positrons and electronsannihilate one another in your body?” Bothanswers will be a rate. Because half the muons(the µ+) decay into positrons (which thenalmost always find an electron to annihilatewith), the answer to the second question is halfthe answer to the first. Hints: Assume yourbody is a suitably-sized rectangular solid. Useyour telescope-mode doubles measurementstaken at θ = 0 (for the top rectangle) andθ = π/2 (for the side rectangles) to determine
March 31, 2021
CRM 18 Advanced Physics Laboratory
the rate at which muons enter through the topand the four sides. Why don’t any enter fromthe bottom rectangle? Note that at θ = π/2the scintillator surface is vertical and muonswill pass though from either side. Thus, themeasured doubles rate in this orientation willbe twice the rate at which muons pass in fromone side only. The number which decay inyour body is some fraction of the numberthat enter. To estimate this fraction use theresults of C.Q. 6c, but because the muon pathswill, on average, be longer in your body thanin a paddle pair, this fraction will be a fewtimes larger (a factor of five, say?) for yourbody than for a paddle.
March 31, 2021