Embed Size (px)
Citation preview

The onset of Alzheimer’s disease (AD) is accompanied by a complexand distributed pattern of neuroanatomic change, difficult todistinguish clinically from dynamic alterations in normal aging.Extreme variations in the sulcal patterns of the human cortex havemade it difficult to identify diffuse and focal variations in corticalstructure in neurodegenerative disease. We report the firstcomprehensive 3D statistical analysis of deep sulcal structure invivo, in both normal aging and dementia. High-resolution 3DT1-weighted fast SPGR (spoiled GRASS) MRI volumes were acquiredfrom 10 patients diagnosed with AD (NINCDS-ARDRA criteria; age:71.9 ± 10.7 years) and 10 normal subjects matched for age (72.9 ±5.6 years), gender, educational level and handedness. Scans weredigitally transformed into Talairach stereotaxic space. To determinespecific patterns of cortical variation in dementia patients, 3Daverage and probabilistic maps of primary deep sulci weredeveloped for both normal and AD groups. Major sulci (includingsupracallosal, cingulate, marginal, parieto-occipital, anterior andposterior calcarine sulci, and Sylvian fissures) were modeled ascomplex systems of 3D surfaces using a multi-resolution parametricmesh approach. Variations and asymmetries in their extents,curvature, area and surface complexity were evaluated. Three-dimensional maps of anatomic variability, structural asymmetryand local atrophy indicated severe regionally selective fiber loss inAD. A midsagittal area loss of 24.5% at the corpus callosum’sposterior midbody (P < 0.025) matched increases in structuralvariability in corresponding temporo-parietal projection areas.Confidence limits on 3D cortical variation, visualized in 3D, exhibitedsevere increases in AD from 2 to 4 mm at the callosum to a peak SDof 19.6 mm at the posterior left Sylvian fissure. Normal Sylvianfissure asymmetries (right higher than left; P < 0.0005), mapped forthe first time in three dimensions, were accentuated in AD (P <0.0002), and were greater in AD than in controls (P < 0.05). SevereAD-related increases in 3D variability and asymmetry may reflectdisease-related disruption of the commissural system connectingbilateral temporal and parietal cortical zones, regions known to be atrisk of early metabolic dysfunction, perfusion deficits and selectiveneuronal loss in AD.
Alzheimer’s disease (AD) causes complex and distributed
patterns of neuroanatomic change, which are difficult to
distinguish clinically from structural alterations observed in
normal aging. Extreme variations in the gyral and sulcal patterns
of the human cortex make it difficult to identify group-specific
variants in cortical structure, including diffuse alterations due to
neurodegenerative disease. This is partly due to the lack of a
precise mathematical framework for encoding and retaining
information on local variability of structure across homogeneous
populations (Grenander and Miller, 1994; Mazziotta et al., 1995;
Thompson and Toga, 1997; Thompson et al., 1997). Diagnosis of
AD prior to death remains one of exclusion; definitive diagnosis
requires histologic findings of diffuse neuronal and synaptic loss
post mortem, accompanied by characteristic neuropathologic
lesions (McKhann et al., 1984; Khachaturian et al., 1985) such as
β-amyloid plaques (Delaere et al., 1989), neurofibrillary tangles
(Wilcock and Esiri, 1982), Hirano bodies (Katzman, 1986)
and granulovacuolar degeneration (Di Patre, 1990). Accurate,
reproducible and practical detection and classification of
anatomic differences presents considerable challenges, but
holds tremendous promise in characterizing disease-related
change.
Structural neuroimaging is important in the evaluation and
monitoring of patients with dementia (Davis et al., 1994).
Computed tomography (CT) and magnetic resonance imaging
(MRI) studies in AD reveal atrophy of the temporal lobe (Kido et
al., 1989; Erkinjuntti et al., 1993; Killiany et al., 1993), cortical
gray matter, and caudate, lenticular and thalamic nuclei (Jernigan
et al., 1991), with sporadic signs of ventricular and sulcal
enlargement. Early damage occurs in the entorhinal cortex
(Arnold et al., 1991; Braak and Braak, 1991; Gómez-Isla et al.,
1996), the posterior aspect of the basal nucleus of Meynert
(which has strong projections to the temporal lobe; Whitehouse
et al., 1981), the amygdaloid nuclei (Cuénod et al., 1993; Scott,
1993) and the CA1/subiculum zone of the hippocampal
formation (West et al., 1994). These disease-induced changes in
structure often escape detection, because of complex inter-
subject differences in anatomy. Identifying early neuroimaging
indicators of AD has been complicated by the overlap between
structural changes seen in normal aging and dementia (Friedland
and Luxenberg, 1988), and controversy still exists as to whether
aging and AD are dichotomous or represent a neuropathological
continuum (Coleman and Flood, 1987; West et al., 1994).
Cortical variation has also made it difficult to compare and
integrate functional image data from multiple subjects and
groups (Rademacher et al., 1993; Roland and Zilles, 1994).
These difficulties are compounded in dementia by additional
pathologic changes. Averaging of digital brain maps, after trans-
formation into a common 3D coordinate space, is only valid if
homologous cortical regions in different subjects are brought
into register. Anatomic correspondence is especially critical
at functional interfaces and cytoarchitectonic boundaries,
including junctional zones between adjacent microanatomic
fields, most of which run along the beds and deep internal banks
of major or minor cortical sulci (Sanides, 1962). Direct reference
to the sulci that frame architectonic fields may present a more
reliable basis for functional mapping than reference to a single
standard or idealized brain (Steinmetz et al., 1990; Rademacher
et al., 1993; Watson et al., 1993).
The first 3D analysis of sulcal variability, measured in a post
mortem population with digitally reconstructed cryosection
images, found a highly heterogeneous pattern of cortical
variation (Thompson et al., 1996a). Despite their relevance for
functional brain mapping studies in health and disease,
characteristics of 3D cortical variation have not been deter-
mined in vivo. Superficial variations in sulcal geometry have
Cortical Variability and Asymmetry inNormal Aging and Alzheimer’s Disease
P.M. Thompson, J. Moussai, S. Zohoori, A. Goldkorn, A.A.
Khan, M.S. Mega, G.W. Small1, J.L. Cummings1 and A.W. Toga
Laboratory of Neuro Imaging, Department of Neurology,
Division of Brain Mapping and1Alzheimer’s Disease Center,
UCLA School of Medicine, Los Angeles, CA, USA
Cerebral Cortex Sep 1998;8:492–509; 1047–3211/98/$4.00
been reported, based on analysis of post mortem specimens, in
primary motor, somatosensory and auditory cortex (Rademacher
et al., 1993), primary and association visual cortex (Stensaas
et al., 1974), frontal and pre-frontal areas (Rajkowska and
Goldman-Rakic, 1995), and lateral perisylvian cortex (Geschwind
and Levitsky, 1968; Ono et al., 1990). Current quantitative
information on sulcal variability in vivo is two-dimensional,
based on 2D pneumoencephalograms (Talairach et al., 1967),
series of 5- or 9-mm-thick MR images (Missir et al., 1989;
Steinmetz et al., 1989, 1990) and MR-derived surface renderings
of the cortex (e.g. Vannier et al., 1991). In addition to the
sampling frequency limitations, these investigations represented
sulci as superficial curves between the outer extremities of
opposing gyri, rather than as complex 3D architectonic surfaces
that merge and branch deep inside the brain.
To spatially characterize the morphometric variability in the
interior surface anatomy of the brain, we modeled major sulci as
complex connected systems of surfaces. A multi-resolution
parametric mesh approach was used (Thompson et al.,
1996a,b). We selected the following primary sulci for 3D
reconstruction and analysis: the supracallosal sulcus, the
cingulate and marginal sulci, the anterior and posterior rami of
the calcarine sulcus, the parieto-occipital sulcus, and the Sylvian
fissure in both hemispheres. These 3D gyral boundaries
encompass the callosal, temporo-parietal and paralimbic belts
known to be at risk of bilateral atrophy in AD (Friedland and
Luxenberg, 1988), as well as perisylvian regions expected to
display profound structural asymmetries in normal subjects
(Galaburda and Geschwind, 1981), and the parieto-occipital and
calcarine surfaces of the occipital cortex, which are thought to
be comparatively resistant to neuronal loss in AD (Pearson et al.,
1985). As major functional interfaces in the brain, these primary
sulci are also easily identifiable, define gyral and lobar
boundaries, and penetrate sufficiently deeply into the brain to
ref lect subtle and distributed variations in neuroanatomy
between individuals.
Goals of this Paper
This paper has two specific goals. First, to determine specific
patterns of sulcal variation in patients with AD, we developed
3D average and probabilistic maps of the primary deep sulci.
Separate maps were constructed for AD patients and for elderly
normal subjects matched for age, gender, educational level and
handedness. These computerized 3D maps yield information
on differential vulnerability of brain regions, disease-specific
variants and selective changes in callosal and lobar anatomy that
accompany aging and AD pathology. The maps encode the
parameters of normal neuroanatomic variation, and express the
coordinates and variability in location of 12 major cortical sulci
in stereotaxic space. Application of the probabilistic atlasing
approach (Mazziotta et al., 1995; Thompson and Toga, 1998) to
a diseased population results in a confidence limit, rather than
an absolute representation of anatomy for each subject group.
Secondly, comprehensive maps of structural asymmetry are
generated, and the pronounced asymmetries of the Sylvian
fissure (Geschwind and Levitsky, 1968), a region central to many
investigations of functional lateralization and the neurologic
basis of language function, are characterized for the first time in
three dimensions. Differences in the extent, curvature, surface
area and complexity of deep anatomic surfaces are quantified in
health and disease. Where appropriate, results are expressed
within the Talairach reference system, enabling direct reference
to results of functional neuroimaging studies. The resulting
framework for assessment and quantitative encoding of cortical
variation reveals its regional heterogeneity, local directional
biases, asymmetries and 3D characteristics in aging and
dementia.
Materials and Methods
Subjects
High-resolution 3D structural MR images were acquired from 20
subjects, matched for age, gender, educational level and handedness.
The patient group included 10 subjects (mean age: 71.9 ± 10.7 years;
six females/four males, all right-handed) diagnosed with AD as
defined by the National Institute of Neurological and Communicative
Disorders and Stroke/Alzheimer’s Disease and Related Disorders
Association (NINCDS-ARDRA) criteria (McKhann et al., 1984). Although
definitive diagnosis of AD requires direct observation of autopsy or
biopsy specimens with characteristic neuropathologic lesions (McKhann
et al., 1984; Khachaturian, 1985), the accuracy of the NIH criteria
evaluated at autopsy has been demonstrated to be 80–85% (Blacker et al.,
1994). Criteria for dementia included an acquired persistent decline
involving at least three of the following domains: language, memory,
visuospatial skills, cognition, emotion or personality (Cummings et al.,
1980).
In addition, the Mini-Mental State Examination (MMSE; Folstein et al.,
1975) was used to evaluate dementia severity. As part of a longitudinal
neuropsychiatric assessment, patients underwent a comprehensive
clinical evaluation which included a neuropsychological battery to assess
a broad range of cognitive domains (Table 1). The AD patient group had a
mean educational level of 13.9 ± 1.4 years and a mean MMSE score of
19.7 ± 5.7 (maximum score: 30), a rating comparable with values
obtained in other dementia studies (Murphy et al., 1993). Control
subjects (mean age: 72.9 ± 5.6 years; six males/four females, all
right-handed), after screening, underwent the same battery of
neuropsychiatric tests, to exclude subjects with cognitive symptoms of a
dementing illness. Their mean MMSE score was 28.8 ± 1.0, and they were
matched with the AD subjects for age, gender, handedness and
educational level (15.8 ± 2.4 years). Exclusion criteria for all subjects were
the presence of a focal lesion on brain MRI, history of head trauma, past
Table 1Demographic and neuropsychiatric test data for the AD patients (n = 10; data courtesy ofMichael Mega)
Mean ± SD
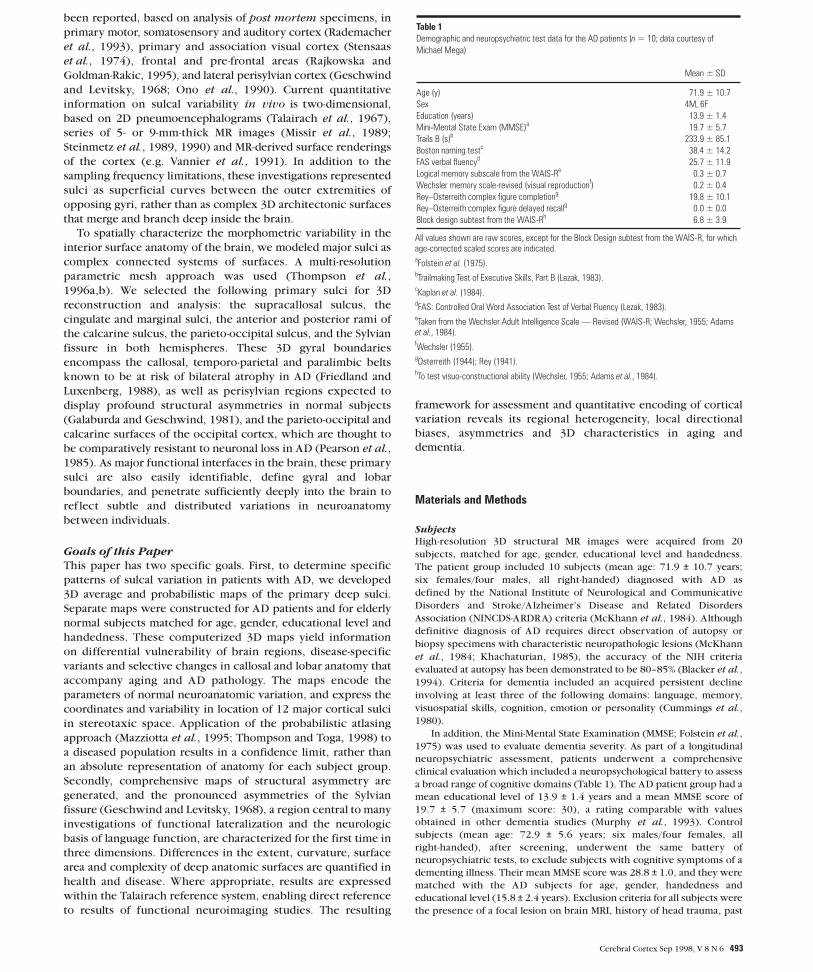
Age (y) 71.9 ± 10.7Sex 4M, 6FEducation (years) 13.9 ± 1.4Mini-Mental State Exam (MMSE)a 19.7 ± 5.7Trails B (s)b 233.9 ± 85.1Boston naming testc 38.4 ± 14.2FAS verbal fluencyd 25.7 ± 11.9Logical memory subscale from the WAIS-Re 0.3 ± 0.7Wechsler memory scale-revised (visual reproductionf) 0.2 ± 0.4Rey–Osterreith complex figure completiong 19.8 ± 10.1Rey–Osterreith complex figure delayed recallg 0.0 ± 0.0Block design subtest from the WAIS-Rh 6.8 ± 3.9
All values shown are raw scores, except for the Block Design subtest from the WAIS-R, for whichage-corrected scaled scores are indicated.aFolstein et al. (1975).bTrailmaking Test of Executive Skills, Part B (Lezak, 1983).cKaplan et al. (1984).dFAS: Controlled Oral Word Association Test of Verbal Fluency (Lezak, 1983).eTaken from the Wechsler Adult Intelligence Scale — Revised (WAIS-R; Wechsler, 1955; Adamset al., 1984).fWechsler (1955).gOsterreith (1944); Rey (1941).hTo test visuo-constructional ability (Wechsler, 1955; Adams et al., 1984).
Cerebral Cortex Sep 1998, V 8 N 6 493

psychiatric history or an active medical problem. Informed consent was
obtained in all cases from patients and controls.
High-resolution 3D MR Image Acquisition
Three-dimensional (2562 × 124 resolution) T1-weighted fast SPGR (spoiled
GRASS) MRI volumes were acquired sagittally from the 20 subjects, on a
GE Signa 1.5T clinical scanner (Milwaukee, Wisconsin) with TR/TE
14.3/3.2 ms, f lip angle 35°, NEX = 1, FOV 25cm and contiguous
1-mm-thick slices (with no interslice gap) covering the entire brain. The
greater slice density, combined with a high in-plane pixel resolution
(0.9765 × 0.9765 mm), resulted in an improved resolution imaging matrix
relative to earlier studies of aging and AD pathology [e.g. slices acquired
every 5 mm (Cuénod et al., 1993), or every 6 or 7 mm (Murphy et al.,
1993)].
Reconstruction, Normalization and Analysis
Three-dimensional image data were corrected for differences in relative
position and size by transformation into standardized Talairach
stereotaxic space [Talairach and Tournoux (1988); software developed
at the UCLA Laboratory of Neuro Imaging, and available at:
http://www.loni.ucla.edu/loni_code/loni_dist.html]. Structural brain
imaging measurements, even in dementia studies (Killiany et al., 1993;
Murphy et al., 1993), are often adjusted for normal variation in head size
or brain size, to avoid confounding variance (Mathalon et al., 1993). Since
we regarded brain size to be an important factor in aging and AD
pathology, the geometric parameters of the stereotaxic normalization
were explicitly saved for analysis, allowing us to perform a coarse-to-fine
morphometric analysis, at both global and local anatomical scales. At the
global level, the parameters of the stereotaxic transformation were
retained, to evaluate differences in brain size between the two groups.
Next, the standard stereotaxic transformation was applied to the image
volumes, placing them in a 3D coordinate system which compensates for
these differences in overall brain size. As a result, the locations and
extents of local differences in sulcal morphology, including structural
asymmetries, are expressed in the Talairach reference system, enabling
direct comparison with results of functional neuroimaging studies (Fox,
1995).
Subsequent anatomic analysis was conducted by operators blind to
each subject’s age, name and diagnostic status. Scans were analyzed only
after being numerically coded and loaded in random order. Since results
on anatomic asymmetry were anticipated, half of the scans from each
subject group were randomly selected, and a digital transformation was
applied to ref lect the left and right hemispheres of the image data in the
midsagittal plane. This ensured that structures were traced without
knowledge of which hemisphere was being analyzed. Additional
software transformed the derived surface data back into its appropriate
hemisphere, prior to surface averaging and further geometric and
statistical analysis.
Criteria for Delineating Sulci
Major deep sulcal fissures in the brain were reconstructed using a
contour-based system. Using an interactive contouring program, all sulci
were outlined manually, according to the detailed anatomic criteria set
out in Steinmetz et al. (1989). Additional formal guidelines were devised
and applied when identifying the exact course of individual sulci in three
dimensions (Thompson et al., 1996a).
The cellular interface between gray and white matter was used to
define the opposing banks of the sulci, rather than the more diffuse
boundary of gray matter at the external limit of the cortical layer.
Consequently, the internal path of each sulcus was defined as the medial
curve equidistant between the opposing white matter banks on either
side. In rare cases, where the white matter was faint, adjacent sections
were viewed for additional information. At high magnification, the
outline of each sulcus was defined to be the medial axis equidistant from
each bank. This contour was traced manually in all the sagittal sections in
which it could be distinguished. At the external cerebral surface, the
convex hull of the cortex served as an exterior limit. Figure 1 shows a
sagittal projection of several sets of contours traced in the left hemisphere
of one subject. Stereotaxic locations of contour points were derived from
the data volume.
Surface Reconstruction from Planar Cross-sections
Interactive outlining of sulci, as described above, resulted in a sampling of
∼15 000 points per sulcus. Although this dense system of points captures
the details of each sulcal surface at a very local level, their spatial
distribution is not quite uniform, and is arbitrarily dependent on how the
sagittal sampling planes intersect the sulcus being outlined. To eliminate
this dependency, we derived a standard surface representation of the
same type for each sulcus. For each sulcus outlined, this algorithm
generates a parametric grid of 100 × 150 uniformly spaced points that act
as nodes in a regular rectangular mesh stretched over the sulcal surface.
Full technical details of the mesh construction algorithm can be found in
Thompson et al. (1996a) and Thompson and Toga (1997). Brief ly, each
resultant surface mesh is analogous to a regular rectangular grid, drawn
on a rubber sheet, which is stretched to match all the data points. This
scheme converts dense irregular systems of points, sampled during
outlining, into regular parametric surfaces that can be analyzed,
visualized, and compared geometrically and statistically. Under certain
strict conditions, the imposition of regular grids onto biological surfaces
permits cross-subject comparisons, by specifying a computed
correspondence along the outline arcs and within the interior of the
structures (Bookstein, 1985). For the comparisons to be valid,
anatomically defined landmark points and curves must appear in
Figure 1. Sagittal projection of contours traced in the left hemisphere of a singlesubject. Orthogonally projected contours of the anterior and posterior rami of thecalcarine sulcus (CALCa and CALCp), cingulate (CING), supracallosal (CALL) andparieto-occipital (PAOC) sulci are shown overlaid on one representative sagittal sectionof an Alzheimer’s patient’s scan. The Sylvian fissure (not shown here) was alsoanalyzed, but is lateral to this section. Contour sets shown here were derived from thefull series of sectional images spanning the left hemisphere.
Figure 2. Scheme for matching connected systems of anatomic surfaces. Accuratedetection and encoding of anatomic differences between subjects requirestransformation tools that deform connected systems of mesh-based surface models(right) representing structures in one subject’s anatomy, into correspondence withtheir counterparts (left) in the anatomy of another subject. The computation isconceptualized mathematically as a surface-based displacement map, which deformsone system of surfaces into the shape of another. Maintenance of information onsurface connectivity guarantees accurate mapping of curved junctions among surfaces.Known anatomic landmarks are also used to constrain the transformation, ensuringbiological as well as computational validity.
494 3D Cortical Variation: Aging and Alzheimer’s Disease • Thompson et al.

corresponding locations in each parametric grid across subjects. Figure 2
illustrates this procedure, in a case where three surface meshes in one
brain are matched with their counterparts in a target brain. Exact
matching is guaranteed at a 3D junction between the surfaces. Mesh
partitioning strategies such as these (Thompson and Toga, 1997) ensure
that known anatomic correspondences are enforced at anatomic
junctions and boundaries.
Measures of Spatial Extent, Surface Curvature, Area and Fractal
Dimension
Parameterization of sulcal outlines enables computation of local statistical
measures and geometric parameters such as surface area, curvature
indices and fractal dimension. Anterior–posterior, vertical and lateral
limits, and extents of all 240 anatomical models (20 subjects, 12
parametric meshes) were determined from the digitized outlines. Surface
area measures were also calculated. In addition, because one of the most
prominent features of the human cerebral cortex is its high degree of
convolution, normalized curvature measures were computed for all 240
sulcal surfaces. For each type of sulcus represented as a parametric mesh
{r(u,v)|0 ≤ u ≤ I, 0 ≤ v ≤ J} of fixed size I × J, a simple measure of surface
curvature was given by Curv(r) = {Σv=0 to J ||r(I,v) – r(0,v)||}/{Σv=0 to J Σu=1 to I
||r(u,v) – r(u – 1,v)||}. This formula can be explained as follows. For any
given slice in which a sulcal contour appears, the cumulative arc length,
measured along the contour, exceeds the direct length of a hypothetical
straight line joining the contour’s endpoints. Similarly, for each of the grid
lines in the mesh, this length excess can be expressed as a ratio which
ref lects the degree of inherent curvature in the surface along that grid
line. The normalized curvature index, Curv(r), is a more general ratio,
which takes all grid lines into account. Its value is given by adding up
the arc lengths along every grid line and dividing the total by the sum of
the direct lengths of straight lines joining each of the grid lines’
endpoints. Both surface area and curvature measures were defined on the
parametric meshes instead of the sample points initially acquired for each
sulcus.
Finally, the fractal dimension of each sulcal surface was calculated.
Fractal dimension is used as an indicator of structural complexity in
biological systems, ranging from bronchial and vascular trees to the
cerebral cortex itself (Cressie, 1991; Stoyan and Stoyan, 1991; Griffen,
1994). The measure is severely reduced for the cortex in disorders such as
epilepsy (Cook et al., 1994). To evaluate the surface complexity of each
structure in the AD patients and controls, an ordered hierarchy of
parametric meshes {MIJ} was generated for each sulcus S, with variable
resolution I × J (I = 2 to 100). If A{MIJ}represents the surface area of the
mesh MIJ, S has fractal dimension DimF(S) = 2 – {∂ ln A{MIJ}) /∂ln(1/I)}.
The gradient of the associated multifractal plot was obtained by least
squares regression of the function ln A{MIJ} against ln(1/I), over the range
2 ≤ I ≤ 100. This procedure was repeated for all 240 meshes.
Surface Averaging and Local Variability Measures
The relationship between two sulci of the same type was represented as
a map which displaces one surface mesh onto another in stereotaxic
space (Fig. 2). For each and every point on a surface mesh M1, and every
point on a similar mesh M2, the two points were matched if they had the
same grid location within their respective surfaces. For each such
association, the discrepancy was computed as a 3D displacement vector
between corresponding nodal points. When mapping a parametric grid
from one sulcal surface r(1)(u,v) to its counterpart in another brain
r(2)(u,v), a second criterion was enforced. This criterion ensured that the
amount of local stretching or contraction of the grid that resulted from
the mapping process, represented by the scalar field
θ(u,v) = [||∂r(2)(u,v)/∂u|| × ||∂r(2)
(u,v)/∂v||]/[||∂r(1)(u,v)/∂u|| ×
||∂r(1)(u,v)/∂v||]
was uniform across the whole surface. The resulting correspondence
field r(1)(u,v) → r(2)(u,v) between surfaces was therefore unaffected by,
and entirely independent of, any global translational or rotational shifts of
one surface relative to the other (Thompson et al., 1996a). Ultimately, this
procedure yielded a full displacement map for every pair of sulcal
surfaces of the same type.
For both the normal elderly and AD groups, an average surface
representation was derived, together with local measures of group
variability for each sulcal type, by averaging the 3D position vectors of
corresponding nodes across all 10 subjects in each group. Local measures
of spatial variance were based upon the availability of this average surface
representation, together with the concept of a displacement map (Fig.
2). A complete mathematical formulation of this notion can be found in
Thompson et al. (1996b, 1997) and Thompson and Toga (1997).
Confidence Limits for Cortical Regions in Stereotaxic Space
To quantify local variations in brain structure, confidence regions for the
location of sulcal points in stereotaxic space were determined. For each
subject group, these represent regions of stereotaxic space in which a
specific sulcal point is likely to fall with probability α, where α is any
desired confidence threshold. Brief ly, if r(1)(u,v), r(2)(u,v) . . . r(N)(u,v) are
3D locations of sulcal surface points indexed by mesh coordinates (u,v) in
N separate individuals, the 3D dispersion of these anatomic points around
their mean location rµ(u,v) = (1/N)Σr(i)(u,v) is indicated by the set of 3D
displacement vectors d(i)(u,v) = r(i)(u,v) – rµ(u,v). As shown elsewhere
(Thompson and Toga, 1997), if d(i)(u,v) has the multivariate normal
density on R3 with non-stationary covariance tensor Ψ(u,v), then for
any desired confidence threshold α, 100(1 – α)% confidence regions in
stereotaxic space, in which a point corresponding to rµ(u,v) will occur
with probability α in a randomly selected subject, are given by nested
ellipsoidal regions
Eλ(α)(x) = {p|[p – rµ(u,v)]T[Ψ(x)]
–1[p – rµ(u,v)] < λ(α)}
where λ(α) = [N(N – 3)/3(N2 – 1)]–1Fα,3,N–3, and Fα,3,N–3 is the critical value
of the F distribution with 3 and N – 3 degrees of freedom such that
Pr{F3,N–3 ≥ Fα,3,N–3} = α.
Three-dimensional Variability Maps
Profiles of variation from the average surfaces, for the Alzheimer’s and
control subjects, were derived locally across the surface of each anatomic
structure. If r(i)(u,v) is the 3D position in stereotaxic space of the point
with parametric coordinates (u,v) on the ith person’s mesh, then the
vector displacement map d(i)(u,v) = r(i)(u,v) – rµ(u,v) expresses the ith
surface’s local deviation from an ‘average mesh’, derived from all the
subjects in the group. This map assigns a 3D displacement vector to each
internal surface point. The root mean square (r.m.s.) magnitude of these
displacements, in the N surface maps di from average to individual,
provides a measure of that surface’s variability in stereotaxic space. The
values of this function are in millimeters of stereotaxic space. Profiles
of local variability were visualized (using Data Explorer 2.1, IBM
Visualization Software), as they varied across each anatomic surface, by
color-coding the surface representation of each sulcus.
Regional Analysis of Corpus Callosum Morphology
To determine whether there was a regionally selective pattern of callosal
change accompanying AD pathology, the morphology of the callosum at
the mid-sagittal plane was analyzed by partitioning it into five regions,
according to the strategy developed by Duara et al. (1991; see also Larsen
et al., 1992). Although other effective partitioning and analysis schemes
exist (Clarke et al., 1989; Witelson, 1989; Hynd et al., 1995; Davatzikos et
al., 1996), this regime is relatively simple to apply clinically, and digitally
divides the anterior–posterior extent of the callosum into fifths, the
anterior and posterior of which approximately represent the genu and
splenium respectively. This results in a segregation of callosal fibers
belonging to distinct cortical regions, since the topographic organization
of callosal fibers, in relation to the cortical regions they connect, enables
the construction of a map of cortical regions along the callosum (Pandya
and Seltzer, 1986). The cross-sectional area of each of these five callosal
subdivisions was determined for all 20 subjects, both before and after
transformation of the image data into Talairach stereotaxic space.
Statistical Tests
In addition to the surface maps of statistics on local variability, confidence
limits and structural asymmetry in three dimensions, two types of
statistical comparisons were planned and carried out between groups: (i)
Cerebral Cortex Sep 1998, V 8 N 6 495

comparisons of means from AD subjects and controls, using unpaired
Student’s t-tests, for specific structural parameters (e.g. regional callosal
area and parameters of the stereotaxic transform as indices of regional
atrophy); and (ii) comparisons between hemispheres, using paired t-tests,
in both controls and AD subjects, to assess anatomic asymmetry. To
control for multiple group comparisons, Bonferroni’s correction was
applied.
All 3D reconstruction programs were written in C and executed on
DEC Alpha AXP3000 workstations running OSF-1.
ResultsFrom the broad spectrum of neuroanatomic variables examined
here, numerous trends were clear. Global patterns of atrophy and
variation, such as widespread reductions in brain volume, are
described first. We proceed to a more local analysis of the typical
patterns of cortical variation in three dimensions. Finally, spatial
profiles of anatomic asymmetries are analyzed for each subject
group, and disease-specific alterations in specific sectors of the
Sylvian fissures, temporo-parietal cortex and corpus callosum are
investigated.
Patterns of Global and Regional Atrophy in AD
The geometric parameters of the stereotaxic normalization
(Talairach and Szikla, 1967) were retained for analysis, allowing
volume comparisons between groups for 12 brain sectors
defined by the Talairach system (Table 2; see legend for
definitions of specific brain sectors). A significant 8.2% volume
loss in AD subjects relative to controls was observed in the
central sector, falling from 438.6 ± 14.3 cm3 in controls (mean ±
SEM) to 402.6 ± 13.1 cm3in the AD group (P < 0.05). In the lower
central sector, a region lying below the anterior commissure–
posterior commissure (AC–PC) line and between the anterior
and posterior commissures, a 9.3% volume reduction was
observed in AD compared with age-matched controls (falling
from 165.4 ± 5.1 cm3 to 150.1 ± 4.8 cm3; P < 0.05). This volume
reduction represented the combined effect of three linear
factors: (i) a bilateral atrophy of the cerebral hemispheres,
whose width fell by 2.5% on the left (from 67.7 ± 0.7 mm in
controls to 66.0 ± 0.9 mm in AD) and by 3.0% on the right (from
66.7 ± 0.8 mm in controls to 64.7 ± 0.9 mm in AD); (ii) a 3.6%
reduction in the AC–PC distance from 28.5 ± 0.7 mm in controls
to 27.5 ± 0.4 mm in the AD group; and (iii) a 3.1% decrease in the
vertical distance of the temporal lobe tip from the AC, falling
from 43.2 ± 0.6 mm in controls to 41.8 ± 0.9 mm in the AD
group. While sector volumes only indirectly ref lect cerebral
atrophy, and are not conventional neuroimaging indicators of
dementia, it was notable that the central sector volume, which
can be calculated rapidly, still differentiated the two subject
groups (P < 0.05).
Striking trends were also revealed when specific neuro-
anatomic indices, calculated for each subject group, were com-
pared with their reference values prescribed by the Talairach
system (Talairach and Szikla, 1967; Talairach and Tournoux,
1988). Extents of the brain along the three orthogonal axes,
prior to stereotaxic transformation, the combined volume of all
12 brain sectors and the internal AC–PC distance were analyzed
by a two-tailed t-test, to identify group departures from canonical
values. Strict Bonferroni criteria were applied and planned
comparisons were enforced to control for Type I error (Table 3).
In the AD patients, the mean rostro-caudal and lateral extents of
the brain (165.2 ± 2.0 and 130.7 ± 1.7 mm respectively) were
significantly depressed when compared with their reference
values (P < 0.05, after Bonferroni correction). By contrast, in
age-matched controls, neither rostro-caudal, lateral nor vertical
extents of the brain were significantly different from their
respective reference values (166.4 ± 3.1, 134.4 ± 1.7 and 114.4 ±
1.1 mm; all P > 0.05). In addition, while the combined volume of
all 12 brain sectors was not significantly different from its
reference value of 2773.0 cm3
in controls (2562.3 ± 78.6 cm3;
P > 0.05), the same measure in the group of Alzheimer’s patients
was significantly reduced (2424.6 ± 83.4 cm3; P < 0.05 after
Bonferroni correction; P < 0.005 uncorrected).
Despite considerable inter-subject variation, the Talairach
system served as a statistically acceptable approximation to
the linear brain dimensions of the elderly control group (q.v.,
Table 3). The sole exception was that the intercommissural
AC–PC distance was greater in both subject groups (P < 0.05)
than the standard value of 23.5 mm established by Talairach,
reaching values of 27.5 ± 0.4 mm in the AD group and 28.5 ± 0.7
mm in controls.
Three-dimensional Variability Maps in Aging and AD
When confidence regions were computed for normal subjects’
cortical regions in stereotaxic space, striking local trends came
to light (Fig. 3). First, indices that ref lected the overall magnitude
of variability for a sulcal surface were remarkably consistent
from one sulcus to another (Table 4). In the control group, the
mean 3D deviation of individual sulci from the average surface
representation of sulcal anatomy was in the 6.1–8.3 mm range
for all structures except the corpus callosum, whose 3D
deviation from the mean averaged only 4.0 mm in both
hemispheres and fell to a low point of 2.8 mm at the inferomedial
limit of the splenium. However, these summary measures of
variability disguised the extremely heterogeneous profiles of
variability across the surfaces of individual sulci (Fig. 3). As
observed in preliminary post mortem studies (Thompson et al.,
Table 2Regional cerebral volume indices in AD and normal aging
Region Controls (cm3) AD (cm3) AD volumereduction (%)
Total cerebral volumeindexa (cm3)
2562.3 ± 78.6 2424.6 ± 83.4 5.4
(as % of Talairachreference brainb)
(92.4% ± 2.8%) (87.4% ± 3.0%)
Specific brain sectorsc
Frontal 994.2 ± 32.4 960.2 ± 44.1 3.4(88.6% ± 2.9%) (85.6% ± 3.9%)
Parieto-occipital 1129.5 ± 42.5 1062.0 ± 30.4 6.0(88.6% ± 3.3%) (83.3% ± 2.4%)
Central 438.6 ± 14.3 402.6 ± 13.1 8.2 (**P < 0.05)(116.4% ± 3.8%) (106.9% ± 3.5%)
Specific brain sectors defined by the Talairach stereotaxic reference system exhibited pronouncedvolume reductions in AD relative to age-matched control subjects.aWhile volumes of these sectors are not measures of tissue volume per se, the central sectorvolume still differentiated the two subject groups (P < 0.05). As a product of three simple linearmeasures, this index may be more readily calculated than cerebral volume, offering a convenientindex of disease-specific tissue loss in three dimensions. When the central sector is furtherpartitioned into upper and lower sectors, lying above and below the AC–PC line respectively,volume loss due to AD in the lower central sector reached 9.3%, and only two control subjectshad a sector volume below while only two AD subjects had a sector volume above (158 cm3).Sector volumes are expressed here in cm3 (as a mean ± SEM for each subject group)bSector volumes expressed as a percentage (shown in parentheses) of corresponding sectorvolumes for the Talairach standard reference brain, which forms the basis of the internationallyaccepted stereotaxic reference system for human functional neuroimaging studies (Fox, 1995).cRegions are defined as follows: a rotational alignment of the image volume horizontally orients theline connecting anterior and posterior commissures (AC–PC line) and vertically orients theinterhemispheric plane. A rectangular bounding box is defined around the brain tissue, and in thisbox regions anterior to the AC and posterior to the PC are designated frontal and parieto-occipitalrespectively, with a central region lying between the two commissures.
496 3D Cortical Variation: Aging and Alzheimer’s Disease • Thompson et al.

1996a), local variability was consistently higher towards the
exterior cortical surface. For the parieto-occipital, posterior
calcarine, cingulate sulci and Sylvian fissures in both brain
hemispheres, confidence limits on 3D variation increased
dramatically from an SD of 2–4 mm internally to a peak of 12–13
mm at the exterior cerebral surface. By contrast, however,
variability at the superior callosal surface and at the f loor of the
cerebral aqueduct (which was included as a control structure,
expected to show minimal variability) never exceeded an SD of
5.7 and 4.4 mm respectively, although variability at the aqueduct
rose slightly with increasing distance from the posterior com-
missure (correlation coefficient r = 0.95 in both controls and
AD).
These regional phenomena are not surprising, given that the
Talairach system fixes the locations of the two commissures, and
is accordingly more effective at reconciling population variances
close to these control points. In particular, for the posterior
calcarine sulci, the measure of 3D r.m.s. variability rose in
controls at an estimated rate of 0.11 mm per mm distance from
the PC on the left (r = 0.89) and 0.08 mm per mm from the PC on
the right (r = 0.86). AD patients displayed similarly striking
increases in cortical variability towards the exterior cerebral
surface, rising to a slightly higher peak value (10.9 mm) than that
seen in controls (10.1 mm). Local variability rose at a rate of 0.08
mm per mm from the PC on the left (r = 0.79) and 0.06 mm per
mm from the PC on the right (r = 0.72). Sulcal variability in the
occipital lobe as a whole was more strongly correlated with 3D
distance from the PC in controls (r = 0.62) than in AD (r = 0.13),
perhaps ref lecting a secondary process of disease-related
atrophy in neighboring parietal areas.
More surprising was the high degree of variability found in the
deep anterior cingulate (SD: 11.7 mm) and the pronounced
increase in variability towards the posterior limits of the Sylvian
fissures (rising sharply from an SD of 5.9 mm rostrally to 12.0
caudally on the left and from 4.8 mm rostrally to 12.1 mm
caudally on the right). Sharp increases in local variability in these
anterior limbic and posterior temporal zones may be attributable
to multiple branching patterns, and variations in the incidence
and topology of neighboring accessory gyri (Galaburda and
Geschwind, 1981; Ono et al., 1990; Leonard, 1996; Paus et al.,
1996a,b).
Alzheimer’s Disease
Three-dimensional variability maps constructed for the same
regions in the group of Alzheimer’s subjects largely corroborated
these control observations (Fig. 4). This time, however,
confidence limits on 3D variation showed an extraordinary
increase from an SD of 2.2–6.1 mm internally at the corpus
callosum to a peak of 19.6 mm at the posterior limit of the left
Sylvian fissure. As found in the control group, variability at the
superior callosal surface and at the f loor of the cerebral
aqueduct never exceeded an SD of 6.1 and 3.7 mm respectively,
while the variability across the surface of the Sylvian fissure rose
extremely sharply from an SD of 6.0 mm rostrally to 19.6 mm
caudally on the left and from 5.0 mm rostrally to 9.0 mm caudally
Table 3Three-dimensional neuroanatomic indices in aging, AD and the Talairach stereotaxic system
Measurement Talairach referencevalue
Controls (%) AD (%)
Linear measures (mm)Total rostral extent 173.0 96.2 ± 1.8‡ 95.5 ± 1.1**
AC–PC distance 23.5 121.2 ± 2.8*** 116.8 ± 1.7***AC to frontal limit 70.0 92.1 ± 1.5 93.2 ± 1.9PC to occipital limit 79.5 92.3 ± 2.9 91.2 ± 1.5
Total vertical extent 117.0 97.8 ± 1.0‡ 95.7 ± 1.8‡Above AC–PC line 74.5 95.6 ± 1.6 94.2 ± 1.9Below AC–PC line 42.5 101.5 ± 1.4 98.3 ± 2.0
Total lateral extent 137.0 98.1 ± 1.0‡ 95.4 ± 1.3**Left hemispheric width 68.5 98.9 ± 1.0 96.4 ± 1.4Right hemispheric width 68.5 97.3 ± 1.1 94.4 ± 1.4
Brain sector volumes (cm3)All brain sectors combined 2773.0 92.4 ± 2.8‡ 87.4 ± 3.0**
Upper frontal 714.5 86.8 ± 3.4 84.3 ± 4.0Lower frontal 407.6 91.8 ± 2.5 87.9 ± 4.0Upper parieto-occipital 811.4 86.7 ± 3.5 82.1 ± 2.5Lower parieto-occipital 462.9 92.1 ± 3.6 85.4 ± 2.5Upper central 239.9 113.9 ± 4.2 105.2 ± 3.6Lower central 136.8 120.9 ± 3.7 109.7 ± 3.5
Striking trends were revealed when specific neuroanatomic indices, calculated for each subjectgroup, were compared with their reference values prescribed by the Talairach system (Talairachand Szikla, 1967; Talairach and Tournoux, 1988). Extents along the three orthogonal axes prior tostereotaxic transformation, the resulting index of cerebral volume and the internal AC–PC distancewere analyzed by a two-tailed t-test to identify group departures from canonical values. Measuresare expressed here as a percentage of the standard parameters for the Talairach reference brain(mean ± SEM for each subject group). Strict Bonferroni criteria were applied and plannedcomparisons were enforced to control for Type I error. Only comparisons planned in advance(indicated by symbols) were therefore evaluated statistically. In the AD patients, the meanrostro-caudal and lateral extents of the brain, as well as the resulting combined volume of all 12brain sectors were significantly depressed when compared with their reference values (P < 0.05,even after Bonferroni correction for multiple comparisons). By contrast, in age-matched controls,neither the combined volume nor the rostro-caudal, lateral or vertical extents of the brain weresignificantly different from their respective reference values (all P > 0.05). Note the considerablygreater value of the intercommissural AC–PC distance in both subject groups than the standardvalue of 23.5 mm established by Talairach. This disparity underscores the need to develop moreflexible atlas systems which explicitly reflect the anatomy of different population subgroups, basedon an empirical analysis and 3D encoding of group-specific patterns of neuroanatomic variation(Mazziotta et al., 1995; Thompson and Toga, 1997; Thompson et al., 1997).
**Significantly decreased, P < 0.05 (after Bonferroni correction), relative to Talairach referencevalue.
***Significantly larger, P < 0.005 (after Bonferroni correction), than Talairach reference value.
‡Not significantly different (P > 0.05).
Table 4Sulcal variability expressed as a 3D distance in stereotaxic space
Structure Controls (mm) AD (mm)
Left hemisphereCALCa 6.4 ± 0.3 7.2 ± 1.0CALCp 8.6 ± 1.2 6.1 ± 1.0CALL 3.7 ± 0.4 4.0 ± 0.7CING 8.3 ± 0.7 5.3 ± 0.9PAOC 6.1 ± 0.9 5.9 ± 0.8SYLV 7.1 ± 0.8 9.1 ± 2.6
Right hemisphereCALCa 6.2 ± 0.4 6.9 ± 0.7CALCp 7.1 ± 1.0 6.7 ± 0.9CALL 4.3 ± 0.5 4.1 ± 0.9CING 8.3 ± 1.8 7.6 ± 1.4PAOC 6.7 ± 0.8 6.5 ± 0.5SYLV 7.2 ± 2.0 5.9 ± 0.8
Cerebral aqueduct 2.9 ± 0.7 2.6 ± 0.4
This summary measure of variability is obtained as follows. The map which displaces the sulcalsurface in a given subject onto the average representation for that sulcus assigns a 3Ddisplacement vector to each node in that subject’s surface. Within each subject group,comparison of the 10 individual surface maps yields a variance value for the magnitude of thedisplacement vector assigned by each map to a given node. The square root of this measure givesthe positional SD of each node as a distance in stereotaxic space. The mean and SD of thesenodal values are shown here for each sulcus. This final numeric value gives a global indication ofthe stereotaxic variability of each sulcus, when all the nodes on its surface are taken into account.Values are in mm of Talairach stereotaxic space. The floor of the cerebral aqueduct (III) was alsoincluded as a control structure, expected to display minimal variability. These summary measuresare similar in both AD and control groups, and their values disguise the highly heterogeneousprofile of variability across the surface of individual structures (cf. Figs 3, 4).
Cerebral Cortex Sep 1998, V 8 N 6 497

on the right. A similarly remarkable variation characterized the
anterior cingulate region, which, despite its close proximity to
the relatively invariant tip of callosal genu (SD: ∼3.5–3.8 mm),
displayed extreme positional variation in stereotaxic space (SD:
8–10 mm; see Fig. 4).
Comparison with Cryosectioned Subjects
Cross-modality effects on measures of 3D cortical variation were
investigated by comparing MR-derived variability maps with
those obtained in previous studies of normal elderly brains
imaged immediately post mortem by ultra-high-resolution digital
cryosection imaging (Thompson et al., 1996a). Figure 5 shows
occipital lobe variability maps for the 10 normal elderly subjects
(top left) and 10 Alzheimer’s patients (top right) imaged by
high-resolution MRI in the current study, as well as (bottom left)
identically derived maps for the six cryosection subjects
analyzed in Thompson et al. (1996a). While the characteristic
rise in variability towards the exterior cerebral surface was a
universal phenomenon, the peak variability values obtained
across population subgroups differed substantially. As expected,
the high cortical variability in 3D MRI was compounded by
additional factors (e.g. cryoprotection, CSF loss and fixation)
that affect specimen integrity in post mortem studies.
Three-dimensional Asymmetry Maps in Aging and AD
Striking regional trends became apparent when 3D maps of
structural asymmetry were constructed for deep sulcal surfaces
in both subject groups. Figure 6 shows a color-coded digital map
of sulcal asymmetry in three dimensions, highlighting its local
biases on an average surface representation of the normal elderly
group’s anatomy. Note the negligible asymmetry (0.0–2.3 mm)
of the callosal surface, and the mild asymmetry values for
parieto-occipital, anterior and posterior calcarine and cingulate
sulci (0.1–3.0, 1.0–4.3, 0.9–4.4 and 0.6–4.6 mm respectively).
Values obtained for these relatively symmetric structures are in
marked contrast with the severe asymmetry exhibited by the
Sylvian fissure (0.8–15.4 mm).
As is apparent from the 3D average surface representations of
anatomy in both normal aging (Fig. 3) and AD (Fig. 4), the
Sylvian fissure is significantly longer and more horizontal on the
left than on the right (Geschwind and Levitsky, 1968; Witelson
and Kigar, 1992; Galaburda, 1995). The right Sylvian fissure also
shows a pronounced upward turn at its posterior limit (Figs
3–6). Among the many functionally important areas on the
lateral perisylvian surface, the planum temporale (a planar
cortical field located on the posterior f loor of the Sylvian fissure)
closely corresponds to auditory association area Tpt, which
represents a critical part of the language representation of the
left hemisphere and has a volume up to seven times larger on the
left than on the right (Galaburda et al., 1978). Consistent with
these cytoarchitectural considerations, the posterior limit of the
right Sylvian fissure was found, in controls, at a mean stereotaxic
position of Y = –31.6 ± 1.8 mm (i.e. 31.6 mm caudal to the origin
of stereotaxic space at the anterior commissure), while the left
Sylvian fissure extended another 9.7 mm further back to a mean
location, for the caudal limit, at Y = –41.3 ± 2.1 mm. Asymmetry
was therefore substantial in controls (P < 0.0005). In AD, this
asymmetry was accentuated (with P < 0.0002): while the right
posterior terminus was found at mean stereotaxic position
Y = –31.9 ± 1.1 mm, a value which almost exactly matched its
location in controls, the left posterior limit was found 16.6 mm
more caudally at Y = –48.5 ± 3.5 mm. Comparative analysis of the
3D variability and asymmetry maps in health and disease (Figs 3,
4, 6, 7) suggested that both the variability and asymmetry at the
left posterior limit are far greater in AD than in controls, with
local asymmetry reaching a highly elevated value of 21.8 mm in
AD compared with only 15.4 mm in controls. Between-
hemisphere differences in the anterior–posterior position of
the Sylvian fissure’s posterior limit were also found to be
significantly greater in AD than in matched controls (P < 0.05).
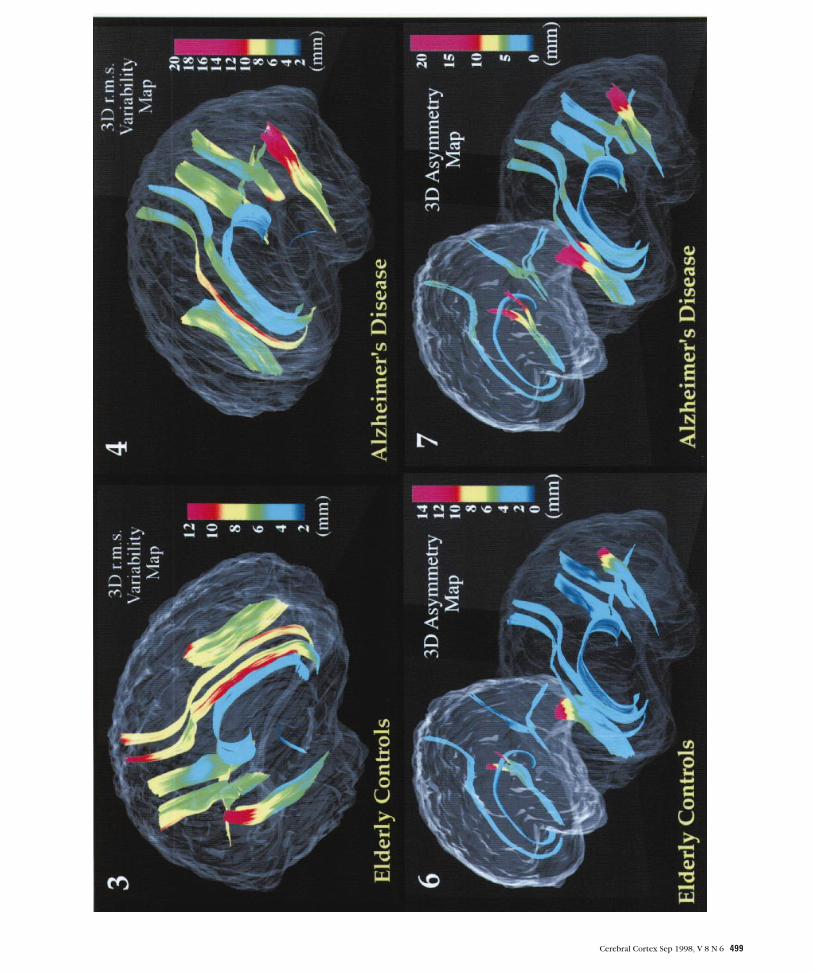
Figure 3. Three-dimensional variability maps and average surface representation for 12 major sulci in elderly normal subjects. Three-dimensional average surface representationsare shown for all 12 deep sulci from corresponding hemispheres of the 10 elderly normal subjects’ brains in Talairach stereotaxic space. The floor of the cerebral aqueduct (CAQD)was included as a control structure, expected to display minimal intersubject variability. Local variability is shown (in color) on an average surface representation of each sulcus. Thecolor encodes the root mean square magnitude of the displacement vectors required to map the surfaces from each of the 10 subjects onto the average, according to standardparametric criteria. Notice the pronounced increase in variability towards the posterior Sylvian and exterior occipital surface. The highly variable cingulate sulcus contrasts sharplywith the relatively invariant corpus callosum lying inferior to it.
Figure 4. Three-dimensional variability maps and average surface representation for 12 major sulci in patients with AD. Identically constructed 3D average surface representationsand variability maps are shown for the 12 major sulci (and aqueductal floor) in the 10 Alzheimer’s patients. Notice this time the extraordinary increase in variability from an SD of2.2–6.1 mm internally at the callosum to a peak of 19.6 mm at the posterior limit of the Sylvian fissure. Metabolic dysfunction in temporoparietal association cortex, assessed withpositron emission tomography (PET), appears early in AD (Friedland et al., 1985), and these data are consistent with the hypothesis that AD pathology severely disruptstemporo-parietal anatomy. The extent of this variation is important to recognize in functional neuroimaging studies of dementia, since averaging and stereotaxic subtraction offunctional maps may lead to spurious results due to anatomic (rather than functional) differences between groups (Meltzer and Frost, 1994; Woods, 1996). Atrophy and degenerationof the perisylvian region may widen the Sylvian fissure, adding variation and asymmetry to the structural patterns of normal aging. These effects are further investigated in Figs 5–7.
Figure 6. Three-dimensional maps of structural asymmetry in the deep surface anatomy of elderly normal subjects. A local index of anatomic asymmetry in different brain regionsis shown here (overlaid in color) on an average 3D surface representation of deep sulci in normal elderly subjects. Average structures were digitally mapped into the oppositehemisphere by reflection in the mid-sagittal plane of Talairach stereotaxic space. Three-dimensional displacement vector maps (Fig. 2) were then calculated according to theparametric criteria described earlier. These maps express the residual spatial mismatch (or local anatomic asymmetry) between each structure and its reflected counterpart. Themagnitude of this displacement, which provides an index of anatomic asymmetry in different brain regions, was then encoded in color on an average 3D surface representation ofeach group’s anatomy. Negligible asymmetry (0.0–2.3 mm) at the callosal surface contrasts sharply with the severe Sylvian fissure asymmetry (0.8–15.4 mm). The profile of Sylvianfissure asymmetry in 3D space suggests that although the fissure exhibits a higher upswing on the right than the left, this asymmetry is restricted to the posterior limit of the structure.This is consistent with prior observations that the planum temporale, a planar cortical field located on the posterior floor of the Sylvian fissure, has a volume up to seven times largerand extends farther posteriorly on the left than on the right (Galaburda et al., 1978).
Figure 7. Three-dimensional maps of structural asymmetry in the deep surface anatomy of patients with AD. Identically constructed variability maps are shown on the average 3Dsurface representation of the 12 major sulci in AD. Note this time the extraordinary increase in asymmetry in AD to a peak value of 21.8 mm at the posterior limit of the Sylvian fissure,which compares with a peak value of only 15.4 mm in controls (Fig. 6). Disease-related disruption of temporo-parietal regions, which are at risk of early metabolic dysfunction,perfusion deficits and early neuronal loss in AD, may constitute a source of secondary anatomic variation and asymmetry superimposed on that seen in normal aging.
498 3D Cortical Variation: Aging and Alzheimer’s Disease • Thompson et al.
Cerebral Cortex Sep 1998, V 8 N 6 499

These data are consistent with the emerging hypothesis that AD
pathology severely and asymmetrically disrupts temporo-parietal
anatomy (Loewenstein et al., 1989; Capitani et al., 1990;
Wahlund et al., 1993; Siegel et al., 1996; Corder et al., 1997).
Underlying atrophy and left greater than right degeneration of
the perisylvian region may widen the Sylvian fissure, introducing
additional individual variation and asymmetry superimposed on
that already seen in normal aging (Figs 4, 7). This hypothesis is
further corroborated by the observations that all structures
displayed a slightly higher degree of asymmetry in AD than in
controls. In the AD patient group there was negligible asym-
metry (0.0–2.5 mm) at the callosal surface and a profile of mild
asymmetry values for parieto-occipital, anterior and posterior
calcarine and cingulate sulci (0.8–5.7, 2.2–5.9, 1.2–4.4 and
3.3–6.0 mm respectively) which contrasted sharply with the
severe asymmetry of the Sylvian fissure (2.3–21.8 mm).
Mapping of Regionally Selective Atrophy at the Corpus
Callosum
The next objective was to test the hypothesis that a local or
diffuse atrophy of bilaterally connected brain regions might
induce secondary effects on homotopically distributed fibers in
the corpus callosum (CC). The cross-section of the CC at the
interhemispheric plane was digitally subdivided into five distinct
sectors of equal rostral extent along the AC–PC axis (Duara et
al., 1991; see Fig. 10, top panel). To control for potential effects
introduced by stereotaxic normalization, all subsequent analyses
were performed first by digitally mapping structure models back
into the original, unscaled MRI data. Rigid body (non-scaling;
translation and rotation) transformations were, however, still
performed to register the brains. When areas of specific sectors
were compared between groups, the posterior midbody zone
was of particular interest, since fibers crossing in this area
selectively innervate the temporo-parietal regions at risk for
early neuronal loss in AD (Brun and Englund, 1981).
Consistent with this hypothesis, a severe and significant
reduction in the posterior midbody area was found in AD
relative to controls, ref lecting a dramatic 24.5% decrease from
98.0 ± 8.6 mm2
in controls to 74.0 ± 5.3 mm2
in AD (P < 0.025;
Fig. 8). By contrast, the terminal sectors (1 and 5) of the
callosum, corresponding to fibers crossing in the rostrum and
splenium respectively, did not undergo a significant areal
reduction, with almost identical values in the control and patient
group of 160.9 ± 9.6 and 158.6 ± 14.3 mm2
respectively for the
rostral sector (P > 0.1), and 148.7 ± 8.6 and 150.8 ± 6.8 mm2
respectively for the splenial sector (P > 0.1). An observed 16.6%
mean areal loss in AD for the central sector showed only a trend
toward significance (P < 0.1), and an apparent 13.4% depression
in mean anterior midbody area was statistically insignificant (P >
0.1) because of substantial inter-group overlap in the values of
these parameters. [To investigate effects of the stereotaxic
transform, all analyses were re-performed on the individual
surface data in Talairach stereotaxic space; precisely the same
pattern of results was found, with a significant posterior
midbody area reduction in AD (P < 0.025), suggesting that this
effect persists even after correction of individual data for
differences in brain size and inter-commissural distance.]
Selective changes in the CC accompanying AD pathology
were measured by partitioning midsagittal sector outlines into
upper and lower sectors; local variability maps (Fig. 9) and
average boundary representations (Fig. 10) were then made for
the callosum in both subject groups. In both control and AD
subjects, sectors showed a distinctly heterogeneous profile of
variability (Fig. 9a,b), with confidence limits on 2D variation at
the midsagittal plane varying from an SD of 2.0–3.3 mm at the
inferior splenium, central midbody and genu to 4.6–5.0 mm at
the posterior aspect of the rostrum. Intriguingly, in the posterior
midbody zone, where a significant area reduction was apparent
in AD, the average callosal representations showed a slight
reduction in thickness in AD relative to controls (Fig. 10, lower
panel). In addition, a pronounced inf lection in shape was
demonstrated towards the inferior limit. This feature can be seen
in Fig. 10 (lower panel), at stereotaxic location (0.0,–25.0,19.0).
This morphology has also been observed in studies of callosal
shape in schizophrenia (DeQuardo et al., 1996; Bookstein,
1997).
Sulcal Surface Extent, Area, Curvature and Complexity
in Three Dimensions
Anterior–posterior, vertical and lateral extents were determined
for sulcal surfaces both before and after transformation of the
associated brain images into Talairach stereotaxic space. To
examine any effects introduced by stereotaxic transformation of
individual data (Talairach and Tournoux, 1988), surface models
of structures were digitally mapped back into the unscaled
original MRI data. A simple rigid body transformation was then
applied to the images and surface models to vertically orient the
interhemispheric plane and horizontally orient the AC–PC line.
Native extents of structures (i.e. their true anatomic extents
before stereotaxic transformation) along the three coordinate
axes are shown graphically in Figure 11a–c. The anterior–
Figure 8. Regionally selective atrophy at the corpus callosum in AD. Areas of specificcallosal sectors are shown (as mean values± SEMs) in control subjects (black bars; n= 10) and Alzheimer’s patients (white bars; n = 10). The partitioning scheme digitallydivides the cross-section of the CC at the interhemispheric plane into five distinctsectors of equal rostral extent along the AC–PC axis (Duara et al.,1991). Figure 10 (toppanel) shows this partition, which divides the callosal midbody into three sectors (hereM1–M3). Notice the severe 24.5% decrease in the area of posterior midbody sectorM1 from 98.0± 8.6 mm2 in controls to 74.0± 5.3 mm2 in AD (P < 0.025). Sectorswhich approximately represent the genu and splenium are comparatively resilient. Asfound in Biegon et al. (1994), Black et al. (1996) and Kaufer et al. (1997), however, totalcallosal area was not found to be significantly depressed in AD (mean± SD: 525.9±116.8 mm2) relative to controls (575.4 ± 108.8 mm2; P > 0.05). As a further caveatagainst the use of total callosal area as a diagnostic index in AD, striking areal variationswere observed in both controls (range: 419–810 mm2) and AD patients (387–812mm2). Discrimination based on this parameter alone may therefore be highly unreliable.Despite the 10 times greater image resolution used in this study, and the carefulcontrolling for age, gender, educational level and handedness, both the mean valuesand range of callosal area values documented here are in strong agreement with priorMR studies of callosal size based on 10 mm-thick sections (Biegon et al., 1994).
500 3D Cortical Variation: Aging and Alzheimer’s Disease • Thompson et al.

posterior extent of the Sylvian fissure was significantly greater
on the left than the right both in the control group (61.1 ± 1.4
mm, left hemisphere; 52.3 ± 2.1 mm, right hemisphere; P <
0.005) and in AD (66.4 ± 3.7 mm, left; 54.4 ± 1.8 mm, right;
P < 0.01). Conversely, the native vertical extents of the Sylvian
fissure were significantly greater on the right than on the left in
controls (34.7 ± 1.8 mm, left; 42.3 ± 2.4 mm, right; P < 0.025)
and in AD (33.7 ± 3.4 mm, left; 42.1 ± 1.9, right; P < 0.05). After
the stereotaxic transformation selectively removed the
contribution of brain size to sulcal variation, the Sylvian fissure
asymmetries achieved an even greater level of significance. The
resulting stereotaxic extents, along the anterior–posterior axis,
were then observed to be considerably greater on the left than
on the right in controls (58.5 ± 1.3 mm, left; 49.2 ± 1.7 mm,
right; P < 0.0005) and in AD subjects (64.3 ± 3.8, left; 51.2 ± 1.6
mm, right; P < 0.005). Again, stereotaxic vertical extents
followed the pattern of being greater on the right than the left in
controls (36.1 ± 6.5 mm, left; 43.8 ± 2.4 mm, right; P < 0.02) and
in AD (34.0 ± 3.1 mm, left; 43.0 ± 2.1, right; P < 0.025).
Furthermore, the stereotaxic transformation revealed that
Sylvian fissure length asymmetries resulted from positional
asymmetries of the caudal tip of the fissure rather than the rostral
tip, which exhibited no significant asymmetries in either subject
group (Fig. 12a–c; see also the asymmetry maps shown in Figs 6,
7). No asymmetries were found in the lateral extent of the
Sylvian fissure (P > 0.05), and no other structure displayed
asymmetries for any structural parameter (P > 0.05). Lateral
extents, not addressed in prior stereotaxic studies, indicated the
extreme depth of the parieto-occipital sulci and Sylvian fissures
(Table 5). These sulci had mean lateral extents of 11.4–12.6 and
15.2–15.5 mm respectively in controls and similar values in the
AD group, with slightly higher values for both groups after
stereotaxic transformation. The AD group did not have
significantly increased lateral extents, relative to controls, for
any of the sulci measured, which might have been expected
given their deep lateral course and the known effects of sulcal
widening in AD (Gado et al., 1982).
Surface Area Measures
Three-dimensional surface area measures for all structures,
both before and after stereotaxic transformation, are shown in
Table 6. Native area measures for controls ranged from mean
hemispheric values of 1.1–1.4 and 3.2–3.4 cm2 for the anterior
and posterior calcarine sulci respectively, increasing to 4.5–5.2
and 7.1–8.0 cm2
for the parieto-occipital and supracallosal
sulci, and reaching 8.7–10.1 and 9.3–9.4 cm2 for the cingulate
sulci and Sylvian fissure respectively. No disease-specific
differences were apparent, nor were there any inter-hemispheric
asymmetries in structure area for either subject group, suggest-
ing that the positional and shape asymmetries of the Sylvian
fissure area not accompanied by hemispheric differences in the
absolute area of its surface.
Surface Curvature
Normalized curvature indices revealed striking differences in
sulcal morphology. Native curvature values in controls ranged
from (1.084 ± 0.009, left; 1.098 ± 0.015, right) for the
comparatively f lat anterior calcarine sulcus, to a peak value of
2.340 ± 0.081 (left; 2.292 ± 0.088, right) for the highly curved
Figure 10. Midsagittal corpus callosum in elderly normal subjects and AD: averageboundary representation and partitioning scheme. Average boundary representations ofthe midsagittal callosum in normal controls and Alzheimer’s patients indicate a mildreduction in thickness in AD relative to controls, accompanied by a pronouncedinflection in shape (white arrow) in the neighborhood of stereotaxic location(0.0,–25.0,19.0).The overlying posterior midbody sector (the second of five, top panel)underwent a 24.5% reduction in area in AD compared with controls (P < 0.025).
Figure 11. Spatial extents of major sulci in both brain hemispheres. Extents of majorsulci in both brain hemispheres and both subject groups are reported (as mean values±SEMs) prior to stereotaxic normalization. In both normal controls (uniform bars) and AD(stippled bars) marked Sylvian fissure asymmetries are observed, with rostral extentsbeing greater on the left, and vertical extents greater on the right (cf. Figs 6, 7, 12).
Cerebral Cortex Sep 1998, V 8 N 6 501
supracallosal sulcus. A curvature value of 1.0 indicates a f lat,
planar structure. The characteristically curved, ‘Λ-shaped’
morphology of the posterior calcarine sulcus was ref lected in its
mean curvature indices (1.169 ± 0.038, left; 1.133 ± 0.012,
right), which were higher than corresponding values for the
anterior segment of the calcarine sulcus (1.084 ± 0.009, left;
1.093 ± 0.014, right). The elaborate curved morphology of the
cingulate sulcus, as it arches round the limbic system, was
indicated by its elevated curvature indices (1.442 ± 0.045, left;
1.486 ± 0.045, right). The 3D course of the Sylvian fissure was
also found to be significantly more curved on the right (1.184 ±
0.029) than on the left (1.109 ± 0.014) in controls (P < 0.025).
This effect, however, showed only a trend towards significance
in AD (1.104 ± 0.015, left; 1.138 ± 0.016, right; P < 0.1).
Analysis of curvature data both before and after stereotaxic
normalization revealed a further effect of the Talairach
stereotaxic system: in control subjects, the mean curvature
index of the corpus callosum increased by 7.9% on the left and
7.7% on the right as a result of the stereotaxic transformation.
Similar increases (of 5.1% on the left, 5.0% on the right) were
introduced in the AD group. The increase in the amount of
‘arching’ exhibited by the callosum probably stems from
contracting the AC–PC distance in the individual MRI datasets to
a reference value of 23.5 mm. As noted earlier, this standard
AC–PC distance is significantly smaller (P < 0.05) than the mean
intercommissural distances obtained for each subject group.
Fractal Dimension and Surface Complexity
Differences in sulcal morphology were also revealed by fractal
dimension analysis (Table 5), which ref lects the rate at which
sulcal surface area increases as the scale of measurement is
reduced. Low complexity values of 2.13–2.14 were determined
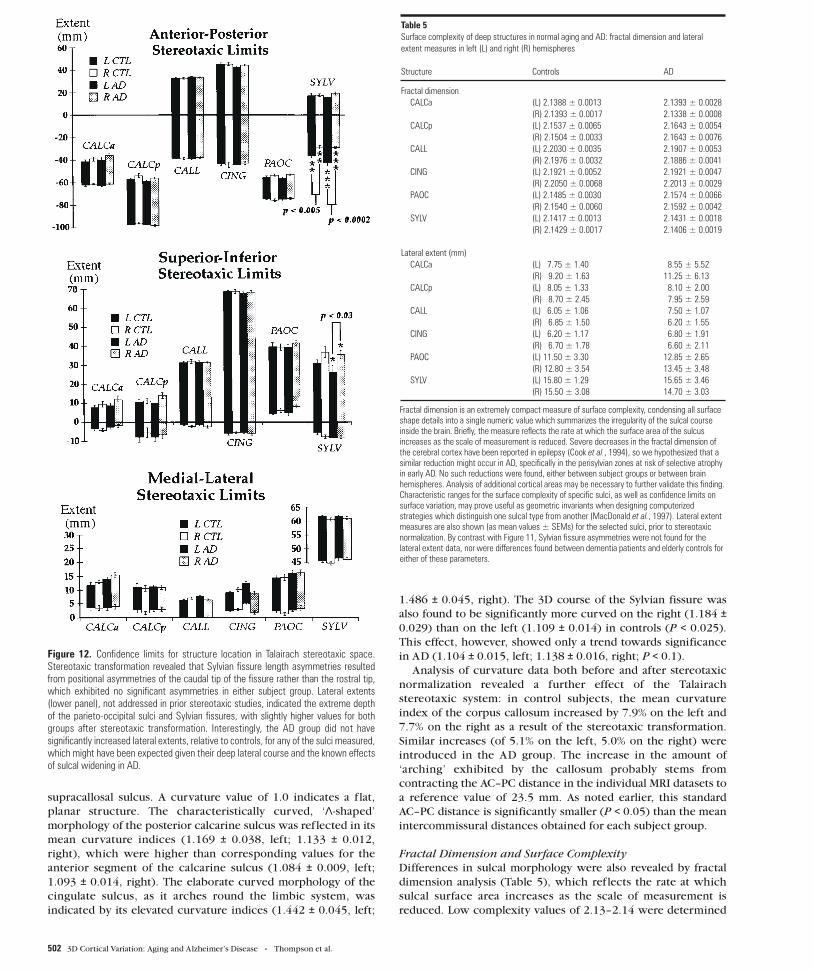
Figure 12. Confidence limits for structure location in Talairach stereotaxic space.Stereotaxic transformation revealed that Sylvian fissure length asymmetries resultedfrom positional asymmetries of the caudal tip of the fissure rather than the rostral tip,which exhibited no significant asymmetries in either subject group. Lateral extents(lower panel), not addressed in prior stereotaxic studies, indicated the extreme depthof the parieto-occipital sulci and Sylvian fissures, with slightly higher values for bothgroups after stereotaxic transformation. Interestingly, the AD group did not havesignificantly increased lateral extents, relative to controls, for any of the sulci measured,which might have been expected given their deep lateral course and the known effectsof sulcal widening in AD.
Table 5Surface complexity of deep structures in normal aging and AD: fractal dimension and lateralextent measures in left (L) and right (R) hemispheres
Structure Controls AD
Fractal dimensionCALCa (L) 2.1388 ± 0.0013 2.1393 ± 0.0028
(R) 2.1393 ± 0.0017 2.1338 ± 0.0008CALCp (L) 2.1537 ± 0.0065 2.1643 ± 0.0054
(R) 2.1504 ± 0.0033 2.1643 ± 0.0076CALL (L) 2.2030 ± 0.0035 2.1907 ± 0.0053
(R) 2.1976 ± 0.0032 2.1886 ± 0.0041CING (L) 2.1921 ± 0.0052 2.1921 ± 0.0047
(R) 2.2050 ± 0.0068 2.2013 ± 0.0029PAOC (L) 2.1485 ± 0.0030 2.1574 ± 0.0066
(R) 2.1540 ± 0.0060 2.1592 ± 0.0042SYLV (L) 2.1417 ± 0.0013 2.1431 ± 0.0018
(R) 2.1429 ± 0.0017 2.1406 ± 0.0019
Lateral extent (mm)CALCa (L) 7.75 ± 1.40 8.55 ± 5.52
(R) 9.20 ± 1.63 11.25 ± 6.13CALCp (L) 8.05 ± 1.33 8.10 ± 2.00
(R) 8.70 ± 2.45 7.95 ± 2.59CALL (L) 6.05 ± 1.06 7.50 ± 1.07
(R) 6.85 ± 1.50 6.20 ± 1.55CING (L) 6.20 ± 1.17 6.80 ± 1.91
(R) 6.70 ± 1.78 6.60 ± 2.11PAOC (L) 11.50 ± 3.30 12.85 ± 2.65
(R) 12.80 ± 3.54 13.45 ± 3.48SYLV (L) 15.80 ± 1.29 15.65 ± 3.46
(R) 15.50 ± 3.08 14.70 ± 3.03
Fractal dimension is an extremely compact measure of surface complexity, condensing all surfaceshape details into a single numeric value which summarizes the irregularity of the sulcal courseinside the brain. Briefly, the measure reflects the rate at which the surface area of the sulcusincreases as the scale of measurement is reduced. Severe decreases in the fractal dimension ofthe cerebral cortex have been reported in epilepsy (Cook et al., 1994), so we hypothesized that asimilar reduction might occur in AD, specifically in the perisylvian zones at risk of selective atrophyin early AD. No such reductions were found, either between subject groups or between brainhemispheres. Analysis of additional cortical areas may be necessary to further validate this finding.Characteristic ranges for the surface complexity of specific sulci, as well as confidence limits onsurface variation, may prove useful as geometric invariants when designing computerizedstrategies which distinguish one sulcal type from another (MacDonald et al., 1997). Lateral extentmeasures are also shown (as mean values ± SEMs) for the selected sulci, prior to stereotaxicnormalization. By contrast with Figure 11, Sylvian fissure asymmetries were not found for thelateral extent data, nor were differences found between dementia patients and elderly controls foreither of these parameters.
502 3D Cortical Variation: Aging and Alzheimer’s Disease • Thompson et al.

for the relatively planar anterior calcarine sulcus, in sharp
contrast with values exceeding 2.19–2.20 for the cingulate
sulcus (in both hemispheres). Consistent with this observation,
we noted qualitatively that the elaborate intracerebral course of
the cingulate often demonstrated multiple highly variable
branching patterns, which may or may not connect with other
accessory, paralimbic sulci (cf. Ono et al., 1990; Paus et al.,
1996a,b). Complexity values also tended to fall in a character-
istic range for each type of sulcus (Table 5), but were
surprisingly stable across subjects and groups.
Contouring Reliability
As in our earlier cryosection studies (Thompson et al., 1996a),
the reliability of the contouring process itself was evaluated by
repeatedly delineating the same structure and comparing the
data obtained in multiple trials. Since the 20 MR scans had
specifically been acquired at high resolution (1-mm-thick MR
slices, with a 0.9765 × 0.9765 mm in-plane pixel resolution and
no inter-slice gap), it was important to determine whether the
advantages of this protocol would actually be ref lected in
reduced contouring error.
All sulcal surfaces in the left hemisphere of a single, randomly
selected brain were manually outlined six times, in random
order. Outlines were converted to parametric mesh form, and
the full range of geometric parameters were calculated for each
surface. Results of these tests are presented in Tables 7 and 8.
While all measures were stable across the series of trials,
curvature and fractal dimension measures were the most
robust — worst case errors represented 0.44 and 0.059% of the
corresponding mean values for these measures in the control
group (q.v., CALCa/p: Table 8). Standard errors for repeated
measures of extent and area data were, in the worst cases, only
0.46 mm and 0.030 cm2
respectively (q.v., CALCa and PAOC:
Table 7). The effects of contouring errors on each geometric
variable were, in all cases but two, between 9 and 190 times
smaller than the corresponding variation in the same quantity
Table 6Three-dimensional surface area measures for deep sulcal surfaces in aging and AD
Structure Controls (cm2) AD (cm2)
Left hemisphereCALCa 1.118 ± 0.121 1.632 ± 0.295
(1.213 ± 0.128)‡ (1.818 ± 0.366)CALCp 3.184 ± 0.246 3.449 ± 0.563
(3.455 ± 0.254) (3.500 ± 0.391)CALL 7.060 ± 0.397 8.583 ± 0.433
(7.265 ± 0.366) (8.697 ± 0.410)CING 8.704 ± 0.459 9.533 ± 0.768
(9.021 ± 0.455) (9.826 ± 0.896)PAOC 4.513 ± 0.475 5.283 ± 0.563
(4.844 ± 0.436) (5.507 ± 0.442)SYLV 9.368 ± 0.262 9.610 ± 0.636
(9.184 ± 0.300) (9.419 ± 0.561)
Right hemisphereCALCa 1.353 ± 0.116 2.058 ± 0.406
(1.480 ± 0.123) (2.253 ± 0.464)CALCp 3.407 ± 0.342 3.575 ± 0.534
(3.759 ± 0.385) (3.711 ± 0.465)CALL 8.020 ± 0.676 7.274 ± 0.831
(8.290 ± 0.673) (7.259 ± 0.600)CING 10.086 ± 1.024 9.496 ± 0.914
(10.377 ± 0.980) (9.936 ± 1.086)PAOC 5.188 ± 0.610 5.506 ± 0.695
(5.567 ± 0.592) (5.716 ± 0.480)SYLV 9.294 ± 0.572 8.507 ± 0.536
F(9.086 ± 0.446) (8.397 ± 0.519)
Surface area measures are shown (as mean ± SEMs) for deep anatomical surfaces in normalelderly subjects and Alzheimer’s patients, both before (first value) and after (‡: value inparentheses) digital transformation into Talairach stereotaxic space. Note that, as expected froman analysis of Table 3, the stereotaxic transformation marginally increases the internal surface areaof the occipital and paralimbic sulci, and that this increase is slightly more pronounced in the ADpatients than in controls. By contrast, the surface area of the deep Sylvian fissure is marginallyreduced in both subject groups by the stereotaxic transformation, especially in controls. This isbecause most of the Sylvian surface falls in the central sector of stereotaxic space. Statisticsdetermined in Tables 2 and 3 suggest that this central sector is generally subjected to arostro-caudal contraction, so that the anterior and posterior commissures can fall at theircanonically defined coordinate locations (Talairach and Tournoux, 1988). No disease-specificdifferences were apparent (P > 0.05), nor were there any inter-hemispheric asymmetries instructure area for either subject group (P > 0.05), suggesting that the positional and shapeasymmetries of the Sylvian fissure area not accompanied by hemispheric differences in theabsolute area of its surface.
Table 7Effects of contouring error on 3D extent and surface area parameters
Structure Anterior–posteriorextent (mm)
Vertical extent(mm)
Lateral extent(mm)
Surface area (cm2)
PAOC 23.91 ± 0.31 38.61 ± 0.46 13.0 ± 0.0 5.563 ± 0.022(1.30%) (1.19%) (0%)a (0.40%)
CALCa 23.49 ± 0.46 10.33 ± 0.28 9.0 ± 0.0 1.192 ± 0.012(1.96%) (2.71%) (0%) (1.01%)
CALCp 43.11 ± 0.28 22.32 ± 0.13 10.0 ± 0.0 5.242 ± 0.018(0.65%) (0.60%) (0%) (0.34%)
CALL 77.29 ± 0.26 28.61 ± 0.16 7.5 ± 0.0 8.272 ± 0.018(0.33%) (0.55%) (0%) (0.22%)
CING 86.02 ± 0.32 72.60 ± 0.19 7.0 ± 0.0 9.414 ± 0.015(0.37%) (0.26%) (0%) (0.16%)
SYLV 51.10 ± 0.20 42.38 ± 0.26 15.5 ± 0.0 9.064 ± 0.030(0.39%) (0.61%) (0%) (0.33%)
This table summarizes the differences which occurred in outlining the same structure, in the lefthemisphere of a randomly selected control subject, on multiple occasions (n = 6). All studies ofmorphometric variation across subjects incorporate identification errors as a source of variability.Errors due to differences in structure delineation in multiple trials are broken down by structure.For each structure, mean measures and their standard deviations are given; SDs are alsoexpressed as a percentage of the corresponding mean values.aIdentification error is not isotropic, as outlines were made for a particular structure in all thesagittal sections in which that structure could be distinguished. Selected structures could bedistinguished in the same sections in each trial, partly because the interhemispheric vault or thelateral aspect of the insula provided the medial limit for each sulcus, and their lateral limits werenot ambiguous. In-plane differences in structure delineation, however, were introduced acrossmultiple trials, and these contributed to differences in the surface areas, as well as the vertical androstral extents, of each individual structure.
Table 8Effects of contouring error on curvature, 3D stereotaxic variability and fractal dimension measures
Structure Curvature Nodal deviation r.m.s.(mm)
Fractal dimension
PAOC 1.1047 ± 0.0033 0.316 ± 0.083 2.1475 ± 0.0005(0.30%) [0.250 ± 0.095]‡ (0.023%)
CALCa 1.0829 ± 0.0048 0.251 ± 0.064 2.1393 ± 0.0007(0.44%) [0.190 ± 0.082] (0.033%)
CALCp 1.2955 ± 0.0031 0.361 ± 0.118 2.1882 ± 0.0013(0.24%) [0.235 ± 0.064] (0.059%)
CALL 1.9316 ± 0.0079 0.435 ± 0.143 2.2053 ± 0.0012(0.41%) [0.341 ± 0.136] (0.054%)
CING 1.2838 ± 0.0022 0.429 ± 0.150 2.1693 ± 0.0005(0.17%) [0.378 ± 0.165] (0.023%)
SYLV 1.1503 ± 0.0036 0.373 ± 0.137 2.1585 ± 0.0011(0.31%) – (0.051%)
As in Table 7, this table provides a further analysis of the differences which occurred in outliningthe same structure, in the left hemisphere of a randomly selected normal subject, on multipleoccasions (n = 6). Meshes were constructed from the outlines produced in different trials, andthe nodal deviation r.m.s. measures summarize the 3D spatial discrepancies in the stereotaxiclocations of their grid points, across the series of trials. For each structure, mean measures andtheir SDs are given; SDs are also expressed as a percentage of the corresponding mean values.‡For purposes of comparison, values in square brackets denote identically calculated error valuesobtained (for the five sulci examined) in our previous study of sulcal variability, in whichultra-high-resolution 3D cryosection images of the human brain were analyzed (Thompson et al.,1996a). The low error values in both studies suggest that contouring error represented a negligiblefraction of the overall measures of inter-subject variability.
Cerebral Cortex Sep 1998, V 8 N 6 503

across each group of subjects. The worst case occurred when
measuring the variability in curvature and fractal dimension, for
the anterior calcarine sulcus (CALCa). A ‘f loor effect’ occurred
because inter-subject variability was very small, in this case, but
the measures of variability (across the 10 subjects in each group)
were still six times greater than the contouring error.
The regional impact of identification error and hand jitter
during manual outlining was assessed in greater detail by
creating additional 3D variability maps for the repeated
contouring trials (n = 6), showing local profiles of contouring
error across each structure. Fig. 13a shows an example of such
an error map for the three occipital sulci in the left hemisphere
of the selected brain. Contouring error across trials was smallest
for the rather f lat anterior branch of the calcarine sulcus (mean
nodal deviation: 0.251 ± 0.064 mm). This compared with a
slightly higher error of 0.361 ± 0.118 mm for the posterior
branch, 0.316 ± 0.083 mm and 0.373 ± 0.137 mm for the
parieto-occipital sulcus and Sylvian fissure, and 0.435 ± 0.143
mm and 0.429 ± 0.150 mm for the callosal and cingulate sulci
respectively.
DiscussionTwo general principles emerge from the broad spectrum of
neuroanatomic maps and indices examined here. First,
population-based averaging and comparative analysis of digital
anatomic maps in normal aging and AD suggested a range of
global and local disease-related differences. Confidence limits
on 3D cortical variation in controls showed a marked increase
from 2–4 mm at the callosum to a peak of 12–13 mm at the
external cerebral surface. In AD, however, while variability was
marginally higher than in controls at the callosal surface, the
variability across the surface of the Sylvian fissure rose extremely
sharply, from an SD of 6.0 mm rostrally to 19.6 mm caudally on
the left and from 5.0 mm rostrally to 9.0 mm caudally on the
right. Although there is a substantial literature on Sylvian fissure
cortical surface asymmetries (Eberstaller, 1884; Cunningham,
1892; Geschwind and Levitsky, 1968; Davidson and Hugdahl,
1994) and their relation to functional lateralization (Strauss et
al., 1983), handedness (Witelson and Kigar, 1992), language
function (Davidson and Hugdahl, 1994), asymmetries of
asssociated cytoarchitectonic fields (Galaburda and Geschwind,
1981) and their thalamic projection areas (Eidelberg and
Galaburda, 1982), no prior report exists mapping the spatial
profile of asymmetries in 3D space. When Sylvian fissure
asymmetries were mapped in three dimensions, the marked
rostral and vertical extent asymmetries in controls (left posterior
limit 9.7 mm more caudal than right; P < 0.0005) were severely
increased in AD (left limit 16.6 mm more caudal than right;
P < 0.0002), and between-hemisphere differences in the
anterior–posterior position of the Sylvian fissure’s posterior limit
were also found to be significantly greater in AD than in matched
controls (P < 0.05). Local maps (Figs 6, 7) also revealed a sharp
rise in 3D asymmetry in AD, reaching 21.8 mm at the posterior
limit of the left Sylvian fissure, compared with 15.4 mm in
controls. Greater variability of the left perisylvian surface and
greater Sylvian fissure asymmetry in AD suggests that AD
pathology asymmetrically disrupts the anatomy of the
temporo-parietal cortex. In AD, Sylvian fissure CSF volume has
also been shown to rise, relative to controls, more sharply on the
left than the right [left volume 31.5% higher in AD than controls
(P < 0.02; n = 32) but right volume only 20.4% higher (P < 0.09;
Wahlund et al., 1993)]. Underlying atrophy and possible left
greater than right degeneration of perisylvian gyri may widen the
Sylvian fissure, superimposing additional individual variation
and asymmetry on that already seen in normal aging (Figs 4, 7).
Significant left greater than right metabolic dysfunction and
cognitive impairment have been reported in both PET
(Loewenstein et al., 1989; Siegel et al., 1996) and neuro-
psychiatric (Capitani et al., 1990) studies of AD, and in PET
studies of related amnestic disorders (Corder et al., 1997).
Recent PET studies have also examined cognitively normal
subjects who are ‘at risk’ for AD in the sense that they
experience mild memory complaints and have at least two
relatives with AD (Small et al., 1995). Left greater than right
metabolic impairment also appears in these subjects, and the
deficit has been shown to be significantly more asymmetric
in at-risk subjects carrying the apolipoprotein type 4 allele
(ApoEε4; a risk factor for familial AD) relative to those subjects
without ApoEε4 (Small et al., 1995). Accentuated patterns of
structural asymmetry and variation found here in AD support
these findings, suggesting either that (i) the left hemisphere is
more susceptible than the right to neurodegeneration in AD; or
that (ii) left hemispheric impairment results in greater structural
change and lobar metabolic deficits (Loewenstein et al., 1989).
A second principle evident from this study is the anatomically
specific relationship observed between putative fiber loss in
callosal regions and the dynamic progression of cortical and
lobar atrophy characteristic of AD. Size reduction and shape
inf lection were observed in commissural regions that map
association areas at risk of selective metabolic loss and incipient
atrophy in early stages of AD (Figs 8, 10). Greater resilience was
observed in splenial sectors, which map the parieto-occipital
and calcarine surfaces which are comparatively resistant to
neuronal loss in AD (Pearson et al., 1985). Severe and regionally
selective areal loss and focal shape inf lection in the posterior
callosal midbody may ref lect disease-related disruption of the
commissural system connecting bilateral temporal and parietal
cortical zones, since these regions are known to be at risk for
early metabolic dysfunction, perfusion deficits and selective
neuronal loss in AD (DeCarli et al., 1996). Any focal or diffuse
abnormalities of bilaterally connected cortical regions may be
expected to have secondary effects on homotopically distributed
fibers in the callosum (Biegon et al., 1994), which serves as the
primary cortical projection system, and consists of ∼200–350
million fibers in man (Aboitiz et al., 1992). Effects on regional
callosal structure have been reported in schizophrenia
(Woodruff et al., 1995; DeQuardo et al., 1996), attention deficit
hyperactivity disorder (Giedd et al., 1994; Baumgardner et al.,
1996), relapsing–remitting multiple sclerosis (Pozzilli et al.,
1991), AD (Hofmann et al., 1995; Vermersch et al., 1996;
Janowsky et al., 1996) and multi-infarct dementia (Yoshii et al.,
1990).
Controversy exists over whether different callosal regions
undergo selective changes in aging and dementia (Yoshii et al.,
1990), and even whether effects in dementia are significant
compared with age-matched controls (Biegon et al., 1994).
As found in Biegon et al. (1994), Black et al. (1996) and Kaufer
et al. (1997), we did not find the total callosal area to be
significantly depressed in AD (mean ± SD: 525.9 ± 116.8 mm2)
relative to controls (575.4 ± 108.8 mm2; P > 0.05). These values
(determined prior to stereotaxic normalization) are in broad
agreement with, but marginally higher than, previously deter-
mined callosal area values (Biegon et al., 1994) of 562 ± 98 mm2
in elderly controls (n = 13; MR slice thickness: 10 mm; age:
64.8 ± 9.0 years) and 480 ± 133 mm2
in AD (P > 0.05; n = 20; age:
70.1 ± 7.4 years, with slightly lower MMSE scores of 17 ± 7.2 and
504 3D Cortical Variation: Aging and Alzheimer’s Disease • Thompson et al.

a range of 9–25). Both our data and those of Biegon et al. (1994),
Black et al. (1996) and Kaufer et al. (1997) do not fully agree
with earlier reports that total callosal area discriminated
between AD and control subjects (Hofmann et al., 1995; P <
0.05), and that combined callosal area was significantly reduced
in AD [by 7.0% relative to controls; P < 0.05 (Yoshii et al., 1994)].
If selective AD-related atrophy occurs in specific callosal sectors
(Black et al., 1996) when areas of these sectors are pooled with
that of other more robust regions, they may or may not be
significantly reduced, depending on disease severity.
The finding that the same highly circumscribed site at the
callosum (Figs 8, 10) shows a comparable shape inf lection in
schizophrenia (DeQuardo et al., 1996; Bookstein, 1997) is
intriguing. Due to differences in the etiology of the two diseases,
fiber deficiency at this site in schizophrenia may be associated
with a neurodevelopmental disruption of the sulco-gyral organ-
ization of temporal lobe fibers that cross in this region (Kikinis
et al., 1994). In AD, however, a similarly localized fiber
deficiency may result from temporo-parietal neuronal loss,
associated with the early perfusion and cognitive performance
deficits in AD. It is well-known that a massive perinatal loss of
callosal axons, lasting from the 35th gestational week to the end
of the first postnatal month (Clarke et al., 1989; La Mantia and
Rakic, 1990) leads to a restricted pattern of adult callosal
connections, but controversy exists over whether callosal area is
further reduced in normal aging relative to young normal
controls (Biegon et al., 1994; cf. Doraiswamy et al., 1991).
Callosal area reductions in AD may have functional significance,
as smaller partial callosal size often ref lects a focal decrease in
the number of small diameter (<3 mm) fibers (Aboitiz et al.,
1992) or decreased myelin deposition, associated with decreased
conduction velocity and longer interhemispheric transmission
times. These and other callosal studies, interpreted in the
context of (i) the temporo-parietal perfusion deficits and
temporal neuronal loss typical in early AD, and (ii) correlations
between reduced association cortex metabolism and cognitive
performance, suggest that neuronal loss and white matter
abnormalities in AD may partially exert their effect through
disruption of long cortico-cortical pathways (DeCarli et al.,
1996). Earlier reports of CC alterations in clinically mild AD
(Hofmann et al., 1995; Janowsky et al., 1996; Vermersch et al.,
1996) support these observations and further highlight the
selective vulnerability of callosal regions in AD.
Extreme variations in cortical patterns, as quantified by this
study, also suggest that caution may be necessary in using the
Talairach stereotaxic system to support cross-subject and
cross-group comparisons of cortically derived events or
functional maps. Three-dimensional stereotaxic localization is
widely accepted by the neuroscience community not only as a
framework for coordinate-based morphometry, multi-modality
brain mapping and neurosurgical studies (Talairach and Szikla,
1967; Burzaco, 1985; Missir et al., 1989; Steinmetz et al., 1989,
1990; Vannier et al., 1991; Mazziotta et al., 1995), but also as a
quantitative system of reference in functional imaging studies.
Direct digital subtraction of stereotaxic functional maps in
dementia studies may lead to spurious results, since homologous
cortical regions in different subjects may not be brought into
register. Since stereotaxic systems differ significantly in their
capacity to compensate for inter-subject variations in the
anatomy of the brain (Burzaco, 1985), cortical variation maps
may serve as a metric to directly evaluate different stereotaxic
systems, and to compare their effectiveness in reconciling
inter-subject variations. Confounding effects of highly variable
cortical patterns can be reduced in multi-subject functional
studies by employing image registration strategies which f luidly
deform the sulcal patterns of different subjects into structural
correspondence (Davatzikos, 1996; Thompson and Toga, 1996,
1997, 1998; Drury et al., 1997). These f luid maps encode
information on complex variations in sulcal topography in
human populations, enabling cross-subject transfer, comparison
and integration of functional data from many subjects. Fluid
transformations of cortical maps have recently allowed inter-
species comparison of cytoarchitecture (Van Essen et al., 1997),
construction of a population-based digital brain atlas (Thompson
Figure 5. Three-dimensional variability maps for occipital lobe sulci in aging, AD and post mortem digital cryosection imaging. Variability maps for major sulci of the occipital lobe, inseveral population subgroups, reveal cross-modality effects on measures of 3D cortical variation. Separate occipital lobe variability maps were constructed from the MRI dataacquired from (top left) control subjects (n = 10); (top right) patients with AD (n = 10); and (bottom left) normal elderly brains (n = 6) imaged immediately post mortem byultra-high-resolution digital cryosection imaging (Thompson et al., 1996a). In each case, an oblique right-hand side view is shown which illustrates the course of the parieto-occipitalsulcus from its antero-ventral junction with the medial surface of the calcarine sulcus, which it divides into anterior and posterior segments. The posterior calcarine sulcus is shownjoining it inferiorly. Notice the pronounced increase in variability, in every case, towards the exterior occipital surface. Peak variability values, however, differ substantially between thetwo imaging modalities. High cortical variability, observed in 3D MRI, is compounded in post mortem studies by additional factors which affect specimen integrity (e.g. cryoprotection,CSF loss and fixation). These factors require computational strategies which selectively remove anatomical variance at the cortex, in order to compare and correlate histochemicalmaps with functional maps derived in vivo from multiple subjects, groups and imaging modalities (Drury et al., 1997; Mega et al., 1997; Thompson and Toga, 1997).
Figure 9. Midsagittal corpus callosum in elderly normal subjects and AD. Separate maps of local variability were constructed for (a) control subjects and (b) Alzheimer’s patients,expressing (in color) the r.m.s. variation of callosal points in each subject group around an average boundary representation of the callosum at the midsagittal plane of Talairachstereotaxic space. Unlike all other maps in this study, these are strictly 2D maps, since the midsagittal analysis of callosal morphology is conducted in a single vertical plane. Averageboundary representations have therefore been thickened for visualization purposes only. Two trends are apparent. Although the variability measure peaks at the inferior genu, this maybe an artifact, due to the difficulties of defining an unambiguous anatomical limit for the inferior aspect of the genu. Nevertheless, the pronounced rise in variability at the rostralmidbody in AD (b) may reflect disease-related enlargement of the third ventricle, which forms its inferior boundary.
Figure 13. Maps of contouring error for occipital lobe sulci. These error maps show the reliability of structure delineation in multiple trials. Algorithms developed for calculatingvariability across subjects were used to map out local discrepancies which occurred when contouring the same structure repeatedly (n = 6) in a randomly selected brain.Three-dimensional surface models of the parieto-occipital, anterior and posterior calcarine sulci are derived from the left hemisphere of the randomly selected brain. The colorencodes the r.m.s. magnitude of the displacement vectors required to map the surface obtained in each trial onto the average of the surfaces obtained in multiple trials. Identicallyconstructed error maps are shown (b) for the same occipital lobe sulci, repeatedly traced in six ultra-high-resolution (1300 × 10242 × 24-bit color) 3D cryosection images of thehuman brain [data reproduced, for purposes of comparison, from Thompson et al. (1996a)]. In conjunction with additional data on the stability of individual geometric parametersmeasured in multiple trials (Tables 7,8), these tests suggest that the contouring reliability achievable with the high-resolution 3D gradient-echo (spoiled GRASS) MR scansapproached that obtainable with ultra-high-resolution cryosection imaging (see Table 8). Variability in delineating sulcal trajectories also represented a negligible fraction of the overallinter-subject variability, which was consistently a factor 9–190 times greater than the errors introduced in the contouring process. Densely acquired 3D gradient-echo scans maytherefore offer quantitative advantages in delineating structural anomalies in a variety of disease states.
Cerebral Cortex Sep 1998, V 8 N 6 505

506 3D Cortical Variation: Aging and Alzheimer’s Disease • Thompson et al.

and Toga, 1997), mapping of 4D growth patterns in the
developing human brain (Thompson and Toga, 1998) and
detection of structural anomalies in AD (Thompson et al., 1997).
The findings presented here on cortical variation and
asymmetry in normal aging and AD reveal its regional hetero-
geneity, local asymmetries and 3D characteristics. Commissural
regions at risk of early selective damage are identified, and these
sites are found to be topographically linked with known cortical
and lobar patterns of structural, metabolic and perfusion
deficits. In the future, more advanced strategies for the assess-
ment and quantitative encoding of cortical variation may provide
extensive information on differential vulnerability of brain
regions, disease-specific variants, and selective changes in
callosal and lobar anatomy that accompany aging and AD.
NotesThis work was generously supported by research grants from the National
Library of Medicine (LM/MH05639), the National Science Foundation
(BIR 93-22434), the NCRR (RR05956) and the Human Brain Project,
which is funded jointly by NIMH and NIDA (P20 MH/DA52176). P.M.T.
was supported by the United States Information Agency, under Grant
G-1-00001, by a Fellowship of the Howard Hughes Medical Institute and
by a research grant from the U.S.–U.K. Fulbright Commission, London.
Address correspondence to Dr Arthur W. Toga, Room 4238, Reed
Neurological Research Center, Laboratory of Neuro Imaging, 710
Westwood Plaza, Los Angeles, CA 90095-1769, USA. Email: toga@
loni.ucla.edu.
ReferencesAboitiz F, Scheibel AB, Fisher RS, Zaidel E (1992) Fiber composition of the
human corpus callosum. Brain Res 598:143–153.
Adams RL, Smigielski J, Jenkins RL (1984) Development of a Satz–Mogel
short form of the revised Wechsler Adult Intelligence Scale (WAIS-R) J
Consult Clin Psychol 52:908.
Arnold SE, Hyman BT, Flory J, Damasio AR, Van Hoesen GW (1991) The
topographical and neuroanatomical distribution of neurofibrillary
tangles and neuritic plaques in the cerebral cortex of patients with
Alzheimer’s Disease. Cereb Cortex 1:103–116.
Baumgardner TL, Singer HS, Denckla MB, Rubin MA, Abrams MT, Colli
MJ, Reiss AL (1996) Corpus callosum morphology in children with
Tourette syndrome and attention deficit hyperactivity disorder.
Neurology 47:477–482.
Biegon A, Eberling JL, Richardson BC, Roos MS, Wong ST, Reed BR, Jagust
WJ (1994) Human corpus callosum in aging and Alzheimer’s Disease:
a magnetic resonance imaging study. Neurobiol Aging 15:393–397.
Black SE, Szekely C, Szalai JP, Kidron D, Yu D, Parker J, Buck B, Stanchev
P, Bronskill M (1996) Can MRI brain measures distinguish Alzheimer’s
Disease from normal aging?, Poster presentation, 2nd International
Conference on Functional Mapping of the Human Brain, June 17–21,
1996, Boston, MA. NeuroImage 3:S476.
Blacker D, Albert MS, Bassett SS, Go RC, Harrell LE, Folstein MF (1994)
Reliability and validity of NINCDS-ADRDA criteria for Alzheimer’s
Disease. The National Institute of Mental Health Genetics Initiative.
Arch Neurol 51:1198–1204.
Bookstein FL (1997) Landmark methods for forms without landmarks:
morphometrics of group differences in outline shape. Med Image Anal
1:225–243.
Braak H, Braak E (1991) Neuropathological staging of Alzheimer-related
changes. Acta Neuropathol 82:239–259.
Brun A, Englund E (1981) Regional pattern of degeneration in Alzheimer’s
Disease: neuronal loss and histopathologic grading. Histopathology
5:549–564.
Burzaco J (1985) Stereotaxic pallidotomy in extrapyramidal disorders.
Appl Neurophysiol 48:283–287.
Capitani E, Della Sala S, Spinnler H (1990) Controversial neuro-
psychological issues in Alzheimer’s Disease: inf luence of onset-age
and hemispheric asymmetry of impairment. Cortex 26:133–145.
Clarke S, Kraftsik R, Van der Loos H, Innocenti GM (1989) Forms and
measures of adult and developing human corpus callosum: is there
sexual dimorphism? J Comp Neurol 280:213–230.
Coleman PD, Flood DG (1987) Neuron numbers and dendritic extent in
normal aging and Alzheimer’s Disease. Neurobiol Aging 8:521–545.
Cook MJ, Free SL, Fish DR, Shorvon SD, Straughan K, Stevens JM (1994)
Analysis of cortical patterns. In: Magnetic resonance scanning and
epilepsy (Shorvon SD et al., eds), pp 263–274. New York: Plenum
Press.
Corder EH, Jelic V, Basun H, Lannfelt L, Valind S, Winblad B, Nordberg A
(1997) No difference in cerebral glucose metabolism in patients with
Alzheimer Disease and differing apolipoprotein E genotypes. Arch
Neurol 54:273–277.
Cressie NAC (1991) Statistics for spatial data. New York: Wiley.
Cuénod CA, Denys A, Michot JL, Jehenson P, Forette F, Kaplan D, Syrota
A, Boller F (1993) Amygdala atrophy in Alzheimer’s Disease: an in
vivo magnetic resonance imaging study. Arch Neurol 50:941–945.
Cummings J, Benson DF, LoVerme S (1980) Reversible dementia.
Illustrative cases, definition, and review. J Am Med Assoc 243:
2434–2439.
Cunningham DJ (1892) Contribution to the surface anatomy of the
cerebral hemispheres. Cunningham Mem (R Irish Acad) 7:372.
Davatzikos C (1996) Spatial normalization of 3D images using deformable
models. J Comput Assist Tomogr 20:656–665.
Davatzikos C, Vaillant M, Resnick SM, Prince JL, Letovsky S, Bryan RN
(1996) A computerized approach for morphological analysis of the
corpus callosum. J Comput Assist Tomogr 20:88–97.
Davidson RJ, Hugdahl K (1994) Brain asymmetry. Boston, MA: MIT Press.
Davis PC, Mirra SS, Alazraki N (1994) The brain in older persons with and
without dementia: findings on MR, PET and SPECT images. Am J
Radiol, 162:1267–1278.
DeCarli C, Grady CL, Clark CM, Katz DA, Brady DR, Murphy DG, Haxby
JV, Salerno JA, Gillette JA, Gonzalez-Aviles A, Rapoport SI (1996)
Comparison of positron emission tomography, cognition, and brain
volume in Alzheimer’s disease with and without severe abnormalities
of white matter. J Neurol Neurosurg Psychiat 60:158–167.
Delaère P, Duyckaerts C, Brion JP, Poulain V, Hauw JJ (1989) Tau, paired
helical filaments and amyloid in the neocortex: a morphometric study
of 15 cases with graded intellectual status in aging and senile
dementia of Alzheimer type. Acta Neuropathol (Berl) 77:645–653.
DeQuardo JR, Bookstein FL, Green WD, Brunberg JA, Tandon R (1996)
Spatial relationships of neuroanatomic landmarks in schizophrenia.
Psychiat Res 67:81–95.
Doraiswamy PM, Figiel GS, Husain MM, McDonald WM, Shah SA, Boyko
OB, Ellinwood EH Jr, Krishnan KR (1991) Aging of the human corpus
callosum: magnetic resonance imaging in normal volunteers. J
Neuropsychiat Clin Neurosci 3:392–397.
Di Patre PL (1990) Cytoskeletal alterations might account for the
phylogenetic vulnerability of the human brain to Alzheimer’s disease.
Med Hypoth 34:165–170.
Drury HA, Van Essen DC, Snyder AZ, Shulman GL, Akbudak E, Ollinger
JM, Conturo TE, Raichle M, Corbetta M (1997) Warping fMRI
activation patterns onto the visible man atlas using f luid deformations
of cortical f lat maps. 3rd International Conference on Functional
Mapping of the Human Brain, Copenhagen, May 19–23 1997.
NeuroImage 5:S421.
Duara R, Kushch A, Gross-Glenn K, Barker WW, Jallad B, Pascal S,
Loewenstein DA, Sheldon J, Rabin M, Levin B (1991) Neuroanatomic
differences between dyslexic and normal readers on magnetic
resonance imaging scans. Arch Neurol 48:410–416.
Eberstaller O (1884) Zür Oberf lachen Anatomie der Grosshirn Hemi-
sphaeren. Wien Med Bl 7:479, 642, 644.
Eidelberg D, Galaburda AM (1982) Symmetry and asymmetry in the
human posterior thalamus: I. Cytoarchitectonic analysis in normal
persons. Arch Neurol 39(6):325–332.
Erkinjuntti T, Lee DH, Gao F, Steenhuis R, Eliasziw M, Fry R, Merskey H,
Hachinski VC (1993) Temporal lobe atrophy on magnetic resonance
imaging in the diagnosis of early Alzheimer’s disease. Arch Neurol
50:305–310.
Folstein MF, Folstein SE, McHugh PR (1975) ‘Mini mental state’: a
practical method of grading the cognitive state of patients for the
clinician. J Psychiat Res 12:189–198.
Fox PT (1995) Spatial normalization: origins, objectives, applications and
alternatives (Editorial). Hum Brain Map 3:161–164.
Friedland RP, Luxenberg J (1988) Neuroimaging and dementia. In:
Clinical neuroimaging: frontiers in clinical neuroscience (Theodore
WH, ed), vol. 4, pp 139–163. New York: Alan R Liss.
Friedland RP, Budinger TF, Jagust WJ, Koss E, Derenzo S, Huesman RH,
Cerebral Cortex Sep 1998, V 8 N 6 507

Yano Y (1985) Positron tomography and the differential diagnosis and
pathophysiology of Alzheimer’s disease. In: Senile dementia of the
Alzheimer type (Traber J, Gispen WH, eds), pp 124–133. Heidelberg:
Springer-Verlag.
Gado M, Hughes CP, Danziger W, Chi D, Jost G, Berg L (1982) Volumetric
measurements of the cerebrospinal f luid spaces in demented subjects
and controls. Radiology 144:535–538.
Galaburda AM (1995) Anatomic basis of cerebral dominance. In: Brain
asymmetry (Davidson RJ, Hugdahl K, eds), pp 51–73. Boston, MA:
MIT Press.
Geschwind N, Levitsky W (1968) Human brain: left–right asymmetries in
temporal speech region. Science 161:186.
Galaburda AM, Geschwind N (1981) Anatomical asymmetries in the adult
and developing brain and their implications for function. Adv Pediatr
28:271–292.
Galaburda AM, Sanides F, Geschwind N (1978) Human brain:
cytoarchitectonic left–right asymmetries in the temporal speech
region. Arch Neurol 35:812–817.
Giedd JN, Castellanos FX, Casey BJ, Kosuch P, King AC, Hamburger SD,
Rapoport JL (1994) Quantitative morphology of the corpus callosum
in attention deficit hyperactivity disorder. Am J Psychiat 151:
665–669.
Gómez-Isla T, Price JL, McKeel DW, Morris JC, Growdon JH, Hyman B
(1996) Profound loss of layer II entorhinal cortex neurons occurs in
very mild Alzheimer’s disease. J Neurosci 16:4491–4500.
Grenander U, Miller MI (1994) Representations of knowledge in complex
systems. J Royal Statist Soc B, 56:549–603.
Griffen LD (1994) The intrinsic geometry of the cerebral cortex. J Theor
Biol 166:261–273.
Hofmann E, Becker T, Meixensberger J, Jackel M, Schneider M,
Reichmann H (1995) Disturbances of cerebrospinal f luid (CSF)
circulation — neuropsychiatric symptoms and neuroradiological
contribution. J Neural Transm Gen Sect 99:79–88.
Hynd GW, Hall J, Novey ES, Eliopulos D, Black K, Gonzales JJ, Edmonds
JE, Riccio C, Cohen M (1995) Dyslexia and corpus callosum
morphology. Arch Neurol 52:32–38.
Janowsky JS, Kaye JA, Carper RA (1996) Atrophy of the corpus callosum
in Alzheimer’s disease versus healthy aging. J Am Geriatr Soc
44:798–803.
Jernigan TL, Salmon DP, Butters N, Hesselink JR (1991) Cerebral structure
on MRI: Part I. Localization of age-related changes. Biol Psychiat
29:55–67.
Kaplan E, Goodglass H, Weintraub S (1984) The Boston naming test.
Philadelphia, PA: Lea & Phebiger Press.
Katzman R (1986) Alzheimer’s disease. N Engl J Med 314:964.
Kaufer DI, Miller BL, Itti L, Fairbanks LA, Li J, Fishman J, Kushi J,
Cummings JL (1997) Midline cerebral morphometry distinguishes
frontotemporal dementia and Alzheimer’s disease/ Neurology
48:978–985.
Khachaturian ZS (1985) Diagnosis of Alzheimer’s disease. Arch Neurol
42: 1097–1105.
Kido DK, Caine ED, LeMay M, Ekholm S, Booth H, Panzer R (1989)
Temporal lobe atrophy in patients with Alzheimer disease: a CT study.
Am J Neuro Rep 7:551–555.
Kikinis R, Shenton ME, Gerig G, Hokama H, Haimson J, O’Donnell BF,
Wible CG, McCarley RW, Jolesz FA (1994) Temporal lobe sulco-gyral
pattern anomalies in schizophrenia: an in vivo MR three-dimensional
surface rendering study. Neurosci Lett 182:7–12.
Killiany RJ, Moss MB, Albert MS, Sandor T, Tieman J, Jolesz F (1993)
Temporal lobe regions on magnetic resonance imaging identify
patients with early Alzheimer’s disease. Arch Neurol 50:949–954.
LaMantia AS, Rakic P (1990) Axon overproduction and elimination in the
corpus callosum of the developing rhesus monkey. J Neurosci
10:2156–2175.
Larsen JP, Høien T, Ödegaard H (1992) Magnetic resonance imaging of the
corpus callosum in developmental dyslexia. Cogn Neuropsychol
9:123–134.
Leonard CM (1996) Structural variation in the developing and mature
cerebral cortex: noise or signal? In: Developmental neuroimaging:
mapping the development of brain and behavior (Thatcher RW, Reid
Lyon G, Rumsey J, Krasnegor N, eds), pp 207–231. San Diego, CA:
Academic Press.
Lezak M (1983) Neuropsychological assessment (2nd edn). New York:
Oxford University Press.
Loewenstein DA, Barker WW, Chang JY, Apicella A, Yoshii F, Kothari P,
Levin B, Duara R (1989) Predominant left hemisphere metabolic
dysfunction in dementia. Arch Neurol 46:146–152.
MacDonald D, Venugopal R, Caramanos Z, Petrides M, Avis D, Evans AC
(1997) A surface-based 2D sulcal atlas. 3rd International Conference
on Functional Mapping of the Human Brain, Copenhagen, May 19–23
1997. NeuroImage 5:S414.
Mathalon DH, Sullivan EV, Rawles JM, Pfefferbaum A (1993) Correction
for head size in brain-imaging measurements. J Psychiat Res:
Neuroimag 50:121–139.
Mazziotta JC, Toga AW, Evans AC, Fox PT, Lancaster J (1995) A
probabilistic atlas of the human brain: theory and rationale for its
development. NeuroImage 2:89–101.
McKhann G, Drachman D, Folstein M, Katzman R, Price D, Stadian EM
(1984) Clinical diagnosis of Alzheimer’s disease: report of the
NINCDS-ARDRA Work Group under the auspices of the Health and
Human Services Task Force on Alzheimer’s Disease. Neurology
34:939–944.
Mega MS, Chen S, Thompson PM, Woods RP, Karaca TJ, Tiwari A, Vinters
H, Small GW, Toga AW (1997) Mapping pathology to metabolism:
coregistration of stained whole brain sections to PET in Alzheimer’s
disease. NeuroImage 5:147–153.
Meltzer CC, Frost JJ (1994) Partial volume correction in emission-
computed tomography: focus on Alzheimer disease. in: Functional
neuroimaging: technical foundations (Thatcher RW, Hallett M,
Zeffiro T, John ER, Huerta M, eds), pp 163–170. San Diego, CA:
Academic Press.
Missir O, Dutheil-Desclercs C, Meder JF, Musolino A, Fredy D (1989)
Central sulcus patterns at MRI. Neuroradiology 16:133–144.
Murphy DGM, DeCarli CD, Daly E, Gillette JA, McIntosh AR, Haxby JV,
Teichberg D, Schapiro MB, Rapoport SI, Horwitz B (1993) Volumetric
magnetic resonance imaging in men with dementia of the Alzheimer
type: correlations with disease severity. J Biol Psychiat 34:612–621.
Ono M, Kubik S, Abernathey CD (1990) Atlas of the cerebral sulci.
Stuttgart: Georg Thieme Verlag.
Osterreith PA (1944) Le Teste de Copie d’une Figure Complexe. Arch
Psychol 30:206–256.
Pandya DN, Seltzer B (1986) The topography of commisural fibers. In:
Two hemispheres–one brain: functions of the corpus callosum
(Lepore F, Ptito M, Jasper HH, eds), p 47. New York: Alan R Liss.
Paus T, Tomaiuolo F, Otaky N, MacDonald D, Petrides M, Atlas J, Morris R,
Evans AC (1996a) Human cingulate and paracingulate sulci: pattern,
variability, asymmetry and probabilistic map. Cereb Cortex 6:
207–214.
Paus T, Otaky N, Caramanos Z, MacDonald D, Zijdenbos A, D’Avirro D,
Gutmans D, Holmes CJ, Tomaiuolo, Evans AC (1996b) In vivo
morphometry of the intrasulcal gray matter in the human cingulate,
paracingulate, and superior-rostral sulci: hemispheric asymmetries,
gender differences and probability maps. J Comp Neurol 376:
664–673.
Pearson RC, Esiri MM, Hiorns RW, Wilcock GK, Powell TP (1985)
Anatomical correlates of the distribution of the pathological changes
in the neocortex in Alzheimer disease. Proc Natl Acad Sci USA
82:4531–4534.
Pozzilli C, Bastianello S, Padovani A, Passafiume D, Millefiorini E, Bozzao
L, Fieschi C (1991) Anterior corpus callosum atrophy and verbal
f luency in multiple sclerosis. Cortex 27:441–445.
Rademacher J, Caviness VS Jr., Steinmetz H, Galaburda AM (1993)
Topographical variation of the human primary cortices: implications
for neuroimaging, brain mapping and neurobiology. Cereb Cortex
3:313–329.
Rajkowska G, Goldman-Rakic P (1995) Cytoarchitectonic definition of
pre-frontal areas in the normal human cortex. II. Variability in
locations of areas 9 and 46 and relationship to the Talairach
coordinate system. Cereb Cortex 5:323–337.
Rey A (1941) L’Examen Psychologique dans les cas d’Encephalopathie
Traumatique. Arch Psychol 28:286–340.
Roland PE, Zilles K (1994) Brain atlases — a new research tool. Trends
Neurosci 17:458–467.
Sanides F (1962) Die Architektonik des menschlichen Stirnhirns.
In: Monographien aus dem Gesamtegebiete der Neurologie
und Psychiatrie 98 (Mueller M, Spatz H, Vogel P, eds). Berlin:
Springer-Verlag.
Scott SA (1993) Dendritic atrophy and remodeling of amygdaloid neurons
in Alzheimer’s disease. Dementia 4:264–272.
Siegel BV Jr, Shihabuddin L, Buchsbaum MS, Starr A, Haier RJ, Valladares
508 3D Cortical Variation: Aging and Alzheimer’s Disease • Thompson et al.

Neto DC (1996) Gender differences in cortical glucose metabolism in
Alzheimer’s disease and normal aging. J Neuropsychiat Clin Neurosci
8:211–214.
Small GW, Mazziotta JC, Collins MT, Baxter LR, Phelps ME, Mandelkern
MA, Kaplan A, La Rue A, Adamson CF, Chang L et al. (1995)
Apolipoprotein E type 4 allele and cerebral glucose metabolism in
relatives at risk for familial Alzheimer disease J Am Med Assoc
273:942–947.
Steinmetz H, Furst G, Freund H-J (1989) Cerebral cortical localization:
application and validation of the proportional grid system in MR
imaging. J Comput Assist Tomogr 13:10–19.
Steinmetz H, Furst G, Freund H-J (1990) Variation of perisylvian and
calcarine anatomic landmarks within stereotaxic proportional
coordinates. Am J Neuroradiol 11:1123–1130.
Stensaas SS, Eddington DK, Dobelle WH (1974) The topography and
variability of the visual cortex in man. J Neurosurg 40:747–755.
Stoyan D, Stoyan H (eds) (1991) Fractals, random shapes, and point fields:
methods of geometric statistics. New York: Wiley.
Strauss E, Kosaka B, Wada J (1983) The neurobiological basis of lateralized
cerebral function. A review. Hum Neurobiol 2:115–127.
Talairach J, Szikla G (1967) Atlas d’Anatomie Stereotaxique du Tel-
encephale: Etudes Anatomo-Radiologiques. Paris: Masson & Cie.
Talairach J, Tournoux P (1988) Co-planar stereotaxic atlas of the human
brain. New York: Thieme Medical Publishers.
Tanna NK, Kohn MI, Horwich DN, Jolles PR, Zimmerman RA, Alves WM,
Alavi A (1991) Analysis of brain and cerebrospinal f luid volumes with
MR imaging: impact on PET data correction for atrophy: Part II: Aging
and Alzheimer dementia. Radiology 178:109–114.
Thompson PM, Toga AW (1996) A surface-based technique for warping
3-dimensional images of the brain. IEEE Trans Med Imag 15:1–16.
Thompson PM, Toga AW (1997) Detection, visualization and animation of
abnormal anatomic structure with a deformable probabilistic brain
atlas based on random vector field transformations. Med Image Anal
1:271–294.
Thompson PM, Toga AW (1998) Anatomically-driven strategies for brain
image warping and pathology detection. In: Brain warping (Toga AW,
ed.). San Diego, CA: Academic Press.
Thompson PM, Schwartz C, Lin RT, Khan AA, Toga AW (1996a) 3D
statistical analysis of sulcal variability in the human brain. J Neurosc
16:4261–4274.
Thompson PM, Schwartz C, Toga AW (1996b) High-resolution random
mesh algorithms for creating a probabilistic 3D surface atlas of the
human brain. NeuroImage 3:19–34.
Thompson PM, MacDonald D, Mega MS, Holmes CJ, Evans AC, Toga AW
(1997) Detection and mapping of abnormal brain structure with a
probabilistic atlas of cortical surfaces. J Comput Assist Tomogr
21:567–581.
Van Essen DC, Drury HA, Joshi SC, Miller MI (1997) Comparisons
between human and macaque using shape-based deformation
algorithms applied to cortical f lat maps. 3rd International Conference
on Functional Mapping of the Human Brain, Copenhagen, May 19–23
1997. NeuroImage 5:S41.
Vannier MW, Brunsden BS, Hildebolt CF, Falk D, Cheverud JM, Figiel GS,
Perman WH, Kohn LA, Robb RA, Yoffie RL, Bresina SJ (1991) Brain
surface cortical sulcal lengths: quantification with three-dimensional
MR imaging. Radiology 180:479–484.
Vermersch P, Roche J, Hamon M, Daems-Monpeurt C, Pruvo JP, Dewailly
P, Petit H (1996) White matter magnetic resonance imaging
hyperintensity in Alzheimer’s disease: correlations with corpus
callosum atrophy. J Neurol 243:231–234.
Wahlund LO, Andersson-Lundman G, Basun H, Almkvist O, Bjorksten KS,
Saaf J, Wetterberg L (1993) Cognitive functions and brain structures:
a quantitative study of CSF volumes on Alzheimer patients and healthy
control subjects. Magn Reson Imag 11:169–174.
Watson JDG, Myers R, Frackowiak RSJ, Hajnal JV, Woods RP, Mazziotta JC,
Shipp S, Zeki S (1993) Area V5 of the human brain: evidence from a
combined study using positron emission tomography and magnetic
resonance imaging. Cereb Cortex 3:79–94.
Wechsler D (1955) Wechsler Adult Intelligence Scale. New York: The
Psychological Corp.
West MJ, Coleman PD, Flood DG, Troncoso JC (1994) Differences in
the pattern of hippocampal neuronal loss in normal aging and
Alzheimer’s disease. Lancet 344:769–772.
Whitehouse PJ, Price DL, Clark AW, Coyle JT, DeLong MR (1981)
Alzheimer’s disease: evidence for selective loss of cholinergic neurons
in the nucleus basalis. Ann Neurol 10:122–126.
Wilcock GK, Esiri MM (1982) Plaques, tangles and dementia: a
quantitative study. J Neurol Sci 56:343–356.
Witelson SF (1989) Hand and sex difference in the isthmus and genu of
the corpus callosum: a post mortem morphological study. Brain
112:799–835.
Witelson SF, Kigar DL (1992) Sylvian fissure morphology and asymmetry
in men and women: bilateral differences in relation to handedness in
men. J Comp Neurol 323:326–340.
Witelson SF, Glezer II, Kigar DL (1995) Women have greater density of
neurons in posterior temporal cortex. J Neurosci 15:3418–3428.
Woodruff PW, McManus IC, David AS (1995) Meta-analysis of corpus
callosum size in schizophrenia. J Neurol Neurosurg Psychiat
58:457–461.
Woods RP (1996) Modeling for intergroup comparisons of imaging data.
NeuroImage 4:84–94.
Yoshii F, Shinohara Y, Duara R (1990) Cerebral white matter bundle
alterations in patients with dementia of Alzheimer type and patients
with multi-infarct dementia — magnetic resonance imaging study.
Rinsho Shinkei 30:110–112.
Cerebral Cortex Sep 1998, V 8 N 6 509