Embed Size (px)
Citation preview

1 | P a g e
Corruption inside the firms and effect on firm value:
A cross-country analysis based on firm-level data
Maurizio La Rocca Associate Professor in
Management and Finance
University of Calabria
(Italy)
Neha Neha Research Assistant in
Corporate Finance
University of Calabria
(Italy)
Corrupt, fraud and illicit activities have become worldwide the major impediment on economic, political
and social development. While the existing empirical analysis is mainly based on measures of corruption
at country level, this is the first empirical research work, out of some studies related to survey, based on
a large dataset measuring illicit activities at businesses level and testing their consequences on firm
value. Using a cross-sectional data of 2,370 listed companies across 31 European countries, the aim of
this study is to highlight the impact of corruption, embedded inside the firm, on corporate performance.
Empirically, it is investigated what happens to firm performance considering whether and to what degree
the members of the board of director or members of the management, also at top level, are involved in
such illegal matters. The empirical findings suggest that firm corruption acts as a vibrant constraint to
its short-term as well as long-run performance. The involvement of the board members and management
in corrupt and any sort of illicit or dishonest practices decreases the accounting and market performance,
being harmful to firm’s growth opportunities. The paper also provides evidences of a gender issue on this
topic, as well as a test concerning the value effect of having politically exposure managers or members
of the Board.
Keywords: Corruption, Fraud, Illicit Activities, Corporate Value, Firm Performance.
JEL Classification: M20, G30, K40, L25,

2 | P a g e
“We can’t fight corruption unless we fight of speaking up. People must feel supported and protected,
that’s why we need EU-wide whistle-blower protection to raise standards across Europe, so that
individuals can come forward without fear of retaliation.” - Carl Dolan, Director of Transparency
International EU1.
“You live in a society where everybody steals. Do you choose to steal? The probability that you will be
caught is low, because the police are very busy chasing other thieves, and even if you do get caught, the
chances of your being punished severely for a crime this is common are low. Therefore, you too steal.”-
Mauro (1998).
1. Introduction
According to MacMillan Dictionary, “corruption can be defined as dishonest, fraudulent or illegal
behavior by officials or people in positions of power, especially when they accept money in exchange for
doing things for someone”. Although, corruption is a worldwide phenomenon that induces negative
effects on various domains of a society, in the last fifteen years, it is becoming strictly related to dishonest
businesses. Until 1980s, corruption has remained mainly the subject matter of sociology, political science,
history and criminal laws. However, since then, the growing evidence of corruption consequences on
economic performance have effectively earned a careful attention of economists, researchers and
government worldwide. The earlier studies on corruption accentuate the role of ineffective government
institutions and economic policies to invite and increase the level of corrupt activities (Abed & Gupta,
1 Transparency International, the global coalition against corruption, EU Office-
http://www.transparencyinternational.eu/2016/11/fear-of-speaking-out-against-corruption-shows-need-for-eu-whistleblower-
law/

3 | P a g e
2002). Since the rise of twenty first century, corruption and corporate frauds have grown up as one of
the most challenging factors for the economic, political, legal, and social development of the countries.
At present time, corruption is no more just a matter of ethics. Simply, it is exorbitant to have a huge loss
to the economic, social and political system and to their sustainable development.
Recently, according to the global survey report2 of Transparency International, corruption has
been identified as one of the most vital issues facing the world today (Global Corruption Barometer,
2013). The World Bank estimates state that every year, the amount of money paid in bribes is almost 1
trillion USD (World Bank, 2004) and now, current estimates of global cost of bribe corruption has
increased to 2 trillion USD, approximately 2% of global GDP (International Monetary Fund, 2016).
Daniel Kaufmann, an economist that had also served as the World Bank institute’s director, reports that
corruption is an obstacle not only for developing countries but also a great challenge for rich developed
nations, coining the following evocative phrase: “Fighting corruption is a global challenge” (World Bank,
2004). De facto, corruption has become so widespread that it seems almost implausible to find a single
newspaper without having some headline highlighting the alleged corruption issues (Global Corruption
Barometer, 2013).
Corruption, latu sensu defined, has been the subject matter of the front pages’ headlines of
popular business press, drawing the attention of many scholars, economists, investors, policy-makers and
government towards the pervasiveness and subtle effects of corporate scams that happens inside the firm3.
Apart from severe corporate scandals, many other corporations, their executives and board of directors
2 So far, it is the biggest global survey study, conducted by Transparency International, a leading coalition against corruption. It
covers 114,000 people across 107 countries to study the people’s direct experiences with bribery as well as their willingness to
stop corruption. One of the major findings of this report state that political parties (which is considered as the pillars of any
democracy) are the most corrupt institution, followed by the police. In addition, more than one in four people around the world
report having paid a bribe and more than half of person perceive the rise in the level of corruption in the last two years.
3 For instance, Enron Scandal (energy-trading corporation, 2001), WorldCom Scandal (telecommunication company, 2002),
Tyco Scandal (security systems company, 2002), HealthSouth Scandal (largest publicly traded healthcare company, 2003),
Lehman Brothers Scandal (Global financial services firm, 2008), Parmalat Scandal (multinational dairy and food corporation,
2003), Royal Ahold scandal (world’s largest international retail grocery and food service, 2003), Swissair scandal (international
airline, 2001), Satyam scandal (software company, 2009), Toshiba scandal (multinational conglomerate corporation, 2015), and
recently, Volkswagen emission scandal (world’s leading manufacturer of automobiles and commercial vehicles, 2015) along
with Fiat Chrysler emission scandal (automobile manufacturer, 2017). To see more: January 12, 2017 in Bloomberg news at link
https://www.bloomberg.com/news/articles/2017-01-12/fiat-chrysler-plunges-on-report-epa-to-allege-emissions-cheating

4 | P a g e
were caught engaging in unethical, criminal and illicit routines such as tax evasion, accounting frauds,
money laundering, bribery (or kickbacks), the sale of harmful items, and overly large executive bonuses.
In one sense, a considerable amount of literature has started to dedicate their research to explore the
significance of corporate governance to mitigate the level of corruption, whereas relatively, a little
attention has been attributed to explore the severity of corruption in terms of economic costs (Gaviria,
2002), happening due to the presence of corrupt behaviors in all types of economic activities.
In recent time, a book of Zingales (2012) analyzed the nowadays problem of crony capitalism,
describing an economy in which success in business depends on unethical and even illegal behaviors, to
overcome higher competition by searching for easier solutions based on cheating, hiding information and
close relationships between business people and government officials. In a sort of misunderstanding of
the role of relational capital, as intangibles sustaining value creation process, managers and entrepreneurs
look for favoritism in the distribution of legal permits, government grants or government support for
hiding unethical behaviors, special tax breaks, or something similar. It is the work of Zingales that raised
our concern for the corporate role of corruption or, in general, fraudulent, illegal or unethical behaviors
of firms.
The theoretical and empirical literature (Dyck et al. 2010, Dyck et al. 2013) spread a light on this
serious global issue, presenting evidence on the whistle-blowers of corporate frauds and economic cost
of such frauds, respectively. Since, it has been widely acknowledged fact about corruption that it is very
difficult to measure due to its illegal and secretive nature. In this direction, the latter studies are very
prominent to get better insights on the issue in the corporate world. On one side, for example, using a
sample of 216 cases of alleged corporate frauds, Dyck et al. (2010) did an extensive reading of each
fraud’s history and identified who are the subjects involved in the disclosure of these frauds. According
to Dyck et al. (2010), after deep investigation of corporate fraud cases, the outcome indicates to the
incapability of the supervisory bodies (both internal and external) failing to detect, punish and prevent
such large scale corporate scandals. More surprisingly, the Dyck et al. (2010) find that the subjects which
blow the whistle against frauds are either an employee (17% of cases), non-financial market regulators

5 | P a g e
(13%), or the media (13%). Hence, it is apparently clear that the internal governance and management of
firm do not take active participation in detecting these frauds. It can also be implied that not only the
management but also the members of the board of directors are the- “part of the game”, otherwise
complicit in these kinds of dishonest activities. On the other side, the paper of Dyck et al. (2013) stirs up
the curiosity as well as concern for corporate fraud effects on social and economic development. By
taking advantage of a natural experiment created by Arthur Andersen’s demise, the former authors find
the evidence that the probability of a firm engaging in corporate fraud in any given year is 14.5% and the
estimate the costs of these corporate frauds and find that fraud destroys 20.4% of enterprise value. These
evidence highlights the seriousness (in terms of economic costs) and consistency (in terms expected
number of fraudulent events every year) of this global issue.
After a brief review of the studies of Dyck et al. (2010) and Dyck et al. (2013), it can be noticed
that in real, the issue of corrupt or fraudulent activities is much nasty than its imagination as it lies in the
roots of companies. It has been seen in Dyck et al. (2010) sample of alleged fraud cases that board group
(who monitor and regulate the firm) and the management (who manages the firm) both are less likely to
highlight the internal dishonest, corrupt or illegal issues of firm for sake of self-interest, risk of reputation
damage, loss of designation and legal penalties. It refers to the significance of board and management as
internal (also individual) units of firm in exploring the effects of corruption on economic value. In existing
literature, at country-level, the study of the effects of corruption on economic value has become a fervent
topic of discussion, whereas firm-level study of corruption remains still limited.
The literature about corruption impact on growth, and economic performance of country
primarily can be divided into two strands. First stream of literature advocates that corruption is detrimental
to the economic growth, innovation and investment (Shleifer & Vishny, 1993; Mauro, 1995; Kaufmann
& Wei, 1999; Mo, 2001; Méon & Sekkat, 2005; Svensson, 2005; Aidt, 2009), supporting to the “sand the
wheels” of commerce hypothesis. For example, Shleifer & Vishny (1993) argue that corruption is much
more harmful and costly to economic development than any other sister acitivity such as taxation, because
the demands of secrecy in corrupt activities shift the investments away from the most valuable projects
6 | P a g e
into sufficiently useless projects, if latter project propose better option for secret corruption. Bribery, a
most popular form of corruption, increases the transaction costs due to uncertainity and secrecy nature of
corrupt transactions (Shleifer & Vishny, 1993). In this direction, Mauro (1995) conducted first systematic
cross-country empirical analysis for 58 countries to investigate the relationship between corruption
(measured as degree to which business transactions involve corruption and graft payments) and
investment and found that corruption decreases the investment level thereby economic growth of the
country. Kaufmann & Wei find that there is a positive relationship between firm bribe payments and
management time wasted with bureaucrats, and the cost of capital. Kaufmann and Wei suggest that
bureaucrats have discretionary power along with a given regulation and corruption prone officials can
usually customize the nature and amount of harassment on the company to extract maximum level of
bribe. Kaufmann & Wei (1999) argue that “efficient grease4 hypothesis holds on a critical assumption5
which should not be taken for granted”. Consistent with Mauro (1995), Mo (2001) find that corruption
(measured by Transparency International Corruption Perceptions Index) has negative effects on the
growth rate (real GDP), the level of human capital and private investment. Méon & Sekkat (2005) report
that corruption has a detrimental effect on both investment and growth. Méon & Sekkat, argue that the
negative effects of corruption tend to be worsen if the quality of governance deteriorate. Contrary to
above-mentioned evidence, Leff (1964), Huntington (1968) and Acemoglu and Verdier (1998) among a
few others argue that corruption might improve the economic growth of the nation, supporting the positive
view that corruption can work as lubricant (or oil) for the wheels of stiff government thereby improving
the efficiency of the system. This view of corruption enforces the benefits of corrupt practices (e.g. bribe
payments) to deal with hectic bureaucratic procedures, rigid bylaws and malfunctioning government
institutions. In case of country-level effects of corruption on economic growth, the hypothesis “sand the
wheels” of commerce has dominated.
4 “The bribery leads to lower effective red tape” hypothesis has been labelled as “efficient grease” theory (Kaufmann
& Wei, 1999). 5 The red tape or regulatory burden (license, tax, contracts, delays and so on) are assumed as exogeneous i.e.
independent of the incentive for officials to accept bribes.

7 | P a g e
There has been a dearth of research investigating the relationship between firm-level corruption
and financial performance. Prior evidence at firm-level are limited, mixed and mostly empirical findings
use either firm-level survey data or country-level survey data to analyze the effects of corruption on firm
performance of the firm. Van Vu et al. (2016), Williams et al. (2016), Athanasouli and Goujard (2015),
Ayaydın and Hayaloglu (2014), Faruq et al. (2013), Athanasouli et al. (2012), Wang and You (2012), De
Rosa et al. (2010), Li et al. (2008), Claessens et al. (2008), Fisman and Svensson (2007), Kimuyu (2007),
McArthur and Teal (2002), Gaviria (2002), Tanzi and Davoodi (2000), are some empirical studies which
investigate the impact of various forms of corruption (e.g. bribery, administrative corruption) on
productivity, growth, and financial performance. It is worthy to mention here that all these above
mentioned empirical studies use survey and perception based data to measure corruption. For instance,
using World Bank Enterprise Survey data of firms across 132 developing countries, Williams et al. (2016)
argue that bribery payments result in high sales growth and productivity. Athanasouli and Goujard (2015)
focus on the regional-level survey data based corruption measure to determine the impact of corruption
on productivity and management quality of firms, operating in manufacturing sector of Central and
Eastern Europe. Gaviria (2002) uses Latin American private firms’ survey data to empirically examine
the relationship between corruption and crime effects on sales growth, investment and employment
growth. Gaviria suggests that corruption and crime substantially damage the firm competitiveness and
argues that it is very unlikely to have any positive effects of corruption and crime. Ayaydın and Hayaloglu
(2014) using a panel data of 41 Turkish companies in manufacturing industry, study the effects of country-
level corruption on firm growth and show that corruption has positive impact on the growth of private
companies. Claessens et al. (2008) using a sample of Brazilian firms, examine the association of the
political connections of firms as a specific proxy of corruption with future firm-specific favours.
Claessens et al. find firms that offer higher campaign contributions to winning political parties in elections
get preferencial access to external finance as political favour as well as these firms enjoy higher stock
returns around the annoucement of election results.

8 | P a g e
There are mainly two limitations of the existing empirical studies on the relationship between firm-
level corruption and financial performance. First, mostly empirical work employs survey data to construct
the firm-level corruption measures and faces the potential problem of respondents’ perception bias across
survey questions (Kaufmann & Wei, 1999). Second, in prior empirical studies on corruption effects, the
country-level corruption proxies (e.g. control of corruption, corruption perceptions index (CPI)) have
been widely used to analyse corruption, and fraud effects on firm performance. Undoubtedly, the country-
level corruption measures are salient proxies to determine its effects on the economic outcomes (growth,
investment and development) of country. However, for the analysis of corruption effects on firm
performance, it must be measured at firm-level to have better estimation of corporate effects of corruption.
Since, the firm-level corruption is intrinsically associated with the corrupt or dishonest behaviours of the
individual units of firm (i.e. executives and board of directors), it will be plausible to scrutinize the role
of gender in determining way of firm level corruption effects on corporate performance, lying at the core
of different behavioural approach across gender towards corrupt or dishonest activities. The two
pioneering empirical studies of Dollar et al. (1999, 2001), and Swamy et al. (2001) unfold the debate on
investigation of the relationship between gender and corruption, showing that the higher level of women
representation in parliament lowers the level of corruption (Dollar et al., 1999, 2001), and women are less
likely to tolerate corruption as well as they are less involved in bribery than their male counterparts
(Swamy et al., 2001). In the same lane of research, there are few other empirical studies (Torgler & Valev,
2006; Sung et al., 2012; Breen et al., 2016) and experimental studies (Lambsdorff & Frank, 2011; Frank
et al., 2011; Rivas, 2013) which shed light on the role of gender in determining corrupt behaviours. In a
very recent paper, using a firm-level data on corruption, Breen et al. (2016) find that women are associated
with lower level of corruption in companies- female-owned businesses are less prone to the incidence of
bribery. Following the above-mentioned lane of research work on the association of gender with
corruption level, and another ongoing debate on the issue of gender equality, a plausible question arises
here- what are consequences of corruption on performance if females are corrupt or dishonest?
9 | P a g e
Over the period of last fifteen years, corruption has been suggested as one of the “hot” topics
and nowadays strongly damages the economic wealth worldwide. It will be compelling to investigate how
this subject can be related to another issue of gender-diversity that is, predominantly advocated to boost
the economic wealth. Although these are two streams of research that are individually receiving a great
attention of the business community, the academia, as well as by media, but so far, these two issues have
not yet well studied in terms of reciprocal interaction. The study of both topics at the same time will lead
us to shed light on the way female, that main literature suggests providing a more ethical (Beltramini et
al., 1984; Chonko & Hunt, 1985; Jones & Gautschi, 1988; Betz et al., 1989; Peterson et al., 1991; Ruegger
& King, 1992; Whipple & Swords, 1992; Borkowski & Ugras, 1998) and positive (Carter et al., 2003;
Erhardt et al., 2003; Farrell & Hersch, 2005; Campbell & Mínguez-Vera, 2008; Francoeur et al., 2008;
Dezsö & Ross, 2012) contribution to the businesses, is able to affect the way corruption influence firm
performance.
The objective of this study is to fill the above-mentioned gap in literature. Specifically, we intend
to verify, empirically whether with the aspirations to increase profitability, any efforts in corruption
activities by firms, its board of directors, or executives (also senior executives) create barriers for others
in the market to safeguard corporate competitive position, and overwhelm the competitors. To accomplish
the purpose of this study, we use a cross-sectional data sample of 2,370 European listed firms concerning
31 countries for the period of 2015. First, to extend analysis on the relationship between the corruption
and corporate performance, we investigate the role of corruption concerning each single individual unit
inside the firms, both in the management and the board of directors. The extent of corruption specific to
these individual units may provide better insights to analyse the corporate corruption effects. As we have
notified in the study of Dyck et al. (2010) and many real-life examples, it seems very evident that the
monitoring and managing functions of board of directors and executives, respectively, are neither any
more effective, nor in line with value creation process, and their behaviours are biased by corruption, in
the sense that managers and directors involved in corruption are not anymore able to effectively serve
their tasks. Thus, as main research issue, we investigate the effect of corrupt board members (as first

10 | P a g e
individual unit) on firm performance, and then, we explore the impact of executives’ corruption (as
second individual unit) on firm performance.
Our empirical analysis goes in deep on the role of corporate corruption investigating one specific
dimension of corruption i.e. the extent of political exposure of individual units, and then considering the
role of gender in conditioning the effect of corruption on financial performance. Motivated by the work
of Zingales (2012), the role of political exposed firms or individual units inside the firms is analysed to
verify the relevance of this specific kind of corruption. In recent years, the literature on the valuation of
political connections for firm value is emerging (Li et al., 2008). The proponents of political connections
often argue that firm’s political connectedness offers several benefits to improve the firm performance.
First of all, it allows the firms securing favourable regulatory conditions in terms of knowledge and close
friendships with policy makers and experience in dealing government or legal proceedings (Agarwal &
Knoeber, 2001). Moreover, it facilitates the preferential treatment by government in form of easy access
to resources such as bank loans or natural materials, tax benefits (or discounts), and regulatory benefits
(Faccio, 2006). Apart from potential benefits available for politically connected firms, such political
connections could also generate costs to firm, in terms of firm’s financial and/or non-financial resources
devoted to keep going this connection providing gifts, support to the political parties and similar activities.
Politically connected individuals also extract rents from these firms in exchange of their support in
generating favourable external linkage (Shleifer & Vishny, 1994). Since, it is widely acknowledged that
companies are fascinated towards the incentives of these political relationships (or connectivity), it is
essential to investigate the role of politically exposed firms as whole, and executives / board members on
financial performance of the firm.
According to Financial Action Task Force (FATF), a politically exposed person (PEP) is an
individual who is or has been entrusted with a prominent public function. It could be a senior official of
political party, a senior executive of a foreign government-owned company or immediate family member
of PEP. These individuals hold influential positions and keep power to formulate and manipulate the
important decision policies. In line with agency theory, we argue that firms managed or governed by

11 | P a g e
political exposed persons (executives and/or board members) may be more likely to exacerbate problem
of opportunism and agency conflicts. Moreover, it may undermine the quality of the management and/or
board of directors as these executives and/or board members may not be fully dedicated to delivering the
services to the firm as well as may prefer to extract heavy rents from company with respect to their
positions in the government and legal system and thereby, contribute to increase the costs of firm. These
are people that have personal attitude to make decisions according to possibility to have favour, promoting
much effort in avoiding and overpassing any competitive comparison.
In addition, to further scrutinize the role of corruption, it is considered the way personal attitude
of people involved in the decision processes inside the firm, in terms of gender diversity, can affect the
role of corruption in shaping firm performance. Gender, being one of the most important dynamics of
human behaviour, could play a significant role in understanding different magnitude of firm corruption
on corporate performance. Indeed, specific behavioural features (e.g. gender) of people working into the
firm can have different propensity to run for corrupt activities. It is considered that female have typically
higher ethical standards (Beltramini et al., 1984; Chonko and Hunt, 1985; Jones and Gautschi, 1988; Betz
et al., 1989; Peterson et al., 1991; Ruegger and King, 1992; Whipple and Swords, 1992; Borkowski and
Ugras, 1998) and more risk averse attitude (Schubert, 1999; Croson and Gneezy, 2009) than men. Thus,
we examine whether women that are widely known as more ethical, more risk averse and less corrupt
than men create some differences in terms of female corruption effects to firm performance, investigating
this relationship between corrupt female board members (also corrupt female executives) and the financial
performance of the firm. This analysis contributes to the corporate governance and gender-diversity
literature combining principal-agent framework and gender-differences literature. Firms with corruption
may be more likely to have problem of information asymmetry due to secretive and informal nature of
corrupt or dishonest activities. Similarly, the opportunistic behaviour of corrupt board members and
executives will promote the agency conflicts and reduce governance as well as management quality. In
addition, to explore corrupt behaviours of firm individual units (i.e. board and management members),
gender-specific corruption consequences should be considered. In line with existing gender-differences

12 | P a g e
literature which implies that females and males are systematically different in terms of their behaviours,
it can be assumed that behavioural differences will not only affect their perceptions about corrupt,
criminal or dishonest activities but also reflect their choice. By nature, females are not suitable for the
corrupt or dishonest activities. In general, they prefer honest and highly ethical behaviour, but if they are
involved in any corrupt or dishonest activities, they are not able to deal with and so such corruption
became even more negative for firm performance. Therefore, there would be twofold effects of corruption
on corporate performance. The first negative effect is related to what we mentioned earlier, while the
second one concerns to incapability of female to manage corruption. We argue that female amplifies this
negative effect of corruption because female involved in corrupt or dishonest activities, becomes more
nervous, fearful and less confident and may be more likely to increase the probability that activity will
fail in the presence of high risk of punishment, fines and fire out, and damage the performance of the
firm. Hence, it can be implied that firm-level corruption as whole, individual unit corruption in form of
board and management and finally, gender-specific corrupt behaviours all encourage the level of
information asymmetry, behavioural opportunism, and malfunctioning of governance and management
whereby the firm faces many types of costs such as resources misallocation, low productivity, reputation
costs and low level of growth opportunities, and decreases its performance. The main empirical findings
of this study are in line with evidence of the macro-level study of Mauro (1995), and firm-level studies
of Gaviria (2002), Athanasouli and Goujard (2015), Athanasouli et al. (2012), De Rosa et al. (2010) and
Faruq et al. (2013) that support “sand the wheels” of commerce perspective of corruption effects.
This empirical study has four value added features. First, we use corruption measures which are
based on the information of publicly detected sanction, enforcement, PEP (Political Espoused Persons)
or other cases (like adverse media) of corrupt, dishonest, unethical and illegal behaviours. This unique
data has been collected from Orbis database, which employs all the publicly detected corruption, fraud
and illegal act cases to develop this unique information set about firm as whole, its board members and
management. This sort of data also provides newness to our study because so far, no research study has
used this type of information since its availability in 2015. Second, we have focused on corruption at

13 | P a g e
board and management level, which did not yet receive enough attention from scholars in corruption
literature and it could help us to get better understanding on corporate corruption consequences. Third,
we investigate the effect of corruption on both short-term and long-term performance of the firm value.
The short-term performance (mainly captured by accounting performance) is based on asset-in-place
allowing to look at the past-consolidated competitive advantage the firm got until now, whereas long-
term performance (captured by the core of firm’s economic value) is growth opportunities with a far look
at the sustainability of the firm competitiveness. Finally, this is first study which jointly analyses two
prominent ongoing issues of corruption and gender to investigate the association of gender specific
corruption with firm performance based on gender-differences in corrupt behaviour.
The paper is organized as follows: In Section 2, we review the previous literature, real life examples
of corruption, empirical evidence on the effects of corruption on economic value of firm and develop the
research hypotheses. Section 3 explains the sample and research methodology used in the analysis.
Section 4 reports the descriptive statistics. In Section 5 describes the main findings. Finally, Section 6
presents the conclusion.
2. Literature Review and Hypothesis Development
2.1 Corruption definitions
Corruption is an ancient notion and it has long roots in the history. Dating back to the fourth century
B.C., Kautilya6 (an economist, philosopher, and the founder of Maurya Empire- prime minister of an
Indian king -Chandra Gupt Maurya) has described about this issue in his ancient book “Arthashastra”-
(Bardhan, 1997):
“Just as it is impossible not to taste the honey (or the poison) that finds itself at the tip of the
tongue, so it is impossible for a government servant not to eat up, at least, a bit of king’s revenue.
6 Kautilya was also known as Vishnugupta and Chanakya. He is considered as the pioneer of the field of political
science and economics in India and his work is also regarded as an important precursor to classical economics-
Wikipedia source.

14 | P a g e
Just as fish moving under water cannot possibly be found out either as drinking or not drinking
water, so government servants employed in the government work cannot be found out (while)
taking money (for themselves)”- (Bardhan 1991, pp. 1320)
Homogenous to any other form of behavior, it is believed that corruption is a very elusive, complex
and multidimensional phenomenon (Theobald, 1990). Corruption has been defined in numerous ways. In
practice, it can be viewed from ethical, social, legal, philosophical, and political aspects. Although it is
not easy to define this issue precisely, the most widely accepted and common definition of corruption
refers to all the activities in which the power of public office is exploited for the private benefits in such
a way that contravenes the rules of the game (Jain, 2001). According to broader perspective of corrupt,
dishonest or criminal behavior, certain illegal activities such as fraud, money laundering, drug trades,
kickbacks, bribes, and black market are associated with corruption, however these activities do not
constitute in above mentioned public corruption definition, since these activities do not involve the use
of public power (Jain, 2001). There are few other standard definitions which are common in use:
According to the dictionary of Law- “corruption can be defined as the act of an official or fiduciary person
who unlawfully and wrongfully uses his station or character to procure some benefit for himself or for
another person, contrary to duty and the rights of others”. On Wikipedia – corruption is defined as a form
of dishonest or unethical conduct by a person entrusted with a position of authority, often to acquire
personal benefit. Huntington (1968) defines- Corruption is the behaviour of public bureaucrats which
diverges from accepted norms to serve their private ends. Nye (1967) describes- Corruption is the
behaviour which deviates from the formal duties of a public role because of private-regarding (personal,
close family, private clique) pecuniary or status gains; or violates rules against the exercise of certain
types of private-regarding influence. So far, all the above-mentioned definitions depend upon the public
sphere which is recognisably distinct from private domain (Theobald, 1990).
In line with definition provided by International Country Risk Guide, published by Political Risk
Service Group, used in papers as Faruq et al. (2013, pp. 119), corruption “is more concerned with actual

15 | P a g e
or potential corruption in the form of excessive patronage, nepotism, job reservations, ‘favors-for-favors’,
secret party funds, and suspiciously close ties between politics and business”.
Following MacMillan dictionary and International Country Risk Guide definition and based on
LexisNexis World Compliance data7, we define-corruption is a kind of illegal, unethical and wicked
behaviour which abuses his/her authority, power and position to flourish his/her interest at the cost of
other individuals because of personal interest, self-satisfaction, competition, jealous, and aspiration of
status gain. This includes such behaviour as illicit activities, cheating, bribery, tax evasion, money
laundering, fraud, environmental and other types of crimes, forgery, and misappropriation among other
corrupt practices. Among all the above-mentioned corruption relevant activities, bribery is one of the
most popular forms of corruption which can be defined as- dishonestly or illegally persuade (someone)
to act in one’ favour by a gift of money or other inducement (Oxford dictionary). Since a long time,
bribery has been used as a tool of getting the things done by others. In history, many bribe cases have
been detected. For example, Ralph Lauren Corporation (a leading clothing retailer) in year 2013, was
found to pay bribes or gifts to officials to avoid customs inspections and related paper work8; Kellogg
Brown & Root in year 2009 (the largest engineering and construction firms) was declared a guilty of
paying bribes to Nigerian officials to win extensive construction contracts in violation of Foreign Corrupt
Practices Act (FCPA)9; BAE systems in year 2007 (a multinational defence, security and aerospace
company) was alleged for paying bribes in relation to its business in Saudi Arabia; and Siemens in year
2008 (largest manufacturing and electronics company)10 was alleged of paying bribes in order to secure
their contracts and some of the executive board members have been found guilty of this corruption. These
7 This is the most comprehensive and current database of sanctions, enforcements, PEP and negative news available all over the world. World
Compliance collects information concerning people and entities to allow to assess, predict and manager the risk associated with the quality of whom a firm intents to start to conduct a business. It employs a rigorous investigative process to provide robust databases of high-risk individuals
and entities commercially available. It is noteworthy for a firm to know in advance whether the managers or the company it wants to start to
make business is involved in some illegal or unethical behaviors and which are these behaviors, supporting more confident decisions, improving due diligence activities, increasing transaction screening efficiency and, in general, enhancing operational efficiency.
8 To see more: go on the link http://businessethicscases.blogspot.it/2014/02/ralph-lauren-16-million-bribery-case.html 9 See on: http://www.investopedia.com/financial-edge/0512/the-biggest-bribe-cases-in-business-history.aspx 10 To see more: go on the link http://www.nytimes.com/2008/12/21/business/worldbusiness/21siemens.html

16 | P a g e
abovementioned real-world examples enumerate how common is corrupt, dishonest or illegal behavioural
activities in the corporate world to fulfil some requirements of business.
2.2 Theoretical background
The Principal-agent theory is one of most widely implemented approaches of neo-institutional
economics which portrays the potential unfair conduct of the two actors entitled as principal and agent
(Braun and Guston, 2003) as well as this theory throws light upon the social connection between foremost
and agent who are involve in exchange of resources. In organizational surroundings, the principals (e.g.
owners or shareholders) are those which delegate resources, tasks and responsibilities to the agents (e.g.
executives or managers) to act on behalf of them. In line with principal-agent literature, the aforesaid
actors are hypothesized to be rational and they always seek out to maximize their utilities corresponding
to their preferences. Such conduct of two cooperative parties may expand the probability of dishonest and
unlawful actions. Essentially, the most widely discussed problems in this agency relationship are moral
hazard and adverse selection. In new institutional economics, these problems are outlined as
“opportunism11” where individuals are self-interested and work to maximize their private wealth. Since
the agents seek their interest with guile, they may always take advantage of information they have and
probably may conceal the essential information from principal to shrink work load, to achieve objectives
set by their principals, to obtain preferred positions among several other private benefits (Braun and
Guston, 2003). Therefore, the agents’ opportunistic behavior encourages them to pursue self-interest with
guile or dishonest activities such as lying, cheating and stealing (Williamson, 1985). According to the
study of Zahra et al. (2005), dishonesty angle of management refers to intentionally cover-up their unfair,
unethical and irresponsible moves from the arbitrators (or monitors and controllers) of their performance.
In organizational settings, corporate governance plays an important role to monitor and control
the functions of the business. To control the agency problem between managers and shareholders, the
11 Opportunism is a subtle and pervasive condition of human nature with which study of the economic organization must be
actively concerned.

17 | P a g e
company board works like a control and monitoring mechanism. The board of directors are hired by the
shareholders to control the opportunistic behaviors of managers as well as to ensure that the managers are
working to maximize shareholders’ wealth. According to agency perspective, the board of directors are
the monitors of managers’ actions and have responsibilities and powers to control the discretionary
actions of managers. Nowadays, the agency problems have become a serious concern for company
governance when the board members start to behave opportunistically and deteriorate governance system
of company. The board opportunism develops where few board members become self-interest seekers
and start to take advantage of their powers and positions.
There are many real-life cases which can be attributed to board opportunism where many board
members have been found guilty of accepting kickbacks from management or outsiders (such as vendors
of business) and favoring their actions against the stakeholders’ interest of the company. For example,
two Costco (a wholesale corporation) pharmacy directors are charged with professional misconduct.
According to Canadian national news12 on Nov. 22, 2016, two directors of Costco pharmacy have been
charged with professional misbehave for an alleged kickbacks scheme in which drug companies have
paid money to directors to get their medications stocked at retail chain and the Ontario College of
Pharmacists says both directors- “contravened a provincial law” in Ontario (a province in Canada). These
corruption relevant issues suggest that opportunistic behavior is no more limited to management but the
board members, are also the part of the game in organizational corruption.
Consistent with Zahra et al. (2005), it may be assumed that opportunistic individuals are likely to
misuse the firm’s resources for their personal gains and may conceal the crucial information from the
observers. This kind of situation will drive the agency problem along with information asymmetry and
constitute various costs like - lower productivity by misallocation of company resources and human
capital, lower- level of transparency, lower-level of investment, lack of trust, poor quality governance,
and environmental issues or absence of corporate social responsibility.
12 To see more: link https://www.thestar.com/news/canada/2016/11/22/costco-directors-charged-with-misconduct.html

18 | P a g e
In real world examples, the companies (e.g. Volkswagen, 2015 and Fiat Chrysler, 2017) who are
alleged of involving in corrupt behaviors, have been found to behave opportunistically. These companies
have made a choice to spend money on buying technology to avoid the issues in laboratory pollutants’
emissions test of vehicles rather than investing money to decrease the level of pollutants’ emission. We
imagine fraud or corruption allegations did not only affect company performance in the market but also
reduce their social credit ratings. In this direction, Athanasouli and Goujard (2015) argue that corruption
deteriorates the management practices in manufacturing firms thereby reduces its productivity.
Athanasouli and Goujard also advise that corruption imposes to lower level of R&D investment, weakens
management quality via lack of trust. Further, Athanasouli & Goujard highlight that managerial practices
are most of the time in charge for the consequences of corruption on firm efficiency and performance.
2.3 Volkswagen, and Fiat Chrysler: the pollutants emission cases in the automotive sector
In corporate world, there are many recent real-life examples which shed light on the corporate
misbehavior towards rules, legislations, corporate code of conduct, environmental health and safety for
sake of prompting private benefits. The recent and limelight Volkswagen (emissionsgate or dieselgate)
scandal in 2015 is one of the cases of corporate misbehavior by companies. Volkswagen is a leading
automobile company in Germany and it is also the second largest automobile company in the world. This
company sold approximately 9.92 million diesel cars all over the world in the year of 2014. At the time
of manufacturing of these cars, the company intentionally installed the software in these cars for showing
the lower level of pollution during car tests. Particularly, the company has deliberately programmed
turbocharged direct injection (TDI) diesel engines to activate certain emissions controls (e.g. nitrogen
oxides (NOx)) only at the time of laboratory emissions testing and violated the Clean Air Act. This
programming technology with diesel cars engines allowed the company to falsify the original NOx
emission limits of cars to meet the U.S. standards of vehicles’ NOx emission in the air. The Volkswagen
scandal indicates to the awareness over the higher levels of pollution, being emitted by all vehicles
manufactured by a wide range of car makers. The pollutants emission by vehicles are used to exceed the

19 | P a g e
legal emission standards of real world driving conditions. In this manner, the company cheated its
stakeholders (e.g. consumers, shareholders, government, employees, investors and others) and this
misbehavior was harming environment and contributing to the serious issue of global warming. Another
example indicates to the very recent case of Fiat Chrysler, it is a multinational automotive group. This
company is a multinational corporation and in present time, it is world’s seventh automobiles’
manufacturer. In the early month of 2017, the company has been investigated by U.S. justice department
because it was accused of violating environmental emission limits (i.e. pollution laws) with its diesel
vehicles and allowing to its vehicles to raise the pollution level on the roads. According to Bloomberg13
news on January 13, 2017, it has been found that Fiat Chrysler used technology from Germany’s Robert
Bosch GmbH, which is already under the investigation for its role in providing software to Volkswagen
car maker. These two above mentioned cases who implemented almost similar approach to cheat the
society and exploit the environment protection rules, set the example of common behavioral trend of the
companies, operating in same industry.
These companies who are alleged of involving in corrupt behaviors, set the example of corporate
opportunistic behavior and as result, companies have made a choice to spend money on buying technology
to avoid the issues in laboratory pollutants’ emissions test of vehicles rather than investing money to
decrease the level of pollutants’ emission. The Volkswagen scandal is the outcome of ambitions of Martin
Winterkorn (CEO), who wanted a successful business at any cost however, he headed towards a huge
loss and reputational damage to the company. The governance role seems completely missing in this case,
either board of directors were also the part of the game or did not want to blow the whistle against
company.
2.4 Empirical evidence and hypothesis development
13 To see more go to the link: https://www.bloomberg.com/news/articles/2017-01-13/fiat-chrysler-said-to-face-u-s-criminal-
emissions-investigation

20 | P a g e
The study of corruption and its consequences on economic performance has received a lot of
attention from broad spectrum of researchers, economists and policy-makers. Despite of a great deal of
theoretical and empirical literature on corruption, apparently mostly empirical studies have been devoted
to investigating its impact on macroeconomic performance indicators whereas firm-level evidence reveals
the room for future research. Until recently, a big pool of academic research using firm-level data, has
emphasized the relation between corruption and growth (e.g. Tanzi & Davoodi, 2000; Fisman &
Svensson, 2007; Kimuyu, 2007; Wang & You, 2012 and Ayaydın & Hayaloglu, 2014). In this section of
paper, we review the main literature on firm-level evidence which reveal influence of corruption impact
on firm performance and other related aspects of performance (e.g. Gaviria, 2002; McArthur and Teal,
2002; Claessens et al., 2008; De Rosa et al., 2010; Athanasouli et al., 2012; Faruq et al., 2013; Athanasouli
& Goujard, 2015; Van Vu et al., 2016; Williams et al., 2016). For example, the paper of Gaviria (2002),
using a survey data of private companies of Latin America, the author assesses the effects of corruption
and crime on the economic outcomes such as sales, investment and employment growth of the firm.
Gaviria also investigates the influence of bribery and illegal payments made by firms on bureaucratic
interference. His evidence supports the arguments that the corruption and crime are negatively affecting
the firm competitiveness and stresses that it is very unlikely to have any kind of positive effects and shows
that the negative association between corruption and firm growth is consistent even after controlling for
firm characteristics and country fixed effects. Similarly, in the context of Africa, McArthur & Teal (2002)
investigate the extent of corruption as a determinant of firm productivity. MaArthur & Teal find that both
local (firm-level proxies of reported and perceived bribe payments) and global (measured as irregular and
extra payments related to export and import permits, business licenses, tax assessments, police protection
or loan applications) corruption have adverse impact on firm productivity. Based on a sample of Brazilian
companies from 1998 and 2002 elections, Claessens et al. (2008) examine the association between
campaign contributions made by firms and future firm-specific favors. Claessens et al. find that there is
a positive correlation between campaign finance and firm future access to finance which implies that such
firms gain preferential access to finance from financial institutions. In addition, Claessens et al. argue

21 | P a g e
that executives who are more prone to engage in corruption also prefer to rationalize bribe payments and
other similar activities to get the things done. Using Business Environment and Enterprise Performance
Survey (BEEPS) data, Athanasouli et al. (2012) examine the association between corruption and firm
performance (measured as annual sales and sales growth) using a sample of Greek firms and suggest that
administrative corruption is “business barrier” that hampers the firm performance. Ayaydın & Hayaloglu
(2014) examine the effect of corruption level on the growth of the firm. Using a sample of 41
manufacturing firms from Turkey, the authors provide the evidence that there is statistically significant
and positive relation between corruption level and growth of private firms. Ayaydın & Hayaloglu argue
that corruption (measured as Corruption Perception Index) could accelerate the economic development
of any firm because it speeds up the commerce through illegal practices and bribe payments. De Rosa et
al. (2010) using a Bank Business Environment Performance Survey (BEEPS) data of 11,000 firms from
28 transition and developed countries, investigate the effect of corruption on firm-level productivity.
Testing the effects of bribe tax and time tax on full sample, they find that bribe tax appears to have
negative impact on firm productivity whereas the effects of time tax are statistically insignificant. Faruq
et al. (2013) investigate the impact of corruption (such as bribes, excessive patronage, nepotism, secret
party funding, job reservations and suspiciously close ties between politics and business), and
bureaucratic quality on firm productivity. Using a sample of 900 companies over twelve years of data
from three African countries (Ghana, Kenya and Tanzania), Faruq et al. find that both poor bureaucratic
quality and corruption have a strong negative impact on firm productivity. In a very recent paper, using a
nationwide survey data of institutional (provincial) quality and a sample of private manufacturing
enterprises (SMEs), Van Vu et al. (2016) show that bribery intensity has statistically significant and
negative impact on the financial performance (measured as ROA) of the firm. In another recent study of
William et al. (2016), the authors analyze the association of bribery with financial performance using a
sample of 132 developing countries over the period of 2006-2014. William et al. employ the WBES
survey data and find that bribery improves the firm performance (measured by sales growth, annual
employment growth and annual productivity). William et al. report that 25.3% firms believe or favor that

22 | P a g e
the informal payments (or bribe) and gifts to officials are necessary to get their work done. The work of
La Rocca et al. (2017) examine the moderating role of country-level corruption on the relationship
between cash holdings and financial performance of the firm. The authors conduct this study in Italian
context where bureaucratic red tape is high and hinders the economic development of the country. The
authors argue that in presence of high-level country corruption, the cash holdings have negative impact
on firm performance. The authors support the view that the management may prefer to keep high level of
cash stock to pay corrupt activities, having high discretionary power and opportunistic sovereignty,
instead of shareholders’ wealth. So, it can be implied that in absence of effective governance, the
management may start to exploit firm’ resources for their personal benefits at the cost of shareholders’
wealth.
The firms involved in any sort of illicit activities such as bribe payments, money laundering,
securities fraud (i.e. embezzlement, asset fabrication, share price manipulation, illegal guarantee etc.),
bank fraud, piracy, tax-evasion, financial crimes among others are most likely to increase its opportunity
cost and reduces the revenues. Since all the illicit (or illegal, dishonest, unethical) actions always
encourage the flow of the unofficial activities, which may be assumed to damage the overall functioning
and management of any firm. It can be expected that the involvement of any firm in corruption or fraud
reduces its efficiency, transparency as well as increases the miss-allocation of its capital and investment.
In turn, such firms increase their operational costs by paying a lot of money to settle their illegal matters
in form of bribes or fines payments charged by governing bodies of any nation and reputational costs in
form of image damage in market place. Moreover, the secretive nature of corrupt or dishonest behaviour
terminates the valuable information flow, communication, coordination, and transparency of the firm. As
a result, internal corrupt environment of firm increases the self-interest seeking of its actors (i.e. board
members and executives), the problem of insufficient information, opportunistic behaviour, and poor
governance thereby raising the agency conflicts among stakeholders of firm and reducing the
performance.

23 | P a g e
Many corporate scandals such as Enron and WorldCom have directed a serious concern due to
the inefficient monitoring and controlling by the governing body of the corporations. The conventional
arguments of (Fama & Jensen, 1983), define the function of board as a mechanism to monitor and control
the opportunism of executives, particularly top-level executives of the firm. In agency framework, the
corporate board members work as arbitrators in situation of deviation of interest between managers and
shareholders by establishing appropriate compensation schemes and replacing the opportunistic top
managers. If board members are involved in corrupt practices, they are more likely to be opportunistic.
Such board members may be more willing to agree with the management decisions because of their social
contacts, self-interest and financial ties with management. Consequesntly, it can be assumed that the
dishonest or corrupt board members may not perform their functions of monitoring and controlling in
effective manner. This discretionary behavior of board members will result in poor quality governance,
higher level of managerial opportunism thereby increase agency conflicts between managers and
shareholders. In brief, it may be assumed that the growing level of corrupt board members will have
adverse effects on the financial performance of the firm.
Following the principal-agent literature, it can be imagined that corrupt or dishonest executives
may be more likely to be opportunistic and prefer to maximize their personal wealth. These opportunistic
behaviors may create several difficulties such as information asymmetry, lack of trust and agency
conflicts. According to corruption literature, it is believed that individuals attract to do illegal, dishonest
and criminal acts because they are fascinated by the incentives of corruption to endorse their personal
benefits. Since executives have information advantage on company which they operate, corrupt
executives may be more likely to exploit their skills, knowledge, position and power against the firm as
well as may hide the essential information to cover-up their unethical, criminal, dishonest or illegal acts
and pursue those short-term investments which improve their incentives and personal wealth. These
actions by dishonest or corrupt executives may also create the problem agency conflicts. Corruption at
management-level increase the managerial opportunism, which leads to the agency conflicts, and

24 | P a g e
information asymmetry and enhances the costs of firm. Based on above-mentioned rationales, it may be
imagined that the rising level of corrupt executives will lower the financial performance of the firm.
Hypothesis 1: Corruption on board level or management level is negatively associated with corporate
performance.
As a matter of serious concern has arisen by the book of Zingalas (2012), where the growing
political power of company has been demonstrated as a detrimental force for competition and thereby
value. Zingalas highlights the issue how strong business leaders with political connections enjoy and
enrich themselves by siphoning money from the firm they manage. As just one of many examples
mentioned into the book, in the late of 1990s, the case of Russian oligarchs who used to trade (sell) oil at
below market-prices to foreign trading companies that they personally owned. According to Zingalas,
this kind of behaviour is not worldwide uncommon. Enron case in U.S., considering the political
(Republican) connection of Kenneth Lay (CEO and chairman for most of the life of Enron), and its CFO
Andrew Fastow, is another exemplification. Andrew Fastow was the in charge of all complex and
financially sophisticated off-balance-sheet special purpose entities (limited partnerships which Enron
controlled) used to hide Enron’s massive losses in their quarterly balance sheets. He had done the
fraudulent and corrupted interest of Enron and, at the same time, unlawfully maintaining personal stakes
in these supposedly independent ghost-entities, he was able to defraud Enron out of tens of millions of
dollars. Therefore, corruption in executives intensifies their personal request for opportunistic
expropriation of firm value, strongly damaging the firm. The literature on the association of politics with
firm values is growing. The political connections of firm have been suggested as an important determinant
of firm profitability (Agarwal & Knoeber, 2001). Agarwal & Knoeber argue that firm political
connections can assist it with their knowledge of government procedures and skills in estimating the
government policies. In the context of China, Li et al. (2008) show a positive relationship between firm
political connections (party membership) and firm performance, suggesting that the political party
alliance supports the private entrepreneurs to get easy access to external source of capital such loans from

25 | P a g e
banks and state-level institutions. Using a sample of 245 privatized firms headquartered in 27 developing
and 14 developed countries for period 1980-2002, Boubakri et al. (2008) find that newly privatized firm
with major political ties suffers and report the poor performance. Although, the political alliances are
associated with some benefits, there are also costs which firms with these connections bear. For example,
as Shleifer & Vishny (1994) emphasize that having politically connected members inside firms tend to
extract rents in exchange of their favours to firms.
The role of PEPs in management or board of director, who hold influential positions and keep
power to formulate and manipulate the important decision policies can be crucial for firm value. In line
with agency theory and real life examples, we argue that firms managed or governed by political exposed
persons (executives/ board members), may be more likely to have the problem of opportunism, agency
conflicts and information asymmetry; moreover, it may undermine the quality of the management and
board as these executives/ board members may not be fully dedicated to delivering the services to the
firm as well as may be more self-interested in extracting heavy rents from company with respect to their
positions in the government and legal system and increase the costs of firm. It can be imagined that PEPs’
connections with firm apparently brings profits to the firm, it also damages the demand of performance-
based incentives and rewards to favouritism. Therefore, the intensity of PEP executives or board members
may be assumed to create problems of opportunism, agency conflicts and poor-quality management and
governance and in turn, the firm performance.
Based on above-mentioned rationales, it may be assumed that the rising level of PEP executives or
members of the board will lower the financial performance of the firm.
Hypothesis 2: Political espoused executives (or board members) have negative impact on corporate
performance.
A broad spectrum of researchers, strategists and policy-developers acknowledges the significance
of gender-diversity and women empowerment at the highest hierarchy of decision-making for economic

26 | P a g e
and social development. Many empirical and experimental studies document that there exists the
systematic behavioural differences between females and males (Rivas, 2013) which are at core of
understanding the differences in their decision making in both personal and professional life. In
psychology and economics literature, several parameters namely overconfidence, social preferences,
moral development, modesty, faithfulness and leadership styles have been studied to explore the
behavioural differences between females and males and to determine the role of gender in firm decisions.
For example, the research work of Bernardi and Arnold (1997) suggest that female executives tend to
have higher level of moral values in comparison to their male counterparts. Like this, other studies report
that female business students are more concerned about ethical issues in comparison to their male
counterparts (Beltramini et al.,1984; Borkowski & Ugras,1998, and Peterson et al.,1991). The most well-
known gender-differences refer that women are on average more risk and loss averse than men (Schubert,
1999; Croson & Gneezy, 2009). In an experimental research review, Croson & Gneezy (2009) argue that
observed differences in risk behaviour of women and men are mainly driven by three types of variation
in level of emotional experiences, degree of confidence, and interpretation of risky situations. First, they
suggest that women are more risk averse because women show more intense nervousness and fear than
men in the projection of negative results (Fujita et al.,1991). Even it has been found in 1960s nationwide
survey of Americans that women usually experience more negative outcomes than men (Fujita et
al.,1991). Second, they argue that differences of risk attitudes between women and men may be caused
by the differences in confidence level as literature finds that women are less overconfident than men,
especially in uncertain environment. For example, women have been substantially found less confident
than men in their investment decisions (Estes & Hosseini, 1988). Finally, they argue that the differences
of risk attitudes are the differences in the interpretation of risk situations. For instance, males are more
likely to perceive risk situations as challenge whereas females interpret risky situations as threats, which
encourages them to avoid such situations. Based on the above theoretical arguments, we can assume that
corrupt females and males may not be likely to behave same since behavioural differences will reflect
their ways to respond the situations.

27 | P a g e
In this direction, empirical and experimental research work on the nexus between corruption and
gender is a matter of interest. Although these two issues are at the core of future economic development,
both related to business ethics and sustainability, only recently they are studied together in a very few
papers. Just after the pioneering studies of Dollar et al. (1999, 2001) and Swamy et al. (2001), the analysis
of the behaviour across gender towards corrupt or dishonest activities has gained more attention but not
enough. In a general view of two seminal studies (Dollar et al., 1999; Swamy et al., 2001), as well as
international studies of World Bank (Corruption and women in government), it has been identified that
larger female participation in organizations reduces level of corruption. Female are more trustworthy,
more ethical, and more reluctant to engage in corrupt activities. From this view, it can be implied that the
basic nature of females who perform their social roles as mother, caring for babies and family members
intrinsically averts and disturbs them to adjust and manage with corrupt or unhonourable environment.
The effects of corruption can be assumed to vary according to the gender; the way female deals
and reacts with corruption can differ compared to the behaviours of male. As Frank et al. (2011) detect
that female typically react more strongly to risky situations and corrupt activities are more likely to fail.
Female may typically feel more uncomfortable in corrupted situations, becoming nervous, fearful and
even less confident to deal with their corrupt (dishonest, dishonoured, unethical or illegal) task, having
as an output of higher probability that the corrupt activity fails. By nature, females are not suitable for
the corrupt or dishonest activities. In general, they prefer honest and highly ethical behaviour, but if they
are involved in any corrupt or dishonest activities, they are not able to deal with and so such corruption
became even more negative for firm performance. Therefore, there would be two effects of corruption on
corporate performance. The first negative effect is related to what we mentioned before, while the second
one concerns the role of female involved in corruption that amplifies this negative effect of corruption
because female involved in dishonest activities, becoming more nervous, fearful and less confident may
be more likely to increase the probability that activity will fail in the presence of high risk of punishment,
fines and fire out., and damage the performance of the firm.

28 | P a g e
In the light of above mentioned theoretical arguments, it can be imagined that corrupt female
executives (or board members) may not be as smart (and confident) as their male counterparts to cover-
up their mistakes and cannot handle the risk of involvement in corrupt transactions and tasks. In situation
when executives or board members are corrupted and female, the incapability of females to manage the
highly risky, illegal and unethical transactions amplifies the negative effect of corruption and it may direct
the firm even in a worse condition.
Hypothesis 3: Corrupt females in management (or among board members) have strong negative impact
on corporate performance.
3. Research Design
3.1 Data
We use Orbis data source to conduct this empirical analysis on the nexus between firm-level
corruption and performance. All the accounting, ownership, board, management and corruption data are
accumulated from Orbis database14 which is organized by Bureau Van Dijk (BVD), a major electronic
publisher of corporate information in the Europe. Our selection of European companies’ sample seems
very important and it may provide valuable insights to the ongoing debate on corruption and its
consequences on the development15.
The sample analyzed in the study consists of a cross-sectional data of 2,370 listed companies across
31 European countries. We considered just listed firms because Bureau Van Dijk can provide a full set of
information concerning corruption of these firms, while including unlisted we have to deal with too much
missing to deal with. The time horizon of the data belongs to the recent year of 2015 because data
concerning corruption was available just for that year and not before. We have omitted firms operating in
banking and insurance industries. Furthermore, we exclude observations that are outliers, winsorizing at
14 Orbis is a global database containing data over 86 million companies from Europe. Data covers financial and economic activity
information, corporate and ownership structure, and company information on politically exposed persons (PEPs), sanctions,
enforcement as well as other types of such data. 15 According to Nowak (2001), the fall of the Berlin wall (November 1989) is commonly credited with giving increase
prominence to corruption issues. Simultaneously, the right-wing residents (i.e. nationalists) also started to criticize corrupt
government in Western Europe as the latter are no longer required as anti-communist supporters (Bosco, 2016).

29 | P a g e
the first and last percentiles for accounting variables to avoid the distortions in the estimates. Finally,
observations from initial sample for which all the necessary accounting data are unavailable for the
analysis are removed. In the Appendix 1, we describe our sample characteristics.
3.2 Main variables
The variables utilized in the empirical analysis to study the effects of firm-specific corruption on
financial performance of firm, are defined in Table 1.
Table 1 - Variable definitions and data sources
Variables Description
Performance Measures
Market to Book Ratio (MtB) Ratio of market value of firm to book value of total assets, where market value of firm is the
difference between book value of total assets and capital plus market capitalization
Return on Assets (ROA) Ratio of net income to total assets
Other Measures of Performance
Return on Investment (ROI) Ratio of earnings before interest and tax to total assets
Corporate Fraud (Corruption) Variables
Percentage of Corrupt Board
Members
Percentage of corrupt board members with respect to total board members in the firm
Percentage of Politically Exposed
Board Members
Percentage of politically exposed board members with respect to total board members in the firm
Percentage of Corrupt Executives Percentage of corrupt executives with respect to total executives in the firm
Percentage of Politically Exposed
Executives
Percentage of politically exposed executives with respect to total executives in the firm
Percentage of Corrupt Senior
Executives
Percentage of corrupt senior executives with respect to total executives in the firm
Percentage of Politically Exposed
Senior Executives
Percentage of politically exposed senior executives with respect to total executives in the firm
Percentage of Corrupt CEO Percentage of corrupt CEO with respect to total CEO in the firm
Percentage of Politically Exposed
CEO
Percentage of politically exposed CEO with respect to total CEO in the firm
Percentage of Corrupt Female
Board Members
Percentage of corrupt female board members with respect to total board members in the firm
Percentage of Corrupt Female
Executives
Percentage of corrupt female executives with respect to total executives in the firm
Percentage of Corrupt Female CEO Percentage of corrupt female CEO with respect to total CEO in the firm
Control Variables: Firm Characteristics
Firm Age Natural logarithm of firm age where firm age has calculated from date of incorporation of firm
Firm Size Natural logarithm of total assets
Financial Leverage Ratio between financial debt and total assets, where financial debt comprises short-term financial
debt (i.e. to credit institutions, the part of long-term debt which is payable within a year, bonds, etc.)
while long-term financial debts (i.e. to credit institutions, (loans, credits), bonds with maturity more
than a year)
Sales Growth Percentage variation of net sales from previous period
Tangibility Ratio of tangible fixed assets to total assets
Ownership Percentage of direct and indirect ownership of the top one largest shareholder
R&D Intensity Ratio of research and development expenses to total assets
Control Variables: Governance Variables
Board Size Natural logarithm of total number of board of directors in the firm
Board Gender Diversity Percentage of female board member with respect to total board members

30 | P a g e
Control Variables: Board/Management Characteristics
Average Executives Age Average age of executives' age in the firm
Average Board Age Average age of board members' age in the firm
Control Variables: Macroeconomic Variable & Governance Variable
GDP growth Annual percentage growth rate of GDP
Control of Corruption It captures perceptions of the degree to which public power is used for personal gain, including both
petty and grand forms of corruption, as well as "capture" of the state by elites and private interests.
Legal Origin
Instrumental Variables
Industry Mean of Corrupt Board Average of corrupt board members with respect to total board members in specified industry
Industry Mean of Corrupt
Executives
Average of corrupt executives with respect to total executives in specified industry
Women Share in Parliament It is the number of seats occupied by females divided by total number of seats in lower chambers of
national parliament of country.
Note: The table reports the variables definitions. All of the above mentioned variables are the calculation of authors using Orbis electronic
database. The data on corruption are based on LexisNexis. The data for macro level variables and governance control variables have been
collected from World Bank’s website (source: World Bank national accounts data, Inter-Parliamentary Union, and OECD National
Accounts data files).
3.2.1 Performance measures
In empirical studies, financial performance of the firm has been measured in many ways by
implementing different methods; however, the most widely applied approach of financial analysis invokes
to profitability ratios as they are mainly considered as the parameters of financial performance and,
efficiency. For our regression analyses, we employ multiple proxies of financial performance of the firm.
In corporate finance literature, two kinds of performance have been suggested: 1) market-based measures
such as Market to Book Ratio, and Tobin’s Q have been provided; 2) accounting-based measures such as
Return on Assets (ROA), Return on Investment (ROI), Return on Sales (ROS), and Return on Equity
(ROE); Unlike the existing empirical studies on effects of corruption on firm performance, we use Market
to Book Ratio and Return on Assets (ROA) as the measures of market-oriented and accounting-oriented
financial performance of firm, respectively. The market to book value ratio is a financial ratio which is
defined as the market value to firm over book value of assets (Harford et al., 2008) and capture the long-
term performance of firm. This ratio indicates to the future growth and competitive advantage of the firm.
A higher value of Market to Book Ratio should reflect the expected future gains because of some expected
investment opportunities and/or competitive advantages. Conversely, a lower value of aforesaid ratio can
reflect poorer growth opportunities and market is over-pessimistic, indicating towards some fundamental
issues with the company. To evaluate the effects of corruption on performance in a short-run, we use

31 | P a g e
Return on Assets (ROA) which equals to net income divided by total assets in the given fiscal year. This
index, unlike Market to Book Ratio, relies on present earnings rather than future gains. The former ratio
represents the profits of the company in a particular period of time with respect to the value of its assets.
A higher value shows that the company is more effectively managing its assets to generate great amount
of net income and a positive value of Return on Assets (ROA) generally indicates upward profit trend. To
verify that the obtained regression results do not depend on the performance measures applied, we
perform some robustness tests using also Return on Investment (ROI) equals to earnings before interest
and tax divided by total assets and Industry Adjusted ROA.
3.2.2 Corruption variables
The most important and one of main variables of interest of study are the corruption measures at
firm-level. Before defining the proxies of corruption, it is essential to understand what is mean by
corruption in general terms. Despite of numerous efforts by economists, scholars and policy-developers,
corruption still is remained a very complex phenomenon, having multiple dimensions. In corruption
literature review by Jain (2001), he argues that it is very uncommon to agree on a very specific definition
of corruption, though there is consensus that corruption refers to the acts in which power of public office
is used for personal benefits in such way that contravenes the rules of the game. Later, he also mentions
that this common corruption definition does not include several illegal activities such as fraud, money
laundering, drug trades, and black-market operations due to the fact these practices do not involve the use
of public power (Jain, 2001). While, according to MacMillan Dictionary -corruption can be defined as-
dishonest, fraudulent or illegal behavior by officials or people in positions of power, especially when they
accept money in exchange for doing things for someone. The corruption definition provided by
International Country Risk Guide (ICRG), published by Political Risk Service Group, used in papers as
Faruq et al. (2013, pp. 119), corruption “is more concerned with actual or potential corruption in the form
of excessive patronage, nepotism, job reservations, ‘favors-for-favors’, secret party funds, and
suspiciously close ties between politics and business”. MacMillan dictionary and International Country

32 | P a g e
Risk Guide (ICRG) definition seem to cover a broad spectrum of social, legal, economic and
environmental dimensions of corrupt, dishonest, criminal, unethical or illegal activities. Especially, in a
firm perspective, this definition looks perfectly fit where people in positions of power can include the
managers and board of directors of firm. The managers and board of directors both are entitled to work
on behalf of firm owners (or shareholders) to maximize the shareholders’ wealth as they are being hired,
and assigned duties, responsibilities along with powers to perform their roles. Since corruption occurs
when position and power are in a place and human beings are in charge of the work. Hence, after
considering the MacMillan and ICRG definitions, we define corruption as follows: Corruption is a kind
of illegal, unethical and untruthful behaviour which abuses his/her authority, power and position to
nourish self-interest at the cost of other individuals because of personal interest, self-satisfaction,
competition, jealous, and aspiration of status gain.
To identify corruption, avoiding that the results on basis of a single proxy, we construct seven
proxies of firm-specific measures of corruption-level based on LexisNexis: (1) Percentage of Corrupt
Board Members, calculated as the percentage of corrupt board members with respect to total board
members in the firm, where corrupt or dishonest board members are those whose name is involved in any
sort of sanction, enforcement, or PEP list of world compliance; (2) Percentage of Corrupt Executives16 is
defined as percentage of corrupt executives with respect to total executives in the firm; (3) Percentage of
Corrupt Senior Executives17, calculated as percentage of corrupt senior executives with respect to total
executives in the firm; (4) Percentage of Corrupt CEO, calculated as ratio of corrupt CEOs with respect
to total CEOs; (5) Percentage of Corrupt Female Board Members is the percentage of corrupt female
board members with respect to total board members in the firm; and (6) Percentage of Corrupt Female
Executives is the percentage of corrupt female executives with respect to total executives in the firm.
16 These executives (or managers) involve all those persons who actively working in the firm on a daily basis, who deal with
current affairs on an executive’s point of view, but do not necessarily sit on the table of the board of directors. Manager, executive
officers, employees, representatives etc. are all part of active workforce of a company and therefore belong to management or
executives’ group. This executives’ group includes not only the top-level executives, who set corporate strategies, but also those
managers who execute these strategies titled as middle management, department managers and salaried supervisors. De facto,
the concern is in those who could be said to be in strategic positions. 17 These executives are all top-level executives such as CEOs, CFOs, and COO among others.

33 | P a g e
To get better understanding of firm level corruption consequences, we use alternative proxies of
corruption, focusing on specific form of corruption. In such way, the estimated effects of corrupt or
dishonest behaviour may be more evident, suggesting that the outcomes are not spurious. Following to
Li et al. (2008), we use corruption proxy based on political connections of the firm. In particular, we use
six alternative proxies which are as follows: (1) Percentage of Politically Exposed Board Members,
calculated as the sum of politically exposed board members divided by total board members in the firm;
(2) Percentage of Politically Exposed Executives, calculated as the sum of politically exposed executives
divided by total executives in the firm; (3) Percentage of Politically Exposed Senior Executives,
calculated as the sum of politically exposed senior executives divided by total executives in the firm.
3.2.3 Control variables
As regard to the performance model of firm, prior to the estimation of corruption effects on firm
performance, it is necessary to consider for the control variables in relation to studies on this relationship.
Following prior studies (e.g. Van Vu et al., 2016; Donadelli et al., 2014; Li et al., 2008; Sharma & Mitra,
2015), including firm performance literature, we use the control variables which may capture some effects
on financial performance of the firm. We control for firm’s characteristics, board features, and managerial
characteristics. The governance and managerial level characteristics play a significant role in determining
a firm performance, affecting firm’s policy formulation and decision-making. For example, in psychology
literature, it is argued that young managers are more enthusiastic and ambitious for their career
advancement than their older counterparts. Following the previous literature on corporate performance,
we also control Average Board Age, defined as sum of board members’ age divided by total number of
board members (Carter et al., 2010) and Average Executives Age, calculated as sum of executives’ age
divided by total number of executives. Board Size, calculated as natural logarithm of sum of board of
directors in the firm; as bigger-sized group of board members creates problems in coordination,
communication and lowers the board ability to control top management, thereby leading to agency issues
stemming from separation of management and control (Jensen, 1993). It is widely-known fact that

34 | P a g e
ineffective governance adversely affects profitability and value of firm. Board Gender Diversity is
calculated as the sum of female board members divided by total board members (Campbell & Mínguez-
Vera, 2008); as gender-diverse boards are characterized by the potential for greater participation of
directors in the decision-making (through attendance and committee assignments), more incentive
alignment, and tough monitoring (Adams & Ferreira, 2009). In this way, gender diverse board improves
governance and controlling mechanism inside firm, thereby increase the performance. We include Firm
Age is calculated as the natural logarithm of the numbers of years since the incorporation year of the firm
in the year of data collected (Glancey, 1998); as the older companies are more experienced, and have
advantage of dynamic economies of scale by learning as well as can get cheap borrowing by reputations
effects; moreover, matured firm are not vulnerable to the liabilities of newness, in that way improves the
firm performance. Firm Size, is calculated in terms of the natural logarithm of total assets (Pervan &
Višić, 2012), which is a superior proxy of size in comparison to sales or employment concept of size (Hall
& Weiss, 1967); larger firms have higher market power which allows it to charge higher prices and earn
more profits. In addition, unlike smaller firms, larger-sized firms do not have to face financial constraints
and can get easy access to external finance, leading to attract and tap better growth opportunities.
Financial Leverage is calculated as total financial debt divided by total assets (Singh & Faircloth, 2005);
high-levered firms are financially more vulnerable18 and experience the underinvestment problem (Myers,
1977) since they cannot raise equity to finance profitable investment opportunities because a large portion
of funds goes to bondholders and a stochastic investment opportunities set introduces agency costs of
debt that negatively affect firm value (Stulz, 1990). Sales Growth is measured by the percentage change
in net sales from previous period. Tangibility is calculated as the ratio of tangible fixed assets over total
assets (Frank & Goyal, 2003); as firm with high level of investment in tangible assets enjoys lowers costs
of financial distress (Akintoye, 2008), and issues debt more often (Mackie‐Mason, 1990), thereby
improving firm performance. Ownership, calculated as the percentage of direct and indirect ownership of
18 Financial leverage plays a disciplinary role to control managers by limiting free cash flow at hand as well as it may also
increase the financial distress and bankruptcy.

35 | P a g e
the top largest shareholder; as highly concentrated ownership causes the conflicts of interest between the
majority and minority shareholders (La Porta et al., 1999). In addition, the largest shareholder tends to
have high voting rights, more likely get almost full control over the firm and are wealthy enough to use
firms to extract private benefits that are not shared by minority shareholders and may reduce managerial
incentives, leading to outweigh the benefits of ownership concentration and reduces the performance.
R&D Intensity is calculated as the research and development expenses divided by total assets; as higher
research and development investment increases the operating costs in presence of high degree of
uncertainty associated with rapidly changing technologies and decreases operating income (Hsu et al.,
2013), thereby R&D Intensity affect the firm performance negatively. Finally, we also use the industry
and country specific effects as control factors (GDP growth, Control of Corruption and legal Origin) in
all the models.
3.3 Methodology
This study is conducted to analyse the effects of firm-level corruption on the financial
performance of the firm using a basic model.
Firm Performance = f (Corruption, Control Variables)
Although the goal of the paper assumes corruption to affect firm performance, there are potential
endogeneity issues to deal with. The endogeneity problem is a prevelant impediment in the empirical
examination of the relationship between corruption and financial performance of firm (Fisman &
Svensson, 2007) since corruption is considered as an endogenous variable. For instance, the likelihood of
firm involvement in corruption might be influenced by some unobservable factors that can be correlated
with the error-term. Moreover, it could be possible that in better performing firms, more cash can be used
for illegal activities or low performing firms may put more efforts to get the work done by illegal or
dishonest ways to turnaround the business. In such situation, the direction of causal relationship will
change than we expect. To solve this issue of endogeneity and possible reverse-causality, two-stage least

36 | P a g e
squares (2SLS) regression has been implemented as an econometric tool of estimation. We estimate the
following 2SLS regression models:
Model-1:
First stage:
𝐵𝑜𝑎𝑟𝑑 𝐶𝑜𝑟𝑟𝑢𝑝𝑡𝑖𝑜𝑛𝑖,𝑡 = 𝛼0 + 𝛼1 𝐼𝑛𝑑𝑢𝑠𝑡𝑟𝑦 𝑀𝑒𝑎𝑛 𝑜𝑓 𝐶𝑜𝑟𝑟𝑢𝑝𝑡 𝐵𝑜𝑎𝑟𝑑 𝑀𝑒𝑚𝑏𝑒𝑟𝑠 𝑗,𝑡 + 𝜃𝑋𝑖,𝑡 +
𝜏𝑗+𝛾𝑘+𝜇𝑖,𝑡
Second stage:
𝐹𝑖𝑟𝑚 𝑃𝑒𝑟𝑓𝑜𝑟𝑚𝑎𝑛𝑐𝑒𝑖,𝑡 = 𝛽0 + 𝛽1𝐼𝑛𝑠𝑡𝑟𝑢𝑚𝑒𝑛𝑡𝑒𝑑 𝐵𝑜𝑎𝑟𝑑 𝐶𝑜𝑟𝑟𝑢𝑝𝑡𝑖𝑜𝑛𝑖,𝑡 + Ø𝑋𝑖,𝑡 + 𝜏𝑗 + 𝛾𝑘 + ℰ𝑖,𝑡
Model-2:
First stage:
𝑀𝑎𝑛𝑎𝑔𝑒𝑚𝑒𝑛𝑡 𝐶𝑜𝑟𝑟𝑢𝑝𝑡𝑖𝑜𝑛𝑖,𝑡 = 𝛼0 + 𝛼1 𝐼𝑛𝑑𝑢𝑠𝑡𝑟𝑦 𝑀𝑒𝑎𝑛 𝑜𝑓 𝐶𝑜𝑟𝑟𝑢𝑝𝑡 𝐸𝑥𝑒𝑐𝑢𝑡𝑖𝑣𝑒𝑠 𝑗,𝑡 + 𝜃𝑋𝑖,𝑡 +
𝜏𝑗+𝛾𝑘+𝜇𝑖,𝑡
Second stage:
𝐹𝑖𝑟𝑚 𝑃𝑒𝑟𝑓𝑜𝑟𝑚𝑎𝑛𝑐𝑒𝑖,𝑡 = 𝛽0 + 𝛽1𝐼𝑛𝑠𝑡𝑟𝑢𝑚𝑒𝑛𝑡𝑒𝑑 𝑀𝑎𝑛𝑎𝑔𝑒𝑚𝑒𝑛𝑡 𝐶𝑜𝑟𝑟𝑢𝑝𝑡𝑖𝑜𝑛𝑖,𝑡 + Ø𝑋𝑖,𝑡 + 𝜏𝑗 + 𝛾𝑘 +
ℰ𝑖,𝑡
In above given models (1-2), firms are represented by i, industry by j, country by k and time by
t, where t time reprents to the year 2015. 𝐹𝑖𝑟𝑚 𝑃𝑒𝑟𝑓𝑜𝑟𝑚𝑎𝑛𝑐𝑒𝑖,𝑡 is the financial performance of the firm
i in given year t. 𝐹𝑖𝑟𝑚 𝐶𝑜𝑟𝑟𝑢𝑝𝑡𝑖𝑜𝑛𝑖,𝑡 can be any the following proxies of firm i in the given t year:
𝐵𝑜𝑎𝑟𝑑 𝐶𝑜𝑟𝑟𝑢𝑝𝑡𝑖𝑜𝑛𝑖,𝑡 can be any of the following: Percentage of Corrupt Board Members, Percentage
of Politically Exposed Board Members, and Percentage of Corrupt Female Board Members.
𝑀𝑎𝑛𝑎𝑔𝑒𝑚𝑒𝑛𝑡 𝐶𝑜𝑟𝑟𝑢𝑝𝑡𝑖𝑜𝑛𝑖,𝑡 can be any the following proxies of firm i in the given t year: Percentage
of Corrupt Executives, Percentage of Corrupt Senior Executives, Percentage of Corrupt CEO,
Percentage of Corrupt Female Executives, Percentage of Politically Exposed Executives, Percentage of
Politically Exposed Senior Executives. 𝐼𝑛𝑠𝑡𝑟𝑢𝑚𝑒𝑛𝑡𝑒𝑑 𝐶𝑜𝑟𝑟𝑢𝑝𝑡𝑖𝑜𝑛𝑖,𝑡 is the fitted value of corruption
indicator from first stage regression for each firm in the given year. 𝑋𝑖,𝑡 is the vector of control variables
for each firm in the year of 2015, namely Average Board Age, Average Executives Age, Board Size, Firm

37 | P a g e
Size, Firm Age, Financial Leverage, Sales Growth, Tangibility, Ownership, and R&D Intensity. 𝜏𝑗 and
𝛾𝑘 control for the industry and country specific effects19, respectively i.e. it captures the different
unobservable characteristics those could affect the firms across sample. 𝜇𝑖,𝑡 is the error-term of the first-
stage regression, whereas ℰ𝑖,𝑡 is the error-term of the second-stage regression.
We use two instrumental variables to deal with the problem of endogeneity and measurement error
with corruption measures. However, it is very difficult to find fully excludable instrumental variables.
The implementation of instruments requires valid and strong instruments that fulfil the following two
conditions: 1) Instrument should be correlated with the endogenous variable; 2) Instrument should be
unrelated with the error term. Consistent with Fisman & Svensson (2007), who use industry location
averages of bribe and tax as instrumental variable for corruption measures, we employ Industry Mean of
Corrupt Board Members and Industry Mean of Corrupt Executives as instrumental variables. We assume
that the probability of a firm to be involved in corruption is more likely to be influenced by industry-level
corruption. In some industries, it is customary to look for favour by “friends” offering bribes or
reciprocate favours in legal form, and for companies, it becomes important to be part of these groups of
“friends” to sustain their competitive advantages and to be able to face competition even better than using
new strategies or firm’s resources. If this is a case in an industry, where the way of dealing with business
problems is related to illegal even more than opportunistic behaviours, it means that large majority of
firms would tend to adopt this prevalent style. As firm’s opinion and behaviour towards corrupt or
dishonest actions are more likely to be guided by conduct and experiences of competitors, operating in
the same industry. For example, the case of automotive industry scandals by Volkswagen and Fiat
Chrysler (described in second part of the paper), where the companies are being found to be influenced
by the corrupt approach of their competitors in the same industry. In a similar way, the industry-level
corrupt or dishonest conduct of board members and executives may encourage other board members and
executives as well as work as promoter of the corrupt practices in the form of an important factor to get
19
We control only for industry fixed effects as we can’t use firm fixed effects due to cross-sectional nature of data.

38 | P a g e
personal benefits, competitive advantage, and survival in that industry. In such environment, the
possibility of firm corruption improves since industry atmosphere either forces or rewards to corrupt
behaviour. Therefore, we expect that Industry Mean of Corrupt Board Members and Industry Mean of
Corrupt Executives are positively correlated with the board-level corruption, instrumented by Industry
Mean of Corrupt Board Members and management-level corruption that is instrumented by Industry
Mean of Corrupt Executives. In line with Gamberoni et al. (2016), we use Women Share in Parliament,
a country level as the second instrumental variable in the subset of instrumental variables for board and
management level corruption. It has been suggested that women involvement in the politics is more likely
to undermine the level of corruption, relying on the reasoning that females are risk averse and more fearful
of punishments in the situation of detection. We therefore assume that women participation in the
parliament is going to influence the incidence of corruption by effective governance and control. In case
of all three instruments, there are no theoretical arguments to believe that these variables can directly
influence the financial performance of the individual firm, however the propositions of relevance of
instruments must be tested.
4. Descriptive Statistics
Table 3 presents the descriptive statistics for all the variables used in the models.
Table 3 - Descriptive Statistics
Variables Mean Median SD Min Quartile 1 Quartile 3 Max
Market to Book
Ratio (MtB)
0.866 0.958 0.284 -2.803 0.860 0.989 2.492
Return on Assets
(ROA)
-0.013 0.029 0.207 -1.579 -0.018 0.066 0.346
Percentage of
Corrupt Board
Members
0.162 0.125 0.198 0.000 0.000 0.250 1.000
Percentage of
Corrupt Executives
0.118 0.059 0.165 0.000 0.000 0.190 1.000
Percentage of
Politically Exposed
Board Members
0.111 0.041 0.167 0.000 0.000 0.167 1.000
Percentage of
Politically Exposed
Executives
0.139 0.000 0.709 0.000 0.000 0.143 25.000
Percentage of
Corrupt Female
Board Members
0.029 0.000 0.065 0.000 0.000 0.000 0.667

39 | P a g e
Percentage of
Corrupt Female
Executives
0.015 0.000 0.047 0.000 0.000 0.000 0.500
Percentage of
Corrupt male Board
Members
0.133 0.091 0.178 0.000 0.000 0.200 1.000
Percentage of
Corrupt male
Executives
0.104 0.000 0.151 0.000 0.000 0.167 1.000
Percentage of
Corrupt CEO
0.139 0.000 0.328 0.000 0.000 0.000 1.000
Percentage of
Politically Exposed
CEO
0.094 0.000 0.277 0.000 0.000 0.000 1.000
Average Board Age 56.515 56.667 5.883 26.000 53.214 60.000 81.000
Average Executives
Age
53.873 54.000 6.013 26.000 50.500 57.250 88.000
Board Size 8.477 8.000 4.455 1.000 6.000 11.000 35.000
Board Gender
Diversity
0.168 0.167 0.148 0.000 0.000 0.263 1.000
Firm Age (in years) 43.800 26.000 45.182 0.000 16.000 57.000 496.000
Firm Size (in
million €)
4189.264 235.061 18787.691 0.276 48.032 1444.600 381935.094
Financial Leverage 0.209 0.182 0.178 0.000 0.052 0.322 0.630
Sales Growth 0.142 0.066 0.644 -1.000 -0.038 0.175 5.901
Tangibility 0.250 0.179 0.238 0.000 0.050 0.382 0.869
Ownership 0.308 0.251 0.241 0.001 0.110 0.495 0.928
R&D Intensity 0.016 0.000 0.043 0.000 0.000 0.005 0.261
GDP Growth Rate 1.891 1.991 1.672 -9.900 1.156 2.329 7.811
Control of
Corruption
1.351 1.867 0.891 -0.980 0.580 1.867 2.284
Industry Mean of
Corrupt Board
1.536 1.214 0.861 0.000 0.958 1.783 5.333
Industry Mean of
Corrupt Executives
1.387 1.200 0.858 0.000 0.804 1.574 4.818
Women Share in
Parliament
29.853 29.400 8.186 10.100 26.200 36.500 43.600
The Market to Book Ratio (MtB) is on average 0.866 and Return on Assets (ROA) is on
average -0.013. The average percentage of corrupt board members in a firm is around 16.2%, while
average percentage of politically exposed board members is 11.1%. The average percentage of corrupt
executives in a firm is around 11.8%, whereas average percentage of politically exposed executives in a
firm is around 13.9%. The average percentage of corrupt female board members in a firm is around
2.90%, whereas average percentage of corrupt female executives in a firm is around 1.50%.
In Table 4 the correlation matrix is represented for the variables defined above.

40 | P a g e
Table 4 – Correlations Matrix
No Variables 1 2 3 4 5 6 7 8 9 10 11 12 13 14 15 16 17 18 19 20 21
1 MtB 1
2 ROA 0.282 1
3 % Corrupt
Board Members 0.008 0.051 1
4 % Corrupt
Executives -0.03 0.011 0.617 1
5
% Politically
Exposed Board
Members
0.033 0.052 0.846 0.505 1
6
% Politically
Exposed
Executives
-0.01 0.028 0.282 0.321 0.235 1
7
% Corrupt
Female Board
Members
0.067 0.097 0.448 0.194 0.448 0.038 1
8
% Corrupt
Female
Executives
0.023 0.049 0.283 0.427 0.261 0.139 0.399 1
9 Average Board
Age 0.013 0.029 0.088 0.025 0.061 0.052 0.048 -0.01 1
10 Average
Executives Age -0.06 0.019 -0.02 0.043 -0.06 0.006 -0.06 -0 0.555 1
11 Board Size 0.167 0.09 0.194 0.138 0.185 -0.08 0.239 0.105 0.152 0.092 1
12 Board Gender
Diversity 0.113 0.138 0.023 -0.07 0.049 -0.08 0.381 0.099 -0.04 -0.05 0.248 1
13 Firm Age 0.06 0.129 0.087 0.041 0.095 0.033 0.079 0.012 0.128 0.077 0.127 0.08 1 14 Firm Size 0.076 0.042 0.241 0.164 0.222 0.132 0.168 0.088 0.1 0.063 0.29 0.059 0.105 1
15 Financial
Leverage -0.02 -0.11 0.042 0.012 0.049 -0.02 0.036 0.006 0.032 -0.01 0.156 0.004 0.028 0.08 1
16 Sales Growth 0.009 -0.03 -0.09 -0.05 -0.07 -0.02 -0.03 -0.03 -0.03 -0.02 -0.00 -0.02 -0.08 -0.04 -0.11 1 17 Tangibility -0.04 0.053 0.134 0.111 0.128 0.059 0.023 0.055 -0.02 0.03 -0.00 -0.08 0.102 0.06 0.291 -0.11 1 18 Ownership -0.03 0.061 -0.01 -0.03 0.003 -0.01 -0.01 -0 -0.05 -0.06 -0.11 0.032 0.07 -0.03 0.037 -0.04 0.14 1 19 R&D Intensity -0.02 -0.19 -0.03 -0.02 -0.02 0.018 -0.04 -0.03 0.062 0.028 -0.00 -0.04 -0.08 -0.02 -0.14 0.069 -0.21 -0.1 1
20 GDP Growth
Rate 0.011 -0.00 -0.05 0.066 -0.10 0.028 0.022 0.07 -0.04 -0.05 -0.04 0.039 -0.06 -0.03 -0.13 0.064 -0.11 -0.15 0.02 1
21 Control of
Corruption 0.113 -0.04 -0.04 -0.02 -0.01 -0.04 0.104 -0.02 0.055 -0.00 0.10 0.095 0.019 0.007 -0.14 0.105 -0.28 -0.32 0.18 0.33 1

41 | P a g e
No Country Firms
Percentage
of corrupt
board
members
Percentage
of corrupt
executives
Percentage
of corrupt
female
board
members
Percentage
of corrupt
female
executives
Percentage
of corrupt
board
members
Percentage
of corrupt
executives
Percentage
of corrupt
CEOs
Percentage
of
Politically
Exposed
CEOs
1 Belgium 45 0.21 0.14 0.04 0.01 0.16 0.08 0.17 0.15
2 Bulgaria 33 0 .14 0.14 0.01 0.06 0.09 0.05 0.05 0.05
3 Cyprus 17 0.10 0.12 0.02 0 0.05 0.1 0.12 0.12
4 Czech Republic 4 0.31 0.22 0.04 0.03 0.21 0.25 0.25 0.25
5 Denmark 59 0.14 0.09 0.02 0 0.1 0.05 0.10 0.08
6 Estonia 7 0.27 0 0.05 0 0.15 0 0.00 0.00
7 Finland 98 0.23 0.06 0.08 0.02 0.17 0.09 0.11 0.09
8 France 362 0.12 0.07 0.03 0.01 0.09 0.06 0.11 0.08
9 Germany 33 0.15 0.13 0 0 0.14 0.79 0.18 0.17
10 Greece 130 0.07 0.06 0.01 0.01 0.04 0.05 0.09 0.06
11 Hungary 4 0.41 0.2 0.03 0.04 0.36 1.86 0.25 0.25
12 Iceland 11 0.12 0.09 0.01 0 0.09 0 0.09 0.00
13 Ireland 33 0.26 0.25 0.04 0.04 0.13 0.22 0.16 0.11
14 Italy 134 0.16 0.05 0.03 0 0.11 0.09 0.13 0.09
15 Lithuania 7 0.40 0.31 0.02 0.07 0.32 0.4 0.29 0.29
16 Luxembourg 11 0.21 0.16 0.02 0.02 0.12 0.14 0.12 0.10
17 Malta 4 0.19 0.25 0.04 0 0.08 0 0.25 0.00
18 Netherlands 26 0.24 0.2 0.02 0.01 0.18 1.41 0.27 0.16
19 Norway 83 0.15 0.1 0.06 0.02 0.13 0.08 0.16 0.12
20 Poland 47 0.08 0.11 0 0 0.07 0.16 0.09 0.09
21 Portugal 24 0.21 0.13 0.03 0.01 0.15 0.1 0.26 0.21

42 | P a g e
The correlation matrix reports that the correlation coefficients were inconsistently positive
between corruption variables and firm performance, directing towards further analysis because this
inconsistency may indicate to the omitted variables biasness that are affecting financial performance of
the firm. With respect to the multicollinearity problem, the magnitude of correlation among explanatory
variables is not very high, indicating that multicollinearity is unlikely to bias coefficients of estimation.
Moreover, we also execute VIF test (not reported for briefness) and find that our analysis is not
threatened by this type of problem.
5. Results
In this section of the paper, we present the results of the regression analysis. Particularly, the
empirical analysis on the effects of corruption is divided into three subparts: 1) concerning the impact
of firm individual units (i.e. board of directors and executives) corruption on financial performance of
the firm, 2) concerning the impact of PEP-connections on financial performance of the firm and 3)
analysis of effects of firm-level gender-based corruption on corporate performance.
5.1 Main empirical analysis
5.1.1 Corruption and financial performance
In this section, we present the preliminary findings of the regression analysis by applying the
two-stage least squares (2SLS) model. In case of all regressions’ outcomes of 2SLS model, we reported
the second-stage regressions, however the first one is available on request. The independent variables
Percentage of Corrupt Board Members, Percentage of Corrupt Executives, Percentage of Corrupt
Senior Executives, and Percentage of Corrupt CEO alternatively used, are the fitted values of corruption
(i.e. firm-level corruption) indicator from the first-stage of regression.
Table 5 - Main regression results for the impact of firm-specific corruption on firm value
The table presents results of 2SLS regression for the sample of 2,370 firms. The dependent variables are: (1) Return on Assets (ROA) and (2)
Market to Book Ratio (MtB). The independent variables (i.e. main variable of interest) are: (1) Percentage of Corrupt Board Members, a percentage of corrupt board members with respect to total board members in the firm; (2) Percentage of Corrupt Executives, a percentage of
corrupt executives with respect to total executives in the firm; (3) Percentage of Corrupt Senior Executives, a percentage of corrupt senior
executives with respect to total executives in the firm and, (4) Percentage of Corrupt CEO, a percentage of corrupt CEOs with respect to total CEOs in the firm. Table 2 provides the definitions of all the variables. At the end, the following statistics are being reported: Hansen J Statistic
is the test of over-identification restrictions and Kleibergen-Paap Wald rk F statistic is the test of weakness of instruments. Robust p-value, based
on robust standard errors, are reported in parentheses. ***: denotes significance at the 1% level; **: denotes significance at the 5% level; *: denotes significance at the 10% level.

43 | P a g e
(1) (2) (3) (4) (5) (6) (7) (8)
Dependent Variables
Explanatory Variables ROA ROA ROA ROA MtB MtB MtB MtB
2SLS 2SLS 2SLS 2SLS 2SLS 2SLS 2SLS 2SLS
Percentage of Corrupt Board
Members
-0.382*** -0.597**
(0.002) (0.012)
Percentage of Corrupt Executives -0.699*** -0.902*** (0.003) (0.009)
Percentage of Corrupt Senior
Executives
-0.554*** -0.768***
(0.004) (0.009)
Percentage of Corrupt CEO -0.783** -1.010**
(0.038) (0.049)
Average Board Age 0.000 -0.001
(0.790) (0.284)
Average Executives Age 0.001 0.001 0.001 -0.004** -0.004** -0.003*
(0.476) (0.475) (0.536) (0.016) (0.017) (0.051)
Board Size -0.006*** -0.005*** -0.005*** -0.005** -0.004** -0.002 -0.002 -0.001
(0.000) (0.000) (0.000) (0.022) (0.016) (0.362) (0.231) (0.637)
Board Gender Diversity 0.102*** 0.063* 0.086*** 0.104** 0.060 0.011 0.039 0.064 (0.000) (0.051) (0.004) (0.017) (0.184) (0.824) (0.417) (0.325)
Firm Age 0.018*** 0.017*** 0.016*** 0.011 -0.013** -0.011* -0.013** -0.020*
(0.000) (0.001) (0.004) (0.199) (0.028) (0.072) (0.045) (0.059)
Firm Size 0.048*** 0.046*** 0.044*** 0.056*** 0.064*** 0.058*** 0.057*** 0.071***
(0.000) (0.000) (0.000) (0.000) (0.000) (0.000) (0.000) (0.000)
Financial Leverage -0.304*** -0.297*** -0.283*** -0.277*** -0.201*** -0.188*** -0.171*** -0.161**
(0.000) (0.000) (0.000) (0.000) (0.001) (0.002) (0.004) (0.019)
Sales Growth -0.005 -0.005 -0.003 -0.006 -0.004 -0.002 -0.000 -0.003
(0.734) (0.738) (0.823) (0.724) (0.752) (0.871) (0.979) (0.837)
Tangibility 0.081*** 0.094*** 0.093*** 0.080** 0.019 0.035 0.037 0.018
(0.000) (0.000) (0.000) (0.017) (0.542) (0.324) (0.312) (0.680)
Ownership 0.014 0.023 0.011 0.007 -0.009 0.002 -0.015 -0.019
(0.440) (0.249) (0.602) (0.814) (0.780) (0.946) (0.660) (0.648)
R&D Intensity -0.687*** -0.690*** -0.725*** -0.687*** -0.016 -0.033 -0.076 -0.029
(0.000) (0.000) (0.000) (0.001) (0.931) (0.860) (0.686) (0.911)
Country Specific Controls Yes Yes Yes Yes Yes Yes Yes Yes
Industry FE Yes Yes Yes Yes Yes Yes Yes Yes
Hansen J Statistic 1.974 1.355 3.563 0.562 0.011 0.006 0.343 0.002
(P-value) 0.160 0.244 0.059 0.453 0.917 0.941 0.558 0.962
Kleibergen-Paap Wald rk F statistic
24.780 12.237 13.323 3.230 24.780 12.237 13.323 3.230
Observation 2370 2370 2370 2370 2370 2370 2370 2370
As mentioned before that for an instrumental variable to be valid, it must satisfy both exogeneity
and identification assumptions, that is, it must not be associated with the residual term and
simultaneously, it should explain the variation in the endogenous variables (board corruption and
management corruption). If we believe that our instrumental variables are valid, we would summarize
that 2SLS outcomes are reliable because both unobserved heterogeneity and endogeneity have been
controlled in this technique. The F-tests of instruments of the first stage regression of models 1, 2, 3, 4,
44 | P a g e
5, 6, 7, and 8 indicate that the instruments Industry Mean of Corrupt Board Members and Women Share
in Parliament are always statistically significant to estimate the board-level corruption and Industry
Mean of Corrupt Executives and, Women Share in Parliament are always statistically significant to
estimate the management-level corruption. In addition, the economic impact of each instrumental
variable about corruption-level in board and management is also satisfactory. Subsequently, the
instrumental variables pass the relevance criterion. In addition, there is no justification to rely on the
fact why Industry Mean of Corrupt Board Members, Industry Mean of Corrupt Executives and Women
Share in Parliament should directly influence the firm performance. In fact, we generally find a
statistically not-significant Hansen-J statistic, which identifies their (instruments) joint validity. In this
way, the instruments reasonably satisfy the exclusion criterion.
In Table 5, we apply 2SLS method for correcting the issues of endogenous measures of
corruption. In columns 1-4, the second stage regressions’ results of corruption impact on Return on
Assets (ROA) report that the coefficients of fitted value of Percentage of Corrupt Board Members,
Percentage of Corrupt Executives, Percentage of Corrupt Senior Executives and Percentage of Corrupt
CEO, alternatively used are negative and on average, statistically significant at least at 1% level.
Similarly, in columns 5-8, the second stage regressions’ results of corruption impact on Market to Book
Ratio (MtB) show that the coefficients of fitted value of Percentage of Corrupt Board Members,
Percentage of Corrupt Executives, Percentage of Corrupt Senior Executives, and Percentage of
Corrupt CEO alternatively used are negative and on average, statistically significant at least at 1% level.
It implies that firm-specific corruption seems to have a negative impact on both its short-term and long-
term financial performance. Consequently, the Hypothesis 1 seems to be confirmed, inferring that
internal corrupt environment of firm increases the self-interest seeking of its actors (i.e. board members
and executives), the problem of insufficient information, opportunistic behaviour, and poor governance
thereby raising the agency conflicts among stakeholders of firm and reducing the performance. It
implies that corruption of board and management level play a vital role in determining firm performance
by improving the propensity of executives’ opportunism and ineffective governance.

45 | P a g e
5.1.2 Political Exposed Persons in management or among board members and financial performance
Although, the political powers of firm are most often considered as an important source to get
favours and special treatments by governments (also politicians) to improve the firm profitability, it
also generates the costs for the firm as a well said quote- “Nothing is free in this world by money or
time”. For example, political connections also generate costs to firm, in terms of financial and/or non-
financial resources of firm are devoted to keep going these connections through providing gifts, and
support to the political parties. Moreover, the politically connected individuals also extract heavy rents
from firms. In this part, we present the findings of the regression analysis by applying the two-stage
least squares (2SLS) model. In case of all regressions’ outcome of 2SLS model, we reported the second-
stage regressions, however the first one is provided on request. The main independent variables,
Percentage of Politically Exposed Board Members, Percentage of Politically Exposed Executives,
Percentage of Politically Exposed Senior Executives, and Percentage of Corrupt CEO alternatively
used, are the fitted values of specific form of corruption (i.e. firm-level corruption) indicator from the
first-stage of regression.
Table 6- Regression results for the impact of specific dimension of corruption on firm value
The table presents results of 2SLS regressions for the sample of 2,370 firms. The dependent variable are: (1) Return on Assets (ROA) and (2) Market
to Book Ratio (MtB).The independent variables (i.e. main variable of interest) are: (1) Percentage of Politically Exposed Board Members; (2)
Percentage of Politically Exposed Executives; (3) Percentage of Politically Exposed Senior Executives; and (4) Percentage of Politically Exposed CEO. Table 2 provides the definitions of all the variables. At the end, the following statistics are being reported: Hansen J Statistic is the test of over-
identification restrictions and Kleibergen-Paap Wald rk F statistic is the test of weakness of instruments. Robust p-value, based on robust standard
errors, are reported in parentheses. ***: denotes significance at the 1% level; **: denotes significance at the 5% level; *: denotes significance at the 10% level.
(1) (2) (3) (4) (5) (6) (7) (8)
Dependent Variables
Explanatory Variables ROA ROA ROA ROA MtB MtB MtB MtB
2SLS 2SLS 2SLS 2SLS 2SLS 2SLS 2SLS 2SLS
Percentage of Politically Exposed Board Members
-0.503*** -0.776**
(0.002) (0.015)
Percentage of Politically Exposed
Executives
-0.195** -0.264*
(0.031) (0.052)
Percentage of Senior Executives
Politically Exposed
-0.747*** -1.037**
(0.008) (0.018) Percentage of Politically Exposed
CEO
-0.745** -0.994**
(0.025) (0.044)
Average Board Age -0.000 -0.002 (0.928) (0.176)
Average Executives Age 0.000 -0.000 -0.000 -0.004** -0.005*** -0.004**
(0.500) (0.778) (0.865) (0.013) (0.006) (0.011) Board Size -0.006*** -0.013*** -0.006*** -0.006*** -0.004** -0.013** -0.003 -0.003
(0.000) (0.000) (0.000) (0.001) (0.019) (0.014) (0.112) (0.233)

46 | P a g e
Board Gender Diversity 0.113*** 0.048 0.102*** 0.123*** 0.076 -0.012 0.062 0.090
(0.000) (0.215) (0.002) (0.002) (0.108) (0.839) (0.219) (0.141) Firm Age 0.018*** 0.017*** 0.016*** 0.014* -0.012* -0.013* -0.013* -0.016*
(0.000) (0.002) (0.006) (0.052) (0.058) (0.063) (0.071) (0.070)
Firm Size 0.048*** 0.054*** 0.045*** 0.052*** 0.064*** 0.069*** 0.058*** 0.067*** (0.000) (0.000) (0.000) (0.000) (0.000) (0.000) (0.000) (0.000)
Financial Leverage -0.301*** -0.317*** -0.281*** -0.286*** -0.195*** -0.216*** -0.168*** -0.175**
(0.000) (0.000) (0.000) (0.000) (0.002) (0.002) (0.009) (0.012)
Sales Growth -0.004 0.002 -0.001 0.002 -0.002 0.007 0.003 0.008 (0.783) (0.891) (0.964) (0.881) (0.855) (0.518) (0.773) (0.592)
Tangibility 0.082*** 0.085*** 0.109*** 0.099*** 0.021 0.026 0.060 0.044
(0.000) (0.000) (0.000) (0.004) (0.505) (0.455) (0.197) (0.354) Ownership 0.016 -0.001 0.018 0.018 -0.006 -0.030 -0.004 -0.005
(0.385) (0.944) (0.407) (0.476) (0.855) (0.326) (0.901) (0.903)
R&D Intensity -0.685*** -0.581** -0.727*** -0.620*** -0.013 0.117 -0.080 0.063
(0.000) (0.010) (0.000) (0.004) (0.944) (0.641) (0.679) (0.804)
Country Specific Controls Yes Yes Yes Yes Yes Yes Yes Yes
Industry FE Yes Yes Yes Yes Yes Yes Yes Yes
Hansen J Statistic 1.496 3.377 3.266 1.376 0.001 0.120 0.276 0.038
(P-value) 0.221 0.066 0.071 0.241 0.970 0.729 0.599 0.845
Kleibergen-Paap Wald rk F statistic 19.235 4.174 9.625 4.460 19.235 4.174 9.625 4.460
Observation 2370 2370 2370 2370 2370 2370 2370 2370
The results of first-stage regressions (not tabulated) show that instruments continue to be
significantly correlated with given corruption proxies. The F-test value reports that the instrumental
model estimates PEP-based corruption at board and management level. Therefore, these instruments
are not too weak to be valid and can satisfy the criterion of relevance. More importantly, these
instruments also plausibly satisfy again the exclusion restriction. Under the assumption of instruments
joint validity i.e. overidentification conditions of instruments was also tested.
In Table 6, we apply 2SLS method for correcting the issues of endogenous measures of
corruption. In columns 1-4, the second stage regressions’ results of corruption impact on Return on
Assets (ROA) report that the coefficients of fitted value of Firm Politically Exposed Dummy, Percentage
of Politically Exposed Board Members, Percentage of Politically Exposed Executives, Percentage of
Corrupt Senior Executives and Percentage of Corrupt CEO, alternatively used are negative and on
average, statistically significant at least at 5% level. Similarly, in columns 5-8, the second stage
regressions’ results of corruption impact on Market to Book Ratio (MtB) show that the coefficients of
fitted value of Percentage of Politically Exposed Board Members, Percentage of Politically Exposed
Executives, Percentage of Corrupt Senior Executives, and Percentage of Corrupt CEO alternatively
used are negative and on average, statistically significant at least at 5% level. It implies that PEP specific
executive or board members’ corruption seems to have a negative effect on both its long-term and short-
term financial performance. Consequently, the Hypothesis 2 seems to be confirmed, inferring that the
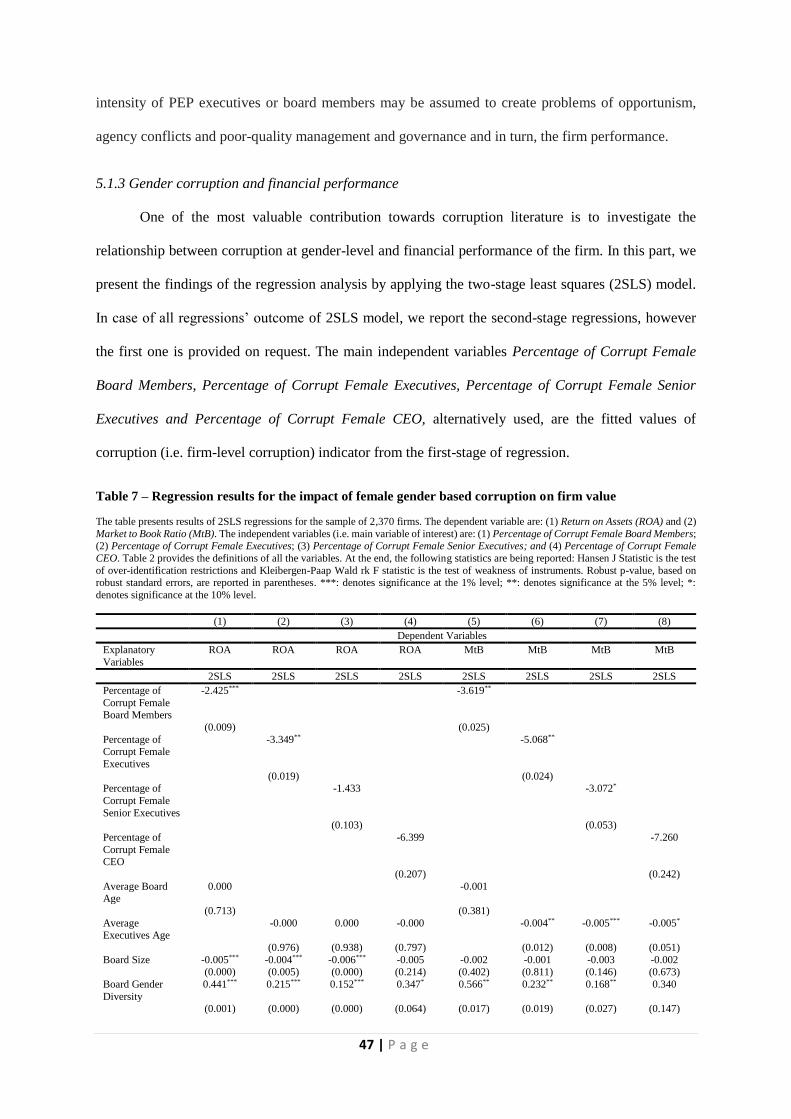
47 | P a g e
intensity of PEP executives or board members may be assumed to create problems of opportunism,
agency conflicts and poor-quality management and governance and in turn, the firm performance.
5.1.3 Gender corruption and financial performance
One of the most valuable contribution towards corruption literature is to investigate the
relationship between corruption at gender-level and financial performance of the firm. In this part, we
present the findings of the regression analysis by applying the two-stage least squares (2SLS) model.
In case of all regressions’ outcome of 2SLS model, we report the second-stage regressions, however
the first one is provided on request. The main independent variables Percentage of Corrupt Female
Board Members, Percentage of Corrupt Female Executives, Percentage of Corrupt Female Senior
Executives and Percentage of Corrupt Female CEO, alternatively used, are the fitted values of
corruption (i.e. firm-level corruption) indicator from the first-stage of regression.
Table 7 – Regression results for the impact of female gender based corruption on firm value
The table presents results of 2SLS regressions for the sample of 2,370 firms. The dependent variable are: (1) Return on Assets (ROA) and (2)
Market to Book Ratio (MtB). The independent variables (i.e. main variable of interest) are: (1) Percentage of Corrupt Female Board Members; (2) Percentage of Corrupt Female Executives; (3) Percentage of Corrupt Female Senior Executives; and (4) Percentage of Corrupt Female
CEO. Table 2 provides the definitions of all the variables. At the end, the following statistics are being reported: Hansen J Statistic is the test
of over-identification restrictions and Kleibergen-Paap Wald rk F statistic is the test of weakness of instruments. Robust p-value, based on robust standard errors, are reported in parentheses. ***: denotes significance at the 1% level; **: denotes significance at the 5% level; *:
denotes significance at the 10% level.
(1) (2) (3) (4) (5) (6) (7) (8)
Dependent Variables
Explanatory
Variables
ROA ROA ROA ROA MtB MtB MtB MtB
2SLS 2SLS 2SLS 2SLS 2SLS 2SLS 2SLS 2SLS
Percentage of
Corrupt Female Board Members
-2.425*** -3.619**
(0.009) (0.025)
Percentage of Corrupt Female
Executives
-3.349** -5.068**
(0.019) (0.024) Percentage of
Corrupt Female
Senior Executives
-1.433 -3.072*
(0.103) (0.053)
Percentage of
Corrupt Female CEO
-6.399 -7.260
(0.207) (0.242)
Average Board Age
0.000 -0.001
(0.713) (0.381)
Average Executives Age
-0.000 0.000 -0.000 -0.004** -0.005*** -0.005*
(0.976) (0.938) (0.797) (0.012) (0.008) (0.051)
Board Size -0.005*** -0.004*** -0.006*** -0.005 -0.002 -0.001 -0.003 -0.002 (0.000) (0.005) (0.000) (0.214) (0.402) (0.811) (0.146) (0.673)
Board Gender
Diversity
0.441*** 0.215*** 0.152*** 0.347* 0.566** 0.232** 0.168** 0.340
(0.001) (0.000) (0.000) (0.064) (0.017) (0.019) (0.027) (0.147)

48 | P a g e
Firm Age 0.019*** 0.018*** 0.019*** 0.011 -0.011 -0.010 -0.008 -0.019
(0.001) (0.003) (0.000) (0.423) (0.143) (0.177) (0.276) (0.267) Firm Size 0.050*** 0.041*** 0.040*** 0.049*** 0.066*** 0.054*** 0.053*** 0.060***
(0.000) (0.000) (0.000) (0.000) (0.000) (0.000) (0.000) (0.000)
Financial Leverage
-0.302*** -0.296*** -0.267*** -0.229*** -0.196*** -0.192*** -0.144** -0.107
(0.000) (0.000) (0.000) (0.004) (0.003) (0.006) (0.027) (0.272)
Sales Growth -0.001 -0.004 0.001 -0.005 0.002 -0.002 0.006 -0.001 (0.931) (0.794) (0.922) (0.759) (0.828) (0.868) (0.594) (0.961)
Tangibility 0.090*** 0.086*** 0.070*** 0.094* 0.032 0.030 0.012 0.030
(0.001) (0.004) (0.003) (0.094) (0.451) (0.504) (0.757) (0.659) Ownership 0.014 0.023 0.011 0.006 -0.008 0.003 -0.020 -0.018
(0.493) (0.322) (0.579) (0.879) (0.828) (0.937) (0.565) (0.738)
R&D Intensity -0.779*** -0.747*** -0.760*** -0.914*** -0.156 -0.107 -0.139 -0.295 (0.000) (0.000) (0.000) (0.000) (0.441) (0.603) (0.458) (0.238)
Country Specific
Controls
Yes Yes Yes Yes Yes Yes Yes Yes
Industry FE Yes Yes Yes Yes Yes Yes Yes Yes
Hansen J Statistic 0.434 5.031 10.656 0.030 0.142 0.959 3.287 0.457
(P-value) 0.510 0.025 0.001 0.862 0.706 0.327 0.070 0.499
Kleibergen-Paap
Wald rk F
statistic
7.727 6.614 6.703 0.907 7.727 6.614 6.703 0.907
Observation 2370 2370 2370 2370 2370 2370 2370 2370
The results of first-stage regressions (not tabulated) show that instruments continue to be
significantly correlated with gender-based corruption proxies. The F-test value reports that the
instrumental model estimates gender-based corruption at board and management level. Therefore, these
instruments are not too weak to be valid and can satisfy the criterion of relevance. More importantly,
these instruments also plausibly satisfy again the exclusion restriction. Under the assumption of
instruments joint validity, the model is exactly identified in this case.
In Table 7, we apply 2SLS method for correcting the issues of endogenous measures of corruption.
In columns 1-4, the second stage regressions’ results of corruption impact on Return on Assets (ROA),
a short-term proxy of financial performance of the company show that the coefficients of fitted value
of Percentage of Corrupt Female Board Members, Percentage of Corrupt Female Executives,
Percentage of Corrupt Female Senior Executives, and Percentage of Corrupt Female CEO,
alternatively used are negative and on average, statistically significant at least at 5% level. Similarly, in
columns 5-8, the second stage regressions’ results of corruption impact on Market to Book Ratio (i.e.
long-term performance measure) report that the coefficients of fitted value of Percentage of Corrupt
Female Board Members, Percentage of Corrupt Female Executives, Percentage of Corrupt Female
Senior Executives, and Percentage of Corrupt Female CEO, alternatively used are negative and on
average, statistically significant at least at 5% level. It implies that corruption at gender-level seems to
have a strong negative impact on both its short-term and long-term financial performance. We also

49 | P a g e
reported the results concerning the male corruption to compare the magnitude of corruption effect on
financial performance of the firm (Table 8).
Table 8 – Regression results for the impact of male gender based corruption on firm value
The table presents results of 2SLS regressions for the sample of 2,730 firms. The dependent variable are: (1) Return on Assets (ROA) and (2) Market to Book Ratio (MtB). The independent variables (i.e. main variable of interest) are: (1) Percentage of Corrupt Male Board Members;
(2) Percentage of Corrupt Male Executives; (3) Percentage of Corrupt Male Senior Executives; and (4) Percentage of Corrupt Male CEO.
Table 2 provides the definitions of all the variables. At the end, the following statistics are being reported: Hansen J Statistic is the test of over-identification restrictions and Kleibergen-Paap rk LM statistic and Kleibergen-Paap Wald rk F statistic is the test of weakness of
instruments. Robust p-value, based on robust standard errors, are reported in parentheses. ***: denotes significance at the 1% level; **: denotes
significance at the 5% level; *: denotes significance at the 10% level. (1) (2) (3) (4) (5) (6) (7) (8)
Dependent Variables
Explanatory
Variables
ROA ROA ROA ROA MtB MtB MtB MtB
2SLS 2SLS 2SLS 2SLS 2SLS 2SLS 2SLS 2SLS
Percentage of
Corrupt Male Board Members
-0.451*** -0.712**
(0.002) (0.014)
Percentage of Corrupt Male
Executives
-0.835*** -1.050***
(0.003) (0.009) Percentage of
Corrupt Male
Senior Executives
-0.665*** -0.885**
(0.004) (0.010)
Percentage of Corrupt Male
CEO
-0.869* -1.142*
(0.053) (0.061) Average Board
Age
0.000 -0.001
(0.820) (0.283) Average
Executives Age
0.001 0.001 0.001 -0.003** -0.003** -0.003*
(0.383) (0.330) (0.476) (0.022) (0.029) (0.078) Board Size -0.006*** -0.005*** -0.005*** -0.005** -0.004*** -0.002 -0.002 -0.001
(0.000) (0.000) (0.000) (0.033) (0.009) (0.282) (0.246) (0.678)
Board Gender Diversity
0.039 0.027 0.060* 0.071 -0.040 -0.032 0.006 0.020
(0.254) (0.492) (0.079) (0.151) (0.486) (0.579) (0.914) (0.777)
Firm Age 0.017*** 0.017*** 0.015*** 0.011 -0.014** -0.012* -0.015** -0.020* (0.001) (0.002) (0.010) (0.226) (0.026) (0.069) (0.031) (0.078)
Firm Size 0.047*** 0.046*** 0.044*** 0.056*** 0.063*** 0.059*** 0.057*** 0.072***
(0.000) (0.000) (0.000) (0.000) (0.000) (0.000) (0.000) (0.000) Financial
Leverage
-0.304*** -0.296*** -0.288*** -0.283*** -0.201*** -0.186*** -0.177*** -0.170**
(0.000) (0.000) (0.000) (0.000) (0.001) (0.002) (0.004) (0.018) Sales Growth -0.006 -0.005 -0.004 -0.006 -0.005 -0.001 -0.001 -0.003
(0.702) (0.747) (0.789) (0.734) (0.695) (0.902) (0.939) (0.841)
Tangibility 0.079*** 0.094*** 0.095*** 0.078** 0.016 0.034 0.038 0.015 (0.000) (0.000) (0.000) (0.027) (0.598) (0.332) (0.301) (0.736)
Ownership 0.014 0.023 0.012 0.007 -0.009 0.002 -0.012 -0.019
(0.450) (0.263) (0.557) (0.817) (0.778) (0.957) (0.729) (0.669) R&D Intensity -0.671*** -0.679*** -0.713*** -0.657*** 0.011 -0.021 -0.061 0.011
(0.000) (0.000) (0.000) (0.004) (0.951) (0.914) (0.750) (0.968)
Country Specific
Controls
Yes Yes Yes Yes Yes Yes Yes Yes
Industry FE Yes Yes Yes Yes Yes Yes Yes Yes
Hansen J Statistic 2.230 0.678 2.092 0.675 0.044 0.114 0.054 0.006
(P-value) 0.135 0.410 0.148 0.411 0.834 0.735 0.817 0.940
Kleibergen-Paap Wald rk F
statistic
21.989 10.832 11.364 2.663 21.989 10.832 11.364 2.663
Observation 2370 2370 2370 2370 2370 2370 2370 2370

50 | P a g e
Comparing the results of Table 8 (Male) with Table 7 (Female), it results the higher magnitude
of the coefficients of corrupted females is higher in comparison to coefficients of corrupted male.
Consequently, the Hypothesis 3 seems to be confirmed, inferring that females involved in corrupt
activities become more nervous, fearful and less confident in managing the high-level of risk in form
of punishment, fines, social image damage, and fear of firing out. It can be assumed that corrupt female
executives (or board members) may not be as confident (or smart) as their male counterparts to cover-
up their dishonest and illegal behaviours, and in turn, they could not handle the risk of involvement in
corrupt transactions and tasks. Therefore, when executives or board members are corrupted and female,
the incapability of females to manage the highly risky, illegal and unethical practices amplifies the
negative effect of corruption and direct the firm even in a worse condition.
5.2 Robustness checks
Our main findings show that corruption is detrimental to firm value in both short-term and long-
term perspective. In this section of the paper, we show the robustness of our results by using the lagged
values of all explanatory variables and implementing the 2SLS method to control for the issue of
endogeneity or reverse causality in our regression models. The results confirm that corruption measures
at board and management level have overall negative influence on firm performance, given in Appendix
3. Similarly, the outcomes remain same when we reinvestigate the effect of PEP-specific corruption
and gender based corruption measures on firm performance by using the lagged values of all
explanatory variables and implementing the 2SLS method to control for endogeneity or reverse. The
findings confirm that PEP-specific corruption and gender based corruption measures at board and
management level have negative influence on firm performance, given in Appendices 4, 5 and 6. We
have also estimated the combined effect of board and management corruption on firm value and we
find that our main effect of corruption still remain negative and statistically significant, given in
Appendix 7.
We further test the robustness of main results (Table 5) by providing the evidence for the
impact of corruption on alternative proxies of firm performance. We investigate the dependent
variables, Return on Investment (ROI) and Industry Adjusted ROA, as alternative proxies of firm
51 | P a g e
performance. Using 2SLS method, the coefficient values of corruption measures, instrumented by
Industry Mean of Corrupt Board Members, Industry Mean of Corrupt Executives, and Women Share in
Parliament are negative and on average, statistically significant. These findings consistent with the
main effect of corruption on Return on Assets (ROA) and Market to Book Ratio (MtB), are available in
Appendix 8.
We also investigate the robustness of the results of Table 6, by using alternative proxies of firm
performance and implementing the two stage least squares (2SLS) model. Using 2SLS method, the
coefficient values of corruption measures, instrumented by Industry Mean of Corrupt Board Members,
Industry Mean of Corrupt Executives, and Women Share in Parliament, are negative and on average,
statistically significant at different levels significance. It confirm that PEP specific executive or board
members’ corruption have a negative effect on both its financial performance and these findings are
consistent with the main effect of PEP specific corruption on Return on Assets (ROA) and Market to
Book Ratio (MtB), available in Appendix 9.
For the robustness test of results of Table 7 and Table 8, we examine the preliminary findings
of the regression analysis by using alternative proxies of firm financial performance and implementing
the two-stage least square (2SLS) method. In the outcomes of 2SLS regression models, we show that
these findings are consistent with the effect of corruption at gender-level on Return on Assets (ROA)
and Market to Book Ratio (MtB), available in Appendix 10.
Moreover, the results are qualitatively remain the same while we use the raw database, without
winsorizing the variables used in the empirical model. Finally, we also applied OLS method as base
line model and the three stage least square approach (3SLS), based on simultaneous equations (the first
one concerning performance determinants and the second one related to corruption antecedents). In
both cases, the results are qualitative the same, available in appendices 11, 12, 13, 14, 15 and 16.
6. Conclusion
This study explores the effects of firm-specific corruption on the short-term and long-term
performance of the firm. Corruption is mainly acknowledged as a primary devastating force that, by
“sand the wheels of commerce”, propagates the hurdles on the way of the economic and social

52 | P a g e
development of the developing as well as developed economies. Nevertheless, a few scholars argue that
corruption is an essential “evil” that can be utilized to mitigate the negative effects of hectic bureaucratic
system, rigid rules, laws and inefficient government, supporting “grease (or oil) the wheels of
commerce” aspect of corruption.
Based on these premises, we perform our analysis on a sample of 2,370 companies from 31
countries across Europe. Using a cross-sectional data of the recent period of 2015, we report several
findings which expand our understanding on the role of firm-specific corruption in determining the
financial performance of the firm. The outcomes of the econometric analysis corroborate our hypotheses
that firm-specific corruption at different levels hinders to its accounting-based performance (the
capability of firm to effectively utilize its resources) as well as reduces its market-based performance
(i.e. capability of firm to attract and finance the profitable investment opportunities and competitive
advantage).
The results of this analysis can be summarized as follows:
First, we investigate the role of internal individual units of corruption (i.e. board and management
group members) impact on the financial performance of the firm. We empirically show that the board-
level corruption (i.e. the percentage of corrupt or dishonest board of directors) negatively affects the
financial performance of the firm. These findings are consistent with the view that the corrupt board
members may be more likely to behave opportunistically. Such board members may be more willing to
agree with the management decisions because of their social contacts, self-interest and financial ties
with management or third parties. In result, the dishonest or illegal behaviour of board members may
not let them perform their functions of monitoring and controlling well. This discretionary behavior of
board members will cause of poor governance, higher level of managerial opportunism thereby increase
agency conflicts between managers and shareholders and contribute to adverse effects on financial
performance of the firm.
Second, we show that the management-level corruption impact on firm peformance has been also
found statistically significant which is consistent with board-level corruption. The underlying reasoning
for these negative effects of executive corruption on firm performance is in line with principal-agent
framework where executives are considered to behave opportunistically and prefer to maximize their
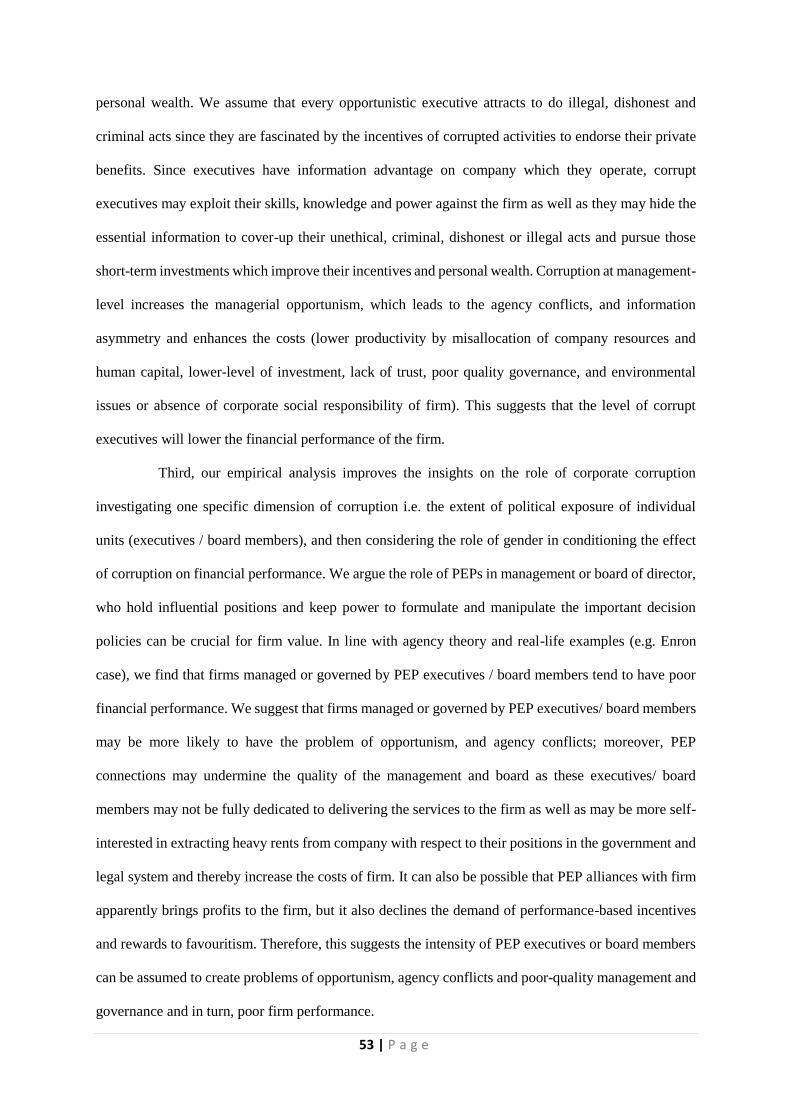
53 | P a g e
personal wealth. We assume that every opportunistic executive attracts to do illegal, dishonest and
criminal acts since they are fascinated by the incentives of corrupted activities to endorse their private
benefits. Since executives have information advantage on company which they operate, corrupt
executives may exploit their skills, knowledge and power against the firm as well as they may hide the
essential information to cover-up their unethical, criminal, dishonest or illegal acts and pursue those
short-term investments which improve their incentives and personal wealth. Corruption at management-
level increases the managerial opportunism, which leads to the agency conflicts, and information
asymmetry and enhances the costs (lower productivity by misallocation of company resources and
human capital, lower-level of investment, lack of trust, poor quality governance, and environmental
issues or absence of corporate social responsibility of firm). This suggests that the level of corrupt
executives will lower the financial performance of the firm.
Third, our empirical analysis improves the insights on the role of corporate corruption
investigating one specific dimension of corruption i.e. the extent of political exposure of individual
units (executives / board members), and then considering the role of gender in conditioning the effect
of corruption on financial performance. We argue the role of PEPs in management or board of director,
who hold influential positions and keep power to formulate and manipulate the important decision
policies can be crucial for firm value. In line with agency theory and real-life examples (e.g. Enron
case), we find that firms managed or governed by PEP executives / board members tend to have poor
financial performance. We suggest that firms managed or governed by PEP executives/ board members
may be more likely to have the problem of opportunism, and agency conflicts; moreover, PEP
connections may undermine the quality of the management and board as these executives/ board
members may not be fully dedicated to delivering the services to the firm as well as may be more self-
interested in extracting heavy rents from company with respect to their positions in the government and
legal system and thereby increase the costs of firm. It can also be possible that PEP alliances with firm
apparently brings profits to the firm, but it also declines the demand of performance-based incentives
and rewards to favouritism. Therefore, this suggests the intensity of PEP executives or board members
can be assumed to create problems of opportunism, agency conflicts and poor-quality management and
governance and in turn, poor firm performance.

54 | P a g e
In addition to the main analysis, we show that gender-specific corruption turns out to play a
significant role in determining the performance of the firm. Our findings report that the corrupt females
are more harmful for the financial performance of the firm. We find that the corrupt female board
members (or executives) have been found to more negatively affect the short-term and long-term
performance of the firm. The underlying reasoning for these strong negative effect is that females
involved in corruption are not able to manage such situation as they may feel more fearful, nervous,
emotional and less-confident and especially, in the presence of high risk of punishment, fines and fire
out. Further, by nature, the corrupt female board members (or executives) are more honest, more ethical
and more reluctant to corrupt or dishonest activities, may not be as smart (and confident) as their male
counterparts to cover-up their unethical and untruthful tasks and they therefore fail to handle the risk of
involvement in corrupt transactions and tasks. Consequently, female corruption even amplifies the main
negative effect of corruption on firm performance. These findings are consistent with the explanation
of Frank et al. (2011), who argue that the degree of corrupt transaction failure increases in the presence
of females. The outcomes of our study show that corruption is simply not acceptable in any form and
at any level and suggest that corruption is detrimental in every situation. These findings consistent with
“sand the wheel of the commerce” view of corruption at macro-level. The managerial implication of
our study is that it is better to avoid female involvement in corrupt or dishonest activities as the
incapability of females in dishonest or corrupt activities amplifies the main negative effect of corruption
and leads the firm in even worse direction. The prior studies on nexus between corruption and gender
argue that females reduce the level of corruption, however our study indirectly suggests to policy-
makers to push the female representation in the firm because in this way, the firms will be probably less
interested in corruption, since females in corruption are not good and the magnitude of negative effect
of female corruption on firm performance is even stronger than the magnitude of negative effect of male
corruption as female corruption make almost double the main effect of corruption. Thus, it seems that
female damages more firm performance compared to male.
Future research should also consider role of the personal wealth, investigating if female that
strongly hit the firm performance are also the one that get more personal advantages, being involved in
corruption or it is male, who is better able to manage with corruption as well as effectively capable to
55 | P a g e
get more benefits from corrupt transactions. Thus, future research should implement the value of the
firms along with the personal value of the people which can be gained through the involvement in
corrupted activities. It will also be remarkable to consider the time-specific effects using panel data,
and particularly analysing the ex-ante and ex-post consequences of corruption on firm performance.
Moreover, it would be worthy to add corporate social responsibility dimension to explore the effects of
corruption on financial performance because the firm pervasiveness towards corruption as well as
towards social responsibility could play a significant role to understand the corruption effects on
corporate performance.
References
Abed, G.T. and Gupta, S., 2002. The economics of corruption: An overview. Governance, Corruption,
and Economic Performance, pp.2.
Acemoglu, D. & Verdier, T., 1998. Property rights, corruption and the allocation of talent: a general
equilibrium approach. The Economic Journal, 108(450), pp. 1381-1403.
Adams, R.B. & Ferreira, D., 2009. Women in the boardroom and their impact on governance and
performance. Journal of Financial Economics, 94(2), pp. 291-309.
Agrawal, A. and Knoeber, C.R., 2001. Do some outside directors play a political role?. The Journal of
Law and Economics, 44(1), pp.179-198.
Aidt, T.S., 2009. Corruption, institutions, and economic development. Oxford Review of Economic
Policy, 25(2), pp. 271-291.
Akintoye, I.R., 2008. Effect of capital structure on firms’ performance: the Nigerian experience.
European Journal of Economics, Finance and Administrative Sciences, Volume 10, pp. 233-243.
Athanasouli, D. & Goujard, A., 2015. Corruption and management practices: firm level evidence.
Journal of Comparative Economics, 43(4), pp. 1014-1034.
Athanasouli, D., Goujard, A. & Sklias, P., 2012. Corruption and firm performance: evidence from
Greek firms. International Journal of Economic Sciences and Applied Research, 5(2), pp. 43-67.
Alatas, V., Cameron, L., Chaudhuri, A., Erkal, N., & Gangadharan, L. (2009). Gender, culture, and
corruption: Insights from an experimental analysis. Southern Economic Journal, 75(3), pp. 663-680.
Ayaydın, H. & Hayaloglu, P., 2014. The effect of corruption on firm growth: evidence from firms in
Turkey. Asian Economic and Financial Review, 4(5), pp. 607-624.
Bardhan, P., 1997. Corruption and development: a review of issues. Journal of economic literature,
35(3), pp. 1320-1346.
Beltramini , R.F., Peterson, R.A. & Kozmetsky, G., 1984. Concerns of college students regarding
business ethics. Journal of Business Ethics, 3(3), pp. 195-200.

56 | P a g e
Bernardi, R.A. & Arnold, D.F., 1997. An examination of moral development within public accounting
by gender, staff level, and firm. Contemporary Accounting Research, 14(4), pp. 653-668.
Betz, M., O'Connell, L. & Shepard, J.M., 1989. Gender differences in proclivity for unethical
behaviour. Journal of Business Ethics, 8(5), pp. 321-324.
Borkowski, S.C. & Ugras, Y.J., 1998. Business students and ethics: a meta-analysis. Journal of Business
Ethics, 17(11), pp. 1117-1127.
Bosco, B., 2016. Old and new factors affecting corruption in Europe: evidence from panel data.
Economic Analysis and Policy, Volume 51, pp. 66-85.
Boubakri, N., Cosset, J.C. and Saffar, W., 2008. Political connections of newly privatized
firms. Journal of corporate finance, 14(5), pp.654-673.
Braun, D. & Guston, D.H., 2003. Principal-agent theory and research policy: an introduction. Science
and Public Policy, 30(5), pp. 302-308.
Breen, M., Gillanders, R., McNulty, G. and Suzuki, A., 2016. Gender and corruption in business. The
Journal of Development Studies, pp.1-16.
Campbell, K. & Mínguez-Vera, A., 2008. Gender diversity in the boardroom and firm financial
performance. Journal of Business Ethics, 83(3), pp. 435-451.
Carter, D.A., D'Souza, F., Simkins, B. J. & Simpson, W.G., 2010. The gender and ethnic diversity of
US boards and board committees and firm financial performance. Corporate Governance, An
International Review, 18(5), pp. 396-414.
Carter, D.A., Simkins, B.J. & Simpson, W.G., 2003. Corporate governance, board diversity, and firm
value. Financial Review, 38(1), pp. 33-53.
Chonko, L.B. and Hunt, S.D., 1985. Ethics and marketing management: An empirical
examination. Journal of Business Research, 13(4), pp. 339-359.
Claessens, S., Feijen, E. & Laeven, L., 2008. Political connections and preferential access to finance:
the role of campaign contributions. Journal of Financial Economics, 88(3), pp. 554-580.
Collins, J.D., Uhlenbruck, K. & Rodriguez, P., 2009. Why firms engage in corruption: A top
management perspective. Journal of Business Ethics, 87(1), pp. 89-108.
Croson, R. & Gneezy, U., 2009. Gender differences in preferences. Journal of Economic literature,
47(2), pp. 448-474.
De Rosa, D., Gooroochurn, N. & Görg, H., 2010. Corruption and productivity: firm-level evidence from
the BEEPS survey. Working Paper Series No. WPS5348, World Bank Policy Research .
Dezsö, C.L. & Ross , D.G., 2012. Does female representation in top management improve firm
performance? a panel data investigation. Strategic Management Journal, 33(9), pp. 1072-1089.
Dollar, D., Fisman, R. and Gatti, R., 1999. Are women really the “fairer” sex? Corruption and women
in government. Working Paper Series No. 4, World Bank.
Dollar, D., Fisman, R. and Gatti, R., 2001. Are women really the “fairer” sex? Corruption and women
in government. Journal of Economic Behavior & Organization, 46(4), pp.423-429.
Dyck, A., Morse, A. & Zingales, L., 2010. Who blows the whistle on corporate fraud?. The Journal of
Finance, 65(6), pp. 2213-2253.

57 | P a g e
Dyck, A., Morse, A. & Zingales, L., 2013 . How pervasive is corporate fraud?. Rotman School of
Management Working Paper (2222608).
Eisenhardt, K.M., 1985. Control: organizational and economic approaches. Management science, 31(2),
pp. 134-149.
Erhardt, N.L., Werbel, J.D. & Shrader, C.B., 2003. Board of director diversity and firm financial
performance. Corporate Governance: An International Review, 11(2), pp. 102-111.
Estes, R. & Hosseini, J., 1988. The gender gap on wall street: an empirical analysis of confidence in
investment decision making. The Journal of Psychology, 122(6), pp. 577-590.
Faccio, M., 2006. Politically connected firms. The American economic review, 96(1), pp.369-386.
Fama, E. & Jensen, M., 1983. Separation of ownership and control. The Journal of Law & Economics,
26(2), pp. 301-325.
Farrell, K. & Hersch, P.L., 2005. Additions to corporate boards: the effect of gender. Journal of
Corporate finance, 11(1), pp. 85-106.
Faruq, H., Webb, M. & Yi, D., 2013. Corruption, bureaucracy and firm productivity in Africa. Review
of Development Economics, 17(1), pp. 117-129.
Fisman, R. & Svensson, J., 2007. Are corruption and taxation really harmful to growth? firm level
evidence. Journal of Development Economics, 83(1), pp. 63-75.
Francoeur, C., Labelle, R. & Sinclair-Desgagné, B., 2008. Gender diversity in corporate governance
and top management. Journal of Business Ethics, 81(1), pp. 83-95.
Frank, B., Lambsdorff, J.G. & Boehm, F., 2011. Gender and Corruption: lessons from laboratory
corruption experiments. European Journal of Development Research, 23(1), pp. 59-71.
Frank, M.Z. & Goyal, V.K., 2003. Testing the pecking order theory of capital structure. Journal of
Financial Economics, 67(2), pp. 217-248.
Fujita, F., Diener, E. & Sandvik, E., 1991. Gender differences in negative affect and well-being: the
case for emotional intensity. Journal of Personality and Social Psychology, 61(3), pp. 427-434.
Gaviria, A., 2002. Assessing the effects of corruption and crime on firm performance: evidence from
Latin America. Emerging Markets Review, 3(3), pp. 245-268.
Glancey, K., 1998. Determinants of growth and profitability in small entrepreneurial firms.
International Journal of Entrepreneurial Behavior & Research, 4(1), pp. 18-27.
Harford, J., Mansi, S.A. and Maxwell, W.F., 2008. Corporate governance and firm cash holdings in the
US. Journal of Financial Economics, 87(3), pp. 535-555.
Hall, M. & Weiss, L., 1967. Firm size and profitability. The Review of Economics and Statistics, 49(3),
pp. 319-331.
Hsu, F.J., Chen, M.Y., Chen, Y.C. & Wang, W.C., 2013. An empirical study on the relationship between
R&D and financial performance. Journal of Applied Finance and Banking, 3(5), pp. 107-119.
Huntington, S.P., 1968. Political order in changing societies. Yale University Press, London.
International Monetary Fund, 2016. Corruption: costs and mitigating strategies. IMF Staff Discussion
Note No. SDN/16/05, 11 May.

58 | P a g e
Jain, A.K., 2001. Corruption: A review. Journal of Economic Surveys, 15(1), pp. 71-121.
Jensen, M.C., 1993. The modern industrial revolution, exit, and the failure of internal control systems.
The Journal of Finance, 48(3), pp. 831-880.
Jensen, M.C. & Meckling, W.H., 1976. Theory of the firm: managerial behavior, agency costs and
ownership structure. Journal of Financial Economics, 3(4), pp. 305-360.
Jones, T.M. & Gautschi, F.H., 1988. Will the ethics of business change? a survey of future executives.
Journal of Business Ethics, 7(4), pp. 231-248.
Kaufmann, D. & Wei, S.J., 1999. Does" grease money" speed up the wheels of commerce?. Working
Paper Series No. 7093, National Bureau of Economic Research.
Kimuyu, P., 2007. Corruption, firm growth and export propensity in Kenya. International Journal of
Social Economics, 34(3), pp. 197-217.
Lambsdorff, J.G. and Frank, B., 2011. Corrupt reciprocity–Experimental evidence on a men's
game. International review of Law and economics, 31(2), pp.116-125.
La Porta, R., Lopez‐de‐Silanes, F. & Shleifer, A., 1999. Corporate ownership around the world. The
Journal of Finance, 54(2), pp. 471-517.
La Rocca, M., Cambrea, D.R. & Cariola, A., 2017. The role of corruption in shaping the value of
holding cash. Finance Research Letters, Volume 20, pp. 104-108.
Leff, N.H., 1964. Economic development through bureaucratic corruption. American Behavioral
Scientist, 8(3), pp. 8-14.
Li, H., Meng, L., Wang, Q. & Zhou, L., 2008. Political connections, financing and firm performance:
Evidence from Chinese private firms. Journal of Development Economics, 87(2), pp. 283-299.
Li, H., Meng, L., Wang, Q. and Zhou, L.A., 2008. Political connections, financing and firm
performance: Evidence from Chinese private firms. Journal of development economics, 87(2), pp.283-
299.
Mackie‐Mason, J.K., 1990. Do taxes affect corporate financing decisions?. The Journal of Finance,
45(5), pp. 1471-1493.
Mauro, P., 1995. Corruption and growth. The Quarterly Journal of Economics, pp. 681-712.
Mauro, P., 1998. Corruption: causes, consequences, and agenda for further research. Finance and
Development, Volume 35, pp. 11-14.
Maury, B. & Pajuste, A., 2005. Multiple large shareholders and firm value. Journal of Banking &
Finance, 29(7), pp. 1813-1834.
McArthur, J. & Teal, F., 2002. Corruption and firm Performance in Africa. Economics Series Working
Papers, No. WPS/2002-10, University of Oxford, Oxford.
Méon, P.G. & Sekkat, K., 2005. Does corruption grease or sand the wheels of growth?. Public Choice,
122(1), pp. 69-97.
Mo, P.H., 2001. Corruption and economic growth. Journal of Comparative Economics, 29(1), pp. 66-
79.
Murphy, K.M., Shleifer, A. & Vishny, R.W., 1993. The Allocation of Talent: Implications for Growth.
The Quarterly Journal of Economics, pp. 409-414.

59 | P a g e
Myers, S.C., 1977. Determinants of corporate borrowing. Journal of financial economics, 5(2), pp. 147-
175.
Nowak, R., 2001. Corruption and transition economies, in, Ninth OSCE Economic Forum, Bucharest,
27-28 March.
Nye, J.S., 1967. Corruption and political development: A cost-benefit analysis. American Political
Science Review, 61(2), pp. 417-427.
Pervan, M. & Višić, J., 2012. Influence of firm size on its business success. Croatian Operational
Research Review, 3(1), pp. 213-223.
Peterson, R.A., Beltramini, R.F. & Kozmetsky, G., 1991. Concerns of college students regarding
business ethics: a replication. Journal of Business Ethics, 10(10), pp. 733-738.
Ruegger, D. & King, E.W., 1992. A study of the effect of age and gender upon student business ethics.
Journal of Business Ethics, 11(3), pp. 179-186.
Rivas, M.F., 2013. An experiment on corruption and gender. Bulletin of Economic Research, 65(1),
pp.10-42.
Robins, J. & Wiersema, M., 1995. A resource‐based approach to the multibusiness firm: Empirical
analysis of portfolio interrelationships and corporate financial performance. Strategic Management
Journal, 16(4), pp. 277-299.
Sahakyan , N. & Stiegert, K.W., 2012. Corruption and firm performance. Eastern European Economics,
50(6), pp. 5-27.
Schubert, R., Brown, M., Gysler, M. and Brachinger, H.W., 1999. Financial decision-making: Are
women really more risk-averse?. The American economic review, 89(2), pp.381-385.
Sharma, C. & Mitra, A., 2015. Corruption, governance and firm performance: evidence from Indian
enterprises. Journal of Policy Modeling, 37(5), pp. 835-851.
Shleifer, A. & Vishny, R., 1993. Corruption. Quarterly Journal of Economics, pp. 599–617.
Shleifer, A. and Vishny, R.W., 1994. Politicians and firms. The Quarterly Journal of
Economics, 109(4), pp.995-1025.
Singh, M. & Faircloth, S., 2005. The impact of corporate debt on long term investment and firm
performance. Applied Economics, 37(8), pp. 875-883.
Stulz, R., 1990. Managerial discretion and optimal financing policies. Journal of Financial Economics,
26(1), pp. 3-27.
Svensson, J., 2005. Eight questions about corruption. The Journal of Economic Perspectives, 19(3), pp.
19-42.
Swamy, A., Knack, S., Lee, Y. and Azfar, O., 2001. Gender and corruption. Journal of development
economics, 64(1), pp.25-55.
Sung, H.E., 2012. Women in government, public corruption, and liberal democracy: A panel
analysis. Crime, Law and Social Change, 58(3), pp.195-219.
Tanzi, V. & Davoodi, H.R., 2000. Corruption, growth, and public finances. IMF Working Paper
WP/00/182.

60 | P a g e
Theobald, R., 1990. What is Corruption?. Corruption, development and underdevelopment, Palgrave
Macmillan UK, pp. 1-18.
Torgler, B. and Valev, N.T., 2006. Women and illegal activities: Gender differences and women's
willingness to comply over time. Working Paper No. 2006-15, Center for Research in Economics,
Management and Arts (CREMA).
Uzun, H., Szewczyk, S.H. & Varma, R., 2004. Board composition and corporate fraud. Financial
Analysts Journal, 60(3), pp. 33-43.
Van Vu, H., Tran, T.Q., Van Nguyen, T. & Lim, S., 2016. Corruption, types of corruption and firm
financial performance: new evidence from a transitional economy. Journal of Business Ethics, pp. 1-
12.
Wang, Y. & You, . J., 2012. Corruption and firm growth: Evidence from China. China Economic
Review, 23(2), pp. 415-433.
Whipple, T.W. and Swords, D.F., 1992. Business ethics judgments: A cross-cultural
comparison. Journal of Business Ethics, 11(9), pp.671-678.
Williams, C.C., Martinez-Perez, A. & Kedir, A., 2016. Does bribery have a negative impact on firm
performance? a firm-level analysis across 132 developing countries. International Journal of
Entrepreneurial Behavior & Research, 22(3), pp. 398-415.
Williamson, O.E., 1985. The economic institutions of capitalism: firms, markets, relational contracting.
Free Press, New York.
World Bank, 2004. The costs of corruption, News and broadcast article, World Bank.
http://web.worldbank.org/WBSITE/EXTERNAL/NEWS/0,,contentMDK:21896686~pagePK:642570
43~piPK:437376~theSitePK:4607,00.html.
Zahra, S.A., Priem, R.L. & Rasheed, A.A., 2005. The antecedents and consequences of top management
fraud. Journal of Management, 31(6), pp. 803-828.
Zajac, E.J. & Westphal, J.D., 2004. The social construction of market value: Institutionalization and
learning perspectives on stock market reactions. American Sociological Review, 69(3), pp. 433-457.
Zingales, L., 2012. A capitalism for the people: Recapturing the lost genius of American prosperity.
Basic Books, New York.

61 | P a g e
Appendix-1
Sample Characteristics
No Country Observations Percentage Year No Country Observations Percentage Year
1 Belgium 45 1.90 2015 18 Netherlands 26 1.10 2015
2 Bulgaria 33 1.39 2015 19 Norway 83 3.50 2015
3 Cyprus 17 0.72 2015 20 Poland 47 1.98 2015
4 Czech Republic 4 0.17 2015 21 Portugal 24 1.01 2015
5 Denmark 59 2.49 2015 22 Romania 101 4.26 2015
6 Estonia 7 0.30 2015 23 Russian Federation 45 1.90 2015
7 Finland 98 4.14 2015 24 Serbia 7 0.30 2015
8 France 362 15.27 2015 25 Slovenia 2 0.08 2015
9 Germany 33 1.39 2015 26 Spain 61 2.57 2015
10 Greece 130 5.49 2015 27 Sweden 187 7.89 2015
11 Hungary 4 0.17 2015 28 Switzerland 116 4.89 2015
12 Iceland 11 0.46 2015 29 Turkey 21 0.89 2015
13 Ireland 33 1.39 2015 30 Ukraine 6 0.25 2015
14 Italy 134 5.64 2015 31 United Kingdom 652 27.51 2015
15 Lithuania 7 0.29 2015
16 Luxembourg 11 0.46 2015
17 Malta 4 0.17 2015
No Industry Sectors Observations Percentage
1 A - Agriculture, forestry and fishing 34 1.43
2 B - Mining and quarrying 125 5.27
3 C - Manufacturing 1,057 44.60
4 D - Electricity, gas, steam and air conditioning supply 79 3.33
5 E - Water supply; sewerage, waste management and remediation activities 21 0.89
6 F - Construction 86 3.63
7 G - Wholesale and retail trade; repair of motor vehicles and motorcycles 191 8.06
8 H - Transportation and storage 89 3.76
9 I - Accommodation and food service activities 55 2.32
10 J - Information and communication 311 13.12
11 L - Real estate activities 24 1.01
12 M - Professional, scientific and technical activities 142 5.99
13 N - Administrative and support service activities 73 3.08
14 Q - Human health and social work activities 34 1.43

62 | P a g e
15 R - Arts, entertainment and recreation 36 1.52
16 S - Other service activities 13 0.55

63 | P a g e
Appendix 2
Corruption definition and source of data
World Compliance™ Data provides information concerning the involvement of the firm,
considered as whole and a separate entity, or each single manager or member of the board in
many kinds of illegal, unethical and untruthful behavior which are based on the abuse his/her
authority and power. Data are provided by LexisNexis World Compliance combining cutting-
edge technology and unique data, built on the LexisNexis 40-year reputation as a trusted
custodian of essential information. This is the most comprehensive and current database of
sanctions, enforcements, PEP and negative news available all over the world. World
Compliance collects information concerning people and entities to allow to assess, predict and
manager the risk associated with the quality of whom a firm intends to start to conduct a
business. It employs a rigorous investigative process to provide robust databases of high-risk
individuals and entities commercially available. It is noteworthy for a firm to know in advance
whether the managers or the company it wants to start to make business is involved in some
illegal or unethical behaviors and which are these behaviors, supporting more confident
decisions, improving due diligence activities, increasing transaction screening efficiency and,
in general, enhancing operational efficiency.
This information is typically used by: 6 of the world’s top 10 banks; 100% of the top 50 U.S.
banks; 80% of Fortune 500 companies; Over 8,000 discreet customers and more than 100,000
online users; Screening over 33 billion names against global watch lists per year; Serving more
than 500 million real-time transactions per year; for the involvement in any kind of sanction,
enforcement, PEP or adverse media list.
The database contents data from different segments, as mainly sorted in: 1) “sanctions and
enforcements”, that are aggregated information from the most important sanction lists (OFAC,
EU, UN, BOE, FBI BIS, etc.) worldwide, grouping them into one category. In addition,
information received from enforcement lists and court filings worldwide, such as the FDA,
U.S. HHS, UK FSA, SEC and more (about 500 enforcement agencies around the world). 2)”
Politically Exposed Persons (PEPs)”: includes profiles of the largest database of Politically
Exposed Persons as well as those of their family members or close associates. 3) “Adverse
Media”: An extensive proprietary database of profiles that have been linked to illicit activities
from over 35,000 news sources worldwide. For example, cheating, bribery, tax evasion, money
laundering, fraud, insider trading, terrorism, securities fraud, bank fraud, kidnapping, piracy,
drug trafficking, smuggling, financial crimes, conspiracy, piracy, environmental and other
types of crimes, forgery, and misappropriation among other corrupt practices.
For further information:
http://www.lexisnexis.com/risk/products/financial/worldcompliance-data.aspx
http://www.lexisnexis.com/risk/intl/en/resources/brochures/WorldCompliance-Data.pdf

64 | P a g e
Appendix 3
Two stage least squares regression results for the ex-post (one year lag) effect of board and management corruption
on financial performance of the firm
The table presents results of 2SLS regression for the sample of 2,370 firms. The dependent variables are: (1) Return on Assets (ROA) and (2)
Market to Book Ratio (MtB) are collected for the year of 2016. The independent variables (i.e. main variable of interest) are: (1) Percentage of
Corrupt Board Members, a percentage of corrupt board members with respect to total board members in the firm; (2) Percentage of Corrupt Executives, a percentage of corrupt executives with respect to total executives in the firm; (3) Percentage of Corrupt Senior Executives, a
percentage of corrupt senior executives with respect to total executives in the firm and, (4) Percentage of Corrupt CEO, a percentage of corrupt
CEOs with respect to total CEOs in the firm are collected for the year of 2015. Table 2 provides the definitions of all the variables. At the end, the following statistics are being reported: Hansen J Statistic is the test of over-identification restrictions and Kleibergen-Paap Wald rk F statistic
is the test of weakness of instruments. Robust p-value, based on robust standard errors, are reported in parentheses. ***: denotes significance at
the 1% level; **: denotes significance at the 5% level; *: denotes significance at the 10% level.
(1) (2) (3) (4) (5) (6) (7) (8)
Dependent Variables
Explanatory
Variables
ROA (t+1) ROA (t+1) ROA (t+1) ROA (t+1) MtB(t+1) MtB(t+1) MtB(t+1) MtB(t+1)
2SLS 2SLS 2SLS 2SLS 2SLS 2SLS 2SLS 2SLS
Percentage of
Corrupt Board
Members
-0.413*** -0.869*
(0.005) (0.067)
Percentage of Corrupt
Executives
-0.679*** -1.151**
(0.003) (0.036) Percentage of
Corrupt Senior
Executives
-0.542*** -1.012**
(0.004) (0.036)
Percentage of
Corrupt CEO
-0.760** -1.289*
(0.030) (0.086)
Average Board
Age
-0.001 -0.002
(0.179) (0.281)
Average
Executives Age
-0.002* -0.002* -0.002 -0.005** -0.005** -0.004*
(0.061) (0.062) (0.137) (0.043) (0.045) (0.083)
Board Size -0.004*** -0.003** -0.003** -0.003 -0.003* -0.001 -0.001 -0.000
(0.001) (0.038) (0.018) (0.188) (0.077) (0.767) (0.587) (0.906)
Board Gender
Diversity
0.035 0.000 0.023 0.040 0.044 -0.017 0.017 0.050
(0.327) (0.993) (0.550) (0.414) (0.420) (0.774) (0.760) (0.536)
Firm Age 0.022*** 0.022*** 0.021*** 0.016** -0.012* -0.010 -0.013* -0.021*
(0.000) (0.000) (0.000) (0.041) (0.054) (0.122) (0.078) (0.100) Firm Size 0.042*** 0.038*** 0.037*** 0.048*** 0.077*** 0.067*** 0.065*** 0.083***
(0.000) (0.000) (0.000) (0.000) (0.000) (0.000) (0.000) (0.000)
Financial Leverage
-0.299*** -0.291*** -0.277*** -0.271*** -0.324*** -0.300*** -0.278*** -0.266***
(0.000) (0.000) (0.000) (0.000) (0.001) (0.002) (0.002) (0.008)
Sales Growth -0.009 -0.008 -0.006 -0.009 -0.001 0.004 0.006 0.002 (0.506) (0.552) (0.632) (0.550) (0.960) (0.777) (0.676) (0.909)
Tangibility 0.084*** 0.098*** 0.097*** 0.085** 0.056 0.072 0.076 0.050
(0.010) (0.004) (0.004) (0.032) (0.206) (0.146) (0.135) (0.397) Ownership 0.010 0.019 0.006 0.003 0.023 0.038 0.016 0.010
(0.757) (0.567) (0.842) (0.944) (0.460) (0.274) (0.630) (0.820)
R&D Intensity -0.742*** -0.755*** -0.788*** -0.752*** 0.094 0.057 0.003 0.062 (0.000) (0.000) (0.000) (0.001) (0.637) (0.773) (0.987) (0.835)
Country Specific
Controls
Yes Yes Yes Yes Yes Yes Yes Yes
Industry FE Yes Yes Yes Yes Yes Yes Yes Yes
Hansen J
Statistic
1.021 0.837 2.577 0.427 0.086 0.348 0.017 0.163
(P-value) 0.312 0.360 0.108 0.514 0.770 0.555 0.897 0.686
Kleibergen-
Paap Wald rk F statistic
24.780 12.237 13.323 3.230 24.780 12.237 13.323 3.230
Observation 2370 2370 2370 2370 2370 2370 2370 2370

65 | P a g e
Appendix 4
Two stage least squares regression results for the ex-post (one year lag) effect of political exposed board and management
on financial performance of the firm
The table presents results of 2SLS regressions for the sample of 2,370 firms. The dependent variables are: (1) Return on Assets (ROA) and (2) Market
to Book Ratio (MtB) are collected for the year of 2016. The independent variables (i.e. main variable of interest) are: (1) Percentage of Politically
Exposed Board Members; (2) Percentage of Politically Exposed Executives; (3) Percentage of Politically Exposed Senior Executives; and (4)
Percentage of Politically Exposed CEO are collected for the year of 2015. Table 2 provides the definitions of all the variables. At the end, the following
statistics are being reported: Hansen J Statistic is the test of over-identification restrictions and Kleibergen-Paap Wald rk F statistic is the test of weakness
of instruments. Robust p-value, based on robust standard errors, are reported in parentheses. ***: denotes significance at the 1% level; **: denotes
significance at the 5% level; *: denotes significance at the 10% level.
(1) (2) (3) (4) (5) (6) (7) (8)
Dependent Variables
Explanatory Variables
ROA (t+1) ROA (t+1) ROA (t+1) ROA (t+1) MtB(t+1) MtB(t+1) MtB(t+1) MtB(t+1)
2SLS 2SLS 2SLS 2SLS 2SLS 2SLS 2SLS 2SLS
Percentage of Politically
Exposed Board
Members
-0.542*** -1.125*
(0.005) (0.070)
Percentage of
Politically Exposed
Executives
-0.191** -0.343*
(0.029) (0.086) Percentage of
Senior Executives
Politically Exposed
-0.731*** -1.368**
(0.007) (0.048)
Percentage of Politically
Exposed CEO
-0.725** -1.289*
(0.021) (0.081) Average Board
Age
-0.002 -0.002
(0.109) (0.173)
Average
Executives Age
-0.002* -0.003** -0.003** -0.005** -0.006** -0.006**
(0.054) (0.015) (0.026) (0.039) (0.028) (0.038) Board Size -0.004*** -0.011*** -0.004*** -0.004** -0.004* -0.015** -0.002 -0.002
(0.001) (0.003) (0.009) (0.036) (0.072) (0.032) (0.339) (0.450) Board Gender
Diversity
0.046 -0.015 0.038 0.059 0.068 -0.049 0.047 0.084
(0.191) (0.742) (0.323) (0.191) (0.264) (0.503) (0.439) (0.287) Firm Age 0.023*** 0.021*** 0.021*** 0.019*** -0.010 -0.012 -0.012 -0.016
(0.000) (0.000) (0.000) (0.005) (0.141) (0.105) (0.133) (0.122) Firm Size 0.042*** 0.046*** 0.038*** 0.045*** 0.077*** 0.081*** 0.067*** 0.079***
(0.000) (0.000) (0.000) (0.000) (0.000) (0.000) (0.000) (0.000)
Financial Leverage
-0.295*** -0.310*** -0.276*** -0.280*** -0.316*** -0.337*** -0.275*** -0.283***
(0.000) (0.000) (0.000) (0.000) (0.002) (0.002) (0.004) (0.006)
Sales Growth -0.008 -0.001 -0.004 -0.001 0.002 0.015 0.010 0.016
(0.557) (0.937) (0.781) (0.969) (0.914) (0.190) (0.427) (0.323)
Tangibility 0.086*** 0.090*** 0.113*** 0.103*** 0.060 0.061 0.107 0.084 (0.009) (0.005) (0.003) (0.010) (0.196) (0.198) (0.101) (0.195)
Ownership 0.012 -0.005 0.014 0.013 0.027 -0.005 0.029 0.028
(0.709) (0.866) (0.683) (0.702) (0.406) (0.865) (0.443) (0.517)
R&D Intensity -0.740*** -0.648*** -0.791*** -0.686*** 0.097 0.255 -0.001 0.183
(0.000) (0.006) (0.000) (0.002) (0.632) (0.413) (0.995) (0.544)
Country Specific
Controls
Yes Yes Yes Yes Yes Yes Yes Yes
Industry FE Yes Yes Yes Yes Yes Yes Yes Yes
Hansen J Statistic 0.748 2.121 2.347 1.023 0.191 0.016 0.016 0.029 (P-value) 0.387 0.145 0.125 0.312 0.662 0.899 0.900 0.865
Kleibergen-Paap Wald rk F statistic
19.235 4.174 9.625 4.460 19.235 4.174 9.625 4.460
Observation 2370 2370 2370 2370 2370 2370 2370 2370

66 | P a g e
Appendix 5
Two stage least squares regression results for the ex-post (one year lag) effect of female board and management corruption
on financial performance of the firm
The table presents results of 2SLS regressions for the sample of 2,370 firms. The dependent variables are: (1) Return on Assets (ROA) and (2) Market
to Book Ratio (MtB) are collected for the year of 2016. The independent variables (i.e. main variable of interest) are: (1) Percentage of Corrupt Female
Board Members; (2) Percentage of Corrupt Female Executives; (3) Percentage of Corrupt Female Senior Executives; and (4) Percentage of Corrupt Female CEO are collected for the year of 2015. Table 2 provides the definitions of all the variables. At the end, the following statistics are being
reported: Hansen J Statistic is the test of over-identification restrictions and Kleibergen-Paap Wald rk F statistic is the test of weakness of instruments.
Robust p-value, based on robust standard errors, are reported in parentheses. ***: denotes significance at the 1% level; **: denotes significance at the 5% level; *: denotes significance at the 10% level.
(1) (2) (3) (4) (5) (6) (7) (8)
Dependent Variables
Explanatory
Variables
ROA (t+1) ROA (t+1) ROA (t+1) ROA (t+1) MtB(t+1) MtB(t+1) MtB(t+1) MtB(t+1)
2SLS 2SLS 2SLS 2SLS 2SLS 2SLS 2SLS 2SLS
Percentage of
Corrupt Female Board Members
-2.598** -5.196*
(0.015) (0.085)
Percentage of
Corrupt Female Executives
-3.311** -6.925*
(0.019) (0.058)
Percentage of Corrupt Female
Senior
Executives
-1.491 -4.669*
(0.120) (0.079)
Percentage of Corrupt Female
CEO
-6.128 -8.652
(0.209) (0.266)
Average Board
Age
-0.001 -0.002
(0.254) (0.389)
Average Executives Age
-0.002** -0.002** -0.003 -0.006** -0.006** -0.006*
(0.031) (0.027) (0.112) (0.040) (0.037) (0.077)
Board Size -0.003* -0.002 -0.004*** -0.003 -0.001 0.001 -0.002 -0.001
(0.054) (0.159) (0.005) (0.431) (0.814) (0.847) (0.461) (0.813) Board Gender
Diversity
0.398*** 0.150** 0.090* 0.273 0.771* 0.280* 0.207* 0.379
(0.007) (0.019) (0.074) (0.129) (0.080) (0.069) (0.086) (0.206) Firm Age 0.023*** 0.023*** 0.024*** 0.017 -0.009 -0.009 -0.004 -0.019
(0.000) (0.000) (0.000) (0.226) (0.324) (0.340) (0.646) (0.332)
Firm Size 0.044*** 0.034*** 0.033*** 0.041*** 0.080*** 0.061*** 0.061*** 0.068***
(0.000) (0.000) (0.000) (0.001) (0.000) (0.000) (0.000) (0.000)
Financial
Leverage
-0.297*** -0.290*** -0.261*** -0.225** -0.317*** -0.308*** -0.241** -0.200
(0.000) (0.000) (0.000) (0.017) (0.003) (0.004) (0.013) (0.109)
Sales Growth -0.005 -0.007 -0.002 -0.008 0.008 0.003 0.013 0.006 (0.743) (0.622) (0.902) (0.587) (0.534) (0.840) (0.295) (0.700)
Tangibility 0.094** 0.090** 0.075** 0.097* 0.074 0.069 0.046 0.063 (0.014) (0.015) (0.018) (0.094) (0.227) (0.267) (0.393) (0.462)
Ownership 0.010 0.018 0.006 0.003 0.024 0.039 0.006 0.013
(0.755) (0.592) (0.845) (0.957) (0.536) (0.373) (0.870) (0.818)
R&D Intensity -0.841*** -0.810*** -0.824*** -0.971*** -0.109 -0.039 -0.087 -0.261
(0.000) (0.000) (0.000) (0.000) (0.625) (0.865) (0.654) (0.352)
Country Specific
Controls
Yes Yes Yes Yes Yes Yes Yes Yes
Industry FE Yes Yes Yes Yes Yes Yes Yes Yes
Hansen J
Statistic
0.179 3.832 9.372 0.049 0.528 0.432 2.212 0.833
(P-value) 0.672 0.050 0.002 0.825 0.468 0.511 0.137 0.361
Kleibergen-Paap Wald rk F
statistic
7.727 6.614 6.703 0.907 7.727 6.614 6.703 0.907
Observation 2370 2370 2370 2370 2370 2370 2370 2370
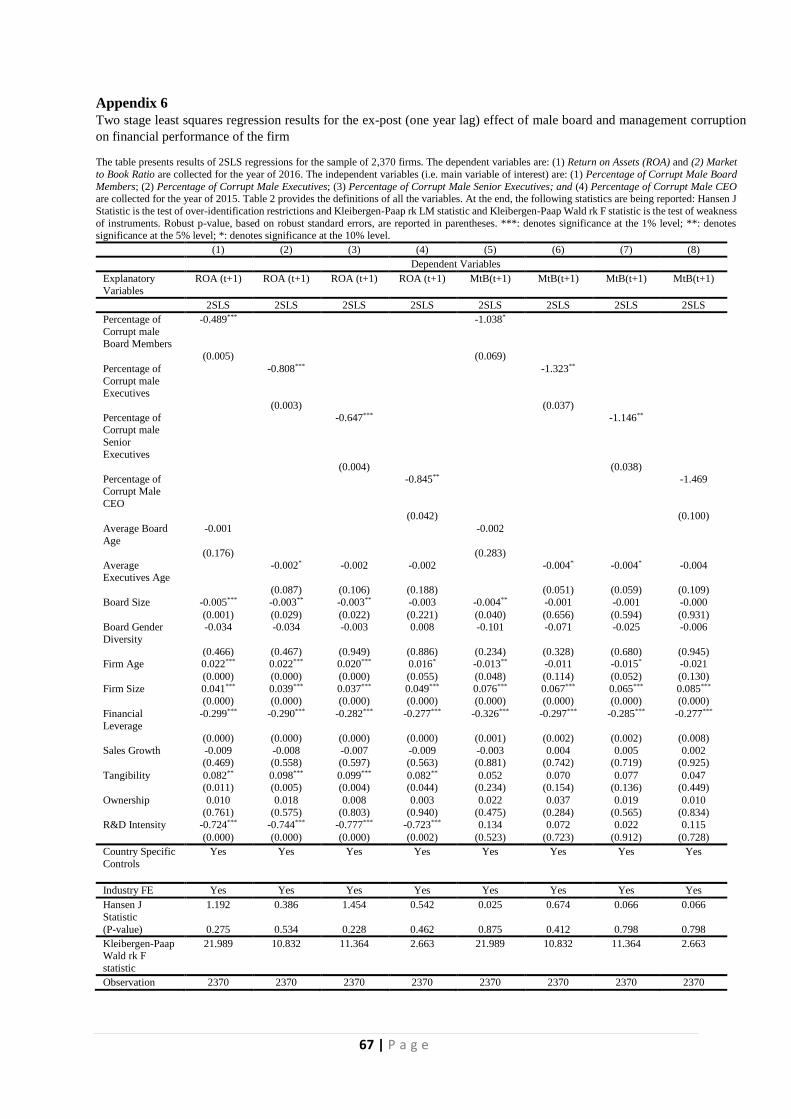
67 | P a g e
Appendix 6
Two stage least squares regression results for the ex-post (one year lag) effect of male board and management corruption
on financial performance of the firm
The table presents results of 2SLS regressions for the sample of 2,370 firms. The dependent variables are: (1) Return on Assets (ROA) and (2) Market
to Book Ratio are collected for the year of 2016. The independent variables (i.e. main variable of interest) are: (1) Percentage of Corrupt Male Board
Members; (2) Percentage of Corrupt Male Executives; (3) Percentage of Corrupt Male Senior Executives; and (4) Percentage of Corrupt Male CEO are collected for the year of 2015. Table 2 provides the definitions of all the variables. At the end, the following statistics are being reported: Hansen J
Statistic is the test of over-identification restrictions and Kleibergen-Paap rk LM statistic and Kleibergen-Paap Wald rk F statistic is the test of weakness
of instruments. Robust p-value, based on robust standard errors, are reported in parentheses. ***: denotes significance at the 1% level; **: denotes significance at the 5% level; *: denotes significance at the 10% level.
(1) (2) (3) (4) (5) (6) (7) (8)
Dependent Variables
Explanatory
Variables
ROA (t+1) ROA (t+1) ROA (t+1) ROA (t+1) MtB(t+1) MtB(t+1) MtB(t+1) MtB(t+1)
2SLS 2SLS 2SLS 2SLS 2SLS 2SLS 2SLS 2SLS
Percentage of
Corrupt male Board Members
-0.489*** -1.038*
(0.005) (0.069)
Percentage of
Corrupt male Executives
-0.808*** -1.323**
(0.003) (0.037)
Percentage of Corrupt male
Senior
Executives
-0.647*** -1.146**
(0.004) (0.038)
Percentage of Corrupt Male
CEO
-0.845** -1.469
(0.042) (0.100)
Average Board
Age
-0.001 -0.002
(0.176) (0.283)
Average Executives Age
-0.002* -0.002 -0.002 -0.004* -0.004* -0.004
(0.087) (0.106) (0.188) (0.051) (0.059) (0.109)
Board Size -0.005*** -0.003** -0.003** -0.003 -0.004** -0.001 -0.001 -0.000
(0.001) (0.029) (0.022) (0.221) (0.040) (0.656) (0.594) (0.931) Board Gender
Diversity
-0.034 -0.034 -0.003 0.008 -0.101 -0.071 -0.025 -0.006
(0.466) (0.467) (0.949) (0.886) (0.234) (0.328) (0.680) (0.945) Firm Age 0.022*** 0.022*** 0.020*** 0.016* -0.013** -0.011 -0.015* -0.021
(0.000) (0.000) (0.000) (0.055) (0.048) (0.114) (0.052) (0.130)
Firm Size 0.041*** 0.039*** 0.037*** 0.049*** 0.076*** 0.067*** 0.065*** 0.085***
(0.000) (0.000) (0.000) (0.000) (0.000) (0.000) (0.000) (0.000)
Financial
Leverage
-0.299*** -0.290*** -0.282*** -0.277*** -0.326*** -0.297*** -0.285*** -0.277***
(0.000) (0.000) (0.000) (0.000) (0.001) (0.002) (0.002) (0.008)
Sales Growth -0.009 -0.008 -0.007 -0.009 -0.003 0.004 0.005 0.002 (0.469) (0.558) (0.597) (0.563) (0.881) (0.742) (0.719) (0.925)
Tangibility 0.082** 0.098*** 0.099*** 0.082** 0.052 0.070 0.077 0.047 (0.011) (0.005) (0.004) (0.044) (0.234) (0.154) (0.136) (0.449)
Ownership 0.010 0.018 0.008 0.003 0.022 0.037 0.019 0.010
(0.761) (0.575) (0.803) (0.940) (0.475) (0.284) (0.565) (0.834)
R&D Intensity -0.724*** -0.744*** -0.777*** -0.723*** 0.134 0.072 0.022 0.115
(0.000) (0.000) (0.000) (0.002) (0.523) (0.723) (0.912) (0.728)
Country Specific
Controls
Yes Yes Yes Yes Yes Yes Yes Yes
Industry FE Yes Yes Yes Yes Yes Yes Yes Yes
Hansen J
Statistic
1.192 0.386 1.454 0.542 0.025 0.674 0.066 0.066
(P-value) 0.275 0.534 0.228 0.462 0.875 0.412 0.798 0.798
Kleibergen-Paap Wald rk F
statistic
21.989 10.832 11.364 2.663 21.989 10.832 11.364 2.663
Observation 2370 2370 2370 2370 2370 2370 2370 2370

68 | P a g e
Appendix 7
Two stage least squares regression results for combined effect of board and management corruption on financial
performance of the firm
The table presents results of 2SLS regression for the sample of 2,370 firms. The dependent variables are: (1) Return on Assets (ROA) and (2)
Market to Book Ratio (MtB). The independent variables (i.e. main variable of interest) are: (1) Combined Executive Board Corruption, a percentage of total corrupt board members and corrupt executives with respect to total board members and executives in the firm; (2) Corrupt
Female Board to Total Female Board, a percentage of corrupt female board members with respect to total female board members in the firm;
and (3) Corrupt Female Executives to Total Female Executives, a percentage of corrupt female executives with respect to total female executives in the firm. Table 2 provides the definitions of all the variables. At the end, the following statistics are being reported: Hansen J Statistic is the
test of over-identification restrictions and Kleibergen-Paap Wald rk F statistic is the test of weakness of instruments. Robust p-value, based on
robust standard errors, are reported in parentheses. ***: denotes significance at the 1% level; **: denotes significance at the 5% level; *: denotes significance at the 10% level.
(1) (2) (3) (4) (5) (6)
Dependent Variables
Explanatory Variables
ROA ROA ROA MtB MtB MtB
2SLS 2SLS 2SLS 2SLS 2SLS 2SLS
Combined Executive
Board Corruption
-0.498*** -0.795**
(0.002) (0.010)
Corrupt Female Board to Total
Female Board
-0.740** -1.126**
(0.014) (0.029) Corrupt Female
Executives to Total
Female Executives
-0.952** -1.364**
(0.027) (0.039)
Average Board Age -0.000 0.001 -0.000 0.001 0.003 0.000
(0.820) (0.405) (0.781) (0.524) (0.188) (0.770) Average Executives
Age
0.000 -0.001 0.001 -0.004*** -0.007*** -0.004**
(0.662) (0.293) (0.464) (0.003) (0.006) (0.021) Board Size -0.005*** -0.001 -0.003 -0.001 0.004 0.001
(0.000) (0.616) (0.116) (0.605) (0.322) (0.791)
Board Gender Diversity
0.097*** 0.308*** 0.172*** 0.056 0.378** 0.165**
(0.000) (0.001) (0.000) (0.213) (0.016) (0.036)
Firm Age 0.017*** 0.016** 0.019*** -0.012** -0.013 -0.010
(0.001) (0.013) (0.007) (0.040) (0.135) (0.272)
Firm Size 0.044*** 0.049*** 0.045*** 0.058*** 0.066*** 0.058*** (0.000) (0.000) (0.000) (0.000) (0.000) (0.000)
Financial Leverage -0.296*** -0.303*** -0.309*** -0.193*** -0.202*** -0.209***
(0.000) (0.000) (0.000) (0.001) (0.004) (0.006) Sales Growth -0.004 -0.002 -0.002 -0.002 0.001 0.001
(0.797) (0.903) (0.869) (0.848) (0.918) (0.949)
Tangibility 0.087*** 0.097*** 0.108*** 0.036 0.049 0.060 (0.000) (0.002) (0.002) (0.281) (0.291) (0.248)
Ownership 0.022 0.024 0.027 0.003 0.006 0.009
(0.217) (0.316) (0.286) (0.921) (0.889) (0.819) R&D Intensity -0.700*** -0.767*** -0.750*** -0.039 -0.143 -0.117
(0.000) (0.000) (0.000) (0.829) (0.522) (0.588)
Country Specific
Controls
Yes Yes Yes Yes Yes Yes
Industry FE Yes Yes Yes Yes Yes Yes
Hansen J Statistic 5.858 0.683 3.040 0.713 0.000 0.488
(P-value) 0.053 0.409 0.081 0.700 0.991 0.485
Kleibergen-Paap
Wald rk F statistic
17.914 6.164 4.356 17.914 6.164 4.356
Observation 2370 2370 2370 2370 2370 2370

69 | P a g e
Appendix 8
Two stage least squares regression results for the influence of board and management corruption on operating and
industry adjusted financial performance of the firm
The table presents results of 2SLS regression for the sample of 2,370 firms. The dependent variables are: (1) Return on Investment (ROI) and (2)
Industry Adjusted ROA (Adj ROA). The independent variables (i.e. main variable of interest) are: (1) Percentage of Corrupt Board Members, a
percentage of corrupt board members with respect to total board members in the firm; (2) Percentage of Corrupt Executives, a percentage of corrupt executives with respect to total executives in the firm; (3) Percentage of Corrupt Senior Executives, a percentage of corrupt senior executives with
respect to total executives in the firm and, (4) Percentage of Corrupt CEO, a percentage of corrupt CEOs with respect to total CEOs in the firm. Table
2 provides the definitions of all the variables. At the end, the following statistics are being reported: Hansen J Statistic is the test of over-identification restrictions and Kleibergen-Paap Wald rk F statistic is the test of weakness of instruments. Robust p-value, based on robust standard errors, are reported
in parentheses. ***: denotes significance at the 1% level; **: denotes significance at the 5% level; *: denotes significance at the 10% level.
(1) (2) (3) (4) (5) (6) (7) (8)
Dependent Variables
Explanatory
Variables
ROI ROI ROI ROI Adj ROA Adj ROA Adj ROA Adj ROA
2SLS 2SLS 2SLS 2SLS 2SLS 2SLS 2SLS 2SLS
Percentage of
Corrupt Board Members
-0.246** -0.379***
(0.011) (0.007)
Percentage of
Corrupt
Executives
-0.565*** -0.556**
(0.005) (0.021)
Percentage of Corrupt Senior
Executives
-0.441*** -0.429**
(0.006) (0.029)
Percentage of
Corrupt CEO
-0.632** -0.622*
(0.042) (0.072)
Average Board
Age
0.000 0.000
(0.902) (0.750)
Average Executives Age
0.000 0.000 0.000 0.000 0.000 0.001
(0.699) (0.695) (0.687) (0.559) (0.556) (0.565) Board Size -0.005*** -0.004*** -0.004*** -0.004** -0.006*** -0.005*** -0.006*** -0.005***
(0.000) (0.000) (0.000) (0.024) (0.000) (0.000) (0.000) (0.008)
Board Gender
Diversity
0.100*** 0.068** 0.087*** 0.101*** 0.089*** 0.057 0.076** 0.090**
(0.000) (0.017) (0.001) (0.006) (0.006) (0.112) (0.026) (0.033)
Firm Age 0.017*** 0.017*** 0.016*** 0.011 0.015** 0.015** 0.014** 0.010
(0.000) (0.000) (0.001) (0.107) (0.014) (0.020) (0.034) (0.253) Firm Size 0.039*** 0.039*** 0.038*** 0.047*** 0.051*** 0.047*** 0.046*** 0.055***
(0.000) (0.000) (0.000) (0.000) (0.000) (0.000) (0.000) (0.000)
Financial Leverage
-0.203*** -0.203*** -0.191*** -0.186*** -0.342*** -0.331*** -0.320*** -0.315***
(0.000) (0.000) (0.000) (0.000) (0.000) (0.000) (0.000) (0.000) Sales Growth -0.004 -0.005 -0.003 -0.005 -0.008 -0.007 -0.005 -0.007
(0.764) (0.690) (0.779) (0.681) (0.771) (0.811) (0.851) (0.796)
Tangibility 0.058*** 0.072*** 0.071*** 0.061** 0.087*** 0.094*** 0.092*** 0.083** (0.002) (0.001) (0.001) (0.031) (0.001) (0.001) (0.002) (0.013)
Ownership 0.021 0.028 0.018 0.014 -0.004 0.004 -0.006 -0.010 (0.166) (0.106) (0.303) (0.535) (0.875) (0.904) (0.827) (0.767)
R&D Intensity -0.763*** -0.757*** -0.785*** -0.754*** -0.680** -0.691** -0.719** -0.689**
(0.000) (0.000) (0.000) (0.000) (0.024) (0.022) (0.017) (0.030)
Country
Specific
Controls
Yes Yes Yes Yes Yes Yes Yes Yes
Industry FE Yes Yes Yes Yes Yes Yes Yes Yes
Hansen J Statistic
1.476 1.485 3.415 0.723 2.866 1.652 3.458 0.857
(P-value) 0.224 0.223 0.065 0.395 0.090 0.199 0.063 0.355
Kleibergen-Paap Wald rk F
statistic
24.780 12.237 13.323 3.230 24.780 12.237 13.323 3.230
Observation 2370 2370 2370 2370 2370 2370 2370 2370

70 | P a g e
Appendix 9 Two stage least squares regression results for the influence of politically exposed board and management on operating
and industry adjusted financial performance of the firm
The table presents results of 2SLS regressions for the sample of 2,370 firms. The dependent variables are: (1) Return on Investment (ROI) and (2) Industry Adjusted ROA (Adj ROA). The independent variables (i.e. main variable of interest) are: (1) Percentage of Politically Exposed Board Members; (2)
Percentage of Politically Exposed Executives; (3) Percentage of Politically Exposed Senior Executives; and (4) Percentage of Politically Exposed CEO.
Table 2 provides the definitions of all the variables. At the end, the following statistics are being reported: Hansen J Statistic is the test of over-identification restrictions and Kleibergen-Paap Wald rk F statistic is the test of weakness of instruments. Robust p-value, based on robust standard errors, are reported in
parentheses. ***: denotes significance at the 1% level; **: denotes significance at the 5% level; *: denotes significance at the 10% level.
(1) (2) (3) (4) (5) (6) (7) (8)
Dependent Variables
Explanatory
Variables
ROI ROI ROI ROI Adj ROA Adj ROA Adj ROA Adj ROA
2SLS 2SLS 2SLS 2SLS 2SLS 2SLS 2SLS 2SLS
Percentage of
Politically
Exposed Board Members
-0.325** -0.501***
(0.014) (0.008)
Percentage of
Politically
Exposed Executives
-0.157** -0.153*
(0.034) (0.068)
Percentage of Senior
Executives
Politically Exposed
-0.595*** -0.578**
(0.010) (0.040)
Percentage of Politically
Exposed CEO
-0.598** -0.585*
(0.027) (0.060) Average Board
Age
-0.000 0.000
(0.885) (0.955) Average
Executives Age
0.000 -0.000 -0.000 0.000 -0.000 -0.000
(0.720) (0.641) (0.722) (0.575) (0.936) (0.978) Board Size -0.005*** -0.011*** -0.005*** -0.005*** -0.007*** -0.012*** -0.006*** -0.006***
(0.000) (0.000) (0.000) (0.001) (0.000) (0.001) (0.000) (0.000)
Board Gender Diversity
0.107*** 0.056* 0.100*** 0.117*** 0.099*** 0.046 0.089** 0.105***
(0.000) (0.096) (0.000) (0.001) (0.002) (0.260) (0.011) (0.008) Firm Age 0.017*** 0.016*** 0.016*** 0.014** 0.016*** 0.014** 0.014** 0.012
(0.000) (0.001) (0.002) (0.022) (0.010) (0.027) (0.037) (0.107)
Firm Size 0.039*** 0.046*** 0.039*** 0.045*** 0.051*** 0.053*** 0.047*** 0.052***
(0.000) (0.000) (0.000) (0.000) (0.000) (0.000) (0.000) (0.000)
Financial Leverage
-0.201*** -0.218*** -0.190*** -0.194*** -0.339*** -0.346*** -0.318*** -0.322***
(0.000) (0.000) (0.000) (0.000) (0.000) (0.000) (0.000) (0.000)
Sales Growth -0.003 0.001 -0.001 0.001 -0.007 -0.001 -0.003 -0.001
(0.803) (0.932) (0.922) (0.916) (0.796) (0.969) (0.910) (0.980)
Tangibility 0.060*** 0.065*** 0.084*** 0.076*** 0.089*** 0.087*** 0.105*** 0.098***
(0.001) (0.001) (0.001) (0.007) (0.001) (0.001) (0.002) (0.005)
Ownership 0.022 0.008 0.023 0.023 -0.003 -0.016 -0.001 -0.001
(0.144) (0.628) (0.193) (0.256) (0.927) (0.576) (0.984) (0.979)
R&D Intensity -0.761*** -0.669*** -0.787*** -0.700*** -0.677** -0.607* -0.721** -0.637**
(0.000) (0.000) (0.000) (0.000) (0.024) (0.062) (0.017) (0.047)
Country Specific
Controls
Yes Yes Yes Yes Yes Yes Yes Yes
Industry FE Yes Yes Yes Yes Yes Yes Yes Yes
Hansen J
Statistic
1.199 3.366 3.385 1.609 2.322 3.217 3.263 1.729
(P-value) 0.274 0.067 0.066 0.205 0.128 0.073 0.071 0.189
Kleibergen-Paap
Wald rk F
statistic
19.235 4.174 9.625 4.460 19.235 4.174 9.625 4.460
Observation 2370 2370 2370 2370 2370 2370 2370 2370

71 | P a g e
Appendix 10
Two stage least squares regression results for the influence of female board and management corruption on operating
and industry adjusted financial performance of the firm
The table presents results of 2SLS regressions for the sample of 2,370 firms. The dependent variables are: (1) Return on Investment (ROI) and (2)
Industry Adjusted ROA (Adj ROA). The independent variables (i.e. main variable of interest) are: (1) Percentage of Corrupt Female Board Members;
(2) Percentage of Corrupt Female Executives; (3) Percentage of Corrupt Female Senior Executives; and (4) Percentage of Corrupt Female CEO. Table 2 provides the definitions of all the variables. At the end, the following statistics are being reported: Hansen J Statistic is the test of over-
identification restrictions and Kleibergen-Paap Wald rk F statistic is the test of weakness of instruments. Robust p-value, based on robust standard
errors, are reported in parentheses. ***: denotes significance at the 1% level; **: denotes significance at the 5% level; *: denotes significance at the 10% level.
(1) (2) (3) (4) (5) (6) (7) (8)
Dependent Variables
Explanatory Variables
ROI ROI ROI ROI Adj ROA Adj ROA Adj ROA Adj ROA
2SLS 2SLS 2SLS 2SLS 2SLS 2SLS 2SLS 2SLS
Percentage of Corrupt Female
Board
Members
-1.579** -2.443**
(0.024) (0.018)
Percentage of
Corrupt Female Executives
-2.622** -2.510*
(0.021) (0.075)
Percentage of Corrupt Female
Senior
Executives
-1.021 -0.893
(0.163) (0.335)
Percentage of
Corrupt Female CEO
-5.281 -5.282
(0.210) (0.228)
Average Board Age
0.000 0.000
(0.819) (0.685)
Average Executives Age
-0.000 -0.000 -0.001 0.000 0.000 -0.000
(0.825) (0.923) (0.711) (0.916) (0.794) (0.851)
Board Size -0.004*** -0.004*** -0.005*** -0.004 -0.005*** -0.005*** -0.006*** -0.005
(0.000) (0.006) (0.000) (0.225) (0.001) (0.003) (0.000) (0.124)
Board Gender Diversity
0.321*** 0.188*** 0.136*** 0.302* 0.430*** 0.173*** 0.120*** 0.291*
(0.001) (0.000) (0.000) (0.052) (0.003) (0.004) (0.007) (0.076)
Firm Age 0.018*** 0.017*** 0.017*** 0.012 0.017** 0.015** 0.015** 0.010 (0.000) (0.001) (0.000) (0.319) (0.016) (0.024) (0.016) (0.435)
Firm Size 0.040*** 0.036*** 0.034*** 0.042*** 0.053*** 0.044*** 0.042*** 0.050***
(0.000) (0.000) (0.000) (0.000) (0.000) (0.000) (0.000) (0.000) Financial
Leverage
-0.202*** -0.201*** -0.179*** -0.147** -0.341*** -0.329*** -0.308*** -0.275***
(0.000) (0.000) (0.000) (0.025) (0.000) (0.000) (0.000) (0.000) Sales Growth -0.001 -0.004 0.001 -0.005 -0.004 -0.005 -0.001 -0.007
(0.925) (0.758) (0.957) (0.708) (0.874) (0.845) (0.961) (0.809)
Tangibility 0.065*** 0.065*** 0.052*** 0.072 0.097*** 0.086*** 0.074*** 0.095* (0.003) (0.009) (0.007) (0.119) (0.003) (0.006) (0.006) (0.060)
Ownership 0.021 0.027 0.018 0.014 -0.004 0.003 -0.005 -0.010
(0.205) (0.149) (0.257) (0.685) (0.898) (0.920) (0.854) (0.809) R&D Intensity -0.822*** -0.802*** -0.811*** -0.941*** -0.771** -0.736** -0.743** -0.875***
(0.000) (0.000) (0.000) (0.000) (0.012) (0.016) (0.013) (0.007)
Country
Specific
Controls
Yes Yes Yes Yes Yes Yes Yes Yes
Industry FE Yes Yes Yes Yes Yes Yes Yes Yes
Hansen J
Statistic
0.506 4.998 10.292 0.008 0.922 4.544 7.294 0.000
(P-value) 0.477 0.025 0.001 0.930 0.337 0.033 0.007 0.983
Kleibergen-
Paap Wald rk F
statistic
7.727 6.614 6.703 0.907 7.727 6.614 6.703 0.907
Observation 2370 2370 2370 2370 2370 2370 2370 2370

72 | P a g e
Appendix 11
Three stage least squares and OLS regression results for the influence of board and management corruption on long-
term (Market to Book Ratio) financial performance of the firm
The table presents results of 3SLS and OLS regressions for the sample of 2,370 firms. The dependent variable is: (1) Market to Book Ratio (MtB).
The independent variables (i.e. main variable of interest) are: (1) Percentage of Corrupt Board Members, a percentage of corrupt board members
with respect to total board members in the firm; (2) Percentage of Corrupt Executives, a percentage of corrupt executives with respect to total executives in the firm; (3) Percentage of Corrupt Senior Executives, a percentage of corrupt senior executives with respect to total executives in the
firm and, (4) Percentage of Corrupt CEO, a percentage of corrupt CEOs with respect to total CEOs in the firm. Table 2 provides the definitions of
all the variables. Robust p-value, based on robust standard errors, are reported in parentheses. ***: denotes significance at the 1% level; **: denotes significance at the 5% level; *: denotes significance at the 10% level.
(1) (2) (3) (4) (5) (6) (7) (8)
Dependent Variable
Explanatory Variables
MtB MtB MtB MtB MtB MtB MtB MtB
3SLS 3SLS 3SLS 3SLS OLS OLS OLS OLS
Percentage of
Corrupt Board
Members
-0.599*** -0.134***
(0.000) (0.005)
Percentage of
Corrupt
Executives
-0.862*** -0.133**
(0.001) (0.032) Percentage of
Corrupt Senior
Executives
-0.830*** -0.080**
(0.000) (0.044)
Percentage of
Corrupt CEO
-0.993** -0.017
(0.017) (0.341)
Average Board
Age
-0.001 -0.002*
(0.287) (0.096)
Average Executives Age
-0.003*** -0.003*** -0.004*** -0.003** -0.003** -0.003**
(0.001) (0.001) (0.007) (0.012) (0.012) (0.012) Board Size -0.004** -0.001 -0.002 -0.002 -0.003** -0.003** -0.003** -0.003**
(0.036) (0.410) (0.259) (0.532) (0.022) (0.049) (0.042) (0.037)
Board Gender
Diversity
0.068 -0.015 0.019 0.059 0.060 0.057 0.062 0.065
(0.104) (0.746) (0.671) (0.341) (0.162) (0.179) (0.142) (0.127) Firm Age -0.012* -0.018*** -0.018** -0.019* -0.014** -0.013** -0.013** -0.014**
(0.064) (0.009) (0.012) (0.070) (0.013) (0.019) (0.018) (0.017) Firm Size 0.064*** 0.058*** 0.059*** 0.071*** 0.051*** 0.048*** 0.048*** 0.047***
(0.000) (0.000) (0.000) (0.000) (0.000) (0.000) (0.000) (0.000)
Financial Leverage
-0.195*** -0.218*** -0.197*** -0.167*** -0.164*** -0.161*** -0.158*** -0.156***
(0.000) (0.000) (0.000) (0.001) (0.006) (0.007) (0.007) (0.008) Sales Growth -0.004 0.000 0.001 -0.004 0.005 0.006 0.007 0.007
(0.678) (0.966) (0.921) (0.805) (0.647) (0.578) (0.545) (0.509)
Tangibility 0.015 0.042 0.041 0.027 -0.003 0.001 -0.001 -0.005 (0.622) (0.202) (0.231) (0.544) (0.921) (0.980) (0.978) (0.867)
Ownership -0.003 -0.036 -0.045* -0.017 -0.005 -0.004 -0.006 -0.005
(0.919) (0.167) (0.089) (0.652) (0.863) (0.903) (0.849) (0.870)
R&D Intensity -0.017 -0.031 -0.054 -0.047 -0.075 -0.089 -0.096 -0.097
(0.903) (0.833) (0.717) (0.821) (0.683) (0.627) (0.599) (0.596)
Country
Specific Controls
Yes Yes Yes Yes Yes Yes Yes Yes
Industry FE Yes Yes Yes Yes Yes Yes Yes Yes
Observations 2370 2370 2370 2370 2370 2370 2370 2370

73 | P a g e
Appendix 12
Three stage least squares and OLS regression results for the influence of board and management corruption on short-
term (Return on Assets) financial performance of the firm
The table presents results of 3SLS and OLS regressions for the sample of 2,370 firms. The dependent variable is: (1) Return on Assets (ROA). The
independent variables (i.e. main variable of interest) are: (1) Percentage of Corrupt Board Members, a percentage of corrupt board members with
respect to total board members in the firm; (2) Percentage of Corrupt Executives, a percentage of corrupt executives with respect to total executives in the firm; (3) Percentage of Corrupt Senior Executives, a percentage of corrupt senior executives with respect to total executives in the firm and,
(4) Percentage of Corrupt CEO, a percentage of corrupt CEOs with respect to total CEOs in the firm. Table 2 provides the definitions of all the
variables. Robust p-value, based on robust standard errors, are reported in parentheses. ***: denotes significance at the 1% level; **: denotes significance at the 5% level; *: denotes significance at the 10% level.
(1) (2) (3) (4) (5) (6) (7) (8)
Dependent Variable
Explanatory
Variables
ROA ROA ROA ROA ROA ROA ROA ROA
3SLS 3SLS 3SLS 3SLS OLS OLS OLS OLS
Percentage of
Corrupt Board
Members
-0.675*** -0.062***
(0.000) (0.001)
Percentage of Corrupt
Executives
-1.012*** -0.055*
(0.000) (0.070) Percentage of
Corrupt Senior
Executives
-0.839*** -0.037*
(0.000) (0.093)
Percentage of
Corrupt CEO
-0.012 -0.012
(0.294) (0.298)
Average Board Age
0.000 -0.000
(0.701) (0.643)
Average
Executives Age
0.001 0.001 0.001 0.001 0.001 0.001
(0.384) (0.433) (0.366) (0.359) (0.358) (0.355)
Board Size -0.006*** -0.004*** -0.005*** -0.006*** -0.006*** -0.006*** -0.006*** -0.006***
(0.000) (0.004) (0.001) (0.000) (0.000) (0.000) (0.000) (0.000)
Board Gender
Diversity
0.098*** 0.007 0.053 0.103*** 0.102*** 0.101*** 0.103*** 0.104***
(0.002) (0.863) (0.164) (0.000) (0.000) (0.000) (0.000) (0.000) Firm Age 0.018*** 0.012** 0.012** 0.016*** 0.017*** 0.016*** 0.016*** 0.016***
(0.001) (0.049) (0.040) (0.001) (0.000) (0.001) (0.001) (0.001)
Firm Size 0.055*** 0.050*** 0.049*** 0.037*** 0.039*** 0.038*** 0.037*** 0.037***
(0.000) (0.000) (0.000) (0.000) (0.000) (0.000) (0.000) (0.000)
Financial Leverage
-0.331*** -0.342*** -0.312*** -0.272*** -0.278*** -0.274*** -0.273*** -0.272***
(0.000) (0.000) (0.000) (0.000) (0.000) (0.000) (0.000) (0.000)
Sales Growth -0.011 -0.007 -0.005 0.002 0.001 0.002 0.002 0.002
(0.128) (0.430) (0.566) (0.883) (0.943) (0.903) (0.893) (0.879)
Tangibility 0.101*** 0.118*** 0.110*** 0.062*** 0.066*** 0.065*** 0.064*** 0.063***
(0.000) (0.000) (0.000) (0.001) (0.001) (0.001) (0.001) (0.001)
Ownership 0.005 -0.007 -0.015 0.018 0.016 0.018 0.017 0.017 (0.782) (0.756) (0.521) (0.297) (0.334) (0.288) (0.312) (0.303)
R&D Intensity -0.657*** -0.668*** -0.704*** -0.740*** -0.728*** -0.737*** -0.740*** -0.740*** (0.000) (0.000) (0.000) (0.000) (0.000) (0.000) (0.000) (0.000)
Country
Specific
Controls
Yes Yes Yes Yes Yes Yes Yes Yes
Industry FE Yes Yes Yes Yes Yes Yes Yes Yes
Observations 2370 2370 2370 2370 2370 2370 2370 2370

74 | P a g e
Appendix 13 Three stage least squares and OLS regression results for the effect of politically exposed board and management on
long-term (Market to Book Ratio) financial performance of the firm
The table presents results of 3SLS and OLS regressions for the sample of 2,370 firms. The dependent variable is: (1) Market to Book Ratio (MtB).
The independent variables (i.e. main variable of interest) are: (1) Percentage of Politically Exposed Board Members; (2) Percentage of Politically Exposed Executives; (3) Percentage of Politically Exposed Senior Executives; and (4) Percentage of Politically Exposed CEO. Table 2 provides the
definitions of all the variables. Robust p-value, based on robust standard errors, are reported in parentheses. ***: denotes significance at the 1% level;
**: denotes significance at the 5% level; *: denotes significance at the 10% level.
(1) (2) (3) (4) (5) (6) (7) (8)
Dependent Variables
Explanatory Variables
MtB MtB MtB MtB MtB MtB MtB MtB
3SLS 3SLS 3SLS 3SLS OLS OLS OLS OLS
Percentage of
Politically
Exposed Board Members
-0.755*** -0.107***
(0.000) (0.009)
Percentage of
Politically
Exposed Executives
-0.283*** -0.016**
(0.001) (0.014) Percentage of
Senior
Executives Politically
Exposed
-1.256*** -0.033
(0.000) (0.175)
Percentage of
Politically Exposed CEO
-1.068*** -0.007
(0.004) (0.577)
Average Board Age
-0.002 -0.002*
(0.141) (0.076) Average
Executives Age
-0.004*** -0.005*** -0.005*** -0.003** -0.003** -0.003**
(0.000) (0.000) (0.000) (0.012) (0.012) (0.012)
Board Size -0.004** -0.013*** -0.003* -0.003 -0.003** -0.003** -0.003** -0.003**
(0.041) (0.000) (0.093) (0.139) (0.024) (0.012) (0.036) (0.036)
Board Gender
Diversity
0.085** 0.003 0.042 0.087 0.062 0.060 0.064 0.065
(0.049) (0.951) (0.364) (0.126) (0.149) (0.155) (0.127) (0.126)
Firm Age -0.012* -0.011 -0.015** -0.014 -0.014** -0.013** -0.013** -0.014**
(0.085) (0.153) (0.042) (0.119) (0.014) (0.018) (0.018) (0.017)
Firm Size 0.063*** 0.070*** 0.063*** 0.070*** 0.050*** 0.048*** 0.047*** 0.047***
(0.000) (0.000) (0.000) (0.000) (0.000) (0.000) (0.000) (0.000) Financial
Leverage
-0.189*** -0.216*** -0.195*** -0.182*** -0.159*** -0.160*** -0.156*** -0.156***
(0.000) (0.000) (0.000) (0.000) (0.007) (0.007) (0.008) (0.008)
Sales Growth -0.002 0.007 0.004 0.007 0.006 0.008 0.007 0.008
(0.841) (0.485) (0.673) (0.542) (0.573) (0.500) (0.507) (0.499) Tangibility 0.018 0.026 0.069* 0.052 -0.005 -0.003 -0.003 -0.005
(0.559) (0.456) (0.080) (0.241) (0.864) (0.908) (0.913) (0.866)
Ownership -0.002 -0.024 -0.030 -0.002 -0.004 -0.006 -0.005 -0.005
(0.936) (0.424) (0.285) (0.954) (0.884) (0.836) (0.876) (0.876)
R&D Intensity -0.027 0.106 -0.027 0.081 -0.081 -0.085 -0.098 -0.097 (0.852) (0.533) (0.864) (0.677) (0.659) (0.641) (0.592) (0.595)
Country Specific
Controls
Yes Yes Yes Yes Yes Yes Yes Yes
Industry FE Yes Yes Yes Yes Yes Yes Yes Yes
Observations 2370 2370 2370 2370 2370 2370 2370 2370

75 | P a g e
Appendix 14
Three stage least squares and OLS regression results for the effect of politically exposed board and management on
short-term (Return on Assets) financial performance of the firm
The table presents results of 3SLS and OLS regressions for the sample of 2,370 firms. The dependent variable is: (1) Return on Assets (ROA). The
independent variables (i.e. main variable of interest) are: (1) Percentage of Politically Exposed Board Members; (2) Percentage of Politically Exposed
Executives; (3) Percentage of Politically Exposed Senior Executives; and (4) Percentage of Politically Exposed CEO. Table 2 provides the definitions of all the variables. Robust p-value, based on robust standard errors, are reported in parentheses. ***: denotes significance at the 1% level; **: denotes
significance at the 5% level; *: denotes significance at the 10% level.
(1) (2) (3) (4) (5) (6) (7) (8)
Dependent Variables
Explanatory
Variables
ROA ROA ROA ROA ROA ROA ROA ROA
3SLS 3SLS 3SLS 3SLS OLS OLS OLS OLS
Percentage of
Politically Exposed Board
Members
-0.858*** -0.068***
(0.000) (0.001)
Percentage of
Politically Exposed
Executives
-0.290*** -0.006
(0.000) (0.129)
Percentage of
Senior Executives
Politically
Exposed
-0.960*** 0.006
(0.000) (0.742)
Percentage of Politically
Exposed CEO
-0.760*** 0.002
(0.005) (0.838) Average Board
Age
-0.000 -0.000
(0.828) (0.590)
Average
Executives Age
0.000 -0.000 -0.000 0.001 0.001 0.001
(0.826) (0.707) (0.675) (0.358) (0.351) (0.355)
Board Size -0.007*** -0.017*** -0.006*** -0.006*** -0.006*** -0.006*** -0.006*** -0.006***
(0.000) (0.000) (0.000) (0.000) (0.000) (0.000) (0.000) (0.000)
Board Gender Diversity
0.117*** 0.034 0.083** 0.116*** 0.103*** 0.103*** 0.104*** 0.104***
(0.000) (0.462) (0.022) (0.006) (0.000) (0.000) (0.000) (0.000) Firm Age 0.020*** 0.018*** 0.015** 0.015** 0.017*** 0.016*** 0.016*** 0.016***
(0.000) (0.005) (0.012) (0.025) (0.000) (0.001) (0.001) (0.001)
Firm Size 0.056*** 0.061*** 0.049*** 0.053*** 0.039*** 0.037*** 0.037*** 0.037***
(0.000) (0.000) (0.000) (0.000) (0.000) (0.000) (0.000) (0.000)
Financial
Leverage
-0.322*** -0.335*** -0.302*** -0.291*** -0.277*** -0.274*** -0.272*** -0.272***
(0.000) (0.000) (0.000) (0.000) (0.000) (0.000) (0.000) (0.000)
Sales Growth -0.009 0.002 -0.000 0.002 0.001 0.002 0.002 0.002
(0.209) (0.849) (0.964) (0.816) (0.925) (0.873) (0.872) (0.873)
Tangibility 0.101*** 0.097*** 0.121*** 0.104*** 0.065*** 0.063*** 0.062*** 0.062***
(0.000) (0.001) (0.000) (0.001) (0.001) (0.001) (0.001) (0.001)
Ownership 0.012 -0.001 0.003 0.021 0.017 0.017 0.018 0.018
(0.556) (0.976) (0.907) (0.400) (0.324) (0.316) (0.298) (0.298)
R&D Intensity -0.642*** -0.533*** -0.693*** -0.617*** -0.729*** -0.736*** -0.741*** -0.741***
(0.000) (0.000) (0.000) (0.000) (0.000) (0.000) (0.000) (0.000)
Country Specific
Controls
Yes Yes Yes Yes Yes Yes Yes Yes
Industry FE Yes Yes Yes Yes Yes Yes Yes Yes
Observations 2370 2370 2370 2370 2370 2370 2370 2370

76 | P a g e
Appendix 15
Three stage least squares and OLS regression results for the effect of female board and management corruption on long-
term (Market to Book ratio) financial performance of the firm
The table presents results of 3SLS and OLS regressions for the sample of 2,370 firms. The dependent variable is: (1) Market to Book Ratio, a ratio of
market value of firm to book value of total assets. The independent variables (i.e. main variable of interest) are: (1) Percentage of Corrupt Female
Board Members; (2) Percentage of Corrupt Female Executives; (3) Percentage of Corrupt Female Senior Executives; and (4) Percentage of Corrupt Female CEO. Table 2 provides the definitions of all the variables. Robust p-value, based on robust standard errors, are reported in parentheses. ***:
denotes significance at the 1% level; **: denotes significance at the 5% level; *: denotes significance at the 10% level.
(1) (2) (3) (4) (5) (6) (7) (8)
Dependent Variables
Explanatory
Variables
MtB MtB MtB MtB MtB MtB MtB MtB
3SLS 3SLS 3SLS 3SLS OLS OLS OLS OLS
Percentage of
Corrupt Female
Board Members
-3.572*** -0.220**
(0.003) (0.019)
Percentage of
Corrupt Female
Executives
-4.744** -0.043
(0.013) (0.635)
Percentage of
Corrupt Female Senior
Executives
-3.298** 0.029
(0.027) (0.606)
Percentage of
Corrupt Female CEO
-7.306 -0.023
(0.140) (0.546)
Average Board
Age
-0.001 -0.002*
(0.331) (0.074)
Average
Executives Age
-0.004*** -0.004*** -0.004* -0.003** -0.003** -0.003**
(0.002) (0.000) (0.057) (0.012) (0.013) (0.012)
Board Size -0.002 -0.000 -0.002 -0.002 -0.003** -0.003** -0.003** -0.003**
(0.390) (0.884) (0.240) (0.595) (0.032) (0.038) (0.036) (0.037) Board Gender
Diversity
0.559*** 0.210** 0.166** 0.345* 0.090** 0.066 0.064 0.065
(0.001) (0.010) (0.016) (0.098) (0.038) (0.119) (0.132) (0.123) Firm Age -0.011 -0.016* -0.011 -0.019 -0.014** -0.013** -0.014** -0.014**
(0.192) (0.062) (0.166) (0.191) (0.013) (0.018) (0.017) (0.018)
Firm Size 0.066*** 0.052*** 0.053*** 0.061*** 0.049*** 0.047*** 0.047*** 0.047*** (0.000) (0.000) (0.000) (0.000) (0.000) (0.000) (0.000) (0.000)
Financial Leverage
-0.194*** -0.209*** -0.160*** -0.109 -0.156*** -0.156*** -0.156*** -0.156***
(0.000) (0.000) (0.000) (0.190) (0.008) (0.008) (0.008) (0.008)
Sales Growth 0.002 0.000 0.007 0.000 0.007 0.008 0.008 0.008
(0.842) (0.982) (0.510) (0.986) (0.511) (0.504) (0.499) (0.501)
Tangibility 0.032 0.032 0.014 0.020 -0.007 -0.005 -0.005 -0.005
(0.386) (0.415) (0.696) (0.765) (0.816) (0.865) (0.852) (0.859)
Ownership -0.005 -0.023 -0.043 -0.025 -0.004 -0.005 -0.005 -0.005
(0.874) (0.468) (0.153) (0.645) (0.885) (0.878) (0.880) (0.875)
R&D Intensity -0.158 -0.119 -0.140 -0.270 -0.096 -0.099 -0.098 -0.099
(0.344) (0.499) (0.389) (0.415) (0.604) (0.590) (0.592) (0.588)
Country Specific
Controls
Yes Yes Yes Yes Yes Yes Yes Yes
Industry FE Yes Yes Yes Yes Yes Yes Yes Yes
Observations 2370 2370 2370 2370 2370 2370 2370 2370

77 | P a g e
Appendix 16
Three stage least squares and OLS regression results for the effect of female board and management corruption on short-
term (Return on Assets) financial performance of the firm
The table presents results of 3SLS and OLS regressions for the sample of 2,370 firms. The dependent variable is: (1) Return on Assets (ROA). The
independent variables (i.e. main variable of interest) are: (1) Percentage of Corrupt Female Board Members; (2) Percentage of Corrupt Female
Executives; (3) Percentage of Corrupt Female Senior Executives; and (4) Percentage of Corrupt Female CEO. Table 2 provides the definitions of all the variables. Robust p-value, based on robust standard errors, are reported in parentheses. ***: denotes significance at the 1% level; **: denotes
significance at the 5% level; *: denotes significance at the 10% level.
(1) (2) (3) (4) (5) (6) (7) (8)
Dependent Variables
Explanatory
Variables
ROA ROA ROA ROA ROA ROA ROA ROA
3SLS 3SLS 3SLS 3SLS OLS OLS OLS OLS
Percentage of Corrupt Female
Board Members
-5.154*** -0.050
(0.000) (0.293)
Percentage of
Corrupt Female
Executives
-3.019** 0.036
(0.019) (0.575) Percentage of
Corrupt Female
Senior Executives
-0.396 0.052
(0.661) (0.149)
Percentage of
Corrupt Female CEO
-8.492* -0.019
(0.091) (0.331)
Average Board
Age
0.001 -0.000
(0.429) (0.560)
Average
Executives Age
0.000 0.000 0.000 0.001 0.001 0.001
(0.836) (0.554) (0.886) (0.351) (0.341) (0.359)
Board Size -0.004* -0.004*** -0.006*** -0.005 -0.006*** -0.006*** -0.006*** -0.006***
(0.057) (0.009) (0.000) (0.182) (0.000) (0.000) (0.000) (0.000)
Board Gender
Diversity
0.863*** 0.194*** 0.117*** 0.399* 0.109*** 0.103*** 0.103*** 0.105***
(0.000) (0.000) (0.005) (0.061) (0.000) (0.000) (0.000) (0.000) Firm Age 0.021*** 0.014** 0.016*** 0.008 0.017*** 0.016*** 0.016*** 0.016***
(0.003) (0.022) (0.001) (0.595) (0.000) (0.001) (0.001) (0.001) Firm Size 0.062*** 0.040*** 0.038*** 0.054*** 0.037*** 0.037*** 0.037*** 0.037***
(0.000) (0.000) (0.000) (0.000) (0.000) (0.000) (0.000) (0.000)
Financial
Leverage
-0.325*** -0.308*** -0.273*** -0.225*** -0.274*** -0.272*** -0.273*** -0.272***
(0.000) (0.000) (0.000) (0.008) (0.000) (0.000) (0.000) (0.000)
Sales Growth -0.005 -0.002 0.002 -0.006 0.002 0.002 0.002 0.002 (0.621) (0.793) (0.701) (0.763) (0.883) (0.869) (0.871) (0.874)
Tangibility 0.115*** 0.087*** 0.064*** 0.097 0.063*** 0.062*** 0.062*** 0.062*** (0.001) (0.002) (0.001) (0.160) (0.001) (0.001) (0.001) (0.001)
Ownership 0.001 0.004 0.013 0.003 0.017 0.018 0.018 0.018
(0.979) (0.858) (0.464) (0.956) (0.322) (0.300) (0.291) (0.299)
R&D Intensity -0.827*** -0.757*** -0.746*** -0.955*** -0.737*** -0.741*** -0.740*** -0.741***
(0.000) (0.000) (0.000) (0.005) (0.000) (0.000) (0.000) (0.000)
Country
Specific Controls
Yes Yes Yes Yes Yes Yes Yes Yes
Industry FE Yes Yes Yes Yes Yes Yes Yes Yes
Observations 2370 2370 2370 2370 2370 2370 2370 2370


![Solicitor Firm Agreement - Sutter Health · Solicitor Firm Agreement [For Solicitor Firms Receiving Commission Compensation] ... 1. Appointment of Solicitor Firm. SHP appoints Solicitor](https://img.pdfslide.us/doc/110x75/5e03c1759ffc96763318b0b7/solicitor-firm-agreement-sutter-health-solicitor-firm-agreement-for-solicitor.jpg)