Embed Size (px)
Citation preview

The Growth Process in Firms:
Job Creation by Firm Age
Growth Firms Project: Phase IV
David Halabisky
November 2006

This publication is available upon request in accessible formats. Contact: Multimedia Services Section Communications and Marketing Branch Industry Canada Room 264D, West Tower 235 Queen Street Ottawa ON K1A 0H5 Tel.: 613-948-1554 Fax: 613-947-7155 Email: [email protected] This publication is also available electronically on the World Wide Web at the following address: www.strategis.gc.ca/sbresearch/growthfirms Permission to Reproduce Except as otherwise specifically noted, the information in this publication may be reproduced, in part or in whole and by any means, without charge or further permission from Industry Canada, provided that due diligence is exercised in ensuring the accuracy of the information reproduced; that Industry Canada is identified as the source institution; and that the reproduction is not represented as an official version of the information reproduced, nor as having been made in affiliation with, or with the endorsement of, Industry Canada. For permission to reproduce the information in this publication for commercial redistribution, please email: [email protected] Cat. No. Iu188-35/2007E-PDF ISBN 978-0-662-44873-0 60164 Aussi offert en français sous le titre Le processus de croissance des entreprises : la création d'emplois selon l'âge des entreprises.

Growth Firms Phase IV 2
SUMMARY
Industry Canada’s Small Business Policy Branch recently undertook the fourth
phase of its ongoing Growth Firms Project. The study’s goal was to examine job creation
over the 1993 to 2003 period and to confirm previous results, including a follow-up
investigation of whether growth is disproportionately concentrated in any particular
industry. Additionally, new work examined firm survival by firm size and growth
category, the ability to maintain growth and job creation by firm age.
Although this study covered 1993 to 2003, the results confirmed many earlier
findings that covered the 1985 to 1999 period, suggesting that many of the conclusions
are not specific to any time period or segment of the business cycle.
Some key results that confirm earlier work include:
• Firms continually enter and exit the market and this churn resulted in more
than half of the net jobs created between 1993 and 2003.
• Hyper growth firms were responsible for nearly half of net job creation by
continuing firms even though they accounted for only 4.4 percent of
continuing firms.
• Although small businesses accounted for 80 percent of net job creation,
high growth was not limited to micro or small firms.
• Growth did not appear to be disproportionately concentrated in any
particular industry.
Furthermore, new results include:
• The bulk of net job creation comes from very young firms, while the
oldest firms shed the most jobs.
• Approximately 15 percent of hyper and strong growth firms maintained a
high level of growth over the full 10-year observation period.
• Among micro firms, strong growth firms had the highest survival rates,
but for all other firm sizes, slow growth firms had the highest survival
rates.
Growth Firms Phase IV 3
Table of Contents
1. Introduction 4
2. Data and Methodology 5
2.1. Data 5
2.2. Methodology 6
3. Results 7
3.1. National Job Creation 7
3.2. Job Creation by Firm Size and Growth Category 8
3.3. Job Creation by Industry 9
3.4. Firm Survival Rates 9
3.5. Firm Survival Rates by Growth Category 11
3.6. Ability to Maintain Growth Over the Medium-term 12
3.7. Job creation by Firm Age 14
4. Discussion 16
5. Conclusions 18
6. Appendix I: Additional Results 20
6.1. Job Creation by Industry 20
6.2. Job Creation by Firm Size 22
6.3. Changes in Firm Size for Hyper and Strong Growth Firms, by Age 23

Growth Firms Phase IV 4
Key Results of Phase IV: Firm Survival and Job Creation by Firm Age
Introduction
The Canadian economy underwent some significant changes during the 1990s,
changing the environment in which Canadian businesses operated. Canada made great
strides in eliminating its national deficit and reduced its debt burden to the lowest level
among G7 countries. The unemployment rate fell after a small recession in the early
1990s and Canada’s level of international trade more than doubled as a number of trade
liberalization treaties came into full effect. These factors and others combine to present
new opportunities and challenges for Canadian businesses.
The ongoing Growth Firms Project of Industry Canada’s Small Business Policy
Branch aims to look at how firms grow and, more specifically, at the job creation process.
This fourth phase of the project examines job creation and firm turnover at the national
level over the 1993 to 2003 period and compares the results with earlier findings that
covered the 1985 to 1999 period. This study also follows up on earlier work by looking at
job creation at the industry level. Additionally, in order to investigate the link between
firm growth and the firm life cycle, the study looks at firm survival, the ability of firms to
maintain growth over time and job creation by firm age.
This study was conducted with Statistics Canada’s Science Innovation and
Electronic Information Division and aims to answer the following questions:
• Who are the growth firms?
• What is the contribution of growth firms to overall job creation?
• How significant is churning (the process of firm entry and exit) to job
creation?
• Is growth confined to certain industries or regions?
• Are fast-growing firms more likely to survive longer than slower growing
firms?
• Are high-growth firms able to maintain their growth over an extended time
period?
• Do young firms create more jobs than established firms?

Growth Firms Phase IV 5
This report begins with a discussion of the data and methodology used, followed
by overall job creation results. Then, results on firm survival and job creation by firm age
are presented, followed by a discussion of results and conclusions.
Although this work is limited to providing diagnostic statistics, there are strong
policy ties. This research provides new evidence on where growth occurs, and dispels the
myth that high-growth firms are only high-technology and high-knowledge companies.
However, it also raises questions about the growth process itself and how policy should
encourage growth. Informing policy-makers and the academic community with baseline
data and facts is a necessary first step in identifying potential barriers to growth that
government can address.
Data and Methodology Data
As in earlier phases of the Growth Firms Project, the data file used was Statistics
Canada’s Longitudinal Employment Analysis Program (LEAP). This longitudinal file
covers the universe of employer firms in Canada over the 1993 to 2003 period (hence,
there are no sampling issues). Data in LEAP report on employment and wages at the firm
level, by province and by industry according to the North American Industrial
Classification System (NAICS).
The employment metric used in this study is called the Individual Labour Unit
(ILU), which has been used throughout this multi-year project. An ILU is assigned to
each person that receives a T4 slip (i.e., earns wages at some point during the year) and if
an employee receives more than one T4 slip in any given year, their unit is distributed
among those employers in proportion to the wages paid by each employer. A firm’s
employment level, therefore, is the sum of its ILUs.
The main advantage of using the ILU is that it avoids defining employment based
on industry averages as other employment measures do, such as the Average Labour

Growth Firms Phase IV 6
Unit; it seems likely that high-growth firms do not conform to industry standard hour and
wage profiles. However, the ILU does have drawbacks. For example, it cannot account
for hours-worked differentials, so a part-time employee will receive one ILU, as would a
full-time employee. Another drawback of the ILU is that it cannot account for working
owners unless they are on their own payroll. Currently, neither of these drawbacks can be
addressed by any of Statistics Canada’s labour measures.
Methodology
The methodology used in this study is consistent with that used in the previous
phases of the project. First, the private sector was selected from the universe by removing
public administration, education and health industries. Canada Post was also removed.
Second, all firms were required to have operated for at least one full year to avoid
capturing firms that were very early in the start-up stage. Therefore, data from 1991 and
1992 were used to verify that firms had operated for at least one full year by 1993.
Employment growth of firms that operated over the 1993 to 2003 period was tracked and
firms that exited before the end of the period, and firms that started operations after 1993,
were tracked separately as “births” and “deaths.” Continuing businesses were tracked by
firm size, geographic region and industry.
Furthermore, firms were assigned to a growth group based upon their job creation
performance over the first four years of the observation period (1993 to 1997) according
to the following criteria:
• Hyper Growth Firms: those with at least 150 percent growth in employment,
• Strong Growth Firms: those with between 50 and 150 percent growth in
employment,
• Slow Growth Firms: those with between 0 and 50 percent growth in
employment, or
• Declining Firms: those with negative employment growth.
Some assumptions are required about the data used in this study. First, the data
are assumed to accurately represent the universe of firms by firm size, geography and

Growth Firms Phase IV 7
industry. Second, corrective measures to eliminate false births and deaths1 are assumed to
catch all instances of false births and deaths. Finally, anomalies in the data are assumed
not to contaminate the results.
Results National Job Creation
There were nearly 800 000 employer firms operating in the private sector in 1993
and this number increased to approximately 893 000 by 2003 (see Table 1).
Approximately 490 000 firms exited over this period, while 583 000 firms entered and
310 000 firms operated continuously. Net firm entry accounted for just over 1 million
jobs, while continuing firms were responsible for the remaining 970 000 net new jobs.
Therefore, total private sector employment increased by nearly 2 million jobs over this
period.
Table 1: Overall Employment Creation, Canada, 1993 to 2003
All Firms in 1993 799 335All Firms in 2003 893 067Total Net Job Creation 1 979 302Firms Not Operating in 1993 But Operating in 2003 (births) 582 863 3 751 862Firms Operating in 1993 But Not Operating in 2003 (deaths) 489 131 -2 739 139Total Net Effect of Churning 93 732 1 012 723Continuing Firms (those existing in 1993 and 2003) 310 204 966 579 Hyper Growth Firms (4%) 13 586 (45%) 431 778 Strong Growth Firms (13%) 39 269 (59%) 565 665 Slow Growth Firms (41%) 127 920 (82%) 791 456 Declining Firms (42%) 129 429 (85%) - 822 320
Number of Firms Net Jobs Created/Lost
Continuing firms were assigned to a growth group based on their job creation
performance over the first four years of the period. Slightly more than 4 percent of
continuing firms were hyper growth firms and these firms accounted for 45 percent of net
jobs created by continuing firms. Strong growth firms also played a large role in the job
creation process, accounting for 13 percent of continuing firms, but 59 percent of net jobs
1 A false birth or death can occur when a business signals the creation of a new business or exit of an existing business when it undergoes an organizational change. This could include a name change or adding new payroll accounts.

Growth Firms Phase IV 8
created. Slow growth and declining firms accounted for slightly more than 40 percent of
continuing firms each and their job creation and job loss offset each other at 82 and
negative 85 percent respectively.
Job Creation by Firm Size and Growth Category
The distribution of net job creation by firm size and growth group is illustrated in
Figure 1. Small firms accounted for nearly 80 percent of net job creation, while medium-
sized firms accounted for more than one quarter and large firms shed jobs, decreasing the
total number of net jobs created by 5 percent. Micro firms (those with 1–4 employees, not
shown in Figure 1) were also important job creators, creating approximately 20 percent of
net jobs by continuing firms over this period. These findings are consistent with earlier
work covering the 1985–1999 period, when small businesses accounted for the bulk of
net job creation, medium-sized businesses contributed about one third of the number of
jobs that small businesses contributed and large businesses shed jobs.
Figure 1: Net Job Creation by Firm Size and Growth Category, Canada, 1993 to 2003
-600 000-500 000-400 000-300 000-200 000-100 000
100 000200 000300 000400 000
Net
Job
s C
reat
ed/L
ost
Hyper Strong Slow Declining
Growth Category
0-99100-499500+
Net job creation by hyper and strong growth firms more than offset the net jobs
shed by declining firms. Although these firms accounted for less than 7 percent of all
firms in 1993, they were responsible for 1 million jobs, which was approximately half of

Growth Firms Phase IV 9
the net jobs created over the 1993–2003 period. Slow growth firms also made a positive
contribution to net job creation, creating nearly 800 000 jobs. However, declining firms
shed more than 820 000 jobs, slightly more jobs than slow growth firms created.
Among hyper, strong and slow growth firms, small businesses accounted for most
of the net job creation. However, medium-sized and large firms were still significant
contributors to job creation and these two size categories combined to create the bulk of
net new jobs created by slow growth firms. All declining firms shed jobs and large firms
were responsible for the bulk of the jobs lost, accounting for 65 percent of net job losses
by declining firms. Small and medium-sized firms accounted for 25 and 10 percent of
jobs shed by declining firms respectively. Additional results by firm size are presented in
the Appendix.
Job Creation by Industry
As in previous work covering 1985–1999, job creation by industry was examined
at approximately the three-digit NAICS level. Among hyper and strong growth firms,
business services was the leading industry, accounting for 18 percent of employment
creation. The top three industries account for only 30 percent of employment creation by
hyper and strong growth firms, up slightly from 25 percent over the 1985–1999 period.
Consequently, net job creation was spread over a large number of industries. It appears,
therefore, that no single industry was predisposed to high growth. More detailed job
creation results by industry are presented in the Appendix.
Firm Survival Rates
Business survival is influenced by many factors, including geographic location,
type of industry, firm size and firm age. There are also several market factors that can
greatly impact firms’ survival, such as the number of competitors and new entrants, as
well as general market and economic conditions.
Growth Firms Phase IV 10
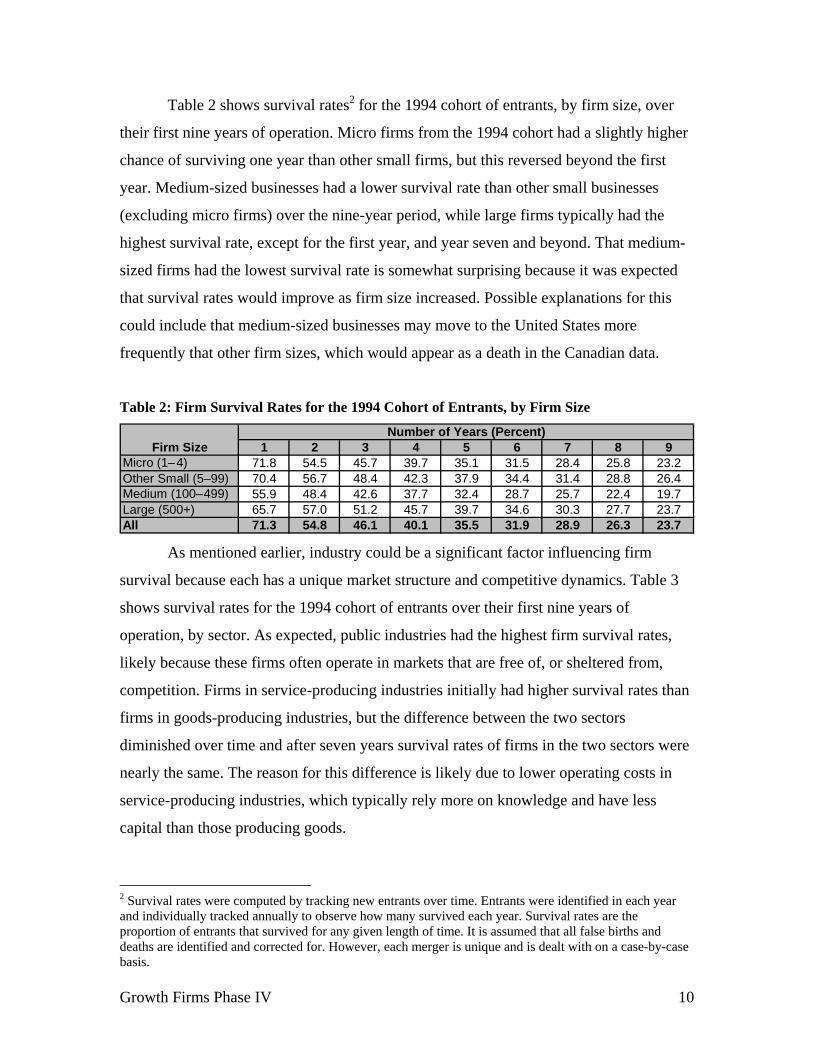
Table 2 shows survival rates2 for the 1994 cohort of entrants, by firm size, over
their first nine years of operation. Micro firms from the 1994 cohort had a slightly higher
chance of surviving one year than other small firms, but this reversed beyond the first
year. Medium-sized businesses had a lower survival rate than other small businesses
(excluding micro firms) over the nine-year period, while large firms typically had the
highest survival rate, except for the first year, and year seven and beyond. That medium-
sized firms had the lowest survival rate is somewhat surprising because it was expected
that survival rates would improve as firm size increased. Possible explanations for this
could include that medium-sized businesses may move to the United States more
frequently that other firm sizes, which would appear as a death in the Canadian data.
Table 2: Firm Survival Rates for the 1994 Cohort of Entrants, by Firm Size
Firm Size 1 2 3 4 5 6 7 8 9Micro (1– 4) 71.8 54.5 45.7 39.7 35.1 31.5 28.4 25.8 23.2Other Small (5–99) 70.4 56.7 48.4 42.3 37.9 34.4 31.4 28.8 26.4Medium (100– 499) 55.9 48.4 42.6 37.7 32.4 28.7 25.7 22.4 19.7Large (500+) 65.7 57.0 51.2 45.7 39.7 34.6 30.3 27.7 23.7All 71.3 54.8 46.1 40.1 35.5 31.9 28.9 26.3 23.7
Number of Years (Percent)
As mentioned earlier, industry could be a significant factor influencing firm
survival because each has a unique market structure and competitive dynamics. Table 3
shows survival rates for the 1994 cohort of entrants over their first nine years of
operation, by sector. As expected, public industries had the highest firm survival rates,
likely because these firms often operate in markets that are free of, or sheltered from,
competition. Firms in service-producing industries initially had higher survival rates than
firms in goods-producing industries, but the difference between the two sectors
diminished over time and after seven years survival rates of firms in the two sectors were
nearly the same. The reason for this difference is likely due to lower operating costs in
service-producing industries, which typically rely more on knowledge and have less
capital than those producing goods.
2 Survival rates were computed by tracking new entrants over time. Entrants were identified in each year and individually tracked annually to observe how many survived each year. Survival rates are the proportion of entrants that survived for any given length of time. It is assumed that all false births and deaths are identified and corrected for. However, each merger is unique and is dealt with on a case-by-case basis.
Growth Firms Phase IV 11
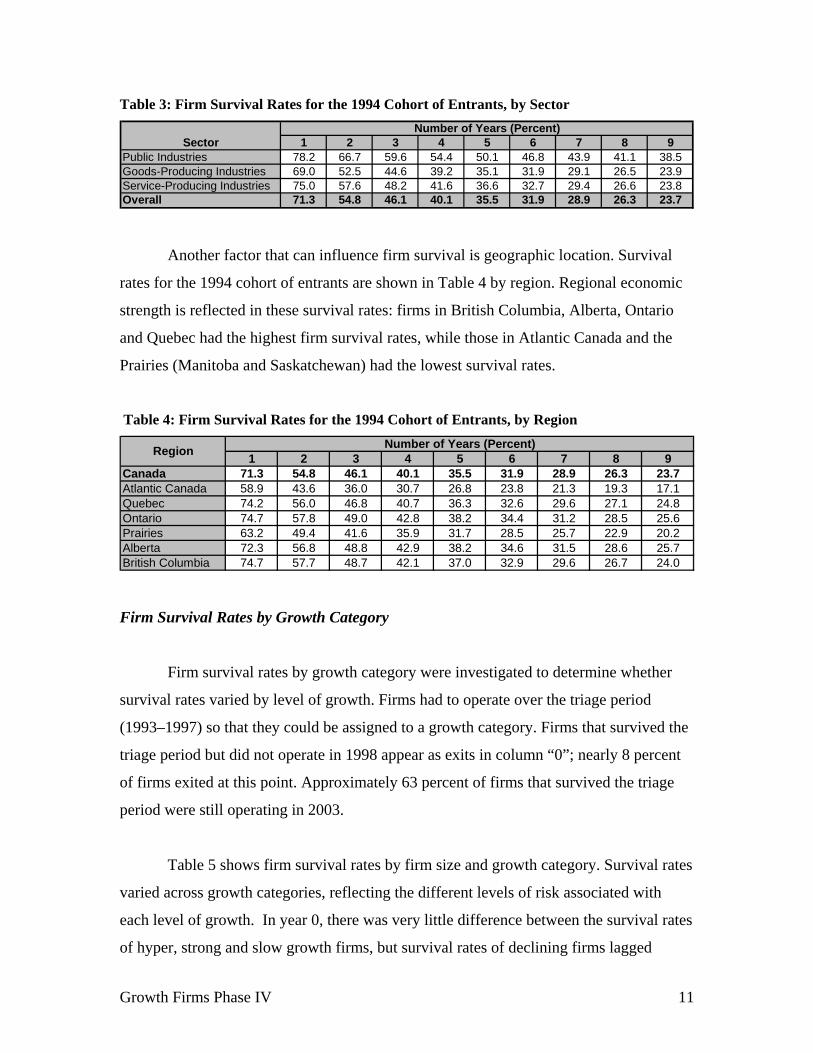
Table 3: Firm Survival Rates for the 1994 Cohort of Entrants, by Sector
Sector 1 2 3 4 5 6 7 8 9Public Industries 78.2 66.7 59.6 54.4 50.1 46.8 43.9 41.1 38.5Goods-Producing Industries 69.0 52.5 44.6 39.2 35.1 31.9 29.1 26.5 23.9Service-Producing Industries 75.0 57.6 48.2 41.6 36.6 32.7 29.4 26.6 23.8Overall 71.3 54.8 46.1 40.1 35.5 31.9 28.9 26.3 23.7
Number of Years (Percent)
Another factor that can influence firm survival is geographic location. Survival
rates for the 1994 cohort of entrants are shown in Table 4 by region. Regional economic
strength is reflected in these survival rates: firms in British Columbia, Alberta, Ontario
and Quebec had the highest firm survival rates, while those in Atlantic Canada and the
Prairies (Manitoba and Saskatchewan) had the lowest survival rates.
Table 4: Firm Survival Rates for the 1994 Cohort of Entrants, by Region
1 2 3 4 5 6 7 8 9Canada 71.3 54.8 46.1 40.1 35.5 31.9 28.9 26.3 23.7Atlantic Canada 58.9 43.6 36.0 30.7 26.8 23.8 21.3 19.3 17.1Quebec 74.2 56.0 46.8 40.7 36.3 32.6 29.6 27.1 24.8Ontario 74.7 57.8 49.0 42.8 38.2 34.4 31.2 28.5 25.6Prairies 63.2 49.4 41.6 35.9 31.7 28.5 25.7 22.9 20.2Alberta 72.3 56.8 48.8 42.9 38.2 34.6 31.5 28.6 25.7British Columbia 74.7 57.7 48.7 42.1 37.0 32.9 29.6 26.7 24.0
Number of Years (Percent)Region
Firm Survival Rates by Growth Category
Firm survival rates by growth category were investigated to determine whether
survival rates varied by level of growth. Firms had to operate over the triage period
(1993–1997) so that they could be assigned to a growth category. Firms that survived the
triage period but did not operate in 1998 appear as exits in column “0”; nearly 8 percent
of firms exited at this point. Approximately 63 percent of firms that survived the triage
period were still operating in 2003.
Table 5 shows firm survival rates by firm size and growth category. Survival rates
varied across growth categories, reflecting the different levels of risk associated with
each level of growth. In year 0, there was very little difference between the survival rates
of hyper, strong and slow growth firms, but survival rates of declining firms lagged

Growth Firms Phase IV 12
behind. Over time, however, survival rates of hyper growth firms declined relative to
strong growth and slow growth firms, and by 2003 survival rates were highest in strong
and slow growth firms. These results suggest that there may be a trade-off between
survival and growth.
Table 5: Survival Rates for Firms Surviving the Triage Period (1993–1997), 1997–2003
0 1 2 3 4 5 (Still alive)All Firms Hyper 94.9 88.6 82.9 77.7 72.8 68.2 63.5
Strong 96.4 91.2 86.2 81.7 77.2 73.1 68.9Slow 95.2 89.6 84.5 79.8 75.4 71.3 66.9Declining 89.1 82.4 76.7 71.7 67.3 63.2 59.0All 92.6 86.5 81.1 76.3 71.8 67.7 63.4
Micro Hyper 94.1 87.2 81.1 75.7 70.6 65.8 60.8(1–4 Strong 95.3 89.2 83.7 78.5 73.7 69.1 64.4Employees) Slow 93.0 85.9 79.5 74.0 68.7 63.9 58.8
Declining 85.9 78.0 71.5 65.9 60.9 56.4 51.6All 90.7 83.4 77.1 71.6 66.6 61.9 57.0
Other Small Hyper 97.9 93.3 88.6 84.2 79.9 75.6 71.9(5–99 Strong 98.4 94.8 90.7 87.1 83.3 79.9 76.4Employees) Slow 98.5 94.8 91.3 87.7 84.3 81.1 77.8
Declining 91.7 85.6 80.4 75.9 71.7 68.0 64.1All 94.8 89.8 85.2 81.1 77.2 73.7 70.0
Medium Hyper 97.6 94.0 89.2 84.4 80.5 76.0 72.4(100–499 Strong 97.7 94.3 90.8 86.9 82.9 80.4 77.5Employees) Slow 98.4 95.6 92.3 89.2 86.2 83.5 80.1
Declining 93.9 89.2 85.3 80.9 76.8 73.1 69.7All 96.2 92.4 88.7 84.9 81.2 78.0 74.6
Large Hyper 98.8 95.4 93.9 92.0 89.0 85.9 81.0(500+ Strong 99.1 97.0 95.0 92.7 90.3 88.0 84.3Employees) Slow 98.9 97.8 95.4 93.3 90.9 88.5 86.2
Declining 96.0 93.6 90.4 87.8 84.0 81.4 78.9All 97.4 95.4 92.7 90.3 87.2 84.6 82.0
Number of Years
Ability to Maintain Growth Over the Medium Term
The methodology used in this study assigns firms to a growth category over the
first four years of the 1993–2003 period and tracks them over the remainder of the period.
Although it is known how the firms performed as a growth category, there may be firms
that alter their growth path over the period. Therefore, a second triage period was added
at the end of the 1993–2003 period to see whether firms maintained their growth path
from the beginning of the period. This second triage period covered the years 1999–2003.
Growth Firms Phase IV 13
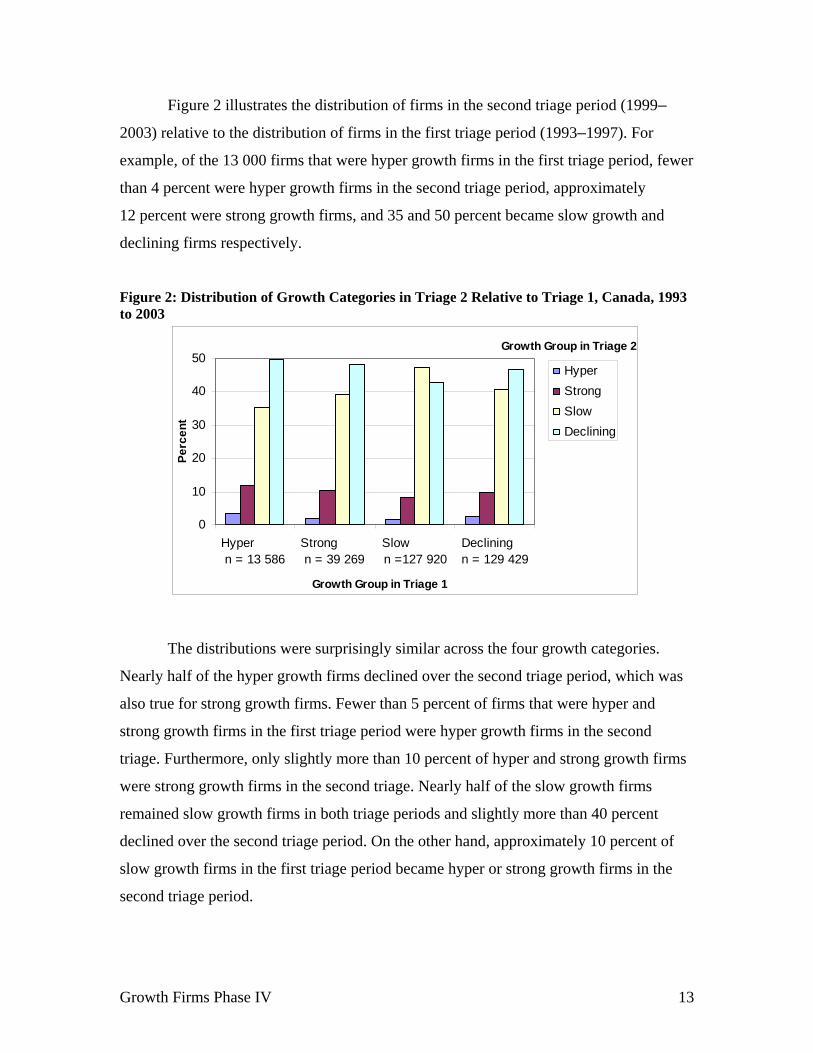
Figure 2 illustrates the distribution of firms in the second triage period (1999–
2003) relative to the distribution of firms in the first triage period (1993–1997). For
example, of the 13 000 firms that were hyper growth firms in the first triage period, fewer
than 4 percent were hyper growth firms in the second triage period, approximately
12 percent were strong growth firms, and 35 and 50 percent became slow growth and
declining firms respectively.
Figure 2: Distribution of Growth Categories in Triage 2 Relative to Triage 1, Canada, 1993 to 2003
Growth Group in Triage 2
0
10
20
30
40
50
Hyper n = 13 586
Strong n = 39 269
Slow n =127 920
Declining n = 129 429
Growth Group in Triage 1
Perc
ent
HyperStrongSlowDeclining
The distributions were surprisingly similar across the four growth categories.
Nearly half of the hyper growth firms declined over the second triage period, which was
also true for strong growth firms. Fewer than 5 percent of firms that were hyper and
strong growth firms in the first triage period were hyper growth firms in the second
triage. Furthermore, only slightly more than 10 percent of hyper and strong growth firms
were strong growth firms in the second triage. Nearly half of the slow growth firms
remained slow growth firms in both triage periods and slightly more than 40 percent
declined over the second triage period. On the other hand, approximately 10 percent of
slow growth firms in the first triage period became hyper or strong growth firms in the
second triage period.

Growth Firms Phase IV 14
Firms that declined in the first triage period showed the most surprising
distribution in the second triage period. Nearly 13 percent of firms that shed jobs in the
first triage period became hyper or strong growth firms in the second triage period,
approximately 40 percent improved to become slow growth firms and 47 percent
continued to decline. This indicates that half of the declining firms were able to address
their weaknesses or reinvent themselves, likely by improving their efficiency, introducing
new products or services, or reaching new markets.
These data were also computed by region and reveal that all regions except for
Alberta and British Columbia mirror the overall Canadian results. Strong economic
growth in Western Canada over this period is evident in the data because more firms
were hyper and strong growth firms and fewer were declining firms in the second triage
period. Regional economic strength plays an important role in the churning process and
growth of continuing firms because most firms, particularly small firms, operate in a very
local market.
Job Creation by Firm Age
The previous two sections present ways to compare growth categories, but these
include all firms operating in 1993, so firm age is not accounted for, which is likely a
strong determinant in the level of job creation. The LEAP file does not contain a firm age
variable, so one was constructed relative to 1999 using data from 1993 to 1999 and
employment creation by firm age was measured between 1999 and 2003. The firm’s first
year of operation was subtracted from 1999 and growth was tracked between 1999 and
2003. The start year of those firms operating in 1993 is not known, so they were assigned
the label “8 years or older.” Growth categories are defined in the same manner as
discussed throughout this report.
Distributions of firms in 1999 and their net job creation over the 1999 to 2003
period, by firm age, are illustrated in Figure 3. The “8 years or older” group accounted
for approximately half of the firms and the next biggest cohort was made up of the
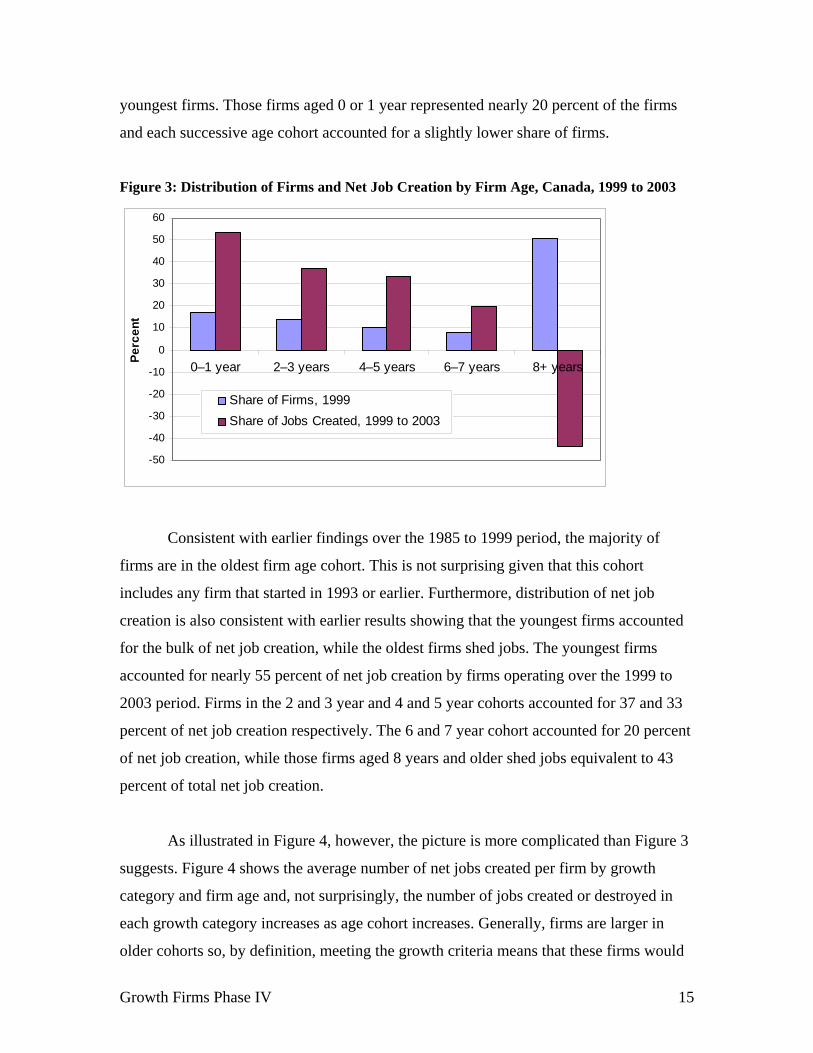
Growth Firms Phase IV 15
youngest firms. Those firms aged 0 or 1 year represented nearly 20 percent of the firms
and each successive age cohort accounted for a slightly lower share of firms.
Figure 3: Distribution of Firms and Net Job Creation by Firm Age, Canada, 1999 to 2003
-50
-40
-30
-20
-10
0
10
20
30
40
50
60
0–1 year 2–3 years 4–5 years 6–7 years 8+ yearsPerc
ent
Share of Firms, 1999Share of Jobs Created, 1999 to 2003
Consistent with earlier findings over the 1985 to 1999 period, the majority of
firms are in the oldest firm age cohort. This is not surprising given that this cohort
includes any firm that started in 1993 or earlier. Furthermore, distribution of net job
creation is also consistent with earlier results showing that the youngest firms accounted
for the bulk of net job creation, while the oldest firms shed jobs. The youngest firms
accounted for nearly 55 percent of net job creation by firms operating over the 1999 to
2003 period. Firms in the 2 and 3 year and 4 and 5 year cohorts accounted for 37 and 33
percent of net job creation respectively. The 6 and 7 year cohort accounted for 20 percent
of net job creation, while those firms aged 8 years and older shed jobs equivalent to 43
percent of total net job creation.
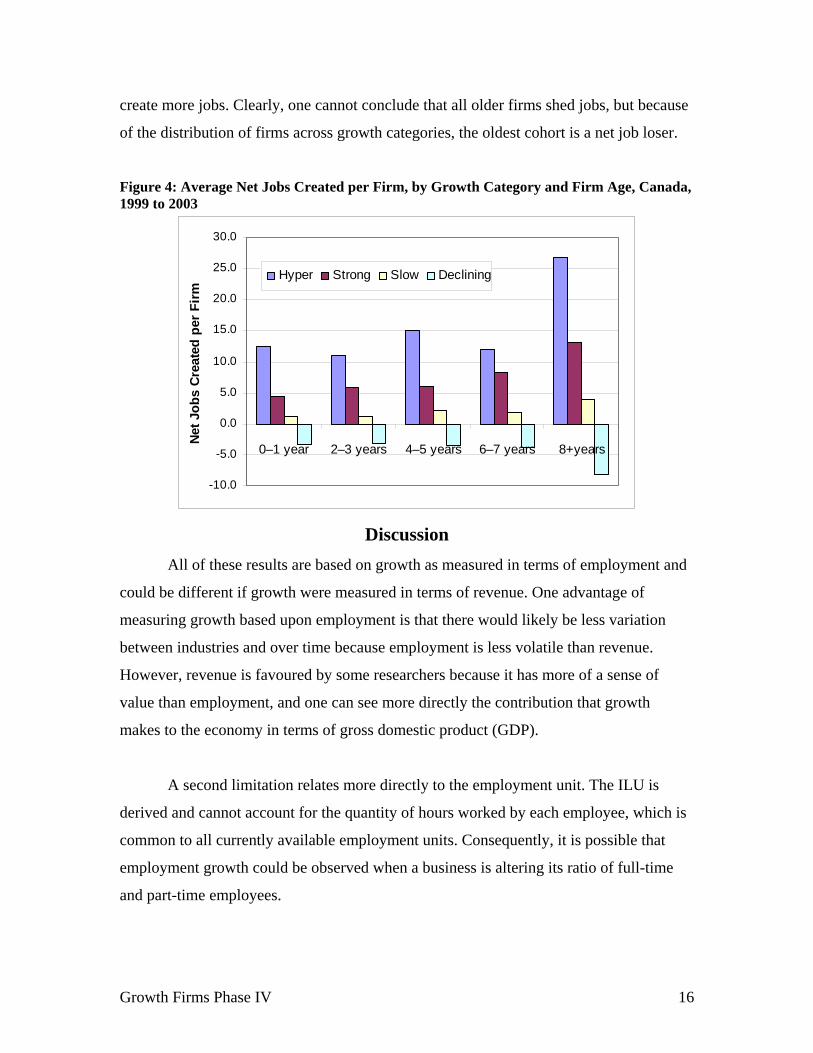
As illustrated in Figure 4, however, the picture is more complicated than Figure 3
suggests. Figure 4 shows the average number of net jobs created per firm by growth
category and firm age and, not surprisingly, the number of jobs created or destroyed in
each growth category increases as age cohort increases. Generally, firms are larger in
older cohorts so, by definition, meeting the growth criteria means that these firms would
Growth Firms Phase IV 16
create more jobs. Clearly, one cannot conclude that all older firms shed jobs, but because
of the distribution of firms across growth categories, the oldest cohort is a net job loser.
Figure 4: Average Net Jobs Created per Firm, by Growth Category and Firm Age, Canada, 1999 to 2003
-10.0
-5.0
0.0
5.0
10.0
15.0
20.0
25.0
30.0
0–1 year 2–3 years 4–5 years 6–7 years 8+years
Net J
obs
Crea
ted
per F
irm
Hyper Strong Slow Declining
Discussion All of these results are based on growth as measured in terms of employment and
could be different if growth were measured in terms of revenue. One advantage of
measuring growth based upon employment is that there would likely be less variation
between industries and over time because employment is less volatile than revenue.
However, revenue is favoured by some researchers because it has more of a sense of
value than employment, and one can see more directly the contribution that growth
makes to the economy in terms of gross domestic product (GDP).
A second limitation relates more directly to the employment unit. The ILU is
derived and cannot account for the quantity of hours worked by each employee, which is
common to all currently available employment units. Consequently, it is possible that
employment growth could be observed when a business is altering its ratio of full-time
and part-time employees.

Growth Firms Phase IV 17
Despite these limitations, several policy implications arise from the study’s
results. First, it is clear that survival rates of hyper growth firms are lower than those
firms that have ambitious, but controlled, growth. This suggests that there are substantial
risks associated with extreme levels of growth, so encouraging firms to pursue very high
levels of growth may not be optimal because these firms have a higher risk of exiting
and, thereby, losing jobs.
In addition to being risky, extremely high growth appears to be short-lived.
Approximately half of the hyper growth firms declined (in employment) after the first
triage period (1993–1997) and only 3.5 percent continued to meet hyper growth criteria
over the later triage period (1999–2003), indicating that it is very difficult to maintain
extremely high growth rates over a longer time period. Strong growth firms were more
likely than hyper growth firms to have positive growth over the full 10-year period, so
they are more likely to be net job contributors over the medium and long term. This also
suggests that hyper growth may not be the most desirable outcome because even if it is
achieved, the benefits (in terms of job creation) last only a short while. However, results
by revenue growth may paint a different picture.
Compared with evidence from other countries, the data in this study indicate that
older firms in Canada contributed more to the job creation process than older firms in the
United States and Europe. Despite this, the majority of job creation was still generated by
the youngest firms in their first few years of operation, suggesting that growth is short-
lived because of the declining positive net contribution to job creation as firm age
increases. Canada is a world leader in creating businesses, but these results indicate that
improvements could be made in the way that firms are supported throughout their life
cycle.
Several results from this study suggest that innovation may be crucial to a firm’s
growth process. The bulk of job creation came from the youngest firms, which are often
firms that enter the market to exploit a new idea or process. Furthermore, a large number
of firms that were declining at the beginning of the observation period were able to

Growth Firms Phase IV 18
reverse their path of decline and grow over the final four years of the period. It is possible
that these firms were able to turn around their business by innovating in some way.
Conclusions This phase of the Growth Firms Project looked at the 1993–2003 period. In
addition to examining job creation by growth category and firm size, it looked at job
creation by firm age and industry, firm survival and the ability of firms to maintain their
growth rates. It also looked at firm survival by growth category and the extent to which
high-growth firms are able to maintain their growth over the 10-year period. This study
confirmed many of the project’s previous findings that covered the 1985 to 1999 period,
indicating that the results are not likely time-period specific. However, there are some
data limitations that need to be addressed to ensure that the results are interpreted in the
correct context.
As found in earlier work, a small number of high-growth firms were responsible
for the bulk of net job creation. While the majority of these firms were small, high growth
was not limited to micro and small businesses as medium and large high-growth firms
accounted for 20 percent of net job creation. Also, although very young firms created the
highest number of net jobs, all other age groups made strong contributions to net job
creation. This confirms earlier findings from the 1985 to 1999 period. In contrast,
evidence from the United States indicates only the youngest firms create jobs.3
Results show that declining firms have the lowest survival rate, followed by hyper
growth firms. This suggests that greater risk may be attached to a high-growth strategy,
and that survival and growth are substitutes, not complements. Strong growth firms had
the highest survival rate, followed closely by slow growth firms. Additionally, only
15 percent of hyper and strong growth firms maintained their growth rates over the full
10-year period, while nearly half of them declined over the second half of the period.
Surprisingly, this result also holds for slow and declining firms. Of those that declined
3 Acs, Zoton, J. “Entrepreneurship (What’s the big deal) and the Macro economy in the 21st Century, Understanding Entrepreneurship: Issues and Numbers.” Paris: OECD, October 2005.

Growth Firms Phase IV 19
over the first triage period (1993–1997), nearly 15 percent were hyper or strong growth
firms over the second triage period (1999–2003).
Although this research continues to shed light on the dynamics of job creation and
the role of high-growth firms, the future of this work lies in file linkages and adding
additional data to the existing LEAP file. Adding revenue from corporate tax files would
allow a comparison of growth by revenue and employment. Furthermore, it would allow
computation of a productivity proxy (revenue per employee) and productivity levels and
changes could be compared across firm sizes and over time. Additional work could be
conducted on examining the employee unit and the possibility of correcting the data for
part-time employment. Linking the LEAP file to Statistics Canada’s innovation surveys
could add insights on how innovative behaviour impacts firm performance, growth and
survival. Follow-up work could also look further into the growth/risk trade-off.

Growth Firms Phase IV 20
APPENDIX: Additional Results Job Creation by Industry
Job creation by industry was examined in detail to validate results from earlier
work that covered the 1985 to 1999 period. There are 104 industries at the three-digit
NAICS level, which led to difficulty disclosing data due to confidentiality restrictions. To
eliminate data suppression, NAICS data were mapped to the two-digit Standard Industrial
Classification (SIC) scheme, which reduced the number of industries to 70.
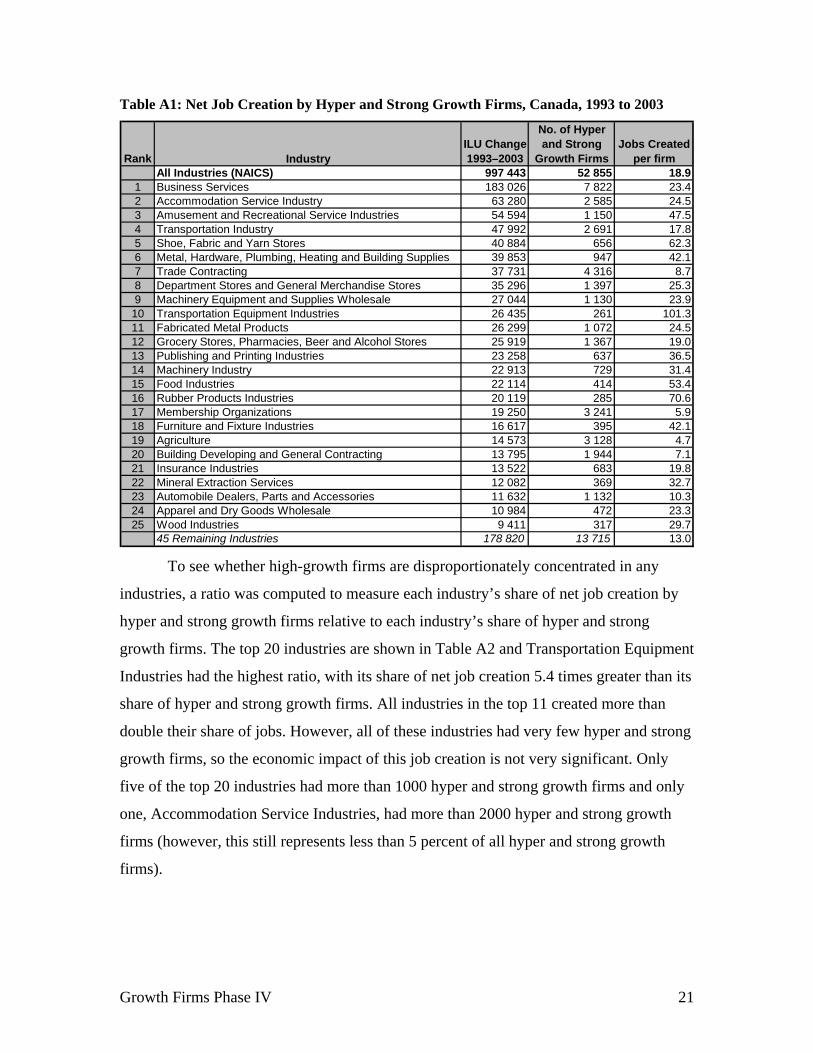
Table A1 shows the 25 industries with the highest net job creation by hyper and
strong growth firms. As in the earlier phase of work, covering the 1985 to 1999 period,
the industry with the most net jobs was business services. Between 1993 and 2003, this
industry accounted for 18 percent of net job creation by hyper and strong growth firms,
which was only slightly above its representation among high-growth firms at 15 percent
of all firms. The other industries in the top five industries for net job creation by hyper
and strong growth firms are Accommodation Service Industries, Amusement and
Recreational Service Industries, Transportation Industry, and Shoe, Fabric and Yarn
Stores. The top eight industries account for half of the net jobs created and the top 23
industries account for 80 percent.
Growth Firms Phase IV 21
Table A1: Net Job Creation by Hyper and Strong Growth Firms, Canada, 1993 to 2003
Rank IndustryILU Change 1993–2003
No. of Hyper and Strong
Growth FirmsJobs Created
per firmAll Industries (NAICS) 997 443 52 855 18.9
1 Business Services 183 026 7 822 23.42 Accommodation Service Industry 63 280 2 585 24.53 Amusement and Recreational Service Industries 54 594 1 150 47.54 Transportation Industry 47 992 2 691 17.85 Shoe, Fabric and Yarn Stores 40 884 656 62.36 Metal, Hardware, Plumbing, Heating and Building Supplies 39 853 947 42.17 Trade Contracting 37 731 4 316 8.78 Department Stores and General Merchandise Stores 35 296 1 397 25.39 Machinery Equipment and Supplies Wholesale 27 044 1 130 23.910 Transportation Equipment Industries 26 435 261 101.311 Fabricated Metal Products 26 299 1 072 24.512 Grocery Stores, Pharmacies, Beer and Alcohol Stores 25 919 1 367 19.013 Publishing and Printing Industries 23 258 637 36.514 Machinery Industry 22 913 729 31.415 Food Industries 22 114 414 53.416 Rubber Products Industries 20 119 285 70.617 Membership Organizations 19 250 3 241 5.918 Furniture and Fixture Industries 16 617 395 42.119 Agriculture 14 573 3 128 4.720 Building Developing and General Contracting 13 795 1 944 7.121 Insurance Industries 13 522 683 19.822 Mineral Extraction Services 12 082 369 32.723 Automobile Dealers, Parts and Accessories 11 632 1 132 10.324 Apparel and Dry Goods Wholesale 10 984 472 23.325 Wood Industries 9 411 317 29.7
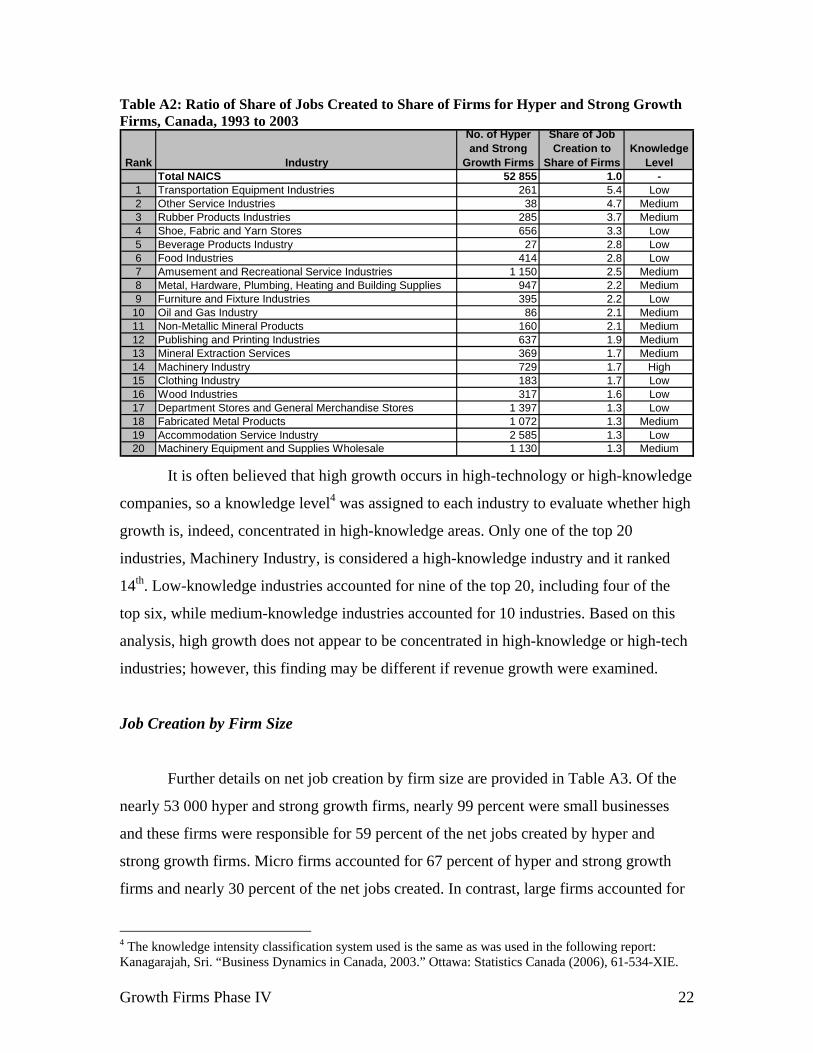
45 Remaining Industries 178 820 13 715 13.0 To see whether high-growth firms are disproportionately concentrated in any
industries, a ratio was computed to measure each industry’s share of net job creation by
hyper and strong growth firms relative to each industry’s share of hyper and strong
growth firms. The top 20 industries are shown in Table A2 and Transportation Equipment
Industries had the highest ratio, with its share of net job creation 5.4 times greater than its
share of hyper and strong growth firms. All industries in the top 11 created more than
double their share of jobs. However, all of these industries had very few hyper and strong
growth firms, so the economic impact of this job creation is not very significant. Only
five of the top 20 industries had more than 1000 hyper and strong growth firms and only
one, Accommodation Service Industries, had more than 2000 hyper and strong growth
firms (however, this still represents less than 5 percent of all hyper and strong growth
firms).
Growth Firms Phase IV 22
Table A2: Ratio of Share of Jobs Created to Share of Firms for Hyper and Strong Growth Firms, Canada, 1993 to 2003
Rank Industry
No. of Hyper and Strong
Growth Firms
Share of Job Creation to
Share of FirmsKnowledge
LevelTotal NAICS 52 855 1.0 -
1 Transportation Equipment Industries 261 5.4 Low2 Other Service Industries 38 4.7 Medium3 Rubber Products Industries 285 3.7 Medium4 Shoe, Fabric and Yarn Stores 656 3.3 Low5 Beverage Products Industry 27 2.8 Low6 Food Industries 414 2.8 Low7 Amusement and Recreational Service Industries 1 150 2.5 Medium8 Metal, Hardware, Plumbing, Heating and Building Supplies 947 2.2 Medium9 Furniture and Fixture Industries 395 2.2 Low10 Oil and Gas Industry 86 2.1 Medium11 Non-Metallic Mineral Products 160 2.1 Medium12 Publishing and Printing Industries 637 1.9 Medium13 Mineral Extraction Services 369 1.7 Medium14 Machinery Industry 729 1.7 High15 Clothing Industry 183 1.7 Low16 Wood Industries 317 1.6 Low17 Department Stores and General Merchandise Stores 1 397 1.3 Low18 Fabricated Metal Products 1 072 1.3 Medium19 Accommodation Service Industry 2 585 1.3 Low20 Machinery Equipment and Supplies Wholesale 1 130 1.3 Medium
It is often believed that high growth occurs in high-technology or high-knowledge
companies, so a knowledge level4 was assigned to each industry to evaluate whether high
growth is, indeed, concentrated in high-knowledge areas. Only one of the top 20
industries, Machinery Industry, is considered a high-knowledge industry and it ranked
14th. Low-knowledge industries accounted for nine of the top 20, including four of the
top six, while medium-knowledge industries accounted for 10 industries. Based on this
analysis, high growth does not appear to be concentrated in high-knowledge or high-tech
industries; however, this finding may be different if revenue growth were examined.
Job Creation by Firm Size
Further details on net job creation by firm size are provided in Table A3. Of the
nearly 53 000 hyper and strong growth firms, nearly 99 percent were small businesses
and these firms were responsible for 59 percent of the net jobs created by hyper and
strong growth firms. Micro firms accounted for 67 percent of hyper and strong growth
firms and nearly 30 percent of the net jobs created. In contrast, large firms accounted for
4 The knowledge intensity classification system used is the same as was used in the following report: Kanagarajah, Sri. “Business Dynamics in Canada, 2003.” Ottawa: Statistics Canada (2006), 61-534-XIE.

Growth Firms Phase IV 23
0.2 percent of hyper and strong growth firms, but nearly one quarter of the jobs created
by these two groups of firms. Although approximately 9 percent of large firms were
hyper or strong growth firms, these large businesses contributed far more jobs per firm
than small businesses. This indicates that high growth is not a small business
phenomenon.
Table A3: Net Job Creation by Firm Size, Canada, 1993 to 2003
Job Creation Percent Job Creation Percent Job Creation Percent Job Creation Percent Job Creation Percent1– 4 83 348 19.3 57 744 10.2 46 631 5.9 -12 112 1.5 175 611 18.25–19 86 250 20.0 114 180 20.2 117 788 14.9 -85 816 10.4 232 402 24.020–49 58 617 13.6 93 467 16.5 114 951 14.5 -62 558 7.6 204 477 21.250–99 26 245 6.1 65 146 11.5 91 136 11.5 -47 533 5.8 134 994 14.01–99 254 460 58.9 330 537 58.4 370 506 46.8 -208 019 25.3 747 484 77.3100–499 72 160 16.7 114 521 20.2 161 789 20.4 -85 259 10.4 263 211 27.2500+ 105 157 24.4 120 607 21.3 259 162 32.7 -529 041 64.3 -44 115 -4.6Total 431 777 100.0 565 665 100.0 791 457 100.0 -822 319 100.0 966 580 100.0
All Continuing FirmsHyper Growth Firms Strong Growth Firms Slow Growth Firms Declining Firms
Changes in Firm Size for Hyper and Strong Growth Firms, by Age
As in earlier phases of this project, growth matrices were tabulated to measure
firm growth through size categories over time. Table A4 shows two growth matrices over
the 1999 to 2003 period for hyper and strong growth firms — one is for the youngest age
cohort (0 or 1 year old) and the other for the oldest cohort (8 years or older).
The shaded diagonal indicates the proportion of firms that remained in the same
size category in both 1999 and 2003. Those values above and to the right of the diagonal
represent the percentage of firms that grew over this period. Those below and to the left
of the diagonal decreased; however, because the triage and tracking periods are the same,
it is impossible for hyper and strong growth firms to decrease, so all these values are
zero.
Growth Firms Phase IV 24
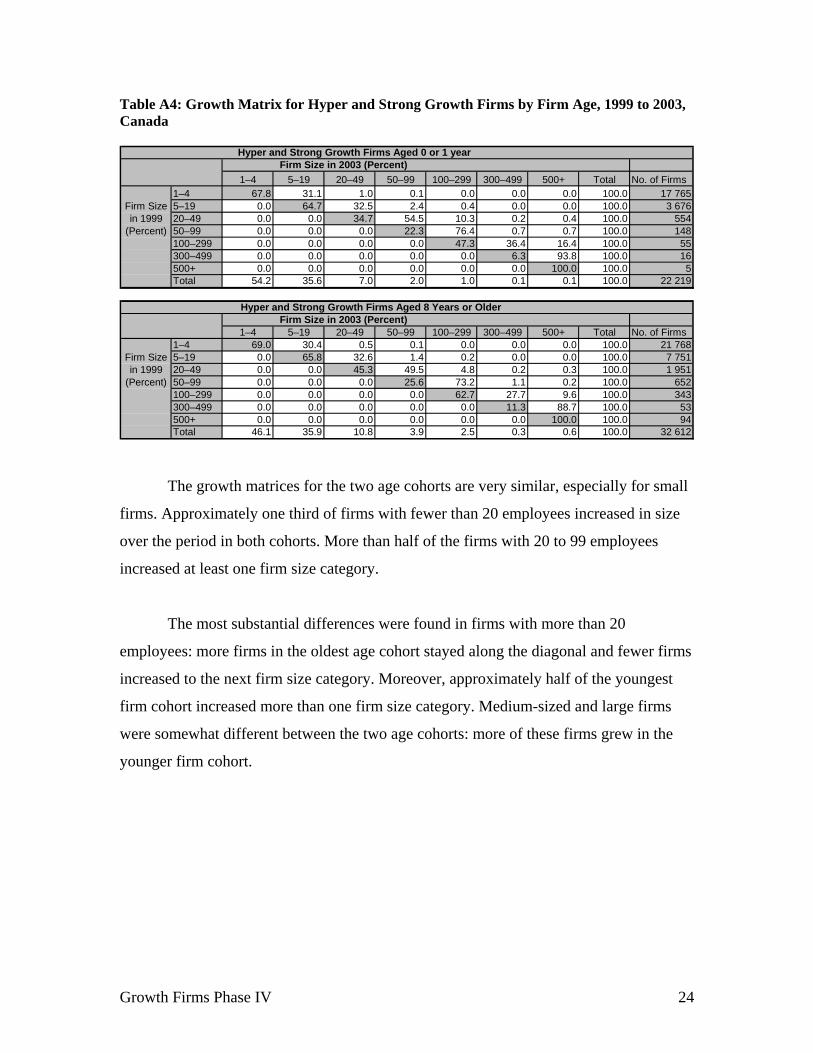
Table A4: Growth Matrix for Hyper and Strong Growth Firms by Firm Age, 1999 to 2003, Canada
Hyper and Strong Growth Firms Aged 0 or 1 year
1–4 5–19 20–49 50–99 100–299 300–499 500+ Total No. of Firms1–4 67.8 31.1 1.0 0.1 0.0 0.0 0.0 100.0 17 7655–19 0.0 64.7 32.5 2.4 0.4 0.0 0.0 100.0 3 67620–49 0.0 0.0 34.7 54.5 10.3 0.2 0.4 100.0 55450–99 0.0 0.0 0.0 22.3 76.4 0.7 0.7 100.0 148100–299 0.0 0.0 0.0 0.0 47.3 36.4 16.4 100.0 55300–499 0.0 0.0 0.0 0.0 0.0 6.3 93.8 100.0 16500+ 0.0 0.0 0.0 0.0 0.0 0.0 100.0 100.0 5Total 54.2 35.6 7.0 2.0 1.0 0.1 0.1 100.0 22 219
Hyper and Strong Growth Firms Aged 8 Years or Older
1–4 5–19 20–49 50–99 100–299 300–499 500+ Total No. of Firms1–4 69.0 30.4 0.5 0.1 0.0 0.0 0.0 100.0 21 7685–19 0.0 65.8 32.6 1.4 0.2 0.0 0.0 100.0 7 75120–49 0.0 0.0 45.3 49.5 4.8 0.2 0.3 100.0 1 95150–99 0.0 0.0 0.0 25.6 73.2 1.1 0.2 100.0 652100–299 0.0 0.0 0.0 0.0 62.7 27.7 9.6 100.0 343300–499 0.0 0.0 0.0 0.0 0.0 11.3 88.7 100.0 53500+ 0.0 0.0 0.0 0.0 0.0 0.0 100.0 100.0 94Total 46.1 35.9 10.8 3.9 2.5 0.3 0.6 100.0 32 612
Firm Size in 1999
(Percent)
Firm Size in 2003 (Percent)
Firm Size in 1999
(Percent)
Firm Size in 2003 (Percent)
The growth matrices for the two age cohorts are very similar, especially for small
firms. Approximately one third of firms with fewer than 20 employees increased in size
over the period in both cohorts. More than half of the firms with 20 to 99 employees
increased at least one firm size category.
The most substantial differences were found in firms with more than 20
employees: more firms in the oldest age cohort stayed along the diagonal and fewer firms
increased to the next firm size category. Moreover, approximately half of the youngest
firm cohort increased more than one firm size category. Medium-sized and large firms
were somewhat different between the two age cohorts: more of these firms grew in the
younger firm cohort.