Embed Size (px)
Citation preview

Corrupting Learning:
Evidence from Missing Federal Education Funds in Brazil∗
Claudio Ferraz†
PUC-Rio
Frederico Finan‡
UC-Berkeley
Diana B. Moreira
World Bank
September 2009
Abstract
While cross-country analysis suggests that corruption hinders economic growth,we have little evidence on the mechanisms that link corruption to long-run economicdevelopment. We provide micro-evidence on the consequences of corruption for thequality of education. We use data from the auditing of Brazil’s local governments toconstruct objective measures of corruption involving educational block grants trans-ferred from the central government to municipalities. Using variation in the incidenceof corruption across municipalities and controlling for students’, schools’ and municipalcharacteristics, we find that corruption significantly reduces the school performance ofprimary school students. Students residing in municipalities where corruption in edu-cation was detected score 0.35 standard deviations less on standardized tests, and havesignificantly higher dropout and failure rates. We also provide evidence on the mech-anisms that link corruption and mismanagement to learning and school attainment.The results are consistent with corruption directly affecting economic growth throughthe reduction of human capital accumulation.JEL: D73, I21, H72
∗We are grateful to the staff at the CGU for support and clarifications of the auditing process, and toElaine Pazzelo and Roberta Biondi for help with the education data. We thank David Card, Miguel Foguel,Seema Jayanchandran, Enrico Moretti, Ted Miguel, Sergei Soares, Fernando Veloso and seminar participantsat BREAD, GRADE, Ibmec-Rio, IPEA-Rio, PUC-Rio, and RAND for comments and suggestions. We alsothank Tassia Cruz, Carolina Grottera, and Marcio Nery for excellent research assistance. Financial supportfrom CCPR and CNPq is gratefully acknowledged.
†Department of Economics, Pontifıcia Universidade Catolica do Rio de Janeiro (PUC-Rio), Rua Marquesde Sao Vicente, 225- Gavea Rio de Janeiro, RJ, 22453-900, Brasil. Email: [email protected]
‡Department of Economics, 508-1 Evans Hall, Berkeley, California 94720-3880. Email: [email protected]; and BREAD, IZA, NBER

1 Introduction
Policies aimed at reducing corruption have become an integral component of several coun-
tries’ development strategies (Rose-Ackerman 2004). These policies are predicated on the
idea that corruption distorts the allocation of resources away from their most productive
uses and thus presents a significant barrier to economic growth (Shleifer and Vishny 1993).
But corruption can also impose significant long-run costs through its effects on the provision
and quality of key public services ((Svensson 2005), Mauro (1995), World Bank (2003)). In
education, high levels of corruption might be particularly harmful if it limits human capital
accumulation.1
Evidence from cross-country data supports the idea that corruption can reduce educa-
tional quality. As seen in Figure 1, there is a strong negative relationship between a country’s
corruption level and its performance on the PISA international exams.2 In spite of the clear
negative correlation, there are several reasons why one should be cautious about interpreting
this relationship as causal. First, there are many institutional and cultural differences across
countries that determine both its level of corruption and the quality of education. Moreover,
as has been well documented, subjective cross-country measures of corruption are subject to
important shortcomings (Svensson 2005). Thus, despite its importance, empirical evidence
on the welfare consequences of corruption remain remarkably sparse.3
This paper aims to fill this gap by providing micro-evidence on the effects of corrup-
tion and mismanagement of education funds on the academic performance of public school
students in Brazil. Brazil provides an ideal case to examine the effects of corruption in educa-
tion. Despite large expenditures on primary schooling per pupil, the performance of students
on the international PISA examination is among the worst in the world (see panels A and B
of Figure 2). Even within Brazil, the association between spending per pupil and academic
performance among primary school children in public schools is weak (see panels A and B
of Figure 3). To overcome the data constraints that have limited cross-country analysis,
1See for example Glewwe and Kremer (2006); Pritchett and Filmer (1999).2Figure 1 plots the relationship between the performance on the PISA international exams in 2006, after
accounting for expenditures on primary schooling per pupil, and a country’s corruption index. The PISAexamination is available in 2006 for 56 countries when we include only those countries for which we also haveinformation on spending in primary education per pupil. The corruption index is from Kaufmann, Kraay,and Mastruzzi (2009), we invert the sign of the control of corruption index.
3A number of recent studies have provided new insights into measuring corruption. See for exampleBandiera, Prat, and Valletti (2008), Di Tella and Schargrodsky (2003), Ferraz and Finan (2008), Olken(2007), Reinikka and Svensson (2004). Our study complements this literature by estimating the extent ofcorruption from educational grants.
1

we assemble a new data set based on a program initiated by the Federal Government that
audits local governments’ for their use of federal funds. Based on audit reports, we quantify
local-level corruption and mismanagement associated with federal block grants earmarked
for education.4 We then link these corruption measures to data on the educational achieve-
ment of primary school students across 1488 public schools located in 365 municipalities
throughout Brazil. We estimate the effects of corruption on dropout rates, failure rates, and
performance on a national standardized exam.
This data set, which represents one of the first large scale attempts to measure corruption
in education at a local level, has several advantages over the existing literature.5 First,
because our estimates are based on audit reports, we also have information available for block
grants in other sectors (e.g. health and infrastructure). Thus, we can distinguish between the
effects of corruption in education versus overall corruption. By controlling for corruption in
other sectors, our estimates do not reflect general levels of corruption or public good provision
in the municipality. Second, the effects of corruption are identified separately from the effects
of mismanagement practices in education. Corrupt politicians may have low management
skills or hire poor managers, both of which may negatively affect educational outcomes.
Our data can distinguish between these different types of irregularities. Third, even within
education we can also distinguish between the various sectors and programs within which the
corruption occurred. This allows us to disentangle the mechanisms that link corruption and
mismanagement of resources to educational attainment. Finally, our complementary data
includes information on a large set of student and household-level characteristics, allowing
us to account for important differences in student attributes that might otherwise confound
our estimates.
We find that the educational outcomes of students residing in municipalities where cor-
ruption was uncovered are significantly lower than those of students residing in municipalities
where no corruption was detected. For instance, test scores on a standardized Language and
Math exam among 4th graders are 0.35 standard deviations lower in corrupt municipalities.
Corruption is also associated with higher dropout rates and failure rates among primary
school children. These results remain even after controlling for measures of mismanagement
and corruption in other areas, suggesting that unobserved determinants of corruption more
4The data were constructed based on the audit reports used in Ferraz and Finan (2009), but exploit thedetailed reports from the educational grants.
5See Reinikka and Svensson (2004) for estimates of local capture of education grants using expendituretracking surveys. See Bjorkman (2007) and Reinikka and Svensson (2007) for an examination of the effectsof reducing capture of public funds on schooling outcomes.
2

generally are not driving our results. Our results are also robust to alternative measures
of corruption. To provide further robustness to our results, we also examine whether cor-
ruption in educational funds in the municipality affects the schooling outcomes of children
attending private school. We find no effects of corruption on the dropout and failure rates
of children attending private school, suggesting that children are neither sorting into pri-
vate schools nor that differences in education performance are driven by municipal level
unobserved characteristics.
If corruption diverts funds intended for schooling inputs then educational inputs should
also be lower in municipalities with more corruption. We demonstrate that this is indeed
the case using three independent data sources. Based on Brazil’s school census, we find that
the percentage of teachers who had received pedagogical training is 10.7 percentage points
lower compared to non-corrupt municipalities. Schools in corrupt municipalities are also less
likely to have a computer lab or a science lab. From independent directors’ and teachers’
surveys, we also find that both teachers and school directors of schools in municipalities
where corruption was detected are much more likely to report that a lack of resources and
teaching supply are serious problems. When we decompose our corruption measure by the
type of program in which the corruption occurred, we find that corruption occurring in the
funds intended for the payment and training of teachers is associated with poor schooling
outcomes.
Given the negative costs associated with corruption in education, the natural question
becomes how to reduce it. Our findings show that corruption in education is significantly
lower in municipalities that hold school principals accountable through elections, as opposed
to having the mayors appoint them. These results suggest that electoral accountability,
even in the context of school management, can be an important mechanism for improving
governance.6
Overall, this study contributes to the literature on corruption and its consequences for
economic growth and development. While the general consensus argues that corruption
harms economic development, with few exceptions, the evidence is based on cross-country
comparisons using subjective or self-reported measures of corruptions (e.g. Mauro (1995)).
Our study complements and extends this literature in two important ways. First, we examine
the effects of corruption using sub-national variation and objective measures of corruption
in education. Second, our findings lend empirical support to the importance of reducing
6See Ferraz and Finan (2009) for the relationship between electoral accountability and corruption inmunicipal governments.
3

corruption in promoting education attainment of primary school children, thus highlighting
the long-run costs of corruption. Finally, our study also relates to a large literature that
examines whether school resources affect student achievement. Differently from the existing
literature, however, an important contribution of this paper is to argue that corruption in
education does more than simply reduce school supplies. Corruption also affects schooling
infrastructure, distorts schooling inputs, reduces teachers’ salaries thus potentially affecting
their motivation, and may even lower children’s nutrition levels. Thus, we should not inter-
pret the effects of corruption as simply shifting the school budget constraint, but rather a
reduced-form effect of these various distortionary channels.7
The paper proceeds as follows. Section 2 provides an overview of Brazil public education
system and corruption program that conducted the audit reports. Section 3 describes our
conceptual framework and outlines our empirical strategy. In Section 4, we describe the
data, including how our corruption measures were coded. Section 5 presents our results, and
Section 6 concludes.
2 Background
2.1 Decentralization and Block Grants for Education
In 2005, Brazil transferred over US$2.6 billion in educational grants to municipal government
and spent 4.5 percent of its GDP on public education. Unfortunately, these expenditures have
not led to improvements in academic performance. For instance, on the 2006 Programme
for International Student Assessment (PISA) test among 15 year old students, Brazil ranked
54th among 57 countries in mathematics and ranked 49th out of 56 countries in reading.
Brazil also placed well below Mexico and Argentina, both of which spend on average similar
amounts on primary education.
Brazil’s local governments are much to blame for this poor performance. The consti-
tution dictates that states and municipal governments share the responsibility for the pro-
vision of primary and secondary education. In practice, however, most state governments
manage secondary schools, while municipal governments manage primary schools (ensino
fundamental). By 2005, approximately 85% of all first to fourth grade primary schools were
7In an environment where schools lack basic infrastructure, text books, school lunches, and qualifiedteachers, Harbison and Hanushek (1992) argue that even modest resources can in fact have significant effectson student learning.
4

managed by municipal governments.8 In order to guarantee adequate investments in edu-
cation, Brazil’s constitution mandates that at least 25 percent of all state and municipal
revenues are spent for educational purposes. Local governments are thus responsible for
building schools, providing adequate infrastructure, distributing school lunches and school
transportation, training teachers, and paying salaries.
To cover these costs, the federal government transfers to states and municipalities large
sums of resources in the form of block grants.9 On top of that, a new financing scheme named
FUNDEF was created in 1997 to equalize the amount of resources available for education
across regions.10 It consists of a state fund to which state and municipal governments
contribute 15 percent of specific taxes and transfers. The fund, which totaled US$13.7
billion in 2005, is then redistributed to state and municipal governments on the basis of
student enrollment. The federal government supplements local governments in states where
per student allocations fall below an established spending floor. The FUNDEF constitutes a
large share of resources available to mayors, but the use of resources is not completely free.
For instance, the rule stipulates at least 60 percent of FUNDEF revenues must be spent on
teachers’ salaries.
To monitor the use of these federal funds and ensure compliance with federal guidelines,
local councils were established, comprising of representatives of the municipal government,
teachers, and parents.11 Unfortunately, these councils have been mostly ineffective. They
have either been captured by local mayors or do not meet regularly enough to effectively
monitor the use of these resources (Transparencia Brasil 2005). That these local councils
are unable to fulfill their role as an effective watchdog is not too surprising. Throughout
Brazil, governments are under the control of local elites and powerful mayors who often
divert resources for their own benefits.12
8See Madeira (2007) for details of the school decentralization process and its impacts in the state of SaoPaulo.
9The largest block grant, called Fundo de Participacao dos Municıpios, was created in the 1960s anddistribute resources to municipalities based on their population and the state’s income per capita.
10FUNDEF stands for Fundo de Manutencao e Desenvolvimento do Ensino Fundamental e de Valorizacaodo Magisterio. See Gordon and Vegas (2005) and Menezes-Filho and Pazello (2007) for a detailed descriptionof FUNDEF.
11These councils are called Conselhos de Acompanhamento e Controle Social.12Corruption at the local level is not unique to Brazil. Elite capture of public resources at local levels is
a serious concern for several countries throughout the world (Rose-Ackerman 1999).
5

2.2 Embezzlement and Misuse of Educational Block Grants
With the large influx of central government transfers to municipalities, the potential for local
capture has increased dramatically. Resources for education and health, the largest grants
received by local governments, have become attractive targets for rent-seeking politicians.
The most common embezzlement tactics include the use of fake receipts, purchases without
proper call-for-bids, over-invoicing of goods and services, and payments made to contractors
without service provision.13
Among the transfers made to municipalities for educational spending, FUNDEF is the
largest block grant and the source of much of the embezzlement. In a report by Transparencia
Brasil, based on audits executed by the Controladoria Geral da Uniao (CGU), the federal
government controller’s office, estimated that approximately 13% to 55% of FUNDEF’s total
budget between 2001 and 2003 was lost to fraud.14
Cases of mayors diverting resources from these educational block grants are countless.
During 2005 alone, there were 26 news stories about the misuse of FUNDEF resources in
the Brazilian press.15 Some examples are helpful to illustrate how prevalent the problem has
become. In the municipality of Placas, in the North of Brazil, the ex-mayor could not attest
to how he spent US$1.25 million of FUNDEF funds between 2003 and 2004. Moreover, when
auditors asked the new mayor that took office in 2005 for documents and receipts, he said
that all documents disappeared from the archives during the government transition.16 The
new mayor of Camaragibe, state of Pernambuco, also had a surprise when he took office in
January 2005. He discovered that US$400,000 from the FUNDEF account was transferred
by the ex-mayor to a private bank account.17
Examples of teachers not receiving their full salaries are also widespread. In May 2009,
approximately 90 percent of municipal school teachers in Itabuna, Bahia received less than
half of their monthly salary, after approximately US$100,000 “disapeared” from the FUN-
DEF account.18 In the municipality of Senador Alexandre Costa, Maranhao, teachers did
not receive their 13th monthly salary and bonus because the mayor had diverted all of the
funds from FUNDEF. By April 2007, despite the school year having started in early Febru-
13See Ferraz and Finan (2009) for a description of corruption practices in local governments.14See Transparencia Brasil (2005).15See www.deunojornal.org.br/busca.php?assunto=46316“Dinheiro do FUNDEF e o maior alvo de desvios”, O Globo 06/25/2006.17“Desvio do FUNDEF atrasa salarios de professores”, O Globo 03/27/2005.18See “Professores de Itabuna recebem so metade do salario”, in the Blog Pimenta na Muqueca, assessed
in 05/04/2009.
6

ary, all municipal schools were still closed and without energy due to the lack of payments.19
In Goncalves Dias, state of Maranhao, 129 municipal teachers did not received their salaries
during 9 months in 2004. They went on strike and it was only in December that the mu-
nicipal government paid part of their earnings. The new mayor, who inherited the debt,
negotiated to pay 40 percent of back pay in exchange for having the new salaries paid on
time.
Although teachers protest these situations, in many cases they are forced to accept these
arrangements in order for their current salary to be paid on time. According to Francisco
Carlos Custodio, the municipal Secretary of Education for Goncalves Dias: “Many teachers
were angry with the situation, but accepted the offer because they were afraid of not receiving
their future salaries.”20 Mayors have been reported to engage in other forms of coercion as
well. For instance, in the municipality of Traipu, a geography teacher and local representative
of the teachers’ union, was transferred from an urban school where she taught geography
to high school students to a rural school to teach small children after she denounced the
mayor’s misuse of educational grants. In the municipality of Vicosa, Alagoas students that
participated in protests were forbidden to use the municipal bus that transports students
to the only secondary school, which was located in the neighboring municipality.21 The
small city of Satuba in Alagoas provides a particularly extreme case. In June 2003, Paulo
Bandeira, a teacher started a campaign to denounce the mayor for embezzling funds. Soon
after, he was found tortured and killed.
While mayors have found ways of coercing teachers, this does not suggest that all cases
of corruption go unpunished. In 2005 the Federal Police arrested 8 mayors and 4 ex-mayors
in the state of Alagoas with charges of diverting US$1 million from the FUNDEF.22 The
ex-mayor of Cocal, in the state of Piaui, was also arrested accused of diverting US$1.2
million from the FUNDEF. He had already been impeached from public office in 2008 for
corruption allegations.23 In December 2008, after a long investigation, the Federal Police
arrested 9 mayors, 7 municipal secretaries and 64 public servants for diverting resources
from education and health funds in 16 municipalities in the state of Bahia. The police
19Taken from a public complaint made by a citizen from Senador Alexandre Costa on a public email sentto Arlindo Chinaglia, the President of the National Congress, in April 2007.
20“Desvio do FUNDEF atrasa salarios de professores”, O Globo 03/27/2005.21See the report “Irregularidades na utilizacao de recursos publicos - Alagoas”, written by the NGO Acao
Educativa, available at http://www.acaoeducativa.org.br.22See O Globo, “Dinheiro do FUNDEF e o maior alvo de desvios”. 25/06/2006)23“PI: ex-prefeito e preso por desvios de fundo do Fundeb e do FUNDEF”, Correio Braziliense, 01/30/2009
7

estimated that approximately US$11.5 million was embezzled.24 In April 2009, the Federal
Police arrested four ex-mayors and 17 other persons in the municipalities of Montes Altos,
Sao Pedro da Agua Branca and Governador Edison Lobao, in the south of Maranhao. They
were accused of diverting R$6.5 million from educational grants during 2008.25
Given its prevalence in the education sector, corruption can severely impact a student’s
ability to learn through a variety of ways. First, when teacher salaries are delayed or not
paid in full due to corruption, this can affect teachers’ motivation or the functioning of the
school. In some cases, teachers go on strike or the school shuts down. Second, school quality
is also comprised when funds intended for new classrooms or school supplies are diverted.
Insufficient school inputs may not only have a direct effect on a student’s ability to learn but
also affect a teacher’s ability to teach. Third, corruption also occurs in the provision of school
lunches. For children of poor households, these meals can represent an important source of
daily calories. If corruption reduces these calories, then enrollment or regular attendance
may suffer.
In sum, Brazil’s local governments receive large sums of resources through educational
block grants. A significant share of these resources is misused and diverted, thus affecting
educational quality. Brazil’s local governments provide an ideal setting to examine how local
corruption affects educational outcomes. In Section 4 we describe Brazil’s anti-corruption
program and how we used the audit reports from this program to build measures of misuse
and diversion of resources from educational block grants.
3 Theoretical Framework
This section presents a simple analytical framework for exploring the relationship between
corruption and school achievement. Corruption can affect student achievement through
various channels. We highlight these channels using an educational production function,
which forms the basis for our estimation equation.
We begin with a standard production function for learning. A child’s achievement, A, is
determined by a set of individual, family, schooling inputs:
A = g(S, F,W,Q, I) (1)
where S denotes years of schooling, F is a vector of predetermined individual and family
24See A Tarde, “Prefeitos envolvidos na Operacao Vassoura-de-Bruxa devem ser ouvidos ate sexta”.25See “PF prende quatro ex-prefeitos e mais 17 pessoas no MA”, Estado de S.Paulo 04/28/2009.
8

characteristics, such as the child innate ability or the education of the parents. The vector
W denotes the set of school characteristics that determine a child’s achievement, such as the
availability of computer laboratories or textbooks. The vector Q represents teacher inputs,
such as teacher effort or qualification. The vector I represents parental inputs, which might
include parental assistance or even how much nutrition is provided to the child.
Based on information revealed in audit reports, corruption may affect the educational
production function through at least three channels. First, resources intended for school
supplies are either diverted completely or over-invoiced leading to an undersupply of school-
ing inputs. This mis-allocation of funds will reduce either the quality or supply of schooling
inputs, W . A second source of corruption uncovered in the audits is the diversion of re-
sources intended for teacher training or wages and bonuses, Q. This type of corruption
may not only directly affect a teacher’s ability to convey the material, but may also reduce
their motivation or incentive to do so. Thirdly, corruption associated with school feeding
programs was often detected. In Brazil, school lunches are an important source of calories
for low-income households. The absence of school lunches may have a significant impact on
a child’s nutritional levels, I, and his ability to learn.
Given these various channels through which corruption can affect student achievement,
we augment Equation 1 as follows:
A = g(S, F,W (c), Q(c), I(c)) (2)
where W , Q, and I are functions of the level of corruption in the municipality. Equation 2
also assumes that predetermined individual and family characteristics, and years of schooling
are not affected by corruption.
To estimate the effects of corruption on student achievement, we can linearize Equation
2 as:
Asm = α + βcm + Z ′smδ + X ′
mγ + ε (3)
where Asm is student achievement in school s in municipality m, cm is the level of corruption
in education that was detected in the municipality, Zsm is a vector of predetermined student
(e.g. gender, age, race, etc) and family characteristics (e.g. parent’s education, assets,
etc), Xm is a vector of municipal characteristics that may affect student achievement, and ε
denotes a random error term. Under the assumption that E[cmε|XmZsm] = 0, the coefficient
β captures the reduced-form effects of corruption on student achievement.
The principal identification issue confronting the estimation of equation 3 is the possibility
9

that cm is correlated with unobserved factors that affect student achievement. For instance,
municipalities with less corruption may offer more public goods and other amenities that
might affect student achievement. Returns to education may also be higher in areas with
less corruption. It is also possible that families that value education may choose to live
in municipalities with less corruption. In this situation, we will over-estimate the negative
effects of corruption on education.
To address these concerns, we present several robustness checks. First, we re-estimate
equation 3 controlling for corruption detected in other sectors (e.g. health and infrastruc-
ture). Controlling for corruption in sectors other than education is likely to proxy for many
of the unobservable characteristics that are both correlated with corruption in education and
determine student achievement. Second, using the audit reports we also construct a measure
of mismanagement of education resources. This allow us to disentangle the effects of cor-
ruption from the effects of mismanagement. Our third main robustness check uses private
schools as a placebo test. Here, we re-estimate equation 3 using educational outcomes of
children who attend private school as the dependent variable. Under this specification, we
would expect β = 0, since corruption in public expenditures should not affect private school
outcomes. Similarly, we also test whether the effects of corruption on educational outcomes
differ in municipalities with private schools. If more able children are sorting into better
schools in corrupt areas, we might expect the effects of corruption to be larger in corrupt
municipalities that offer a private schooling option. We test for this possibility by estimating
the following equation:
Asm = α + βcm + η1pm + θ(pm × cm) + Z ′smδ + X ′
mγ + ε
where pm is an indicator for whether a private school exists in the municipality. If in corrupt
municipalities more able students are sorting into private schools, then we would expect the
interaction effect between corruption and the existence of a private school to be negative,
i.e. θ < 0.
4 Data
Our empirical analysis combines three different data sources. First, we use information
contained in the audit reports of Brazil’s anti-corruption program to construct our measures
of corruption and mismanagement in the education sector. Second, we collect information
on various schooling outcomes and student characteristics, which we aggregate to the school
10

level. The third data source contains information about the socio-economic characteristics
of the municipality. Because the identifying variation is at the level of the municipality,
accounting for differences across municipalities will be important for our analysis.
4.1 Building Measures of Corruption and Mismanagement of Ed-
ucational Funds
Widespread corruption scandals in municipalities have led to a growing concern over the
misuse of federal funds. In May 2003, the federal government started an unprecedented
anti-corruption program based on the random auditing of municipal government’s expen-
ditures. The program, which is implemented through the Controladoria Geral da Uniao
(CGU), aims at discouraging misuse of public funds among public administrators and fos-
tering civil society participation in the control of public expenditures. The program started
with the audit of 26 randomly selected municipalities, one in each state of Brazil. It has
since expanded to auditing 50 and later 60 municipalities per lottery, from a sample of all
Brazilian municipalities with less than 450,000 inhabitants. The lotteries, which are held on
a monthly basis at the Caixa Economica Federal in Brasilia, are drawn in conjunction with
the national lotteries. To assure a fair and transparent process, representatives of the press,
political parties, and members of the civil society are all invited witness the lottery.
Once a municipality is chosen, the CGU gathers information on all federal funds trans-
ferred to the municipal government from 2001 onwards. Approximately 10 to 15 CGU audi-
tors are then sent to the municipality to examine accounts and documents, to inspect for the
existence and quality of public work construction, and delivery of public services. Auditors
also meet members of the local community, as well as municipal councils in order to get
direct complaints about any malfeasance.26 After approximately one week of inspections,
the auditors submit a report containing, for each inspected area (i.e education, health, ur-
ban infrastructure), a list of government programs audited, the total amount of federal funds
transferred, and a detailed list describing each irregularity found.27 At the time of this study,
audit reports were available for approximately 790 municipalities randomly selected across
the first 16 lotteries of the anti-corruption program. From these 16 lotteries, we randomly
selected the municipalities from 10 lotteries to measure corruption and mismanagement in
26These auditors are hired based on a public examination, and prior to visiting the municipality receiveextensive training on the specificities of the sampled municipality. Also, there is a supervisor for each teamof auditors.
27For some irregularities, the amount of resources diverted are estimated by the auditors.
11
education, health, and urban infrastructure, the three largest sources of federal transfers for
municipalities.28 Thus, in total, we construct indicators of corruption and mismanagement
for 365 municipalities.
In order to build our measures of corruption and mismanagement, we read the report
for each municipality and classify the irregularities listed by the auditors into several pre-
established categories. We define three types of irregularities as acts of corruption: diversion
of public funds, over-invoicing, and irregular public procurements. We classify diversion of
resources as any irregularity involving the embezzlement of public funds. This typically oc-
curs in two situations: 1) federally-transferred resources simply “disappear” from municipal
bank accounts; and 2) the municipality claimed to have purchased goods and services that
were never provided, which is determined when there is no proof of purchase and community
members confirm that the goods were in fact not delivered. We classify over-invoicing as
any irregularity in which auditors determined that the goods and services were purchased at
a value above market price. We classify the irregularity as an irregular public procurement
when there is an illegal call-for-bids and the contract is awarded to a “friendly firm”. These
firms are usually connected directly to the mayor and/or his family or some cases do not
physically exist. Most cases of corruption involving illegal public procurements include any
combination of: i) use of non-existing firms in the bidding process; ii) use of fake receipts to
pay for goods and services; iii) over-invoicing of prices to increase the amount paid for the
goods and services.
In addition to cases of corruption, we also construct measures of mismanagement. These
are irregularities that are uncovered by the auditors, but do not involve any incidence of
fraud. Administrative irregularities, however, may still affect the quality of education if they
create inefficiencies in the allocation of school inputs. Some examples are useful to illustrate
this measure. Municipalities that receive funds from the FUNDEF program are required to
establish an active and independent community council to monitor the use of these funds.
Auditors uncovered several cases where the council simply did not function. It either never
met or was led by a mayor’s family member. Although this irregularity is not an act of
corruption, the lack of a well functioning council prevents the effective use and monitoring of
resources by civil society. Another common form of mismanagement is the use of resources
that are mandated for other purposes. For instance, mayors have to spend at least 60 percent
of resources from FUNDEF on teacher salaries. In some municipalities, auditors discovered
that these resources were used to pay the salaries of other public servants or the purchase
28As a result, we do not have data from lotteries 8, 11-13, and 15.
12
of gasoline for municipal cars. Again, even though this does not constitute the diversion of
resources for private gains, it may affect the allocation of resources intended for education.
Finally, public procurements require at least three firms to participate in the call-for-bids.
Even in the case where the public good or service was provided (and is thus not considered
corruption) the lack of competition in the bidding process might have led the government to
overspend, thus creating distortions in the allocation of resources.
Using the classifications described above, we define three measures of corruption. First,
an indicator for whether auditors detected any corruption in education. Second, we count
the number of irregularities associated with corruption and divide by the number of ser-
vice items audited. Third, we estimate the value of resources diverted (when information
is available) and divide by the amount of resources transferred to the municipality from
educational grants.29 While the second and third measures capture the extent of corruption,
corruption in education was only detected in 35 percent of municipalities, suggesting that
the extensive margin may capture most of the relevant variation in the data. So while we
present results using all three measure of corruption, most of our analysis will focus on the
corruption indicator. For mismanagement, most irregularities are not associated with values
(e.g. lack of a council to monitor the use of funds) and virtually every municipality has some
incident of mismanagement. Thus, we can only build measures counting the total number
of irregularities.
Table 1 presents summary statistics of the corruption measures. Corruption in the area
of education was discovered in 35 percent of municipalities. Among these municipalities,
35 percent of services items in education were found to be corruption and 8 percent of
resources were diverted. Corruption in other sectors were also discovered in 50 percent of
the municipalities, and on average 2 irregularities per service item were found to associated
with some type of mismanagement.
With the richness of the audit data, we are also able to distinguish in what types of pro-
grams the irregularities occur. To this end, we classify the corruption in education into three
broad categories: i) school feeding programs; ii) infrastructure and payments for teachers;
iii) others. A large number of irregularities occur in block grants that the central govern-
ment transfers to municipal governments to provide school lunches for children. The second
category includes infrastructure, materials, and teachers’ salaries. Examples include the con-
struction of classrooms and purchase of textbooks, purchase of school buses, and payments
29Because some of the irregularities associated with corruption have missing values, the share of corruptionis underestimated.
13

for teachers with the FUNDEF funds.
4.2 Data on Schooling Outcomes and Municipal Characteristics
We have two main sources of schooling data, both of which are aggregated at the school
level. The data on test scores and student characteristics come from a program called Prova
Brasil. Prova Brasil is a federal program designed to measure student performance among
4th and 8th graders. In 2005, the program conducted a standardized exam in the subjects
of Mathematics and Portuguese given to all 4th graders enrolled in a public school with at
least 20 students. In addition to the exam, the program conducted a survey designed to
measure the child’s socio-economic conditions. The survey includes not only information
about the child: such as, gender, age, and race, but also information about the parents and
home environment: such as, the education of the parents, whether the child lives with both
parents, size of the family, whether the household owns a computer, and other assets. The
wealth of information contained in the survey allows us to control for a host of characteristics
that are likely to affect student achievement.
Our second principal data source comes from the 2006 school census, referring to informa-
tion from the 2005 school year. The census measures the basic conditions of schools in Brazil.
Contained in the census is information about approval rates, dropout rates, and failure rates
by school. There is also information regarding school conditions: such as whether the school
has sanitation, or computer and science labs, as well as information about teachers: such as,
years of experience and what proportion have a degree or are credentialed.
Table 2 provides summary statistics based on information from these surveys, as well
as, basic socio-economic information about the municipality. In panel A, we see that the
proportion of children with parents with at least high school degree is on average 16 percent.
And on average 15 percent of children have a computer at home. The average dropout rate
for schools in our sample is 4 percent, while failure rates are at 10 percent. Only 19 percent
of schools have a computer lab and 4 percent of schools have a science lab.
From Prova Brasil, we also have responses from a director’s survey and a teacher’s survey.
These surveys, which were conducted separately, asked whether the following four items were
a serious concern at school: 1) lack of financial resources 2) lack of school supplies 3) lack
of teachers to teach the courses 4) disciplinary problems among the student body. In both
the teacher’s and director’s survey, 55 percent of the schools cite a lack resources and school
supplies as serious concerns. Only 23 percent cited a lack of teachers as an important concern.
Combining the test score data with the information from the audit reports, Figure 4 plots
14

the distribution of test scores by whether or not corruption in education was detected in the
municipality. Consistent with the cross-country evidence, we find that the distributions of
scores for both math and language in corrupt municipalities is to the left of the distributions
of scores in municipalities where corruption was not found. On average, test scores are 15
points lower in municipalities where some corruption in education was detected. In the next
sections, we investigate the robustness of this relationship.
5 Results
In this section we present the main empirical results of the paper. We begin by presenting
estimates of the relationship between schooling outcomes and corruption in education. We
then show that our estimates are robust across various specifications, including ones that
control for the effects of mismanagement and corruption in other sectors. In the final part of
the section, we explore the mechanisms that link corruption to poor schooling achievement,
and whether school elections for principals reduce corruption.
5.1 The effects of corruption practices on educational outcomes
Table 3 reports estimates of the association between corruption and various schooling out-
comes measured in 2005. The results are OLS estimates of a series of regression models based
on equation 3. Our base specification, which is reported in the odd columns for various ed-
ucational outcomes, adjusts for several key school characteristics (e.g. gender, race, age,
parent’s education, household wealth, student-teacher ratio, etc) which are likely to affect
the education production function. In the even columns, we augment this base specification
to also include various characteristics of the municipalities (e.g. GDP per capita, population,
Gini, etc).
Panel A presents estimates using as our measure of corruption: the proportion of educa-
tion items audited found to involve corruption. Across the various schooling measures, the
negative effects of corruption are substantive. For instance, a 30 percentage point (or ap-
proximately one standard deviation) increase in corruption is associated with a 0.10 standard
deviation decrease in test scores (columns 2 and 4), and a 0.6 percentage point increase in
both dropout and failure rates (columns 6 and 8). These point estimates, while economically
meaningful, are also highly robust to the inclusion of important controls, such as GDP per
capita and urbanization rates, that control for differences in labor market opportunities.
15
In Panel B, we present estimates using the share of resources in education found to be
corrupt as an alternative measure of corruption. In reading the audit reports, it is difficult
to calculate a dollar amount for every irregularity. Yet despite the imprecision associated
with this measure, the results in Panel B tell a similar story. In columns 2 and 4 of Panel
B, the estimates imply that a 5 percentage point increase in corruption is associated with a
0.04 standard deviation decrease in test scores. The share of audited resources found to be
corrupt is also positively associated with both dropout and failure rates.
In Panel C, we present a third alternative measure of corruption: an indicator for whether
or not corruption in education was detected. The results suggests that children residing in
municipalities where corruption was detected fare much worse on the standardized exams
than those with similar observable characteristics but residing in municipalities where no
corruption was revealed. Based on the estimates presented in column 1, corruption in ed-
ucation is associated with a significant decrease of 0.35 standard deviations in test scores
(robust standard error = 0.076).
While columns 1-4 suggest that corruption may have affect learning, the results in
columns 5-8 indicate that corruption may also affect a child’s education attainment. Dropout
rates are 2.9 percentage points higher in municipalities where corruption was detected, which
represents almost a 65 percent increase from the average. Failure rates are also higher in cor-
rupt municipalities (see column 7 and 8), which is consistent with the effects on test scores.
Again, these results are robust to controlling for differences in observable characteristics of
the municipalities.
While all three alternative measures of corruption produce similar results, the measures
presented in panels A and B have the potential advantage of capturing the effects of cor-
ruption along the intensive margin. However, given that only 35 percent of municipalities
committed some act of corruption in education, extensive margin might capture the relevant
variation in the data. In panel D, we test for this explicitly by re-estimating the model
with two indicators indicating low versus high corruption. Low corruption municipalities
have engaged in some corruption but below the median amount in the proportion of items
audited associated with corruption. High corruption municipalities are defined as those that
have corruption levels above the median amount. The excluded category in the regression is
no corruption. As we see in Panel D, the effects for low versus high corruption are the same
and statistically significantly different from zero. For this reason, we use in the remainder
of the analysis, an indicator for whether or not corruption in education was detected as our
main measure of corruption.
16

Overall, the results presented in Table 3 suggest that the effects of corruption on education
outcomes are quite severe. These estimates represent reduced-form effects of several channels.
Thus, it is difficult to compare them with the previous literature. Relative to other studies,
however, the estimated effects of corruption on test scores are large but not unreasonably so.
For instance, Banerjee et al. (2007) find that a remedial education program increased average
test scores by 0.28 standard deviation, and a computer-assisted learning program focusing on
math increased math scores by 0.47 standard deviation. Muralidharan and Sundararaman
(2008) randomly assigns bonus payments to teachers based on the average improvement of
their students’ test scores and finds that math scores increased by 0.28 standard deviations
among students in incentive schools.
5.2 Accounting for institutional differences
The results presented in Table 3 suggest that corruption in education may have adverse
effects on the educational outcomes of primary school children. An obvious concern with
this interpretation is that our estimates may be capturing the effects of the overall quality of
institutions in the municipality, rather than the effects of corruption in education per se. If
municipalities with less corruption have better institutions and provide better public goods,
which may also attract families who value education more, then our estimates will be biased
upwards.
To address this set of concerns, in Table 4 we re-estimate our main specification con-
trolling for corruption in other sectors. This specification is useful for two reasons. First, it
identifies the effects of corruption specifically in education, rather than potentially estimating
a proxy for more general corruption. Second, by controlling for corruption in other sectors,
we are in effect accounting for many of the unobserved differences between municipalities
that do and do not engage in corruption more generally. For instance, returns to education
are often lower in places that are more prone to corruption, since these areas tend to be eco-
nomically depressed and more reliant on local patronage practices. With this specification,
we are, for example, able to capture any potential differences in the returns to education
that were not necessarily accounted for by controlling for just differences in income across
municipalities.
Our findings suggest that corruption in other sectors do not adversely affect educational
outcomes. If anything, the correlation is positive although not statistically significant. More-
over, even after controlling for whether corruption in other sectors was detected, our esti-
mates remain both economically and statistically meaningful. Overall these results suggest
17

that our estimates are robust to unobservable factors that affect both schooling outcomes
and a municipality’s propensity to engage in corruption more generally.
In Table 5, we present an alternative test for whether unobserved differences between
corrupt and non-corrupt municipalities are affecting our results. In columns 1 and 2, we
estimate the effects of corruption in education on the dropout and failure rates of children
attending private schools.30 Because our measure of corruption is based on the misuse of
funds intended for public schools, we should not expect the measure to predict educational
outcomes of private-school children. The results in columns 1 and 2 do in fact show that the
effects of corruption on private schooling outcomes are small and statistically insignificant.
The remaining columns of Table 5 report the estimated coefficients from the model based
on equation 3, which in addition to the standard set of controls includes an indicator for
whether a private school exists in the municipality and an interaction term between having a
private school and our corruption measure. This model is then estimated for each of the four
educational outcomes for sample of children attending public school. Under this specification,
we can test whether selection across municipal and private schools could potentially explain
the correlation between corruption and schooling outcomes. If in municipalities without
corruption, more able students are more likely to attend private schools, then we should
expect the effects of corruption to be more pronounced among municipalities with a private
school. But as we see in columns 3-6, for each educational outcome, the coefficient on the
interaction term is both small in magnitude and statistically insignificant, suggesting that
differential sorting does not explain our findings.
5.3 Controlling for school organizations and community involve-
ment
Even after controlling for institutional differences across municipalities, our results still sug-
gest that test scores and other educational outcomes are substantially lower in municipalities
with more corruption in education. While encouraging, our specifications do not rule out
the possibility that differences in educational systems and institutions across municipalities
are confounding the results. For instance, it could be the case that parent-teacher associa-
tions, and other school/parent organizations, operate more effectively in municipalities where
corruption was not detected. If these organizations also hold government officials more ac-
countable then we would be overestimating the effects of corruption on student achievement.
30Unfortunately, standardized math and Portuguese exams are only conducted on students attendingpublic schools.
18

Also, it could be the case that municipalities where communities are more active exert more
control over corruption and school quality.
In columns 1-4 of Table 6, we re-estimate the main regression model controlling for several
measures of community participation and differences in education systems and institutions:
1) whether the school principal is elected; 2) whether the school has an active PTA; 3)
whether the municipality has an education council, which are intended to provide oversight
on spending; 4) whether the municipality receives private or community financial support; 5)
whether the municipality participates in any intergovernmental consortiums; and 6) whether
the municipality uses participatory budgeting - whereby local communities actively partic-
ipate in the budgeting process. These variables either directly capture the efficacy of local
schools and parent organizations (e.g. active PTA, existence of school council) or serve as
proxies for the general level of civic engagement in the municipality (e.g. principal is elected,
municipality uses participatory budgeting).31
In columns 1 and 2, we find that whether the principal is elected and whether the mu-
nicipality participates in any intergovernmental consortiums are both positively associated
with test scores. Yet controlling for these characteristics, as well as the other proxies, does
not affect any of our original estimates. Even accounting for participatory budgeting and
principal elections, both of which are negatively correlated with corruption in education,
(e.g. point estimate on participatory budgeting= -0.212 with robust standard errors=0.105)
has no effect on our estimates.
Differences in community involvement in schools also do not drive our results. In columns
5-8, we control for whether the community helps in school maintenance, which is positively
associated with test scores, and whether in the last year, the school participated in an
awareness campaign for the community. Once again, accounting for these differences leaves
our point estimates unaffected.
5.4 Robustness Checks
Corruption or mismanagement? Another possible concern is that our estimates capture
the effects of not only the diversion but also the mismanagement of educational resources.
If corruption and mismanagement of educational funds are positively correlated, then our
estimates are overstated. Table 7 shows this is not the case. In columns 1-4, we re-estimate
31Intergovernmental consortiums are entities managed by the civil society. They group municipalitiesto implement a certain action that individual municipalities are not capable of doing alone. They haveautonomous management and financing and are usually used to provide public services, e.g. management ofa public hospital, irrigation project, public transportation, etc.
19

the full specifications presented in Table 3, controlling for the share of audited items in ed-
ucation associated with mismanagement practices. Our findings in columns 1 and 2 suggest
that test scores are in fact negatively correlated with the incidence of mismanagement. A
one standard deviation increase in the incidence of mismanagement is associated with a 0.14
standard deviation decrease in math scores. Yet despite this negative correlation, the mag-
nitude of the effect is small relative to the size of the effects of corruption. The incidence of
mismanagement in a municipality would have to increase from the 1st percentile to the 99th
percentile of the distribution in order to achieve the same effects as those of corruption. Over-
all, the estimated coefficients across the various educational outcomes suggest substantive
effects of corruption, even after accounting for the negative effects of mismanagement.
Functional form Table A1 presents additional specification checks that relax our func-
tional form assumptions. In Panel A, we estimate the effects of corruption in education
on our various educational outcomes using propensity score, and in Panel B we estimate
the effects by propensity score matching. To compute the propensity score, we estimate
the probability that corruption in education was detected in the municipality using a logit
regression on the entire set of school and municipal controls. For the regression, we use a
highly flexible specification that included a full set of second-order polynomials and interac-
tions.32 The propensity score is the predicted values from this regression. In Figure A1 in
the appendix, we plot the distribution of the propensity score for municipalities with corrup-
tion versus municipalities without corruption. Overall, municipalities where corruption was
detected have a much higher propensity, and although there does appear to be substantial
common support, 20 percent of the corrupt municipalities have a propensity score above
the maximum propensity score for non-corrupt municipalities. In the estimates presented in
both panels A and B, we drop these municipalities that are off the common support. Table
A2 of the appendix demonstrates how accounting for the propensity score eliminates almost
all of the differences in covariates between corrupt and non-corrupt municipalities. Only the
number of household members above the age of 6 is statistically different between the two
groups, at less than the 10 percent level.
Panel A of Table A1 reports the estimated effects of corruption on education outcomes
using a propensity score approach (Rosenbaum and Rubin 1983). Specifically, we regress
the outcomes indicated in each column on an indicator for whether or not corruption in
education was detected in the municipality, the propensity score, the corruption indicator
32Using a higher order structure does not change the estimates of the effects of corruption on schoolingoutcomes.
20

interacted with the propensity score demeaned. While specifications presented in Panel A
are regression based, the estimates presented in Panel B are computed using a bias-adjusted
matching estimator (Abadie and Imbens 2006) on the propensity score.
Overall, the findings presented in Table A1 support the conclusion that corruption has
a negative effect on education outcomes of children in 4th grade of primary school. In both
set of specifications, the point estimates are similar to those presented in Table 3. Although
compared to the previous regression analysis the identification assumptions are similar, the
estimators presented here have the advantage that they neither assume an additive linear
functional form nor extrapolate over areas of uncommon support in the observable charac-
teristics.
5.5 Mechanisms linking corruption to educational outcomes
Thus far, we have presented estimates of a reduced-form relationship between corruption
in education and student achievement. As discussed in Section 3, corruption can affect
student performance through various channels. One possible channel is the reduction of
schooling inputs or infrastructure. In Table 8, we explore whether schooling inputs are lower
in municipalities where corruption was detected using data from the 2006 school census.
Column 1 examines whether corrupt municipalities are less likely to have received peda-
gogical training. One common form of corruption uncovered in the audits was the diversion
of funds intended for teacher training. The results in column 1 confirm this. In municipalities
where corruption was detected, the percentage of teachers who are trained is 10.7 percentage
points (standard error 0.061) lower compared to non-corrupt municipalities. Given that 43
percent of teachers receive training, this estimate represents a 25 percent decline. Schools in
corrupt municipalities are also less likely to have a computer lab (coefficient=-0.068; stan-
dard error =0.027) or a science lab (coefficient=-0.020; standard error =0.009). We do not
find any evidence that schools in corrupt municipalities have less access to sanitation, but
this might be a margin where corruption is harder to hide.
Table 9 provides further evidence that schools have fewer resources in municipalities where
corruption in education was detected. Table 9 presents estimates based on a series of linear
probability models, where the dependent variable is specified at the top of each column. Each
dependent variable is constructed based on a series of questions asking whether the school
faced the following non-mutually exclusive problems: 1) insufficient resources; 2) insufficient
teaching supplies; 3) lack of teachers; 4) disciplinary problems among the students. In
columns 1-4, we present estimates based on information from a teacher’s survey, whereas the
21

estimates presented in columns 5-8 are based on responses for the same question, but asked
separately to the school principal.
Despite the fact that the two surveys were conducted separately, both teachers and
principals of schools in municipalities where corruption was detected are much more likely
to report a lack of resources is a serious problem. For instance, in corrupt municipalities,
teachers are 7.5 percentage points (standard error=0.031) more likely to indicate a lack
of teaching supplies (see column 2); whereas, school directors are 11.4 percentage points
(standard error=0.034) more likely to complain about a lack of teaching supplies (see column
6). While corruption would expectedly lead to fewer resources, one would not necessarily
expect corruption to affect disciplinary problems among students or even a lack of teachers
(at least in the short run). The data do in fact bear this out. In columns 3-4 and 7-8, we
do not find any association between corruption in education and whether the school faces
disciplinary problems amongst its students or a lack of teachers. Using information from
the principal’s survey, we investigate whether schools in corrupt municipalities are less likely
to offer pedagogical training. As reported in column 9, we find that schools in corrupt
municipalities are 11.3 percentage points less likely to have gone through teacher training.
This result is consistent with the finding presented in Table 8.
The audit data provide further insights into potential mechanisms. As discussed in Sec-
tion 4, corruption in education assumes several forms. The effects of corruption may vary
depending on whether it occurred through the reduction of school supplies, or perhaps dur-
ing the course of a school feeding program. In Table 10, we separate the irregularities into
three categories: 1) corruption involving a school feeding program; 2) corruption involv-
ing schooling inputs, including teachers; 3) other violations associated with corruption in
education.33
Test scores in municipalities where corruption was detected in either schooling inputs or
teacher salaries are 0.18 standard deviations lower than in municipalities where no corruption
was found. The effects on test scores for the other categories of corruption are similar in
magnitude, but are measured with much less precision. Corruption in schooling inputs is
also associated with a 2 percentage point increase in dropout rates.
33Unfortunately, the data do not allow us to separate the various forms of corruption into finer categories.Because certain programs were selected at random for audit, information does not exist for each municipality.Thus, as we disaggregate our corruption measure into separate categories, we lose observations.
22
5.6 Electing principals, accountability, and corruption
Given the negative costs associated with corruption in education, the question naturally be-
comes how to reduce it. Recently, much of the policy focus has been on enhancing account-
ability in service delivery, both through increased citizens’ access to information or shifting
the responsibility and decision-making power to end users that have better incentives to
manage public funds (Bjorkman and Svensson (2009), Gertler, Patrinos, and Rubio-Codina
(2008)).
In Brazil, a different accountability mechanism has emerged. During the 1990’s, as Brazil
underwent its democratic transition, some states began to experiment with democratization
of state schools by making the choice of school principals a democratic process where teachers,
parents and students can vote. This movement was predicated on the idea that the election
of principals would empower both teachers and parents with more decision-making power to
enhance accountability. Currently, 16 out of Brazil’s 26 states have some form of elections for
school principals of state-run schools. This form of school governance has also been adopted
by municipalities, where 30 percent of municipal school principals are currently elected.
In Table 11, we investigate the relationship between the election of school principals in
municipal schools and our measures of corruption in education. Panel A presents the OLS
estimates of regressing corruption on an indicator for whether or the not the municipality
holds elections for its school principals, controlling for the full set of student and municipal
characteristics. As seen in column 1, municipalities where the principal is elected are associ-
ated with less corruption in education. For instance, an elected principal is associated with
a 17 percentage point decline in the likelihood of detecting corruption in education. Even
though principal elections and corruption in education are negatively correlated, this does
not necessarily imply that the effects of elections on corruption are causal. For instance,
individuals in municipalities that chose to elect their principals may value education more,
which may lead them to elect a mayor that is more likely to adopt election of principals and
less likely to engage in corruption.
In Panel B, we use an instrumental variable approach to overcome some of the issues
associated with omitted characteristics that determine the choice of elections. We use as an
instrument for the election indicator, the number of state schools in the municipality that
have an elected principal. Municipalities should be more likely to adopt school policies if
there are other schools administered by the state that adopt such policies. Moreover, because
the state government makes statewide decisions about whether or not to elect its principals,
23

it’s unlikely to have a direct effect on municipal corruption in education.34 We find that
school elections have a negative effect on corruption in education, although the IV estimate
is larger and less precisely estimated than the OLS estimate.35
As a further test of robustness, we estimate the effects of elections on whether corruption
was detected in other sectors (e.g. health and infrastructure). If elections had a significant
negative effect on corruption in sectors other than education, then one might be concerned
that our indicator for elections is also capturing other unobserved municipal characteristic.
But as we see in column 2, both the OLS and IV estimates are positive and statistically
insignificant.
Traditionally, school principals in Brazil’s public schools have been nominated by politi-
cians which constituted an important source of patronage to distribute to their electoral
supporters (Plank 1996). Moreover, with politically-appointed principals, school adminis-
tration is typically centralized and under the influence of local mayors (Myers 2008). While
admittedly suggestive, our estimates of the effects of holding elections for school principals
point towards the importance of making school principal accountable to parents and teachers,
instead of dependent on local politicians.
6 Conclusions
While there is a general consensus that corruption undermines economic and social develop-
ment, empirical evidence on the consequences of corruption remains limited. In this paper,
we present evidence that corruption has important consequences for learning and school at-
tainment. Using a novel dataset of corruption in education and schooling outcomes across
public schools in Brazil, we find that student test scores on a national standardized exam
are 0.35 standard deviations lower in municipalities where corruption was detected. We also
find that corruption is associated with higher dropout and failure rates.
Given the richness of the data, we are able to rule out several alternative explanations
for our findings. We reject that the effects of corruption in education are capturing overall
corruption in the municipality or inefficiencies related to public sector management. We also
reject the possibility that more able children in corrupt areas are sorting out of municipal
schools and into private schools. Our data also provide insights into some of the mechanisms
that link corruption and mismanagement to schooling outcomes. Consistent with the idea
34In the IV specifications, we also control for the total number of state schools in the municipality. Whetherwe control for the number of state schools does not affect the results in the slightest.
35These results are robust to using the other measures of corruption.
24

that corruption reduces and/or distorts schooling inputs, we find that schools in municipal-
ities found to be corrupt are much less likely to have school infrastructure and high quality
teachers. Moreover, both teachers and directors are more likely to cite a lack of resources
as a principal concern in corrupt municipalities. Finally, we show that using elections for
school principals as a mechanism for accountability can reduce resource diversion.
Overall, our results suggest that not only corruption, but also the mismanagement of
resources have detrimental effects on schooling outcomes. These findings complement the
work of Bandiera, Prat, and Valletti (2008) who show that passive waste in public ser-
vice might be as important as active waste (i.e. corruption) in generating public sectors
inefficiencies. Moreover, to the extent that the quality of education affects long-run eco-
nomic performance, our results suggest a direct channel through which corruption affects
long-run economic development (Hanushek and Woessmann (2009)). Our study provides
micro-evidence for why the large increases in educational spending in developing countries
have had such a disappointing effect on economic growth.
Improving school performance remains a challenge facing most countries (Filmer, Hasan,
and Pritchett 2006). Our results suggest that policies aimed at increasing resources to schools
may not be effective in an environment of high corruption and poor management. In such
contexts, policies that enhance transparency and accountability may be more effective in
improving school performance.
25

References
Abadie, Alberto, and Guido Imbens. 2006. “Large Sample Properties of Matching Estima-
tors for Average Treatment Effects.” Econometrica 74 (1): 235–267.
Bandiera, Oriana, Andrea Prat, and Tommaso Valletti. 2008. “Active and Passive Waste
in Government Spending: Evidence from a Policy Experiment.” American Economic
Review, Forthcoming.
Banerjee, Abhijit V., Shawn Cole, Esther Duflo, and Leigh Linden. 2007. “Remedying
Education: Evidence from Two Randomized Experiments in India.” The Quarterly
Journal of Economics 122 (3): 1235–1264.
Bjorkman, Martina. 2007. “Does Money Matter for Student Performance? Evidence from
a Grant Program in Uganda.” IGIER Working Paper n. 326, August.
Bjorkman, Martina, and Jakob Svensson. 2009. “Power to the People: Evidence from
a Randomized Experiment on Community-Based Monitoring in Uganda.” Quaterly
Journal of Economics 124 (2): 735769 (May).
Di Tella, Rafael, and Ernesto Schargrodsky. 2003. “The Role of Wages and Auditing
During a Crackdown on Corruption in the City of Buenos Aires.” Journal of Law and
Economics 46 (1): 269.
Ferraz, Claudio, and Frederico Finan. 2008. “Exposing Corrupt Policiticans: The Effects
of Brazil’s Publicily Released Audits on Electoral Outcomes.” Quarterly Journal of
Economics 123 (2): 703745.
. 2009. “Electoral Accountability and Corruption: Evidence from the Audits of Local
Governments.” NBER working papers 14937, National Bureau of Economic Research.
Filmer, D., A. Hasan, and L. Pritchett. 2006. “A Millenium Learning Goal: Measuring
real Progress in Education.” Working paper No.97, Center for Global Development.
Gertler, Paul, Harry Patrinos, and Marta Rubio-Codina. 2008. “Empawering Parents to
Improve Education: Evidence from Rural Mexico.” Mimeo, The World Bank.
Glewwe, Paul, and Michael Kremer. 2006. “Schools, Teachers, and Education Outcomes
in developing Countries.” In Handbook on the Economics of Education, edited by Erik
Hanushek and Finis Welchh. Oxford: Elsievier.
Gordon, Nora, and Emiliana Vegas. 2005. “Educational Finance, Equalization, Spending,
Teacher Quality, and Student Outcomes: the Case of Brazil’s FUNDEF.” In Incentives
26

to Improve Teaching: Lessons from Latin America, edited by Emiliana Vegas. Wash-
ington D.C.: The World Bank.
Hanushek, Eric A., and Ludger Woessmann. 2009. “Do Better Schools Lead to More
Growth? Cognitive Skills, Economic Outcomes, and Causation.” NBER working papers
14633, National Bureau of Economic Research.
Harbison, Ralph, and Eric Hanushek. 1992. Educational performance of the poor: Lessons
from rural northeast Brazil. Oxford: Oxford University Press.
Kaufmann, D., A. Kraay, and M. Mastruzzi. 2009. “Governance Matters VIII: Aggregate
and Individual Governance Indicators, 1996-2008.” World bank policy research working
paper 4978, World Bank.
Madeira, Ricardo. 2007. “The Effects of Decentralization on Schooling: Evidence From the
Sao Paulo State Education Reform.” Mimeo.
Mauro, Paolo. 1995. “Corruption and Growth.” Quarterly Journal of Economics, no.
110:681–712.
Menezes-Filho, Naercio A., and Elaine Pazello. 2007. “Do Teachers Wages Matter for
Proficiency? Evidence from a Funding Reform in Brazil.” Economics and Education
Review 26 (6): 660–672.
Muralidharan, Karthik, and Venkatesh Sundararaman. 2008. “Teacher Performance Pay:
Experimental Evidence from India.” Mimeo, UCSD.
Myers, John P. 2008. “Democratizing school authority: Brazilian teachers’ perceptions of
the election of principals.” Teaching and Teacher Education 24:952–966.
Olken, Benjamin A. 2007. “Monitoring Corruption: Evidence from a Field Experiment in
Indonesia.” Journal of Political Economy 115, no. 2 (April).
Plank, D. 1996. The Means of our Salvation: Public Education in Brazil, 1930-1995.
Boulder, CO: Westview Press.
Pritchett, Lant, and Deon Filmer. 1999. “What education production functions really
show: a positive theory of education expenditures.” Economics of Education Review 18
(2): 223–239 (April).
Reinikka, Ritva, and Jakob Svensson. 2004. “Local Capture: Evidence from a Central
Government Transfer Program in Uganda.” Quaterly Journal of Economics 119 (2):
679–705 (May).
27

. 2007. “The Returns from Reducing Corruption: Evidence from Education in
Uganda.” CEPR discussion papers 6363.
Rose-Ackerman, Susan. 1999. Corruption and Government: Causes, Consequences, and
Reform. New York: Cambridge University Press.
. 2004. “Governance and Corruption.” In Global Crises, Global Solutions, edited by
Bjorn Lomborg, 301–44. Cambridge, UK: Cambridge University Press.
Rosenbaum, Paul, and Donald Rubin. 1983. “The Central Role of the Propensity Score in
Observational Studies for Causal Effects.” Biometrika 70:41–50.
Shleifer, Andrei, and Robert W. Vishny. 1993. “Corruption.” Quarterly Journal of Eco-
nomics 108 (3): 599–617 (August).
Svensson, Jakob. 2005. “Eight Questions about Corruption.” Journal of Economic Per-
spectives 19 (3): 1942 (Summer).
Transparencia Brasil. 2005. “Brazil: The Hidden Cost of Decentralized Education.” In
Stealing the Future: Corruption in Classroom, edited by Bettina Meier and Michael
Griffin. Berlin: Transparency International.
World Bank. 2003. World Development Report 2004: Making Services Work for Poor
People. Washington, DC: Oxford University Press.
28

GER
ARG
AUS
AUT
BEL
BRA
BGR
CHL
COL
KOR
HRV
DNKSVK
SVNESP
USA
EST
FIN
FRA
GRC
NLD
HKG
HUN
IRL
ISL
ISRITA
JPN
JOR
LVA
LTULUX
MAC
MEX
NOR
NZL
POL
PRT
GBR
CZE
ROM
SWE
CHE
THA
TUN
TUR
URY
-100
-50
050
100
PIS
A 2
006
mat
h re
sidu
al
-3 -2 -1 0 1Country corruption measure
GER
ARG
AUS
AUT
BEL
BRA
BGR
CHL
COL
KOR
HRVDNK SVKSVN
ESP
EST
FIN
FRA
GRC
NLD
HKG
HUN
IRL
ISL
ISR
ITA
JPN
JOR
LVALTULUX
MAC
MEX
NOR
NZL
POL
PRT
GBRCZE
ROM
SWECHE
THA
TUN
TUR
URY
-100
-50
050
100
PIS
A 2
006
read
ing
resi
dual
-3 -2 -1 0 1Country corruption measure
PANEL A: MATH PANEL B: READING
FIGURE 1: TEST SCORES AND CORRUPTION
Notes: The scatter plots in panels A and B depict the relationship between the residuals from a regression of performance on the PISA exams in 2006 on expenditure on primary education per capita as a share of 2005 GDP per capita, and the World Bank corruption index (Kaufmann, Kraay, and Mastruzzi (2005)). The data used for these graphs can be found: http://www.pisa.oecd.org.

GER
ARG
AUS
AUTBEL
BRABGR
CHL
COL
KOR
HRVDNK
SVK
SVN
ESP
EST
FIN
FRA
GRC
NLD
HKG
HUN
IRL
ISL
ISR
ITA
JPN
JOR
LVALTU
LUXMAC
MEX
NOR
NZLPOL
PRT
GBRCZE
ROM
SWECHE
THA
TUN
TUR
URY
350
400
450
500
550
600
PIS
A 2
006
read
ing
10 15 20 25Spending on primary education/GDP per capita
FINHKG KOR
PANEL A: MATH PANEL B
FIGURE 2: TEST SCORES AND SPENDING IN PRIMARY SCHOOL PER PUPIL IN 2005
Notes: The scatter plots in panels A and B depict the relationship between a country’s performance on the PISA exams in 2006 and its expenditure on primary education per capita as a share of GDP per capita in 2005. The data used for these graphs can be found: http://www.pisa.oecd.org.
GER
ARG
AUSNLDMAC JPNBEL
AUT
BRA
BGRCHL
COL
HRV
DNK
SVKIRL
SVNISL
ESP USA
EST
FRA
GRC
HUN
ISR
ITA
JOR
LVALTU LUX
MEX
NORGBR
NZL
POL
PRT
CZE
ROM
SWE
CHE
THA
TUN
TURURY
600
550
500PISA 2006 math
450
400
350
10 15 20Spending on primary education/GDP per capita
25
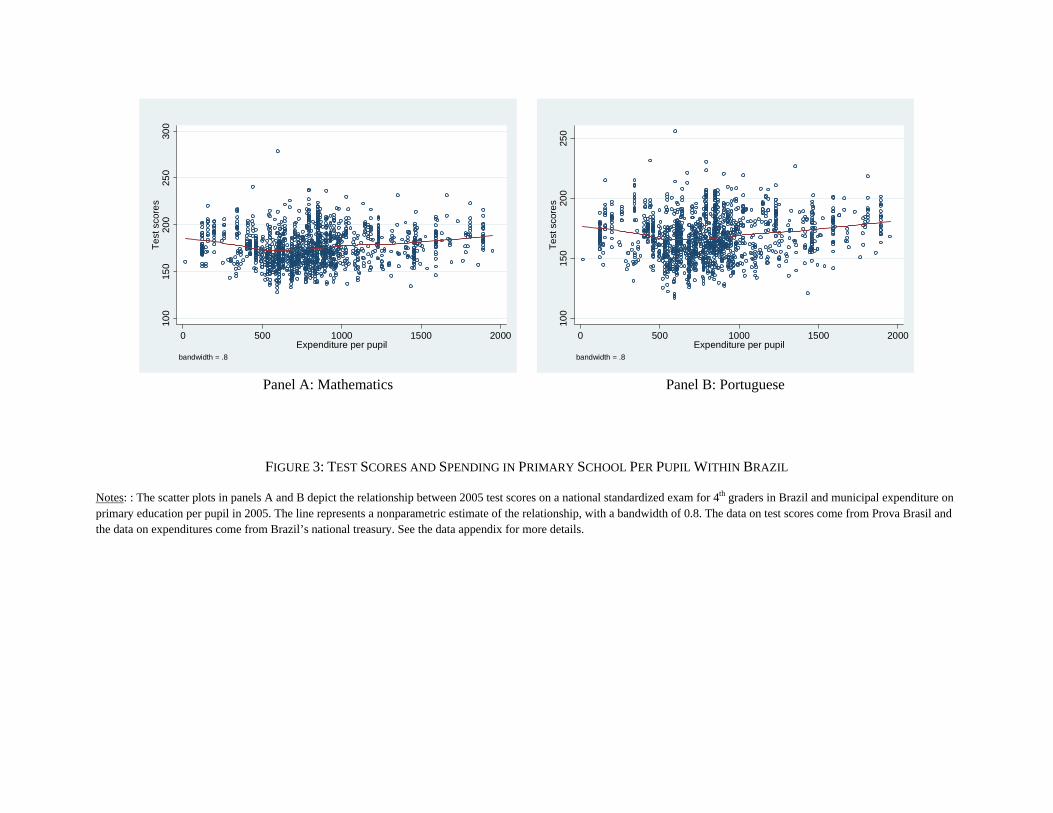
100
150
200
250
300
Test
sco
res
0 500 1000 1500 2000Expenditure per pupil
bandwidth = .8
100
150
200
250
Test
sco
res
0 500 1000 1500 2000Expenditure per pupil
bandwidth = .8
Panel A: Mathematics Panel B: Portuguese
FIGURE 3: TEST SCORES AND SPENDING IN PRIMARY SCHOOL PER PUPIL WITHIN BRAZIL
Notes: : The scatter plots in panels A and B depict the relationship between 2005 test scores on a national standardized exam for 4th graders in Brazil and municipal expenditure on primary education per pupil in 2005. The line represents a nonparametric estimate of the relationship, with a bandwidth of 0.8. The data on test scores come from Prova Brasil and the data on expenditures come from Brazil’s national treasury. See the data appendix for more details.

0.0
1.0
2.0
3kd
ensi
ty m
at_4
a
100 150 200 250 300
No corruption Corruption
0.0
1.0
2.0
3kd
ensi
ty p
ort_
4a
100 150 200 250
No corruption Corruption
Panel A: Mathematics Panel B: Portuguese
FIGURE 4: DISTRIBUTION OF TEST SCORES FOR MATHEMATICS AND PORTUGUESE BY CORRUPTION
Notes: Panels A and B display kernel densities of 2005 test scores aggregated at the school-level by subject matter. The densities were estimated separately depending on whether the school resided in municipality where corruption was detected in education. The densities were estimated using the Epanechnikov kernel, with an optimally computed bandwidth.
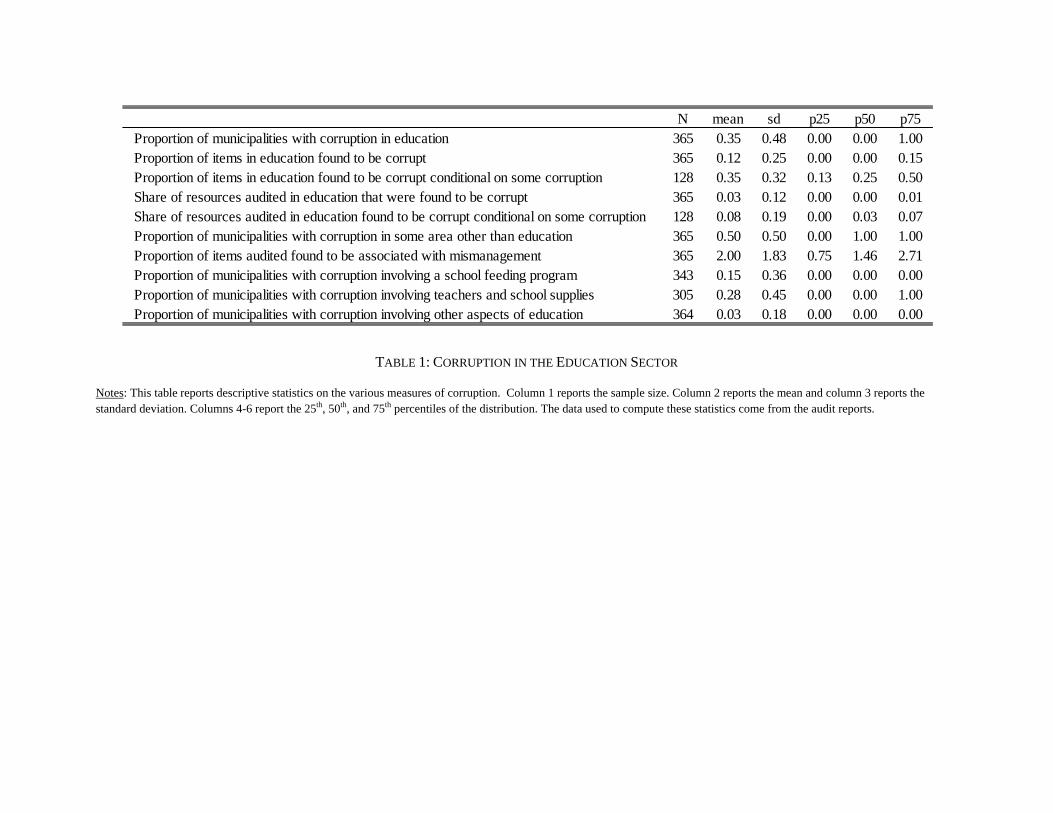
N mean sd p25 p50 p75Proportion of municipalities with corruption in education 365 0.35 0.48 0.00 0.00 1.00Proportion of items in education found to be corrupt 365 0.12 0.25 0.00 0.00 0.15Proportion of items in education found to be corrupt conditional on some corruption 128 0.35 0.32 0.13 0.25 0.50Share of resources audited in education that were found to be corrupt 365 0.03 0.12 0.00 0.00 0.01Share of resources audited in education found to be corrupt conditional on some corruption 128 0.08 0.19 0.00 0.03 0.07Proportion of municipalities with corruption in some area other than education 365 0.50 0.50 0.00 1.00 1.00Proportion of items audited found to be associated with mismanagement 365 2.00 1.83 0.75 1.46 2.71Proportion of municipalities with corruption involving a school feeding program 343 0.15 0.36 0.00 0.00 0.00Proportion of municipalities with corruption involving teachers and school supplies 305 0.28 0.45 0.00 0.00 1.00Proportion of municipalities with corruption involving other aspects of education 364 0.03 0.18 0.00 0.00 0.00
Notes: This table reports descriptive statistics on the various measures of corruption. Column 1 reports the sample size. Column 2 reports the mean and column 3 reports the standard deviation. Columns 4-6 report the 25th, 50th, and 75th percentiles of the distribution. The data used to compute these statistics come from the audit reports.
TABLE 1: CORRUPTION IN THE EDUCATION SECTOR

N mean sd p25 p50 p75Panel A: Student characteristics
Standardized exam in Mathematics - 4th grade 1488 175.80 18.25 162.23 174.01 188.22Standardized exam in Portuguese - 4th grade 1488 168.09 18.07 155.41 167.10 180.15% males 1488 0.50 0.09 0.45 0.50 0.56% white 1488 0.31 0.15 0.21 0.29 0.39% of mothers with a high school degree 1488 0.17 0.09 0.10 0.15 0.21% of fathers with a high school degree 1488 0.15 0.08 0.09 0.14 0.19% children that live with both parents 1488 0.61 0.12 0.54 0.62 0.70Family size 1488 0.26 0.13 0.17 0.24 0.34% families with a home computer 1488 0.15 0.10 0.08 0.13 0.20% families with electricity at home 1488 0.92 0.09 0.89 0.94 0.97% families with running water at home 1488 0.84 0.14 0.79 0.88 0.93% of children who are 8 years old or younger 1488 0.01 0.02 0.00 0.00 0.02% of children who are 9 years old 1488 0.05 0.05 0.01 0.04 0.07% of children who are 10 years old 1488 0.36 0.18 0.22 0.35 0.49% of children who are 11 years old 1488 0.25 0.10 0.18 0.24 0.31% of children who are 12 years old 1488 0.12 0.07 0.07 0.11 0.16
Panel B: School Characteristics Dropout rates 1488 0.04 0.07 0.00 0.02 0.06Failure rates 1488 0.10 0.09 0.03 0.09 0.16% of teachers with a teaching credentials 1488 0.43 0.36 0.05 0.42 0.75School has a computer lab 1488 0.19 0.39 0.00 0.00 0.00School has a science lab 1488 0.04 0.19 0.00 0.00 0.00School has sanitation 1488 0.03 0.17 0.00 0.00 0.00Director's survey
Lack of financial resources is a serious concern 1488 0.55 0.50 0.00 1.00 1.00Lack of schooling supplies is a serious concern 1488 0.40 0.49 0.00 0.00 1.00Lack of teachers is a serious concern 1488 0.23 0.42 0.00 0.00 0.00Disciplinary problems is a serious concern 1488 0.63 0.48 0.00 1.00 1.00Training courses are provided to teachers 1488 0.49 0.50 0.00 0.00 1.00
Teacher's surveyLack of financial resources is a serious concern 1488 0.56 0.50 0.00 1.00 1.00Lack of schooling supplies is a serious concern 1488 0.51 0.50 0.00 1.00 1.00Lack of teachers is a serious concern 1488 0.26 0.44 0.00 0.00 1.00Disciplinary problems is a serious concern 1488 0.63 0.48 0.00 1.00 1.00
TABLE 2: SUMMARY STATISTICS
Notes: This table reports descriptive statistics for the variables used in the analysis. Column 1 reports the sample size. Column 2 reports the mean and column 3 reports the standard deviation. Columns 4-6 report the 25th, 50th, and 75th percentiles of the distribution. The variables presented in Panels A and B are computed for the 1488 schools that reside in the 365 municipalities for which information on corruption exists.

N mean sd p25 p50 p75Panel C: Municipal Characteristics
% population urban 365 0.61 0.23 0.44 0.62 0.80Gini 365 0.57 0.06 0.54 0.57 0.61GDP per capita 365 8707.74 22821.08 2545.43 4678.03 8544.47Expenditure in primary school per child 365 942.20 487.67 656.48 856.68 1106.40Dropout rates among private schools 188 0.01 0.03 0.00 0.00 0.00Failure rates among private schools 188 0.02 0.04 0.00 0.00 0.02Election is held for principal 365 0.10 0.30 0.00 0.00 0.00Average number of state schools that elect its principal 365 0.43 1.25 0.00 0.00 0.00Average number of state schools in the municipality 365 1.68 3.31 0.00 1.00 2.00PTA is active in the municipality 365 0.48 0.50 0.00 0.00 1.00Municipality has a intergovernmental consortium 365 0.26 0.44 0.00 0.00 1.00Municipality has an education council 365 0.69 0.46 0.00 1.00 1.00Schools receive support from private sector 365 0.07 0.25 0.00 0.00 0.00Municipality uses participatory budgeting 365 0.71 0.45 0.00 1.00 1.00The community helps in the maintenance of the school 365 0.15 0.36 0.00 0.00 0.00The school participated in an awareness campaign for the community 365 0.41 0.49 0.00 0.00 1.00
TABLE 2: SUMMARY STATISTICS (CONTINUED…)
Notes: This table reports descriptive statistics for the variables used in the analysis. Column 1 reports the sample size. Column 2 reports the mean and column 3 reports the standard deviation. Columns 4-6 report the 25th, 50th, and 75th percentiles of the distribution. The variables presented in Panels A and B are computed for the 1488 schools that reside in the 365 municipalities for which information on corruption exists.

Dependent variable:(1) (2) (3) (4) (5) (6) (7) (8)
Panel A:Proportion of items with corruption in education -0.323 -0.321 -0.356 -0.357 0.021 0.02 0.019 0.017
[0.069]*** [0.073]*** [0.068]*** [0.072]*** [0.010]** [0.010]** [0.006]*** [0.006]***
R-squared 0.49 0.5 0.55 0.57 0.26 0.29 0.15 0.17
Panel B:Share of audited resources with corruption in education -0.722 -0.6 -0.9 -0.731 0.048 0.034 0.029 0.024
[0.372]* [0.352]* [0.413]** [0.388]* [0.016]*** [0.017]* [0.023] [0.024]
R-squared 0.49 0.49 0.54 0.56 0.26 0.28 0.15 0.16
Panel C:Corruption in education -0.356 -0.33 -0.357 -0.317 0.029 0.026 0.019 0.019
[0.076]*** [0.078]*** [0.070]*** [0.074]*** [0.005]*** [0.005]*** [0.008]** [0.008]**
R-squared 0.51 0.51 0.56 0.57 0.29 0.31 0.16 0.17
Panel D:Low corruption in education -0.373 -0.328 -0.377 -0.35 0.028 0.025 0.018 0.019
[0.074]*** [0.079]*** [0.083]*** [0.085]*** [0.006]*** [0.006]*** [0.009]** [0.009]**High corruption in education -0.321 -0.287 -0.304 -0.282 0.03 0.027 0.019 0.018
[0.122]*** [0.131]** [0.115]*** [0.120]** [0.008]*** [0.008]*** [0.010]** [0.009]*
R-squared 0.56 0.57 0.51 0.51 0.29 0.31 0.16 0.17F-test: low corruption = high corruption 0.17 0.09 0.38 0.29 0.02 0.05 0.00 0.01
Student characteristics Yes Yes Yes Yes Yes Yes Yes YesMunicipal characteristics No Yes No Yes No Yes No Yes
Mathematics Portuguese Dropout rates Failure rates
TABLE 3: THE EFFECTS OF CORRUPTION ON SCHOOLING OUTCOMES
Notes: This table reports the effects of corruption on various education outcomes. Each column presents the results of an OLS regression where the dependent variable is listed at the top of each column. For the results reported in Panels A, C, and D, the number of observations is 1488 schools. Whereas, for Panel B, the number of observations is 1479, due to missing values in the amount of resources audited. Student characteristics included proportion of male children, proportion of white children, the schooling of the mother, schooling of the father, the proportion of kids with both parents living at home, family size, proportion of households with a computer, proportion of families with running water, proportion of families with electricity, age dummies. Municipal characteristics included share of population that resides in urban areas, Gini coefficient, GDP per capita in 2004, expenditure per child in primary school. Robust standard errors clustered at the municipality are displayed in brackets. Significantly different than zero at 99 (***), 95 (**), 90 (*) percent confidence.

Dependent variable: Mathematics Portuguese Dropout rates Failure rates(1) (2) (3) (4)
Corruption in education -0.28 -0.279 0.034 0.027[0.120]** [0.100]*** [0.011]*** [0.012]**
Corruption in other sectors 0.023 0.014 0.011 0.012[0.116] [0.096] [0.010] [0.011]
Student characteristics Yes Yes Yes YesMunicipal characteristics Yes Yes Yes YesNumber of schools 1251 1251 1251 1251R-squared 0.48 0.54 0.29 0.17
TABLE 4: THE EFFECTS OF CORRUPTION ON SCHOOLING OUTCOMES CONTROLLING FOR INSTITUTIONAL QUALITY
Notes: This table reports the effects of corruption on various education outcomes. Each column presents the results of an OLS regression where the dependent variable is listed at the top of each column. Our measure of corruption is an indicator for whether corruption was detected in education. Our measure of other corruption is an indicator for whether corruption was detected in sectors other than education. Student characteristics included proportion of male children, proportion of white children, the schooling of the mother, schooling of the father, the proportion of kids with both parents living at home, family size, proportion of households with a computer, proportion of families with running water, proportion of families with electricity, age dummies. Municipal characteristics included share of population that resides in urban areas, Gini coefficient, GDP per capita in 2004, expenditure per child in primary school. Robust standard errors clustered at the municipality are displayed in brackets. Significantly different than zero at 99 (***), 95 (**), 90 (*) percent confidence.

Dependent variable: Dropout rates for private schools
Failure rates for private schools Mathematics Portuguese Dropout rates Failure rates
(1) (2) (3) (4) (5) (6)
Corruption in education -0.005 -0.001 -0.308 -0.28 0.023 0.014[0.004] [0.005] [0.091]*** [0.086]*** [0.005]*** [0.008]*
Corruption in education × Municipality has a private school -0.007 -0.019 0.001 0[0.012] [0.015] [0.001] [0.002]
Student characteristics Yes Yes Yes Yes Yes YesMunicipal characteristics Yes Yes Yes Yes Yes YesNumber of schools 1185 1185 1488 1488 1488 1488R-squared 0.04 0.01 0.53 0.59 0.31 0.19
TABLE 5: PRIVATE SCHOOLS
Notes: This table reports whether there is a differential effects of corruption in municipalities with a private school. Each column presents the results of an OLS regression where the dependent variable is listed at the top of each column. In columns 1 and 2, the dependent variables are dropout and failure rates of children in private schools. In columns 3-6, the dependent variables are the education outcomes for children attending municipal schools (as in the previous tables). Our measure of corruption is an indicator for whether corruption was detected in education. Student characteristics included proportion of male children, proportion of white children, the schooling of the mother, schooling of the father, the proportion of kids with both parents living at home, family size, proportion of households with a computer, proportion of families with running water, proportion of families with electricity, age dummies. Municipal characteristics included share of population that resides in urban areas, Gini coefficient, GDP per capita in 2004, expenditure per child in primary school. Robust standard errors clustered at the municipality are displayed in brackets. Significantly different than zero at 99 (***), 95 (**), 90 (*) percent confidence.

Dependent variable:Mathematics Portuguese
Dropout rates
Failure rates Mathematics Portuguese
Dropout rates
Failure rates
(1) (2) (3) (4) (5) (6) (7) (8)
Corruption in education -0.351 -0.328 0.028 0.017 -0.325 -0.312 0.025 0.019[0.078]*** [0.073]*** [0.005]*** [0.008]** [0.079]*** [0.075]*** [0.005]*** [0.008]**
Principal is elected 0.173 0.115 0.002 0.004[0.090]* [0.068]* [0.005] [0.007]
Active PTA 0.017 0.057 -0.004 -0.003[0.048] [0.040] [0.003] [0.005]
Intergovernment consortium 0.142 0.152 -0.006 0.007[0.084]* [0.075]** [0.005] [0.008]
Education council -0.077 -0.052 0 0.007[0.087] [0.074] [0.004] [0.007]
Schools receive support from private sector -0.141 -0.093 0.004 -0.025[0.113] [0.110] [0.005] [0.013]*
Participatory Budgeting 0.004 0.056 0.009 -0.007[0.082] [0.076] [0.005]* [0.009]
The community helps in the maintenance of the school 0.099 0.075 -0.005 -0.003[0.056]* [0.044]* [0.003] [0.006]
The school participated in an awareness campaign for the community 0.021 0.012 -0.002 0.007[0.037] [0.037] [0.003] [0.005]
Student characteristics Yes Yes Yes Yes Yes Yes Yes YesMunicipal characteristics Yes Yes Yes Yes Yes Yes Yes YesNumber of schools 1488 1488 1488 1488 1488 1488 1488 1488R-squared 0.52 0.58 0.31 0.18 0.51 0.57 0.31 0.17
TABLE 6: EFFECTS OF CORRUPTION ON SCHOOLING OUTCOMES ACCOUNTING FOR SCHOOL ORGANIZATIONS AND COMMUNITY INVOLVEMENT
Notes: This table reports the effects of corruption on various education outcomes, controlling for the existence and efficacy of school organizations and the degree of community involvement in education. Each column presents the results of an OLS regression where the dependent variable is listed at the top of each column. Our measure of corruption is an indicator for whether corruption was detected in education. Student characteristics included proportion of male children, proportion of white children, the schooling of the mother, schooling of the father, the proportion of kids with both parents living at home, family size, proportion of households with a computer, proportion of families with running water, proportion of families with electricity, age dummies. Municipal characteristics included share of population that resides in urban areas, Gini coefficient, GDP per capita in 2004, expenditure per child in primary school. Robust standard errors clustered at the municipality are displayed in brackets. Significantly different than zero at 99 (***), 95 (**), 90 (*) percent confidence.

Dependent variable: Mathematics Portuguese Dropout rates Failure rates(1) (2) (3) (4)
Corruption in education -0.304 -0.289 0.025 0.02[0.082]*** [0.078]*** [0.005]*** [0.008]**
Mismanagement -0.044 -0.048 0.001 -0.003[0.018]*** [0.018]*** [0.001] [0.003]
Student characteristics Yes Yes Yes YesMunicipal characteristics Yes Yes Yes YesNumber of schools 1486 1486 1486 1486R-squared 0.52 0.59 0.31 0.19
TABLE 7: EFFECTS OF CORRUPTION ON SCHOOLING OUTCOMES ACCOUNTING FOR MISMANAGEMENT
Notes: This table reports the effects of corruption on various education outcomes, controlling for mismanagement and corruption in other sectors. Each column presents the results of an OLS regression where the dependent variable is listed at the top of each column. Our measure of corruption is an indicator for whether corruption was detected in education. Our measure of mismanagement is the share of audited service items that found to be associated with poor management practices. Student characteristics included proportion of male children, proportion of white children, the schooling of the mother, schooling of the father, the proportion of kids with both parents living at home, family size, proportion of households with a computer, proportion of families with running water, proportion of families with electricity, age dummies. Municipal characteristics included share of population that resides in urban areas, Gini coefficient, GDP per capita in 2004, expenditure per child in primary school. Robust standard errors clustered at the municipality are displayed in brackets. Significantly different than zero at 99 (***), 95 (**), 90 (*) percent confidence.

Dependent variable: Percentage of teachers with a teaching credential
Proportion of schools with a computer lab
Proportion of schools with a science lab
Proportion of school with sanitation
(1) (2) (3) (3)
Corruption in education -0.107 -0.068 -0.02 -0.003[0.061]* [0.027]** [0.009]** [0.016]
Student characteristics Yes Yes Yes YesMunicipal characteristics No Yes No NoNumber of schools 1488 1488 1488 1488R-squared 0.25 0.13 0.08 0.02
TABLE 8: THE EFFECTS OF CORRUPTION ON SCHOOLING INPUTS
Notes: This table reports the effects of corruption on various schooling inputs. Each column presents the results of an OLS regression where the dependent variable is listed at the top of each column. Our measure of corruption is an indicator for whether corruption was detected in education. Student characteristics included proportion of male children, proportion of white children, the schooling of the mother, schooling of the father, the proportion of kids with both parents living at home, family size, proportion of households with a computer, proportion of families with running water, proportion of families with electricity, age dummies. Municipal characteristics included share of population that resides in urban areas, Gini coefficient, GDP per capita in 2004, expenditure per child in primary school. Robust standard errors clustered at the municipality are displayed in brackets. Significantly different than zero at 99 (***), 95 (**), 90 (*) percent confidence.
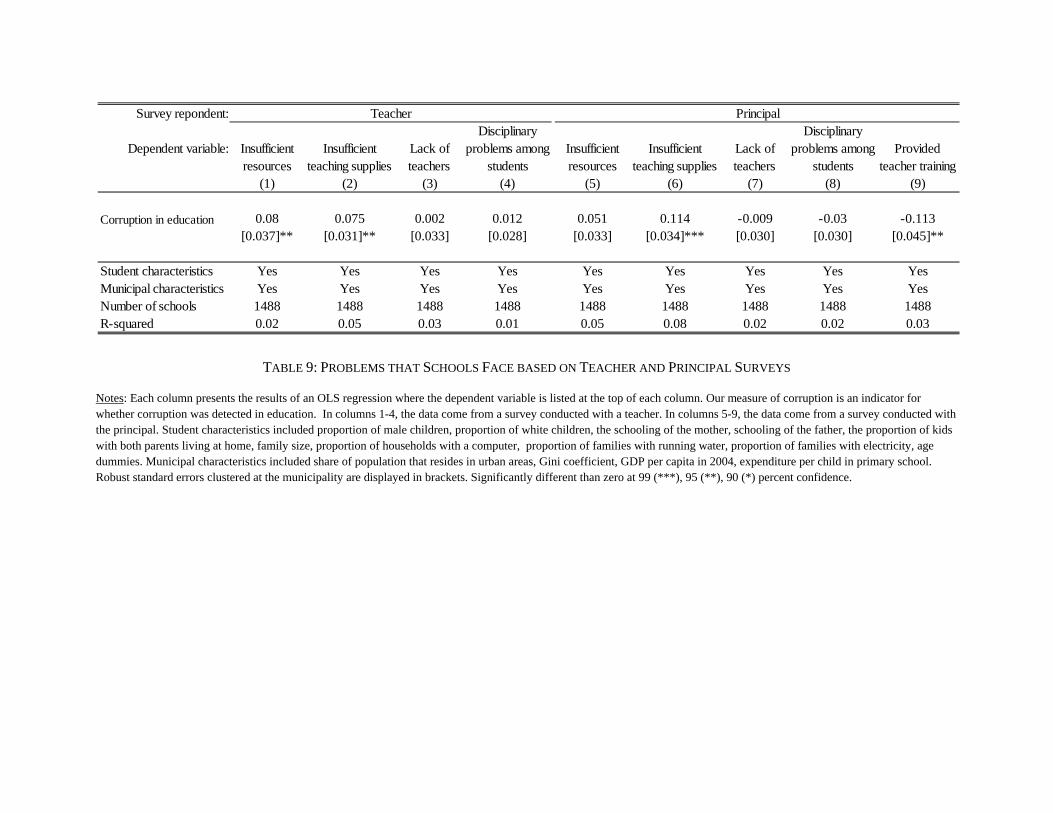
Survey repondent:
Dependent variable: Insufficient resources
Insufficient teaching supplies
Lack of teachers
Disciplinary problems among
studentsInsufficient resources
Insufficient teaching supplies
Lack of teachers
Disciplinary problems among
studentsProvided
teacher training(1) (2) (3) (4) (5) (6) (7) (8) (9)
Corruption in education 0.08 0.075 0.002 0.012 0.051 0.114 -0.009 -0.03 -0.113[0.037]** [0.031]** [0.033] [0.028] [0.033] [0.034]*** [0.030] [0.030] [0.045]**
Student characteristics Yes Yes Yes Yes Yes Yes Yes Yes YesMunicipal characteristics Yes Yes Yes Yes Yes Yes Yes Yes YesNumber of schools 1488 1488 1488 1488 1488 1488 1488 1488 1488R-squared 0.02 0.05 0.03 0.01 0.05 0.08 0.02 0.02 0.03
Teacher Principal
TABLE 9: PROBLEMS THAT SCHOOLS FACE BASED ON TEACHER AND PRINCIPAL SURVEYS
Notes: Each column presents the results of an OLS regression where the dependent variable is listed at the top of each column. Our measure of corruption is an indicator for whether corruption was detected in education. In columns 1-4, the data come from a survey conducted with a teacher. In columns 5-9, the data come from a survey conducted with the principal. Student characteristics included proportion of male children, proportion of white children, the schooling of the mother, schooling of the father, the proportion of kids with both parents living at home, family size, proportion of households with a computer, proportion of families with running water, proportion of families with electricity, age dummies. Municipal characteristics included share of population that resides in urban areas, Gini coefficient, GDP per capita in 2004, expenditure per child in primary school. Robust standard errors clustered at the municipality are displayed in brackets. Significantly different than zero at 99 (***), 95 (**), 90 (*) percent confidence.

Dependent variable: Mathematics Portuguese Dropout rates Failure rates(1) (2) (3) (4)
Corruption involving a school feeding program -0.163 -0.125 0.01 0.007[0.116] [0.117] [0.009] [0.011]
Corruption involving teachers and schooling inputs -0.186 -0.171 0.02 0.01[0.092]** [0.090]* [0.006]*** [0.010]
Corruption involving other aspects of education -0.272 -0.305 0.006 0.024[0.226] [0.186] [0.012] [0.016]
Student characteristics Yes Yes Yes YesMunicipal characteristics Yes Yes Yes YesNumber of schools 1230 1230 1230 1230R-squared 0.49 0.56 0.3 0.15
TABLE 10: THE EFFECTS OF CORRUPTION BY TYPE OF IRREGULARITY
Notes: Each column presents the results of an OLS regression where the dependent variable is listed at the top of each column. Corruption involving a school feeding program is an indicator for whether corruption was detected in a school feeding program. Corruption involving teachers and schooling inputs is an indicator for whether corruption was detected in delivery of school supplies or teachers’ salaries. Corruption involving other aspects of education is an indicator for whether corruption was detected in an area of education other than school feeding or schooling inputs. Student characteristics included proportion of male children, proportion of white children, the schooling of the mother, schooling of the father, the proportion of kids with both parents living at home, family size, proportion of households with a computer, proportion of families with running water, proportion of families with electricity, age dummies. Municipal characteristics included share of population that resides in urban areas, Gini coefficient, GDP per capita in 2004, expenditure per child in primary school. Robust standard errors clustered at the municipality are displayed in brackets. Significantly different than zero at 99 (***), 95 (**), 90 (*) percent confidence.

Dependent variable: Corruption in education Corruption in other sectors(1) (4)
Panel A: OLSPrincipal is elected -0.169 0.019
[0.066]** [0.086]Panel B: IV
Principal is elected -0.835 0.403[0.437]* [0.438]
Municipal characteristics Yes YesNumber of observation 365 365F-test on excluded instrument 13.9 13.9
TABLE 11: THE EFFECTS OF PRINCIPAL ELECTIONS ON CORRUPTION IN EDUCATION
Notes: In Panel A, each column presents the results of an OLS regression estimated at the level of the municipality where the dependent variable is listed at the top of each column. Panel B presents IV estimates, where the excluded instrument is the number of state schools with elected principals. Principal is elected is an indicator for whether the principal of the municipal school is elected. Municipal characteristics included share of population that resides in urban areas, Gini coefficient, GDP per capita in 2004, expenditure per child in primary school. Robust standard errors are displayed in brackets. Significantly different than zero at 99 (***), 95 (**), 90 (*) percent confidence.

Notes: This table reports the effects of corruption on various educational outcomes. Each column in Panel A presents the results of an OLS regression where the dependent variable is listed at the top of each column, whereas Panel B presents estimates from the Abadie and Imbens (2004) matching estimator. Our measure of corruption is an indicator for whether corruption was detected in education. The propensity score is estimated from a logit regression based on a 3rd order polynomial approximation of the student and municipal characteristics. Robust standard errors clustered at the municipality are displayed in brackets. Significantly different than zero at 99 (***), 95 (**), 90 (*) percent confidence. The sample has been restricted to areas of common support based on the estimated propensity score.
Dependent variable: Mathematics Portuguese Dropout rates Failure rates(1) (2) (3) (4)
Panel A: Propensity score -0.332 -0.331 0.019 0.017Corruption in education [0.101]*** [0.095]*** [0.007]** [0.010]*
Panel B: Propensity score matching -0.592 -0.588 0.019 0.018Corruption in education [0.103]*** [0.112]*** [0.006]*** [0.012]
Number of schools 1449 1449 1449 1449
TABLE A1: THE EFFECTS OF CORRUPTION ON SCHOOLING OUTCOMES USING PROPENSITY SCORE MATCHING

Dependent variable: Unadjusted difference Propensity-score adjusted difference(1) (2)
Share of male students -0.001 0.004[0.005] [0.007]
Share of white students -0.072 -0.01[0.015]*** [0.020]
Share of mothers with a high school degree -0.026 0[0.008]*** [0.009]
Share of fathers with a high school degree -0.028 -0.003[0.009]*** [0.009]
Both parents reside in the household -0.024 0.011[0.013]* [0.012]
Household size 0.094 0.026[0.014]*** [0.013]*
Proportion of households with electricity -0.021 0.004[0.008]*** [0.009]
Proportion of households with running water -0.052 -0.005[0.013]*** [0.015]
Age 3 -0.079 0[0.023]*** [0.022]
Age 4 0.002 -0.007[0.012] [0.015]
Age 5 0.031 0.01[0.006]*** [0.009]
Gini coefficient 0.023 -0.001[0.006]*** [0.009]
Per capita income -3,510.11 -1,385.72[785.241]*** [993.955]
Share of expenditures in education per child -0.153 -0.116[0.062]** [0.107]
TABLE A2: DIFFERENCE IN MEANS BEFORE AND AFTER ADJUSTING FOR THE PROPENSITY SCORE
Notes: This table reports differences in student and municipal characteristics between municipalities where corruption in education was detect and those where corruption in education was not detected. Column 1 reports the unadjusted differences, whereas column 2 reports the differences conditional on the propensity score. The propensity score is estimated from a logit regression based on a 3rd order polynomial approximation of the student and municipal characteristics. Robust standard errors clustered at the municipality are displayed in brackets. Significantly different than zero at 99 (***), 95 (**), 90 (*) percent confidence. The sample has been restricted to areas of common support based on the estimated propensity score.

0.5
11.
52
0 .1 .2 .3 .4 .5 .6 .7 .8 .9 1Propensity score
No Corruption Corruption
FIGURE A1: OVERLAP IN THE DISTRIBUTION OF THE ESTIMATED PROPENSITY OF BEING CORRUPT
Notes: Figure A1 displays the distribution of the propensity score for detecting corruption in education. The propensity score is estimated from a logit regression based on a 3rd order polynomial approximation of the student and municipal characteristics. The densities were estimated using the Epanechnikov kernel, with an optimally computed bandwidth.