Embed Size (px)
Citation preview
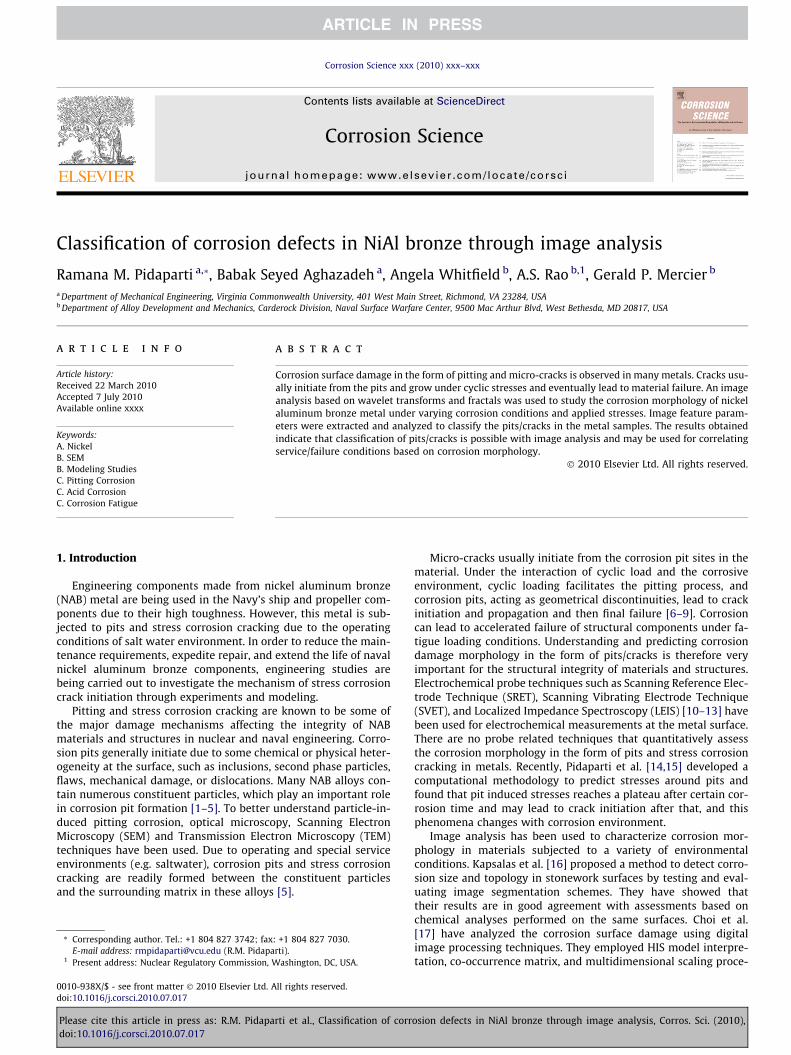
Classification of corrosion defects in NiAl bronze through image analysis
Ramana M. Pidaparti a,*, Babak Seyed Aghazadeh a, Angela Whitfield b, A.S. Rao b,1, Gerald P. Mercier b
a Department of Mechanical Engineering, Virginia Commonwealth University, 401 West Main Street, Richmond, VA 23284, USAb Department of Alloy Development and Mechanics, Carderock Division, Naval Surface Warfare Center, 9500 Mac Arthur Blvd, West Bethesda, MD 20817, USA
a r t i c l e i n f o
Article history:Received 22 March 2010Accepted 7 July 2010Available online xxxx
Keywords:A. NickelB. SEMB. Modeling StudiesC. Pitting CorrosionC. Acid CorrosionC. Corrosion Fatigue
a b s t r a c t
Corrosion surface damage in the form of pitting and micro-cracks is observed in many metals. Cracks usu-ally initiate from the pits and grow under cyclic stresses and eventually lead to material failure. An imageanalysis based on wavelet transforms and fractals was used to study the corrosion morphology of nickelaluminum bronze metal under varying corrosion conditions and applied stresses. Image feature param-eters were extracted and analyzed to classify the pits/cracks in the metal samples. The results obtainedindicate that classification of pits/cracks is possible with image analysis and may be used for correlatingservice/failure conditions based on corrosion morphology.
� 2010 Elsevier Ltd. All rights reserved.
1. Introduction
Engineering components made from nickel aluminum bronze(NAB) metal are being used in the Navy’s ship and propeller com-ponents due to their high toughness. However, this metal is sub-jected to pits and stress corrosion cracking due to the operatingconditions of salt water environment. In order to reduce the main-tenance requirements, expedite repair, and extend the life of navalnickel aluminum bronze components, engineering studies arebeing carried out to investigate the mechanism of stress corrosioncrack initiation through experiments and modeling.
Pitting and stress corrosion cracking are known to be some ofthe major damage mechanisms affecting the integrity of NABmaterials and structures in nuclear and naval engineering. Corro-sion pits generally initiate due to some chemical or physical heter-ogeneity at the surface, such as inclusions, second phase particles,flaws, mechanical damage, or dislocations. Many NAB alloys con-tain numerous constituent particles, which play an important rolein corrosion pit formation [1–5]. To better understand particle-in-duced pitting corrosion, optical microscopy, Scanning ElectronMicroscopy (SEM) and Transmission Electron Microscopy (TEM)techniques have been used. Due to operating and special serviceenvironments (e.g. saltwater), corrosion pits and stress corrosioncracking are readily formed between the constituent particlesand the surrounding matrix in these alloys [5].
Micro-cracks usually initiate from the corrosion pit sites in thematerial. Under the interaction of cyclic load and the corrosiveenvironment, cyclic loading facilitates the pitting process, andcorrosion pits, acting as geometrical discontinuities, lead to crackinitiation and propagation and then final failure [6–9]. Corrosioncan lead to accelerated failure of structural components under fa-tigue loading conditions. Understanding and predicting corrosiondamage morphology in the form of pits/cracks is therefore veryimportant for the structural integrity of materials and structures.Electrochemical probe techniques such as Scanning Reference Elec-trode Technique (SRET), Scanning Vibrating Electrode Technique(SVET), and Localized Impedance Spectroscopy (LEIS) [10–13] havebeen used for electrochemical measurements at the metal surface.There are no probe related techniques that quantitatively assessthe corrosion morphology in the form of pits and stress corrosioncracking in metals. Recently, Pidaparti et al. [14,15] developed acomputational methodology to predict stresses around pits andfound that pit induced stresses reaches a plateau after certain cor-rosion time and may lead to crack initiation after that, and thisphenomena changes with corrosion environment.
Image analysis has been used to characterize corrosion mor-phology in materials subjected to a variety of environmentalconditions. Kapsalas et al. [16] proposed a method to detect corro-sion size and topology in stonework surfaces by testing and eval-uating image segmentation schemes. They have showed thattheir results are in good agreement with assessments based onchemical analyses performed on the same surfaces. Choi et al.[17] have analyzed the corrosion surface damage using digitalimage processing techniques. They employed HIS model interpre-tation, co-occurrence matrix, and multidimensional scaling proce-
0010-938X/$ - see front matter � 2010 Elsevier Ltd. All rights reserved.doi:10.1016/j.corsci.2010.07.017
* Corresponding author. Tel.: +1 804 827 3742; fax: +1 804 827 7030.E-mail address: [email protected] (R.M. Pidaparti).
1 Present address: Nuclear Regulatory Commission, Washington, DC, USA.
Corrosion Science xxx (2010) xxx–xxx
Contents lists available at ScienceDirect
Corrosion Science
journal homepage: www.elsevier .com/ locate /corsc i
Please cite this article in press as: R.M. Pidaparti et al., Classification of corrosion defects in NiAl bronze through image analysis, Corros. Sci. (2010),doi:10.1016/j.corsci.2010.07.017
Report Documentation Page Form ApprovedOMB No. 0704-0188
Public reporting burden for the collection of information is estimated to average 1 hour per response, including the time for reviewing instructions, searching existing data sources, gathering andmaintaining the data needed, and completing and reviewing the collection of information. Send comments regarding this burden estimate or any other aspect of this collection of information,including suggestions for reducing this burden, to Washington Headquarters Services, Directorate for Information Operations and Reports, 1215 Jefferson Davis Highway, Suite 1204, ArlingtonVA 22202-4302. Respondents should be aware that notwithstanding any other provision of law, no person shall be subject to a penalty for failing to comply with a collection of information if itdoes not display a currently valid OMB control number.
1. REPORT DATE MAR 2010 2. REPORT TYPE
3. DATES COVERED 00-00-2010 to 00-00-2010
4. TITLE AND SUBTITLE Classification of corrosion defects in NiAl bronze through image analysis
5a. CONTRACT NUMBER
5b. GRANT NUMBER
5c. PROGRAM ELEMENT NUMBER
6. AUTHOR(S) 5d. PROJECT NUMBER
5e. TASK NUMBER
5f. WORK UNIT NUMBER
7. PERFORMING ORGANIZATION NAME(S) AND ADDRESS(ES) Naval Surface Warfare Center Carderock Division,Department of AlloyDevelopment and Mechanics,9500 Mac Arthur Blvd,West Bethesda,MD,20817
8. PERFORMING ORGANIZATIONREPORT NUMBER
9. SPONSORING/MONITORING AGENCY NAME(S) AND ADDRESS(ES) 10. SPONSOR/MONITOR’S ACRONYM(S)
11. SPONSOR/MONITOR’S REPORT NUMBER(S)
12. DISTRIBUTION/AVAILABILITY STATEMENT Approved for public release; distribution unlimited
13. SUPPLEMENTARY NOTES
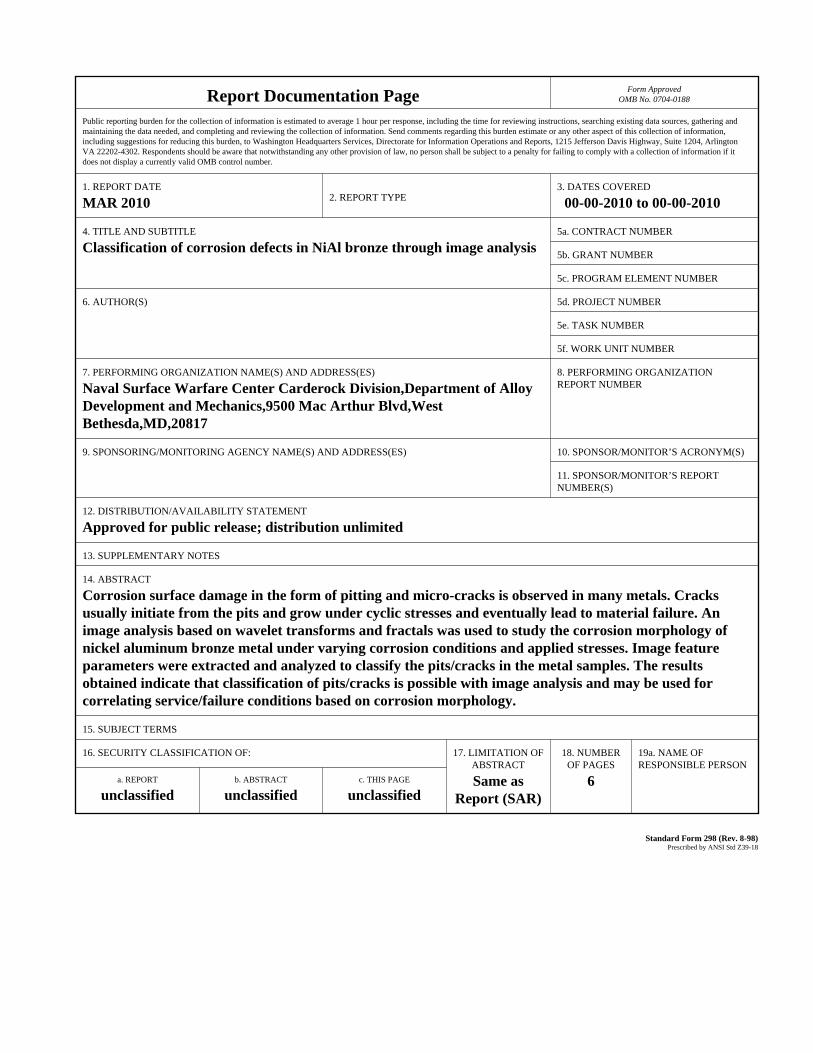
14. ABSTRACT Corrosion surface damage in the form of pitting and micro-cracks is observed in many metals. Cracksusually initiate from the pits and grow under cyclic stresses and eventually lead to material failure. Animage analysis based on wavelet transforms and fractals was used to study the corrosion morphology ofnickel aluminum bronze metal under varying corrosion conditions and applied stresses. Image featureparameters were extracted and analyzed to classify the pits/cracks in the metal samples. The resultsobtained indicate that classification of pits/cracks is possible with image analysis and may be used forcorrelating service/failure conditions based on corrosion morphology.
15. SUBJECT TERMS
16. SECURITY CLASSIFICATION OF: 17. LIMITATION OF ABSTRACT Same as
Report (SAR)
18. NUMBEROF PAGES
6
19a. NAME OFRESPONSIBLE PERSON
a. REPORT unclassified
b. ABSTRACT unclassified
c. THIS PAGE unclassified
Standard Form 298 (Rev. 8-98) Prescribed by ANSI Std Z39-18
dure to characterize images by three categories of colour, texture,and shape features. Wang et al. [18] used wavelet packet decom-position energies of images at different wavelet sub-bands as fea-tures to study the atmospheric corrosion behavior of zinc samples.They acquired a relationship between the selected image featuresand the corrosion weight loss. Tao et al. [19] analyzed the atmo-spheric corrosion of field exposure high strength aluminum alloys.They used wavelet packed decomposition energies at differentsub-bands to estimate the corrosion loss of five types of aluminumalloys. It was found that the values of sub-image energies de-creased with increasing exposure time. There are no studies inthe literature on classification of pits/cracks in NAB metals undercombined corrosion and cyclic stresses.
In order to qualitatively and quantitatively characterize theearly stage damage mechanisms in NAB metals under corrosionand cyclic stresses, image analysis of corrosion morphology maybe used as a tool to predict the nucleation of cracks resulting frominitiation and growth of pits. In this study, image analysis based onwavelet transforms and fractals was used to study the corrosionmorphology of Nickel Aluminum Bronze metal under varying cor-rosion conditions and applied cyclic stresses. Image feature param-eters were extracted and analyzed to classify the pits/cracks in theNAB metal samples.
2. Image analysis methods
Several image analysis methods are available for characterizingthe corrosion surface morphology. In this study, wavelet trans-forms and fractals were used for the image analysis based on ourexperience, and are described below briefly.
2.1. Wavelet packet transform
In order to improve the images obtained from microscopytechniques such as SEM and others, multi-resolution wavelettransforms can be used. The details of standard wavelet transfor-mations can be found in the literature [20]. As an extension of thestandard wavelets, wavelet packets (WPs) which represent a gener-alization of the multi-resolution analysis use the entire family ofsub-band decompositions to generate a complete representationof images. There are many outstanding properties of wavelet pack-ets, which encourage researchers to employ them in widespreadfields. It has been shown that sparsity of coefficients’ matrix, com-putational efficiency, multiresolution and time–frequency analysiscan be useful in dealing with many engineering problems. The hier-archical WP transform uses a family of wavelet functions and theirassociated scaling functions to decompose the original time series/signal into subsequent sub-bands. The decomposition process isrecursively applied to both the low and high frequency sub-bandsto generate the next level of the hierarchy.
Two-dimensional discrete wavelet packet transform (DWPT)decomposition allows us to analyze an image simultaneously atdifferent resolution levels and orientations. In 2-D DWPT method,an image is decomposed into one approximation and three detailimages. The approximation and the detail images are then decom-posed into a second-level approximation and detail images, andthe process is repeated. The standard 2-D DWPT can be imple-mented with a low-pass filter and a high-pass filter [20]. The 2-DDWPT of an N �M discrete image A up to level P þ 1 ðP 6minðlog2N; log2MÞÞ is recursively defined in terms of the coeffi-cients at level p as follows:
Cpþ14k;ði;jÞ ¼
X
m
X
n
hðmÞhðnÞCpk;ðmþ2i;nþ2jÞ
Cpþ14kþ1;ði;jÞ ¼
X
m
X
n
hðmÞgðnÞCpk;ðmþ2i;nþ2jÞ
Cpþ14kþ2;ði;jÞ ¼
X
m
X
n
gðmÞhðnÞCpk;ðmþ2i;nþ2jÞ
Cpþ14kþ3;ði;jÞ ¼
X
m
X
n
gðmÞgðnÞCpk;ðmþ2i;nþ2jÞ ð1Þ
where C00 is the image A and k is an index of the nodes in the wave-
let packet tree denoting each sub-band. h and g are the filter coef-ficients of low-pass and high-pass filters, respectively. Supposingthat Haar basis has been used, h ¼ f�0:7071;0:7071g; and g ¼f0:7071;0:7071g: At each step, the image Cp
k is decomposed intofour quarter-size images Cpþ1
4k , Cpþ14kþ1, Cpþ1
4kþ2, andCpþ14kþ3: The capital let-
ters (N or M) are maximum constants defined by the image size.However, small letters (m or n) are defined at each step. For exam-ple, when p = 5, p can be 1, 2, 3, or 4 and so on.
The Shannon entropy in different sub-bands is computed fromthe sub-band coefficient matrix as:
EntropypðkÞ ¼ �X
i
X
j
jCpk;ði;jÞj
2 log jCpk;ði;jÞj
2 ð2Þ
EnergypðkÞ ¼X
i
X
j
jCpk;ði;jÞj
2 ð3Þ
where EnergypðkÞ and EntropypðkÞ are the energy and entropy of theimage projected onto the subspace at node ðp; kÞ. The entropy ofeach sub-band provides a measure of the image characteristics inthat sub-band. The energy distribution has important discrimina-tory properties for images and as such can be used as a featurefor texture classification. From the equations above, it follows thatthe wavelet entropy is minimum when the image represents an or-dered activity characterized by a narrow frequency distribution,whereas the entropy is high when an image contains a broad spec-trum of frequency distribution.
In this study, firstly the SEM images of the surfaces have beentransformed from TIF to JPG to export to MATLAB software. Haarmother wavelet was employed to decompose the grayscale corro-sion images to the second level of decomposition and Shannonentropies of sub-images at each sub-band have been used as imagefeatures. The process has been done using the wavelet toolbox ofMATLAB software on a Pentium Dual-Core and 1.66 GHz processorspeed PC computer.
2.2. Fractal analysis
The fractal dimension (FD) is a mathematical concept to classifycertain sets in more detail than the topological dimension can.There are many interesting and aesthetic examples of such sets(known as ‘‘fractal sets”) that can be created. Many scientists in lifeand material sciences and engineering use the fractal dimension(FD) as a parameter to characterize rough lines or surfaces. In otherwords, the fractal dimension is a measure of the morphology, tex-ture, and roughness in the surface (or images). FD can numericallycharacterize the variation in surface structure caused by corrosion,which corresponds to morphology changes in grey value imagescaptured by microscopy techniques such as SEM or AFM. Variousmethods have been proposed to estimate fractal values [21]: Fou-rier, Kolmogorov, Korcak, Minkowski, root mean square, slit island,etc. These methods differ in computational efficiency, numericalprecision and estimation boundary. However, a strong correlationwas reported between the relative ranking of fractal values ob-tained from different fractal measuring techniques [21,22]. Amongthese methods the Fourier analytical technique is the most prom-ising one in that it has several advantages. First, the Fourier meth-od is relatively insensitive to the presence of noise in images;second, there exists a fast algorithm, the FFT, which provides effi-cient implementation particularly for online application; and third,the computation of fractal values is based on an explicit formula
2 R.M. Pidaparti et al. / Corrosion Science xxx (2010) xxx–xxx
Please cite this article in press as: R.M. Pidaparti et al., Classification of corrosion defects in NiAl bronze through image analysis, Corros. Sci. (2010),doi:10.1016/j.corsci.2010.07.017
and is potentially more accurate computationally. For these rea-sons Fourier analysis was adopted to estimate fractal values in thisstudy.
For a surface image f ðx; yÞ, the power spectral density (PSD) iscalculated as:
Sðu;vÞ ¼ jFðu; vÞj2; ð4Þ
where F(u, v) is the Fourier transform of f (x, y), and u and v are thespatial frequencies (number of waves per unit wave length) in the xand y directions, respectively. The PSD Sðu;vÞ is converted to thepolar coordinate system S(f) such that f ¼
ffiffiffiffiffiffiffiffiffiffiffiffiffiffiffiffiu2 þ v2p
. The values ofSðf Þ, at each radial frequency f, are averaged over angular distribu-tions. For a fractal surface, the power spectrum shows a linear var-iation between the logarithm of Sðf Þ and the logarithm of thefrequency f [23]. The slope of the linear regression line b is relatedto the FD by equation [24]:
FD ¼ ð7� bÞ=2 ð5Þ
In this study, FD analysis was carried out on SEM images of cor-roded specimens under varying conditions with a goal of differen-tiating pits and cracks in them.
3. Experimental data
Nickel aluminum bronze alloy metal samples were cut into50 mm � 5 mm � 1 mm dimensions from a plate. The chemicalcomposition of the NAB plate (wt.%) [1] is 8.7–9.5% Al; 4.0–4.8%Ni; 3.5–4.3% Fe; 1.2–2.0% Mn; 0.1% Si; 0.02% Pb and the rest isCu with an average tensile strength of 731 MPa and Rockwell BHardness of 203 (HRB). The NAB plate’s typical microstructureconsists of continuous equiaxed crystals with small areas of meta-stable b phases. k Phase precipitates are found at grain boundariesin a phase and b phases areas [1]. Initially, the specimens werefirst inspected visually and diamond polished up to a surface finishof 3 lm before the corrosion testing. These specimens wereimmersed in 10% ammonia (NH4OH) (by vol.) – 90% seawater(by vol.) prepared as per ASTM D1141 standard and the cyclicstress was applied under three point bending according to ASTMG39. The chemical composition of the simulated seawater is as fol-lows: initially salt solution was prepared using salts NaCl0.413 mol dm�3; MgCl2 0.0546 mol dm�3; Na2SO4 0.0288 moldm�3; CaCl2 0.0105 mol dm�3; and KCl 0.0009 mol dm�3, and dis-solving them in 1000 mL of de-ionized distilled water. Concen-trated ammonia solution of 100 mL was then added to 900 mL ofthe salt solution to obtain the simulated.
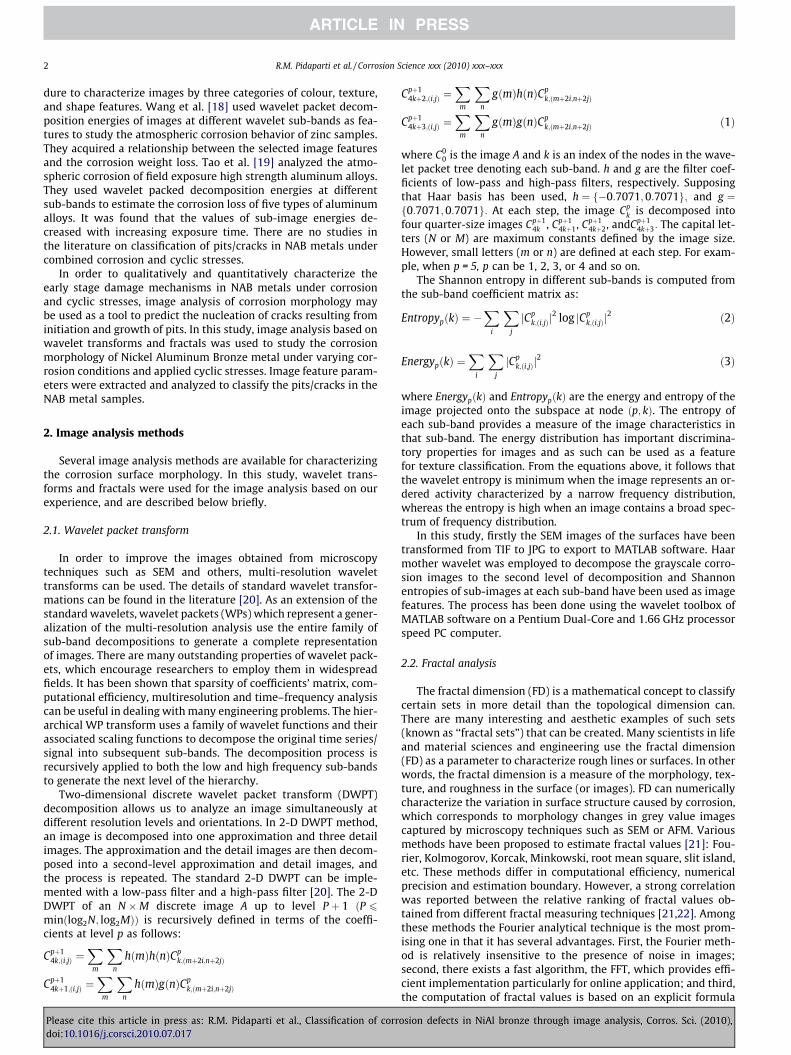
After exposing the specimens for a specific corrosion time (1–37 days) under specified cyclic stress (0–310 MPa), the sampleswere examined under SEM to characterize the surface morphology.The experiments were conducted by the researchers at the Depart-ment of Alloy Development and Mechanics, Carderock Division,Naval Surface Warfare Center, Bethesda, Maryland. They providedthe SEM image data to VCU for further analysis. An investigationof the SEM data for defects classification was carried out in thisstudy. The corrosion morphology of typical NAB specimens withdefects, pits, and cracks is shown in Fig. 1. These SEM images wereused in the image analysis to develop features to characterize thepits/cracks in NAB metal.
4. Results and discussion
4.1. Defect detection
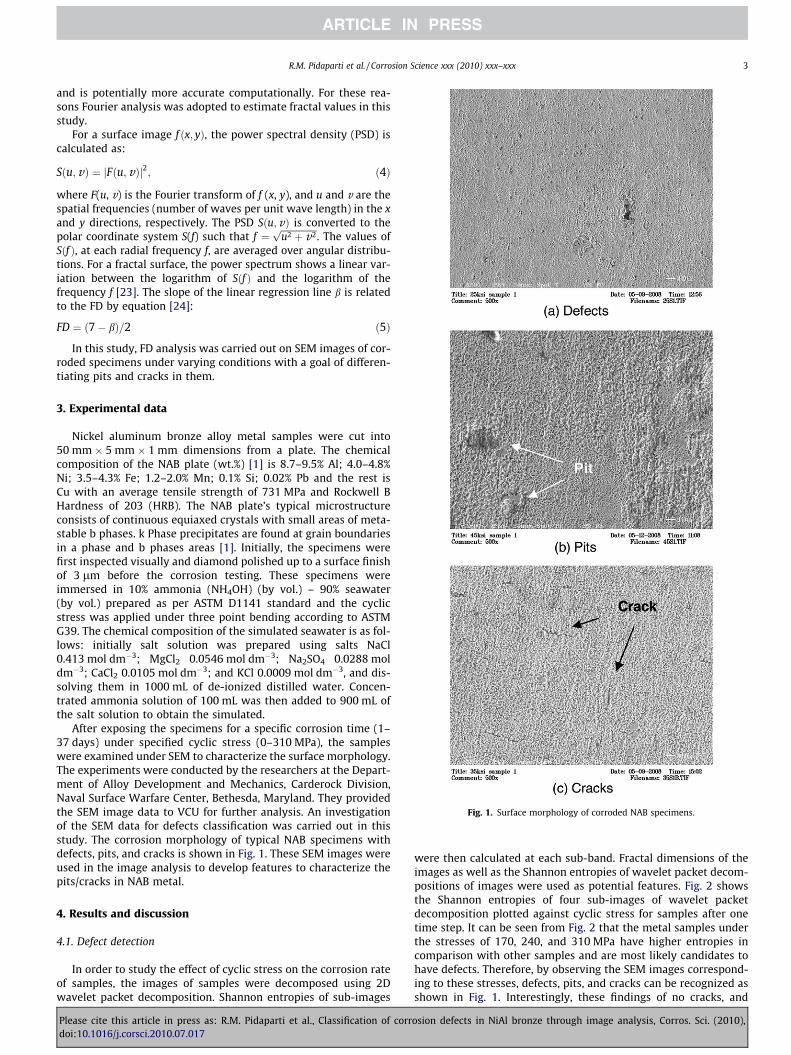
In order to study the effect of cyclic stress on the corrosion rateof samples, the images of samples were decomposed using 2Dwavelet packet decomposition. Shannon entropies of sub-images
were then calculated at each sub-band. Fractal dimensions of theimages as well as the Shannon entropies of wavelet packet decom-positions of images were used as potential features. Fig. 2 showsthe Shannon entropies of four sub-images of wavelet packetdecomposition plotted against cyclic stress for samples after onetime step. It can be seen from Fig. 2 that the metal samples underthe stresses of 170, 240, and 310 MPa have higher entropies incomparison with other samples and are most likely candidates tohave defects. Therefore, by observing the SEM images correspond-ing to these stresses, defects, pits, and cracks can be recognized asshown in Fig. 1. Interestingly, these findings of no cracks, and
Fig. 1. Surface morphology of corroded NAB specimens.
R.M. Pidaparti et al. / Corrosion Science xxx (2010) xxx–xxx 3
Please cite this article in press as: R.M. Pidaparti et al., Classification of corrosion defects in NiAl bronze through image analysis, Corros. Sci. (2010),doi:10.1016/j.corsci.2010.07.017
cracks has been observed by Vasanth and Hays [1] in their studieson NAB metal under varying environmental conditions.
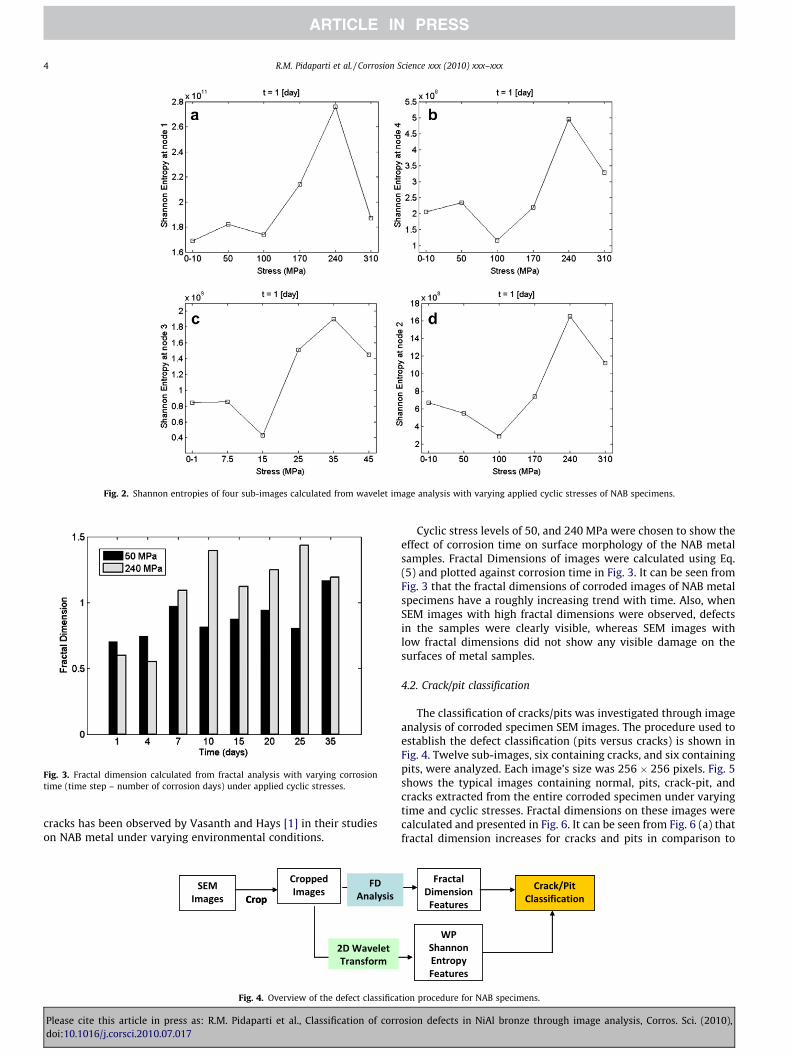
Cyclic stress levels of 50, and 240 MPa were chosen to show theeffect of corrosion time on surface morphology of the NAB metalsamples. Fractal Dimensions of images were calculated using Eq.(5) and plotted against corrosion time in Fig. 3. It can be seen fromFig. 3 that the fractal dimensions of corroded images of NAB metalspecimens have a roughly increasing trend with time. Also, whenSEM images with high fractal dimensions were observed, defectsin the samples were clearly visible, whereas SEM images withlow fractal dimensions did not show any visible damage on thesurfaces of metal samples.
4.2. Crack/pit classification
The classification of cracks/pits was investigated through imageanalysis of corroded specimen SEM images. The procedure used toestablish the defect classification (pits versus cracks) is shown inFig. 4. Twelve sub-images, six containing cracks, and six containingpits, were analyzed. Each image’s size was 256 � 256 pixels. Fig. 5shows the typical images containing normal, pits, crack-pit, andcracks extracted from the entire corroded specimen under varyingtime and cyclic stresses. Fractal dimensions on these images werecalculated and presented in Fig. 6. It can be seen from Fig. 6 (a) thatfractal dimension increases for cracks and pits in comparison to
Fig. 2. Shannon entropies of four sub-images calculated from wavelet image analysis with varying applied cyclic stresses of NAB specimens.
Fig. 3. Fractal dimension calculated from fractal analysis with varying corrosiontime (time step – number of corrosion days) under applied cyclic stresses.
Fig. 4. Overview of the defect classification procedure for NAB specimens.
4 R.M. Pidaparti et al. / Corrosion Science xxx (2010) xxx–xxx
Please cite this article in press as: R.M. Pidaparti et al., Classification of corrosion defects in NiAl bronze through image analysis, Corros. Sci. (2010),doi:10.1016/j.corsci.2010.07.017
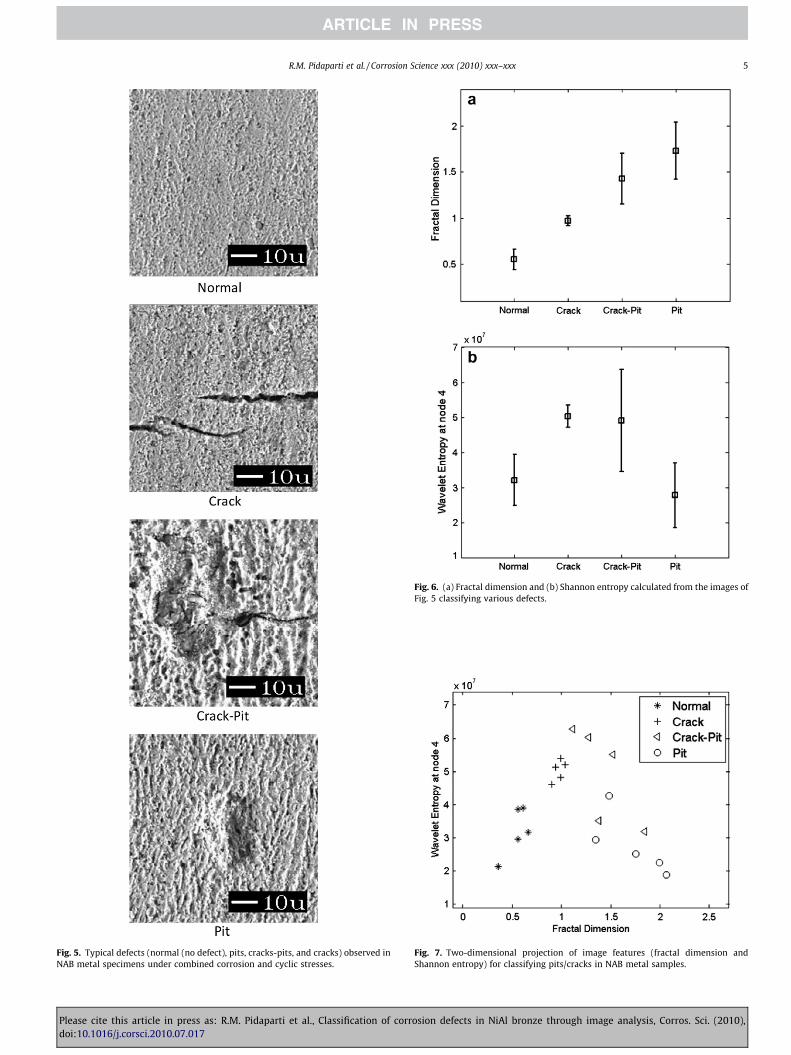
Fig. 5. Typical defects (normal (no defect), pits, cracks-pits, and cracks) observed inNAB metal specimens under combined corrosion and cyclic stresses.
Fig. 6. (a) Fractal dimension and (b) Shannon entropy calculated from the images ofFig. 5 classifying various defects.
Fig. 7. Two-dimensional projection of image features (fractal dimension andShannon entropy) for classifying pits/cracks in NAB metal samples.
R.M. Pidaparti et al. / Corrosion Science xxx (2010) xxx–xxx 5
Please cite this article in press as: R.M. Pidaparti et al., Classification of corrosion defects in NiAl bronze through image analysis, Corros. Sci. (2010),doi:10.1016/j.corsci.2010.07.017
normal (no defect) images. Also, the images with pits have higherfractal dimensions in comparison to images with cracks. The sam-ples are linearly separable in this feature space and a threshold canbe chosen to distinguish cracks from pits and its transition. Thisshows the effectiveness of the fractal dimension feature in the clas-sification of corrosion cracks from pits and their transition.
In addition to fractal dimension, the Shannon entropies of thewavelet packet decompositions of images containing normal (nodefects), pits, cracks, and combination of pit-crack cases (Fig. 5)were also calculated. It can be seen from Fig. 6(b) that the crackshave higher entropies in comparison to pits in comparison to nor-mal (no defect) in their images. It has been observed that with onlyincreasing corrosion, there are visible pits in SEM images. In con-trast, when the cyclic stress is increased, there are visible cracksand pits in SEM images. To provide a better illustration, a twodimensional projection of images (normal (no defects), pits, cracks,and combination of pit-crack cases) into the feature space is pre-sented in Fig. 7 for the images considered in this study. It can beseen from Fig. 7 that using the features of fractal dimension andShannon entropy of the wavelet packet decomposition, cracksand pits are linearly separable and, thus, easily classifiable.
5. Conclusions
An image analysis based on wavelet transforms and fractals wasused to study the corrosion morphology of nickel aluminumbronze metal under varying corrosion conditions and applied cyc-lic stresses. Image feature parameters were extracted from theexperimental data obtained from SEM, and analyzed to classifythe pits/cracks in the metal samples. The results obtained from im-age analysis indicate that classification of pits/cracks is possible asthey are linearly separable based on the fractal dimension and en-tropy features. The approach presented in this paper may be usedfor correlating service/failure conditions based on corrosion mor-phology in metals. However, more research is needed to study fur-ther the proposed methods/analysis based on images obtainedfrom non-destructive inspection devices as part of routine inspec-tion and correlating the fractal dimension to service/failureconditions.
Acknowledgements
The first two authors thank US National Science Foundation forsupporting this work through a Grant DMR-0505496. The authorsalso acknowledge the financial support from Dr. Airan Perez, Pro-gram Officer, Office of Naval Research, Virginia.
References
[1] K.L. Vasanth, R.A. Hays, Corrosion assessment of nickel–aluminum bronze(NAB) in Seawater, Corrosion 2004, Paper No. 04294.
[2] F.M. Dersch, A. Cohn, Ultrasonic Inspection of Nickel Aluminum Bronze forStress Corrosion Cracking, NSWCCD-61-TR-2001-21, 2001.
[3] M.D. Fuller, S. Swaminathan, A.P. Zhilyaev, T.R. McNelley, Microstructuraltransformations and mechanical properties of cast nial bronze: effects offusion welding and friction stir processing, Mater. Sci. Eng. 463 (1-2) (2007)128–137.
[4] J.A. Wharton, R.C. Barik, G. Kear, R.J.K. Wood, K.R. Stokes, F.C. Walsh, Thecorrosion of nickel–aluminum bronze in seawater, Corros. Sci. 47 (2005) 3336–3367.
[5] K. Oh-Ishi, T.R.T.R. McNelley, Microstructural modification of as-cast NiAlbronze by friction stir processing, Metall. Mater. Trans. 35 (2004) 2951–2961.
[6] G.T. Burstein, C. Liu, R.M. Souto, S.P. Vines, Origins of pitting corrosion, Corros.Eng. Sci. Technol. 39 (2004) 25.
[7] S.I. Rokhlin, J.Y. Kim, H. Nagy, B. Zoofan, Effect of pitting corrosion on fatiguecrack initiation and fatigue life, Eng. Fract. Mech. 2 (1999) 425–444.
[8] S. Ishihara, S. Saka, Z.Y. Nan, T. Goshima, S. Sunada, Prediction of corrosionfatigue lives of aluminum alloy on the basis of corrosion pit growth law,Fatigue Fract. Eng. Mater Struct. 29 (2006) 472–480.
[9] M.R. Sriraman and R.M. Pidaparti, Life prediction of aircraft aluminumsubjected to pitting corrosion under fatigue conditions, J. Aircraft (7–8)(2009) 1253–1259.
[10] H.S. Isaacs, Initiation of stress corrosion cracking of sensitized type 304stainless steel in ductile thiosulfate solution, J. Electrochem. Soc. 135 (1988)2180–2183.
[11] T. Suter, H. Bohni, A new microelectrochemical method to study pit initiationon stainless steels, Electrochim. Acta 42 (1997) 3275–3280.
[12] R. Oltra, V. Vignal, Recent advances in local probe techniques in corrosionresearch – analysis of the role of stress on pitting sensitivity, Corros. Sci. 49(2007) 158–165.
[13] C.H. Paik, R.C. Alkire, Role of sulfide inclusions on localized corrosion of Ni200in NaCl solutions, J. Electrochem. Soc. 148 (2001) 276–281.
[14] R.M. Pidaparti, R.R. Patel, Correlation between corrosion pits and stresses in Alalloys, J. Mater. Lett. 62 (2008) 4497–4499.
[15] R.M. Pidaparti, K. Koombua, A.S. Rao, Corrosion pit induced stresses predictionfrom SEM and finite element analysis, Int. J. Comput. Methods Eng. Sci. Mech.10 (2009) 117–123.
[16] K.Y. Choi, S.S. Kim, Morphological analysis and classification of types of surfacecorrosion damage by digital image processing, Corros. Sci. 47 (2005) 1–15.
[17] P. Kapsalas, M. Zervakis, P. Maravelaki-Kalaitzaki, Evaluation of imagesegmentation approaches for non-destructive detection and quantification ofcorrosion damage on stonework, Corros. Sci. 49 (2007) 4415–4442.
[18] S. Wang, S. Song, Image analysis of atmospheric corrosion exposure of zinc,Mater. Sci. Eng. A 385 (2004) 377–381.
[19] L. Tao, S. Song, X. Zhang, Z. Zhang, F. Lu, Image analysis of atmosphericcorrosion of field exposure high strength aluminum alloys, Appl. Surf. Sci. 254(2008) 6870–6874.
[20] S. Mallat, A Wavelet Tour of Signal Processing, Academic, New York, 1999.[21] J. Zhang, P. Regtian, M. Korsten, Monitoring of dry sliding wear using fractal
analysis, in: 10th TC-10 IMEKO Conference on Technical Diagnostics, 9–10June 2005, Budapest, Hungary.
[22] J. Rawers, J. Tylczak, Fractal characterization of wear-erosion surfaces, Mater.Eng Performance 8 (6) (1999) 669–676.
[23] J.C. Russ. Fractal Surfaces. Plenum Press, New York, 1994.[24] H. Peitgen, D. Saupe, M.F. Barnsley, The Science of Fractal Images, Springer-
Verlag, New York, 1988.
6 R.M. Pidaparti et al. / Corrosion Science xxx (2010) xxx–xxx
Please cite this article in press as: R.M. Pidaparti et al., Classification of corrosion defects in NiAl bronze through image analysis, Corros. Sci. (2010),doi:10.1016/j.corsci.2010.07.017