Embed Size (px)
Citation preview
25 March 2009 NDC Business System R2Letterhead (scale 80%) Option #1
47533 Westinghouse Drive Fremont, California 94539 t 510.683.2000 f 510.683.2001
We are Nitinol.™
www.nitinol.com
CorrosionofNitinol
Venugopalan,Trepanier
ProceedingsoftheInt’lConferenceonShapeMemoryandSuperelasticTechnologiesSMST‐2000
(eds.)S.Russell,A.Peltonpp.261‐270
2000

CORROSION OF NITINOL
Ramakrishna Venugopalan 1 and Christine Trepanier2
f Department of Biomedical Engineering, Unj"eNit)' of Alabama at Binningham 1075 13,h Streel South, Hoehn 370, Birmingham, AL 35294·4461
2Cordis Corporatioll-Nitillol Devices &: Compoflt.'IIlS 47533 Westinghouse Drive, Fremolll, CA 94539
ABSTRACT Nilinol is a very attractive material for manufacturing minimally invasive therapy devices and tools because of its unique superelasticity and shape memory propenies. While several studie. .. have shown it possesses good biocompatibility, its high nickel contenl and possible dissolution during corrosion still remains a concern. However, electropolishing can significantly decrease nickel di ssolution from Nilinol by fonning a corrosion resistant titanium oxide surface layer. In general, eleclropolished Nitinol exhibits equivalent, if not better. static corrosion behavior and ability to resist and repassivale (repair) surface damage when compared to 3 16L stainless steel . Combining electropolished Nitinol with stainless steel. titanium, and tantalum does not significantly affect its corrosion behavior. However, combining eleclropolished Nitinol with gold, platinum. and platinum-iridium alloy can result in an order of magnitude increase in corrosion rate. Review of prior research indicates that nickel release from Nitinol decreases from well below dietary levels to nearly nondetectable levels in the first few days following immersion in a physiological media. Finally. review of prior in vivo studies indicate minimal corrosion of Nitinol during implantation with released nickel concentration in surrounding tissues or organs being equivalent to that released by 3l6L stainless steel.
INTRODUCTION Nitinol (NiTi) is a very attractive material for minimally invasive therapy since it possesses unique mechanical properties (superelasticity and shape memory) and good biocompatibility [I). In the last twO decades. NiTI technology has conlributed to significant improvemenls in onhopedics and orthodontics 12.3]. It is now overcoming the limits in designing smaller. more efficient minimally invasive tools and devices (4].
Although several studies have shown the good corrosion resistance and biocompatibility of NiTi, the high nickel conlent of the alloy (55 wt.% Ni) and its possible dissolution during corrosion still
261

262
remains a concern {5-9] . Tissues in the human body contai n water, dissolved oltygen, proteins and various ions such as chloride and hydroxide and they present an aggressive environment to the metals or alloys used for implantation [10,1 11. Thus every basc-metaValloy implanted in the body will corrode-it is a question of how much. Corrosion resistance of a metallic implant is thus an important aspect of its biocompatibility [12]. In addition to the release of ions in the physiological environment, the corrosion process will also result in the deterioration of dimensional parameters of the COITod ing booy [13]. While large orthopedic implants like total hips and knees very rarely lose mechanical integrity purely due 10 corrosion faligue. small and complex-geometry minimally invasive devices can be susceptible to failure due to mechanically assisted corrosion. Thus. when choosing a material for manufacturing minimally invasive devices, evaluation and optimization of the corrosion properties should be perfonned on samples representative of actual device surface finish or preferably the device itself.
In particular, NiT! corrosion behavior can be significantly improved after specific surface treatments such as electropolishing [14]. Not surprisingl y, similar surface treatments are prescribed by the American Society for Testing and Materials (ASTM) to optimize the corrosion properties of stainless steel and other biomaterials (F86 standard) r 151. Electropolishing of NiTi homogenizes the thickness, tOjXlgraphy and chemical comjXlsition of the surface layer by fonning predominantly titanium o~ jde-a significant factor in improving corrosion resistance [16,17].
Still, most minimally invasive devices are susceptible to surface damage during their manipulation. Such damage can disrupt the surface layer and lead to significantly increased corrosion. Thus, the abili ty of the device to repair surface damage has to be ascertained in addi tion to detennining the device's static corrosion behavior. Finally, galvanic corrosion may occur when dissimilar metals are coupled to NiTi. Indeed. d ifferent mmerial devices could be placed in close proximity or a device may even be made from more than onc material to take 3dvant3ge of their specific properties. An example for the latter case is the use of noble metal markers on 3 16L Stainless Steel (SS) or NiTi devices to improve radiopacity.
Based on these considerations. the objectives of this paper are to: ( I ) discuss ill vitro static corrosion behavior and repassivation ability of electropolished NiTi in comparison to e lectropolished SS. (2) discuss the ill vitro galvan ic corrosion behavior of electropolished NiTi in combination with other biomaterials, and (3) review prior research on nickel dissolution ill vitro and in vivo corrosion of NiTi.
STATIC CORROSION BEHAVIOR-POTENDIODYNAMIC POLARIZATION TESTING
Potcntiodynamic polarization testing was conducted on electropolished NiTi and SS d iscs to deter· mine the ir individual corrosion behavior under static conditions in de-aemted Hank's so lution at 37°C [ 18]. A generic schematic o f experimental configuration used for corrosion testing is presented in Figure I. After an hour of equilibration, polarization data were generated by conducting a forward scan from 100 mY morc active than the corrosion potential (£corr) to a threshold anodic current density of 10 mA/cm2. The scan direction was reversed until the protection potential was achieved or the potential was 0 mY wi th reference to the £ corr Tafel extrapolation and Stem-Geary curre nts were used to calculate the corrosion current density (let",) in amperelcm2 at the £ (orr (ParCalc® Routine, Technical Notcs/Software Manual, EG&G, Princeton Applied Research). The corrosion rate in mmlyear (CR) was calculated based on cquivalcnt weight and density valucs included in the experimental setup for the M352 software. The breakdown potcntial (Ebd) was dctennincd

COOROSION OF NITlNOl 263
EG&G Princeton Model 273
Reference Electn)~e
Differential [:r==~::;t=;:~---Gas Purge Line
Salt Bridge+-k*,=:j==j
Working Elect1(xk_-==--~ Counter Electrode
Corrosion
Environmental Chamber
Figure I Gel/eric schematic of experimemal configuratioll used for corrosion testing.
from the y-axis coordinate corresponding to the intersection of a line-fit extrapolation of the passive and transpassive regions.
The ECQrr is an indicatOr of the stability of surface condition. Thus. less variabil ity in Ecorr values from different samples is indicative of more consistent surface proce.~sj ng. The let"" and calculatcd CR arc relative measures of corrosion and illustrate how much of a material will be lost during the corrosion process. Hence. the higher the lcor' and calculated CR. the more the materiallosl. The Ew is a measure of the region over which a surface layer is stable and corrosion resistant. Thus, a higher or more positive value of Ebd indicates a larger region of corrosion resistance.
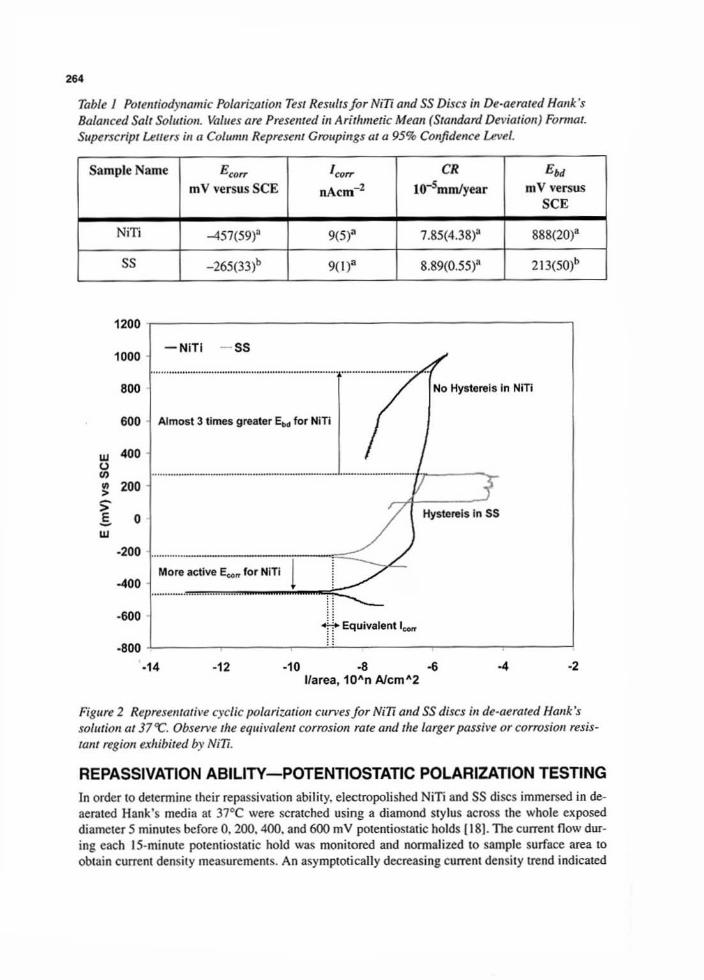
Typical values of Eeo,,, leo,,, CR. and Ebd are presented in Table I. Representative potentiodynamic polarization plots for NiT! and SS are presented in overlaid fonnat in Figure 2. The Eeorr for NiTi was more active than SS. The leorr was very consistent and in the nNcm2 range for both NiTi and SS. The CR values also exhibited no Significant difference between SS and NiTi. The Ebd for NiTi was almost three limes greater than for SS. Prior research by Trepanier. et al . in 1998 r 14) and Rondelli in 1996 r 191 on comparative corrosion behavior of surface-modi fied NiTi also presented si milar corrosion rates and breakdown potentials. Also. NiTi exhibited instantaneous repassivation on the reverse scan while SS exhibited a significant hysteresis. Hence. the SS was more susceptible to propagation of existing surface damage than NiTI.
264
Table I PorentiodJ"amic Po/ariw/iOIl Test Results/or NlTI alld SS Discs in De·aerated Halik's Balanced Salt Soll/rioll. Vailies are Presented in Arithmetic Mean (Standard Deviatioll) Fonnat. SlIperscript Lel/ers ill a Colllllln Represent Groupings at a 95% Confidmce Uvl!l.
SampJeName EC#1rr I"," CR E", m V versus SeE nAcm- 2 lO-Smmlyear mV versus
SeE
NiT! -457(59)' 9(5)' 7.85(4.38)' 888(20)'
SS -265(33)' 9(1)' 8.89(0.55)' 213(50)'
1200 ,--------------------------------------------
1000 -NiTI - 58
800 No Hysterels In NITi
600 Almost 3 times greater EM for NiTi
w 400 u '" ..... """-.-".-,,"-,,----,,-.---,, -·,,----·-·· .. /,,---r !.! 200 :;-.s 0 Hysterels In S5
w
-400 ''''''''''''-.:-::--:-=~--:=:--.L More active E ... ". fo r Nlli 1
·600 +. Equivalent 1_
.800 "-----------------~::------------------------·14 ·12 ·10 ·8 -6 -4 ·2
I(area, 10"0 Alcm"2
Figllre 2 Representative cyclic polarization elm'es for NiT! and SS discs ill de-aerated Halik's S(}llllioll lit 37 't:'. Ohren'l! tile eqllivoiem corrosion rate and the larger passil'~ or corrosion resistam region exhibited by Ni1i.
REPASSIVATION ABILITY-POTENTIOSTATIC POLARIZATION TESTING
In order 10 delennine their repassivation abi lity. electropolished NiT! and SS discs immersed in deaeraled Hank's media al 37°C were scralched using a diamond stylus across the whole exposed diameter 5 minutes before O. 200. 400. and 600 mV potcntioslalic holds II S). The current now during each IS·minute polcntioSI31ic hold was monitored and nonnalized to sample surface area 10 obtain current density measurements. An asymptoticaJly decreasing current densi ty trend indicated
CoRROSION OF NITINOL 265
that the material was able 10 repassivate the scratch damage at that potentiostatic hold. An increasing CUrTent density trend indicated that the sample was nOI able to repassivale scratch damage at thai potentioslatic hold. Current density greater than 500 J.1 AJcm2 was used as a threshold value 10 define total loss of ability of the material to repassivate (20) .
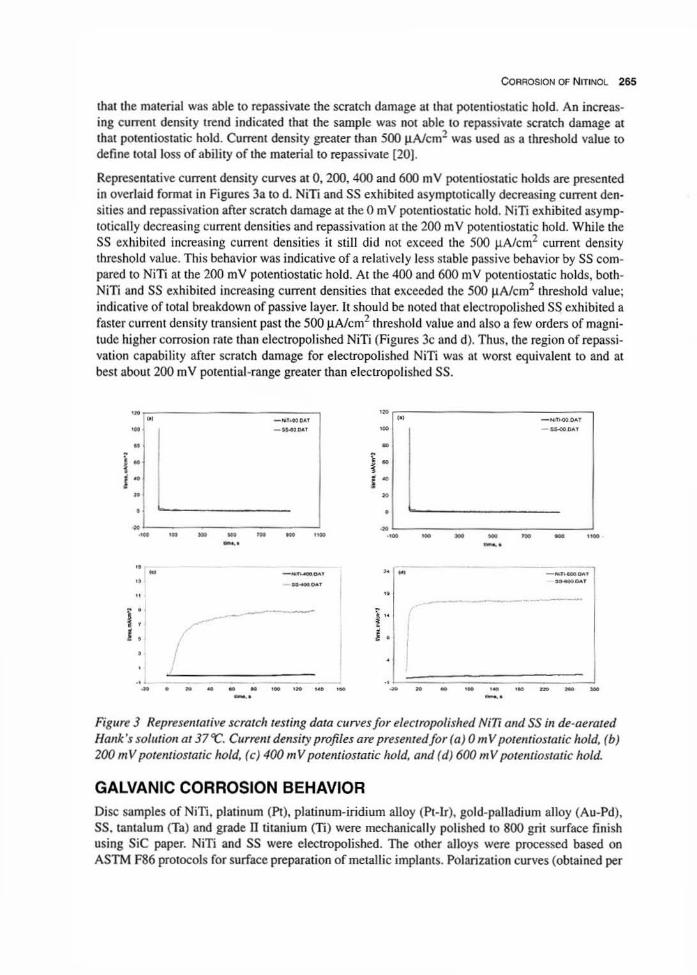
Representative current density curves at 0, 200. 400 and 600 mY potcnt iostatic holds are presenled in overlaid formal in Figures 3a to d. NiTi and SS exhibited asymptotically decreasing current densities and repassivation afler scratch damage at the 0 mV potentiostatic hold. NiT! exhibited asymptotically decreasing current densities and repassivation al the 200 mY potentiostatic hold. While the 55 ex hibited increasing current densities it still did not exceed the 500 J.lAlcm2 current dens ity threshold value. This behavior was indicative of a relatively less stable passive behavior by SS compared to NiT! at the 200 mY potentiostalic hold. AI the 400 and 600 mV potcntiostatic holds, bothNiTi and 55 exhibited increasing current densities that exceeded the 500 J.lAlcm2 threshold val ue; indicative of lOla 1 breakdown of passive layer. It should be noted that electropolished 55 exhibited a faster current density transient past the 500 J.1 A1cm1 Ihreshold value and also a few orders of magni tude higher corrosion rate than clectropolished NiTi (Figures 3c and d). Thus, the region of repassi vation capabili ty after scratch damage for ele<: tropolished NiT! was at worst equivalent to and at best about 200 mY potential-range greater than e leclropolishcd SS.
,. '. " -~'''' OO' ,.
"~"" "'T ,. - -"., ~ -_ ... , • •
i • i • I • I •
• • , •
~ ~ .• • • • - - ,. .. • - - - - ,~ -' -, ,. - -- -""-,,., M - --..... .. ..-..... - -, .. ' I I' I ._--" ~
I • ( 1 •
" , ., ~ • • • - , . '. - - • • - '. '. ,. - --. _.
Figure 3 Representative scratch testing data curves for electropolislted NiT! and 55 ;11 de-aerated Halik's sollftioll at 37'('. Currelll density profiles are presemedfor (a) 0 m V potemio!;tatic hold, (b) 200 m V potentiostatic hold, (c) 4()() m V potentioslatic hold, and (d) 600 III V potemiostatic hold.
GALVANIC CORROSION BEHAVIOR
Disc samples of NiT!, platinum (Pt), platinum-iridium alloy (Pt-lr). gold-palladium alloy (Au-Pd), SS. tantalum (Ta) and grade II titanium (Ti) were mechanically polished to 800 grit surface fin ish using SiC paper. NiT! and SS were elcclropolished. The other alloys were processed based on ASTM F86 pr01ocols for surface preparation of metall ic implants. Polarization curves (obtained per
266
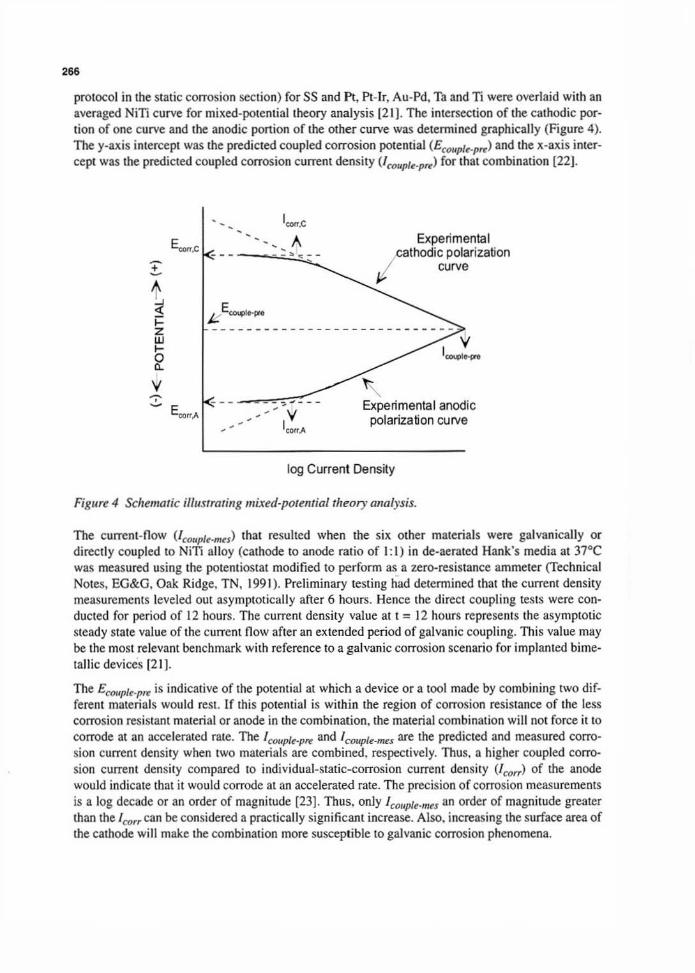
protocol in the static corrosion seclion) for SS and Pt. Pt-Ir, Au-Pd. Ta and n were overlaid with an averaged NiTi curve (or mixed-potcntialtheory analysis (21). The intersection of the cathodic portion of one curve and the anodic portion of the other curve was detennined graphically (Figure 4). The y-axis intercept was the predicted coupled corrosion potential (£(()Ijp/~-pl'f!) and the x-axis intercept was the predicted coupled cOrTosion current density (lroupl~.p't) for thaI combination [221.
E...< £ t ~ >-Z
"' >-0 Q.
Y Z
E""
Ic;on.c
" _ ..... --Experimental
/
calhOdiC polarization curve
I>
'\ Experimenta l anodic
polarization curve
log Current Density
Figure 4 Schematic illustrating mixed-potential theor), allalpis.
The current-now (Irouillt-mn) that resulted when the six other materials were galvanically or directly coupled to Nili alloy (c3Ihode to anode ralio of 1:1) in de-aerated Hank's media at 37°C was measured using the potentiostat modified to perform as a zero-resislance ammeter (Technical NOles, EG&G, Oak Ridge, TN, 199 1). Preliminary testing had detennined thaI the current density measurements leveled out asymptotically after 6 ho urs. Hence the direct coupling tests were conducted for period of 12 hours. The current density value at I = J 2 hours represents the asymptotic steady Slate value of the current now after an ex tended period of galvanic coupling. This value may be Ihe most relevant benchmark with reference to a galvanic corrosion scenario for implanted bimetallic devices [2 J).
The ECOI1pll!.pre is indicative of the potential at which a device o r a tool made by combining twO diffe rent materials would rest. If this potential is within the region of corrosion resislance o f the less corrosion resistant material or anode in the combination, the material combinatio n will not force it to corrode at an accelerated ratc. The I coupll!,pfI! and ICQupll!.mrs are the predicted and measured corrosion current density when two materials are combined, respectively. Thus. a higher coupled corrosion current density compared to individual-Slatic-corrosion current density (leo,,) of the anode would indicate that it would corrode at an accelerated rate. The precision of corrosion measurements is a log decade or an order of magnitude (23]. Thus, only I coupll!-lnt!s an order of magnitude greater than the ' eorrcan be considered a praclically significant increase. Also. increasing the surface area of the cathode will make the combination more susceptible to galvanic corrosion phenomena.
CORROSION OF NITINOl. 267
Consolidated results from mixed·potemial theory prediction and the direct coupli ng experiments are presented in Table 2. Mixed-potential theory calculations predicted thai the galvanic coupling of NiT! to (a) Pt and Pt-tr will result in £eo«ptt.prt in the middle of the passive region of the NiTi, (b) Au-Pd and 55 will resull in £~ouplt'Prt in the beginning of the passive region of the Nin. and (c) Tn will result in £ cOIlptt.pre similar to the C()rrosion potential of the NiTi. The ' couplt.prt for NiT! cou· pled to Pt. Pt·lr and Au-Pd was greater than when coupled to Ta. The Tafel regions of NiTi and Ti were too close to each other to conduct tangential extrapolation using mixed-potential theory. The proximity of NiTi and Ti Tafel regions may be indicative of negligible galvanic influence on cou· piing. The predicted increase in the NiTi corrosion rale when coupled to 55 was not conclusive due to signifi cant standard deviation in the calculated results.
Table 2 Mixed·Potential Theory Predictiolls alld Direct Coupling Re.ntlts. Values are Presellled ill Arithmetic Mean (Stalldard Deviation) Formal. Silperscript LeI/err ill a Co/ullin Represent Grollp' jllgs alll 95% COllfidellce Lel'el. • Predictions COlild Not be Made Dlle to Proximit), of Tafel Regiolil'
Mixed-Potential Theory Direct Coupling Experiments Cathode-Anode Prediction
Ecouplt.pl'f l couplt.prt Icoupf,.mn at t = 12 hours mY versus nAcm- 2 nAcm-2
seE Pt·Nin 126 (22)' 277 (9) 836 (74)'
Pttr·NiTi 40 (27)' 256 (3) 780 (302)'
AuPd·NiTi - 137 (3)' 285 (2) 608 (34)'
SS·Nili -218 (76)' 176( 11 1) 35 (5)'
Ta·Nili -406 (27)' 9 (6) 12 (17)'
Ti-NiTi • • 22 (l7)b
Individual Nin corrosion rate ,", 9 (5) nAcm-2
During direct coupling experiments. the largest ' couplt.mts were obtai ned for the noble alloys (Pt. Pt-Ir. Au-Pd) galvanically coupled to NiTi. The smallest /cOl,plt.mts values were obtained for 55, Ti and Ta galvanically coupled to NiTi. Also. the 'CQj,pl~.mts values for the (PI, Pt·[r, Au-Pd)lNiTi combinations were an order of magnitude greater than the values for the (55. T!, Ta)INiTI combinations. Good rank order agreement was obtained between the predicted results from mixed-potentiallhe· ory calculations and the resuhs from direct coupling experiments. The increased coupled current density measurements obtained in this study were not of sufficient magnitude to breakdown the passivated NiTi surface layer due to galvanic action alone. Platt. et al. galvanically coupled S5 to NiTi [24]. Their results did not indicate a statistically significant increase in current density due to galvanic coupling at a 1:1 cathode to anode ra tio. However, they observed localized crevice COrTO·
sion phenomena occurring in the 55 specimens while the NiT! specimens remained cathooic or protected. Thus. it is not possible to specifically isolate the galvanic corrosion effects from the crevice
268
corrosion effects for direct comparison to our study. They also observed an increase in galvanic activity when they reduced the surface area of the anode by 75%.
IN VITRO AND IN VIVO CORROSION
Since nickel release during the corrosion of NiT! is an important concern for its use as an implant material, several studies have measured this value. Barret, el a1. [25] and Bishara, el al. {261 investigated nickel release from NiT! archwires (processed by the manufacturer) in saliva in vitro and reported that NiT! components released an average of 13.05 Ilglday. This value is significantly below the estimated average dietary intake of 200 to 300 J.lglday (25]. In a second study, orthodontic patients with NiTi appliances had nickel concentration in their blood measured over a period of 5 months [25J. Results showed no significant increase in the nickel blood level th roughout this study.
A comparative in I'ilro cell cul ture study by Ryhanen, et al. measured nicke l re leased from NiTi and SS in a fibroblast and osteobl ast cel! culture medi a [7]. Nickel levels were higher in the NiTi group the first day and decreased rapidly as a function of time to achieve simi lar levels as SS after 8 days in both media. Even though nickel release was hi gher in the NiTi group, cell proli fe ration or cell growth near the sample surface was not affected. Also, NiTi had been only mechanically polished while SS had been e lectropolished according to the guidelines of the manufacturer. Wever, et al. conducted a similar comparative study with passivated NiTi and SS in Hank's solution !8]. They also found that nickel release from NiTi was maximum the first day (l4.5xIO·1 ~g1cm sec) and reached undetectable levels similar to SS after 10 days.
Castleman, et aJ. published the first ;11 1';1'0 biocompatibil ity data on NiT!. They implanted NiTi bone plates in the femurs of beagles for up 10 17 months [27]. Retrieved plates exhibited no evidence of either localized or general corrosion. In addition, neutron activation analyse. .. showed no metallic contamination of the surrounding tissue. .. and organs for the NiTi sample group. A recent sludy by Ryhanen, et al. investigated implant surface corrosion and systemic trace metal release when NiT! and SS intramedullary rods were implamcd in rals for up 10 60 weeks [9]. Retrieval analyses exhibited no evidence of localized corrosion on the NiTi implants while apparent pits were observed on the SS con trol implants. Also, nickel content analysis of explanted organs did not indicate significant differences between NiTi and SS sample groups.
CONCLUSIONS
Electropolished Nit inol exhibits increased resistance to primary breakdown of the passive layer and an increased resistance to propagation of existing surface damage compared to 3 16L stainless steel under static conditions. Electropolished Nitinol also exhibits equivalent, if not better abil ity to repassivate surface damage compared to 3 16L stain less steel. The galvanic coupli ng to noble metals or alloys increases the corrosion rate of the e lectropol ished Nitinol by two orders of magnitude. whi le coupli ng to the base-metal alloys resulted in a corrosion rate in the same order of magnitude as static uncoupled values. The increased current dens ity measurements obtained during direct coupling experiments were not of sufficient magni tude to breakdown the eleclropolished Nitinol surface oxide layer. Review of prior research indicates thai nickel release from Nitinol decreases from well below dietary levels to nearly nondetectable levels in the fi rst few days following immersion in a physiological media. Finally. review of prior ill I'il'o studies indicate minimal corrosion of Nitinol duri ng implantation with re leased nickel concentration in surroundi ng tissues or organs being equivalent to that released by 3 16L stainless steel. Thus. carefully electropolished Niti nol is a very altractive material for manufacturing minimally invasive devices and tools.
CORROSION OF NITINOL 269
ACKNOWLEDGEMENTS
Thi s study was funded in par1 by Cordis Corporation- Nitinol Devices & Components (Fremont. CAl and NSF· EPSCoR.
REFERENCES
I. T. W. Duerig, A.R. Pe lIOn, O. Stockel. Bio·Medical Materials and Engineering 6 (1996), 255· 266.
2. J. Haasters, G. Salis-Solio, G. Bonsmann. in Engineering aspects o/shape memor)' alloys, eds. T.W. Ouerig, et al.. (Jordan Hill, Oxford: Butterworth-Heinemann 1990). 426-444.
3. S. Lu. in Ellgineering aspects of shape memor)' aflo)'s, eds. T. W. Ouerig. et al., {Jordan Hill, Oxford: Butterworth·Heinemann 1990), 445-451 .
4. TG. Frank, et al.. in SMST-97: Proceedings of the Second Jntern(Jtiollal Conference 011 Shape MemOlY alld Superelastic Techn%gies, eds. A.R. Pelton . et al .. (Pacific Grove. California: Inte rnational Organization on the SMST. 1991). 509·5 14.
5. S. A. Shabalovskaya. Bio·Medical Materials and Engilleerillg 6 ( 1996).261-289.
6. C. Trepanier, et aI., JBMR (Appl Biomaler) 48 ( 1999). 165-17 1.
1. J. Ryhanen. et al .. JBMR 35, (1999), 45 1-457.
8. OJ. Wever, el al.. Bioma/ 19 (1998), 761-769.
9. J. Ryhanen, et al. , JBMR (in press).
10. L.L. Shrier, R.A. Jarman, G.T. Burstein, in CorrosiOIl - Mewll£IIviroll"'cm Reacliolls. Third £tIilioll, (Jordan Hill . Oxford : Butterworth-Heineman, 1995). 2:3-2: 164.
II . 1.8 . Park, R S. Lakes, in Biomaterials: All Introductioll. Second Edition. (New York: Plenum Press. 1992). 79·114.
12. J. Black. in Biological PerfomlOllce of Materials: Ffllldllttlelllais of Biocompatibiliry, Second Edilion. (New York: Marcel Decker 1992),38-60.
13. M.G. Fontana, in Corrosion Ellgilleering: Modem Theory alld AppliclIfions, Third Edition, (New York: MacGraw-HiII 1986).445-502.
14. C. Trepanier. et ai., JBMR (Appl Biomater) 43 (1998). 433·440.
15. ASTM F86, "Standard practice for surface preparation and marking of metallic surgical implants" in Anl/ual Book of ASTM Sumdllrds: Medical Del'ices (lIId Sen 'ices. Vol. 13.01. (Philadelphia, PA: American Society for Testing and Materials. 1995),6·8.
16. OJ . Wever, ct al.. Biolllflt 19 (1998), 761 -169.
17. S. Trigwell. G. Selvaduray. in SMST-97: Proceedings of the Second Imernaliollal Conference all Shape Memorytmd SlIperelastic Technologies, cds. A.R. Pelton. et al.. (Pacific Grove, Cali· fornia: International Organization on the SMST, 1997),383-388.
18. R. Venugopalan, el aI., 25th Annual Meeting of Society for Biomaterials/31st International Biomaterials Symposium. Providence, RI. 1999.
19. G. Rondellj, Biomlll J7 (1 996). (20): 2003-2008.

270
20. ASTM F746, "Standard lest method for pitting or crevice corrosion of metallic surgical implant materials" in AmlUal Book of ASTM Sumdards: Medical devices and Services, vol 13.01 (Phi ladelphia, PA: American Society for Testing and Materials, 1995), 192- 197.
21. R. VenugopaJao. et al., Submitted to World Biomaterials Congress. Kamuela, Hawaii. 2000.
22. D.A. Jones. Principles and Preventioll o/Corrosion, Second Edilioll , (Prentice Hall , Upper saddle River. NY). 1996: 168-198.
23. ASTM 0 61 "Standard leSt method for conducting cyclic potentiodynamic polarization measurements for localized corrosion susceptibility of iron-, nickel-, or cobalt-b..1sed a lloys~ in Metals, Test Methods and Analytical Procedures, vol 03.02. (Philadelphia, PA: American Society for Testing and Materials, 1995),224-228.
24. lA. Platt, el aI., Am J Orthod Dentufacial Orthop 112 (1997), 69-79.
25. R.D. Barrett, S.E. Bishara, 1.K. Quinn. Am J Orthod Delltofac Orthop 103 (1993),8- \4.
26. S.E. Bi shara , R.D. Barrett, M.l. Selim. Am J Or/hod DenroJac Or/hop 103 (1993), 1\ 5-119.
27. L.S. Cast leman, et al., lBMR 10 (1976), 695-73 1.


![Self‐Expanding Nitinol Stents ‐ Material and Design ......Nitinol implants are very corrosion resistant and biocompatible [9]. Nitinol, like titanium and stainless steel a.o.,](https://img.pdfslide.us/doc/110x75/5f423b518d684236a37b0680/selfaexpanding-nitinol-stents-a-material-and-design-nitinol-implants.jpg)