Embed Size (px)
Citation preview
25 March 2009 NDC Business System R2Letterhead (scale 80%) Option #1
47533 Westinghouse Drive Fremont, California 94539 t 510.683.2000 f 510.683.2001
We are Nitinol.™
www.nitinol.com
OxidationofNitinolandItsEffectonCorrosionResistance
Zhu,Trepanier,Fino,Pelton
ASMMaterials&ProcessesforMedicalDeviceConference2003
2003

Oxidation of Nitinol and its Effect on Corrosion Resistance
L. Zhu, C. Trépanier, A. R. PeltonNitinol Devices and Components, Fremont, California, USA
J. FinoCalifornia Polytechnic State University, San Luis Obispo, California, USA
Abstract
This study explores the phase transformations of oxideformation in NiTi and its effects on corrosion resistance.Electropolished Ni-50.8 at% Ti wires were heat treatedbetween 400 and 1000oC for 3 to 300 minutes in air. Surfaceanalytical techniques were used to characterize the thickness,composition and phase distribution of the oxide surface layers.The results of this study suggests that oxidation occurs asfollows:
†
NiTi +O2 Æ Ni3Ti +TiO2 Æ Ni4Ti +TiO2 Æ Ni +TiO2
The presence, amount, and distribution of these phases dependon both time and temperature. Corrosion behavior of theseoxidized wires with respect to the breakdown potential (Ebd)by potentiodynamic polarization tests was investigated. TheEbd dramatically decreases from 1000mV to below -100mV vsSCE as the oxide thickness increases from less than 0.01µm to10µm. Above 10µm, however, the oxide forms a protectivebarrier and the Ebd increases to 1000mV. Samples deformedup to 3% strain in bending developed cracks in the protectiveTiO2 layer and exposed the Ni-rich phases with a concomitantdecrease in Ebd to below -100mV vs SCE. These results willbe discussed in terms of processing parameters for medicaldevices.
Introduction
Nitinol is rapidly becoming the material of choice for severalimplant devices, such as self-expanding stents, due to itssuperelastic properties. Although several studies havedemonstrated good corrosion resistance and biocompatibilitywhich Nitinol provides [1-3], recent studies have shown thatin some cases Nitinol implants can corrode in vivo and releasehigh nickel content [4, 5]. It has been shown that Nitinolcorrosion resistance can be significantly improved by surfacetreatments such as electropolishing [1]. Electropolishing ofNitinol forms a protective uniform titanium oxide layer thatprotects the base material from corrosion.
At elevated temperatures in air, titanium reacts with oxygen toform a TiO2 layer, and the structure of this oxide is importantin understanding the biocompatibility of the material. Sinceseveral Nitinol implants undergo several heat treatments toshape-set the devices or adjust its transformation temperaturesas the final surface treatments, it’s also important to assess theeffect of oxidation of Nitinol on its corrosion resistance.Several authors [6-12] have studied the effects of surfacetreatments on the surface composition of NiTi, but themechanisms of high temperature oxidation and the effects oncorrosion are not entirely understood.
Therefore, the goal of this study was to better understand theoxidation of nitinol and determine the effect this oxidation hason corrosion resistance. Furthermore, since most implants areused under stress/strain conditions, the influence of strain onthe corrosion resistance of oxidized Nitinol was also assessed.
Experimental Methods and Techniques
Oxidation: Three mm diameter Ni-50.8 at% Ti wire wasannealed at 1000oC for 30 minutes, centerless ground toremove the resultant oxide scale, and electropolished. Thewire was subsequently oxidized in an air furnace at 400 to1000oC in 100oC increments for 3, 10, 30, 100, and 300minutes. Auger Electron Spectroscopy (AES), Focused IonBeam (FIB), JEOL JSM-5600 Scanning Electron Microscope(SEM), and Oxford Instruments Model 6587 EnergyDispersive X-Ray Spectroscopy (EDXS) were used tocharacterize the thickness and composition of the oxidelayer(s). AES was used for oxide layers up to 0.1µm; FIBbetween 0.1-1 µm; and SEM was used for ≥ 1 µm layers.Cross-sections of the wires were prepared using standardmetallographic techniques. Two sections of wire from eachheat treatment condition were mounted in bakelite, polished toa mirror-like finish up to 1200 grit SiC paper, and cleaned inultrasonicated denatured alcohol. Samples were not etched inorder to ensure that all phases were retained for analysis.
Specimens were observed by SEM in both secondary electronimaging (SEI) and backscattered electron imaging (BEI)modes; the BEI mode was especially useful to differentiate Ni-rich (light) and Ti-rich (dark) phases. Layer thicknessmeasurements from AES were based on estimates from theFWHM depth profiles, whereas thicknesses from FIB andSEM were based on averages of measurements from severalsamples.
Corrosion Testing: In accordance with ASTM F2129, anEG&G Princeton Applied Research potentiostat model 273Awas used to conduct the potentiodynamic polarizationcorrosion tests [13]. The potentiostat is controlled by acomputer with 352 SoftCorrIII-DC corrosion test software. Asaturated calomel electrode (SCE) is used as a referenceelectrode for the potential. Two platinum auxiliary electrodesare used as counter electrodes. Testing was conducted in anappropriate polarization cell as recommended in ASTMF2129. The solution was first de-aerated for 30 minutes priorto immersion of the test sample and throughout the test. Then,the Open Circuit Potential (OCP) was monitored for 1 hour.The polarization of the test specimen was then started 100 mVbelow the OCP at a voltage scan rate of 0.167 mV/sec. Thetests were conducted in Hank’s simulated physiologicalsolution at an initial pH of 7.4±0.1. The solution wasmaintained at 37± 1°C using a water bath. The corrosionresistance of the devices was characterized in terms of theirbreakdown potential (Ebd). After testing, the samples wereinspected with SEM in both SEI and BEI modes.
Results and Discussion
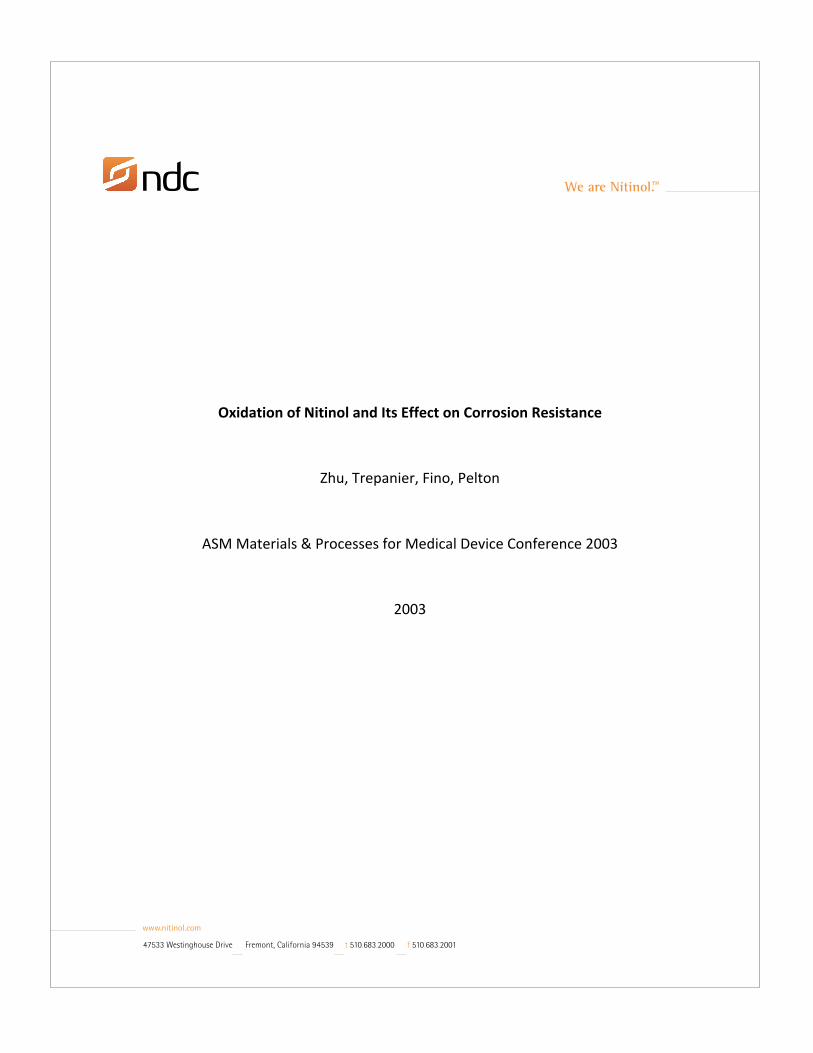
Oxidation Growth and Composition: No visible oxide wasobserved by SEM for samples at lower temperatures (≤600˚C)and shorter times (≤30 minutes) at 700oC. These samples wereanalyzed with AES and/or FIB to determine the oxidethickness and composition. Figure 1 shows the AES depthprofile of the electropolished and 400˚C/3 min samples, with aTiO2 thickness of 110 Å and 200 Å, respectively. After 30minutes at 400oC, AES revealed a nickel-rich region beneaththe outer TiO2 layer (Figure 2). The remaining samplesanalyzed with AES showed a more pronounced nickel-richregion below the surface TiO2 layer.
FIB [14] was used to analyze intermediate oxide thicknesses,as well as to overlap other analysis techniques. Figure 3 showstwo light gray superficial platinum layers (marked) that areused as a protective coating during sample preparation.Beneath those layers, a darker TiO2 (or other Ti suboxidelayers) with a lighter nickel-rich sublayer is detected.Chuprina [6] also discovered a “white layer” beneath thesurface scale by optical metallography, which he determinedto be Ni3Ti. Voids in the surface layers are also seen in Figure3. The formation of voids and/or pores may be due to stressgeneration in the oxide during growth or by the Kirkendalleffect whereby vacancies are created when the Ti atoms
diffuse away from the NiTi matrix to react with O2 [6,15-17].Chu et al. [16] suggest that the formation of large voids maybe due to the difference in the vertical and lateral oxide growthrates, as well as the collection of vacancies.
Figure 1: AES depth profiles of NiTi wire: (a) aselectropolished; (b) 400oC for 3 minutes
Figure 2: AES depth profile of 400˚C/30 minute NiTi wire.Note the presence of a Ni-rich region below the TiO2 surfacelayer

Figure 4 shows the cross-section of the as-electropolishedwire, as compared to Figure 5 which illustrates the progressivegrowth of the oxide with increasing time at 900˚C. The brightinterfacial region between the base NiTi and the surface TiO2
observed for the oxidized samples was analyzed by EDXS tobe 75at% Ni and 25at% Ti, consistent with Ni3Ti (whitesublayer); EDXS also confirms the presence of TiO2 (darkgray). Small Ni3Ti finger-like projections emerge from thenickel-rich layer and appear to form islands in the oxide. Acomprehensive EDXS analysis indicates that the Ni content ofthe phases increases with increasing distance from the NiTiinterface. The Ni3Ti interfacial layer transforms to Ni4Ti(80at% Ni), whereas the islands become nearly pure Ni(approximately 92 at% Ni). This composition transitionindicates that with increasing time at temperature, the Ni3Tisublayer becomes Ti-depleted as the Ti reacts with the O2,leaving behind nearly pure Ni. The light gray areas embeddedin the TiO2 observed in Figure 5e may be NiO and TiO2,which can react to form the double-oxide NiTiO3 [18]. Otherauthors [6-8,15-16] obtained similar results, but there arediscrepancies in the actual composition of these phases. X-raydiffraction analysis in Chuprina et al. showed the co-existenceof Ni3Ti, Ni, NiO, Ni(Ti), and TiO2 at high temperatures(>600˚C) [6]. Metallic Ni, oxidized Ni, or Ti atoms in solidsolution with Ni (Ni(Ti)) have also been reported [8, 15-16].
Figure 3: FIB image of 700oC/10 minute NiTi at 100,000X.Note the bright Ni3Ti layer and (dark) voids
After 3 minutes at 1000oC, the nickel-rich and titanium oxideregions can be easily observed by BEI (see Figure 6a). Thenickel-rich precipitates and TiO2 form a lamellar structure ofalternating Ni-rich phases and TiO2. After 30 minutes at1000oC, this structure becomes more apparent (see Figure 6b),and after 300 minutes at 1000oC, the oxide has become
extremely thick (approximately 300 mm), with most of the Nifrom Ni3Ti dispersing into the TiO2 layer (see Figure 6c). AsNi diffuses to the surface, it becomes increasingly pure(approximately 98at% Ni), with most of the Ti reacting withO2 to form TiO2.
It appears that the TiO2 layer acts as a diffusion barrier toprevent Ni from oxidizing as expected from pure metalthermodynamics [19]. This is also consistent with thethermodynamic calculations from Firstov et al. [15], whichindicate that reactions at the NiTi/air interface consist ofNiTiO3, TiO2, and metallic Ni, whereas NiO would not beformed due to insufficient oxygen partial pressures.
Figure 4:BEI image of as-electropolished cross-section(500X)
Corrosion: The corrosion resistance of the oxidized Nitinolspecimens, based on their breakdown potential, depends onthe time and temperature of the heat treatment. As shown inFigure 7, while some specimens did not show any localizedcorrosion, such as the electropolished sample, other specimensshowed breakdown potentials as low as -140 mV vs SCE(specimens heat treated at 500°C for 30 min.). The graph inFigure 8 illustrates the variation of the breakdown potential asa function of the oxide layer thickness.
As can be observed from Figure 8, there is a correlationbetween the breakdown potential and the oxide layerthickness. For oxide layer thickness between 0.01 and 0.05mm,the breakdown potentials remain very high. Then, there is asharp decrease in the breakdown potential starting from 0.1mmto 10mm thick oxide layer. An increase in the breakdownpotential can be observed for specimens with an oxide layerthicker than 10mm. It is important to note that with such athick oxide layer, the material was insulated from the testsolution.
Deformation of the specimen (3% strain in bending) resultedin severe cracking of the oxide layer for specimens with a verythick oxide, which also greatly influenced the corrosion testresults. For example, the breakdown potential of the Nitinolspecimens heat treated at 400°C for 10 min. decreased from1030 mV vs SCE to 417 mV vs SCE (Figure 9). In general, asignificant decrease in the breakdown potential was observedfor the majority of the specimens (Figure 10).
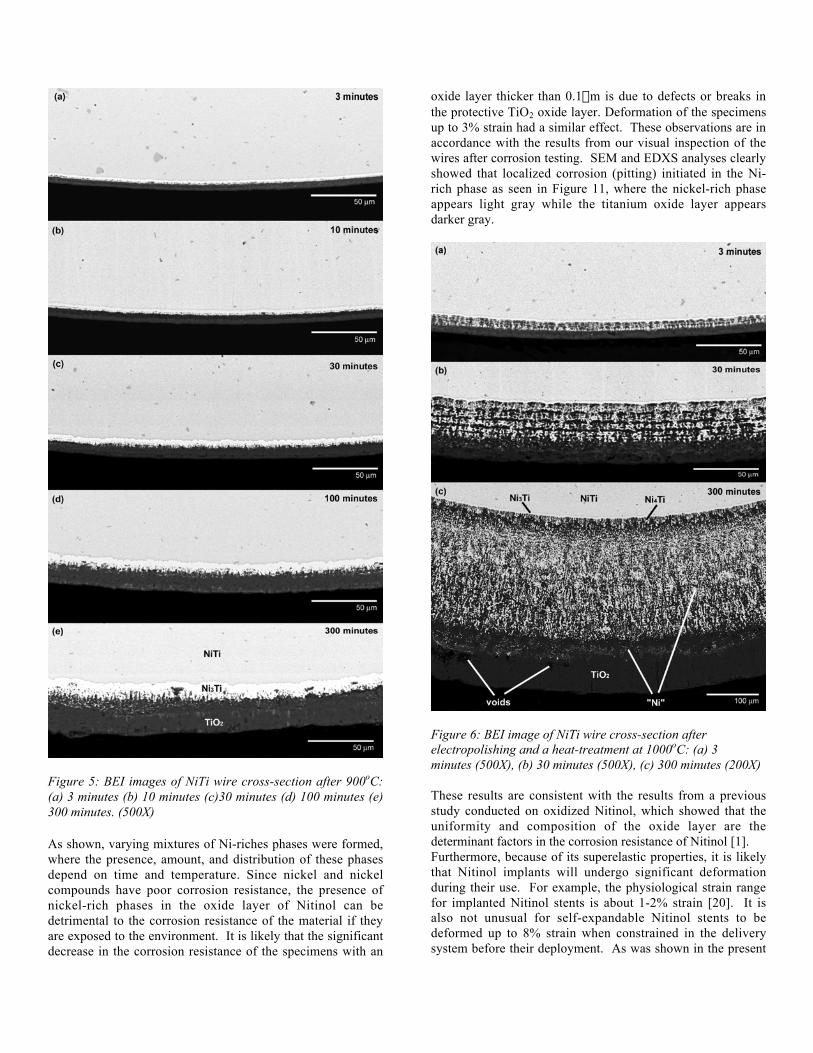
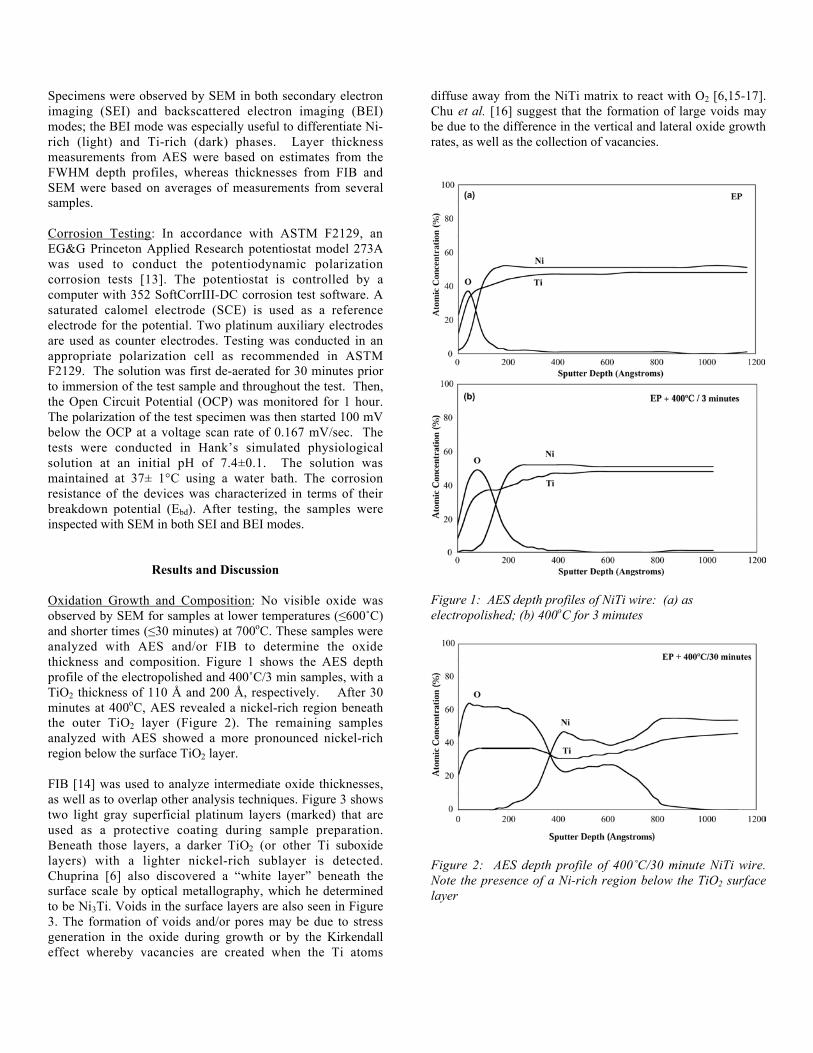
Figure 5: BEI images of NiTi wire cross-section after 900oC:(a) 3 minutes (b) 10 minutes (c)30 minutes (d) 100 minutes (e)300 minutes. (500X)
As shown, varying mixtures of Ni-riches phases were formed,where the presence, amount, and distribution of these phasesdepend on time and temperature. Since nickel and nickelcompounds have poor corrosion resistance, the presence ofnickel-rich phases in the oxide layer of Nitinol can bedetrimental to the corrosion resistance of the material if theyare exposed to the environment. It is likely that the significantdecrease in the corrosion resistance of the specimens with an
oxide layer thicker than 0.1mm is due to defects or breaks inthe protective TiO2 oxide layer. Deformation of the specimensup to 3% strain had a similar effect. These observations are inaccordance with the results from our visual inspection of thewires after corrosion testing. SEM and EDXS analyses clearlyshowed that localized corrosion (pitting) initiated in the Ni-rich phase as seen in Figure 11, where the nickel-rich phaseappears light gray while the titanium oxide layer appearsdarker gray.
Figure 6: BEI image of NiTi wire cross-section afterelectropolishing and a heat-treatment at 1000oC: (a) 3minutes (500X), (b) 30 minutes (500X), (c) 300 minutes (200X)
These results are consistent with the results from a previousstudy conducted on oxidized Nitinol, which showed that theuniformity and composition of the oxide layer are thedeterminant factors in the corrosion resistance of Nitinol [1].Furthermore, because of its superelastic properties, it is likelythat Nitinol implants will undergo significant deformationduring their use. For example, the physiological strain rangefor implanted Nitinol stents is about 1-2% strain [20]. It isalso not unusual for self-expandable Nitinol stents to bedeformed up to 8% strain when constrained in the deliverysystem before their deployment. As was shown in the present

study, when oxidized Nitinol is deformed, the oxide layer maycrack and expose the nickel-rich phases which cansignificantly lower the corrosion resistance of the material.Since the oxide layer on Nitinol is not superelastic, a thinoxide layer is preferable since it can flex and sustain the largedeformations of the underlying Nitinol material withoutcracking.
Figure 7: Polarization curves for electropolished and heattreated (500°C for 30 min) specimens.
Figure 8: Breakdown potential as a function of oxide layerthickness
Based on these results, if Nitinol implants go through severalheat treatments to shape-set or adjust the transformationtemperatures of the devices, it is preferable that the implantsundergo a final surface treatment to remove the thick oxidelayer and passivate the surface. Furthermore, it is important topoint out that as opposed to thermally grown oxide thatpromote the growth of mixed titanium oxide and nickel-richphases, chemically and electrochemically grown oxidepromotes pure titanium oxide formation. During chemicalpolishing and electropolishing, process nickel is preferentiallyremoved.
Figure 9: Effect of strain on Nitinol heat treated at 400°C for10 min.
Figure 10: Breakdown potential as a function of oxide layerthickness after 3% strain
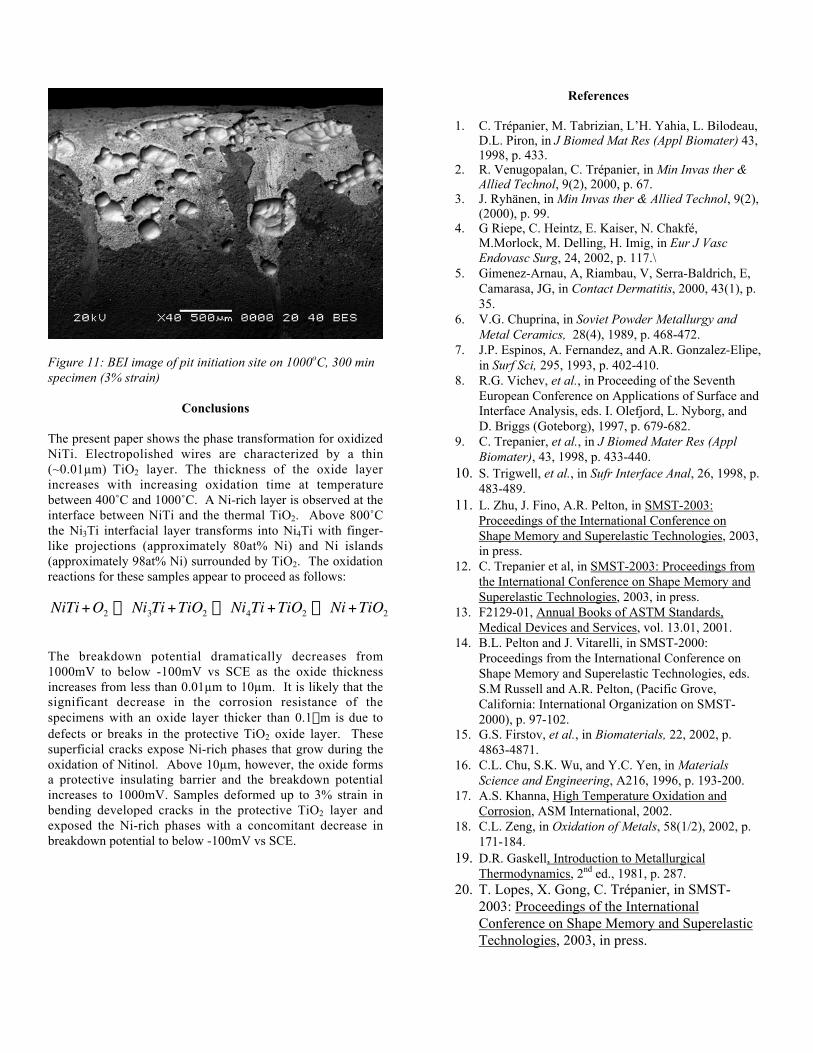
Figure 11: BEI image of pit initiation site on 1000oC, 300 minspecimen (3% strain)
Conclusions
The present paper shows the phase transformation for oxidizedNiTi. Electropolished wires are characterized by a thin(~0.01µm) TiO2 layer. The thickness of the oxide layerincreases with increasing oxidation time at temperaturebetween 400˚C and 1000˚C. A Ni-rich layer is observed at theinterface between NiTi and the thermal TiO2. Above 800˚Cthe Ni3Ti interfacial layer transforms into Ni4Ti with finger-like projections (approximately 80at% Ni) and Ni islands(approximately 98at% Ni) surrounded by TiO2. The oxidationreactions for these samples appear to proceed as follows:
†
NiTi +O2 Æ Ni3Ti +TiO2 Æ Ni4Ti +TiO2 Æ Ni +TiO2
The breakdown potential dramatically decreases from1000mV to below -100mV vs SCE as the oxide thicknessincreases from less than 0.01µm to 10µm. It is likely that thesignificant decrease in the corrosion resistance of thespecimens with an oxide layer thicker than 0.1mm is due todefects or breaks in the protective TiO2 oxide layer. Thesesuperficial cracks expose Ni-rich phases that grow during theoxidation of Nitinol. Above 10µm, however, the oxide formsa protective insulating barrier and the breakdown potentialincreases to 1000mV. Samples deformed up to 3% strain inbending developed cracks in the protective TiO2 layer andexposed the Ni-rich phases with a concomitant decrease inbreakdown potential to below -100mV vs SCE.
References
1. C. Trépanier, M. Tabrizian, L’H. Yahia, L. Bilodeau,D.L. Piron, in J Biomed Mat Res (Appl Biomater) 43,1998, p. 433.
2. R. Venugopalan, C. Trépanier, in Min Invas ther &Allied Technol, 9(2), 2000, p. 67.
3. J. Ryhänen, in Min Invas ther & Allied Technol, 9(2),(2000), p. 99.
4. G Riepe, C. Heintz, E. Kaiser, N. Chakfé,M.Morlock, M. Delling, H. Imig, in Eur J VascEndovasc Surg, 24, 2002, p. 117.\
5. Gimenez-Arnau, A, Riambau, V, Serra-Baldrich, E,Camarasa, JG, in Contact Dermatitis, 2000, 43(1), p.35.
6. V.G. Chuprina, in Soviet Powder Metallurgy andMetal Ceramics, 28(4), 1989, p. 468-472.
7. J.P. Espinos, A. Fernandez, and A.R. Gonzalez-Elipe,in Surf Sci, 295, 1993, p. 402-410.
8. R.G. Vichev, et al., in Proceeding of the SeventhEuropean Conference on Applications of Surface andInterface Analysis, eds. I. Olefjord, L. Nyborg, andD. Briggs (Goteborg), 1997, p. 679-682.
9. C. Trepanier, et al., in J Biomed Mater Res (ApplBiomater), 43, 1998, p. 433-440.
10. S. Trigwell, et al., in Sufr Interface Anal, 26, 1998, p.483-489.
11. L. Zhu, J. Fino, A.R. Pelton, in SMST-2003:Proceedings of the International Conference onShape Memory and Superelastic Technologies, 2003,in press.
12. C. Trepanier et al, in SMST-2003: Proceedings fromthe International Conference on Shape Memory andSuperelastic Technologies, 2003, in press.
13. F2129-01, Annual Books of ASTM Standards,Medical Devices and Services, vol. 13.01, 2001.
14. B.L. Pelton and J. Vitarelli, in SMST-2000:Proceedings from the International Conference onShape Memory and Superelastic Technologies, eds.S.M Russell and A.R. Pelton, (Pacific Grove,California: International Organization on SMST-2000), p. 97-102.
15. G.S. Firstov, et al., in Biomaterials, 22, 2002, p.4863-4871.
16. C.L. Chu, S.K. Wu, and Y.C. Yen, in MaterialsScience and Engineering, A216, 1996, p. 193-200.
17. A.S. Khanna, High Temperature Oxidation andCorrosion, ASM International, 2002.
18. C.L. Zeng, in Oxidation of Metals, 58(1/2), 2002, p.171-184.
19. D.R. Gaskell, Introduction to MetallurgicalThermodynamics, 2nd ed., 1981, p. 287.
20. T. Lopes, X. Gong, C. Trépanier, in SMST-2003: Proceedings of the InternationalConference on Shape Memory and SuperelasticTechnologies, 2003, in press.