Embed Size (px)
Citation preview

1
Corrosion of Glass Windows in DIRC PMTs
P. Bourgeois1 and J. Va'vra2
1: Cente d’Etude de Saclay, DANIA-SPP, F91191 Gif-sur-Yvette CEDEX, France2: Stanford Linear Accelerator Center, Stanford University, Stanford, CA 94309, USA
AbstractThe DIRC photon detector contains ~11,000 photomultipliers (PMTs), which are submerged in ultra-purewater. This note reports on glass corrosion R&D conducted with PMTs in pure water. We conclude that only alimited number (~50) of the PMTs in water are affected by rapid corrosion, while a majority of the 11,000PMTs should last, according to our measurements, for another ten years. The observation of PMT glasscorrosion is based on visual observations, X-ray surface analysis, ESCA surface analysis, weight analysis,transmission measurement, as well as detailed water trace element analysis. We also correlate theseobservations with DIRC measurements of water pH factor, resistivity, temperature, transmission, and BaBaranalysis of Bhabha and di-muon events. We also compare DIRC water purity with that of the SuperKamiokande and K2K experiments, which also use ultra-pure water. We provide empirical proof that corrosion,in our particular Borosilicate type of PMT glass window, occurs at high rate when the glass has no Zn content.
1. IntroductionDIRC is using EMI 9125FLB17 1.125” diameter PMTs made by Electron Tube Ltd. (ETL). The PMT front
glass window is made of B53 Borosilicate glass (also called E53C). B53 is specified as a low background glassbecause it has no potassium (K). One should also add that the front glass is different than the side glass (seeSection 6). There is ~11,000 PMTs of this type in the photon detector. The PMT front windows are sitting in
water to minimize photon losses. The front window is only 1.2 ± 0.1 mm thick. The window type and itsthickness were chosen to maximize a response at very low wavelengths. In retrospect, DIRC could have used athicker window because the EPOTEK-301-2 optical epoxy, used to glue quartz bars together, cuts thewavelength acceptance below 290 nm. However, that was not initially realized.
In principle, ultra-pure water is very corrosive because it is hungry for ions. This creates certainelectrostatic pressure pushing a migration of ions from any surface surrounding water. Therefore, whendesigning an experiment in water, one has to worry about corrosion of all components, including the vessel (inDIRC we call it the SOB, for standoff box), plumbing, and glass windows of PMTs. The pure water is requiredin an experiment such as DIRC to reach good optical transmission in 1 m of length, as well as a bacteria-freeenvironment.
Examples of experiments using a large number of PMTs submerged in ultra-pure water are the DIRC,Super Kamiokande, K2K, SNO, Sudan, Milargo, etc. Typically, the PMTs are submerged in water to minimizephoton losses due to windows and couplings.
It is certainly tempting to argue at this point that there is already enough experience running glass PMTs inclean water, and therefore one does not have to worry, arguing PMT manufacturers already know.Unfortunately, this argument is incorrect. We have found that there is a relatively low level of understanding,from a theoretical point of view when questions are raised about under what such condition a glass will corrode.However, since several experiments have been running for the past 3-4 years with very large number of PMTsin water, the relevant empirical experience is slowly emerging, and DIRC certainly will contribute to the data inthis area. Nevertheless, we would always recommend performing exhaustive corrosion tests for a particularchoice of glass formulation.
When the DIRC vessel (SOB) was opened and drained in October 1999, we noticed that many of the PMTsfront glass windows had a “milky” or “frosty” appearance. Figure 1 shows examples of corroded PMTs, and,for comparison, one that is clear. We found that only the glass face was corroded, i.e., the PMT sides were notaffected at all. The “frosty” PMT had deep surface fractures resembling a frosty window in winter. The “milky”surface appears to be slightly cloudy, and visible only under direct light. For example, if a “milky” PMT is

2
submerged in water, the problem is almost unnoticeable. This is because water provides good optical couplingeven to corroded surfaces. A “frosty” PMT is slightly more noticeable in water. We did a visual accounting1 ofall affected PMT in the entire SOB during the October shutdown, and the result is that about two-thirds of themare in the “milky” category, and the number of “frosty” PMTs is ~50. One should also point out that to date, wedo not have an independent account of the number of bad PMTs, i.e., verified by the manufacturer.
Figure 1. Example of a “milky” PMT (labeled as #3), and a “frosty” PMT (labeled as #4), observed inthe SOB during October 1999, when water was drained out of the vessel.
A subsequent DIRC data analysis found no deterioration of the relative efficiency of the “milky” or“frosty” PMTs compared to “clear” PMTs, which confirms that water provides a good coupling to thesesurfaces. In fact, a lab test on a “frosty” PMT yielded normal results, i.e., no after-pulsing, which would indicateworsening vacuum. The long-term behavior of relative efficiency is still being investigated.
We have removed a number of “frosty” and “milky” PMTs from the SOB during the October 1999shutdown, for subsequent surface analysis at the ETL Company, Saclay, and SLAC. We briefly outline thesequence of various major developments:(a) First, by using an electronic microscope at SLAC, the problem was identified as glass corrosion of the PMT
front window, characterized by a depletion of sodium ions [2].(b) ETL confirmed this explanation by measuring the glass composition after immersion in hot water and
comparing it to the nominal composition [3,4]. The measurement is done by X-ray fluorescence. The X-rays
probe the surface composition to a depth between 10-100 µm. Results are given in Table 1. The surface
composition of the glass has been modified as a result of immersion for 31 days at 83.5°C. In particular, thefraction of alumina, boron, and silicate (Al2O3, B2O3 and SiO2) constituents has increased after immersionbecause other constituents, and especially sodium, have been leached from the surface layer.
(c) Most importantly, ETL discovered that the “frosty” PMTs were in fact those PMTs, which had mistakenlyreceived a window made out of the wrong material [3,4]. The glass material had no zinc, and was identifiedas X-glass (or E47.2-type glass, which is used by ETL for other applications), instead of the nominal B53glass, which is required for its better resistance to corrosion when submerged in the ultra-pure water. Asubsequent test conducted at SLAC using the ESCA analysis confirmed that indeed the “frosty” PMTs hadno zinc in the first 50Å below the surface [5]. Table 1, provided by the ETL Company, gives the glasscomposition before and after immersion of the wrong type of glass in water. For this glass, not only thesodium, but also the boron was depleted. The company found that windows made out of X-glass arealready frosty after five days of being submerged in hot water at 83.5°C, which corresponds according toETL, to about 5 months at ambient temperature, as we discuss later. This is a crucial result on which to base
1 The determination of what PMT should be labeled “milky” versus “frosty,” as well as locating them in the SOB, was done
by J. Va’vra and A. Hoecker during the October 1999 shutdown [1]. Unfortunately, to this date, there is no other directsource of information on how many PMTs are affected. For example, after one year of operation the DIRC data analysis,is still unable to distinguish which are the “clear,” “milky,” or “frosty” PMTs. Similarly, the PMT manufacturer did notprovide the information of how many PMTs were made out of the “wrong” type of glass.
MilkyPMT #3
FrostyPMT #4
ClearPMT

3
the argument that the SOB PMTs, made out of X-glass have already become “frosty” by the time of theOctober 1999 shutdown, and therefore, we count all.
(d) Tests performed in Saclay verified the ETL scaling law of glass corrosion in B53 material. Even moreimportantly, the Saclay data shows a loss of the PMT detection efficiency, which could be explained byeither the window transmission degradation, the quantum efficiency loss, or gain drop. The loss of thedetection efficiency may be consistent with a 2-3% loss of photons we seem to detect in DIRC data fromBaBar, both in the Bhabha and the di-muon events.
(e) Many other tests at Saclay, ETL, and SLAC were performed to check for overall consistency.
Table 1. ETL Co. analysis of B53 and X-glass windows under various conditions.
Component B53 glassref. glass[% by wt]
B53 glassimmersed for30 days, 83.5oC
B53 glassnormalizedto SiO2 **
X-glassref. glass
X-glassimmersed for30 days, 83.5oC
X-glassnormalizedto SiO2 **
SiO2 62.70 66.10 62.70 69.60 92.40 69.60NaO2 7.50 1.00 0.95 8.70 0.90 0.68Al2O3 6.80 7.30 6.92 4.20 5.10 3.84ZnO 2.90 2.70 2.56 0.00 0.000 0.00BaO 3.10 2.40 2.28 0.00 0.20 0.15CaO 0.70 0.80 0.76 0.00 0.70 0.53B2O3 * 15.90 19.10 18.12 17.20 0.00 0.00Total 99.60 99.40 94.29 99.70 99.30 74.80
Notes: * Fitted by difference** Normalized to maintain the SiO2 composition constant.
2. Tests Performed at the Electron Tube Ltd. (ETL)
2.1. OverviewThis section describes tests performed at ETL [3,4]. The goal of the study is to quantify the rate of material
loss of the glass in order to answer the question of whether the PMTs could survive ten years in the DIRC SOBvessel without imploding. The study was performed in hot de-ionized water in order to accelerate their agingeffect. The acceleration factors applied have been measured by a separate study.
In addition, X-ray fluorescence analysis of the immersed and non-immersed glass windows has been usedto measure the composition of the glass in order to improve the understanding of the weight loss mechanisms,as already mentioned in the introduction.
2.2. Experimental Setup
2.2.1. “Thirty Day” Trial
B53 (also called E53C by ETL in these tests) glass window samples (2.93cm dia. and 0.12cm thick) wereimmersed in de-ionized water for 31 days at 83.5°C. The windows were positioned flat on the base of animmersed perforated polypropylene beaker to enable the whole surface area of the window to be exposed toattack by water. The de-ionized water was changed daily. First, water in system A was replaced with fresh de-ionized water from our in-house supply. Then the water in system B was replaced with water previously insystem A. System A had four B53 windows immersed in de-ionized water with a mean conductivity of 6.21
µS.cm -1, and a pH, measured at 20°C, of 7.26 ± 0.14. The system B had also four B53 windows, immersed in
“24-48 hour aged” water with a mean conductivity of 12.80 µS.cm-1, and a pH, measured at 20°C, of 7.12 ±0.02. A non-immersed window was used as a reference standard for weighing purposes.
2.2.2. “Five Day” Trials
Three B53 glass windows and three X-glass windows (also called E47.2 by ETL) were immersed in de-ionized water for a period of five days at various temperatures in the range of 30°C to 85°C. The B53 samples

4
were immersed at temperatures of 73.0 and 82.6°C and the X-WINDOW samples were immersed attemperatures of 33.2 and 73.0°C. The mean conductivity was 3-12 µS.cm-1.
The apparatus was similar to the one used for the 30-day test with the exception that windows were fixed inposition and mounted vertically using polypropylene fastenings in order to maximize exposure of both faces toattack by water. Also, glass types were separated based on composition and the de-ionized water was not re-cycled between beakers.
2.3. Results and Analysis
2.3.1. Results for B53 Glass Windows – “Thirty-Day” Immersion TrialThe weight loss in system B is greater than the weight loss in system A throughout the experiment, and this
is likely to be due to the greater conductivity of the water in system B; however, the increased dissolution rate isrelatively small (10-30%). The dissolution rate decreases by a factor of 2.5 to 3 during the experiment. Apossible explanation is that the weight loss mechanism evolves from rapid ion exchange with the water-electrolyte into slow dissolution of the lattice.
Taking the average weight loss per day per unit surface area of B53 glass as 1.36 10-05 g.day-1.cm-2 forsystem A (the surface area of the tested windows is 14.6cm2), and the surface area of a typical window sealedonto a PMT tube as 7cm2, then the weight loss for the active surface area of the window is 0.1 mg/day at 83.5°Cor 0.005% of the typical mass of a window (2 grams). This is equivalent to an average daily loss of thickness of57 nm.day-1, or 0.005% of the original window thickness (see Table 2).
Table 2. Weight loss of B53 glass windows (mg).
Day 0 Day 10 Day 21 Day 31 Uncertainty
Average weight of window (A) 1 946.44 1 943.27 1 941.48 1 940.29 0.05Average weight of window (B) 1 903.92 1 899.61 1 897.66 1 896.27 0.05
Ave. weight loss / window /day (A) 0.317 0.163 0. 119 0.01Ave. weight loss / window /day (B) 0.431 0.178 0. 139 0.01
2.3.2. Results for B53 and X-Glass Windows – “Five Day” Immersion TrialsAs the dissolution of glass is generally slow at ambient temperature, it is conventional to measure the glass
dissolution rate V at more than one elevated temperature T. The results can then be modeled using theArrhenius equation in order to derive the activation energy Q for dissolution of the glass: V = V0 exp (-Q/RT),where V0 is the baseline dissolution rate and R the universal constant. So a plot of lnV against 1/T produces astraight line graph of slope -Q/R. The acceleration factor at increased temperature is deduced and then used topredict the performance of the glass at ambient temperature.
The measurements performed at different temperatures are shown in Table 3.
Table 3. Average weight loss per window and per day after five days immersion (mg).33.2°C 73.0°C 82.6°C Uncertainty
X-glass window 0. 32 2.87 N/A 0.02B53 glass window N/A 0.33 0.64 0.02
Table 4 presents a comparison of the dissolution rate results for B53 windows during the five-day and
thirty-day immersion trials at ~83°C. The dissolution rate for the five day immersion trial is higher than therates measured in the thirty-day trial. This is as expected as the five-day trial will favor the initial ion-exchangeweight-loss mechanism that will be faster than lattice dissolution. The analysis of the dissolution rates usingdata from the thirty day trial uses the average dissolution rate for simplicity, though it is noted that moresophisticated models of the dissolution rate could be constructed from these results.

5
Table 4. Average dissolution rates for B53 glass windows for the “five day” trial at 82.6°C and “31 day” trial at83.5°C (10-5 g.day-1.cm-2).
5 day trial 31 day trial5 days uncertainty Days 0-10 Days 10-21 Days 21-31 uncertainty
82.6°C 83.5°C 83.5°C 83.5°C4.40 0.12 (A) 2.17 1.11 0.82 0.06
(B) 2.95 1.22 0.95 0.06
Results for the activation energy and acceleration factors for the B53 and X-glass windows are calculatedfrom the five day immersion study and summarized in Table 5. The reference temperature used for thecalculation of the acceleration factor AF is Tref = 20°C.2 We can calculate an accelerator coefficient c allowingthe calculation of the acceleration factor at different temperatures with regard to a given reference temperatureby the following formula:
AF (T) = c ((T-Tref
) / 10)) c = AF (T) (10 / (T-Tref
))
Table 5. Activation energy Q, accelerating factor AC, and acceleration coefficient c.
Temperature T Activation Energy Q Acceleration Factor AF Acceleration Coefficient c[°C] [kJ/mol.]
B53 glass82.6 71.2 170 2.27
X-glass73.0 485 21 1.7883.5 34
2.3.3. Pressure TestETL selected ten PMTs and removed 2% of the front window thickness using air jet alumina powder. These
ten PMTs were then immersed in water for one hour at 2.8 atm and survived the test. According to themanufacturer’s experience, this test is equivalent to more than 20 years of operation at normal pressure. Thisprinciple has been used by the SNO experiment to test the strength of their large PMTs.
2.3.4. Tests determining that the “Frosty” PMT glass is a wrong type of glass.TLC immersed six PMTs in 84oC water with partial circulation (three PMTs in the first tank, and the other
three in the second tank. Daily fresh water was added in the first tank and old water went into the second tank).Voltage was off during this test. In addition, four B53 glass coupons were placed in the first tank, and four B53coupons into the second tank. The tests lasted 30 days. At the end of this period, five PMTs were partially“milky” and one PMT was “frosty.” The window coupons were slightly “milky” on both surfaces. The windowcoupons showed no transmission loss (measured in Saclay), and QE of one “milky” PMT (S/N262438) showedno significant change. However, QE of the “frosty” PMT (S/N 268885) was significantly different from themeasurement before water exposure. In addition, the weight loss in the windows was ~6g/m2, and the weightloss of the “frosty” PMT was ~90g/m2. Table 6 shows the chemical composition of various glasses as measuredby back-scattered X-rays.The column labels in Table 6 have the following meaning:
(a) B53 is data sheet composition of a B53-type glass,(b) A is B53 glass from the batch supplied to the DIRC group (not immersed in water),(c) B is B53 glass from the batch supplied to the DIRC group (after 30 days in water at 84oC),(d) X is “low background” glass used in other PMT types at ETL,(e) C is from “frosty” window cut off from PMT S/N268885 after 30 days in water at 84oC (inside surface),(f) D is from “frosty” window cut off from PMT S/N268885 after 30 days in water at 84oC (“frosty” outside
surface).
2 The SOB water-return temperature is typically 26-28oC.

6
Table 6. Chemical composition of different PMT glasses used in ETL tests:Analysis B53 A B X C DSiO2 65.5% 62.7% 66.1% 69.6% 74.3% 92.4%NaO2 7.7 7.5 1.0 8.7 7.9 0.9Al2O3 6.2 6.8 7.3 4.2 4.1 5.1ZnO 2.0 2.9 2.7 0.0 0.0 0.0BaO 3.0 3.1 2.4 0.0 0.0 0.2CaO 0.5 0.7 0.8 0.0 0.0 0.7B2O3 15.0 15.9 19.1 17.2 13.3 0.0
The conclusion from tests (e) and (f) is that the “frosty” PMT window (S/N 268885) is not B53 glass (it has noZn) and is most probably X-glass. According to ETL, the B53 glass turns “milky” with the loss of sodium, while the“frosty” window has lost sodium and boron. Therefore, it is argued that some DIRC PMTs turned “frosty”because a small number of X-glass windows mistakenly were mixed with the B53 glass windows in the DIRCPMT production. Thus far, the company has not produced an independent estimate indicating how many PMTswith the “wrong” type of glass are in the DIRC. Figure 2 shows (see also section 2.3.5) the extent of the corrosionin “frosty” and “milky” PMT windows (cross-sectional view). One can clearly see that the “frosty” corrosion ismuch larger. The “frosty” window shows a uniform depth of attack up to 15% of the window thickness after 30 daysin 84oC water. The depth of the attack on the “milky” window is entirely concentrated on the surface and it is toothin to be resolved optically even after 30 days in 84oC water. Figure 3(a) shows that there was no effect on the QEmeasurement of “milky” PMTs; however, there was some effect on “frosty” PMTs, as seen on Fig. 3(b). Figure 4shows a correlation between the “frosty” PMTs removed from the SOB in the October 1999 shutdown and ETL’sserial numbers. It would appear that the largest group came as a cluster or two, which indicates a bad batch and acontinuous problem.
(a) (b)
Figure 2. (a) Image of a sectioned X-glass window cut from a PMT after immersion in de-ionized 83.5°Cwater for 31 days. The thickness of the frosted region is 0.018 cm. (The rule spacing is 0.5mm). The crazed edge is observed at the top. (b) Image of a sectioned B53 window cut from
a PMT after immersion in de-ionized 83.5°C water for 31 days. There is no evidence ofpenetrative etching of the glass. The “milky” side is on top.
2.3.5. Discussion of ETL ResultsThe acceleration factor and the weight loss data from the five day trials can be used to calculate that 0.7%
of the B53 window thickness will be lost after immersion for ten years at 20°C. If the weight loss data from the31 day trials is used with the same acceleration factor, then approximately 0.1% of the window thickness will belost. The difference between these two predictions is most probably due to the changing mechanism of weightloss from the glass as a function of time from ion exchange to congruent lattice dissolution. As ETL considersthat there is a significant risk of implosion if greater than 50% of the window thickness is lost; there is
Outside “frosty”surface
Outside “milky”surface
Scale

7
negligible risk of failure for PMTs with B53 windows. This is confirmed by the image of a sectioned B53window, which shows no etching after 31 days at 83.5°C, equivalent to 14 years at 20°C [see Figure 2(b)].
X-ray fluorescence analysis of the surface of X-glass windows has shown that ion exchange or penetrativeetching, as shown on Figure 2(a), dominates the weight loss mechanism. The X-ray analysis has been combinedwith the five-day weight loss measurements and the relevant acceleration factor to derive the 10 year etch depthas 48% of the original window thickness. Given that the calculated acceleration factors may vary depending onthe local environment, the calculations suggest there is a sizeable risk of failure of the X-glass windows after 10years.
(a) (b)
Figure 3. (a) No effect on measurement of QE of “milky” PMT exposed to water at 84oC for 30 days.(b) Some effect on measurement of QE of “frosty” PMT exposed to water at 84oC for 30 days.
0
2
4
6
8
10
12
14
16
18
20
250 1250 2250 3250 4250 5250 6250 7250 8250 9250 10250
PMTs in S/N sequence
Frequency of 'frosted' PMTs in bins of 500 delivered
Figure 4. ETL company’s estimate how the “frosty” PMTs taken out of SOB correlate with serial numberproduction. It appears that most of them came as one bad batch.

8
2.3.6. Conclusion of ETL TestsThe acceleration factors calculated from the five-day immersion trials predict that PMTs with B53 glass
windows will loose less than 1% of the window thickness after a 10 years immersion at 20°C. Therefore, thereis no significant risk of envelope failure for PMTs with B53 windows.
The analysis of X-glass windows shows that up to 50% of the window thickness may be compromised after
immersion for 10 years at 20°C. Therefore, there is a sizeable risk of implosion after 10 years for PMTs withX-glass windows. It is likely that the etching rate may vary in differing environments, so it is suggested that aPMT with an X-glass window could be removed and sectioned to determine the local etch rate.
The analysis of DIRC “frosty” PMTs shows that the front window glass has the same composition as theX-glass, which were mixed with the B53 windows in DIRC PMT production by mistake. The X-glass has noZn, which causes excessive depletion of Na and B elements, and subsequent corrosion. The “milky” PMTs aremade of the correct B53 glass, which has tolerable rate of corrosion over 10 years in BaBar. This means that outof 10 800 PMTs in SOB, only 50 are made of wrong glass.
According to ETL’s test results, all “wrong glass” PMTs would turn “frosty” by the time of the October1999 shutdown, i.e., we would have counted them all. This is an extremely important statement because we donot have an independent method to estimate how many of the X-glass windows we have in the system.
4. Tests Performed at Saclay
4.1. OverviewThis section describes tests performed at Saclay [4]. Glass corrosion was not the main worry of the DIRC
group initially, assuming that the manufacturer understood such problems well at this point of time, and we cansimply specify when ordering PMTs [6]. Saclay performed only tests related to water pollution triggered by thePMT’s material, and the emphasis was made on the helium tests and the sensitivity to the magnetic field [7].Initial PMT glass corrosion tests were performed in parallel to the light-catcher coating corrosion and the socketgluing tests in Orsay. No obvious visual effects on the PMT front glass were observed at that time. After theOctober 1999 discovery of PMT front-glass corrosion, one PMT from the Orsay sample was also analyzed atSLAC. It was found that there was indeed sodium depletion in the front-glass window; however, the glass wasobviously the B53 glass, and did not suffer from the gross corrosion. In retrospect the problem, judged by visualobservation only, would not have been discovered during the Orsay tests.
The main emphasis in the tests performed at Saclay was in the area of photo-detection, and to also checkfor weight and transmission losses.
4.2. Experimental Setup: Water StationThe need to understand the long-term PMT glass behavior over 10-years of operation required that
corrosion studies be performed in hot water in order to accelerate the effect, similarly to the above mentionedETL tests. This method is typically used in industry to study chemical and mechanical characteristics of glass.For temperature increase by every 10 °C, an acceleration factor of 2-2.5 is obtained. This factor is entirelyempirical, depending on what we are studying. In the Saclay tests, we have used a factor of two as aconservative acceleration coefficient (see Section 4.3.2). As we discussed in Section 2.3.1, ETL Co. empiricallymeasured the acceleration factors of 2.3 and 1.8 for the B53 and X-glass respectively, based on the weight lossrates at different temperatures.
A small ultra-pure water station, with a recirculation capability, is used in the Saclay tests. The water isfiltered, de-ionized and goes through an UV lamp to kill bacteria. The water resistance at the inlet of the testcontainer, with no circulation, is ~4 MΩ, and ~18 MΩ after the purification. For comparison, the DIRC SOB
water resistance is between 8 (return from SOB) and 18 MΩ (supply to SOB). We also measure the resistanceand pH factor of water samples taken from the PMTs stainless steel vessel, containing seven PMTs, in similargeometry as in the DIRC.
The temperature in the purification station could not exceed 40°C. In order to keep the water temperature atsufficiently high levels inside the vessel, recirculation was not continuous. Instead, only 3 hours three times aday initially, and later only once a day after having tested that the water quality stays good enough (checking
that the resistance is greater than 1 MΩ, and no bacteria peak absorption is observed in the water transmission).

9
The vessel has been put in a thermostatic box and we periodically measured the temperature at differentlevels (see Fig. 5). The supply water resistance was 19 MΩ, and 1MΩ to 10 MΩ in the vessel. The pH factorwas close to seven after water purification, and about 6-7 in the vessel.
0
10
20
30
40
50
60
70
80
90
100
0 24 48 72 96 120 144 168 192 216Time (ho urs)
Tem
pera
ture
(°C
)T water: 67+/-11°C
T box: 85+/-3°C
T bases: 56+/-4°C
T out: 21+/-1°C
Figure 5. Temperature evolutions between two measurements on the PMTs, the average value of the watertemperature has been used to determine the acceleration factor.
4.3. Experimental Setup: Measurement of PMTsThe seven PMTs were immersed in hot water and illuminated in the same manner as the DIRC PMTs
during the calibration procedure [8,9,10]. We have used a blue LED, pulsed at 1kHz. To facilitate themeasurement, we did not work at the single photoelectron level, but instead work with more than 10photoelectrons in a Gaussian mode using directly the average value of the peak. To check the possiblefluctuation of the LED, the light has been split and we have used a monitoring PMT (2020) at roomtemperature. The high voltage of the different PMTs (1140 to 1380 V) has been adjusted to have approximatelythe same LED amplitude. The LEDs were switched only during the measurement, but the PMTs have alwaysstayed on.
The PMT gain correction due to temperature variation was calibrated out using a single-photoelectron peakmeasurement shown in Table 7 and Fig. 6, because of a possible PMT gain change towards the end of its life.
Table 7. PMT gain correction as a function of temperature.
PMT # Slope (%/°C)1 -0.552 -0.503 -0.334 -0.595 -0.376 -0.317 -0.34
Tem
pera
ture
[C
]

10
0
0,2
0,4
0,6
0,8
1
1,2
15 25 35 45 55 65 75 85
Temperature (°C)
GA
IN (A
.U.)
Slope: - 0,59% per °C
Figure 6. Normalized PMT gain versus the temperature of the water in which it has been immersed.
4.4. PMTs Corrosion ResultsFor this test, we have used nine PMTs, which are listed in Table 8. Two PMTs, #3 (“frosty”) and 7
(“milky”), were tested at the St. Gobain Company who analyzed the composition of the glass confirming theresults of ETL.
Table 8. PMTs used in Saclay glass corrosion tests.
PMT # PMT serial number Origin1 264829 Clear PMT removed in IR62 259755 Clear PMT removed in IR63 268882 Frosty PMT removed in IR24 255830 Milky PMT removed in IR25 268886 Frosty PMT removed in IR26 258106 Clear PMT from Orsay7 258203 Clear PMT from Orsay3’ 268887 Frosty PMT removed in IR27’ 050372 ETL free PMT sample grounded at Orsay
Table 9. Saclay PMT glass corrosion test results.Run Start of
testEnd Time
(days)Mean temp.
(°C)Accel. Time
(months)Observations
1 11/09/99 12/20/99 40 66.8 17 End of test of PMTs # 3 and 72 01/16/00 02/16/00 30 66.6 12 Start of test of PMTs # 3’, 7’ and
four B53 windows3 02/17/00 06/27/00 131 63.5 62 Death of PMT # 7’ (grounded)
Water changed on 03/23/004 06/28/00 07/28/00 29 66.2 11 Death of PMT # 5 (frosty)
The tests started in November 1999 and ended in August 2000. The “grounded” PMT #7’ was dead after110 days (a 52-month equivalent, with the SOB at 28°C). At the end, and before its death, PMT #5, labeled as“frosty” in the SOB, started displaying the “Christmas tree” effect,3 which lasted about ten days. This caused
3 “Christmas tree” is a condition when a PMT starts shining light uncontrollably. ETL explains that such condition may occur
when either a PMT vacuum is slightly compromised or internal breakdown occurs [11].
Nor
mal
ized
Gai
n

11
some loss in PMT response due to loss of gain4 and efficiency. However, we cannot be certain if the loss is dueto quantum efficiency loss, or due to transmission loss given that the photon flux was not calibrated absolutely.Table 9 shows corrosion test results prior to the “Christmas tree” effect.
We have taken pictures of PMTs at different stages of the corrosion test - see Figures 7-10. One can seethat four clear PMTs become rapidly milky, followed by scratches appearing on the window surfaces. The“frosty” PMTs become progressively frosted, spreading to the edges of the window. One can also see that thecharacteristic color of the photocathodes disappear on the dead PMTs, as if the surface was wet.
Figure 7. Appearance of seven PMTs, as the beginning of the corrosion test. One can see four “clear”PMTs on the bottom, two “frosty” on each side, and one “milky” at the top right-hand side.
Figure 8. The same PMTs as in Fig. 7, after the first immersion in hot water for up to 40 days (equivalent to17 months at 28°C). Notice that the four “clear” PMTs shown in Fig. 7 became “milky.”
4 PMT 9125 aging, which is a slight decrease of output in time, is due to: (a) when the PMT is on, the dominant mechanism
is a gain change approximately linear with the charge drawn. Typically the gain decreases to 50% after an anode draws acharge in the range of 200-400 Coulombs. (b) when the PMT is off, the quantum efficiency also degrades with the same 200-400 Coulombs at half-life. Given that the cathode current is many orders of magnitude smaller than the anode current, the lossof quantum efficiency is usually negligible in comparison to the gain [12].
1
6
5 3
2
7
4

12
Figure 9. The same PMTs as in Fig. 7, after the second immersion in hot water for 30 days (equivalent to12 months at 28°C). Scratches appeared on four “milky” PMTs, and edges of the “frosty” PMT# 5 also became “frosty.” It is the first immersion for PMT #3’ and 7’.
Figure 10. The same PMTs as in Fig. 7, after the third and fourth immersion in hot water for 174 days(equivalent to 82 months at 28°C); it is the second and third immersion for PMT #3’ and 7’.There are more scratches on four of the “milky” PMTs and the “frosty” PMT appears muchmore “frosty” when dry.
The results of the detection efficiency measurements with the LED flasher are summarized on Fig. 11. Thedata shows an overall drop in response, although one can see an initial increase in several PMTs. This increaseis not entirely understood. One possibility is that some of the PMT front-glass was not entirely clean and thepollution washed away slowly (these PMTs were used at CERN in another test). A reason why we believe inthis hypothesis is that the PMTs kept in clean conditions, such as the PMTs removed from the SOB, did showthe initial rise in response. A less likely, although still a possible explanation of the initial increase in response,is that the PMTs operated at high temperature during the test and some developed instability due to theevaporation of photocathode and/or coating of other surfaces. In any case, after certain point in time, all PMTsshow a gradual drop in response to the LED photon flux (PMT #3 showing the smallest slope). The time used inFig. 11 is the accelerated time calculated by using the mean temperature and the acceleration factor of two per10°C, taking 28°C as a reference temperature of the SOB. Using the mean temperature between twomeasurements introduces a systematic error of about 25% (we have done the exact calculation on 200 hoursand found an accelerated time of 164 days instead of 131 days calculated with the mean temperature). Anotherpoint is that we have also used one acceleration factor for two different types of glasses.
Table 10 summarizes the results shown in Fig. 14, taking only the downward trend into account. The PMTswith B53 glass have an efficiency loss of 0.16-0.51% per month, which would translate to a loss of response of19-61% in ten years. The loss in response is not only due to the window transmission loss but probably also dueto photocathode aging. The gain change was corrected using a single-electron gain measurement.
7’
3’
Dead
Dead
5

13
PMT FR OM IR6
0
200
400
600
800
0 12 24 36 48 60 72 84 96 108 120Time (months)
Blu
e LE
D P
eak
(A.U
.) PM1 clear
PM2 clear
PMTS FR OM IR2
0
200
400
600
800
0 12 24 36 48 60 72 84 96 108 120
Time (months)
Blu
e LE
D P
eak
(A.U
.)
PM3 fros ty
PM4 milkyy
PM5 fros ty
PM3' fros ty
dead
PMT FROM ORSAY
0
200
400
600
800
0 12 24 36 48 60 72 84 96 108 120
Time (months)
Blu
e LE
D P
eak
(A.U
.) PM6 used at CERN
PM7 used at CERN
PM7' gr ounded
dead
Figure 11. The PMT detection efficiency change as a function of time. Time was scaled to the SOB temperatureof 28°C (taking into account the acceleration factor). The PMT response was measured using the blueLED producing ~10 photoelectrons on average.
Blu
e L
ED
Pea
k B
lue
LE
D P
eak
Blu
e L
ED
Pea
k

14
Table 10. Slope describing the downward trend in PMT efficiency in Fig. 11.
PMT # Condition Slope (%/month)1 Clear, then milky -0.332 Clear, then milky -0.393' Frosty -0.484 Milky -0.165 Frosty -0.536 Clear, then milky -0.517' Grounded -0.96
Figure 12 shows that average number of Cherenkov photoelectrons per ring, as reconstructed from theBhabha events, droping steadily as a function of the BaBar run number with a slope of 2-3%/year [13]. Asimilar result, shown in Fig. 13, was obtained from the di-muon events [14]. Both of these results confirm thatwe are probably dealing with a real loss of efficiency in the DIRC detector. Although these two results are stillpreliminary, it suggests a possible correlation with the Saclay results shown in Fig. 11.
The PMT gain drops after a certain accumulated anode charge is collected. For example, we can estimatethe average anode charge assuming a BaBar run of 12 months duration, rate of 100kHz/PMT, the average singlephotoelectron pulse of ~25mV amplitude and 10ns duration, on a 50 Ohm load. We obtain the total anodecharge of ~8 Coulombs per PMT per year. If we use the information disclosed [12] in Footnote 4, we may beactually consistent with the measured 2-3% efficiency drop shown on Figures 12 and 13, i.e., the observedefficiency drop is due to the PMT gain drop, i.e., due to a dynode aging process. If the efficiency loss is due tothe PMT gain loss, and as long as it is only 2-3% loss per year, it can be easily corrected by a voltageadjustement. However, allowing large charge doses, for example the “Christmass tree“ effect, for a long periodof time could be dangerous. On the other hand, the cathode accumulated charge is a tiny fraction of the anodecharge (for the above example is only ~4.6x10⁻⁷ Coulombs/year), which indicates that we are probably notdealing with cathode quantum efficiency drop at BaBar.
Figure 12. Average number of Cherenkov photons per ring from Bhabha analysis as a function of the BaBar run number [13]. The decline is consistent with 2-3%/year.
Nph
oton
s
Bhabhas
Run number

15
Figure 13. Average number of Cherenkov photons per ring from di-muon analysis (x points) as a function ofthe BaBar run number [14]. The figure also shows a relative difference from the expected number(+ points). Both curves indicate a decline at a level of 2-3%/year.
4.5. Weight and Transmission LossThe weight loss measurement was done using front window coupons of B53 glass obtained from ETL Co.
Four coupons were placed vertically in the PMT vessel, attached to three pieces of PVDF hose used for thewater system, as shown in Figure 14.
Figure 14. Four B53 glass window coupons with supports.
We have performed two kinds of measurements: (a) the weight loss using a 0.1mg accuracy scale(Sartorius), and (b) the transmission loss between 200 and 850 nm (the spectrometer was made by Perkin Elmer
Run number
Nphotons
Mea
n N
phot
ons -
Nex
pect
eddi-Muons

16
Co., Model Lambda 16). We have also taken pictures which show milky spots only at the beginning and at thelevel of the hose contact, then more and more scratches (see Fig. 15).
Figure 15. (a) B53 glass window coupon after the first immersion in water, and (b) after the third immersion.
4.5.1. Weight Loss MeasurementsOur results compared with those of ETL are not in complete agreement given that testing was not done in
the same experimental conditions. For example, the temperature is higher in the ETL data, and the ETL waterresistance is lower. Figure 16 and Table 11 summarizes the results of the measurements. The equivalent SOBtime has been calculated with an acceleration coefficient of two, and a reference temperature of 28°C; this givesETL an acceleration factor of 50. However, ETL’s conclusion is still valid, i.e., the PMTs equipped with theB53 glass should not implode in 10 years of running.(a) (b)
0
5
10
15
20
0 50 100 150 200 250 300
Real time (days)
Wei
gh
t L
ost
(m
g)
Saclay: 5MOhm, 67°C
ETL A: 0,16MOhm, 83,5°C
ETL B: 0,08MOhm, 83,5°C
0
5
10
15
20
0 20 40 60 80 100
Equivalent SOB time (months)
Wei
gh
t L
ost
(m
g)
Saclay: 5MOhm, 67°C
ETL A: 0,16MOhm, 83,5°C
ETL B: 0,08MOhm, 83,5°C
Figure 16. B53 glass coupon weight loss as a function of (a) the real time and (b) the SOB equivalent time.
Table 11. B53 glass coupon weight loss measurements at Saclay and ETL.
SACLAY ETL
Real Time(days)
SOBTime
(months)
Weight Lost(mg)
Error(mg)
Real Time(days)
SOB Time(months)
A(mg)
B(mg)
0 0 0.0 0.2 0 0 0.0 0.033 12 5.4 0.3 10 17 3.2 4.3
164 72 16.4 0.6 21 35 5.0 6.3243 94 18.6 0.7 31 52 6.1 7.6
Wei
ght
loss
[m
g]
Wei
ght
loss
[m
g]

17
4.5.2. Transmission MeasurementsFigure 17 shows the transmission loss as a function of wavelength for a reference glass coupon as well as
one of four coupons immersed in hot water at different periods of time. Figure 18 shows the mean transmissionloss (averaged over four coupons) at three wavelengths as a function of time. Note that corrosion takes place onboth faces, so the transmission loss is greater here than in the SOB. Another important point is that themeasurements were not done with water directly coupled to the corroded surface, which would definitelyimprove the transmission, even though the surface is visibly corroded. In that sense, this is a less importantresult, which is not directly applicable to the DIRC analysis. It only indicates that the glass surface is indeedcorroded.
REFERENCE B53 WINDOW
-0,12
-0,1
-0,08
-0,06
-0,04
-0,02
0
0,02
200 300 400 500 600 700 800
Wavelength (nm)
DIF
Tra
nsm
issi
on
16fev
27june
14sept
B53 WINDOW #4
-0,12
-0,1
-0,08
-0,06
-0,04
-0,02
0
0,02
200 300 400 500 600 700 800
Wavelength (nm)
Tra
nsm
issi
on
33days ----> 12 monthes
164days ----> 72 monthes
243days ----> 94 monthes
Figure 17. Transmission loss (relative to the initial transmission) for (a) the reference B53 window,and (b) for one coupon immersed in hot water at different periods.
(a)
(b)
Tra
nsm
issi
on lo
ss T
rans
mis
sion
loss

18
-12
-10
-8
-6
-4
-2
0
2
0 20 40 60 80 100Time (months)
Tra
nsm
issi
on
var
iati
on
(%
)
330nm
450nm
600nm
Figure 18. The transmission loss in percentage at different wavelengths.
5.6. Conclusions from Tests at SaclayThe effect of ultra pure water on the PMT glass window has been quantified by studying the corrosion rates
in hot water and applying the relevant acceleration factor. We confirm the ETL results that the PMT frontwindow, which is made of B53 glass, will loose less than 1% of its thickness in ten years of operation.Therefore, there is no significant risk of implosion for PMTs with B53C windows. Our measurements, based onscaling from the hot water tests, indicate that the risk of implosion is small in ten years even for the “frosty”PMTs. Saclay plans to make a cross-sectional cuts through the “frosty” PMTs.
We measure a decrease of a few percent in the transmission after ten years equivalent at SOB temperature.However, this measurement was done in air, where the optical coupling is much worse than in water.
We measure a non-negligible loss of detection efficiency, on which we can put an upper limit ranging from20 to 60% per ten years of operation. The loss of the detection efficiency could be explained by a loss of eitherthe window transmission or the PMT quantum efficiency (in this measurement, the PMT gain variation wascalibrated out). The efficiency loss measured in Saclay would represent an addition to the possible PMT gainloss due to the total accumulated anode charge mentioned in Section 4.4. However, one should add that theSaclay test did not measure a possible loss of the quantum efficiency in warm water.
5. Tests Performed at SLAC
5.1. OverviewThis section describes tests performed at SLAC. They include periodic visual observations of the status of
PMT glass faces viewed through the window ports of the SOB, taking pictures of PMTs removed from the SOBvessel, X-ray and ESCA surface analysis of PMT glass, detailed SOB water trace element analysis, and a long-term test of front PMT glass coupons. We used the water analysis to check if the sodium and boron levels areconsistent with the known corrosion of the PMT glass. We also include other measurements, which SLACperforms regularly, such as the water transmission at 266, 325, and 442nm, water pH factor, water resistivity,and SOB water temperature. The results of this work are described in the following sections.
5.2. Visual Observation of PMT Glass Through the Ports in the SOB VesselWe can only see gross effects when viewing a corroded glass through the SOB port, while the vessel is full
of water. This is due to the good optical coupling of water to glass surface, even if it is corroded. We haveperformed periodic checks over the past ten months. There was no observable degradation detected.
5.3. Electron Microscope Pictures of PMTs Removed from the SOB VesselFigure 19(a) shows an electron microscope picture of a “frosty” PMT, designated as #4 in Fig. 1. The
surface is full of small fractures, which seem to be peeling off the surface underneath. Some of the fracturingoccurs when the PMT is subjected to vacuum forces in the electron microscope. For example, Figure 19(b)
Tra
nsm
issi
on lo
ss [
%]

19
shows an example of such fracturing on a “milky” PMT, designated as #3 in Fig. 1. It is believed that itoccurred in the vacuum. The thickness of the fracture shown on Fig. 19(b) is 1-2 microns. Another example isshown on Fig. 20, which shows PMT #10, which was neither “milky” nor “frosty” and was removed from theSOB by mistake. It also developed crazing when subject to forces in vacuum. This indicates that any PMT,which was subjected to water for more than ~6 months, must not be stressed excessively in any way. This resultled us to a major decision not to open the SOB unless it is absolutely necessary.
(a) (b)
Figure 19. (a)“Frosty” PMT, designated as #4 in Fig. 1, developed crazing already in the SOB. (b) This pictureindicates that a “milky” PMT, designated as #3 in Fig. 1, can develop crazing when placed in theelectron microscope vacuum. The thickness of the fracture is 1-2 microns.
Figure 20. PMT #10, designated as “clear” and nearly perfect, was removed from SOB by mistake (it wasneither “milky” nor “frosty”). It developed crazing when subjected to vacuum forces in the electronmicroscope. This led us to conclude that we should minimize any stresses, such as unnecessary waterdraining, SOB opening, etc.
5.4. Surface X-Ray Analysis of PMT GlassThis technique uses an electron beam (~15 keV) and measures a spectrum of the recoiled X-rays. Figure 21
shows a typical X-ray spectrum taken at accelerating voltage of 15 kV. A simulation, shown in Fig. 22, showsthe electron beam penetrating 1-2 microns in glass at 15kV, i.e., probing the few microns at the surface. At thesame time, the electron beam lateral spread is about 1-2 micron when it stops. Therefore, a sampling volume atthis voltage is a cube of the size of a few microns. This is an important result because several conclusions, basedon the X-ray analysis and presented in Section 5.4.1, only apply to a small depth.

20
One can clearly identify major peaks of O, Na, Si, C, and Al in Fig. 21. These peaks will be used in Section5.4.1 to analyze the sodium depletion in front-glass. It is difficult to see Zn using our electron microscope,because the Zn and Na peaks are close to each other. At 15 kV, Zn has two X-ray lines, a dominant one is at1.010 keV and a weaker one is located at 8.638 keV (less than 10% intensity). Na has only one line at 1.041keV. This was verified by using calibration targets containing either ZnO or NaF2. In all our PMT front glassanalysis of “milky” or “frosty” tubes we did not have any hints of the 8.638 keV line, which would indicate apresence of Zn. One should add that there was no peak corresponding to Rhenium, which would indicate thatthe light catcher plating is coming off.
Figure 21. Elemental composition of a reference glass as measured in the electron microscope operating a 15 kV.electron beam strikes a PMT front glass surface and recoil X-ray spectrum is measured. One can clearlyrecognize major components of glass: O, Si, Na, Al and C.
Figure 22. Monte Carlo simulation of motion of 15 KeV electron in SiO2 using the commercial program “FlightSimulator” (courtesy of B. Kirby).
5.4.1. Sodium Depletion of PMT Front-Glass Taken out of the SOB VesselFigure 23 shows a sequence of points along the PMT envelope where the primary electron beam strikes.
For each point we have taken, the X-ray spectrum is similar to that shown in Figure 21. As one follows thesequence of points, shown in Fig. 23, one slightly changes the solid angle for the X-ray detection. This wascalibrated out by using a Na/Si ratio, assuming that the Si component is changing only slightly.
Figure 24 shows the result as a ratio of X-ray peak areas of Na and Si for a “milky” PMT #6 (S/N 050038)(taken out of SOB during the October 1999 shutdown), normalized by the same peak area ratio for a brand newPMT (this PMT was not immersed in the water at all). One can see that points 5-14, which are located on the

21
front PMT glass surface, clearly shows sodium depletion relatively to points 1, 2, 3, 4, and 15, which arelocated on the glass side of the PMT, as shown on Fig. 23. The side glass has a different composition than thefront glass (see Section 6).
Figure 23. A sequence of points along the PMT glass, where the electron beam hit and the X-ray scan was taken tocheck for sodium depletion.
Another analysis performed under a flake of PMT #4, similar to that shown in Fig. 19(b), indicates nosodium depletion. However, on top of the flake sodium depletion is detected. A typical flake, only a fewmicrons thick is indicative that sodium depletion extends to depths of only a few microns (see Fig. 19b). Thisresult is consistent with the penetration depth of 15 keV electron beam in SiO2, as simulated in Fig. 22 by acomputer program. The measurement of sodium depletion under the flake was possible since the PMT wasplaced into the electron microscope at an angle. The result is also consistent with the rate of removal, based onthe water purity tests described in Section 5.6.
Sodium depletion in "milky" PMT #6 front glass
0
0.2
0.4
0.6
0.8
1
1.2
1.4
1.6
1.8
0 2 4 6 8 10 12 14 16Sequence number of a point along the PMT envelope
~23 mm (PMT face)
J.V., 10.14.99
PMT side
~ 1-2 mm from the edge
Figure 24. Sodium depletion in the front glass of PMT #6 (S/N 254776) judged as having a “milky” surface,and removed from the SOB during October 1999 shutdown. A sequence of numbers follow the glassenvelope as described on Fig 23. The Si X-ray peak was used as the normalization of the X-raydetector response due to the changing solid angle during the surface sweep.

22
Figure 25 shows similar sodium depletion, although to a lesser extent. The front PMT glass surface (#1 orS/N 050038) used in early verification tests at Orsay, is designed to show that there is no water induced PMTglass corrosion. Indeed, one can confirm that there was no visual effect. However, more precise X-ray testsshow that corrosion is present in terms of sodium depletion on the front of the PMT glass.
Sodium depletion in PMT #1 front glass
0
0.2
0.4
0.6
0.8
1
1.2
1.4
1.6
0 2 4 6 8 10 12 14 16Sequence number of a point along the PMT envelope
PMT face
J.V., 12.4.99
PMT side
Exactly on the knee of the front glass
~1mm away from the knee (on the side)
Figure 25. Sodium depletion in the front-glass of PMT #1 (S/N 050038) used in early tests at Orsay to verify theabsence of glass corrosion by water. A sequence of numbers follows the glass envelope as describedon Fig. 23. The Si X-ray peak was used as a normalization of the X-ray detector response due to solid anglechanges during the surface sweep.
5.5. ESCA Analysis of the Front-Glass PMT Taken out of the SOB VesselThis technique uses a very soft X-ray beam (1.487 keV) and measures a spectrum of the recoiled electrons.
The soft X-ray beam probes only ~50Å of the glass volume, which is a major difference from the electron beam-based X-ray analysis (see Section 5.4). The X-ray analysis probes 2-3 microns of glass volume at 15kV. Anothertechnical difference is that the ESCA spectrometer vacuum chamber is much smaller, and one needs to cut frontPMT glass to do the front glass analysis.
The analysis was done on several tubes: (a) “milky” PMT #6 (S/N 254776), (b) “milky” PMT #8 (S/N255140), and (c) “frosty” PMT #4 (S/N 268893). The last two were broken up to allow a cross-sectionalanalysis of the front glass. Figure 26 clearly shows that Zn is present in the front glass of the “milky” PMT #6,although we do not see any Na, because it is already depleted from the front surface. Figures 27 and 28 showthat both elements, Zn and Na, are present in the “milky” PMT #8. This means that zinc is present not only onthe outside surface (Fig. 27), but also in the volume (Fig. 28). This is evaluated as consistency proof that the“milky” appearance corresponds to B53-type glass, which confirms the ETL results. On the other hand, Fig. 29shows that we clearly do not see Zn in the “frosty” PMT #4, although we do see Na. This agrees with the ETLobservation that only the “frosty” PMTs do not have Zn element in the front glass. The milky PMTs, as well asall clear PMTs, do have Zn in the form of ZnO. Our tests were done on PMTs taken out of the SOB vessel inIR-2 after being immersed in water for ~8 months at temperatures between 26-28oC.

23
Figure 26. ESCA analysis of front-face glass of PMT #6 (S/N 254776), which was judged as “milky,” and removedfrom the SOB vessel during the October 1999 shutdown. Zn is clearly detected, which is taken as a proofthat the glass was indeed B53 glass. This result is consistent with the “milky” appearance; however, thereis no sign of Na.
Figure 27. ESCA analysis of front-face glass of PMT #8 (S/N 255140), which was judged as “milky” and removedfrom the SOB vessel during the October 1999 shutdown. Both elements, Zn and Na, are clearly detected.
PMT #6 front-face glass(S/N 254776)
PMT #8 front-face glass(S/N 255140)
Expect Na
Zn
Zn
Na

24
Figure 28. ESCA side analysis of the broken edge of the front face glass of PMT #8 (S/N 255140), whichwas judged as “milky,” and removed from the SOB vessel during the October 1999 shutdown.Both elements, Zn and Na, are clearly detected in the volume of the front glass. This means thatthe glass is B53-type glass, which meets the required glass type.
Figure 29. ESCA analysis of front face glass of PMT #4 (S/N 268893), which was judged as “frosty,” andremoved from SOB vessel during the October 1999 shutdown. Clearly, we see no sign of Zn. Thisconfirms the ETL observation that “frosty” PMTs do not have Zn, because they are made with thewrong X-type glass.
5.6. Water Analysis and Its Relationship to Glass CorrosionIf elements of the PMT glass are leaching into water, we should be able to detect them in precision water
analysis. Today, a modern water analysis is capable of determining impurities at a level of 0.001-0.010 ppb. Aswe will see, with this level of precision it is possible to verify that sodium from the front PMT glass is indeedleaching into the water, i.e., verify conclusions from the X-ray analysis described in Section 5.2.1. By doingperiodic water analysis, it is then possible to determine if the leaching is constant, improving, or deteriorating.
PMT #8 broken edge of front-face glass(S/N 255140)
PMT #4 front face-glass(S/N 268893)
Expect Zn here

25
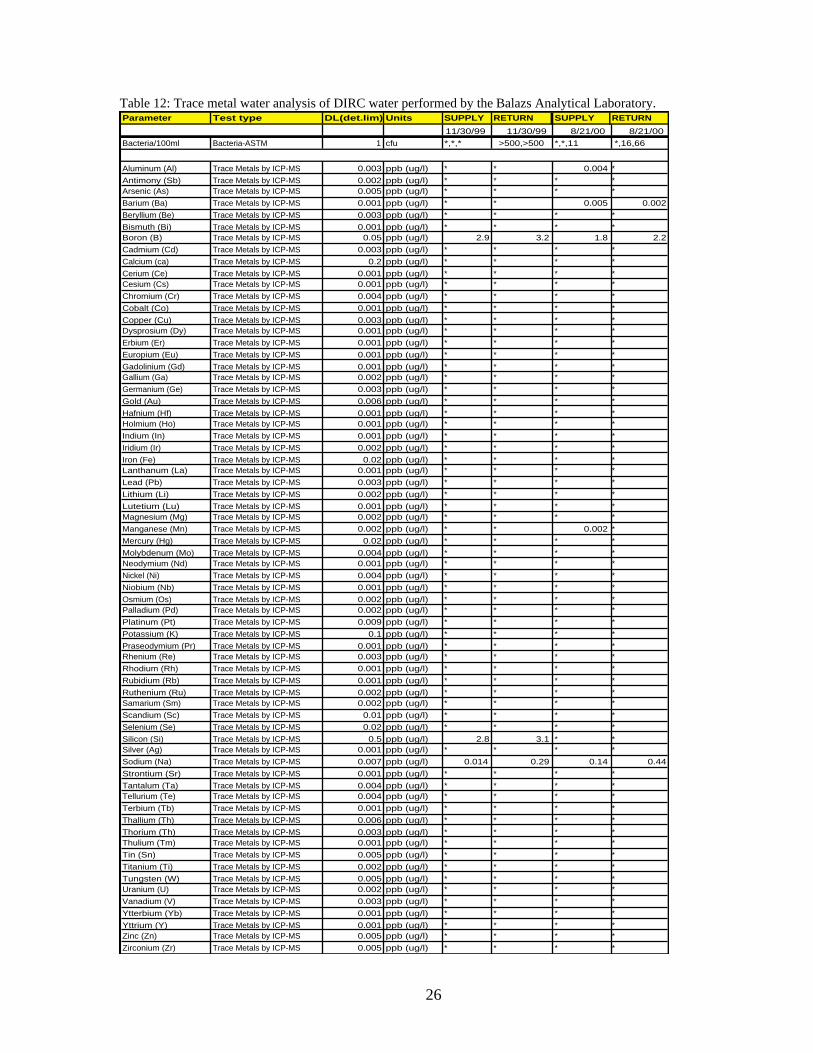
Table 12 shows results of trace metal analysis, detection limits, and bacteria count in the supply and returnof the SOB water in IR-2, which were performed ~8 months apart. Our experience with the detection limitsindicate that the quoted number, especially frequently found elements such as sodium, could exceed its nominalquoted value by a factor of 2-3 on any given measurement trial. Variations can be caused by a samplingtechnique, presence of people, sample bottle contamination, etc. The water sampling and the analysis were doneby the Balazs Co.5 We were especially interested in elements, which are present in the PMT glass, such assodium, boron, and silicone. The difference between supply and return water samplings in November 1999
indicate 0.28 ± 0.14 ppb of Na, 0.3 ± 0.1 ppb of B, and 0.3 ± 1 ppb of Si, where the error margin is given as
twice the detection limit shown in Table 1. In August 2000, these differences changed to 0.44 ± 0.14 ppb of Na,
0.4 ± 0.1 ppb of B, and 0.0 ± 1 ppb of Si. For all practical purposes, we can neglect Si as a significant resultgiven its very large errors.
According to ETL, the B53 glass turns “milky” with loss of sodium, while the “frosty” window has loses ofsodium and boron (see Section 2.3.4.). If we assume this, we may determine two different scaling rates. Onerate for the sodium leaching from all PMTs in the DIRC, and another rate for the boron leaching from only“frosty” PMTs, which are made of X-glass. There are only 50 such PMTs in the DIRC system.
From Table 12, we conclude that the leaching rates of Na and B are constant during the past eight monthswithin errors. We can also use the results from Table 12 to estimate the depth of the PMT front glass affected byNa and B leaching. Table 13 shows results of this calculation. The analysis of the Na leaching indicates that we
are removing this element from the front PMT glass at a rate of 3-4 µm/PMT/year. This is consistent with theelectron microscope surface analysis of the “milky” PMTs that were taken out of the SOB in October 1999. Atthis rate of removal, and assuming that it will continue to be constant in the future, the PMTs with B53 glassshould last ~10 years from the point of view of implosion danger. The analysis of the B leaching, assuming thatboron only comes out of “milky” PMTs, indicates that we are removing this element from the front PMT glass at
a rate of ~800µm/PMT/year. This is much larger than the ETL measurement (see Fig. 2). At this rate of removal,the “frosty” PMTs would have already imploded. Clearly, the boron model’s assumption that only “frosty”PMTs leach may not be entirely correct. It would be more consistent with our observations to assume that boronleaches similarly to sodium, i.e., from all PMTs with B53 glass (see Table 13 for details).
Table 14 shows SLAC’s measurements of the water pH factor, resistivity, transmission, and temperatureduring water samplings shown in Tables 12 and 13. Clearly, these variables are not sensitive to the level ofimpurities seen in the water analysis.
It is useful to compare the DIRC water quality with other experiments, for example, such as SuperKamiokande (SK) or K2K, which have been successfully running already for the past 2-4 years with a verylarge number of PMTs in ultra-pure water. Table 15 shows the impurity level in water of SK and K2Kexperiments, compared with the DIRC water purity shown in Table 12. If one takes, for example, sodium intheir water, it is comparable with our level; however, in their case, there is no evidence suggesting that they areleaching it from PMTs (supply is higher than return). Perhaps, one could argue that the K2K experiment couldbe leaching calcium and aluminum, elements present in their PMTs. However, there is no visual evidence ofPMT window glass corrosion in the two experiments [15]. Table 16 shows their typical operating parameters,such as water flow, pH factor, resistivity, and water temperature. Judging from a similarity in water resistancebetween DIRC, SK, and K2K, it appears that the water quality is rather similar.
Worthy of note is that the SK and K2K experiments are running considerably cooler than we do, whichcertainly helps to keep low bacteria levels, and also helps to reduce chemical reactivity in water. A low bacterialevel is important from the point of view of corroded surface. Bacteria “likes” to reside in various cavities, andwe certainly would not want them to be “residing” in PMT window glass, which would reduce photontransmission. Therefore, it we were pleased to see low-bacteria count in the SOB water return during our lastmeasurement – see Table 12.
5 Balazs Analytical Laboratory, 252 Humboldt Court, Sunnyvale, CA 94089-1315.
26
Table 12: Trace metal water analysis of DIRC water performed by the Balazs Analytical Laboratory.Parameter Test type DL(det.lim) Units SUPPLY RETURN SUPPLY RETURN
11/30/99 11/30/99 8/21/00 8/21/00
Bacteria/100ml Bacteria-ASTM 1 cfu *,*,* >500,>500 *,*,11 *,16,66
Aluminum (Al) Trace Metals by ICP-MS 0.003 ppb (ug/l) * * 0.004 *
Antimony (Sb) Trace Metals by ICP-MS 0.002 ppb (ug/l) * * * *Arsenic (As) Trace Metals by ICP-MS 0.005 ppb (ug/l) * * * *
Barium (Ba) Trace Metals by ICP-MS 0.001 ppb (ug/l) * * 0.005 0.002
Beryllium (Be) Trace Metals by ICP-MS 0.003 ppb (ug/l) * * * *
Bismuth (Bi) Trace Metals by ICP-MS 0.001 ppb (ug/l) * * * *Boron (B) Trace Metals by ICP-MS 0.05 ppb (ug/l) 2.9 3.2 1.8 2.2
Cadmium (Cd) Trace Metals by ICP-MS 0.003 ppb (ug/l) * * * *
Calcium (ca) Trace Metals by ICP-MS 0.2 ppb (ug/l) * * * *
Cerium (Ce) Trace Metals by ICP-MS 0.001 ppb (ug/l) * * * *Cesium (Cs) Trace Metals by ICP-MS 0.001 ppb (ug/l) * * * *
Chromium (Cr) Trace Metals by ICP-MS 0.004 ppb (ug/l) * * * *
Cobalt (Co) Trace Metals by ICP-MS 0.001 ppb (ug/l) * * * *
Copper (Cu) Trace Metals by ICP-MS 0.003 ppb (ug/l) * * * *Dysprosium (Dy) Trace Metals by ICP-MS 0.001 ppb (ug/l) * * * *
Erbium (Er) Trace Metals by ICP-MS 0.001 ppb (ug/l) * * * *
Europium (Eu) Trace Metals by ICP-MS 0.001 ppb (ug/l) * * * *
Gadolinium (Gd) Trace Metals by ICP-MS 0.001 ppb (ug/l) * * * *Gallium (Ga) Trace Metals by ICP-MS 0.002 ppb (ug/l) * * * *
Germanium (Ge) Trace Metals by ICP-MS 0.003 ppb (ug/l) * * * *
Gold (Au) Trace Metals by ICP-MS 0.006 ppb (ug/l) * * * *
Hafnium (Hf) Trace Metals by ICP-MS 0.001 ppb (ug/l) * * * *Holmium (Ho) Trace Metals by ICP-MS 0.001 ppb (ug/l) * * * *
Indium (In) Trace Metals by ICP-MS 0.001 ppb (ug/l) * * * *
Iridium (Ir) Trace Metals by ICP-MS 0.002 ppb (ug/l) * * * *
Iron (Fe) Trace Metals by ICP-MS 0.02 ppb (ug/l) * * * *Lanthanum (La) Trace Metals by ICP-MS 0.001 ppb (ug/l) * * * *
Lead (Pb) Trace Metals by ICP-MS 0.003 ppb (ug/l) * * * *
Lithium (Li) Trace Metals by ICP-MS 0.002 ppb (ug/l) * * * *
Lutetium (Lu) Trace Metals by ICP-MS 0.001 ppb (ug/l) * * * *Magnesium (Mg) Trace Metals by ICP-MS 0.002 ppb (ug/l) * * * *
Manganese (Mn) Trace Metals by ICP-MS 0.002 ppb (ug/l) * * 0.002 *
Mercury (Hg) Trace Metals by ICP-MS 0.02 ppb (ug/l) * * * *
Molybdenum (Mo) Trace Metals by ICP-MS 0.004 ppb (ug/l) * * * *Neodymium (Nd) Trace Metals by ICP-MS 0.001 ppb (ug/l) * * * *
Nickel (Ni) Trace Metals by ICP-MS 0.004 ppb (ug/l) * * * *
Niobium (Nb) Trace Metals by ICP-MS 0.001 ppb (ug/l) * * * *
Osmium (Os) Trace Metals by ICP-MS 0.002 ppb (ug/l) * * * *Palladium (Pd) Trace Metals by ICP-MS 0.002 ppb (ug/l) * * * *
Platinum (Pt) Trace Metals by ICP-MS 0.009 ppb (ug/l) * * * *
Potassium (K) Trace Metals by ICP-MS 0.1 ppb (ug/l) * * * *
Praseodymium (Pr) Trace Metals by ICP-MS 0.001 ppb (ug/l) * * * *Rhenium (Re) Trace Metals by ICP-MS 0.003 ppb (ug/l) * * * *
Rhodium (Rh) Trace Metals by ICP-MS 0.001 ppb (ug/l) * * * *
Rubidium (Rb) Trace Metals by ICP-MS 0.001 ppb (ug/l) * * * *
Ruthenium (Ru) Trace Metals by ICP-MS 0.002 ppb (ug/l) * * * *Samarium (Sm) Trace Metals by ICP-MS 0.002 ppb (ug/l) * * * *
Scandium (Sc) Trace Metals by ICP-MS 0.01 ppb (ug/l) * * * *
Selenium (Se) Trace Metals by ICP-MS 0.02 ppb (ug/l) * * * *
Silicon (Si) Trace Metals by ICP-MS 0.5 ppb (ug/l) 2.8 3.1 * *Silver (Ag) Trace Metals by ICP-MS 0.001 ppb (ug/l) * * * *
Sodium (Na) Trace Metals by ICP-MS 0.007 ppb (ug/l) 0.014 0.29 0.14 0.44
Strontium (Sr) Trace Metals by ICP-MS 0.001 ppb (ug/l) * * * *
Tantalum (Ta) Trace Metals by ICP-MS 0.004 ppb (ug/l) * * * *Tellurium (Te) Trace Metals by ICP-MS 0.004 ppb (ug/l) * * * *
Terbium (Tb) Trace Metals by ICP-MS 0.001 ppb (ug/l) * * * *
Thallium (Th) Trace Metals by ICP-MS 0.006 ppb (ug/l) * * * *
Thorium (Th) Trace Metals by ICP-MS 0.003 ppb (ug/l) * * * *Thulium (Tm) Trace Metals by ICP-MS 0.001 ppb (ug/l) * * * *
Tin (Sn) Trace Metals by ICP-MS 0.005 ppb (ug/l) * * * *
Titanium (Ti) Trace Metals by ICP-MS 0.002 ppb (ug/l) * * * *
Tungsten (W) Trace Metals by ICP-MS 0.005 ppb (ug/l) * * * *Uranium (U) Trace Metals by ICP-MS 0.002 ppb (ug/l) * * * *
Vanadium (V) Trace Metals by ICP-MS 0.003 ppb (ug/l) * * * *
Ytterbium (Yb) Trace Metals by ICP-MS 0.001 ppb (ug/l) * * * *
Yttrium (Y) Trace Metals by ICP-MS 0.001 ppb (ug/l) * * * *Zinc (Zn) Trace Metals by ICP-MS 0.005 ppb (ug/l) * * * *
Zirconium (Zr) Trace Metals by ICP-MS 0.005 ppb (ug/l) * * * *

27
Table 13. Leaching rate of Na and B based on results shown in Table 12.
1) Assume that Na is leaching from windows of all PMTs:
Parameter Value on 12/13/1999 Unit
Na level (out-in) 0.276 ppb
SOB water volume 6 m^3
Water flow 18 m^3/day
PMT window dia. 2.5 cm
Single PMT area 4.9 cm^2
Total PMT area 5.39 m^2
Leaching rate of Na+ 0.004968 g/day
Leaching rate per pmt 4.51636E-07 g/(pmt*day)
Leaching rate of Na2O 6.08727E-07 g/(pmt*day)
Na2O content in glass 0.1338 g/cm^3
Leaching rate 4.54953E-06 cm^3/(pmt*day)
Depth removal 9.28476E-07 cm/(pmt*day)
Depth removal 3.388936496 um/(pmt*yr)
2a) Assume that Boron is leaching from windows of all PMTs:
Parameter Value on 12/13/1999 Unit
B level (out-in) 0.3 ppb
SOB water volume 6 m^3
Water flow 18 m^3/day
PMT window dia. 2.5 cm
Single PMT area 4.9 cm^2
Total PMT area 5.39 m^2
Leaching rate of B+ 0.0054 g/day
Leaching rate per pmt 4.90909E-07 g/(pmt*day)
Leaching rate of B2O3 1.66909E-06 g/(pmt*day)
B2O3 content in glass 0.3345 g/cm^3
Leaching rate 4.98981E-06 cm^3/(pmt*day)
Depth removal 1.01833E-06 cm/(pmt*day)
Depth removal 3.716898092 um/(pmt*yr)
2b) Assume that Boron is leaching from only "frosty" PMTs:
Parameter Value on 12/13/1999 Unit
B level (out-in) 0.3 ppb
SOB water volume 6 m^3
Water flow 18 m^3/day
PMT window dia. 2.5 cm
Single PMT area 4.9 cm^2
Total PMT area 0.0245 m^2
Leaching rate of B+ 0.0054 g/day
Leaching rate per pmt 0.000108 g/(pmt*day)
Leaching rate of B2O3 0.0003672 g/(pmt*day)
B2O3 content in glass 0.3345 g/cm^3
Leaching rate 0.001097758 cm^3/(pmt*day)
Depth removal 0.000224032 cm/(pmt*day)
Depth removal 817.7175803 um/(pmt*yr)

28
Table 14. Various test results performed at SLAC, which correspond to the timing of the water samples measuredby Balazs Analytical Laboratory (this is addendum to Tables 12 & 13).IR2 WATER QUALITY 1-st TEST RESULTS
SLAC measurements of water transmission, pH factor, water resistivity and temperature ---->
Parameter Unit Results Results
Date 12/13/99 8/21/00
pH SUPPLY PH Ffactor 6.7 6.5pH RETURN PH factor 6.3 6.6R-water SUPPLY Mohm.cm 13.4 18.5
R-water RETURN Mohm.cm 8.3 9.7T-water temp. deg C 24.3 27.1
Water flow One volume change every 8 hours 24 hoursTrans. (442nm) %/meter 99.14 +- 0.1 98.09 +- 0.02Trans. (325nm) %/meter 98.56 +- 0.7 98.05 +- 1.7
Trans. (266nm) %/meter 91.23 +- 1.3 91.86 +- 0.8Comment Old filters New filtersUV lamp 185 nm 260 nm
Table 15. Water composition in Super Kamiokande (SK) and K2K experiments, which also use pure water [15].K2K and Super Kamiokande, water sampled by Dr. Mine on May 21, 1999
Parameter Reference K2K supply K2K return SK supply SK return SK 20 m SK 37 m Units
3/21/99 3/21/99 3/21/99 3/21/99 3/21/99 3/21/99 3/21/99
Aluminum (Al) < 0.1 0.2 1.7 < 0.1 < 0.1 < 0.1 < 0.1 ppb (ug/l)Calcium (ca) 0.23 0.073 2.4 0.11 0.82 0.29 0.29 ppb (ug/l)Copper (Cu) < 0.01 < 0.01 < 0.01 < 0.01 < 0.01 < 0.01 < 0.01 ppb (ug/l)Iron (Fe) < 0.01 0.04 0.26 < 0.01 0.03 0.03 < 0.01 ppb (ug/l)Magnesium (Mg) 0.05 0.005 0.24 < 0.005 0.016 0.03 < 0.005 ppb (ug/l)Sodium (Na) 0.054 0.28 0.13 0.34 0.29 0.3 0.36 ppb (ug/l)
Note: List only elements they have measured.
Table 16. Water parameters for K2K and Super Kamiokande (SK) experiments [15].
Parameter K2K S. K.
Date 3/21/99 3/21/99pH SUPPLY 6 6pH RETURN 6 6R-water SUPPLY 16 18R-water RETURN 9 10T-water temp. 12 12Water flow 2-3 days 2 month
5.7. Long-Term Test of PMT Front-Glass Coupons in the SOB Water ReturnWe have decided to place twelve PMT front-glass window coupons into the SOB vessel water return. The
coupons were supplied by ETL as B53 glass, which is known to contain Zn. Neither Saclay nor SLAC obtainedthe X- glass coupons, and thus, we could not verify its corrosion rate independently of ETL. The coupons wereplaced into KYNAR holders (a special plastic which is resistant to water corrosion), as shown in Fig. 30. Theholders were inserted in a LEXAN container with N2 atmosphere above water. The container was placed in athermally insulated housing, and the temperature was controlled at 30oC. This is close to the SOB watertemperature, which is 26-28oC. Therefore, no extrapolation is necessary. We report results obtained after ~8months of the coupons being immersed in water. We have confirmed this by running an ESCA analysis – seeFigure 32. One major result of the back scattered X-ray analysis, shown in Fig. 31, is that Na is almostcompletely depleted from the first few microns of the glass. This is also verified in the ESCA analysis shown in

29
Fig. 32, which is sensitive up to the first ~50Å. The glass coupons appeared clear, as judged by visualinspection, when removed from the water. However, we have observed crazing when the coupons were placedin vacuum during surface analysis, as shown in Fig. 33. The crazing affected coupons independently, whetherthey were pumped on or not during the test, and appeared obvious to the naked eye. One could qualify it as“milky” rather than “frosty” surface from the point of view of our earlier discussions. The flakes appear to bevery shallow and few microns thick. In other words, a PMT would operate normally, and with water coupling,we would not see any deterioration of efficiency. This result would be consistent with the ETL manufacturer’sfinding that it is Zn, which prevents “frosting” development in this particular glass material. We still observe Nadepletion and the front window turns “milky;” however, these corrosion effects are much smaller, and DIRCwould operate well over the next ten years.
(a) (b)
Figure 30. (a) A five-coupon setup placed in the SOB water return. (b) A two-coupon setup, which was pumped on.
(a)
(b)
Figure 31. (a) X-ray analysis of the PMT front glass coupon A1, before the water test was started. The Na element isclearly detected. (b) The same coupon after eight months in the SOB water return. From the relative ratioof the Na/Si peak areas, it is clear that the Na line is depleted.
Na
Na
Si
Si

30
(a)
(b)
Figure 32. (a) ESCA analysis of the PMT front glass coupon A1, prior to the water test. Both elements, Zn and Na,are clearly detected. This proves that this particular glass has traces of Zn present. (b) The same couponafter eight months in the SOB water return. The Na line is completely missing. The Zn line is still present.
(a) (b)
Figure 33. (a) Electron microscope picture of the PMT front glass coupon near the edges of C3 (left) and C5(right) coupons. C5 coupon was subject to vacuum, C3 was not. They seem to be affected similarly.This type of surface gives a “milky” appearance as discussed elsewhere. (b) A similar picture of themiddle C3 coupon, although the corrosion level is generally lower. The “milky” appearance is spottyin the middle of the coupon.
Coupon A1 – initial condition
Coupon A1 – after eight monthsin SOB return water

31
5.8. Conclusion of Tests at SLACThe SLAC analysis, by using the electronic microscope has determined that sodium depletion affects only
the front window glass for both “milky” and “frosty” PMTs. The PMT side glass is not affected.Similarly, it was determined that using ESCA analysis, that the “frosty” PMTs, do not contain Zn, thus
confirming the ETL result indicating that the PMT material made out of X-glass, was added into production inerror.
A long-term test of the B53 glass coupons, placed in SOB return water at 30oC, which is close to ouroperating temperature of 26-28oC in IR-2 (and therefore no scaling is required), shows corrosion levels to beconsistent with that of the “milky” PMTs. The sodium is also depleted from the first few microns of surface.Such corrosion, although clearly visible if the glass is not coupled to water, will not represent a disaster for theDIRC from the point of view of possible PMT implosion.
Any time a “milky” PMT was subject to vacuum with the electron microscope, it developed additionalcrazing. This is a warning that the front PMT glass is very fragile, because of its depleted sodium. Therefore,the PMTs in the SOB must not be subjected to mechanical forces, which includes water draining or dooropenings.
A trace analysis of the water shows that the amount of sodium present in water is consistent with the
sodium leaching from the front PMT glass, and represents a rate of removal of about 3-4 µm/PMT/year. This isconsistent with the visual corrosion observed with the electron microscope on the “milky” PMTs.
The water analysis in the DIRC indicates a steady reduction of bacteria levels, which is a necessarycondition to guarantee good transparency given the degree of glass corrosion.
The water analysis also indicates that the DIRC does not have excessively pure water compared to otherexperiments such as K2K or Super Kamiokande.
6. DiscussionThe purpose of this section is to point out that the “Zn hypothesis” may not be the “all explaining” recipe,
and the answer may lie in the detailed understanding of particular “glass” chemistry. For example, Table 17shows that in the Pyrex type of glass, as used in Super Kamiokande, there is no Zn at all, and there is nocorrosion of the PMT glass window [15]. Apparently, Zn is necessary in some Borosilicate glass formulations.Both ETL and us certainly did observe a very large corrosion level of the X-glass window, which was added tothe DIRC PMT production in error (see Sections 1 and 2). If the correct B53 glass is used for the windows, thecorrosion is much smaller (only a sodium depletion causing “milky” surfaces). However, we did not see any Naleaching or corrosion on the sides of the glass body of the DIRC PMTs [16], which is also a Borosilicate glass,and has no Zn nominally – see Table 17. Of course, the side glass comes as a tube and goes through acompletely different process. Another example is the experience of Philips Photonics with the so called ZK(N)7glass, which contained a very large amount of Zn (see Table 17), with extremely large rates of corrosionobserved in humid air [17]. Therefore, it appears that glass corrosion is dependent on a very delicate balance ofvarious glass ingredients, and Zn may play a significant protection role only if present at the correct quantity. Inthe case of the DIRC PMTs, the front window glass requires a few percent of Zn in order to limit the corrosionrate, based on the empirical observations which have been presented in this paper.
Based on our experience, we would always recommend that one performs as exhaustive a corrosion test aspossible for particular choices of glass formulation.
Table 17. Comparison of PMT glass composition in various experiments or tests by the PMT manufacturers.Company Experiment Glass name PMT portion SiO2 Al2O3 B2O3 Li2O Na2O K2O BaO CaO As2O3 Sb2O3 ZnO
Hamamatsu Super Kamiokande Pyrex face 80 2.1 14.1 0.1 3.7 0.12 - - - - -
Hamamatsu Internal R&D test - - - - 5.5 - - - - - -
Hamamatsu Internal R&D test 67.5 3 19 0 0.4 9 - - - - -Hamamatsu Internal R&D test 65 0 14 0 0.1 0.06 - - - - -
Philips Photonics A special PMT ZK(N)7 face 60.8 5.6 14 - 7.4 0.003 - - 0.1 0 11.2
Electron Tube Ltd. DIRC detector Borosilicate (B53) face 65 6 15 - 6 - 3 1 - - 4
Electron Tube Ltd. DIRC detector Borosilicate side body 71 7 11 - 6 1 2 1 - - -
Electron Tube Ltd. DIRC detector Borosilicate pin area 73 5 13 - 8 0.1 - - - - 1
Electron Tube Ltd. Internal PMT X glass window 69.6 4.2 17.2 - 8.7 - 0 0 - - 0

32
7. Overall ConclusionWe believe that the DIRC detector has about 50 “frosty” PMTs out of 11,000, where glass will be corroded
to such an extent that over a 10-year period there may be a danger of implosion or vacuum loss. The ETL Co.explains that during the production a wrong type of glass was included, namely the so called X-glass, instead ofB53 glass. The X-glass does not contain Zn, which according to ETL makes it weaker in terms of rapid leachingof sodium and boron resulting in “frosty” PMTs. In this paper we have provided independent experimentalevidence supporting this hypothesis. The rest of the DIRC PMTs used B53 glass, which contains Zn, and this in
turn limits the sodium and boron depletion to acceptable levels. There is still glass corrosion up to 30-50 µm ofdepth after ~10 years of operation, which is believed to be acceptable from the point of view of the danger ofimplosion.
DIRC’s data seems to indicate a non-negligible loss of detection efficiency at a level of 2-3% per year, bothin Bahbha and di-muon events. Based on the Saclay test results, this loss could be explained by either windowtransmission or PMT quantum efficiency loss; however, the PMT gain loss cannot be excluded. A simpleestimate of the total PMT accumulated anode charge would favor the PMT gain loss explanation as a dominantfactor. Of course, the small PMT gain change can be easily corrected by a corresponding change in voltage.More studies are needed to understand this in more detail.
AcknowledgmentWe would like to thanks R. Aleksan, V. Lepeltier, and G. Vasseur for their very valuable help in efforts to
understand the PMT glass corrosion problem. We also thank B. Kirby and his group at SLAC, for running theelectron microscope and ESCA analysis spectrometer and for providing many useful suggestions for the SLAC-based analysis. We thank A. Hoecker for his help in sorting out tube glass corrosion appearances during theOctober 1999 shutdown, and B. Ratcliff for suggesting using the water analysis results to check the consistencyof the PMT corrosion rates. We also thank R. Reif for his help to set up the long-term glass coupon test atSLAC.
References:1. A. Hoecker, http://www.slac.stanford.edu:/~hoecker/IR2/frostyPMT.html, October 1999.2. J. Va’vra, BaBar Hypernews note #595, October 5, 1999.3. Electron Tubes Limited, Water immersion tests, July 2000.4. P. Bourgeois et al., BaBar Hypernews note #993, September 28, 2000.5. J. Va’vra, BaBar Hypernews note #764, January 29, 2000.6. The Saclay group, PMT specifications and EMI 9125, BaBar DIRC note 32, March 1996.7. Ph.Bourgeois, M.Karolak and G.Vasseur, Performance of the photomultiplier tubes used in the DIRC of
BaBar: effect of a magnetic field and of helium, Nucl.Inst.Meth. A442 (2000) 105.8. P. Bourgeois et al., Results of the PMT sector test at Saclay, BaBar DIRC note 116, January 1999.9. P. Bourgeois et al., The light generator crate of the DIRC calibration system, BaBar DIRC note 118,
March 1999.10. P. Bourgeois et al., Results of the tests of the optical fibers and the diffuser for the DIRC calibration system,
BaBar DIRC note 119, March 1999.11. T. Wright, ETL, private communication.12. R. McAlpine, ETL technical Director, private communication.13. A. Hoecker, http://www.slac.stanford.edu/~hoecker/plots/nphot_bhabha.gif .14. D. Aston, BaBar Hypernews note #986, September 22, 2000.15. S. Mine, K2K experiment, KEK, Japan, private communication.16. J. Va’vra, BaBar Hypernews note #700, December 18, 1999.17. Esso Flyckt, Photonis, private communication.