Embed Size (px)
Citation preview

i
Driving Factors of Rural-Urban Migration in China
Grace Melo1 and Glenn C.W. Ames2
1Corresponding author and PhD student, Department of Agricultural & Applied Economics, University of
Georgia, Athens, GA ([email protected])
2Professor Emeritus, Department of Agricultural & Applied Economics, University of Georgia, Athens, GA
Selected Paper prepared for presentation at the 2016 Agricultural & Applied Economics Association
Annual Meeting, Boston, Massachusetts, July 31-August 2
Copyright 2016 by Melo and Ames. All rights reserved. Readers may make verbatim copies of this document for
non-commercial purposes by any means, provided that this copyright notice appears on all such copies.

i
Abstract
This study employs panel data to analyze the economic factors that drive rural-urban migration and
agricultural labor supply within China. The results indicate that higher wages in urban areas, especially
in the construction sector, was associated with rural-urban migration and a decline in the agricultural
labor supply. The rural-urban wage differential in construction reflects the housing boom in cities set off
by rapid urbanization and government policies. Most importantly, our findings raise concerns about the
negative impact of rural-urban migration on agriculture in China. Policies that impact labor supply,
especially in times of rapid urban development and low diffusion of agricultural technology, are critical
to Chinese economic development and stability.
Keywords: Internal migration, agricultural labor
JEL Classification: O15, R23, J43
1
1. Introduction
Population growth in Chinese metropolitan areas is partly attributed to massive migration from rural to
urban areas. The number of urban residents increased by 14 million people, while the number of rural
residents dropped by 7 million during the 2008-2014 period (National Bureau of Statistics of China
2014). In 2011, the Chinese urban population exceeded the rural population for the first time (World
Bank 2012), perhaps as a result of rapid economic development that has encouraged rural residents to
seek better employment opportunities in urban areas, particularly in coastal regions, where migration
within provinces is more common (Zhang, and Shunfeng 2003). Historically, the labor mobilization
allows temporary reallocation of workers, and is one of the main factors that have driven China to be
more competitive. However, the massive inflow of rural workers to metropolitan areas raises a concern
about the future of agricultural production and urbanization.
Different driving factors influence internal migration across China. Previous studies shown that
employment opportunities and the rural-urban income gap are economic factors considered by Chinese
workers when they migrate from the countryside to cities within or between provinces (Zhang and
Shunfeng 2003; Zhu 2010). While previous work has analyzed the role of economic factors on rural-
urban migration in general, the first objective of this study is to evaluate how economic factors related to
other industries such as construction and manufacturing, two important sectors in the demand of migrant
labor, affect rural-urban migration within provinces. In 2010, rural-urban migration within provinces
account 37% of total migration, whereas in 1990 migrant workers who moved within their home
provinces represented the majority (72%) of inter-county migrant workers (Chan 2013) . While there is
a higher rate of interprovincial migration, the percentage increase of migration within provincial
boundaries was larger than the percentage increase of interprovincial migration (6% vs. 3%) over the

2
period 2010-2011 (National Bureau of Statistics of China 2014). In addition, this growing trend of within-
provinces migration might continue because geographic distance discourages migration between
provinces. Chinese cities are predicted to face an influx of another 243 million migrants by 2025, taking
the urban population up to nearly 1 billion people. Migrants will represent nearly 40% of the urban
population in the next 10 years (Woetzel et al. 2009).
Due to China's status as a developing country and its severe shortage of arable land, farming in China
has always been very labor-intensive. Since 2011, the workforce share in agriculture steadily decreased
and the majority of China’s labor force (36%) has been employed in the service sector (Statista 2016).
The modernization of agriculture can be seen as a way to boost productivity and reduce the impact of a
labor shortage in the agricultural sector. And so, China’s government has started to increase government
spending and encouraging investment in agriculture (Shangguan 2013), including increasing the supply
of improved crop seeds and pesticides (Revill, and Spegele 2016). However, at the farm level, investment
on labor-saving agricultural technology remains small (Wang et al. 2014), rising a concern about China’s
food security on the presence of labor migration out of agriculture. Understanding the economic drivers
of agricultural labor supply is critical for decisions about internal migration policy that affects both
urbanization and food production. Therefore, the second objective of this study is to assess how current
economic factors affect the agricultural workforce.
Using 2008-2014 national data obtained from National Bureau Statistics of China, we estimate panel
models 1) to evaluate the economic factors that stimulate rural-urban migration within provinces, and 2)
to determine the economic factors that drive labor supply out of the agricultural sector at the provincial
level. Overall, we explore how these economic conditions influence migration decisions and farm labor
supply during a period of relative economic slowdown in China.

3
We found that the construction sector in urban areas played a key role in explaining changes in the
rural-urban population and in the number of people employed in agriculture. Our results show that an
increase of real wages in this sector decreased the ratio of rural to urban population and the number of
people working in the primary sector.
This paper is organized as follows. In the next section, we provide a theoretical framework of
rural-urban migration. Sections 3 and 4 discuss the economic factors related to rural-urban migration
and agricultural workforce, and provide econometric models of rural-urban population ratio and
agricultural labor. Section 5 describes the data used in the econometric analysis. Section 6 presents a
discussion of the estimation results. Finally, we end with conclusions and policy implications in section
2. Theoretical Framework
2.1. Rural-Urban Migration
Economic and non-economic research agree that economic factors are important predictors of rural-
urban migration, and particularly that high urban wages is the main pulling factor. Based on the
theoretical model of Fields (1975), the amount of rural-urban migration can be denoted as follows
(1) 𝐿�̇� = 𝜑(𝐸(𝑊𝑈) − 𝐸(𝑊𝑅))
where 𝜑(. ) is the differential of wages between urban and rural areas 𝐸(𝑊𝑈) and 𝐸(𝑊𝑅), respectively.
Therefore, the equilibrium condition is
(2) 𝐸(𝑊𝑈) = 𝐸(𝑊𝑅).

4
We can also say that the expected income 𝐸(𝑊𝑗)𝐿𝑗 in area j =U, R is equal to the wage 𝑊𝑗 times the
number of employment opportunities 𝐸𝑗 and can be expressed as
(3) 𝐸(𝑊𝑗)𝐿𝑗 = 𝑊𝑗𝐸𝑗
Using equations 2 and 3 we can define the ratio of rural to urban population 𝐿𝑅
𝐿𝑈 as a function of
wages 𝑊𝑗 and employment 𝐸𝑗 in area 𝑗 =U, R,.
(4) 𝐿𝑅
𝐿𝑈=
𝑊𝑅
𝑊𝑈
𝐸𝑅
𝐸𝑈
Since total employment �̅� can defined as 𝐸𝑅 + 𝐸𝑈, we can write equation (4) as follows:
(5) 𝐿𝑅
𝐿𝑈=
𝑊𝑅
𝑊𝑈 �̅�−𝐸𝑈
𝐸𝑈=
𝑊𝑅
𝑊𝑈 (
�̅�
𝐸𝑈− 1)
We can infer that wages 𝑊𝑈 and employment opportunities 𝐸𝑈 in cities have a negative effect on
the ratio of rural to urban population 𝐿𝑅
𝐿𝑈 from equation 5.
2.2. Agricultural Labor Supply
Using equation (4), we can say that the relationship between working in agriculture 𝐿𝑎 versus working
in non-agricultural jobs in urban areas 𝐿𝑈 can be represented as
(6) 𝐿𝑎
𝐿𝑈=
𝑊𝑎
𝑊𝑈
𝐸𝑎
𝐸𝑈
Therefore agricultural labor supply 𝐿𝑎 can be expressed as follows:
(7) 𝐿𝑎 = 𝑊𝑎
𝑊𝑈 𝐸𝑎 𝐿𝑈
𝐸𝑈=
𝑊𝑎
𝑊𝑈 𝐸𝑎(𝑈 − 1)

5
where U is the unemployment rate in urban areas. Because an important proportion of the workforce in
rural areas is employed in agriculture we can define total employment �̅� as 𝐸𝑎 + 𝐸𝑈, and substitute
𝐸𝑎 by �̅� − 𝐸𝑈 in equation (7), therefore obtaining:
(8) 𝐿𝑎 =𝑊𝑎
𝑊𝑈 (�̅� − 𝐸𝑈)(𝑈 − 1)
In equation (8) we can deduce that work opportunities and high wages in urban jobs have a
negative effect on farm labor force 𝐿𝑎. While, unemployment rate in cities 𝑈 has positive effect on
agricultural labor 𝐿𝑎.
3. Background of Rural-Urban Migration in China
In 2004, three out of four migrant workers were employed in manufacturing, construction, social services,
hotels and restaurants, and commerce (Shi 2008). According to Wang (2008) manufacturing and
construction employed over 67% of all migrant workers in 2005 (35% and 32%, respectively).
Although, in 2012 construction attracted just 10% of new-generation migrants compared to 28% of
the previous generation of migrant workers, this economic sector remains as an important magnet for
many rural-urban migrants. In fact, the most popular training schools migrants attend to improve their
professional skills are for construction along with computer, technology, sewing, and beauticians (Hu
2012). Moreover, the current growth of migrants in the construction sector was steady even in face of the
economic crisis in 2009, mainly due to government investments as a part of stimulus package to mitigate
the effect of recession (Csanádi, Nie, and Li 2015).
For many years, cheap housing has been available for migrant workers in “urban villages”. However,
these crowded neighborhoods are being cleared across China as part of an urbanization campaign
announced by the government more than a decade ago. Policies that provide government-built housing

6
while removing these "villages within cities" result in a net loss of housing units, affecting the private
rental market that for decades has enabled China's massive urban migration. Moreover, the removal of
this urban village seems to result in at least 3% housing price appreciation (Zhang et al. 2016) . To assess
the influence of these economic factors on rural-urban migration in China, we consider the following
econometric model as our base line model to explain rural-urban migration:
(9) log(𝑟𝑢𝑟𝑎𝑙/𝑢𝑟𝑏𝑎𝑛𝑖𝑡) = 𝜇 + log(𝑢𝑟𝑏𝑎𝑛 𝑤𝑎𝑔𝑒𝑠𝑖𝑡)′ 𝛾 + log(𝑢𝑟𝑏𝑎𝑛 𝑗𝑜𝑏𝑠𝑖𝑡)′𝛼 + 𝑧𝑖𝑡′ 𝛽 + 𝑎𝑡 + 𝑎𝑖 + 𝑣𝑖𝑡
where 𝑟𝑢𝑟𝑎𝑙/𝑢𝑟𝑏𝑎𝑛𝑖𝑡 is the ratio of rural to urban population in time t and province i. The variables of
interest in this model are real wages of employed persons in urban areas in construction and
manufacturing sectors represented by the vector 𝑢𝑟𝑏𝑎𝑛 𝑤𝑎𝑔𝑒𝑠𝑖𝑡 and the number of workers employed
in construction and manufacturing represented by the vector 𝑢𝑟𝑏𝑎𝑛 𝑗𝑜𝑏𝑠𝑖𝑡1 .The vector of control
variables 𝑧𝑖𝑡 includes unemployment rate in urban areas, natural growth rate, and Consumer Price Index
(CPI) for rent as an indicator of rent inflation. The element 𝑎𝑡 represents time fixed effects. The
unexplained component of the regression is expressed in terms of 𝑎𝑖 and 𝑣𝑖𝑡 which correspond to the
unobserved time-invariant province effect and error term, respectively.
Based on the baseline model in equation (9) we estimate a dynamic panel data model using Arellano-
Bover/Blundell-Bond GMM estimator, which is the preferred specification in this study. The model and
results are detailed in the results section.

7
4. Agricultural Labor Supply
The growing urban population raises concern about the future of agricultural production and urbanization,
because workers are leaving farms seeking better opportunities in cities and wealthier coastal regions
(Knight, Deng, and Li 2011). However, there are arguments that the shortage of agricultural labor, if it
happens, will not be permanent but circular because of the strict internal migration law, hukou system,
established since the early 1960s that prevents rural workers from staying in the cities because the
extension of urban social and economic benefits to migrants remains absent, even though physical
controls on migration into cities have gradually been reduced (Chan, and Zhang 1999). Evidence,
however, shows that the impact of rural-urban migration on the labor supply exists and differs across
regions. During the 1990s, in the eastern developed regions of China, the percentage of agricultural
workers in the workforce declined, while the workforce in the western undeveloped regions remained at
a high level (Carter, and Estrin 2001). However, after 2005 the decline of agricultural workforce was also
evident in western areas while in eastern developed regions this number has remained almost unchanged
(National Bureau of Statistics of China 2014).
As urbanization draws more labor and land from agriculture and accelerates changes in food
consumption, the government’s ability to guarantee permanent farm labor is important to China’s food
sovereignty in the future. Today, China is considered the leading importer of soybeans and cotton and
has recently emerged as an importer of other major commodities, including corn, pork, wheat, and rice.
This trend reflects China’s dependence on food imports, a scenario that could become critical if the labor
supply in food production shrink because it could bring further demand for imports (Wang et al. 2013).
Research on Chinese internal migration has mainly focused on the socio-economic impact of
migration in source and destination areas at household and aggregate level (Rozelle, Taylor, and

8
DeBrauw 1999; Taylor, Rozelle, and De Brauw 2003). Little work has been documented about the
driving economic factors of labor supply in the agricultural sector, especially during a period of economic
slowdown in China. Hu (2012) examined both economic and non-economic reasons for rural-urban
migration using survey data. According to his study, among the factors that drive labor out of farming
are high non-agricultural wages, lower wages for farm labor, and the increase in educational levels of the
second generation of farmers. Similarly, Zhu (2010) found that the income gaps influence migration
decisions in China. Similar results have been found when analyzing migration flows across countries.
Hispanic migrants were mainly motivated by high wages and job opportunities when deciding to migrate
and staying in the US (Melo, Colson, and Ramirez 2014). Rural workers that move to urban areas
represent about 75% of total migrants, and about 60% come from: Sichuan, Anhui, Hunan, Jiangxi,
Henan, and Hubei provinces (Migration News 2011). Three of these provinces, Henan, Sichuan, and
Anhui, were among the top ten that generated most of the agricultural production in 2009 (USDA 2015).
Rural migrant workers received less access to public services and social benefits in urban areas
compared to local workers. Yet, rural workers prefer to migrate and work under these “unfair” conditions
in cities rather than remain in their towns and villages because better economic opportunities can be
found in urban areas. The work compensation gap between urban and rural areas has increased.
Therefore, although job opportunities in manufacturing and construction exist in towns and villages,
higher wages in urban areas in these industries are more appealing to workers (Banister, and Cook 2011).
The hukou or household registration system has had an important impact on rural-urban migration
in China. The hukou system, established in the 1950s, kept people tied to where they lived by making
government services contingent on their occupation and place of residence. While agricultural laborers
(rural hukou holders) received land, nonagricultural workers (urban hukou holders) received food rations

9
as well as public services such as employment opportunities, subsidized housing, free education, medical
care, and old-age pensions (Cheng, and Selden 1994).
Under the current weakening of the hukou system that has shaped migration policies to “leave the
land but not the villages”, workers have moved out of farming to rural industrial production (Au, and
Henderson 2006). Because Chinese migration system still prevents migrant workers from residing
permanently or receiving residency rights in the cities where they temporally work, the separation of
family members is common. This forced separation exposes children to different hazards and may make
marriages unstable (Zhao 1999). In addition, migrant workers struggle to acquired proper housing
because of high rents and strict government policies in metropolitan areas (Davis 2013; Zhao 1999).
Despite this situation, migrant workers account for 40 percent of the urban labor force in China
(Scheineson 2009), while the lack of government protection and access to social services make migrant
workers the most vulnerable group in the society.
Rozelle et al. (1999) found no evidence of a negative impact on farm output after migration because
remittances sent home by migrants stimulate crop production by relaxing market constraints. This result
supports the New Economics of Labor Migration proposition developed in 1980s which states that
migration lessens production and investment constraints in imperfect markets (Taylor 1999).
Contrary to Rozelle, Taylor, and DeBrauw (1999), a later study suggested that labor-migrant
households often under-cultivate or abandon their farmland as a consequence of household labor
shortages (Qin 2010). The discrepancy of previous findings about the effect of rural-urban migration on
the agricultural sector indicates that a potential danger for the future of agricultural production may exist,
but more conclusive evidence is needed. Meanwhile, understanding the factors that drives farm workers

10
in and out of the agricultural sector is necessary for policy making. To analyze the impact of economic
variables on agricultural labor supply, the baseline regression model is as follows:
(10) log(𝑎𝑔𝑟𝑖𝑐𝑢𝑙𝑡𝑢𝑟𝑎𝑙 𝑙𝑎𝑏𝑜𝑟𝑖𝑡) = 𝜇 + log(𝑢𝑟𝑏𝑎𝑛 𝑤𝑎𝑔𝑒𝑠𝑖𝑡)′ 𝛾 + log(𝑢𝑟𝑏𝑎𝑛 𝑗𝑜𝑏𝑠𝑖𝑡−1)′𝛼 + 𝑧𝑖𝑡′ 𝛽 +
𝑎𝑡 + 𝑎𝑖 + 𝑣𝑖𝑡
where 𝑎𝑔𝑟𝑖𝑐𝑢𝑙𝑡𝑢𝑟𝑎𝑙 𝑙𝑎𝑏𝑜𝑟𝑖𝑡 is the number of persons employed in the primary sector including
agriculture, forestry, animal husbandry, and fishery in province i and year t. The vector of variables
𝑢𝑟𝑏𝑎𝑛 𝑤𝑎𝑔𝑒𝑠𝑖𝑡 is defined as before as real wages in construction and manufacturing in urban areas. The
vector 𝑢𝑟𝑏𝑎𝑛 𝑗𝑜𝑏𝑠𝑖𝑡−1 correspond to the lag of number of people employed in construction and
manufacturing. The vector 𝑧𝑖𝑡 contain the control variables defined in the model of rural-urban migration
in equation (10) but it also includes real wages in agriculture. The element 𝑎𝑡 represents time fixed
effects. The unobserved time-invariant cross-unit effect is 𝑎𝑖 and 𝑣𝑖𝑡 is the error term.
Similar to the rural-urban population ratio model, we estimate a dynamic panel data model for
agricultural labor based on the baseline specification in equation (10). The model and results obtained
from using Arellano-Bover/Blundell-Bond GMM estimator are detailed in the results section.
5. Data
Socioeconomic and agricultural labor supply data from the National Bureau of Statistics of China (2014)
during the period 2008-2014 was used to identify the economic factors that drives rural-urban migration
and labor supply in the agricultural sector within provinces in China. Specifically, we use panel data
analysis at the provincial-level 1) to analyze the economic factors that drive changes in rural-urban
population, and 2) to determinate the economic factors associated with number of people employed in
the primary sector in China.

11
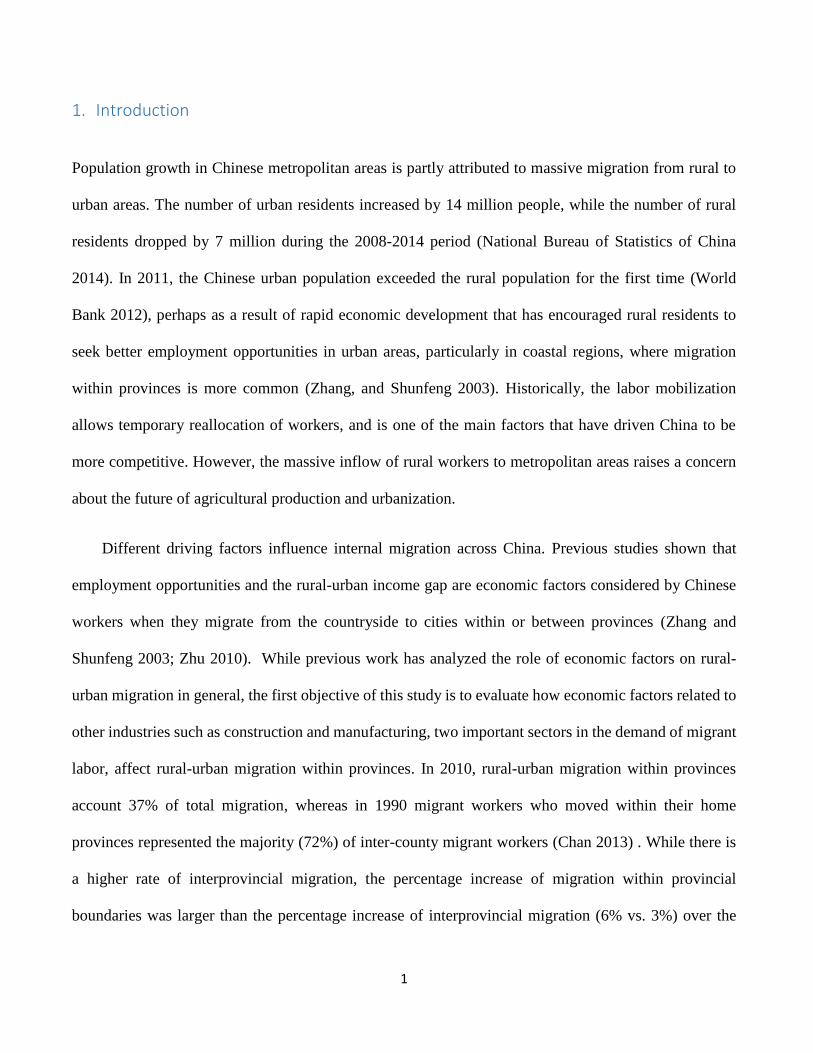
Figure 1 indicates that for most of the Chinese regions, the ratio of rural to urban population has
decreased between 2005 and 2014. The decline is steeper for those provinces located in the central region
(Anhui and Henan) and western region (Sichuan, Yunnan, Guizhou, Gansu, and Tibet). Anhui, Sichuan,
and Henan were among the provinces where most migrant workers come from (Migration News 2011).
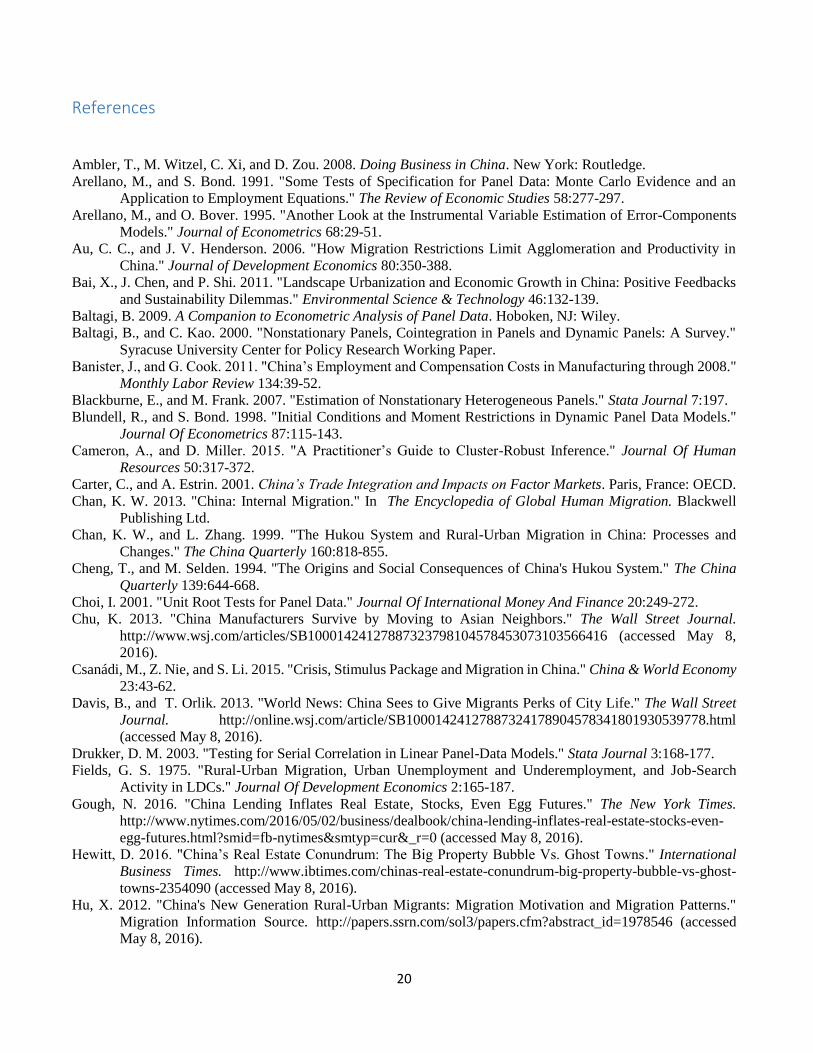
Similarly, figure 2 shows a reduction of Chinese workers employed in agriculture, forestry, animal
husbandry and fishery (Primary Sector) in central and western regions for the same time period. The
decline is more apparent in Anhui, Henan, and Sichuan, which are important provinces for agricultural
production (USDA 2015). Guangxi is the only province where an increase of employment in the primary
sector can be observed. This trend is not surprising given that foreign direct investment and efforts of
local governments have supported agricultural development in this province in the last years (Ambler et
al. 2008; Ye, Su, and Wei 2010).
Table 1 indicates that the ratio rural to urban population has decreased 0.34 points (from 1.3 to 0.9)
during the period of 2008-2014, this change indicates that the urban population in China has increased at
a faster rate than rural population for the study period. The changes in population ratio could be explained
by the decrease in the unemployment rate (about 0.5 percentage points decline) and the increase of real
wages in urban areas for the construction and manufacturing sectors.
In 2014 real wages in urban areas were about double what they were in 2008; interestingly, real
wages in construction and manufacturing in urban areas increased by 119 percent between 2008 and
2014. Consequently, manufacturing companies started to move their production to other countries such
as Vietnam where wages remain low (Chu 2013). While real wages in agriculture in urban areas also
increased by 109 percent, the percentage increase of real wages in agriculture was 10 percentage points
lower than compared to the percentage increase of real wages in construction and manufacturing.
Agricultural wages in rural areas2 are probably lower than agricultural wages in cities, increasing the

12
wage gap between rural and urban areas. This wage differential could be an important pulling factor that
make agricultural workers to search non-farm jobs in cities.
Similar to the decline of rural-urban population ratio, there was a 3% decline of workers in the
primary sector in China between 2008 to 2012. Part of this decline might be associated with the increase
of employment experienced in the other industries, including manufacturing and construction by
approximately 52% and 172%, respectively. The large increase in construction jobs resulted from an
expansion of investment in urban construction projects during this period in China (Bai, Chen, and Shi
2011). It can also be as a result of an economic incentive implemented by the government similar to the
huge stimulus package that Beijing implemented after the 2008 global financial crisis, which set off a
building boom (Gough 2016). If China’s property market remains saddled with a surplus of apartments
in many cities, a crash in the housing market is possible according to some economists (Hewitt 2016).
China’s manufacturing sector contracted at the end of 2013 because of a weakening in exports and
government interest to promote domestic consumption even at the expense of investment and exports.
This softening growth momentum for manufacturing sectors has weighed on employment growth
(Reuters 2014). Therefore, it is not surprising to find that the increase of manufacturing jobs was modest
and statistically insignificant compared to the increase in construction jobs during the 2008-2014 period.
This modest increase in manufacturing probably reflects the fact that about 20 million migrant workers
could not find work or had been dismissed during 2009 as a result of the slowdown in China’s economy
(LaFraniere 2009).
6. Results and Discussion
The results of two-way fixed effects FE3 estimation using provincial-level data for the two models: rural-
urban population ration and agricultural labor are presented in Tables 2 and 3, respectively. The small4

13
number of clusters (i.e., provinces) in our panel data might generate standard errors that are not correct
when clustering panel data (Cameron, and Miller 2015). Therefore, we report unclustered standard errors.
The results of the two-way FE model for rural-urban population ratio in Table 2 (column 1) indicate
that an increase in real wages earned by construction workers in the urban sector by 1 percent decreased
the ratio of rural to urban population by 0.18 percent. Similarly, an increase in employment opportunities
in the construction sector by 1 percent represented a decrease of rural-urban population ratio by 0.05
percent. In contrast, wages and job opportunities in the manufacturing sector were not associated with
population ratio changes. These results indicate that employment opportunities along with real wages in
the construction sector were the determinant factors that influenced changes in the population structure
in China. Most importantly, high real wages in construction were more important than job opportunities
in construction on influencing changes of the rural-urban population ratio. This result is in line with
Banister, and Cook (2011), who found that wages are very important considerations for migrant workers.
One of the reasons that can explain the relevance of construction wages is that the increase of real wages
in this sector was considerably greater than the increase of real wages in manufacturing (170% vs. 53%,
respectively) during the study period.
The results of two-way FE estimation model for agricultural employment in Table 3 (column 1)
show that none of the variables of interest are related to employment in the primary sector including
agriculture.
We employed a test of first-order correlation in the estimated models as described by Wooldridge
(2010), which has been shown to present good statistical properties (Drukker 2003). The test results
indicate that we can reject the hypothesis of no first-order correlation at 1% level for the baseline models
presented in equations (9) and (10). Thus, we estimate these models allowing the error term to be first-

14
order autoregressive, specifically we fit the linear models of equations (9) and (10) with province fixed
effects 𝑎𝑖 and an autoregressive AR (1) disturbance as follows:
(11) 𝑣𝑖𝑡 = 𝜌 𝑣𝑖𝑡 + 𝜀𝑖𝑡 , where −1 < 𝜌 < 1 and 𝜀𝑖𝑡 ~ 𝑁(0, 𝜎2)
The FE-AR(1) model was estimated first by transforming the data to remove the AR(1) error
component following the estimation process by Baltagi (2009)
Results from the rural-urban population ratio model using FE-AR (1) estimation in table 2 (column
2), indicate that jobs and wages in the manufacturing sector are associated with changes in the population
structure. We found that for every percentage increase in real wages in manufacturing, the rural-urban
population ratio decreased by 0.3 percent, which is almost twice the decrease reported when construction
wages increase in the two-way FE model (column 1). The results also show that a 0.06 percent decrease
in rural-urban population ratio was associated with an increase in jobs in the manufacturing sector. This
elasticity estimate is similar to the one for construction jobs in the two-way FE model. Surprisingly, an
increase of CPI rentals decreased the rural-urban population ratio; however, its impact is not
economically significant (-0.002).
Results for the model of primary sector labor using FE-AR (1) estimation in table 3 (column 2)
indicate that construction wages had a negative impact on the number of people employed in agriculture
(elasticity value -0.12). Surprisingly, an increase of jobs in construction in urban areas in year t-1 had a
positive association with agricultural employment in year t (elasticity value is 0.08). In addition, a one
percentage point increase in the natural growth rate was associated to 0.02 percent increase in the amount
of agricultural workers.
The positive and negative signs of the coefficients for construction jobs (in the agricultural labor
model) and for CPI rentals (in the rural-urban population ratio model), respectively, might be a signal of
model misspecification in these equations. Therefore, we checked stationarity of the variables in our

15
panel data analysis employing the Fisher-type test as proposed by (Choi 2001) . Because demeaning the
data mitigates the impact of cross-sectional dependence on the test, we employ the test after subtracting
the cross-sectional means from the series as suggested by Levin, Lin, and Chu (2002). While,
nonstationary panel time series are common in the analysis of macro panels with large cross-units N and
large time series T (Baltagi, and Kao 2000), the test results of our micro panel data with small T indicate
that the dependent variables, rural-urban population ratio and employed persons in the primary sector,
are non-stationary, including most of the explanatory variables. In addition, the test results show that the
error term is I(1)5 for both regressions rural-urban ratio and agricultural labor, therefore we discard the
possibility of cointegration.
Differencing is appropriate in nonstationary models in which all variables and error term are random
walk I(1)6. First differenced variables are stationary and the model parameters can be reliably estimated.
In the presence of a mixed panel with I(0) and I(1) series, as in this case, other models are recommended.
The Autoregressive Distributed Lag (ARDL) model is appropriate in large number of cross-sectional
observations N and time series T panel data to address the latter problem (Blackburne, and Frank 2007).
In small T panel estimation (i.e., micro panels), however, a combination of FE or RE estimator and
instrumental variables estimator, such as the generalized method of moments GMM estimator in the
context of dynamic panel data is recommendable (Arellano, and Bond 1991; Arellano, and Bover 1995;
Blundell, and Bond 1998).
Another issue commonly found in panel data is that the model may contain a lagged dependent
variable. Failing to include lagged-dependent variables that are related with the error term, will result in
bias parameter estimates. Hence, we estimate an ARDL-type dynamic panel data (DPD) model which
has been developed for small T data. We use Arellano-Bover/Blundell-Bond GMM system estimator
which outperforms the Arellano-Bond GMM-IV. The problem with the latter estimator is that may suffer

16
of weak instruments (i.e., lagged-levels) if the autoregressive process is too persistent (Blundell, and
Bond 1998). To deal with this problem, the former estimator uses lagged levels as well as lagged
differences as instruments for first differenced variables. The DPD model equations based on the baseline
equations (9) and (10) include the lag value of the dependent variable in the right hand side
𝑟𝑢𝑟𝑎𝑙/𝑢𝑟𝑏𝑎𝑛𝑖𝑡−1 in equation (11) and 𝑎𝑔𝑟𝑖𝑐𝑢𝑙𝑡𝑢𝑟𝑎𝑙 𝑙𝑎𝑏𝑜𝑟𝑖𝑡−1 in equation (12) and they can be
expressed as follow:
(12) log(𝑟𝑢𝑟𝑎𝑙/𝑢𝑟𝑏𝑎𝑛𝑖𝑡) = 𝜇 + δ log(𝑟𝑢𝑟𝑎𝑙/𝑢𝑟𝑏𝑎𝑛𝑖𝑡−1) + log(𝑢𝑟𝑏𝑎𝑛 𝑤𝑎𝑔𝑒𝑠𝑖𝑡)′ 𝛾 +
log(𝑢𝑟𝑏𝑎𝑛 𝑗𝑜𝑏𝑠𝑖𝑡)′𝛼 + 𝑧𝑖𝑡′ 𝛽 + 𝑎𝑡 + 𝑎𝑖 + 𝑣𝑖𝑡
(13) log(𝑎𝑔𝑟𝑖𝑐𝑢𝑙𝑡𝑢𝑟𝑎𝑙 𝑙𝑎𝑏𝑜𝑟𝑖𝑡) = 𝜇 + δ log(𝑎𝑔𝑟𝑖𝑐𝑢𝑙𝑡𝑢𝑟𝑎𝑙 𝑙𝑎𝑏𝑜𝑟𝑖𝑡−1) + log(𝑢𝑟𝑏𝑎𝑛 𝑤𝑎𝑔𝑒𝑠𝑖𝑡)′ 𝛾 +
log(𝑢𝑟𝑏𝑎𝑛 𝑗𝑜𝑏𝑠𝑖𝑡−1)′𝛼 + 𝑧𝑖𝑡′ 𝛽 + 𝑎𝑡 + 𝑎𝑖 + 𝑣𝑖𝑡
The results of DPD model related to construction wages for rural-urban population in table 2 (column
3) are similar to the results of the two-way FE model (column 1). We find that wages in the construction
sector has a negative impact in the ratio rural-urban population. Specifically, an increase of 1 percent in
real wages in the construction sector was associated with a 0.08 percent decrease in the ratio rural to
urban population. As one would expect, the rural-urban ratio of year t-1 has a contemporaneous positive
effect on the rural-urban ratio of year t. Contrary to the previous model FE-AR (1) (column 2), CPI rentals
is positive but not statistically significant in the DPD model (column 3).
The results of the DPD model for agricultural labor indicate that real wages in the manufacturing
and construction sectors are important determinants of China’s agricultural employment. The parameter
estimate for manufacturing wages indicates that a decrease by 1 percent in real wages in this sector
accounted for an increase in the number of employed people in agriculture by approximately 0.3 percent.
Similarly, a decrease by 1 percent in construction wages was associated with an increase by 0.2 percent
in the number of people employed in agriculture. As expected the lag value of number of people

17
employed in the primary sector is highly statistically significant and positive. A one percentage point
increase in the natural growth rate will increase the amount of agricultural workers by 0.05 percent. This
positive relationship between natural growth rate and labor force in agriculture predicted in the DPD and
FE-AR (1) models, point out that the majority of agricultural workers are located in rural areas where the
birth rate is higher due to stricter population control policies imposed in Chinese cities (Saltenyte 2013).
We conduct the Sargan test of over identifying restrictions. This test has an asymptotic Chi-squared
distribution only for a homoscedastic error term (Arellano, and Bond 1991)7. The test results indicate
that we cannot reject the null hypothesis that all instruments are uncorrelated with the error term at 1
percent level in both models. Also the Arellano–Bond tests for serial correlation in the first-differenced
errors show that second order correlation of the errors is not a concern in our model.8
Comparing the elasticity estimates across model specifications, we can conclude that for the
population ratio model, high real wages in construction is an important variable associated with a
decrease of rural population, which is a consistent result in FE and DPD model specifications. Our results
indicate that an increase in real wages in construction by 1 percent increased rural-urban mobilizations
at least by 0.08 percent. More importantly, the estimation results from FE-AR (1) and DPD models point
out that construction wages played an important role in agricultural labor supply. The elasticity estimate
shows that an increase in real wages in this sector by 1 percent was associated with a decrease of
agricultural jobs by at least 0.12 percent.
7. Conclusions and Implications
Overall, our results point out that urban areas are the main destinations for Chinese individuals who
are looking for non-agricultural jobs and higher incomes to support their family and improve their living
conditions, especially for those who live in rural areas where economic growth is slower. Urban

18
expansion along with government urbanization policies are some contributing factors to the growth in
the construction sector which is reflected in high wages and jobs opportunities for migrant workers in
this sector. In line with this, we found that higher wages in construction was associated with an increase
of rural-urban migration and a decline of the agricultural labor supply.
Our results also point out that a downturn in these sectors, construction and manufacturing, will
increase rural–urban population ratio, which might not be desirable if rural areas are not able to employ
returned migrants. Now that China has entered a period of economic slowdown, it is critical to formulate
policies to create rural employment opportunities for migrants returning from the cities in order to
maintain socio-economic stability.
Understanding the role of economic factors on rural-urban migration and supply of farm labor is
critical. Particularly, in the present scenario in which China is becoming more dependent on food imports
and migration flows are expected to continue, possibly resulting in a large decrease of the amount of
labor available for agricultural production. As a whole, our findings indicate that future policy oriented
to provide economic incentives (i.e., higher wages) to rural workers to stay in agricultural jobs as well as
to encourage the use of technology at farm level seem to be good alternatives in China.
Acknowledgements
The authors wish to express their gratitude to Chen Zhen, Associate Professor, Department of
Agricultural & Applied Economics, University of Georgia, Athens, GA, for his insightful contributions
to this paper.

19
20
References
Ambler, T., M. Witzel, C. Xi, and D. Zou. 2008. Doing Business in China. New York: Routledge.
Arellano, M., and S. Bond. 1991. "Some Tests of Specification for Panel Data: Monte Carlo Evidence and an
Application to Employment Equations." The Review of Economic Studies 58:277-297.
Arellano, M., and O. Bover. 1995. "Another Look at the Instrumental Variable Estimation of Error-Components
Models." Journal of Econometrics 68:29-51.
Au, C. C., and J. V. Henderson. 2006. "How Migration Restrictions Limit Agglomeration and Productivity in
China." Journal of Development Economics 80:350-388.
Bai, X., J. Chen, and P. Shi. 2011. "Landscape Urbanization and Economic Growth in China: Positive Feedbacks
and Sustainability Dilemmas." Environmental Science & Technology 46:132-139.
Baltagi, B. 2009. A Companion to Econometric Analysis of Panel Data. Hoboken, NJ: Wiley.
Baltagi, B., and C. Kao. 2000. "Nonstationary Panels, Cointegration in Panels and Dynamic Panels: A Survey."
Syracuse University Center for Policy Research Working Paper.
Banister, J., and G. Cook. 2011. "China’s Employment and Compensation Costs in Manufacturing through 2008."
Monthly Labor Review 134:39-52.
Blackburne, E., and M. Frank. 2007. "Estimation of Nonstationary Heterogeneous Panels." Stata Journal 7:197.
Blundell, R., and S. Bond. 1998. "Initial Conditions and Moment Restrictions in Dynamic Panel Data Models."
Journal Of Econometrics 87:115-143.
Cameron, A., and D. Miller. 2015. "A Practitioner’s Guide to Cluster-Robust Inference." Journal Of Human
Resources 50:317-372.
Carter, C., and A. Estrin. 2001. China’s Trade Integration and Impacts on Factor Markets. Paris, France: OECD.
Chan, K. W. 2013. "China: Internal Migration." In The Encyclopedia of Global Human Migration. Blackwell
Publishing Ltd.
Chan, K. W., and L. Zhang. 1999. "The Hukou System and Rural-Urban Migration in China: Processes and
Changes." The China Quarterly 160:818-855.
Cheng, T., and M. Selden. 1994. "The Origins and Social Consequences of China's Hukou System." The China
Quarterly 139:644-668.
Choi, I. 2001. "Unit Root Tests for Panel Data." Journal Of International Money And Finance 20:249-272.
Chu, K. 2013. "China Manufacturers Survive by Moving to Asian Neighbors." The Wall Street Journal.
http://www.wsj.com/articles/SB10001424127887323798104578453073103566416 (accessed May 8,
2016).
Csanádi, M., Z. Nie, and S. Li. 2015. "Crisis, Stimulus Package and Migration in China." China & World Economy
23:43-62.
Davis, B., and T. Orlik. 2013. "World News: China Sees to Give Migrants Perks of City Life." The Wall Street
Journal. http://online.wsj.com/article/SB10001424127887324178904578341801930539778.html
(accessed May 8, 2016).
Drukker, D. M. 2003. "Testing for Serial Correlation in Linear Panel-Data Models." Stata Journal 3:168-177.
Fields, G. S. 1975. "Rural-Urban Migration, Urban Unemployment and Underemployment, and Job-Search
Activity in LDCs." Journal Of Development Economics 2:165-187.
Gough, N. 2016. "China Lending Inflates Real Estate, Stocks, Even Egg Futures." The New York Times.
http://www.nytimes.com/2016/05/02/business/dealbook/china-lending-inflates-real-estate-stocks-even-
egg-futures.html?smid=fb-nytimes&smtyp=cur&_r=0 (accessed May 8, 2016).
Hewitt, D. 2016. "China’s Real Estate Conundrum: The Big Property Bubble Vs. Ghost Towns." International
Business Times. http://www.ibtimes.com/chinas-real-estate-conundrum-big-property-bubble-vs-ghost-
towns-2354090 (accessed May 8, 2016).
Hu, X. 2012. "China's New Generation Rural-Urban Migrants: Migration Motivation and Migration Patterns."
Migration Information Source. http://papers.ssrn.com/sol3/papers.cfm?abstract_id=1978546 (accessed
May 8, 2016).

21
Knight, J., Q. Deng, and S. Li. 2011. "The Puzzle of Migrant Labour Shortage and Rural Labour Surplus in China."
China Economic Review 22:585-600.
LaFraniere, S. 2009. "China Puts Joblessness for Migrants at 20 Million." The New York Times.
http://www.nytimes.com/2009/02/03/world/asia/03china.html (accessed May 8, 2016).
Levin, A., C.-F. Lin, and C.-S. J. Chu. 2002. "Unit Root Tests in Panel Data: Asymptotic and Finite-Sample
Properties." Journal Of Econometrics 108:1-24.
Melo, G., G. Colson, and O. A. Ramirez. 2014. "Hispanic American Opinions toward Immigration and
Immigration Policy Reform Proposals." Applied Economic Perspectives And Policy 36:604-622.
Migration News. 2011. "China: Migrants, Economy." Migration News.
http://migration.ucdavis.edu/mn/more.php?id=3698_0_3_0 (accessed May 8, 2016).
National Bureau of Statistics of China. 2014. National Data. China Statistics Press, Beijing, China.
http://data.stats.gov.cn/english/index.htm (accessed May 8, 2016).
Qin, H. 2010. "Rural-to-Urban Labor Migration, Household Livelihoods, and the Rural Environment in Chongqing
Municipality, Southwest China." Human Ecology 38:675-690.
Reuters. 2014. "A Manufacturing Slowdown Carries over to 2014 in China." The New York Times.
http://www.nytimes.com/2014/01/23/business/international/a-manufacturing-slowdown-carries-over-to-
2014-in-china.html (accessed May 8, 2016).
Revill, J., and B. Spegele. 2016. "Syngenta Agrees to $43 Billion Chemchina Takeover." The Wall Street Journal.
http://www.wsj.com/articles/chemchina-offers-more-than-43-billion-for-syngenta-
1454480529#:q2dtMmwYDbEM-A (accessed May 2016).
Rozelle, S., J. E. Taylor, and A. DeBrauw. 1999. "Migration, Remittances, and Agricultural Productivity in China."
American Economic Review 89:287-291.
Saltenyte, U. 2013. "Are Birth Rates Lower in Cities." Euromonitor. http://blog.euromonitor.com/2013/10/are-
birth-rates-lower-in-cities.html.
Scheineson, A. 2009. "China's Internal Migrants." Council On Foreign Relations. http://www.cfr.org/china/chinas-
internal-migrants/p12943 (accessed May 8, 2016).
Shangguan, Z. 2013. "China to Pull Back on Grains." The Wall Street Journal
http://www.pressdisplay.com/pressdisplay/viewer.aspx (accessed May 8, 2016).
Shi, L. 2008. "Rural Migrant Workers in China: Scenario, Challenges and Public Policy." Geneva, International
Labour Office, Policy Integration and Statistics Department, pp. 34.
Statista. 2016. "Distribution of the Workforce across Economic Sectors in China from 2004 to 2014." Statista.
http://www.statista.com/statistics/270327/distribution-of-the-workforce-across-economic-sectors-in-
china/ (accessed May 2, 2016).
Taylor, E. 1999. "The New Economics of Labour Migration and the Role of Remittances in the Migration Process."
International Migration 37:63-88.
Taylor, E., S. Rozelle, and A. De Brauw. 2003. "Migration and Incomes in Source Communities: A New
Economics of Migration Perspective from China." Economic Development And Cultural Change 52:75-
101.
USDA. 2015. U.S. Department of Agriculture. China Agricultural and Economic Data.
http://www.ers.usda.gov/data-products/china-agricultural-and-economic-data/national-and-provincial-
data.aspx#.UV8aHjd2TQc (accessed June 6, 2015).
Wang, C., N. Rada, L. Qin, and S. Pan. 2014. "Impacts of Migration on Household Production Choices: Evidence
from China." Journal Of Development Studies 50:413-425.
Wang, D. 2008. Rural-Urban Migration and Policy Responses in China: Challenges and Options. Bangkok,
Thailand: International Labour Organization.
Wang, S. L., F. Tuan, F. Gale, A. Somwaru, and J. Hansen. 2013. "China's Regional Agricultural Productivity
Growth in 1985–2007: A Multilateral Comparison1." Agricultural Economics 44:241-251.
Woetzel, J., L. Mendonca, J. Devan, S. Negri, Y. Hu, L. Jordan, X. Li, A. Maasry, G. Tsen, and F. Yu. 2009.
"Preparing for China’s Urban Billion." Mckinsey Global Institute. http://www.mckinsey.com/global-
themes/urbanization/preparing-for-chinas-urban-billion, McKinsey&Company.
Wooldridge, J. M. 2010. Econometric Analysis of Cross Section and Panel Data. Cambridge, MA: MIT press.

22
World Bank. 2012. "Building Sustainable Transport Systems in Chinese Cities."
http://www.worldbank.org/en/news/feature/2012/08/14/building-sustainable-transport-systems-in-
chinese-cities (accessed May 1, 2016.
Ye, B., H. Su, and L. Wei. 2010. "Construction of Rural Sci-Tech Information Service System in Guangxi Based
on Demands of Agriculture Industrialization " Southwest China Journal Of Agricultural Sciences 2:64.
Zhang, K. H., and S. Shunfeng. 2003. "Rural–Urban Migration and Urbanization in China: Evidence from Time-
Series and Cross-Section Analyses." China Economic Review 14:386-400.
Zhang, Y., S. Zheng, Y. Song, and Y. Zhong. 2016. "The Spillover Effect of Urban Village Removal on Nearby
Home Values in Beijing." Growth And Change 47:9-31.
Zhao, Y. 1999. "Labor Migration and Earnings Differences: The Case of Rural China." Economic Development
And Cultural Change 47:767-782.
Zhu, J. 2010. "China’s Population Set to Reach 1.4 Billion by 2015 " China Daily.
http://www.chinadaily.com.cn/china/2010census/2010-07/05/content_11178513.htm (accessed May 3,
2016).

23
Table 1. Summary Statistics
Dependent Variables 2008 2014 P-value
Employed Persons in Agriculture, Forestry, Animal Husbandry and Fishery 914.95 673.88a 0.81
(Primary Sector) (713.30) (673.90)
Rural-Urban Population Ratio 1.25 0.91 0.03**
(0.68) (0.50)
Independent Variables
Average Annual Real Wage of Employed Persons in Urban Units, Primary 15329.09 32058.90 0.00***
Sector (yuan) (5678.9) (11069.7)
Average Annual Real Wage of Employed Persons in Urban Units,
Manufacturing (yuan)
22552.52 49450.79 0.00***
(5097.0) (9359.0)
Average Annual Real Wage of Employed Persons in Urban Units, Construction 20531.93 44868.43 0.00***
(yuan) (7974.7) (9306.5)
Employed Persons in Urban Units, Manufacturing (10000) 110.78 169.13 0.17
(105.2) (206.90)
Employed Persons in Urban Units, Construction (10000) 34.60 94.23 0.00***
(28.52) (96.67)
Natural Growth Rate 5.46 5.52 0.93
(2.72) (2.76)
Unemployment Rate in Urban Area (%) 3.75 3.28 0.00***
(0.55) (0.65)
Consumer Price Indices (preceding year=100), Rentals 104.24 103.19 0.13
(3.46) (1.49)
Notes: Standard Deviations in parenthesis. P-value corresponds to a paired t-test between 2008 and 2014 data. a Value that corresponds to
2012. Source: NBS, China (2008-2014),

24
Table 2. Rural-Urban Population Ratio
(1) (2) (3)
VARIABLES Two-Way
FE
FE-AR(1) DPD
Log(Average Annual Real Wage of Employed Persons in Urban 0.120* -0.295*** -0.023
Units, Manufacturing (yuan)) [0.065] [0.045] [0.043]
Log(Average Annual Real Wage of Employed Persons in Urban -0.181*** -0.032 -0.081***
Units, Construction (yuan)) [0.042] [0.035] [0.031]
Log(Employed Persons in Urban Units, Construction (10000)) -0.049*** 0.018 0.020
[0.015] [0.016] [0.015]
Log(Employed Persons in Urban Units, Manufacturing (10000)) -0.021 -0.060* -0.051
[0.030] [0.036] [0.032]
Natural Growth Rate -0.013 -0.002 0.003
[0.008] [0.006] [0.007]
Unemployment Rate in Urban Area (%) -0.005 0.020 0.021
[0.014] [0.014] [0.014]
Consumer Price Indices(preceding year=100), Rentals -0.001 -0.002** 0.001
[0.001] [0.001] [0.001]
Log(Rural-Urban population Ratio) Lag1 0.915***
[0.021]
Constant 1.413** 3.614*** 0.946*
[0.666] [0.143] [0.548]
Year FE Yes*** Yes***
Region FE Yes*** Yes***
Observations 216 185 186
Regions 31 31 31
Note: Robust standard errors in brackets except for FE-AR (1) *** p<0.01, ** p<0.05, * p<0.1. Source: NBS, China (2008-2014)

25
Table 3. Employed Persons in the Primary Sector (1) (2) (3)
VARIABLES Two-Way FE FE-AR(1) DPD
Log(Average Annual Real Wage of Employed Persons in Urban Units, Primary -0.008 0.003 -0.005
Sector (yuan)) [0.028] [0.055] [0.066]
Log(Average Annual Real Wage of Employed Persons in Urban Units, 0.014 -0.011 -0.286**
Manufacturing (yuan)) [0.120] [0.080] [0.132]
Log(Average Annual Real Wage of Employed Persons in Urban Units, 0.000 -0.123* -0.219**
Construction (yuan)) [0.096] [0.064] [0.102]
Natural Growth Rate 0.015 0.022* 0.054***
[0.014] [0.012] [0.016]
Unemployment Rate in Urban Area (%) -0.022 -0.019 -0.005
[0.023] [0.022] [0.024]
Consumer Price Indices(preceding year=100), Rentals -0.001 0.001 -0.001
[0.001] [0.001] [0.001]
Log(Employed Persons in Primary Sector (10000)) Lag1 0.855***
[0.061]
Log(Employed Persons in Urban Units, Construction (10000)) Lag1 0.041 0.078** 0.030
[0.055] [0.037] [0.032]
Log(Employed Persons in Urban Units, Construction (10000)) Lag2 -0.057 -0.048 0.030
[0.070] [0.084] [0.085]
Log(Employed Persons in Urban Units, Construction (10000)) Lag3 -0.037
[0.066]
Log(Employed Persons in Urban Units, Manufacturing (10000)) Lag1 0.007
[0.085]
Log(Employed Persons in Urban Units, Manufacturing (10000)) Lag2 -0.023
[0.159]
Log(Employed Persons in Urban Units, Manufacturing(10000)) Lag3 0.104
[0.138]
Constant 7.453*** 7.528*** 5.663***
[1.363] [0.462] [1.963]
Year FE Yes*** Yes***
Regions FE Yes*** Yes***
Observations 124 93 62
Regions 31 31 31
Note: Robust standard errors in brackets except for FE-AR (1) *** p<0.01, ** p<0.05, * p<0.1. Source: NBS, China (2008-2014)

26
Figure 2. Changes in Rural-Urban Population Ratio.
01
23
40
12
34
01
23
40
12
34
01
23
40
12
34
200420062008201020122014 200420062008201020122014 200420062008201020122014 200420062008201020122014 200420062008201020122014
200420062008201020122014
Anhui Beijing Chongqing Fujian Gansu Guangdong
Guangxi Guizhou Hainan Hebei Heilongjiang Henan
Hubei Hunan Inner Mongolia Jiangsu Jiangxi Jilin
Liaoning Ningxia Qinghai Shaanxi Shandong Shanghai
Shanxi Sichuan Tianjin Tibet Xinjiang Yunnan
Zhejiang
Ru
ral-
Urb
an
pop
ula
tion
Ratio
YearFigure 1. Changes in Rural-Urban Population Ratio, Source: NBS China (2005-2014)

27
Figure 2. Changes in Number of Workers Employed in Primary Sector
0
10
0020
0030
00
0
10
0020
0030
00
0
10
0020
0030
00
0
10
0020
0030
00
0
10
0020
0030
00
0
10
0020
0030
00
200420062008201020122014 200420062008201020122014 200420062008201020122014 200420062008201020122014 200420062008201020122014
200420062008201020122014
Anhui Beijing Chongqing Fujian Gansu Guangdong
Guangxi Guizhou Hainan Hebei Heilongjiang Henan
Hubei Hunan Inner Mongolia Jiangsu Jiangxi Jilin
Liaoning Ningxia Qinghai Shaanxi Shandong Shanghai
Shanxi Sichuan Tianjin Tibet Xinjiang Yunnan
Zhejiang
Em
plo
ye
d P
ers
ons in
Prim
ary
Se
cto
r(10
00
0)
YearFigure 2. Changes in Workers Employed in Primary Sector, Source: NBS China (2005-2012)

28
Notes
1 One might be concerned of collinearity issues in the rural-urban population ratio and the agricultural labor
models, specifically correlation between wages and job opportunities. However, the Pearson correlation
results show low correlations between wages and job opportunities for construction and manufacturing (0.24,
0.17, respectively).
2 Agricultural wages in rural areas were not reported in National Bureau Statistics of China.
3 Haussmann test rejected the null hypothesis that over identifying restriction of Random effects estimator hold
for both models.
4 There is no clear-cut definition of few, it may range from less than 20 to less than 50 clusters in the balanced
case, and even more clusters in the unbalanced case (Cameron and Miller, 2015)
5 We cannot reject the null hypothesis of unit root at 1 % level using the Dickey-Fuller test.
6 If the residuals are stationary I (0), then the variables are cointegrated and have a long run relationship. In this
case, an error correction model or the Johansen procedure will generate accurate results.
7 Arellano and Bond (1991) show that the one-step Sargan test tend to over reject in the presence of
heteroscedasticity.
8 First difference of white noise is necessarily autocorrelated, the concern is with second and higher
autocorrelation.