Embed Size (px)
Citation preview
1
1
2
RESEARCH ARTICLE 3
4
5
Running head: Plasma membrane lipids in tobacco 6
7
8
9
Corresponding author: 10
Sébastien Mongrand 11
Laboratoire de Biogenèse Membranaire (LBM), UMR 5200, CNRS-University of 12
Bordeaux, 71 avenue Edouard Bourlaux, 33883 Villenave d’Ornon Cedex, France 13
Tel: 033 663266000 14
Fax 033 5 56 51 83 61 15
e-mail: [email protected] 16
17
18
Research Area: 19
Membranes, Transport and Biogenetics: Associate Editor Anna Amtmann (Glasgow) 20
21
Secondary Research Area: 22
Biochemistry and Metabolism: Associate Editor Julian Hibberd (Cambridge) and Cathie 23
Martin (Norwich) 24
25
26
Plant Physiology Preview. Published on October 30, 2015, as DOI:10.1104/pp.15.00564
Copyright 2015 by the American Society of Plant Biologists
www.plantphysiol.orgon September 15, 2018 - Published by Downloaded from Copyright © 2015 American Society of Plant Biologists. All rights reserved.
2
RE-VISITING PLANT PLASMA MEMBRANE LIPIDS IN TOBACCO: A FOCUS ON 27
SPHINGOLIPIDS 28
29
Jean-Luc Cacas1,3, Corinne Buré2, Kevin Grosjean3, Patricia Gerbeau-Pissot3, Jeannine 30
Lherminier4, Yoann Rombouts5,6, Emmanuel Maes5,6, Claire Bossard1,7, Julien Gronnier1, 31
Fabienne Furt1, Laetitia Fouillen1, Véronique Germain1, Emmanuelle Bayer1, Stéphanie 32
Cluzet8, Franck Robert4, Jean-Marie Schmitter2, Magali Deleu7, Laurence Lins7, 33
Françoise Simon-Plas4, Sébastien Mongrand1 34
35
36
1, Laboratoire de Biogenèse Membranaire (LBM), CNRS-University of Bordeaux, UMR 37
5200. 71 avenue Edouard Bourlaux, F-33883 Villenave d’Ornon Cedex, France 38
2, Chimie Biologie des Membranes et Nanoobjets CBMN - UMR 5248 Centre de 39
Génomique Fonctionnelle BP 68 Université de Bordeaux. 146, rue Léo Saignat F-33076 40
Bordeaux Cedex, France 41
3, Université de Bourgogne UMR1347 Agroécologie, ERL 6300 CNRS, 17 Rue Sully, BP 42
86510, F-21065 Dijon Cedex, France 43
4, INRA UMR1347 Agroécologie, ERL 6300 CNRS, 17 Rue Sully, BP 86510, F-21065 44
Dijon Cedex, France 45
5, Université de Lille 1, Unité de Glycobiologie Structurale et Fonctionnelle, Villeneuve 46
d'Ascq, France 47
6, CNRS, UMR 8576, Villeneuve d'Ascq, France 48
7, Laboratoire de Biophysique Moléculaire aux Interfaces (LBMI), Université de Liège, 2, 49
Passage des Déportés, B-5030 Gembloux, Belgium 50
8, ISVV, Groupe d’Etude des Substances Végétales à Activité Biologique (GESVAB), 51
University of Bordeaux, EA 3675, F-33140 Villenave-d’Ornon, 3 avenue Espeleta, F-52
33400 Talence, France 53
54
One-sentence summaries: 55
This paper shows that GIPCs are major lipids of the PM forming raft in the outer leaflet, 56
yet extending into the inner one through VLCFA, thereby creating interdigitation across 57
the membrane. 58
59
www.plantphysiol.orgon September 15, 2018 - Published by Downloaded from Copyright © 2015 American Society of Plant Biologists. All rights reserved.
3
FOOTNOTES 60
Financial source: 61
We acknowledge the French Agence Nationale de la Recherche (ANR), programme 62
blanc “PANACEA” NT09_517917, contracts to SM and FSP. Lipidomic analyses were 63
performed on Bordeaux Metabolome Facility-MetaboHUB (ANR-11-INBS-0010), 64
contracts to SM and LF (http://www.biomemb.cnrs.fr/page_8.html). JLC was supported 65
by ANR projet blanc “PANACEA” NT09_517917. SM, LF, MD and LL are supported 66
by the ARC FIELD project “Finding Interesting Elicitor LipiDs”, and financial support of 67
FSR, University of Liege. MD and LL thank the Belgian Funds for Scientific Research 68
(FNRS) for their position as Senior Research Associate. Financial support from the 69
TGIR-RMN-THC Fr3050 CNRS for conducting the research is gratefully acknowledged. 70
71
Present address: 72
FF, Worcester Polytechnic Institute, Department of Biology and Biotechnology, 100 73
Institute Road, Worcester, MA 01609, USA 74
75
www.plantphysiol.orgon September 15, 2018 - Published by Downloaded from Copyright © 2015 American Society of Plant Biologists. All rights reserved.
4
ABSTRACT 76
Lipid composition of plasma membrane (PM) and the corresponding Detergent-Insoluble 77
Membrane (DIM) fraction were analyzed with a specific focus on highly polar 78
sphingolipids so-called Glycosyl-Inositol-Phosphoryl-Ceramides (GIPCs). Using tobacco 79
Bright Yellow-2 cell suspension and tobacco leaves (Nicotiana tabacum), evidences were 80
provided that GIPCs represent up to 40 mol% of the PM lipids. Comparative analysis of 81
DIMs with the PM showed an enrichment of 2-hydroxylated Very Long Chain Fatty Acid 82
(VLCFA)-containing GIPCs and polyglycosylated GIPCs in the DIMs. Purified 83
antibodies raised against these GIPCs were further used for immunogold-electron 84
microscopy strategy, revealing the distribution of polyglycosylated GIPCs in domains of 85
35±7nm in the plane of the PM. Biophysical studies also showed strong interactions 86
between GIPCs and sterols, and suggested a role for VLCFA in the interdigitation 87
between the two PM composing-monolayers. The ins and outs of lipid asymmetry, raft 88
formation and interdigitation in plant membrane biology are finally discussed. 89
90
www.plantphysiol.orgon September 15, 2018 - Published by Downloaded from Copyright © 2015 American Society of Plant Biologists. All rights reserved.

5
INTRODUCTION 91
Eukaryotic Plasma Membranes (PMs) are composed of three main classes of lipids: 92
glycerolipids, sphingolipids and sterols, which may account for up to 100,000 different 93
molecular species (Yetukuri et al., 2008); (Shevchenko and Simons, 2010). Overall, all 94
glycerolipids share the same molecular moieties in plants, animals and fungi. By contrast, 95
sterols and sphingolipids are different and specific to each kingdom. For instance, the 96
plant PM contain an important number of sterols among which β-sitosterol, stigmasterol 97
and campesterol predominate (Furt et al., 2011). In addition to free sterols, phytosterols 98
can be conjugated to form Steryl Glycosides (SG) and Acyl Steryl Glycosides (ASG) that 99
represent up to ca. 15% of the tobacco PM (Furt et al., 2010). As for sphingolipids, 100
sphingomyelin (SM) the major phospho-sphingolipid in animals, which harbors a 101
phosphocholine as polar head, is not detected in plants. Glycosyl Inositol 102
PhosphorylCeramides (GIPCs) are the major class of sphingolipids in plants, but they are 103
absent in animals (Sperling and Heinz, 2003; Pata et al., 2010). Sphingolipidomic 104
approaches identified up to 200 plant sphingolipids (reviewed in (Pata et al., 2010) and 105
(Cacas et al., 2013). 106
Although GIPCs belong to one of the earliest classes of plant sphingolipids that have 107
been identified in the late 50’s (Carter et al., 1958), only a few GIPCs were structurally 108
characterized to date because of their high polarity, and a limited solubility in typical 109
lipid extraction solvents. For these reasons, they were systematically omitted from 110
published plant PM lipid composition. GIPCs are formed by addition of an inositol 111
phosphate to the ceramide moiety, the inositol head group of which can then undergo 112
several glycosylation steps. The dominant glycan structure, composed of a Hexose-113
Glucuronic acid (GlcA) linked to the inositol, is called series A. Polar heads containing 3 114
to 7 sugars, so-called series B to F, have been identified and appeared to be species 115
specific (Bure et al., 2011);(Cacas et al., 2013) (Mortimer et al., 2013). The ceramide 116
moiety of GIPCs consists of a long chain base (LCB), mainly t18:0 (called 117
phytosphingosine) or t18:1 compounds (for review, see (Pata et al., 2010) to which is 118
amidified a very long chain fatty acid (VLCFA); the latter of which being mostly 2-119
hydroxylated (hVLCFA) with odd or even number of carbon atoms. In plants, little is 120
known about the subcellular localization of GIPCs. It is, however, assumed that they 121
www.plantphysiol.orgon September 15, 2018 - Published by Downloaded from Copyright © 2015 American Society of Plant Biologists. All rights reserved.
6
would be highly represented in PM (Worrall et al., 2003; Lynch & Dunn, 2004; Sperling 122
et al., 2005) even if this remains to be experimentally proven. The main argument 123
supporting such an assumption is the strong enrichment of tri-hydroxylated LCB (t18:n) 124
in DIM fractions (Borner et al., 2005); (Lefebvre et al., 2007), LCB known to be 125
predominant in GIPC’s core structure as aforementioned. 126
In addition to this chemical complexity, lipids are not evenly distributed within the PM. 127
Sphingolipids and sterols can preferentially interact with each other and segregate to form 128
microdomains dubbed membrane raft (Simons and Toomre, 2000). The “membrane raft” 129
hypothesis suggests that lipids play a regulatory role in mediating protein clustering 130
within the bilayer by undergoing phase separation into liquid-disordered (Ld) and liquid-131
ordered (Lo) phases. The Lo phase, termed membrane raft, was described as enriched in 132
sterol and saturated sphingolipids, and is characterized by tight lipid packing. Proteins, 133
which have differential affinities for each phase, may become enriched in, or excluded 134
from, the Lo phase domains to optimize the rate of protein-protein interactions and 135
maximize signaling processes. In animals, rafts have been implicated in a huge range of 136
cellular processes, such as hormone signaling, membrane trafficking in polarized 137
epithelial cells, T cell activation, cell migration, life cycle of influenza and HIV viruses 138
(Simons and Gerl, 2010) (Simons and Ikonen, 1997). In plants, evidence are raising that 139
rafts are also involved in signal transduction processes and membrane trafficking 140
(reviewed in (Simon-Plas et al., 2011); (Cacas et al., 2012b); (Mongrand et al., 2010). 141
Moreover, lipids are not evenly distributed between the two leaflets of the PM either. 142
Within PM of eukaryotic cells, sphingolipids are primarily located in the outer monolayer 143
whereas unsaturated phospholipids are predominantly exposed on the cytosolic leaflet. 144
This asymmetrical distribution has been well established in human red blood cells, in 145
which the outer leaflet contains SM, phosphatidylcholine (PC) and a variety of 146
glycolipids like gangliosides. By contrast, the cytoplasmic leaflet is composed mostly of 147
phosphatidylethanolamine (PE), phosphatidylserine (PS) and phosphatidylinositol (PI) 148
and its phosphorylated derivatives (Devaux and Morris, 2004). With regards to 149
sphingolipids and glycerolipids, the asymmetry of the former is established during their 150
biosynthesis and that of the latter requires ATPases such as the amino-phospholipid 151
translocase that transports lipids from the outer to the inner leaflet, as well as Multiple 152
www.plantphysiol.orgon September 15, 2018 - Published by Downloaded from Copyright © 2015 American Society of Plant Biologists. All rights reserved.
7
Drug Resistance proteins that transport PC in the opposite direction (Devaux and Morris, 153
2004). This ubiquitous scheme encountered in animal cells could apply in plant cells as 154
proposed by (Tjellstrom et al., 2010). Indeed, the authors showed that there is a 155
pronounced transversal lipid asymmetry in root at the PM. Phospholipids and 156
galactolipids dominate the cytosolic leaflet whereas the apoplastic leaflet is enriched in 157
sphingolipids and sterols. 158
From such a high diversity of the plant PM thus arises the question of the respective 159
contribution of lipids to membrane sub-organization. Our groups recently tackled this 160
aspect by characterizing the order level of liposomes prepared from various plant lipids 161
and labeled with the environment-sensitive probe di-4-ANEPPDHQ (Grosjean et al., 162
2015). Fluorescence spectroscopy experiments showed that, among phytosterols, 163
campesterol exhibits the strongest ability to order model membranes. In agreement with 164
these data, spatial analysis of membrane organization through multispectral confocal 165
microscopy pointed the strong ability of campesterol to promote Lo domain formation 166
and organize their spatial distribution at the membrane surface. Conjugated sterols also 167
exhibit a striking ability to order membranes. In addition, GIPCs enhance the sterol-168
induced ordering effect by emphasizing the formation and increasing the size of sterol-169
dependent ordered domains. 170
The aim of this study was to re-investigate the lipid composition and organization of the 171
PM with a particular focus on GIPCs using tobacco leaves and BY-2 cell cultures as 172
models. Analyzing all membrane lipid classes at once, including sphingolipids, is 173
challenging because they all display dramatically different chemical polarity going from 174
very apolar (like free sterols) to highly polar molecules (like polyglycosylated GIPCs). 175
Most lipid extraction techniques published thus far use chloroform/methanol mixture and 176
phase partition to remove contaminants, resulting in the loss GIPCs, which remain either 177
in the aqueous phase, unextracted in the insoluble pellet or at the interphase (Markham et 178
al., 2006). In order to gain access to both glycerolipids and sphingolipids species at a 179
glance, we developed a protocol whereby the esterifed or amidified FAs were hydrolyzed 180
from the glycerobackbone (glycerolipids) or the long chain base (sphingolipids) of 181
membrane lipids, respectivley. FA were then analyzed by GC-MS with appropriate 182
internal standards for quantification. We further proposed that the use of Methyl tert-183
www.plantphysiol.orgon September 15, 2018 - Published by Downloaded from Copyright © 2015 American Society of Plant Biologists. All rights reserved.
8
butyl ether (MTBE) ensures the extraction of all classes of plant polar lipids. Our results 184
indicate that GIPCs represent up to 40 mol% of total tobacco PM lipids. Interestingly, 185
polyglycolyslated GIPCs are 5-fold enriched in DIMs of BY-2 cell when compared to 186
PM. Further investigation brought us to develop a preparative purification procedure that 187
allowed to obtaining enough material for raising antibodies against GIPCs. Using 188
immunogold-labeling on PM vesicles, it was found that polyglycosylated GIPCs cluster 189
in membrane nanodomains, strengthening the idea that lateral nano-segregation of 190
sphingolipids takes place at the PM in plants. Multispectral confocal microscopy was 191
performed on vesicles prepared using GIPCs, phospholipids and sterols, and labeled with 192
the environment-sensitive probe di-4-ANEPPDHQ. Our results show that, despite a 193
different fatty acid and polar head composition, GIPCs extracted from tobacco leaves and 194
BY-2 cells have a similar intrinsic propensity of enhancing vesicle global order together 195
with sterols. Assuming that GIPCs are mostly present in the outer leaflet of the PM, 196
interactions between sterols and sphingolipids was finally studied by Langmuir 197
monolayer and the area of a single molecule of GIPC, or in interaction with phytosterols, 198
was calculated. Using the calculation docking method, the energy of interaction between 199
GIPCs and phytosterols was determined. A model was proposed in which GIPCs and 200
phytosterols interact together to form Lo domains, and in which the VLCFAs of GIPCs 201
promote interdigitation of the two membrane leaflets. The implication of domain 202
formation and asymmetrical distribution of lipids at the PM in plants is also discussed. 203
Finally, we propose a model that re-considers the intricate organization of the plant PM 204
bilayer. 205
206
www.plantphysiol.orgon September 15, 2018 - Published by Downloaded from Copyright © 2015 American Society of Plant Biologists. All rights reserved.
9
RESULTS 207
GIPCs are enriched in plasma membrane microdomains 208
Because FA-containing lipids, i.e. glycerolipids, acylated sterylglucosides and GIPCs, 209
exhibit marked different FA compositions, total FA distribution of microsomal, PM and 210
DIM fractions isolated from BY2 cells and tobacco leaves was determined to test for the 211
assumption that GIPCs mainly reside in PM. Samples were transesterified in hot 212
methanol/sulfuric acid solution to fully release both FA-esterified glycerolipids and 213
sterylglucoside, and FA-amidified sphingolipids. Total FA content was then quantified by 214
GC-MS (see Supplemental Fig. S1, for a typical GC-MS spectrum). The Fig. 1A shows 215
that, in both tobacco leaves and BY-2 cells, the combined percentage of VLCFA and 216
hVLCFA increases from ca. 3% in total tissue to ca. 55% in DIM at the expense of 217
LCFAs, i.e. 16 and 18 carbon atom-long FA (Fig. 1A; refer to Supplemental Fig. S2 for 218
the detailed FA content). Comparison of FA contents of DIM fractions floating in the 219
sucrose gradient, and Detergent-Soluble Membrane (DSM) fractions in the bottom of the 220
gradient revealed a higher level of LCFAs in DSM, which correlates with a lower 221
percentage of (h)VLCFA in this fraction (Supplemental Fig. S3). 222
In order to understand the origin of (h)VLCFA, we analyzed the structure of the different 223
family of plant PM lipids. We previously showed that VLCFA and hVLCFA are absent 224
from tobacco glycerolipids, except for a few percent of 20:0/22:0 in PS (Mongrand et al., 225
2004; Lefebvre et al., 2007). Further extraction and structural analyses revealed that 226
tobacco ASGs consist of saturated FA with mainly 16 and 18 carbon atoms and common 227
sterols of the PM (Supplemental Fig. S4). GluCER that accounts for only 5-10 mol% of 228
PM (Furt et al., 2010) is acylated by h16:0 as major hydroxylated FA (Supplemental Fig. 229
S5). Therefore, we hypothesized that VLCFA and hVLCFA, present in high amount in 230
PM and DIM, likely originate from GIPCs. 231
To test this hypothesis, we purified total GIPCs from tobacco leaf and BY-2 cells as 232
described in (Bure et al., 2011), and determined their FA and LCB content by GC-MS. 233
hVLCFA and VLCFA content is highly comparable in DIMs and pure GIPCs (Fig. 1B), 234
with an even higher proportion of hVLCFA in DIMs purified from BY2 cells, suggesting 235
that hVLCFA-containing GIPCs are most likely to be present in membrane 236
microdomains. Besides, levels of the two LCB t18:0 and t18:1, which are mostly present 237
www.plantphysiol.orgon September 15, 2018 - Published by Downloaded from Copyright © 2015 American Society of Plant Biologists. All rights reserved.
10
in GIPCs (Bure et al., 2011), strongly increase in DIMs when compared to PM, reaching 238
80% of total LCBs in DIMs (Supplemental Fig. S6, and Borner et al., 2005). This is also 239
in good agreement with a strong enrichment of GIPCs in DIMs. Note that h16:0 is 240
enriched in DIMs (Fig. 1B). Logically, this FA is found in tobacco gluCER (Fig. S5), a 241
sphingolipid enriched in tobacco DIMs (Mongrand et al., 2004); (Lefebvre et al., 2007). 242
To further characterize the enrichment of GIPCs in DIMs, we first compared the total 243
GIPCs extracted from leaf and BY-2 cells by MALDI-TOF mass spectrometry (Bure, et 244
al. 2011). Leaf GIPCs mostly contain GIPCs of series A (with 2 sugars) and BY-2 245
contain in addition to series A, a vast array of polyglycosylated GIPCs of the B to E 246
series (Fig. 2), as previously described (Bure, et al. 2011). The detailed molecular species 247
of the polar head and LCB/FA combination is provided in Supplemental Fig. S7 with the 248
nomenclature described in (Bure et al., 2011). We next used HP-TLC to separate the 249
different series (Kaul and Lester, 1975) (Fig. 2B), scratched the corresponding silica 250
bands and quantified the FAMES by GC-MS after transmethylation/silylation (Fig. 3 and 251
4). Note that the series A partitioned into two bands called PhytoSphingoLipid: PSL I (N-252
Acetyl glucosamine(GlcNAc)-GlcA-IPC) and PSL II (Glucosamine(GlcN)-GlcA-IPC) as 253
previously established (Kaul and Lester, 1975). 254
GIPC of series A were found in both PM and DIM fractions of tobacco leaves 255
(Supplemental Fig. S8), but the fact that BY-2 cells contain different series of GIPCs 256
prompted us to determine whether polyglycosylated GIPCs were enriched in DIMs of 257
BY-2. We performed HP-TLC coupled to GC-MS, as described above. GIPCs of series B 258
were enriched three times in DIMs when compared to PM, reaching 17% of total GIPCs 259
in BY-2 DIM (Fig. 3). 260
Lipid composition of tobacco plant PM based on the latter set of data was combined to 261
previous findings (Furt et al., 2010), and the global lipid composition of PM and DIM 262
fractions was recalculated taking into account GIPC concentrations (Fig. 3). As expected, 263
glycerolipids were depleted in DIM fractions when compared to PM, whereas the exact 264
opposite trends was observed for sphingolipids, whether these fractions were prepared 265
from tobacco leaves (Fig. 4A) or BY-2 cells (Fig. 4B). Remarkably, GIPCs that have 266
long been omitted for technical reasons in PM composition, represent up to 45 and 30 267
mol% of total PM lipids isolated from leaves and BY-2 cell suspensions, respectively. 268
www.plantphysiol.orgon September 15, 2018 - Published by Downloaded from Copyright © 2015 American Society of Plant Biologists. All rights reserved.
11
Furthermore, DIM fractions purified from both BY-2 cells and photosynthetic tissues 269
display a huge proportion of GIPCs that reaches 60 mol%, suggesting that the 270
contribution to sphingolipid enrichment in PM microdomains is mainly due to GIPCs. It 271
is also worth noting that the sum of sterols and sphingolipids averages 90 and 88 mol% in 272
DIM of tobacco leaves (Fig. 3A right) and that of BY-2 cells (Fig. 3B right), respectively. 273
We reasoned that if GIPCs are exclusively located in the outer leaflet of PM (see 274
discussion section), the presence of more than 50 % of GIPCs in DIMs suggests a higher 275
solubilization of the inner leaflet by the TritonX-100. 276
Hence, from these data arise the question of the lipid-to-protein ratio, commonly thought 277
to be closed to 1 for plant PM. This ratio was experimentally reinvestigated using BY-2 278
PM samples. One hundred micrograms of PM vesicles were extracted by the “gold-279
standard” Folch protocol, i.e. chloroform/methanol 2/1 (v/v) extraction. As previously 280
described by (Markham et al., 2006), almost half of the (h)VLCFA-containing GIPCs 281
were lost in the lower aqueous phase (Fig. S9). This phase was therefore evaporated to 282
remove solvents, resuspended in pure water and GIPCs were re-extracted with butanol-1 283
(which extract 98% of plant GIPC from water as previously shown in Bure et al., 2011). 284
Importantly, no FA was recovered in water after this double extraction (Fig. S9). In 285
addition, when comparing direct transesterification to Folch protocol followed by 286
butanol-1 extraction, the estimated lipid recovery yield using FA levels as proxy was 287
close to 100%, indicating full extraction of lipids irrespectively of their polarity. Based 288
on these results, the lipid-to-protein ratio was calculated to be 1.3 ± 0,07 for BY-2 PM. 289
290
We further decided to test other solvents for lipid extraction to get a simple, quantitative 291
and unbiased recovery of lipid species from plants. Methyl tert-butyl ether (MTBE) 292
extraction was tested, because it has been shown to allow faster and cleaner lipid 293
recovery (Matyash et al., 2008). Its low density forms the upper layer organic phase 294
during phase separation, which simplifies its recovery (Fig. S10A). We thus compared 295
Folch protocol (Extraction #1 in Experimental section), MTBE extraction (Extraction #2) 296
and Markham protocol (extraction #3) developed to fully extract plant sphingolipids 297
(Markham et al., 2006). Rigorous testing demonstrated that the extraction in hot 298
isopropanol followed by one of the three extractions was suitable to extract total polar 299
www.plantphysiol.orgon September 15, 2018 - Published by Downloaded from Copyright © 2015 American Society of Plant Biologists. All rights reserved.
12
lipids of plant samples (see Experimental section). Nevertheless, Markham’s extraction 300
(#3) diplays the disadvantage to contain large amount of water, hardly evaporated, and 301
protein contamination in the organic phase because of the absence of liquid-liquid phase 302
separation. In the Folch extraction (#1), inconvenience resides in the fact that the higher 303
density of chloroform forms the lower phase in the two-phase partitioning system, and a 304
glass pipette or a needle must cross the aqueous phase to collect the lipid-containing one. 305
By contrast, lipid extraction by upper phase MTBE/methanol/water “extraction #2” 306
greatly simplifies sample handling. We therefore proposed the MTBE method as a 307
method of choice to extract total plant polar lipids. 308
309
Purification of GIPC series from BY-2 cells and production of antibodies against 310
polyglycosylated GIPCs 311
Pure GIPCs are not commercially available, neither are the corresponding molecular tools 312
dedicated to their study, like fluorescently-labeled lipids or specific antibodies. We thus 313
purified several milligrams of GIPCs in order to immunize rabbits and raise antibodies to 314
be used in immunolabeling experiments. Because of their anionic phosphate groups, 315
GIPCs can be purified by anion-exchange chromatography on diethylaminoethyl (DEAE) 316
cellulose. This approach has the double advantage of allowing sample cleanup and 317
concentration. 318
The preparative purification procedure was carried out according to Kaul and Lester 319
(1975) with slight modifications described in the section Material and Methods. Home-320
packed DEAE cellulose chromatographic column was used for that purpose and GIPCs 321
were eluted with increasing concentrations of ammonium acetate dissolved in 322
chloroform/methanol/water (30/60/8, v/v/v). Under our experimental conditions, GIPCs 323
of series A (namely PSL1 and PSL2) were successfully separated from polyglycosylated 324
GIPC of series B-F; the former eluting in fractions 41-45, whereas the latter eluted in 325
fractions 46-49 (Supplemental Fig. S11A). Glycerolipid contaminations were discarded 326
from these fractions by methylamine treatment, which hydrolyses ester bonds (Markham 327
et al., 2006). Fractions were then dialyzed to remove ammonium acetate and their 328
concentration and purity estimated by GC-MS and MALDI-TOF (Supplemental Fig. 329
S11B). They were subsequently used for preparing liposomes supplemented with 330
www.plantphysiol.orgon September 15, 2018 - Published by Downloaded from Copyright © 2015 American Society of Plant Biologists. All rights reserved.
13
bacterial lipid A known to boost rabbit immunity (Richards et al., 1998). The two 331
immune sera obtained following rabbit injection with GIPC of series A did not react with 332
the DEAE-purified fractions used for the immunization protocol (data not shown). By 333
contrast, one immune serum (rabbit #46) raised against polyglycosylated GIPCs of series 334
B-F clearly reacted with the chromatographic fractions used for the immunization 335
protocol, whereas no reaction was observed with the corresponding pre-immune serum 336
(Figure 5A). ELISA performed on PM showed strong signal increase between negative 337
controls (preimmune serum) and final serum or purified IgG antibodies (Supplemental 338
Fig. S12). No specific signal was detected with antibodies against GIPCs on hydrophobic 339
membranes that have been spotted with all eight phosphoinositides and seven other 340
biological important lipids (“PIP strip”, Supplemental Fig. S13). Finally, to further test 341
the specificity of the antibodies on the different GIPCs series purified from BY-2 cells, 342
Eastern blots were directly performed on HP-TLC plates containing PM lipids extracted 343
with the MTBE protocol described above. Rabbit polyclonal antibodies were able to 344
recognize polyglycosylated GIPCs of series B-F, but not those of series A (Fig. 5B). 345
346
Polyglycosylated GIPCs cluster within nanodomains in tobacco PM 347
Since polyglycosylated GIPCs are enriched in BY-2 DIM fractions (Fig. 4B), the 348
possibility of visualizing GIPC-enriched clusters was challenged by transmission electron 349
microscopy using anti-GIPC antibodies-based immunogold labelling experiments. PM 350
vesicles were purified from BY-2 cells, directly deposited onto microscope grids 351
allowing for the exposure of large membrane sheets. The grids were then pretreated to 352
prevent nonspecific binding, incubated first with primary antibodies against 353
polyglycosylated GIPCs and then with secondary IgG conjugated to colloidal gold 354
particles. Preparations were negatively stained with ammonium molybdate to reveal the 355
vesicle morphology and observed by transmission electron microscopy. 356
Statistical analysis was performed on 49 independent gold-labeled PM vesicles to analyze 357
the putative clustering of gold particles. The mean and standard deviation were calculated 358
for different parameters: diameter of PM vesicles, area of PM vesicle, number of gold per 359
PM vesicle, number of gold particles per cluster, size of gold particle cluster and distance 360
between two neighboring clusters. The mean labeling density was quantified to be 7 gold 361
www.plantphysiol.orgon September 15, 2018 - Published by Downloaded from Copyright © 2015 American Society of Plant Biologists. All rights reserved.
14
particles per vesicle. Groups of particles were composed of an average of 4 gold particles 362
(from 3 to 7 particles were clustered). We calculated that 88% (n=3) of the gold particles 363
showed a clustered distribution throughout the vesicle surface with an average of 4 gold 364
particles, and with an average cluster diameter of 35 nm ± 7nm (Fig. 6A,B). Only 12% of 365
the gold particles exhibited a random distribution on the PM surface. Ripley’s K-function 366
analysis indicated that the gold pattern was aggregated, since K(r) values of experimental 367
data laid clearly above the Poisson simulation curve corresponding to completely random 368
pattern (Fig 6C). Negative controls including omission of the primary antibody or use of 369
pre-immune serum exhibited a very weak labeling. Positive controls carried out using 370
antibodies raised against the proton pump ATPase (PMA) showed a heavy labeling of the 371
PM (Raffaele et al., 2009) (Supplemental Fig. S14). Therefore, GIPCs (series B-F) 372
exhibit an aggregated pattern within the PM of BY-2 cells with a mean size of 35nm. 373
374
Order level of model membranes prepared with GIPCs isolated from leaves or cell 375
cultures 376
The ability of GIPCs to change membrane order and organize Lo domain was 377
investigated using the environment-sensitive probe di-4-ANEPPDHQ, as described in 378
(Grosjean et al., 2015). Briefly, membrane organization alters the fluorescence emission 379
spectrum of the probe that emits in both red (635 to 655 nm) and green spectral regions 380
(545 to 565 nm). Increase in green fluorescence emission correlates with a higher average 381
order level of the membrane. Conversely, an emission shift towards red wavelengths 382
indicates a decrease in the relative amount of ordered domains in the lipid bilayer. The 383
Red-to-Green fluorescence ratio of the Membrane (RGM) thus reflects the relative 384
proportions of Ld/Lo phases within membranes (Nichols et al. 1986). 385
Previously, we showed that plant sphingolipids, especially GIPCs, enhanced the sterol-386
induced ordering effect by increasing the size of sterol-dependent ordered domains 387
(Grosjean et al., 2015). In order to test for the impact of GIPC’s composition on global 388
membrane organization, Large Unilamellar Vesicles (LUV) were prepared using distinct 389
combination of lipids, incubated in the presence of di-4-ANEPPDHQ and the RGM 390
calculated upon spectral acquisition. The phospholipids dioleoylphosphatidylcholine 391
(DOPC) and dipalmitoylphosphatidylcholine (DPPC), the phytosterol (campesterol or a 392
www.plantphysiol.orgon September 15, 2018 - Published by Downloaded from Copyright © 2015 American Society of Plant Biologists. All rights reserved.
15
sterol mix isolated from BY2 cells (TM)), and GIPCs were used for producing LUV. We 393
compared GIPCs of series A isolated from tobacco leaves, and GIPCs of series A-F, 394
which include polyglycosylated molecules, purified from BY-2 cell suspensions. 395
Importantly, the ceramide moiety of tobacco leaves mostly contains hVLCFA, whereas 396
that of BY2 suspension harbors an equimolar mix of VLCFA and hVLCFA. 397
Results of Fig. 7 confirmed that GIPCs have no particular ability to modify the order 398
level of model membranes containing only phospholipids and suggest that the size of 399
their sugar head and the hydroxylation of VLCFA do not change this capacity. When 400
33% of campesterol or a sterol mixture mimicking the one found in tobacco BY-2 PM 401
(TM, Tobacco Mix) were added to phospholipids and GIPCs, a significant and similar 402
decrease of the RGM was observed (Fig. 7). Such decrease of RGM confirm the major 403
involvement of sterol in increasing membrane order level, and suggest that 17% of 404
polyglycosylated (Fig. 3) or the presence of 50% of VLCFA (Fig. 1B) in GIPCs does not 405
drastically modify the ability of sphingolipids to order membrane with sterols. 406
407
Molecular simulation modeling and biophysical analysis reveals GIPC/Sterol 408
interaction and interdigitation of GIPC’s VLCFA between the two leaflets of the 409
PM 410
Based on the literature (see discussion) and immunolabelling experiments (Fig. 6), we 411
reasonably hypothesized that GIPCs may preferentially reside in the apoplastic leaflet. 412
Therefore, we conducted biophysical experiments and energetic calculation to 413
characterize outer leaflet organization of plant PM, i.e. structure, organization and 414
behavior. 415
The Langmuir trough technique applied on a monolayer model at air–water interface has 416
been extensively used for characterizing interfacial organization of lipids and lipid–lipid 417
interactions at the micrometric level (Deleu, et al. 2014). The GIPC compression 418
isotherm (Fig. 8A) showed a low and relatively constant surface pressure at large 419
molecular areas, corresponding to a gaseous state. Compression of a pure GIPC 420
monolayer induced a progressive increase in surface pressure, indicating the appearance 421
of a liquid-expanded (LE) state, which is characterized by a certain degree of cooperative 422
interaction between the molecules at the interface (Fig. 8A). This was confirmed by the 423
www.plantphysiol.orgon September 15, 2018 - Published by Downloaded from Copyright © 2015 American Society of Plant Biologists. All rights reserved.
16
value of the two-dimensional compressibility modulus (Cs−1 = 31.9 mN/m in the 180-70 424
Ų/molecule region), which is lower than the highest value (100mN/m) for a LE film 425
(Rideal, 1963). At the onset of the LE state, corresponding to the more expanded 426
configuration, the molecule occupies a mean interfacial area of 209.9±3.6 Ų/molecule. 427
This increase in surface pressure was followed by a small plateau of quite constant 428
surface pressure and by a sharp increase in surface pressure at low areas per molecule. 429
This indicated that GIPC monolayers can adopt a more condensed state (Cs−1>80mN/m) 430
under high compression. In this state, the lipids occupy a mean molecular area of 431
66.0±11.3 Ų/molecule and adopt probably a vertical orientation at the interface. 432
We next assessed the interaction between GIPCs and sitosterol; information can be 433
obtained by a thermodynamic analysis of the compression isotherms of the mixed GIPC-434
sitosterol monolayers. Within a mixed monolayer, if the two components are immiscible 435
(or ideally miscible), the area occupied by the mixed film will be the sum of the areas of 436
the separate components (obeyed the additivity rule) (Maget-Dana, 1999). Any deviation 437
from the additivity rule can be attributed to specific interaction between the two 438
components (Maget-Dana, 1999; Fang et al., 2003). Whatever the surface pressure 439
considered (10, 20 or 30 mN/m), the mean molecular area of mixed monolayer GIPC/Sito 440
(85/15) was significantly lower than the theoretical value calculated from the additivity 441
rule (Fig. 8B). The negative deviation of the area, together with the negative excess of 442
free energy of mixing (ΔGex) (Fig. 8C) suggests a strong attractive interaction between 443
the two components (Maget-Dana, 1999; Gaines, 1966; Eeman et al., 2005). Moreover, 444
the negative value of ΔGM (Fig. 8C) indicated that the mixed GIPC/sitosterol monolayer 445
is thermodynamically stable. 446
Molecular modelling of the GIPC monolayer and membrane insertion 447
We finally used a simple theoretical docking method, called Hypermatrix (HM). This 448
method is particularly useful to compare the specific interaction of a molecule of interest 449
with lipids and with itself, and hence helps to understand its organization according to the 450
different interacting forces. The analysis of the assembly of GIPC molecules with 451
t18:0/h24:0 in a monolayer showed that the calculated interaction is mainly driven by 452
hydrophobic energy (Fig. 9C). The mean interfacial area occupied by one molecule in the 453
monolayer is 69±10 Ų (Fig. 9C). This is in very good agreement with the area measured 454
www.plantphysiol.orgon September 15, 2018 - Published by Downloaded from Copyright © 2015 American Society of Plant Biologists. All rights reserved.

17
experimentally using the Langmuir technique in high compression conditions, suggesting 455
that the calculated structure of GIPC corresponds to this configuration. When the 456
interaction between GIPCs and sitosterol was analyzed, the energy of the interaction was 457
comparable to that of GIPC monomolecular layer, with a slight increase in Van der 458
Waals interactions (Fig. 9C). This suggests a good steric fitting between the two 459
molecules, as shown on figure 9A. This molecular fitting can also be correlated to the 460
fact that the mean area calculated in mixed GIPC/sitosterol monolayers was lower than 461
the area of individual molecules (Fig. 9C), again in very good agreement with the 462
experimental assays on monolayer (Fig. 8B). 463
To analyze the behavior of GIPCs with t18:0/h24:0 into a lipid membrane, we calculated 464
its insertion into a simplified implicit bilayer (IMPALA method) (Ducarme et al., 1998) 465
and compared it to gluCER with d18:2/h16:0. Fig. 9B clearly evidenced a significant 466
difference between gluCER and GIPC: 1/ the size of the polar heads and the positioning 467
of acyl chains are strikingly different; 2/ the saturated VLCFA of GIPCs runs out of the 468
middle of the bilayer and interdigitates by at least 6-7 carbon atoms within the second 469
leaflet. 470
471
www.plantphysiol.orgon September 15, 2018 - Published by Downloaded from Copyright © 2015 American Society of Plant Biologists. All rights reserved.
18
DISCUSSION 472
GIPCs are by far the major lipids of the plant plasma membrane 473
In this work, we reinvestigated the lipid composition of PM and ordered domain isolated 474
as Detergent-Insoluble Membranes (DIMs), with a particular focus on GIPCs. The latter 475
class of sphingolipids has long been neglected because it is not extracted by conventional 476
lipid extraction procedures (Fig. S9 and Sperling et al., 2005; Markham et al., 2006). 477
Here, we showed that GIPCs represent up to 30-40 mol% of the total PM lipids of 478
tobacco plants and therefore represent the bulk of PM outer leaflet lipids, with 60-80% of 479
total outer leaflet lipids (Fig. 3 and 10). Taking into account this striking result, we 480
recalculated the lipid-to-protein ratio of plant PM and found a ratio of 1.3. Hence, bearing 481
in mind that PM contains a high protein density, it is tempting to propose that plant PM 482
should not be considered as system where proteins are floating in a “sea” of lipids, but as 483
a lipid–protein composite in which a very high density of transmembrane and anchored 484
proteins may modify order on nearby lipids (Jacobson et al., 2007). A recent publication 485
in plants showed for example that PM are subcompartmentalized into a plethora of 486
coexisting and diverse microdomains labeled by the different isoforms of the inner leaflet 487
plant raft protein REMORINs (Jarsch et al., 2014). The respective role of lipids and 488
proteins in this segregation of membrane compounds remains to be elucidated. 489
490
GIPC’s polar headgroups are much bulkier than phospholipid ones 491
The volume occupied by the glycosyl-phosphoinositol headgroup of GIPCs increases 492
with the complexity of the oligosaccharide chain. Our experimental data obtained by the 493
Langmuir monolayer technique point that the molecular area occupied by tobacco GIPCs 494
of series A varies from 66.0±11.3 to 209.9±3.6 Ų/molecule from a condensed to an 495
expanded state (Fig. 8A). This was further corroborated by our computational 496
calculations indicating a value of 69±10 Ų/molecule (Fig. 9C) in good agreement with 497
the values of the interfacial area either calculated or measured by Langmuir monolayer 498
technique, as reviewed in (Deleu et al., 2014). By contrast, phospholipids occupy 95-110 499
Ų/molecule in an expanded state and 45-55 Ų/molecule in a condensed state (Deleu et 500
al., 2001; Eeman et al., 2005) and sterols display an interfacial area of 38-48 Ų/molecule 501
(Eeman et al., 2005; Scheffer et al., 2005). Predictions based on the geometrical 502
www.plantphysiol.orgon September 15, 2018 - Published by Downloaded from Copyright © 2015 American Society of Plant Biologists. All rights reserved.
19
properties of glycosphingolipid molecules indicate that the separation of a 503
glycosphingolipid-rich phase in a phospholipid bilayer would imply a minimization of 504
the interfacial free energy required to accommodate the amphipathic glycosphingolipid in 505
the bilayer. Therefore, the geometrical properties inherent to the bulky headgroup of 506
glycosphingolipids strongly favor phase separation and spontaneous membrane 507
curvature, for review (Sonnino and Prinetti, 2010). In animals, the extent of ganglioside 508
phase separation in glycerophospholipid bilayers depends on the surface area occupied by 509
the oligosaccharide group that is usually directly correlated with the number of sugar 510
residues (Masserini et al., 1989). Nevertheless, one must note that gangliosides are 511
present in very low amount in animal membrane (less than few percent), whereas plant 512
GIPCs represent the major sphingolipids of the PM. In that context, the biophysical 513
properties of the plant PM must be fully reinvestigated. 514
515
Role for GIPCs and sterols in coupling the inner and the outer leaflets of the PM 516
The asymmetry of lipids in the tobacco PM 517
A common feature of eukaryotic PMs is the non-random distribution of lipids in the two 518
leaflets of the membrane, called lipid asymmetry. Lipid asymmetry within the two PM 519
monolayers is responsible for different biophysical properties and influences numerous 520
cellular functions. The lipid asymmetry lies in the facts that glycerolipids are primarily 521
synthesized on the cytosolic side of cellular membranes whereas production of complex 522
sphingolipids is completed in the ER/Golgi, rendering the latter exposed to the outer 523
surface. In addition, sterols have higher affinity for sphingolipids than glycerolipids. This 524
out-of-equilibrium situation is maintained by the activity of lipid translocases, which 525
compensate for the slow spontaneous transverse diffusion of lipids (Devaux and Morris, 526
2004). 527
To build a model of plant PM, we used the results of the present paper, and those 528
obtained by Tjellström and collaborators (2010) who showed that there is a transversal 529
lipid asymmetry in root plant PM. They calculated that the distribution 530
cytosolic/apoplastic leaflet was 65:35 for phospholipids, 30:70 for total sterols, and 30:70 531
for GluCer. DGDG is exclusively located in the inner leaflet (Tjellstrom et al., 2010). 532
Here, we considered that the glycerophospholipid-rich inner leaflet is unsaturated and 533
www.plantphysiol.orgon September 15, 2018 - Published by Downloaded from Copyright © 2015 American Society of Plant Biologists. All rights reserved.
20
that plant phosphatidylserine (PS) and polyphosphoninositides (e.g. PIP2) were 534
exclusively present in the inner leaflet, as described in animal models (Di Paolo and De 535
Camilli, 2006). As Filipin III labeling used to assess sterol distribution could not 536
discriminate between free sterols and sterol derivatives (ASG and SG) (Tjellstrom et al., 537
2010), we drew free sterols, SG and ASG equivalently distributed between the two 538
leaflets, with a molar ratio for sterols of 30:70, in:out. 539
We tried to experimentally access the distribution of GIPCs in the PM. We treated Right 540
Side Out (RSO) and In Side Out (ISO) vesicles with Sphingolipid ceramide N-deacylase 541
(SCD) enzyme able to hydrolyze GIPCs (Blaas and Humpf, 2013), as described with 542
phospholipase A2 for phospholipid asymmetrical distribution (Tjellstrom et al., 2010). In 543
our hands, no GIPC hydrolysis occurred (data not shown). Nevertheless, we reasonably 544
hypothesized that GIPCs are exclusively located in the apoplastic face for different 545
independent reasons: 1/ the two first steps of the GIPC synthesis (IPC synthase and 546
glucuronic transferase) occur in the Golgi apparatus (Wang et al., 2008); (Rennie et al., 547
2014); 2/ The mannosylation of series A of GIPC to build series B is dependent of the 548
GDP-mannose transporter GOLGI-LOCALIZED NUCLEOTIDE SUGAR 549
TRANSPORTER (GONST1), suggesting a luminal glycosylation of GIPCs so that the 550
polar heads is exposed in the outer leaflet of the PM after vesicular fusion (Mortimer et 551
al., 2013); 3/ GIPCs are structurally homologs to gangliosides, exclusively present in the 552
outer leaflet of the PM in animal cells (Sonnino and Prinetti, 2010); 4/ it is very unlikely 553
that GIPCs may spontaneously flip-flop in the PM because of the size and polarity of 554
their heads and 5/ immunogold labeling of GIPCs (series B-F) on PM vesicles seems to 555
be unilaterally distributed mainly outside of the PM vesicles (Fig. 6). 556
Saturated very long chain fatty acid of GIPCs interdigitate the two leaflets 557
A key question in understanding the functional role of the PM is whether lipids of the 558
outer leaflet are coupled to those of the inner leaflet. Plant GIPCs exhibit a high content 559
of VLCFA that can be hydroxylated on carbon 2. The presence of VLCFA in DIMs was 560
recently observed in bean and maize DIMs (Carmona-Salazar et al., 2015). Here, the 561
modeling approach suggests a strong and stable interdigitation of (h)VLCFA of GIPCs 562
from the outer leaflet into the inner leaflet by 6-7 carbon atoms (Fig. 9B). VLCFA are 563
also abundant in sphingolipids in animal cells. It has been proposed that lipid bilayer 564
www.plantphysiol.orgon September 15, 2018 - Published by Downloaded from Copyright © 2015 American Society of Plant Biologists. All rights reserved.
21
organization of the stratum corneum could be stabilized by a partial interdigitation 565
between the two leaflets (Ruettinger et al., 2008). Interdigitation of long chain fatty acid 566
residues between complex lipids might thus represents a common feature in plants and 567
animals that allows a higher thermal stability of the outer leaflet, as described in artificial 568
asymmetrical liposomes prepared with animal lipids (Cheng et al., 2009). 569
570
GIPCs are able to organize in liquid-ordered domains with sterols 571
Tobacco cells produce several hundred GIPCs of different structures, (see Fig. 2, and 572
Cacas et al., 2013), with the same ceramide moiety and a variable glycan part. 573
Publication of the 70’s suggest that up to 20 sugars can be added to the GIPC core 574
structure, but little is known about such molecule (Kaul and Lester, 1975). In this paper, 575
we demonstrated that GIPCs with more than two sugars are enriched in DIMs (Fig 2C) 576
and these complex sphingolipids cluster in domains of 35 nm (Fig. 6). In addition, we 577
showed that 2-hydroxylated-containing GIPCs were enriched in DIMs (Fig. 1B). This 578
result is coherent with biophysical studies where raft phase separation is favored by the 579
fact that sphingolipids, as ceramide-based amphipathic lipids, can create a network of 580
hydrogen bonds due to the presence of the amide nitrogen, the carbonyl oxygen and the 581
hydroxyl group positioned in proximity of the water/ lipid interface of the bilayer 582
(Pascher, 1976). In addition, GIPC’s LCB being dominated by tri-hydroxylated LCBs 583
(Figs S6), the presence of two additional hydroxyl groups at the interface may be of 584
importance for sphingolipid/phytosterol interactions. The contribution of hydrogen bonds 585
between lipids stabilizing a more rigid segregated phase in the bilayer is energetically 586
remarkable (Quinn and Wolf, 2009). We recently showed that GIPCs enhance the sterol-587
induced ordering effect by stimulating the formation of and increasing the size of sterol-588
dependent ordered membrane domains (Grosjean et al., 2015), suggesting a strong 589
interaction between phytosterols and GIPCs leading to a well defined Lo phase 590
separation. Docking calculation between phytosterols and GIPCs showed that the 591
interaction is mostly of hydrophobic and Van der Waals types (Fig. 9C). Hence, the closer 592
the molecules are, the stronger the interaction is. This aspect is also pointed by Langmuir 593
monolayers’ experiments, where we measured an attractive interaction between GIPCs 594
and phytosterols at a molar ratio of 85:15 (Fig. 8). Finally, interdigitated hydrocarbon 595
www.plantphysiol.orgon September 15, 2018 - Published by Downloaded from Copyright © 2015 American Society of Plant Biologists. All rights reserved.
22
chains may play a role in the stabilization of lipid domains, as reviewed in (Sonnino and 596
Prinetti, 2010). 597
A model summarizing these data is presented in the figure 10. To build this model, the 598
molar composition of lipids from BY-2 PM (Fig. 4) and information presented above 599
were considered. This model emphasizes the strong enrichment of GIPCs in the 600
apoplastic phase of the PM. In accordance with this assumption, only little space would 601
be left in the outer leaflet for phospholipids, which consequently are concentrated on the 602
cytoplasmic leaflet. Polyglycosylated GIPCs cluster with sterols in domains of ca. 35nm 603
in the outer leaflet, and polyphosphoinositide-enriched domain are present in the inner 604
leaflet according to our previous work (Furt et al., 2010). 605
606
Are rafts in the two leaflets coupled? 607
Plant GIPCs are clearly involved in raft formation, and rafts exist in both external and 608
internal leaflets of the plant PM (Raffaele et al., 2009); (Furt et al., 2010); (Mongrand et 609
al., 2010). “Biological rafts” are likely of nanometer scale and certainly differ in size and 610
stability in the two monolayers. It is not known whether they overlap so that they are 611
coupled functionally and structurally (Eisenberg et al., 2006); (Subczynski and Kusumi, 612
2003). By exploring this possibility, one could shed light on how cues are transmitted 613
through the bilayer. Does the clustering of proteins or lipids in the outer leaflet trigger the 614
re-arrangement of downstream proteins or lipids in the inner leaflet (Kinases, 615
phosphatases, small G proteins, PIP2…), leading to signal transduction and 616
amplification? Can rafts in the outer leaflet enriched in GIPCs and sterols mirrored by 617
PIP2-enriched cytoplasmic leaflet rafts, as represented in figure 10? What could be the 618
role of FA interdigitation and lipid asymmetry in plants, and how is this process 619
regulated? Proteins -omitted in our model- will certainly influence raft composition, size, 620
shape and overall physical properties, independently of thermodynamic considerations of 621
the pure lipid phases (Devaux and Morris, 2004). This last aspect remains to be fully 622
elucidated in plant PM. 623
624
CONCLUSIONS 625
www.plantphysiol.orgon September 15, 2018 - Published by Downloaded from Copyright © 2015 American Society of Plant Biologists. All rights reserved.
23
In plants, GIPCs have been shown to be involved in early stages of symbiosis (Hernandez 626
et al., 1995), in Golgi and ER integrity (Chen et al., 2008), growth and hypersensitive 627
response through salicylic acid production (Mortimer et al., 2013). A recent study on cell 628
wall rhamnogalacturonan II (RG-II) showed that GIPCs are able to bind RG-II, possibly 629
via a Boron bridge, and that they can favor the Boron-dependent dimerisation of RG-II 630
(Voxeur and Fry, 2014). Cell wall is an important feature in regulating protein lateral 631
mobility. In plant cells, turgor pressure tightly pressed PM against cell wall. Martinière 632
and collaborators, 2012 showed that this intimate connection affects protein lateral 633
mobility including the one in the inner leaflet. This suggests that the plant cell wall, and 634
by extension the continuum between the PM and the cell wall, influences protein lateral 635
mobility (Martiniere et al., 2012). This regulation of protein lateral mobility by the cell 636
wall certainly plays a role in plant cellular processes. GIPCs may also be important 637
determinants in cell signaling, cell-to-cell communication, plant defense and the sorting 638
of proteins, as it is also described for complex sphingolipids in animal development 639
(Worrall et al., 2003). The link between outer leaflet lipids and the cell wall also deserves 640
to be fully investigated. Finally, apoplastic leaflet that contains high ordered-forming 641
lipids (GIPC/phytosterols) likely represents physical barrier involved in maintenance of 642
thermal tolerance (Cheng et al., 2009), cell integrity and responses to pathogens. 643
Preparation of asymmetric vesicles that mimic the plant PM will be of great interest to 644
study this coupling, the effect of lipid raft formation and the distribution of 645
transmembrane protein helices (Cheng et al., 2009). In animals, alteration of lipid 646
asymmetry plays a prominent role during cell fusion, activation of the coagulation 647
cascade and, recognition and removal of apoptotic cell. Our work should pave the way to 648
address such questions in plants. 649
650
www.plantphysiol.orgon September 15, 2018 - Published by Downloaded from Copyright © 2015 American Society of Plant Biologists. All rights reserved.
24
MATERIAL and METHODS 651
Materials—High-performance thin-layer chromatography (HP-TLC) plates were 652
Silicagel 60 F254 (Merck, Rahway, NJ). 653
654
Plant Materials—Leaves were obtained from 8-week-old tobacco plants (Nicotiana 655
tabacum cv. Xanthi) grown in a growth chamber at 25°C under 16/8-h day/night 656
conditions. Wild type BY-2 cells (Nicotiana. tabacum cv. Bright Yellow 2) and Vitis 657
vinifera L. cv ‘Cabernet Sauvignon’ (CS6) were grown as previously described in (Morel 658
et al., 2006) and (Cacas et al., 2013). 659
660
Preparation and Purity of Tobacco PM—All steps were performed at 4°C. PMs were 661
obtained after cell fractionation according to (Mongrand et al., 2004) by partitioning in an 662
aqueous polymer two-phase system with polyethylene glycol /dextran. 663
664
Fatty acids Analysis— Each sample was transmethylated at 110°C overnight in 665
methanol containing 5% (v/v) sulfuric acid and spiked with 10 µg of heptadecanoic acid 666
(c17:0) and 10 µg of 2-hydroxy-tetradecanoic acid (h14:0) as internal standards. After 667
cooling, 3 mL of NaCl (2.5%, w/v) were added, and the released fatty acyl chains were 668
extracted in hexane. Extracts were washed with 3 mL of saline solution (200 mM NaCl, 669
200 mM Tris, pH 8.0), dried under a gentle stream of nitrogen, and dissolved in 150 µL 670
of BSTFA (N,O-bis(trimethylsilyl) trifluoroacetamide) and TMCS 671
(trimethylchlorosilane). Free hydroxyl groups were derivatized at 110°C for 30 min, 672
surplus BSTFA-TMCS was evaporated under nitrogen, and samples were dissolved in 673
hexane for analysis using GC-MS under the same conditions as described in (Bure et al., 674
2011). Quantification of fatty acids and hydroxyl acids was based on peak areas, which 675
were derived from Total Ion Current (Rehman et al.), and using the respective internal 676
standards. 677
678
Sphingoid Base (LCB) Analysis—Samples were heated at 110C for 24 h with 4 mL of 679
dioxane (Sigma) plus 3.5 mL of 10% (w/v) aqueous Ba(OH)2 (Sigma). The sphingoid 680
bases were oxidized to their corresponding aldehydes by stirring the sample with 100 µL 681
www.plantphysiol.orgon September 15, 2018 - Published by Downloaded from Copyright © 2015 American Society of Plant Biologists. All rights reserved.
25
of 0.2 M sodium periodate (Sigma) at room temperature for 1 h in the dark. The 682
aldehydes were recovered by hexane extraction and used directly for GC analysis as 683
described in (Cacas et al., 2012a). 684
685
Extraction of total polar lipids; Set up of lipid extraction protocol for total polar 686
lipids in plants—Membrane fractions (100-200µg) or grape cell culture (ca. 20 mg of 687
lyophilized materiel) were extracted according to three independent methods: Extraction 688
#1: 3.5 mL of chloroform/methanol/HCl (200/100/1, v/v/v) supplemented with 0.01% 689
butylatedhydroxytoluene (BHT) (w/v) were incubated with the sample. Then, 2mL of 690
NaCl 0.9% (w/v) were added, vortexed for 5 min and centrifuged. The lower organic 691
phase was collected, and the higher phase was re-extracted once with 4 mL of pure 692
chloroform. Extraction #2: 3.5 mL of Methyl tert-butyl ether (MTBE)/methanol/water 693
(100/30/25, v/v/v) supplemented with 0,01% BHT (w/v) were incubated with the sample. 694
Then, 2ml of NaCl 0.9% was added, vortexed for 5 min and centrifuged. The upper 695
organic phase was collected, and the lower phase was re-extracted once with 4 mL of 696
pure MTBE. In both extractions, the organic phases were combined and dried. The 697
aqueous phases were dried to remove any trace of organic solvent, resuspended in 1mL 698
of pure water, and GIPCs were back-extracted twice by 1 mL butanol-1. Extraction #3 699
adapted from (Markham et al., 2006): 3.5 mL of (lower phase of propan-2-700
ol/hexane/water, 55:20:25 (v/v/ v)) were incubated with the sample. The sample was 701
incubated at 60 °C for 15 min with occasional shaking. The extract was spun at 500 g 702
while still warm, and the supernatant was transferred to a fresh tube. The pellet was 703
extracted once more, each time with 3.5 mL of extraction solvent, and the supernatants 704
were combined and dried. The pellet was dried to remove any trace of organic solvent, 705
resuspended in 1mL of pure water, and GIPC were back-extracted twice by 1mL butanol-706
1. Extracted lipids were dissolved in chloroform /methanol/water (30/60/8, v/v/v) for 707
storage. Alternatively, before lipid extraction, biological samples were transferred to 708
isopropanol (3mL) with 0.01% BHT at 75 °C and incubated for 15 min to inhibit lipase 709
activity. 710
The rationale for the three lipid extraction protocols is presented in Fig. S10A in 711
supplemental data. We used lyophilized grape cell culture (Vitis vinifera), previously 712
www.plantphysiol.orgon September 15, 2018 - Published by Downloaded from Copyright © 2015 American Society of Plant Biologists. All rights reserved.
26
shown to contain similar (h)VLFCA and GIPCs as tobacco cells (Cacas et al., 2013), see 713
Supplemental Fig. S10B. We first compared Folch protocol (Extraction #1) and MTBE 714
extraction (Extraction #2) followed by butanol-1 extraction of the aqueous phase, with 715
Markahm protocol (Extraction #3) shown to fully extract plant sphingolipids (Fig. 4B) 716
(Markham et al., 2006). Results of Fig. S10C middle showed that all the classes of lipids 717
were extracted with no significant differences between the three different protocols. We 718
performed a HP-TLC plate to test the integrity of polar lipids, and we observed, as often 719
described during plant lipid extraction, a major activation of Phospholipase D leading to 720
the conversion of phospholipids into Phosphatidic Acid, PA (Supplemental Fig. S10D). 721
To circumvent this problem, we boiled the lyophilized grape cells in hot isopropanol, and 722
further extracted with the three protocols. To our surprise, all the polar lipids including 723
VLCFA-containing GIPCs were extracted without the need of the second extraction step 724
by butanol-1 of the aqueous phase (Fig. S10C right). As expected, no degradation of 725
phospholipids was anymore observed on TLC plates (see Supplemental Fig. S10D). 726
727
Extraction and purification of GIPCs by DEAE chromatography —GIPCs were 728
purified according to (Bure et al., 2011) and (Grosjean et al., 2015) to obtain milligram 729
amount. Alternatively, GIPCs were purified DEAE chromatography. DEAE Sephadex 730
DE-52 (Whatman pre-swollem, µgranular) was suspended in chloroform/ methanol/water 731
(30:60:8, v/v/v) supplemented with 1M ammonium acetate. A glass column (40 cm high, 732
2.2 cm of diameter) was plugged by defatted cotton, filled with DEAE Sephadex and 733
washed with 600 mL of chloroform/ methanol/water (30:60:8, v/v/v). GIPC whitish pellet 734
extracted from BY-2 cell culture was dissolved in 10 ml of chloroform/methanol/water 735
(30:60:8, v/v/v) and loaded on the column. The column was washed with 800 ml of 736
chloroform/ methanol/water (30:60:8, v/v/v) for removal of neutral compounds: fractions 737
1-8. The fractions were sequentially eluted with 500 mL of chloroform/ methanol/water 738
(30:60:8, v/v/v) supplemented with 5 mM ammonium acetate: fractions 9-14, 10 mM 739
ammonium acetate: fractions 15-20; 25 mM ammonium acetate: fractions 21-28; 50 mM 740
ammonium acetate: fractions 29-35; 100 mM ammonium acetate: fractions 36-43; 250 741
mM ammonium acetate: fractions 44-49, see Fig. S11 in supplemental information. The 742
purification process was monitored by on HP-TLC impregnated with freshly prepared 0.2 743
www.plantphysiol.orgon September 15, 2018 - Published by Downloaded from Copyright © 2015 American Society of Plant Biologists. All rights reserved.
27
M ammonium acetate dissolved in methanol, and chromatographed in chloroform/ 744
methanol/ NH4OH (4N in water) (9:7:2, v/v). Lipids were visualized by spraying plates 745
with primuline. GIPC-containing fractions were dissolved in water, and dialyzed against 746
water at 4 °C for two days to remove ammonium acetate (Spectra/Por Dialysis 747
Membrane, MWCO 3500). The water was changed every 6h. The desalted fractions were 748
dried and dissolved in a volume of 3 mL of chloroform/methanol/water (30:60:8, v/v/v), 749
and stored at 4°C. 750
751
Generation of rabbit polyclonal antibodies to GIPC—Preparation of liposomes: 752
Liposomes were prepared essentially as described previously (Richards et al., 1998). 753
Liposomes for the primary immunization were composed of purified BY-2 cell GIPCs 754
(series A or mix of series B-E), phosphatidylcholine, phosphatidylglycerol, cholesterol in 755
mole ratios of 0.9 / 0.1 / 0.75. Lipid A was included in the liposomes at 20 nmol of lipid 756
A per µmol of phospholipid. Lipids were dried from chloroform/Methanol/water 30/60/8 757
solution. The liposomes were swollen in 1 mL of TBS by vigorous shaking in a vortex 758
mixer, and sonicated at room temperature for 30 min. Immunization of rabbits: Rabbits 759
were immunized four times at 0, 21, 42 days (COVALAB - France Biotechnologies, 760
France). Preimmune serum compare with 53 days post injection serum were analyzed. 761
762
Immunogold labeling of purified plant plasma membranes— Labeling was performed 763
on purified BY-2 cell PM vesicles according to (Noirot et al., 2014). Immunological 764
reaction on grids was performed for 1h with rabbit polyclonal antibody against 765
polyglycosylated GIPCs (46) diluted 1/40 which was revealed with a goat anti-rabbit IgG 766
conjugate (Aurion, Wageningen, The Netherlands) labeled to 6-nm colloidal gold 767
particles. Three independent experiments using three independent biochemical PM 768
purifications from BY-2 cells were recorded. For each experiment, 3 replicates of 769
immunolabeling and 2 replicates of each control sample (omission of the primary 770
antibody and use of the preimmune) were observed with a Hitachi H7500 transmission 771
electron microscope equipped with an AMT camera driven by AMT software. In order to 772
characterize the distribution of the detected antigen on PM vesicle surface, the density of 773
labeling was evaluated by counting the number of colloidal gold particles per labeled 774
www.plantphysiol.orgon September 15, 2018 - Published by Downloaded from Copyright © 2015 American Society of Plant Biologists. All rights reserved.
28
vesicle. Groups of gold labeling were visualized and size(s) of the cluster(s) were 775
measured on each labeled vesicle with the AMT software. Proportions of gold particles in 776
groups and of isolated gold particles were evaluated. Counting and measurement were 777
performed on 49 pictures of PM vesicles from the three independent experiments. The 778
spatial distribution was determined as described in (Noirot et al., 2014) using the Ripley 779
function (Ripley, 1976). 780
781
Order Level Measurement of Artificial Membranes—Preparation of LUVs and 782
Fluorescence spectroscopy, membrane order level Measurement were as described in 783
(Grosjean et al., 2015) 784
785
Home made Lipid-blot— Immun-Blot PVDF Membrane (Bio-rad) were activated with 786
methanol for 30 sec. GIPC DEAE fractions (3µl) were deposited and let dried. 787
Membranes were further re-activated in methanol for 2 sec, blocked in TBS 788
supplemented with 5% de-fatted BSA for 1 h. Antibodies to GIPC (dilution 1/100) were 789
incubated for 1h at room temperature, membranes were then rinsed three times with TBS 790
supplemented with 0.1% (v/v) Tween 20, and revealed with anti-rabbit secondary 791
antibodies coupled to horse-radish peroxidase (1/100). 792
793
ELISA— All steps were performed at 37°C. ELISA plate were filled with or without 794
500ng of BY-2 cell PM vesicles in 0,1mL PBS for 2h, then blocked for 2h with 1% BSA 795
in PBS. Anti-GIPC antibodies (dilution 1/50 for sera or 1/100 for purified IgG) were 796
incubated for 1h and revealed with anti-rabbit secondary antibodies coupled to alkaline 797
phosphatase (1/5000). Reaction with p-Nitrophenyl Phosphate (0,01% in 10% 798
diethanolamine buffer) was read at 405 nm after 1h. 799
800
Langmuir trough—Total BY-2 GIPC (molecular weight, ca. 1260 g/mol) was used in 801
this study. A solution at 0.39mM in chloroform/methanol/water (30/60/8) was prepared. 802
Sitosterol was purchased from Avanti Polar Lipids (Alabaster, USA). It was dissolved at 803
0.39 mM in chloroform/methanol (2/1). The Π–A isotherms were recorded by means of 804
an automated Langmuir trough (KSV Minitrough, width: 75 mm, area: 24.225 mm², KSV 805
www.plantphysiol.orgon September 15, 2018 - Published by Downloaded from Copyright © 2015 American Society of Plant Biologists. All rights reserved.

29
Instruments, Helsinki, Finland) equipped with a platinum plate attached to a Wilhelmy 806
type balance. The GIPC sample was heat up at 60°C for 15 minutes for a better 807
solubilization. Pure solutions and (0.15/0.85) molar mixtures of Sitosterol/GIPC were 808
spread (fixed volume of 30µL) as tiny droplets to produce a uniform monolayer on a 809
Tris/NaCl 10/150 mM (Millipore Co., Milford, MA) subphase adjusted at pH 7 with HCl. 810
After evaporation of the solvent (15 min), monolayers were compressed at a rate of 5 811
mm/min and at a temperature of 22 ± 1° °C. Before each experiment, the cleanliness of 812
the system was confirmed by checking the surface pressure over the surface compression 813
of the pure subphase. The reproducibility of the Π–A isotherms was checked by repeated 814
recordings and the relative standard deviation in surface pressure and area was found to 815
be ≤3%. 816
817
Molecular modeling approaches—The conformation of GIPC sitosterol and 818
glucosylceramide (d18:2(delta4, delta8)/h16:0) was calculated using the structure tree 819
procedure, as described elsewhere (Lins et al., 1996). The Hypermatrix (HM) docking 820
procedure was used to study the monolayer formed by GIPC and its interaction with 821
sitosterol, as already described (Lins et al., 1999) (Fa et al., 2007) (Bensikaddour et al., 822
2008) and reviewed recently, (Deleu et al., 2014). Briefly, one GIPC molecule is 823
positioned and fixed for the whole calculation at the center of the system, oriented at the 824
hydrophobic (Haimi et al.)/hydrophilic (phi) interface (Brasseur, 1990). The interacting 825
GIPC (for GIPC monolayer) or sitosterol (for mixed monolayer) is also oriented at the 826
pho/phi interface and, by rotations and translations, more than 107 positions of the 827
interacting molecule around the central molecule are calculated. The energy values 828
together with the coordinates of all assemblies are stored in a matrix and classified 829
according to decreasing values. The most stable matching is used to decide the position 830
of the first interacting molecule. The position of the second one is then defined as the 831
next most energetically favorable orientation stored in the matrix taking steric and 832
energetic constraints due to the presence of the first molecule into account. The process 833
ends when the central molecule is completely surrounded with the other molecule. In this 834
method, the lipid/water interface was taken into account by linearly varying the dielectric 835
constant ε between 3 (above the interface) and 30 (below the interface) and an empirical 836
www.plantphysiol.orgon September 15, 2018 - Published by Downloaded from Copyright © 2015 American Society of Plant Biologists. All rights reserved.
30
equation for the hydrophobic energy is added in the force field, as described in (Lins and 837
Brasseur, 1995). The mean area occupied by one molecule in the complex was estimated 838
by projection on the x-y plane using a grid of 1 Å square. 839
To calculate the insertion of GIPCs or Soy bean glucosylceramide into an implicit 840
simplified bilayer, we used the IMPALA method described previously (Ducarme et al., 841
1998). Briefly, this method simulates the insertion of any molecule into a bilayer by 842
adding energy restraint functions to the usual energy description of molecules. The lipid 843
bilayer is defined by C(z), which represents an empirical function describing membrane 844
properties. This function is constant in the membrane plane (x- and y- axes) but varies 845
along the bilayer thickness (z-axis). Two restraints simulate the membrane, one the 846
bilayer hydrophobicity (Epho), and the other, the lipid perturbation (Elip). All the 847
equations were described elsewhere (Ducarme et al., 1998). The method was notably 848
successfully applied to small helical peptides of known configurations (Lins et al., 2001). 849
It provides insights of the behavior of peptide dynamics that cannot be obtained with 850
statistical approaches. All calculations were performed on a Linux station bi-xeon quad 851
core, using the home-designed Z-ultime software. 852
853
www.plantphysiol.orgon September 15, 2018 - Published by Downloaded from Copyright © 2015 American Society of Plant Biologists. All rights reserved.
31
ACKNOWLEDGEMENTS 854
We thank Yohann Boutté and Patrick Moreau (LBM, Bordeaux) for critical reading of 855
the manuscript. We thank Michel Laguerre (IECB, Bordeaux) for the modelisation of 856
series A tobacco GIPC, Elodie Noirot (PF DimaCell, UMR Agroécologie, Dijon) and 857
Kiên Kiêu (INRA, UR341 Mathématiques et Informatique Appliquées, Jouy-en-Josas) 858
for spatial statistical analysis. We also acknowledge Paul Gouguet (LBM, Bordeaux) 859
Bernadette Codeville (Unité de Glycobiologie, Villeneuve d'Ascq) for the help in GIPC 860
purification, Veronique Aubert for her help in microscopy studies (PF DimaCell, UMR 861
Agroécologie), and Michel Ponchet (Institut Sophia Agrobiotech) for providing tobacco 862
leaves, and Yann Guérardel for the purification material (Unité de Glycobiologie, 863
Villeneuve d'Ascq). 864
www.plantphysiol.orgon September 15, 2018 - Published by Downloaded from Copyright © 2015 American Society of Plant Biologists. All rights reserved.
32
LITERATURE CITED 865
Bensikaddour, H., Fa, N., Burton, I., Deleu, M., Lins, L., Schanck, A., Brasseur, R., 866
Dufrene, Y.F., Goormaghtigh, E., and Mingeot-Leclercq, M.P. (2008). 867
Characterization of the interactions between fluoroquinolone antibiotics and 868
lipids: a multitechnique approach. Biophysical journal 94, 3035-3046. 869
Blaas, N., and Humpf, H.U. (2013). Structural profiling and quantitation of glycosyl 870
inositol phosphoceramides in plants with Fourier transform mass spectrometry. 871
Journal of agricultural and food chemistry 61, 4257-4269. 872
Borner, G.H., Sherrier, D.J., Weimar, T., Michaelson, L.V., Hawkins, N.D., 873
Macaskill, A., Napier, J.A., Beale, M.H., Lilley, K.S., and Dupree, P. (2005). 874
Analysis of detergent-resistant membranes in Arabidopsis. Evidence for plasma 875
membrane lipid rafts. Plant physiology 137, 104-116. 876
Brasseur, R. (1990). TAMMO: theoretical analysis of membrane molecular 877
organisation,. In Mol. Descr. Biol. Membr. Components by Comput. Conform. 878
Anal., (CRC Press, Boca Raton), pp. pp. 203–219. 879
Bure, C., Cacas, J.L., Wang, F., Gaudin, K., Domergue, F., Mongrand, S., and 880
Schmitter, J.M. (2011). Fast screening of highly glycosylated plant sphingolipids 881
by tandem mass spectrometry. Rapid communications in mass spectrometry : 882
RCM 25, 3131-3145. 883
Cacas, J.L., Melser, S., Domergue, F., Joubes, J., Bourdenx, B., Schmitter, J.M., and 884
Mongrand, S. (2012a). Rapid nanoscale quantitative analysis of plant 885
sphingolipid long-chain bases by GC-MS. Analytical and bioanalytical chemistry 886
403, 2745-2755. 887
Cacas, J.L., Bure, C., Furt, F., Maalouf, J.P., Badoc, A., Cluzet, S., Schmitter, J.M., 888
Antajan, E., and Mongrand, S. (2013). Biochemical survey of the polar head of 889
plant glycosylinositolphosphoceramides unravels broad diversity. Phytochemistry 890
96, 191-200. 891
Cacas, J.L., Furt, F., Le Guedard, M., Schmitter, J.M., Bure, C., Gerbeau-Pissot, P., 892
Moreau, P., Bessoule, J.J., Simon-Plas, F., and Mongrand, S. (2012b). Lipids 893
of plant membrane rafts. Progress in lipid research 51, 272-299. 894
Carmona-Salazar, L., El Hafidi, M., Gutierrez-Najera, N., Noyola-Martinez, L., 895
Gonzalez-Solis, A., and Gavilanes-Ruiz, M. (2015). Fatty acid profiles from the 896
plasma membrane and detergent resistant membranes of two plant species. 897
Phytochemistry 109, 25-35. 898
Carter, H.E., Gigg, R.H., Law, J.H., Nakayama, T., and Weber, E. (1958). 899
Biochemistry of the sphingolipides. XI. Structure of phytoglycolipide. The 900
Journal of biological chemistry 233, 1309-1314. 901
Cheng, H.T., Megha, and London, E. (2009). Preparation and properties of asymmetric 902
vesicles that mimic cell membranes: effect upon lipid raft formation and 903
transmembrane helix orientation. The Journal of biological chemistry 284, 6079-904
6092. 905
Deleu, M., Crowet, J.M., Nasir, M.N., and Lins, L. (2014). Complementary 906
biophysical tools to investigate lipid specificity in the interaction between 907
bioactive molecules and the plasma membrane: A review. Biochimica et 908
biophysica acta 1838, 3171-3190. 909
www.plantphysiol.orgon September 15, 2018 - Published by Downloaded from Copyright © 2015 American Society of Plant Biologists. All rights reserved.
33
Deleu, M., Nott, K., Brasseur, R., Jacques, P., Thonart, P., and Dufrene, Y.F. (2001). 910
Imaging mixed lipid monolayers by dynamic atomic force microscopy. 911
Biochimica et biophysica acta 1513, 55-62. 912
Devaux, P.F., and Morris, R. (2004). Transmembrane asymmetry and lateral domains in 913
biological membranes. Traffic 5, 241-246. 914
Di Paolo, G., and De Camilli, P. (2006). Phosphoinositides in cell regulation and 915
membrane dynamics. Nature 443, 651-657. 916
Ducarme, P., Rahman, M., and Brasseur, R. (1998). IMPALA: a simple restraint field 917
to simulate the biological membrane in molecular structure studies. Proteins 30, 918
357-371. 919
Eeman, M., Deleu, M., Paquot, M., Thonart, P., and Dufrene, Y.F. (2005). Nanoscale 920
properties of mixed fengycin/ceramide monolayers explored using atomic force 921
microscopy. Langmuir : the ACS journal of surfaces and colloids 21, 2505-2511. 922
Eisenberg, S., Shvartsman, D.E., Ehrlich, M., and Henis, Y.I. (2006). Clustering of 923
raft-associated proteins in the external membrane leaflet modulates internal leaflet 924
H-ras diffusion and signaling. Molecular and cellular biology 26, 7190-7200. 925
Fa, N., Lins, L., Courtoy, P.J., Dufrene, Y., Van Der Smissen, P., Brasseur, R., 926
Tyteca, D., and Mingeot-Leclercq, M.P. (2007). Decrease of elastic moduli of 927
DOPC bilayers induced by a macrolide antibiotic, azithromycin. Biochimica et 928
biophysica acta 1768, 1830-1838. 929
Fang, K., Zou, G., and He, P. (2003). Dynamic viscoelastic properties of spread 930
monostearin monolayer in the presence of glycine. Journal of colloid and interface 931
science 266, 407-414. 932
Frazier, Z., and Alber, F. (2012). A computational approach to increase time scales in 933
Brownian dynamics-based reaction-diffusion modeling. Journal of computational 934
biology : a journal of computational molecular cell biology 19, 606-618. 935
Furt, F., Simon-Plas, F., and Mongrand, S. (2011). Lipids of the plasma membrane. In 936
The Plant Plasma Membrane. Plant Cell Monographs 19., A.S. Murphy, P. 937
Wendy, and B. Schulz, eds (Heidelberg: Springer-Verlag), pp. 3-30. 938
Furt, F., Konig, S., Bessoule, J.J., Sargueil, F., Zallot, R., Stanislas, T., Noirot, E., 939
Lherminier, J., Simon-Plas, F., Heilmann, I., and Mongrand, S. (2010). 940
Polyphosphoinositides are enriched in plant membrane rafts and form 941
microdomains in the plasma membrane. Plant physiology 152, 2173-2187. 942
Gaines, G.L. (1966). Insoluble Monolayers at liquid-gas Interfaces ( 943
Garssen, M.P., van Koningsveld, R., van Doorn, P.A., Merkies, I.S., Scheltens-de 944
Boer, M., van Leusden, J.A., van Schaik, I.N., Linssen, W.H., Visscher, F., 945
Boon, A.M., Faber, C.G., Meulstee, J., Prick, M.J., van den Berg, L.H., 946
Franssen, H., Hiel, J.A., van den Bergh, P.Y., and Sindic, C.J. (2007). 947
Treatment of Guillain-Barre syndrome with mycophenolate mofetil: a pilot study. 948
Journal of neurology, neurosurgery, and psychiatry 78, 1012-1013. 949
Grosjean, K., Mongrand, S., Beney, L., Simon-Plas, F., and Gerbeau-Pissot, P. 950
(2015). Differential effect of plant lipids on membrane organization: hot features 951
and specificities of phytosphingolipids and phytosterols. The Journal of biological 952
chemistry. 953
Haimi, P., Uphoff, A., Hermansson, M., and Somerharju, P. (2006). Software tools 954
for analysis of mass spectrometric lipidome data. Anal Chem 78, 8324-8331. 955
www.plantphysiol.orgon September 15, 2018 - Published by Downloaded from Copyright © 2015 American Society of Plant Biologists. All rights reserved.
34
Hernandez, L.E., Perotto, S., Brewin, N.J., and Drobak, B.K. (1995). A novel 956
inositol-lipid in plant-bacteria symbiosis. Biochemical Society transactions 23, 957
582S. 958
Jacobson, K., Mouritsen, O.G., and Anderson, R.G. (2007). Lipid rafts: at a crossroad 959
between cell biology and physics. Nature cell biology 9, 7-14. 960
Jarsch, I.K., Konrad, S.S., Stratil, T.F., Urbanus, S.L., Szymanski, W., Braun, P., 961
Braun, K.H., and Ott, T. (2014). Plasma Membranes Are Subcompartmentalized 962
into a Plethora of Coexisting and Diverse Microdomains in Arabidopsis and 963
Nicotiana benthamiana. The Plant cell 26, 1698-1711. 964
Kaul, K., and Lester, R.L. (1975). Characterization of Inositol-containing 965
Phosphosphingolipids from Tobacco Leaves: Isolation and Identification of Two 966
Novel, Major Lipids: N-Acetylglucosamidoglucuronidoinositol 967
Phosphorylceramide and Glucosamidoglucuronidoinositol Phosphorylceramide. 968
Plant physiology 55, 120-129. 969
Lefebvre, B., Furt, F., Hartmann, M.A., Michaelson, L.V., Carde, J.P., Sargueil-970
Boiron, F., Rossignol, M., Napier, J.A., Cullimore, J., Bessoule, J.J., and 971
Mongrand, S. (2007). Characterization of lipid rafts from Medicago truncatula 972
root plasma membranes: a proteomic study reveals the presence of a raft-973
associated redox system. Plant physiology 144, 402-418. 974
Lins, L., and Brasseur, R. (1995). The hydrophobic effect in protein folding. FASEB 975
journal : official publication of the Federation of American Societies for 976
Experimental Biology 9, 535-540. 977
Lins, L., Charloteaux, B., Thomas, A., and Brasseur, R. (2001). Computational study 978
of lipid-destabilizing protein fragments: towards a comprehensive view of tilted 979
peptides. Proteins 44, 435-447. 980
Lins, L., Brasseur, R., Malaisse, W.J., Biesemans, M., Verheyden, P., and Willem, R. 981
(1996). Importance of the hydrophobic energy: structural determination of a 982
hypoglycemic drug of the meglitinide family by nuclear magnetic resonance and 983
molecular modeling. Biochemical pharmacology 52, 1155-1168. 984
Lins, L., Thomas-Soumarmon, A., Pillot, T., Vandekerchkhove, J., Rosseneu, M., 985
and Brasseur, R. (1999). Molecular determinants of the interaction between the 986
C-terminal domain of Alzheimer's beta-amyloid peptide and apolipoprotein E 987
alpha-helices. Journal of neurochemistry 73, 758-769. 988
Maget-Dana, R. (1999). The monolayer technique: a potent tool for studying the 989
interfacial properties of antimicrobial and membrane-lytic peptides and their 990
interactions with lipid membranes. Biochimica et biophysica acta 1462, 109-140. 991
Markham, J.E., Li, J., Cahoon, E.B., and Jaworski, J.G. (2006). Separation and 992
identification of major plant sphingolipid classes from leaves. The Journal of 993
biological chemistry 281, 22684-22694. 994
Martiniere, A., Lavagi, I., Nageswaran, G., Rolfe, D.J., Maneta-Peyret, L., Luu, 995
D.T., Botchway, S.W., Webb, S.E., Mongrand, S., Maurel, C., Martin-996
Fernandez, M.L., Kleine-Vehn, J., Friml, J., Moreau, P., and Runions, J. 997
(2012). Cell wall constrains lateral diffusion of plant plasma-membrane proteins. 998
Proceedings of the National Academy of Sciences of the United States of America 999
109, 12805-12810. 1000
www.plantphysiol.orgon September 15, 2018 - Published by Downloaded from Copyright © 2015 American Society of Plant Biologists. All rights reserved.
35
Masserini, M., Palestini, P., and Freire, E. (1989). Influence of glycolipid 1001
oligosaccharide and long-chain base composition on the thermotropic properties 1002
of dipalmitoylphosphatidylcholine large unilamellar vesicles containing 1003
gangliosides. Biochemistry 28, 5029-5034. 1004
Matyash, V., Liebisch, G., Kurzchalia, T.V., Shevchenko, A., and Schwudke, D. 1005
(2008). Lipid extraction by methyl-tert-butyl ether for high-throughput 1006
lipidomics. Journal of lipid research 49, 1137-1146. 1007
Mongrand, S., Stanislas, T., Bayer, E.M., Lherminier, J., and Simon-Plas, F. (2010). 1008
Membrane rafts in plant cells. Trends in plant science 15, 656-663. 1009
Mongrand, S., Morel, J., Laroche, J., Claverol, S., Carde, J.P., Hartmann, M.A., 1010
Bonneu, M., Simon-Plas, F., Lessire, R., and Bessoule, J.J. (2004). Lipid rafts 1011
in higher plant cells: purification and characterization of Triton X-100-insoluble 1012
microdomains from tobacco plasma membrane. The Journal of biological 1013
chemistry 279, 36277-36286. 1014
Morel, J., Claverol, S., Mongrand, S., Furt, F., Fromentin, J., Bessoule, J.J., Blein, 1015
J.P., and Simon-Plas, F. (2006). Proteomics of plant detergent-resistant 1016
membranes. Molecular & cellular proteomics : MCP 5, 1396-1411. 1017
Mortimer, J.C., Yu, X., Albrecht, S., Sicilia, F., Huichalaf, M., Ampuero, D., 1018
Michaelson, L.V., Murphy, A.M., Matsunaga, T., Kurz, S., Stephens, E., 1019
Baldwin, T.C., Ishii, T., Napier, J.A., Weber, A.P., Handford, M.G., and 1020
Dupree, P. (2013). Abnormal glycosphingolipid mannosylation triggers salicylic 1021
acid-mediated responses in Arabidopsis. The Plant cell 25, 1881-1894. 1022
Mouritsen, O.G. (2010). The liquid-ordered state comes of age. Biochimica et 1023
biophysica acta 1798, 1286-1288. 1024
Noirot, E., Der, C., Lherminier, J., Robert, F., Moricova, P., Kieu, K., Leborgne-1025
Castel, N., Simon-Plas, F., and Bouhidel, K. (2014). Dynamic changes in the 1026
subcellular distribution of the tobacco ROS-producing enzyme RBOHD in 1027
response to the oomycete elicitor cryptogein. Journal of experimental botany 65, 1028
5011-5022. 1029
Pascher, I. (1976). Molecular arrangements in sphingolipids. Conformation and 1030
hydrogen bonding of ceramide and their implication on membrane stability and 1031
permeability. Biochimica et biophysica acta 455, 433-451. 1032
Pata, M.O., Hannun, Y.A., and Ng, C.K. (2010). Plant sphingolipids: decoding the 1033
enigma of the Sphinx. The New phytologist 185, 611-630. 1034
Quinn, P.J., and Wolf, C. (2009). The liquid-ordered phase in membranes. Biochimica 1035
et biophysica acta 1788, 33-46. 1036
Raffaele, S., Bayer, E., Lafarge, D., Cluzet, S., German Retana, S., Boubekeur, T., 1037
Leborgne-Castel, N., Carde, J.P., Lherminier, J., Noirot, E., Satiat-1038
Jeunemaitre, B., Laroche-Traineau, J., Moreau, P., Ott, T., Maule, A.J., 1039
Reymond, P., Simon-Plas, F., Farmer, E.E., Bessoule, J.J., and Mongrand, S. 1040
(2009). Remorin, a solanaceae protein resident in membrane rafts and 1041
plasmodesmata, impairs potato virus X movement. The Plant cell 21, 1541-1555. 1042
Rehman, R.U., Stigliano, E., Lycett, G.W., Sticher, L., Sbano, F., Faraco, M., 1043
Dalessandro, G., and Di Sansebastiano, G.P. (2008). Tomato Rab11a 1044
characterization evidenced a difference between SYP121-dependent and SYP122-1045
dependent exocytosis. Plant Cell Physiol 49, 751-766. 1046
www.plantphysiol.orgon September 15, 2018 - Published by Downloaded from Copyright © 2015 American Society of Plant Biologists. All rights reserved.
36
Rennie, E.A., Ebert, B., Miles, G.P., Cahoon, R.E., Christiansen, K.M., Stonebloom, 1047
S., Khatab, H., Twell, D., Petzold, C.J., Adams, P.D., Dupree, P., 1048
Heazlewood, J.L., Cahoon, E.B., and Scheller, H.V. (2014). Identification of a 1049
sphingolipid alpha-glucuronosyltransferase that is essential for pollen function in 1050
Arabidopsis. The Plant cell 26, 3314-3325. 1051
Richards, R.L., Rao, M., Wassef, N.M., Glenn, G.M., Rothwell, S.W., and Alving, 1052
C.R. (1998). Liposomes containing lipid A serve as an adjuvant for induction of 1053
antibody and cytotoxic T-cell responses against RTS,S malaria antigen. Infection 1054
and immunity 66, 2859-2865. 1055
Rideal, J.T.D.a.E.K. (1963). Interfacial Phenomena ( 1056
Ripley, B.D. (1976). The second order analysis of stationary point process. Journal of 1057
Applied Probability 13, 255-261. 1058
Ruettinger, A., Kiselev, M.A., Hauss, T., Dante, S., Balagurov, A.M., and Neubert, 1059
R.H. (2008). Fatty acid interdigitation in stratum corneum model membranes: a 1060
neutron diffraction study. European biophysics journal : EBJ 37, 759-771. 1061
Scheffer, L., Solomonov, I., Weygand, M.J., Kjaer, K., Leiserowitz, L., and Addadi, 1062
L. (2005). Structure of cholesterol/ceramide monolayer mixtures: implications to 1063
the molecular organization of lipid rafts. Biophysical journal 88, 3381-3391. 1064
Shevchenko, A., and Simons, K. (2010). Lipidomics: coming to grips with lipid 1065
diversity. Nature reviews. Molecular cell biology 11, 593-598. 1066
Simon-Plas, F., Perraki, A., Bayer, E., Gerbeau-Pissot, P., and Mongrand, S. (2011). 1067
An update on plant membrane rafts. Current opinion in plant biology 14, 642-649. 1068
Simons, K., and Ikonen, E. (1997). Functional rafts in cell membranes. Nature 387, 1069
569-572. 1070
Simons, K., and Toomre, D. (2000). Lipid rafts and signal transduction. Nature reviews. 1071
Molecular cell biology 1, 31-39. 1072
Simons, K., and Gerl, M.J. (2010). Revitalizing membrane rafts: new tools and insights. 1073
Nature reviews. Molecular cell biology 11, 688-699. 1074
Sonnino, S., and Prinetti, A. (2010). Gangliosides as regulators of cell membrane 1075
organization and functions. Advances in experimental medicine and biology 688, 1076
165-184. 1077
Sperling, P., and Heinz, E. (2003). Plant sphingolipids: structural diversity, 1078
biosynthesis, first genes and functions. Biochimica et biophysica acta 1632, 1-15. 1079
Sperling, P., Franke, S., Luthje, S., and Heinz, E. (2005). Are glucocerebrosides the 1080
predominant sphingolipids in plant plasma membranes? Plant Physiol Biochem 1081
43, 1031-1038. 1082
Subczynski, W.K., and Kusumi, A. (2003). Dynamics of raft molecules in the cell and 1083
artificial membranes: approaches by pulse EPR spin labeling and single molecule 1084
optical microscopy. Biochimica et biophysica acta 1610, 231-243. 1085
Tjellstrom, H., Hellgren, L.I., Wieslander, A., and Sandelius, A.S. (2010). Lipid 1086
asymmetry in plant plasma membranes: phosphate deficiency-induced 1087
phospholipid replacement is restricted to the cytosolic leaflet. FASEB journal : 1088
official publication of the Federation of American Societies for Experimental 1089
Biology 24, 1128-1138. 1090
Vitiello, F., and Zanetta, J.P. (1978). Thin-layer chromatography of phospholipids. 1091
Journal of chromatography 166, 637-640. 1092
www.plantphysiol.orgon September 15, 2018 - Published by Downloaded from Copyright © 2015 American Society of Plant Biologists. All rights reserved.
37
Voxeur, A., and Fry, S.C. (2014). Glycosylinositol phosphorylceramides from Rosa cell 1093
cultures are boron-bridged in the plasma membrane and form complexes with 1094
rhamnogalacturonan II. The Plant journal : for cell and molecular biology 79, 1095
139-149. 1096
Wang, W., Yang, X., Tangchaiburana, S., Ndeh, R., Markham, J.E., Tsegaye, Y., 1097
Dunn, T.M., Wang, G.L., Bellizzi, M., Parsons, J.F., Morrissey, D., Bravo, 1098
J.E., Lynch, D.V., and Xiao, S. (2008). An inositolphosphorylceramide synthase 1099
is involved in regulation of plant programmed cell death associated with defense 1100
in Arabidopsis. The Plant cell 20, 3163-3179. 1101
Worrall, D., Ng, C.K., and Hetherington, A.M. (2003). Sphingolipids, new players in 1102
plant signaling. Trends in plant science 8, 317-320. 1103
Yetukuri, L., Ekroos, K., Vidal-Puig, A., and Oresic, M. (2008). Informatics and 1104
computational strategies for the study of lipids. Molecular bioSystems 4, 121-127. 1105
1106
1107
www.plantphysiol.orgon September 15, 2018 - Published by Downloaded from Copyright © 2015 American Society of Plant Biologists. All rights reserved.
38
FIGURE LEGENDS 1108
Figure 1. Long chain (LCFA), very long chain (VLCFA) and 2-hydroxylated very 1109
long chain fatty acid (hVLCFA) content of tissue, microsomal, plasma membrane 1110
(PM) and Detergent-Insoluble Membranes (DIM) fractions from tobacco leaf or 1111
BY-2 cell culture 1112
A, Fatty Acids were released from biological samples by acid methanolysis; the resulting 1113
FAMEs were subsequently derivatized with BSTFA before GC/MS analysis. The data are 1114
expressed as the mean of three independent experiments. LCFA: Long Chain Fatty Acid 1115
with 16, 18 or 20 carbon atoms, VLCFA: Very Long Chain Fatty Acid with 22 to 26 1116
carbon atoms, hVLCFA, VLCFA with 22 to 26 carbon atoms hydroxylated in position 2; 1117
B, Histograms show the comparison between VLCFA and hVLCFA content of DIM and 1118
of GIPCs purified from tobacco leaves or BY-2 cell culture. The data are expressed as the 1119
mean of four independent experiments ±SD. 1120
1121
Figure 2. Analysis of GIPCs extracted from tobacco leaf and BY-2 cells by MALDI-1122
MS and HP-TLC. Polyglycosylated GIPCs are enriched in DIMs 1123
A, MALDI-MS analysis of GIPC extracts from BY-2 cells and tobacco leaf. Spectra were 1124
acquired in the negative ion mode using 2,6-dihydroxyacetophenone (DHA) as a matrix. 1125
GIPCs are grouped in series according to their number of saccharide units, from two 1126
(series A) to six (series E), see supplemental figure S7 for detailed analysis of the peaks; 1127
B, High Performance-Thin Layer Chromatography (HP-TLC) were used to separated the 1128
different series of GIPCs. Note that the series A show two bands called by Kaul and 1129
Lester 1975, PhytoSphingoLipid: PSL I and PSL II, corresponding to GlcNAc-GlcUA-1130
IPC and GlcNH2-GlcUA-IPC, respectively(Kaul and Lester, 1975). GIPCs extracted from 1131
Arabidopsis thaliana (At) and leek (Ap., Allium porrum) were used as HP-TLC standards 1132
for series A and B respectively, according to (Cacas et al., 2013). 1133
1134
www.plantphysiol.orgon September 15, 2018 - Published by Downloaded from Copyright © 2015 American Society of Plant Biologists. All rights reserved.
39
Figure 3. Quantification of polyglycosylated GIPCs found in PM and DIMs of BY-2 1135
cells. 1136
Quantification by HP-TLC coupled to GC-MS of polyglycosylated GIPCs found in PM 1137
and DIMs of BY-2 cells. The data are expressed as the mean of three independent 1138
experiments as the percentage of total GIPCs found in PM and DIMs respectively ±SD. 1139
1140
Figure 4. Lipid content of tobacco leaf (A.) and BY-2 cell (B.) PM and DIMs 1141
Left: From the results presented in Fig. 1 and 2 and those obtained on phospholipids and 1142
sterols on the same plant materials (Furt et al., 2010), we were able to determine the lipid 1143
content of PM and DIM expressed as mol%. Right, The three main classes of lipids, 1144
namely phospholipids, sterols and sphingolipids were summed and represented as mol% 1145
of total lipids. The data are expressed as means of three independent experiments ± SD. 1146
Abbreviations are as followed: phosphatidylethanolamine (PE), phosphatidylcholine 1147
(PC), phosphatidic acid (PA), phosphatidylinositol (PI), phosphatidylinositol 4-phosphate 1148
(PI4P), phosphatidylinositol 4,5-bisphosphate (PI4,5P2), digalactosyldiacylglycerol 1149
(DGDG), Steryl-glucosides (SG), Acyl Steryl-glucosides (ASG), free sterols (Sterols), 1150
glucosylceramides (GluCER), GlycosylInositolPhosphorylCeramides (GIPCs). 1151
Right: sum of percentage of glycerolipids (PE, PC, PA, PI, PIP4P, PI4,5P2, DGDG) 1152
sterols (free sterols, SG, ASG) and sphingolipids (gluCER, GIPCs). 1153
1154
Figure 5. Test for the specificity of antibodies to polyglycosylated GIPCs 1155
A, Home–made PVDF dot-blots were done with DEAE fractions of GIPC purification, 1156
see supplemental Fig. S11. PVDF membranes were blotted with pre-immun serum 1157
(1/100) or with 53 days serum (1/100) immunized against polyglycosylated GIPCs, see 1158
experimental section; B, Lipids from BY-2 cell PM were separated on HP-TLC. The 1159
plates were blotted with pre-immun serum (1/100) or with 53 days serum (1/100) 1160
immunized against polyglycosylated GIPCs, see experimental section. 1161
1162
Figure 6. Polyglycosylated GIPCs locates in nanoscale membrane domains on BY-2 1163
cell PM vesicles. A, Transmission electron micrographs of negatively stained tobacco 1164
PM vesicles immunogold labeled on grids with purified antibodies to polyglycosylated 1165
www.plantphysiol.orgon September 15, 2018 - Published by Downloaded from Copyright © 2015 American Society of Plant Biologists. All rights reserved.
40
GIPCs detected by 6 nm colloidal gold conjugated goat anti-rabbit. Circles indicate 1166
obvious membrane domains; Bars = 20 nm; B Total number of 49 independent gold-1167
labeled PM vesicles were analyzed for the statistics; C; Ripley’s K-function analysis of 1168
GIPCs distribution on the surface of PM vesicles: y axis K(r) is the average number of 1169
particles lying at a distance less than r (x axis), normalized by the mean particle density. 1170
This Ripley’s analysis of the labeled PM vesicles (black line) indicates clustering of the 1171
gold particles when compared to a theoretical simulation for a completely random 1172
(Poisson) point pattern (red dotted line). 1173
1174
Figure 7. Effect on membrane order level of tobacco leaf or BY-2 cell purified 1175
GIPCs, in combination with phospholipids and free sterols. 1176
The Red/Green Mean ratio of the membrane (RGM) of 1µm diameter LUVs of different 1177
compositions labeled with di-4ANEPPDHQ (3 µM) was measured by spectrofluorimetry 1178
in the presence of GIPCs isolated from tobacco BY-2 cells or tobacco leaves. Data shown 1179
are mean values ± SD, n=5 or more independent repetitions. The different letters indicate 1180
significantly different values (p-value < 0.05). 1181
1182
Figure 8. Surface pressure-area (Π-A) isotherms, at the air-aqueous phase interface, 1183
of pure GIPC () and sitosterol () monolayers and of mixed GIPC/sitosterol 1184
monolayer () prepared at GIPC a 0.85 molar ratio. 1185
A, The isotherms were recorded at 22 ± 1°C with an aqueous subphase composed by a 1186
Tris 10mM buffer at pH 7.0. Duplicate experiments using independent preparations 1187
yielded similar results; B, Comparison of the experimental (white bars) and theoretical 1188
(black bars) mean molecular areas at a surface pressure of 10 mN/m, 20 mN/m and 30 1189
mN/m for GIPC/sitosterol at a 0.85 GIPC molar ratio. The theoretical value is obtained 1190
according to the additivity rule : A12 = A1X1 + A2X2 where A12 is the mean molecular 1191
area for ideal mixing of the two components at a given Π, A1, and A2 are the molecular 1192
areas of the respective components in their pure monolayers at the same Π and X1 and 1193
X2 are the molar ratios of components 1 and 2 in the mixed monolayers; C, Excess free 1194
energy of mixing (ΔGex) (white bars), and free energy of mixing (ΔGM) (black bars) of 1195
the mixed monolayer GIPC/sitosterol at a 0.85 molar ratio of GIPC for various surface 1196
www.plantphysiol.orgon September 15, 2018 - Published by Downloaded from Copyright © 2015 American Society of Plant Biologists. All rights reserved.
41
pressures. ΔGex and ΔGM were calculated according to the following equations (Maget-1197
Dana, 1999) (Eeman et al., 2005) : ΔGex = A12 dΠ0
Π
− X1 A1dΠ0
Π
− X2 A2 dΠ0
Π
where A is 1198
the mean molecular area, X is the molar fraction, subscripts 1 and 2 refer, respectively, to 1199
pure components 1 and 2 and 12 to their mixtures, and ΔGM =ΔGex +ΔGid where ΔGid is 1200
the free energy for ideal mixing and can be calculated from the following equation, 1201
ΔGid =RT X1 lnX1 + X2 lnX2( ) where R is the universal gas constant and T the absolute 1202
temperature. 1203
1204
Figure 9. Modeling approaches 1205
A, Theoretical interactions between 8 GIPC and 8 sitosterol molecules calculated by HM 1206
docking method. Sitosterol molecules are in green and GIPCs are coloured with carbon 1207
atoms in grey, oxygen in red, phosphorus in purple, nitrogen in blue and hydrogen in 1208
white; B, Most stable insertion of gluCER d18:2/h16:0 (left) and GIPCs t18:0/h24:0 1209
(Frazier and Alber, 2012) into an implicit bilayer calculated by IMPALA. The yellow 1210
plane represents the center of the bilayer; the mauve plane stands for the lipid polar 1211
head/acyl chain interface and the pink plane, for the water/lipid polar head interface; C, 1212
Interaction energies calculated for GIPCs and GIPCs/sitosterol (from Fig. 9A) 1213
monolayers. Epolar corresponds to polar and electrostatic interactions and Epho and 1214
Evdw, to hydrophobic and Van der Waals interactions, respectively. The mean calculated 1215
interfacial molecular areas for GIPCs alone or in interaction with sitosterol are also 1216
indicated. 1217
1218
Figure 10. Model for the organization of lipids in tobacco plasma membrane. 1219
To build this model, we took the molar composition of the BY-2 PM obtained in Fig. 4 1220
and used the data obtained by Tjellstrom and collaborators 2010, who were able to 1221
calculate the distribution of cytosolic/apoplastic lipids. We hypothesize that GIPCs are 1222
located exclusively in the apoplastic face, see text. 1223
1224
www.plantphysiol.orgon September 15, 2018 - Published by Downloaded from Copyright © 2015 American Society of Plant Biologists. All rights reserved.
42
Supplemental Data 1225
The following materials are available in the online version of this article. 1226
1227
Supplemental Figure S1. Typical GC-MS spectrogram of total FAMES and sterols 1228
extracted from BY-2 cell PM. Two internal standards (IS) were added to quantify 1229
GIPC: 2-hydroxylated 14 carbon atom fatty acid (h14), and heptadecanoic acid (17:0). 1230
1231
Supplemental Figure S2. Fatty acid content of tissue, microsomal, plasma 1232
membrane (PM) and Detergent-Insoluble Membranes (DIM) fractions from tobacco 1233
leaves or BY-2 cell culture. A. Fatty Acids were released from biological samples by 1234
acid methanolysis; the resulting FAMEs were subsequently derivatized with BSTFA 1235
before GC/MS analysis. LCFA: Long Chain Fatty Acid with 16, 18 or 20 carbon atoms, 1236
VLCFA: Very Long Chain Fatty Acid with 22 to 26 carbon atoms, hVLCFA, 2-1237
hydroxylated Very Long Chain Fatty Acid with 22 to 26 carbon atoms. The data are 1238
expressed as the mean of three independent experiments ± SEs (Garssen et al.). 1239
B. Sum of LCFA: Long Chain Fatty Acid with 16, 18 or 20 carbon atoms, VLCFA: Very 1240
Long Chain Fatty Acid with 22 to 26 carbon atoms, hVLCFA, 2-hydroxylated Very Long 1241
Chain Fatty Acid with 22 to 26 carbon atoms expressed as nmol of FAMES per mg of 1242
proteins. The data are expressed as the mean of three independent experiments ± SEs 1243
(Garssen et al.). 1244
1245
Supplemental Figure S3. Fatty acid content of Detergent-Insoluble Membranes 1246
(DIM) vs. Detergent-Soluble Membranes (DSM) from tobacco leaf purified PM. 1247
Fatty Acids were released by acid methanolysis; the resulting FAMEs were subsequently 1248
derivatized with BSTFA before GC/MS analysis. LCFA: Long Chain Fatty Acid with 16, 1249
18 or 20 carbon atoms, VLCFA: Very Long Chain Fatty Acid with 22 to 26 carbon 1250
atoms, hVLCFA, 2-hydroxylated Very Long Chain Fatty Acid with 22 to 26 carbon 1251
atoms. The data are expressed as the mean of three independent experiments ± SEs 1252
(Garssen et al.). 1253
1254
www.plantphysiol.orgon September 15, 2018 - Published by Downloaded from Copyright © 2015 American Society of Plant Biologists. All rights reserved.
43
Supplemental Figure S4. Fatty acid and sterol content of purified Acyl Steryl 1255
Glucosides (ASG) extracted from tobacco leaves or BY-2 cell culture. ASG was 1256
purified by HP-TLC (Lefebvre et al., 2007), scratched from the silica and submitted to 1257
either acid methanolysis for FAMES analysis, or to saponification for sterol analysis. 1258
After TMS derivatizasion, FAMES and sterols were quantified by GC-MS. The data are 1259
expressed as the mean of three independent experiments ± SEs (Garssen et al.). 1260
1261
Supplemental Figure S5. Fatty acid content of purified glucosyl ceramide (gluCER) 1262
extracted from tobacco leaves or BY-2 cell culture and purified by TLC. GluCER 1263
was purified by HP-TLC (Lefebvre et al., 2007), scratched from the silica and submitted 1264
to acid methanolysis for FAMES analysis, After BSTFA derivatizasion, FAMES were 1265
quantified by GC-MS. The data are expressed as the mean of three independent 1266
experiments ± SEs (Garssen et al.). 1267
1268
Supplemental Figure S6. LCB content of GIPCs, plasma membrane (PM) and 1269
Detergent-Insoluble Membranes (DIM) from tobacco leaves or BY-2 cell culture. A, 1270
LCBs were isolated by hydrolysis from GIPCs purified from leaf and BY-2 cells, 1271
converted to their fatty aldehydes by peroxydation and separated by GC, as described 1272
(Cacas et al., 2012a); B-C, LCBs content were determined in PM and DIM purified from 1273
tobacco leaves and BY-2 cells. Abbreviations are as follow: Peak nomenclature in the 1274
key is systematically based upon the 2-amino-acyl backbone of the LCB. t18:0: 2-1275
aminooctadecane-1,2,4-triol (trivial name phytosphingosine); t18:1(8Z): (Z)-2-1276
aminooctadec-8-ene-1,2,4-triol, (trivial name (8Z)-phytosphingenine); d18:1(4E): (E)-2-1277
aminooctadec-4-ene-1,2-diol (trivial name sphingosine); d18:2(4E/8Z,E): (E,Z)-2-1278
aminooctadeca-4,8-dienine-1,2-diol (trivial name (4E,8Z)-sphingadienine); d18:0: 2-1279
aminooctadecane-1,2-diol (trivial name sphinganine). 1280
1281
Supplemental Figure S7. MALDI-MS analysis of GIPC extracts from BY-2 cells. 1282
Spectra were acquired in the negative ion mode using 2,6-dihydroxyacetophenone (DHA) 1283
as a matrix. GIPCs are grouped in series according to their number of saccharide units, 1284
from two sugars (series A) to six (series E). 1285
www.plantphysiol.orgon September 15, 2018 - Published by Downloaded from Copyright © 2015 American Society of Plant Biologists. All rights reserved.
44
1286
Supplemental Figure S8. MALDI-MS analysis of GIPC extracts purified from PM 1287
and DIMs extracted from tobacco leaves. Spectra were acquired in the negative ion 1288
mode using 2,6-dihydroxyacetophenone (DHA) as a matrix. 1289
1290
Supplemental Figure S9. Determination of lipid-to-protein ratio in plant PM. A, 100 1291
µg of BY-2 cell purified PM were extracted by protocol #1 (see experimental procedures) 1292
using chloroform/methanol/HCl, the aqueous phase were re-extracted by buranol-1. 1293
Histograms shows the total FA content recovered in each solvent fractions expressed as 1294
the mean ± SD of three independent experiments, compare with the direct 1295
transesterification of 100 µg of BY-2 cell purified PM. 1296
1297
Supplemental Figure S10. Fatty acid content of total lipids from grape cell culture. 1298
A, Fatty Acids were released from biological samples by acid methanolysis; the resulting 1299
FAMEs were subsequently derivatized with BSTFA before GC/MS analysis. LCFA: 1300
Long Chain Fatty Acid with 16, 18 or 20 carbon atoms, VLCFA: Very Long Chain Fatty 1301
Acid with 22 to 26 carbon atoms, hVLCFA, 2-hydroxylated Very Long Chain Fatty Acid 1302
with 22 to 26 carbon atoms. The data are expressed as the mean of three independent 1303
experiments ± SEs (Garssen et al.); B, Lipids from grape cell culture were extracted with 1304
or without preliminary hot isopropanol treatment. Polar lipis are further separated by HP-1305
TLC by the solvent migration described in (Vitiello and Zanetta, 1978). Abbreviations 1306
are as described in Fig. 3; C, Rationale for the three lipid extraction protocols; D, Fatty 1307
acid analyses of lyophilized grape cell culture by the three lipid extraction protocols with 1308
or without hot isopropanol pre-treatment, compare with the direct transesterification of 1309
grape cell culture (TOTAL, left). The data are expressed as means of three independent 1310
experiments ± SD. 1311
1312
Supplemental Figure S11. Purification of GIPCs from BY-2 cells by DEAE 1313
chromatography. A, Total BY-2 cell GIPC were separated by DEAE. The different 1314
fractions were eluted with increasing amount of ammonium acetate: fractions 9-49, see 1315
material and methods. The purification process was monitored by on HP-TLC. Lipids 1316
www.plantphysiol.orgon September 15, 2018 - Published by Downloaded from Copyright © 2015 American Society of Plant Biologists. All rights reserved.
45
were visualized by spraying plates with primuline. GIPCBY2 are the starting material used 1317
as control standards for HP-TLC; B, Purified and dialyzed fractions (GIPC series A and 1318
B-F) were check for purifty by HP-TLC and MALDI-MS. Note the absence of residual 1319
glycerolipids and sterols, and the strong enrichment of series A in one hand (middle) and 1320
series B-F in the other hand. 1321
1322
Supplemental Figure S12. Test by ELISA of the specificity of antibodies against 1323
polyglycosylated GIPCs. ELISA were performed using BSA as negative control. Data 1324
represent mean value of four technical replicates. Vertical bars indicate standard error of 1325
the mean. 1326
1327
Supplemental Figure S13. Cross reactivity of antibodies against polyglycosylated 1328
GIPCs. A, The cross reactivity of antibodies against polyglycosylated GIPCs was 1329
performed on “PIP strips” according to manufacturers’s instructions (Echelon Bioscience, 1330
USA; http://www.echelon-inc.com). Membranes were first incubated with rabbit 1331
antibodies against polyglycosylated GIPCs (dilution 1/100 for 1h at RT) and further with 1332
horseradish peroxydase-conjugated secondary anti mouse antibody (dilution 1/15,000 for 1333
1h at RT); B, A negative control with preimmume serum, or without primary antibodies 1334
is shown at the bottom panel; C, Positive control is performed with antibodies against 1335
PI4,5P2 (Antibodies against native PI4,5P2 from bovine spinal cord (www.Assay 1336
designs.com); dilution 1/1,000 for 1h at RT). Note that these antibodies are 10-fold more 1337
diluted than antibodies against polyglycosylated GIPCs. 1338
1339
Supplemental Figure S14. Immumogold labeling controls of PM vesicles. 1340
A, omission of the primary antibody; B, use of the pre-immune serum of rabbit used for 1341
immunization of polyglycosylated GIPCs with the preimmune serum of rabbit used for 1342
immunization of polyglycosylated GIPCs; C, with antibodies against the proton pump 1343
ATPase PMA as used in (Raffaele et al., 2009) 1344
1345
www.plantphysiol.orgon September 15, 2018 - Published by Downloaded from Copyright © 2015 American Society of Plant Biologists. All rights reserved.
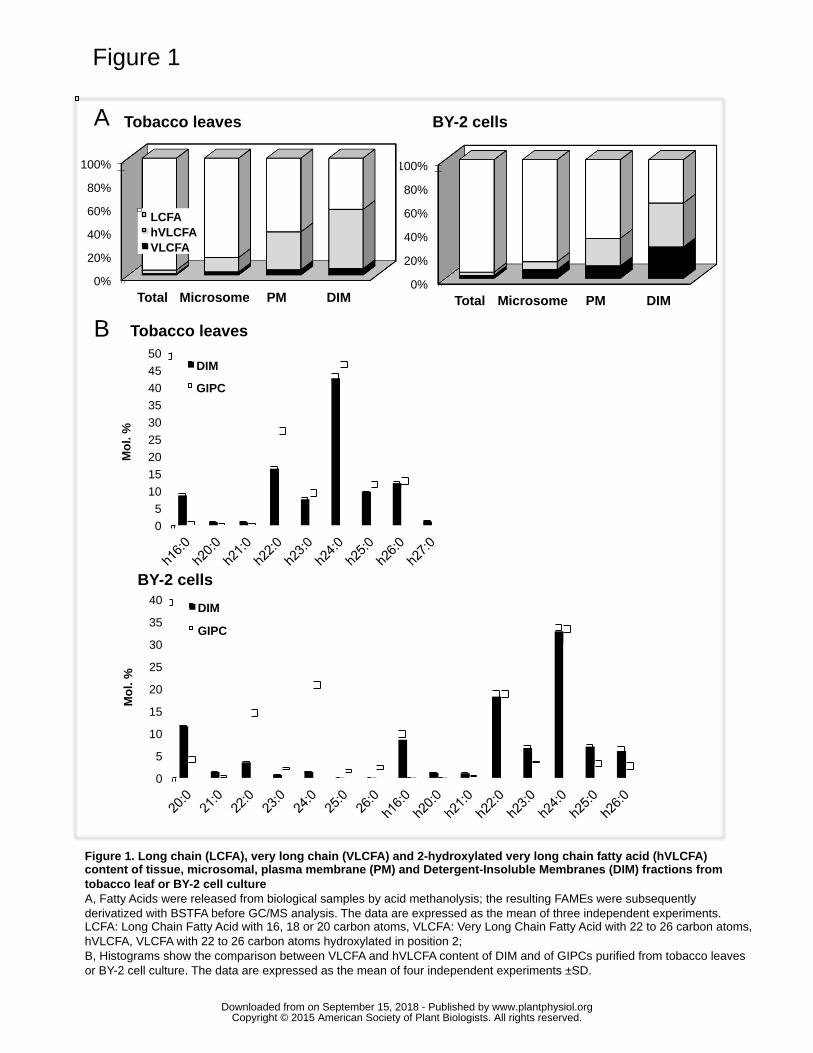
Figure 1
0%
20%
40%
60%
80%
100%
Total Microsome PM DIM 0%
20%
40%
60%
80%
100%
Total Microsome PM DIM
LCFA hVLCFA VLCFA
Tobacco leaves BY-2 cells A
B Tobacco leaves
BY-2 cells
0 5
10 15 20 25 30 35 40 45 50
Mol
. %
DIM
GIPC
0
5
10
15
20
25
30
35
40
Mol
. %
DIM
GIPC
Figure 1. Long chain (LCFA), very long chain (VLCFA) and 2-hydroxylated very long chain fatty acid (hVLCFA) content of tissue, microsomal, plasma membrane (PM) and Detergent-Insoluble Membranes (DIM) fractions from tobacco leaf or BY-2 cell culture A, Fatty Acids were released from biological samples by acid methanolysis; the resulting FAMEs were subsequently derivatized with BSTFA before GC/MS analysis. The data are expressed as the mean of three independent experiments. LCFA: Long Chain Fatty Acid with 16, 18 or 20 carbon atoms, VLCFA: Very Long Chain Fatty Acid with 22 to 26 carbon atoms, hVLCFA, VLCFA with 22 to 26 carbon atoms hydroxylated in position 2; B, Histograms show the comparison between VLCFA and hVLCFA content of DIM and of GIPCs purified from tobacco leaves or BY-2 cell culture. The data are expressed as the mean of four independent experiments ±SD.
www.plantphysiol.orgon September 15, 2018 - Published by Downloaded from Copyright © 2015 American Society of Plant Biologists. All rights reserved.
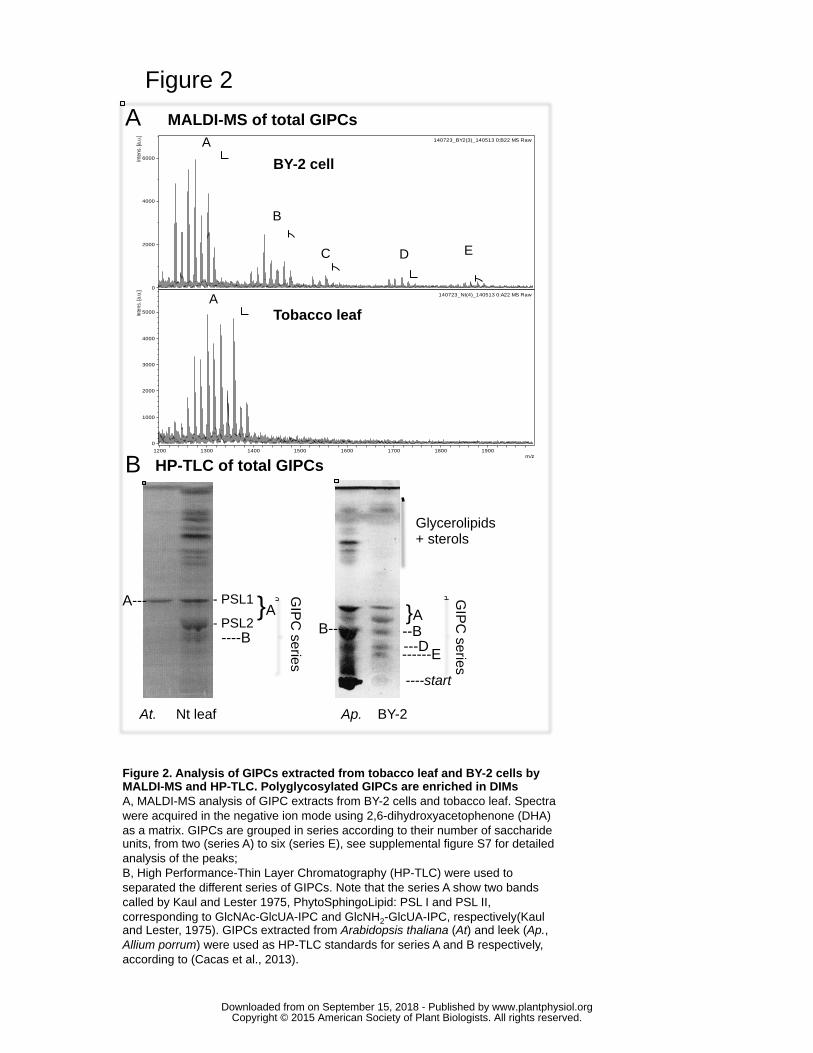
140723_BY2(3)_140513 0:B22 MS Raw
0
2000
4000
6000Inte
ns. [
a.u.
]
140723_Nt(4)_140513 0:A22 MS Raw
0
1000
2000
3000
4000
5000Inte
ns. [
a.u.
]
1200 1300 1400 1500 1600 1700 1800 1900m/z
Figure 2
A
D C
B
A Tobacco leaf
BY-2 cell
A MALDI-MS of total GIPCs
B HP-TLC of total GIPCs
E
}A ----B
GIP
C series
- PSL1
- PSL2
At. Nt leaf
A---
Ap. BY-2
--B ---D
GIP
C series
Glycerolipids + sterols
B---
----start
------E
}A
Figure 2. Analysis of GIPCs extracted from tobacco leaf and BY-2 cells by MALDI-MS and HP-TLC. Polyglycosylated GIPCs are enriched in DIMs A, MALDI-MS analysis of GIPC extracts from BY-2 cells and tobacco leaf. Spectra were acquired in the negative ion mode using 2,6-dihydroxyacetophenone (DHA) as a matrix. GIPCs are grouped in series according to their number of saccharide units, from two (series A) to six (series E), see supplemental figure S7 for detailed analysis of the peaks; B, High Performance-Thin Layer Chromatography (HP-TLC) were used to separated the different series of GIPCs. Note that the series A show two bands called by Kaul and Lester 1975, PhytoSphingoLipid: PSL I and PSL II, corresponding to GlcNAc-GlcUA-IPC and GlcNH2-GlcUA-IPC, respectively(Kaul and Lester, 1975). GIPCs extracted from Arabidopsis thaliana (At) and leek (Ap., Allium porrum) were used as HP-TLC standards for series A and B respectively, according to (Cacas et al., 2013).
www.plantphysiol.orgon September 15, 2018 - Published by Downloaded from Copyright © 2015 American Society of Plant Biologists. All rights reserved.
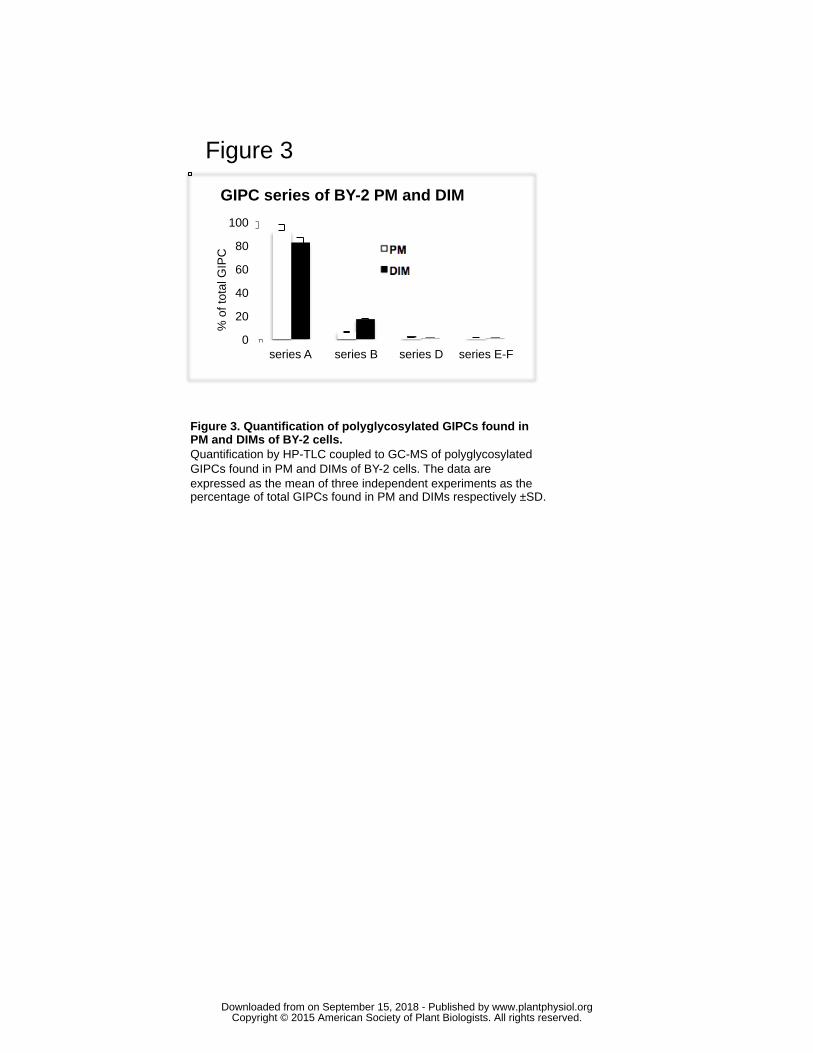
0
20
40
60
80
100
series A series B series D series E-F
GIPC series of BY-2 PM and DIM %
of t
otal
GIP
C
Figure 3
Figure 3. Quantification of polyglycosylated GIPCs found in PM and DIMs of BY-2 cells. Quantification by HP-TLC coupled to GC-MS of polyglycosylated GIPCs found in PM and DIMs of BY-2 cells. The data are expressed as the mean of three independent experiments as the percentage of total GIPCs found in PM and DIMs respectively ±SD.
www.plantphysiol.orgon September 15, 2018 - Published by Downloaded from Copyright © 2015 American Society of Plant Biologists. All rights reserved.
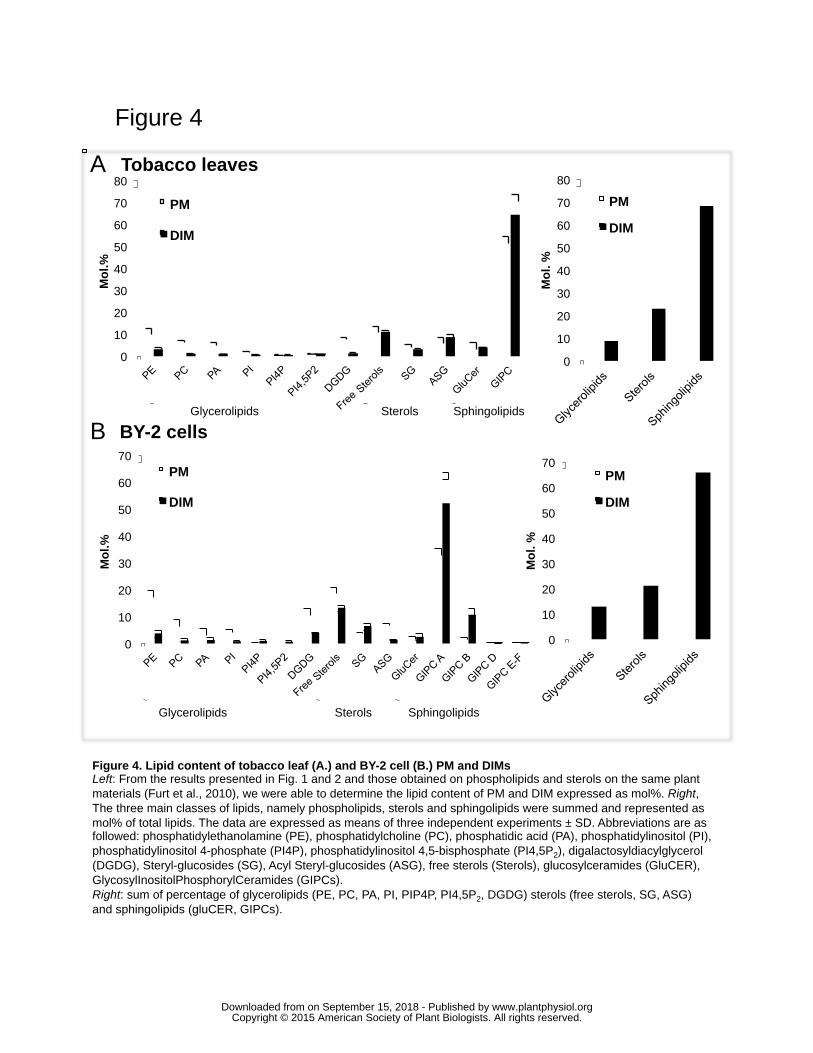
0
10
20
30
40
50
60
70
80
Mol
.%
PM
DIM
Glycerolipids Sterols Sphingolipids
A
Figure 4
Tobacco leaves
0
10
20
30
40
50
60
70
80
Mol
. %
PM
DIM
BY-2 cells
Glycerolipids Sphingolipids Sterols
0
10
20
30
40
50
60
70
Mol
.%
PM
DIM
B
0
10
20
30
40
50
60
70
Mol
. %
PM
DIM
Figure 4. Lipid content of tobacco leaf (A.) and BY-2 cell (B.) PM and DIMs Left: From the results presented in Fig. 1 and 2 and those obtained on phospholipids and sterols on the same plant materials (Furt et al., 2010), we were able to determine the lipid content of PM and DIM expressed as mol%. Right, The three main classes of lipids, namely phospholipids, sterols and sphingolipids were summed and represented as mol% of total lipids. The data are expressed as means of three independent experiments ± SD. Abbreviations are as followed: phosphatidylethanolamine (PE), phosphatidylcholine (PC), phosphatidic acid (PA), phosphatidylinositol (PI), phosphatidylinositol 4-phosphate (PI4P), phosphatidylinositol 4,5-bisphosphate (PI4,5P2), digalactosyldiacylglycerol (DGDG), Steryl-glucosides (SG), Acyl Steryl-glucosides (ASG), free sterols (Sterols), glucosylceramides (GluCER), GlycosylInositolPhosphorylCeramides (GIPCs). Right: sum of percentage of glycerolipids (PE, PC, PA, PI, PIP4P, PI4,5P2, DGDG) sterols (free sterols, SG, ASG) and sphingolipids (gluCER, GIPCs).
www.plantphysiol.orgon September 15, 2018 - Published by Downloaded from Copyright © 2015 American Society of Plant Biologists. All rights reserved.

Figure 5 A B
Primulin pre-immune immune
GIPC
PL
gluCER
Neutral lipids
anti GIPC (1/100)
-----SG
anti GIPC (1/100)
pre-immun immun
45 49 45 49 DEAE fractions
A{
B--
Figure 5. Test for the specificity of antibodies to polyglycosylated GIPCs A, Home–made PVDF dot-blots were done with DEAE fractions of GIPC purification, see supplemental Fig. S10. PVDF membranes were blotted with pre-immun serum (1/100) or with 53 days serum (1/100) immunized against polyglycosylated GIPCs, see experimental section; B, Lipids from BY-2 cell PM were separated on HP-TLC. The plates were blotted with pre-immun serum (1/100) or with 53 days serum (1/100) immunized against polyglycosylated GIPCs, see experimental section.
www.plantphysiol.orgon September 15, 2018 - Published by Downloaded from Copyright © 2015 American Society of Plant Biologists. All rights reserved.
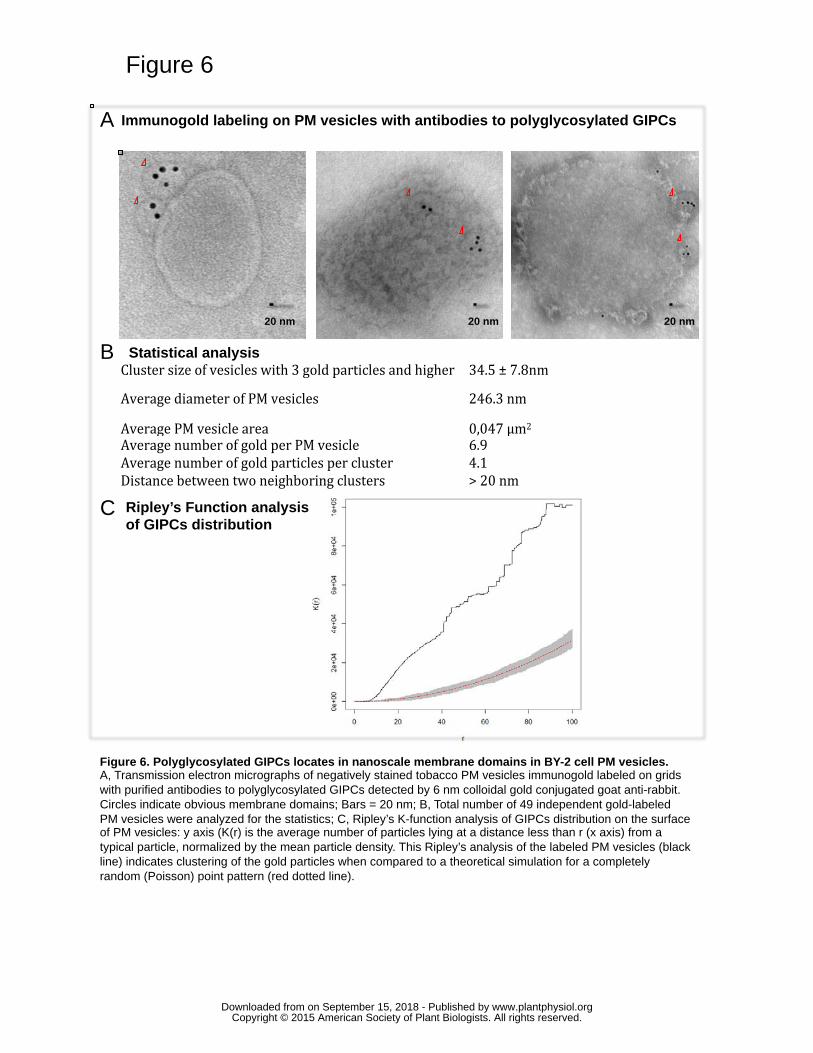
Figure 6
!Cluster!size!of!vesicles!with!3!gold!particles!and!higher! 34.5!±!7.8nm!
Average!diameter!of!PM!vesicles! 246.3!nm!
Average!PM!vesicle!area! 0,047!µm2!Average!number!of!gold!per!PM!vesicle! 6.9!Average!number!of!gold!particles!per!cluster!! 4.1!Distance!between!two!neighboring!clusters! >!20!nm!!
B
A
C
Immunogold labeling on PM vesicles with antibodies to polyglycosylated GIPCs
Statistical analysis
Ripley’s Function analysis of GIPCs distribution
20 nm 20 nm 20 nm
Figure 6. Polyglycosylated GIPCs locates in nanoscale membrane domains in BY-2 cell PM vesicles. A, Transmission electron micrographs of negatively stained tobacco PM vesicles immunogold labeled on grids with purified antibodies to polyglycosylated GIPCs detected by 6 nm colloidal gold conjugated goat anti-rabbit. Circles indicate obvious membrane domains; Bars = 20 nm; B, Total number of 49 independent gold-labeled PM vesicles were analyzed for the statistics; C, Ripley’s K-function analysis of GIPCs distribution on the surface of PM vesicles: y axis (K(r) is the average number of particles lying at a distance less than r (x axis) from a typical particle, normalized by the mean particle density. This Ripley’s analysis of the labeled PM vesicles (black line) indicates clustering of the gold particles when compared to a theoretical simulation for a completely random (Poisson) point pattern (red dotted line).
www.plantphysiol.orgon September 15, 2018 - Published by Downloaded from Copyright © 2015 American Society of Plant Biologists. All rights reserved.
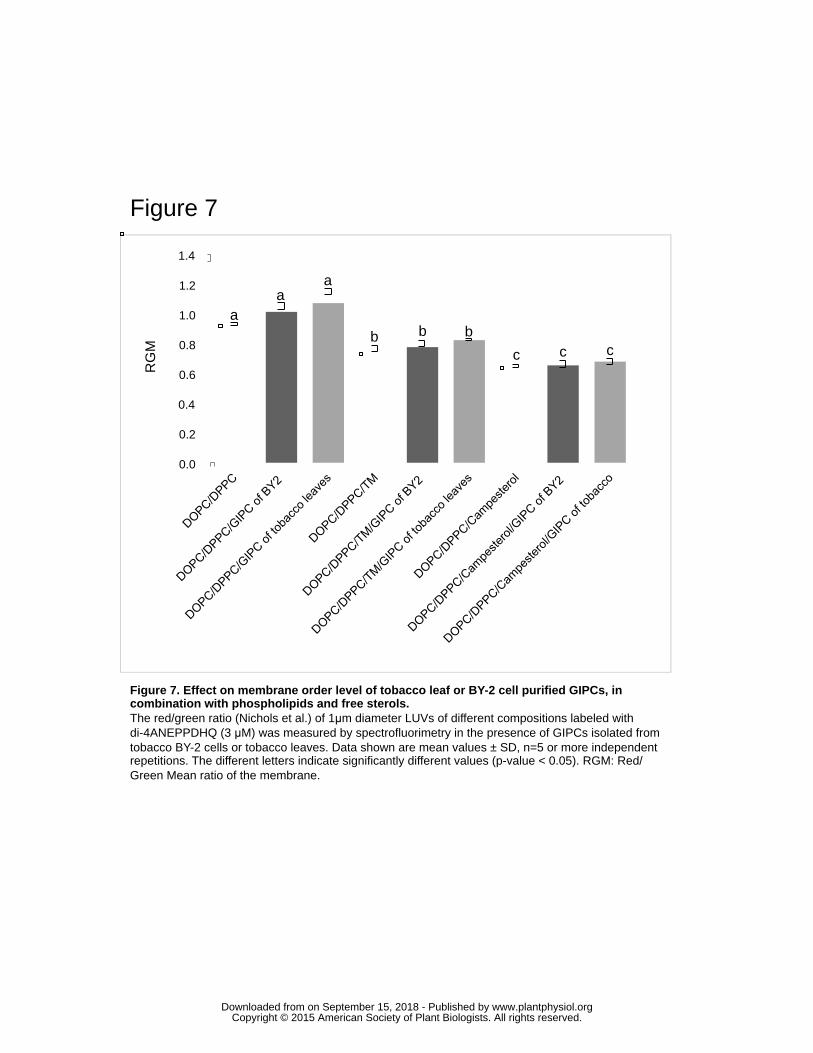
Figure 7
0.0
0.2
0.4
0.6
0.8
1.0
1.2
1.4
a
b c
a
b c c
b a
RG
M
1.4
1.2
1.0
0.8
0.6
0.4
0.2
0.0
Figure 7. Effect on membrane order level of tobacco leaf or BY-2 cell purified GIPCs, in combination with phospholipids and free sterols. The red/green ratio (Nichols et al.) of 1µm diameter LUVs of different compositions labeled with di-4ANEPPDHQ (3 µM) was measured by spectrofluorimetry in the presence of GIPCs isolated from tobacco BY-2 cells or tobacco leaves. Data shown are mean values ± SD, n=5 or more independent repetitions. The different letters indicate significantly different values (p-value < 0.05). RGM: Red/Green Mean ratio of the membrane.
www.plantphysiol.orgon September 15, 2018 - Published by Downloaded from Copyright © 2015 American Society of Plant Biologists. All rights reserved.
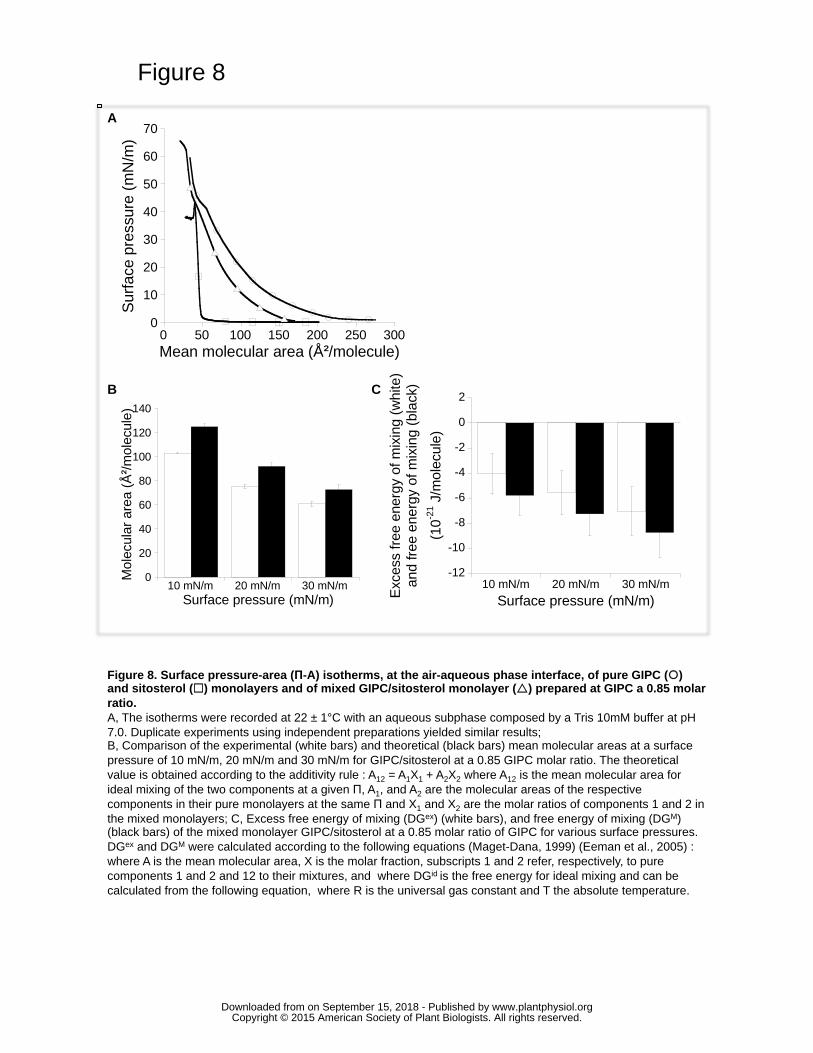
Figure 8
0
10
20
30
40
50
60
70
0 50 100 150 200 250 300
Surfa
ce p
ress
ure
(mN
/m)
Mean molecular area (Ų/molecule)
A
0
20
40
60
80
100
120
140
10 mN/m 20 mN/m 30 mN/m
Mol
ecul
ar a
rea
(Ų/m
olec
ule)
Surface pressure (mN/m)
B
-12
-10
-8
-6
-4
-2
0
2
10 mN/m 20 mN/m 30 mN/m
Exce
ss fr
ee e
nerg
y of
mix
ing
(whi
te)
and
free
ener
gy o
f mix
ing
(bla
ck)
(10-2
1 J/m
olec
ule)
Surface pressure (mN/m)
C
Figure 8. Surface pressure-area (Π-A) isotherms, at the air-aqueous phase interface, of pure GIPC (!) and sitosterol (!) monolayers and of mixed GIPC/sitosterol monolayer (!) prepared at GIPC a 0.85 molar ratio. A, The isotherms were recorded at 22 ± 1°C with an aqueous subphase composed by a Tris 10mM buffer at pH 7.0. Duplicate experiments using independent preparations yielded similar results; B, Comparison of the experimental (white bars) and theoretical (black bars) mean molecular areas at a surface pressure of 10 mN/m, 20 mN/m and 30 mN/m for GIPC/sitosterol at a 0.85 GIPC molar ratio. The theoretical value is obtained according to the additivity rule : A12 = A1X1 + A2X2 where A12 is the mean molecular area for ideal mixing of the two components at a given Π, A1, and A2 are the molecular areas of the respective components in their pure monolayers at the same Π and X1 and X2 are the molar ratios of components 1 and 2 in the mixed monolayers; C, Excess free energy of mixing (DGex) (white bars), and free energy of mixing (DGM) (black bars) of the mixed monolayer GIPC/sitosterol at a 0.85 molar ratio of GIPC for various surface pressures. DGex and DGM were calculated according to the following equations (Maget-Dana, 1999) (Eeman et al., 2005) : where A is the mean molecular area, X is the molar fraction, subscripts 1 and 2 refer, respectively, to pure components 1 and 2 and 12 to their mixtures, and where DGid is the free energy for ideal mixing and can be calculated from the following equation, where R is the universal gas constant and T the absolute temperature.
www.plantphysiol.orgon September 15, 2018 - Published by Downloaded from Copyright © 2015 American Society of Plant Biologists. All rights reserved.
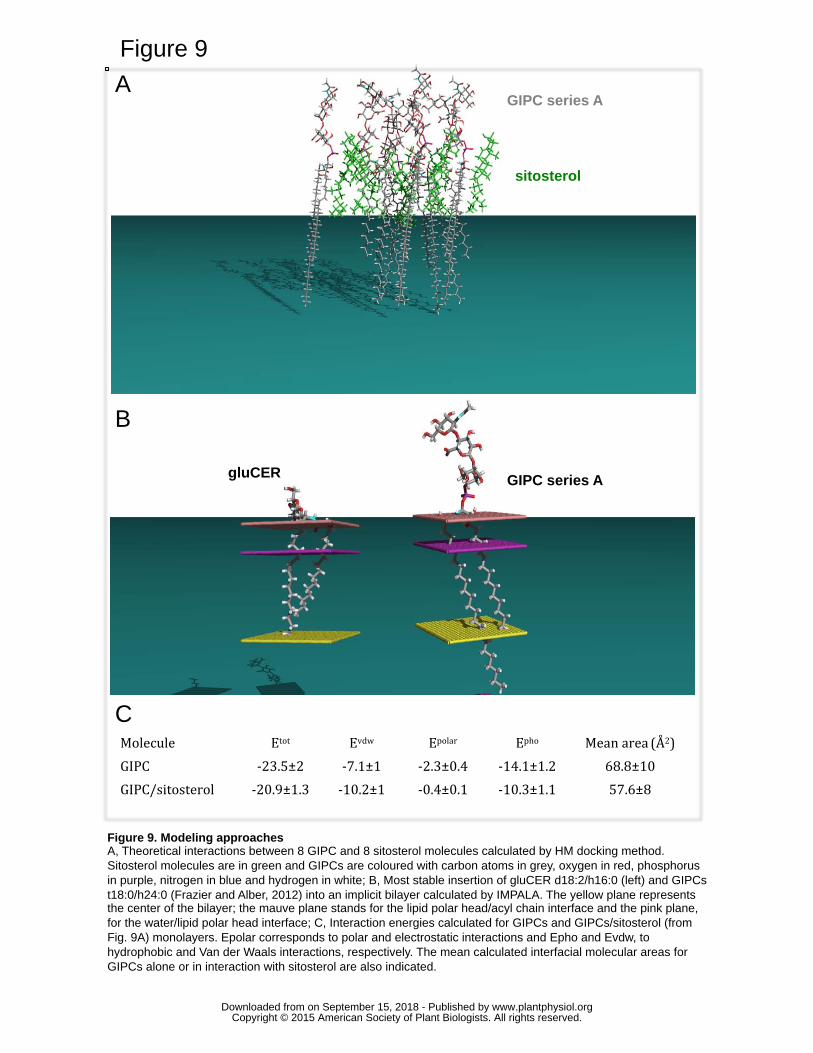
A
B
Figure 9
gluCER GIPC series A
GIPC series A
sitosterol
Figure 9. Modeling approaches A, Theoretical interactions between 8 GIPC and 8 sitosterol molecules calculated by HM docking method. Sitosterol molecules are in green and GIPCs are coloured with carbon atoms in grey, oxygen in red, phosphorus in purple, nitrogen in blue and hydrogen in white; B, Most stable insertion of gluCER d18:2/h16:0 (left) and GIPCs t18:0/h24:0 (Frazier and Alber, 2012) into an implicit bilayer calculated by IMPALA. The yellow plane represents the center of the bilayer; the mauve plane stands for the lipid polar head/acyl chain interface and the pink plane, for the water/lipid polar head interface; C, Interaction energies calculated for GIPCs and GIPCs/sitosterol (from Fig. 9A) monolayers. Epolar corresponds to polar and electrostatic interactions and Epho and Evdw, to hydrophobic and Van der Waals interactions, respectively. The mean calculated interfacial molecular areas for GIPCs alone or in interaction with sitosterol are also indicated.
!
!
Molecule! Etot! Evdw! Epolar! Epho! Mean!area!(Å2)!GIPC! :23.5±2! :7.1±1! :2.3±0.4! :14.1±1.2! 68.8±10!GIPC/sitosterol! :20.9±1.3! :10.2±1! :0.4±0.1! :10.3±1.1! 57.6±8!
C
www.plantphysiol.orgon September 15, 2018 - Published by Downloaded from Copyright © 2015 American Society of Plant Biologists. All rights reserved.
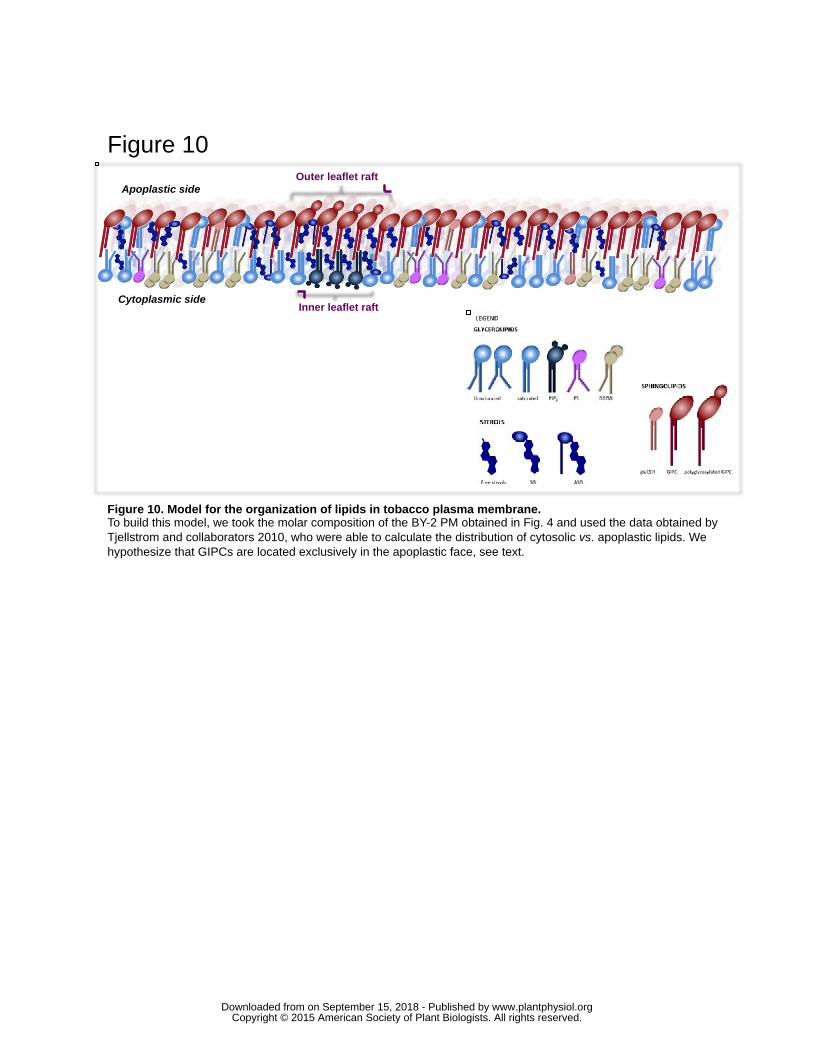
Figure 10
Apoplastic side
Cytoplasmic side Inner leaflet raft
Outer leaflet raft
Figure 10. Model for the organization of lipids in tobacco plasma membrane. To build this model, we took the molar composition of the BY-2 PM obtained in Fig. 4 and used the data obtained by Tjellstrom and collaborators 2010, who were able to calculate the distribution of cytosolic vs. apoplastic lipids. We hypothesize that GIPCs are located exclusively in the apoplastic face, see text.
www.plantphysiol.orgon September 15, 2018 - Published by Downloaded from Copyright © 2015 American Society of Plant Biologists. All rights reserved.
Parsed CitationsBensikaddour, H., Fa, N., Burton, I., Deleu, M., Lins, L., Schanck, A., Brasseur, R., Dufrene, Y.F., Goormaghtigh, E., and Mingeot-Leclercq, M.P. (2008). Characterization of the interactions between fluoroquinolone antibiotics and lipids: a multitechniqueapproach. Biophysical journal 94, 3035-3046.
Pubmed: Author and TitleCrossRef: Author and TitleGoogle Scholar: Author Only Title Only Author and Title
Blaas, N., and Humpf, H.U. (2013). Structural profiling and quantitation of glycosyl inositol phosphoceramides in plants with Fouriertransform mass spectrometry. Journal of agricultural and food chemistry 61, 4257-4269.
Pubmed: Author and TitleCrossRef: Author and TitleGoogle Scholar: Author Only Title Only Author and Title
Borner, G.H., Sherrier, D.J., Weimar, T., Michaelson, L.V., Hawkins, N.D., Macaskill, A., Napier, J.A., Beale, M.H., Lilley, K.S., andDupree, P. (2005). Analysis of detergent-resistant membranes in Arabidopsis. Evidence for plasma membrane lipid rafts. Plantphysiology 137, 104-116.
Pubmed: Author and TitleCrossRef: Author and TitleGoogle Scholar: Author Only Title Only Author and Title
Brasseur, R. (1990). TAMMO: theoretical analysis of membrane molecular organisation,. In Mol. Descr. Biol. Membr. Componentsby Comput. Conform. Anal., (CRC Press, Boca Raton), pp. pp. 203-219.
Pubmed: Author and TitleCrossRef: Author and TitleGoogle Scholar: Author Only Title Only Author and Title
Bure, C., Cacas, J.L., Wang, F., Gaudin, K., Domergue, F., Mongrand, S., and Schmitter, J.M. (2011). Fast screening of highlyglycosylated plant sphingolipids by tandem mass spectrometry. Rapid communications in mass spectrometry : RCM 25, 3131-3145.
Pubmed: Author and TitleCrossRef: Author and TitleGoogle Scholar: Author Only Title Only Author and Title
Cacas, J.L., Melser, S., Domergue, F., Joubes, J., Bourdenx, B., Schmitter, J.M., and Mongrand, S. (2012a). Rapid nanoscalequantitative analysis of plant sphingolipid long-chain bases by GC-MS. Analytical and bioanalytical chemistry 403, 2745-2755.
Pubmed: Author and TitleCrossRef: Author and TitleGoogle Scholar: Author Only Title Only Author and Title
Cacas, J.L., Bure, C., Furt, F., Maalouf, J.P., Badoc, A., Cluzet, S., Schmitter, J.M., Antajan, E., and Mongrand, S. (2013). Biochemicalsurvey of the polar head of plant glycosylinositolphosphoceramides unravels broad diversity. Phytochemistry 96, 191-200.
Pubmed: Author and TitleCrossRef: Author and TitleGoogle Scholar: Author Only Title Only Author and Title
Cacas, J.L., Furt, F., Le Guedard, M., Schmitter, J.M., Bure, C., Gerbeau-Pissot, P., Moreau, P., Bessoule, J.J., Simon-Plas, F., andMongrand, S. (2012b). Lipids of plant membrane rafts. Progress in lipid research 51, 272-299.
Pubmed: Author and TitleCrossRef: Author and TitleGoogle Scholar: Author Only Title Only Author and Title
Carmona-Salazar, L., El Hafidi, M., Gutierrez-Najera, N., Noyola-Martinez, L., Gonzalez-Solis, A., and Gavilanes-Ruiz, M. (2015).Fatty acid profiles from the plasma membrane and detergent resistant membranes of two plant species. Phytochemistry 109, 25-35.
Pubmed: Author and TitleCrossRef: Author and TitleGoogle Scholar: Author Only Title Only Author and Title
Carter, H.E., Gigg, R.H., Law, J.H., Nakayama, T., and Weber, E. (1958). Biochemistry of the sphingolipides. XI. Structure ofphytoglycolipide. The Journal of biological chemistry 233, 1309-1314.
Pubmed: Author and TitleCrossRef: Author and TitleGoogle Scholar: Author Only Title Only Author and Title
Cheng, H.T., Megha, and London, E. (2009). Preparation and properties of asymmetric vesicles that mimic cell membranes: effectupon lipid raft formation and transmembrane helix orientation. The Journal of biological chemistry 284, 6079-6092.
Pubmed: Author and TitleCrossRef: Author and TitleGoogle Scholar: Author Only Title Only Author and Title
Deleu, M., Crowet, J.M., Nasir, M.N., and Lins, L. (2014). Complementary biophysical tools to investigate lipid specificity in theinteraction between bioactive molecules and the plasma membrane: A review. Biochimica et biophysica acta 1838, 3171-3190.
Pubmed: Author and TitleCrossRef: Author and TitleGoogle Scholar: Author Only Title Only Author and Title
Deleu, M., Nott, K., Brasseur, R., Jacques, P., Thonart, P., and Dufrene, Y.F. (2001). Imaging mixed lipid monolayers by dynamicatomic force microscopy. Biochimica et biophysica acta 1513, 55-62.
Pubmed: Author and Title www.plantphysiol.orgon September 15, 2018 - Published by Downloaded from
Copyright © 2015 American Society of Plant Biologists. All rights reserved.
CrossRef: Author and TitleGoogle Scholar: Author Only Title Only Author and Title
Devaux, P.F., and Morris, R. (2004). Transmembrane asymmetry and lateral domains in biological membranes. Traffic 5, 241-246.Pubmed: Author and TitleCrossRef: Author and TitleGoogle Scholar: Author Only Title Only Author and Title
Di Paolo, G., and De Camilli, P. (2006). Phosphoinositides in cell regulation and membrane dynamics. Nature 443, 651-657.Pubmed: Author and TitleCrossRef: Author and TitleGoogle Scholar: Author Only Title Only Author and Title
Ducarme, P., Rahman, M., and Brasseur, R. (1998). IMPALA: a simple restraint field to simulate the biological membrane inmolecular structure studies. Proteins 30, 357-371.
Pubmed: Author and TitleCrossRef: Author and TitleGoogle Scholar: Author Only Title Only Author and Title
Eeman, M., Deleu, M., Paquot, M., Thonart, P., and Dufrene, Y.F. (2005). Nanoscale properties of mixed fengycin/ceramidemonolayers explored using atomic force microscopy. Langmuir : the ACS journal of surfaces and colloids 21, 2505-2511.
Pubmed: Author and TitleCrossRef: Author and TitleGoogle Scholar: Author Only Title Only Author and Title
Eisenberg, S., Shvartsman, D.E., Ehrlich, M., and Henis, Y.I. (2006). Clustering of raft-associated proteins in the external membraneleaflet modulates internal leaflet H-ras diffusion and signaling. Molecular and cellular biology 26, 7190-7200.
Pubmed: Author and TitleCrossRef: Author and TitleGoogle Scholar: Author Only Title Only Author and Title
Fa, N., Lins, L., Courtoy, P.J., Dufrene, Y., Van Der Smissen, P., Brasseur, R., Tyteca, D., and Mingeot-Leclercq, M.P. (2007).Decrease of elastic moduli of DOPC bilayers induced by a macrolide antibiotic, azithromycin. Biochimica et biophysica acta 1768,1830-1838.
Pubmed: Author and TitleCrossRef: Author and TitleGoogle Scholar: Author Only Title Only Author and Title
Fang, K., Zou, G., and He, P. (2003). Dynamic viscoelastic properties of spread monostearin monolayer in the presence of glycine.Journal of colloid and interface science 266, 407-414.
Pubmed: Author and TitleCrossRef: Author and TitleGoogle Scholar: Author Only Title Only Author and Title
Frazier, Z., and Alber, F. (2012). A computational approach to increase time scales in Brownian dynamics-based reaction-diffusionmodeling. Journal of computational biology : a journal of computational molecular cell biology 19, 606-618.
Pubmed: Author and TitleCrossRef: Author and TitleGoogle Scholar: Author Only Title Only Author and Title
Furt, F., Simon-Plas, F., and Mongrand, S. (2011). Lipids of the plasma membrane. In The Plant Plasma Membrane. Plant CellMonographs 19., A.S. Murphy, P. Wendy, and B. Schulz, eds (Heidelberg: Springer-Verlag), pp. 3-30.
Pubmed: Author and TitleCrossRef: Author and TitleGoogle Scholar: Author Only Title Only Author and Title
Furt, F., Konig, S., Bessoule, J.J., Sargueil, F., Zallot, R., Stanislas, T., Noirot, E., Lherminier, J., Simon-Plas, F., Heilmann, I., andMongrand, S. (2010). Polyphosphoinositides are enriched in plant membrane rafts and form microdomains in the plasmamembrane. Plant physiology 152, 2173-2187.
Pubmed: Author and TitleCrossRef: Author and TitleGoogle Scholar: Author Only Title Only Author and Title
Gaines, G.L. (1966). Insoluble Monolayers at liquid-gas Interfaces (
Garssen, M.P., van Koningsveld, R., van Doorn, P.A., Merkies, I.S., Scheltens-de Boer, M., van Leusden, J.A., van Schaik, I.N.,Linssen, W.H., Visscher, F., Boon, A.M., Faber, C.G., Meulstee, J., Prick, M.J., van den Berg, L.H., Franssen, H., Hiel, J.A., van denBergh, P.Y., and Sindic, C.J. (2007). Treatment of Guillain-Barre syndrome with mycophenolate mofetil: a pilot study. Journal ofneurology, neurosurgery, and psychiatry 78, 1012-1013.
Pubmed: Author and TitleCrossRef: Author and TitleGoogle Scholar: Author Only Title Only Author and Title
Grosjean, K., Mongrand, S., Beney, L., Simon-Plas, F., and Gerbeau-Pissot, P. (2015). Differential effect of plant lipids onmembrane organization: hot features and specificities of phytosphingolipids and phytosterols. The Journal of biological chemistry.
Pubmed: Author and TitleCrossRef: Author and TitleGoogle Scholar: Author Only Title Only Author and Title
Haimi, P., Uphoff, A., Hermansson, M., and Somerharju, P. (2006). Software tools for analysis of mass spectrometric lipidome data.Anal Chem 78, 8324-8331. www.plantphysiol.orgon September 15, 2018 - Published by Downloaded from
Copyright © 2015 American Society of Plant Biologists. All rights reserved.

Anal Chem 78, 8324-8331.Pubmed: Author and TitleCrossRef: Author and TitleGoogle Scholar: Author Only Title Only Author and Title
Hernandez, L.E., Perotto, S., Brewin, N.J., and Drobak, B.K. (1995). A novel inositol-lipid in plant-bacteria symbiosis. BiochemicalSociety transactions 23, 582S.
Pubmed: Author and TitleCrossRef: Author and TitleGoogle Scholar: Author Only Title Only Author and Title
Jacobson, K., Mouritsen, O.G., and Anderson, R.G. (2007). Lipid rafts: at a crossroad between cell biology and physics. Nature cellbiology 9, 7-14.
Pubmed: Author and TitleCrossRef: Author and TitleGoogle Scholar: Author Only Title Only Author and Title
Jarsch, I.K., Konrad, S.S., Stratil, T.F., Urbanus, S.L., Szymanski, W., Braun, P., Braun, K.H., and Ott, T. (2014). Plasma MembranesAre Subcompartmentalized into a Plethora of Coexisting and Diverse Microdomains in Arabidopsis and Nicotiana benthamiana.The Plant cell 26, 1698-1711.
Pubmed: Author and TitleCrossRef: Author and TitleGoogle Scholar: Author Only Title Only Author and Title
Kaul, K., and Lester, R.L. (1975). Characterization of Inositol-containing Phosphosphingolipids from Tobacco Leaves: Isolation andIdentification of Two Novel, Major Lipids: N-Acetylglucosamidoglucuronidoinositol Phosphorylceramide andGlucosamidoglucuronidoinositol Phosphorylceramide. Plant physiology 55, 120-129.
Pubmed: Author and TitleCrossRef: Author and TitleGoogle Scholar: Author Only Title Only Author and Title
Lefebvre, B., Furt, F., Hartmann, M.A., Michaelson, L.V., Carde, J.P., Sargueil-Boiron, F., Rossignol, M., Napier, J.A., Cullimore, J.,Bessoule, J.J., and Mongrand, S. (2007). Characterization of lipid rafts from Medicago truncatula root plasma membranes: aproteomic study reveals the presence of a raft-associated redox system. Plant physiology 144, 402-418.
Pubmed: Author and TitleCrossRef: Author and TitleGoogle Scholar: Author Only Title Only Author and Title
Lins, L., and Brasseur, R. (1995). The hydrophobic effect in protein folding. FASEB journal : official publication of the Federation ofAmerican Societies for Experimental Biology 9, 535-540.
Pubmed: Author and TitleCrossRef: Author and TitleGoogle Scholar: Author Only Title Only Author and Title
Lins, L., Charloteaux, B., Thomas, A., and Brasseur, R. (2001). Computational study of lipid-destabilizing protein fragments: towardsa comprehensive view of tilted peptides. Proteins 44, 435-447.
Pubmed: Author and TitleCrossRef: Author and TitleGoogle Scholar: Author Only Title Only Author and Title
Lins, L., Brasseur, R., Malaisse, W.J., Biesemans, M., Verheyden, P., and Willem, R. (1996). Importance of the hydrophobic energy:structural determination of a hypoglycemic drug of the meglitinide family by nuclear magnetic resonance and molecular modeling.Biochemical pharmacology 52, 1155-1168.
Pubmed: Author and TitleCrossRef: Author and TitleGoogle Scholar: Author Only Title Only Author and Title
Lins, L., Thomas-Soumarmon, A., Pillot, T., Vandekerchkhove, J., Rosseneu, M., and Brasseur, R. (1999). Molecular determinants ofthe interaction between the C-terminal domain of Alzheimer's beta-amyloid peptide and apolipoprotein E alpha-helices. Journal ofneurochemistry 73, 758-769.
Pubmed: Author and TitleCrossRef: Author and TitleGoogle Scholar: Author Only Title Only Author and Title
Maget-Dana, R. (1999). The monolayer technique: a potent tool for studying the interfacial properties of antimicrobial andmembrane-lytic peptides and their interactions with lipid membranes. Biochimica et biophysica acta 1462, 109-140.
Pubmed: Author and TitleCrossRef: Author and TitleGoogle Scholar: Author Only Title Only Author and Title
Markham, J.E., Li, J., Cahoon, E.B., and Jaworski, J.G. (2006). Separation and identification of major plant sphingolipid classes fromleaves. The Journal of biological chemistry 281, 22684-22694.
Pubmed: Author and TitleCrossRef: Author and TitleGoogle Scholar: Author Only Title Only Author and Title
Martiniere, A., Lavagi, I., Nageswaran, G., Rolfe, D.J., Maneta-Peyret, L., Luu, D.T., Botchway, S.W., Webb, S.E., Mongrand, S.,Maurel, C., Martin-Fernandez, M.L., Kleine-Vehn, J., Friml, J., Moreau, P., and Runions, J. (2012). Cell wall constrains lateraldiffusion of plant plasma-membrane proteins. Proceedings of the National Academy of Sciences of the United States of America109, 12805-12810.
Pubmed: Author and Title www.plantphysiol.orgon September 15, 2018 - Published by Downloaded from Copyright © 2015 American Society of Plant Biologists. All rights reserved.
CrossRef: Author and TitleGoogle Scholar: Author Only Title Only Author and Title
Masserini, M., Palestini, P., and Freire, E. (1989). Influence of glycolipid oligosaccharide and long-chain base composition on thethermotropic properties of dipalmitoylphosphatidylcholine large unilamellar vesicles containing gangliosides. Biochemistry 28,5029-5034.
Pubmed: Author and TitleCrossRef: Author and TitleGoogle Scholar: Author Only Title Only Author and Title
Matyash, V., Liebisch, G., Kurzchalia, T.V., Shevchenko, A., and Schwudke, D. (2008). Lipid extraction by methyl-tert-butyl ether forhigh-throughput lipidomics. Journal of lipid research 49, 1137-1146.
Pubmed: Author and TitleCrossRef: Author and TitleGoogle Scholar: Author Only Title Only Author and Title
Mongrand, S., Stanislas, T., Bayer, E.M., Lherminier, J., and Simon-Plas, F. (2010). Membrane rafts in plant cells. Trends in plantscience 15, 656-663.
Pubmed: Author and TitleCrossRef: Author and TitleGoogle Scholar: Author Only Title Only Author and Title
Mongrand, S., Morel, J., Laroche, J., Claverol, S., Carde, J.P., Hartmann, M.A., Bonneu, M., Simon-Plas, F., Lessire, R., andBessoule, J.J. (2004). Lipid rafts in higher plant cells: purification and characterization of Triton X-100-insoluble microdomainsfrom tobacco plasma membrane. The Journal of biological chemistry 279, 36277-36286.
Pubmed: Author and TitleCrossRef: Author and TitleGoogle Scholar: Author Only Title Only Author and Title
Morel, J., Claverol, S., Mongrand, S., Furt, F., Fromentin, J., Bessoule, J.J., Blein, J.P., and Simon-Plas, F. (2006). Proteomics ofplant detergent-resistant membranes. Molecular & cellular proteomics : MCP 5, 1396-1411.
Pubmed: Author and TitleCrossRef: Author and TitleGoogle Scholar: Author Only Title Only Author and Title
Mortimer, J.C., Yu, X., Albrecht, S., Sicilia, F., Huichalaf, M., Ampuero, D., Michaelson, L.V., Murphy, A.M., Matsunaga, T., Kurz, S.,Stephens, E., Baldwin, T.C., Ishii, T., Napier, J.A., Weber, A.P., Handford, M.G., and Dupree, P. (2013). Abnormal glycosphingolipidmannosylation triggers salicylic acid-mediated responses in Arabidopsis. The Plant cell 25, 1881-1894.
Pubmed: Author and TitleCrossRef: Author and TitleGoogle Scholar: Author Only Title Only Author and Title
Mouritsen, O.G. (2010). The liquid-ordered state comes of age. Biochimica et biophysica acta 1798, 1286-1288.Pubmed: Author and TitleCrossRef: Author and TitleGoogle Scholar: Author Only Title Only Author and Title
Noirot, E., Der, C., Lherminier, J., Robert, F., Moricova, P., Kieu, K., Leborgne-Castel, N., Simon-Plas, F., and Bouhidel, K. (2014).Dynamic changes in the subcellular distribution of the tobacco ROS-producing enzyme RBOHD in response to the oomyceteelicitor cryptogein. Journal of experimental botany 65, 5011-5022.
Pubmed: Author and TitleCrossRef: Author and TitleGoogle Scholar: Author Only Title Only Author and Title
Pascher, I. (1976). Molecular arrangements in sphingolipids. Conformation and hydrogen bonding of ceramide and their implicationon membrane stability and permeability. Biochimica et biophysica acta 455, 433-451.
Pubmed: Author and TitleCrossRef: Author and TitleGoogle Scholar: Author Only Title Only Author and Title
Pata, M.O., Hannun, Y.A., and Ng, C.K. (2010). Plant sphingolipids: decoding the enigma of the Sphinx. The New phytologist 185,611-630.
Pubmed: Author and TitleCrossRef: Author and TitleGoogle Scholar: Author Only Title Only Author and Title
Quinn, P.J., and Wolf, C. (2009). The liquid-ordered phase in membranes. Biochimica et biophysica acta 1788, 33-46.Pubmed: Author and TitleCrossRef: Author and TitleGoogle Scholar: Author Only Title Only Author and Title
Raffaele, S., Bayer, E., Lafarge, D., Cluzet, S., German Retana, S., Boubekeur, T., Leborgne-Castel, N., Carde, J.P., Lherminier, J.,Noirot, E., Satiat-Jeunemaitre, B., Laroche-Traineau, J., Moreau, P., Ott, T., Maule, A.J., Reymond, P., Simon-Plas, F., Farmer, E.E.,Bessoule, J.J., and Mongrand, S. (2009). Remorin, a solanaceae protein resident in membrane rafts and plasmodesmata, impairspotato virus X movement. The Plant cell 21, 1541-1555.
Pubmed: Author and TitleCrossRef: Author and TitleGoogle Scholar: Author Only Title Only Author and Title
Rehman, R.U., Stigliano, E., Lycett, G.W., Sticher, L., Sbano, F., Faraco, M., Dalessandro, G., and Di Sansebastiano, G.P. (2008). www.plantphysiol.orgon September 15, 2018 - Published by Downloaded from
Copyright © 2015 American Society of Plant Biologists. All rights reserved.
Tomato Rab11a characterization evidenced a difference between SYP121-dependent and SYP122-dependent exocytosis. PlantCell Physiol 49, 751-766.
Pubmed: Author and TitleCrossRef: Author and TitleGoogle Scholar: Author Only Title Only Author and Title
Rennie, E.A., Ebert, B., Miles, G.P., Cahoon, R.E., Christiansen, K.M., Stonebloom, S., Khatab, H., Twell, D., Petzold, C.J., Adams,P.D., Dupree, P., Heazlewood, J.L., Cahoon, E.B., and Scheller, H.V. (2014). Identification of a sphingolipid alpha-glucuronosyltransferase that is essential for pollen function in Arabidopsis. The Plant cell 26, 3314-3325.
Pubmed: Author and TitleCrossRef: Author and TitleGoogle Scholar: Author Only Title Only Author and Title
Richards, R.L., Rao, M., Wassef, N.M., Glenn, G.M., Rothwell, S.W., and Alving, C.R. (1998). Liposomes containing lipid A serve asan adjuvant for induction of antibody and cytotoxic T-cell responses against RTS,S malaria antigen. Infection and immunity 66,2859-2865.
Pubmed: Author and TitleCrossRef: Author and TitleGoogle Scholar: Author Only Title Only Author and Title
Rideal, J.T.D.a.E.K. (1963). Interfacial Phenomena (
Ripley, B.D. (1976). The second order analysis of stationary point process. Journal of Applied Probability 13, 255-261.Pubmed: Author and TitleCrossRef: Author and TitleGoogle Scholar: Author Only Title Only Author and Title
Ruettinger, A., Kiselev, M.A., Hauss, T., Dante, S., Balagurov, A.M., and Neubert, R.H. (2008). Fatty acid interdigitation in stratumcorneum model membranes: a neutron diffraction study. European biophysics journal : EBJ 37, 759-771.
Pubmed: Author and TitleCrossRef: Author and TitleGoogle Scholar: Author Only Title Only Author and Title
Scheffer, L., Solomonov, I., Weygand, M.J., Kjaer, K., Leiserowitz, L., and Addadi, L. (2005). Structure of cholesterol/ceramidemonolayer mixtures: implications to the molecular organization of lipid rafts. Biophysical journal 88, 3381-3391.
Pubmed: Author and TitleCrossRef: Author and TitleGoogle Scholar: Author Only Title Only Author and Title
Shevchenko, A., and Simons, K. (2010). Lipidomics: coming to grips with lipid diversity. Nature reviews. Molecular cell biology 11,593-598.
Pubmed: Author and TitleCrossRef: Author and TitleGoogle Scholar: Author Only Title Only Author and Title
Simon-Plas, F., Perraki, A., Bayer, E., Gerbeau-Pissot, P., and Mongrand, S. (2011). An update on plant membrane rafts. Currentopinion in plant biology 14, 642-649.
Pubmed: Author and TitleCrossRef: Author and TitleGoogle Scholar: Author Only Title Only Author and Title
Simons, K., and Ikonen, E. (1997). Functional rafts in cell membranes. Nature 387, 569-572.Pubmed: Author and TitleCrossRef: Author and TitleGoogle Scholar: Author Only Title Only Author and Title
Simons, K., and Toomre, D. (2000). Lipid rafts and signal transduction. Nature reviews. Molecular cell biology 1, 31-39.Pubmed: Author and TitleCrossRef: Author and TitleGoogle Scholar: Author Only Title Only Author and Title
Simons, K., and Gerl, M.J. (2010). Revitalizing membrane rafts: new tools and insights. Nature reviews. Molecular cell biology 11,688-699.
Pubmed: Author and TitleCrossRef: Author and TitleGoogle Scholar: Author Only Title Only Author and Title
Sonnino, S., and Prinetti, A. (2010). Gangliosides as regulators of cell membrane organization and functions. Advances inexperimental medicine and biology 688, 165-184.
Pubmed: Author and TitleCrossRef: Author and TitleGoogle Scholar: Author Only Title Only Author and Title
Sperling, P., and Heinz, E. (2003). Plant sphingolipids: structural diversity, biosynthesis, first genes and functions. Biochimica etbiophysica acta 1632, 1-15.
Pubmed: Author and TitleCrossRef: Author and TitleGoogle Scholar: Author Only Title Only Author and Title
Sperling, P., Franke, S., Luthje, S., and Heinz, E. (2005). Are glucocerebrosides the predominant sphingolipids in plant plasmamembranes? Plant Physiol Biochem 43, 1031-1038. www.plantphysiol.orgon September 15, 2018 - Published by Downloaded from
Copyright © 2015 American Society of Plant Biologists. All rights reserved.
membranes? Plant Physiol Biochem 43, 1031-1038.Pubmed: Author and TitleCrossRef: Author and TitleGoogle Scholar: Author Only Title Only Author and Title
Subczynski, W.K., and Kusumi, A. (2003). Dynamics of raft molecules in the cell and artificial membranes: approaches by pulse EPRspin labeling and single molecule optical microscopy. Biochimica et biophysica acta 1610, 231-243.
Pubmed: Author and TitleCrossRef: Author and TitleGoogle Scholar: Author Only Title Only Author and Title
Tjellstrom, H., Hellgren, L.I., Wieslander, A., and Sandelius, A.S. (2010). Lipid asymmetry in plant plasma membranes: phosphatedeficiency-induced phospholipid replacement is restricted to the cytosolic leaflet. FASEB journal : official publication of theFederation of American Societies for Experimental Biology 24, 1128-1138.
Pubmed: Author and TitleCrossRef: Author and TitleGoogle Scholar: Author Only Title Only Author and Title
Vitiello, F., and Zanetta, J.P. (1978). Thin-layer chromatography of phospholipids. Journal of chromatography 166, 637-640.Pubmed: Author and TitleCrossRef: Author and TitleGoogle Scholar: Author Only Title Only Author and Title
Voxeur, A., and Fry, S.C. (2014). Glycosylinositol phosphorylceramides from Rosa cell cultures are boron-bridged in the plasmamembrane and form complexes with rhamnogalacturonan II. The Plant journal : for cell and molecular biology 79, 139-149.
Pubmed: Author and TitleCrossRef: Author and TitleGoogle Scholar: Author Only Title Only Author and Title
Wang, W., Yang, X., Tangchaiburana, S., Ndeh, R., Markham, J.E., Tsegaye, Y., Dunn, T.M., Wang, G.L., Bellizzi, M., Parsons, J.F.,Morrissey, D., Bravo, J.E., Lynch, D.V., and Xiao, S. (2008). An inositolphosphorylceramide synthase is involved in regulation ofplant programmed cell death associated with defense in Arabidopsis. The Plant cell 20, 3163-3179.
Pubmed: Author and TitleCrossRef: Author and TitleGoogle Scholar: Author Only Title Only Author and Title
Worrall, D., Ng, C.K., and Hetherington, A.M. (2003). Sphingolipids, new players in plant signaling. Trends in plant science 8, 317-320.
Pubmed: Author and TitleCrossRef: Author and TitleGoogle Scholar: Author Only Title Only Author and Title
Yetukuri, L., Ekroos, K., Vidal-Puig, A., and Oresic, M. (2008). Informatics and computational strategies for the study of lipids.Molecular bioSystems 4, 121-127.
Pubmed: Author and TitleCrossRef: Author and TitleGoogle Scholar: Author Only Title Only Author and Title
www.plantphysiol.orgon September 15, 2018 - Published by Downloaded from Copyright © 2015 American Society of Plant Biologists. All rights reserved.


![Auxin Signaling1[OPEN] - plantphysiol.org wielded by the conductor of an orchestra: “When the auxin baton points your way, it’s your turn to play whatevermusicalinstrumentyouhappentobeholding](https://img.pdfslide.us/doc/110x75/5b275bbc7f8b9a4b7e8b59d7/auxin-signaling1open-wielded-by-the-conductor-of-an-orchestra-when-the-auxin.jpg)


![[Francois Grosjean] Studying Bilinguals (Oxford Li(BookFi.org)](https://img.pdfslide.us/doc/110x75/5695d4b31a28ab9b02a26bdb/francois-grosjean-studying-bilinguals-oxford-libookfiorg.jpg)


