Embed Size (px)
Citation preview
1Correlations
Surface waves and correlations
Correlation of time series Similarity Time shifts
Applications Correlation of rotations/strains and translations Ambient noise correlations Coda correlations
Scope: Appreciate that the use of noise (and coda) plus correlation techniques is one of the most innovative direction in data analysis at the moment: passive imaging
2Correlations
Discrete Correlation
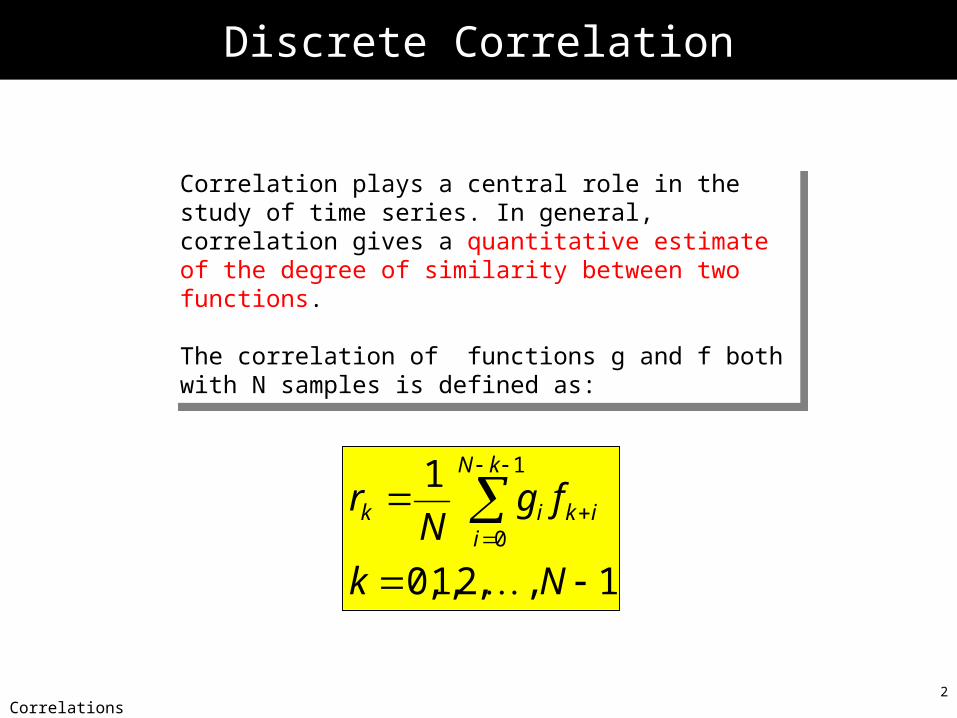
Correlation plays a central role in the study of time series. In general, correlation gives a quantitative estimate of the degree of similarity between two functions.
The correlation of functions g and f both with N samples is defined as:
Correlation plays a central role in the study of time series. In general, correlation gives a quantitative estimate of the degree of similarity between two functions.
The correlation of functions g and f both with N samples is defined as:
1,,2,1,0
1 1
0
Nk
fgN
rkN
iikik
3Correlations
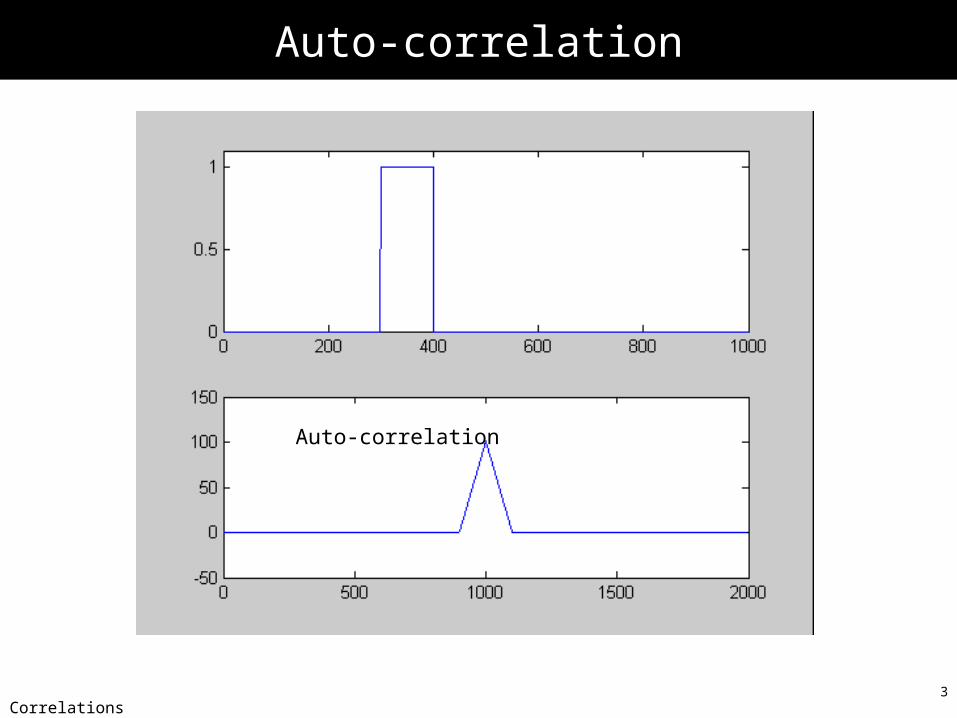
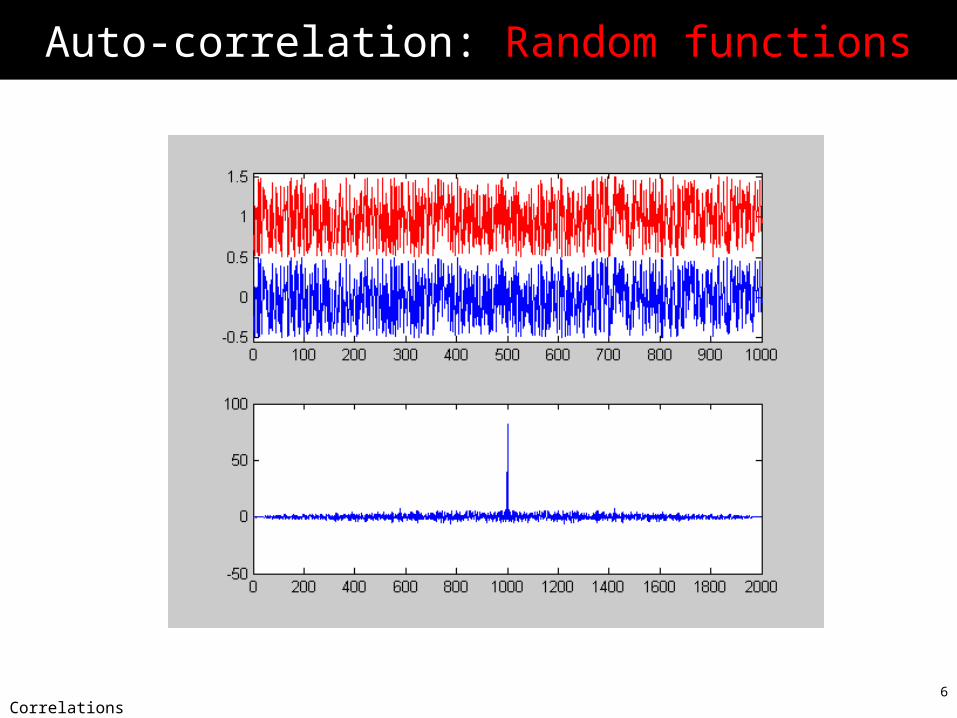
Auto-correlation
Auto-correlation
4Correlations
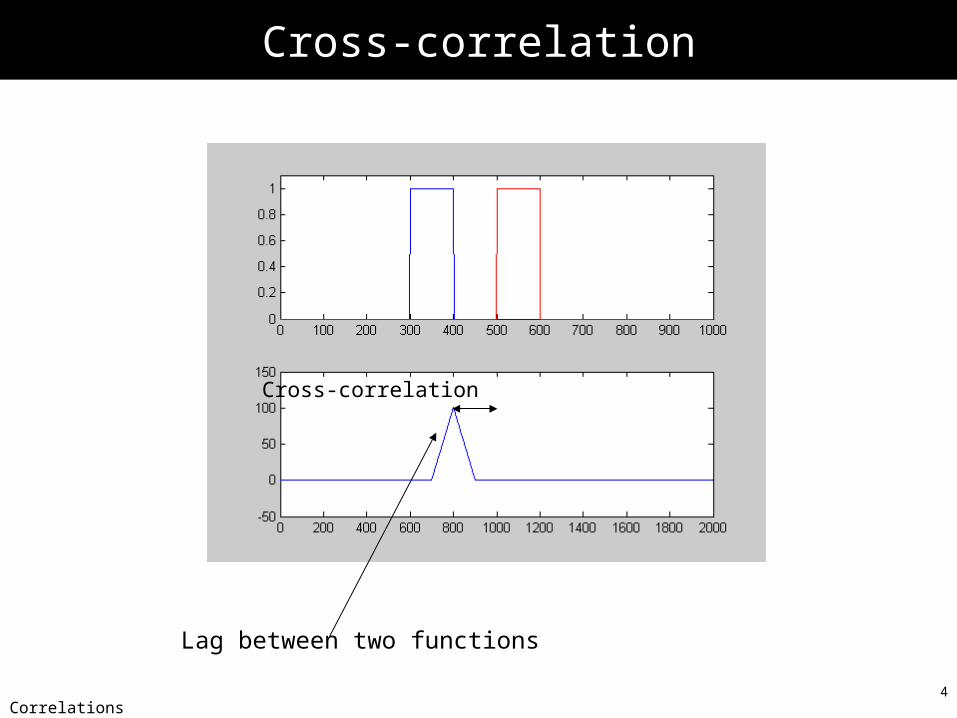
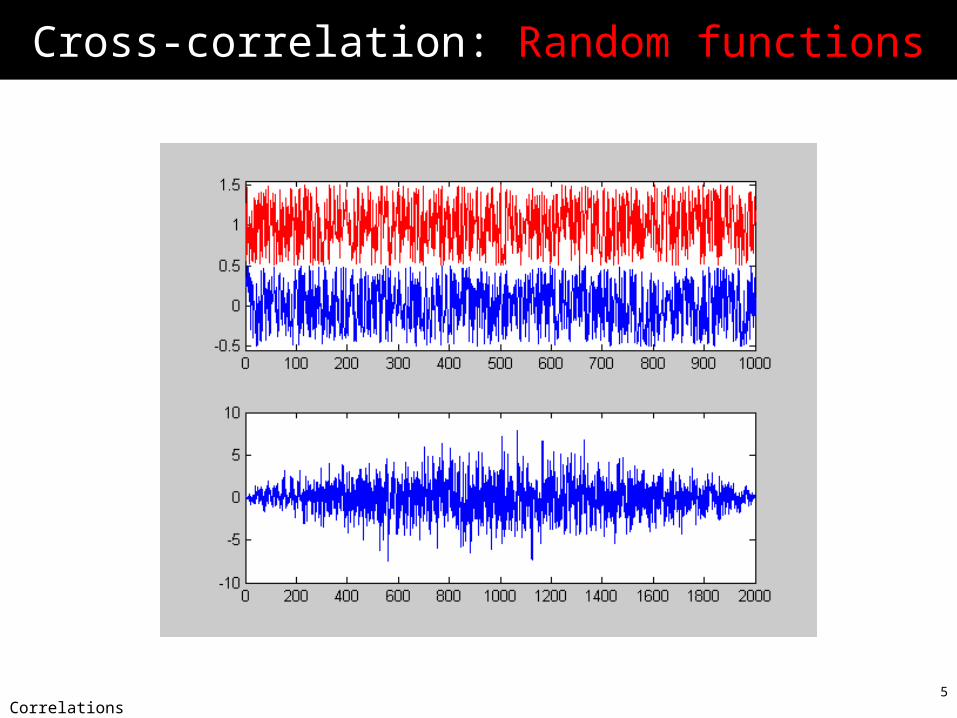
Cross-correlation
Lag between two functions
Cross-correlation
5Correlations
Cross-correlation: Random functions
6Correlations
Auto-correlation: Random functions
7Correlations
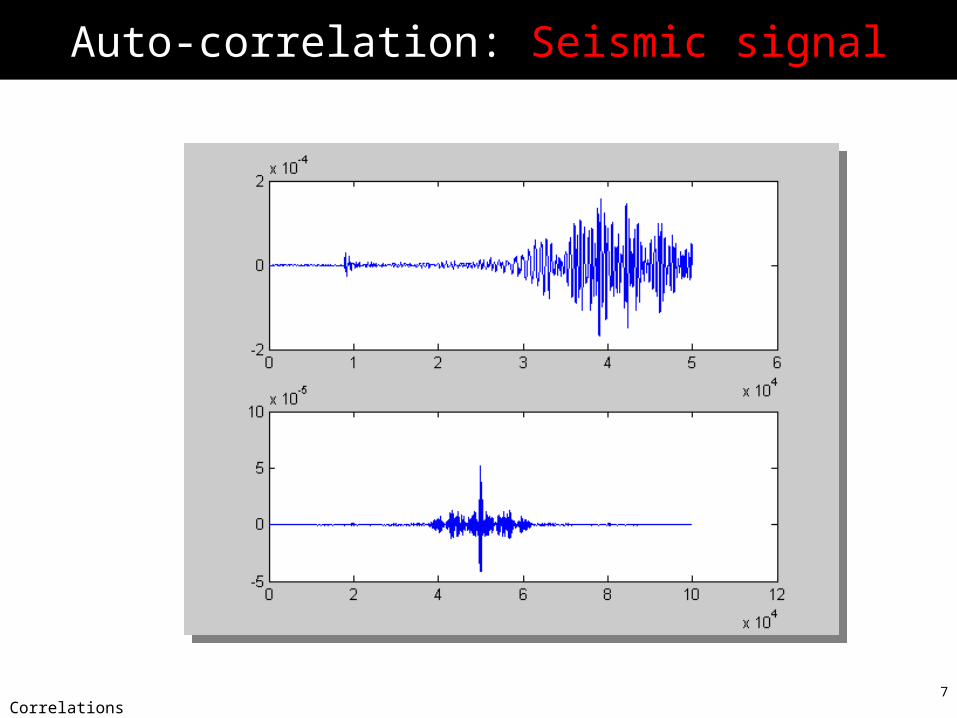
Auto-correlation: Seismic signal
8Correlations
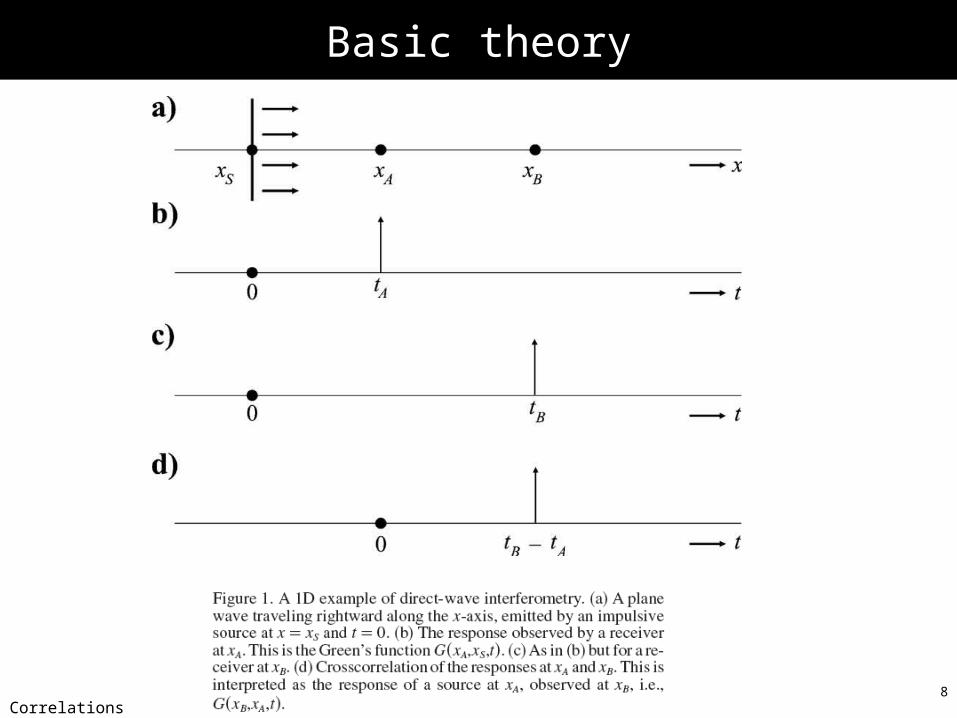
Basic theory
9Correlations
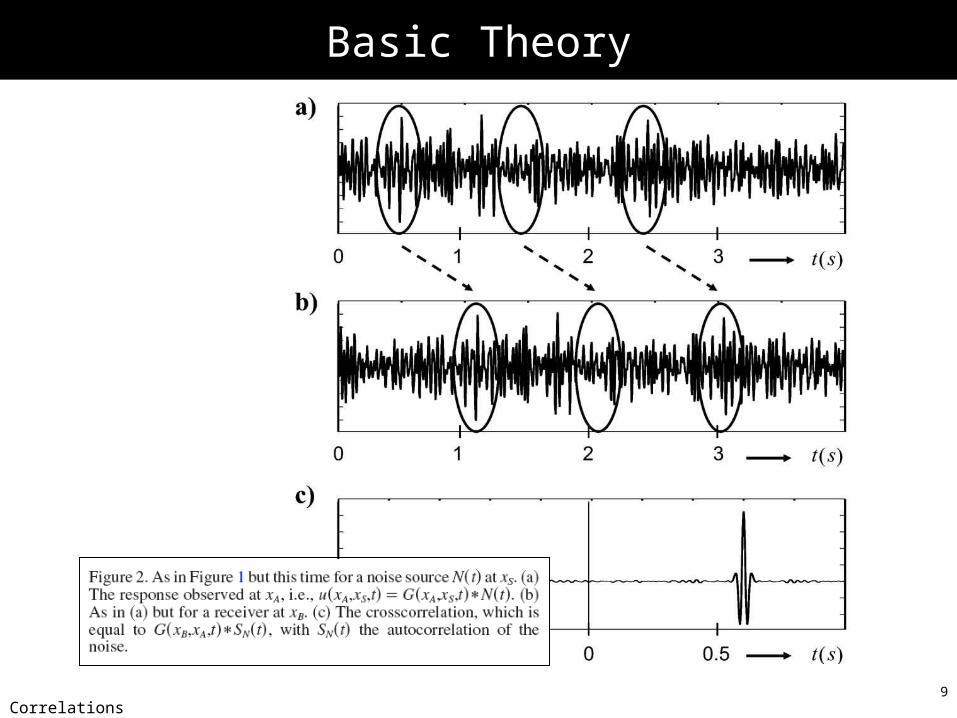
Basic Theory
10Correlations
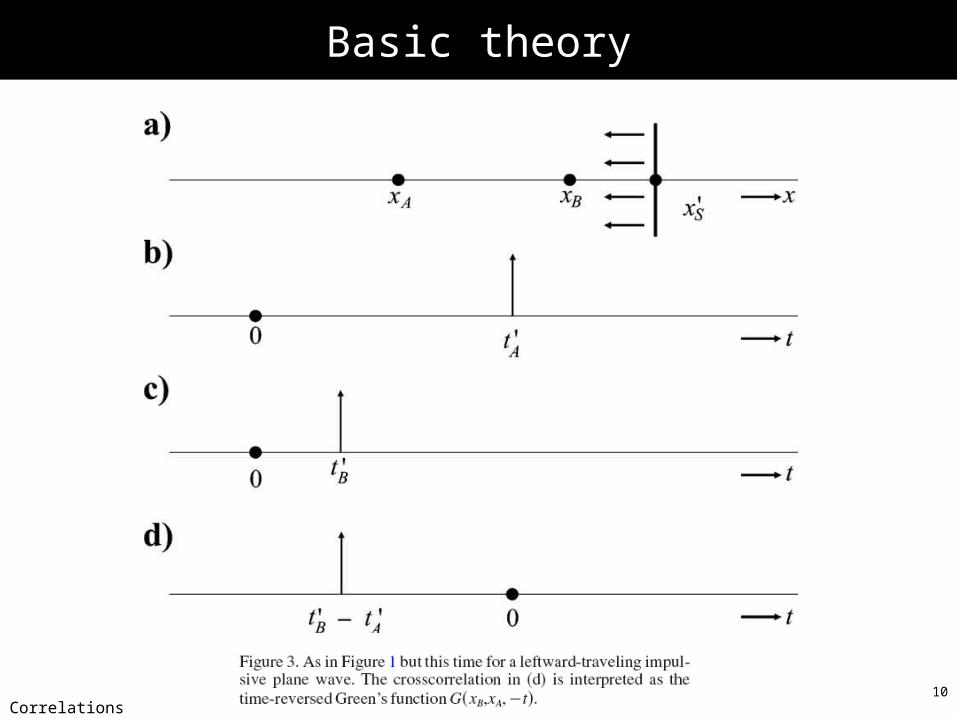
Basic theory
11Correlations
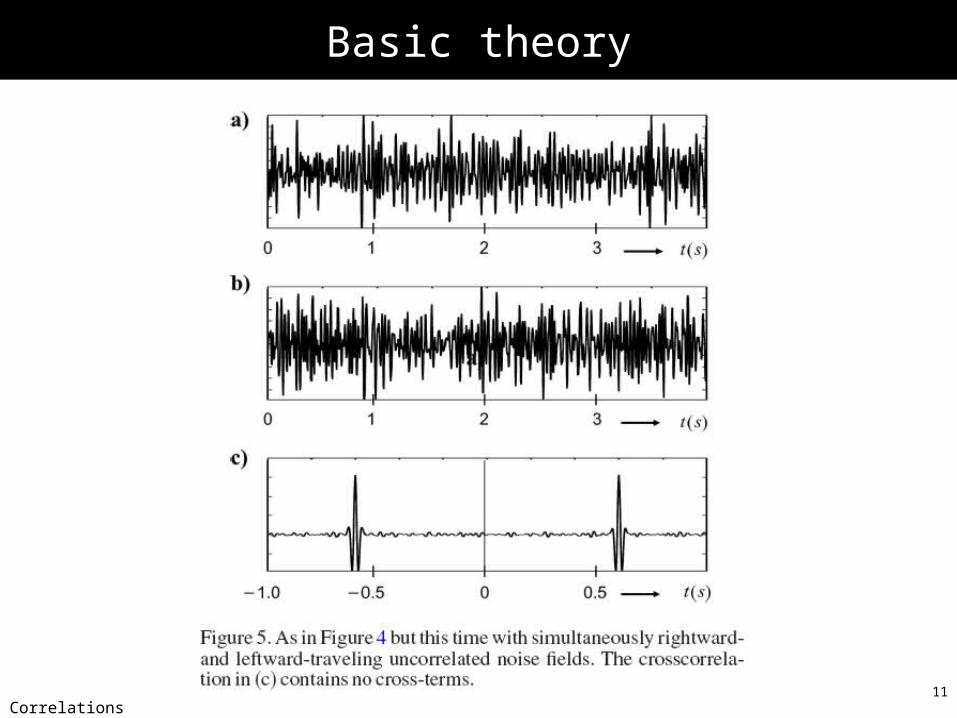
Basic theory
12Correlations
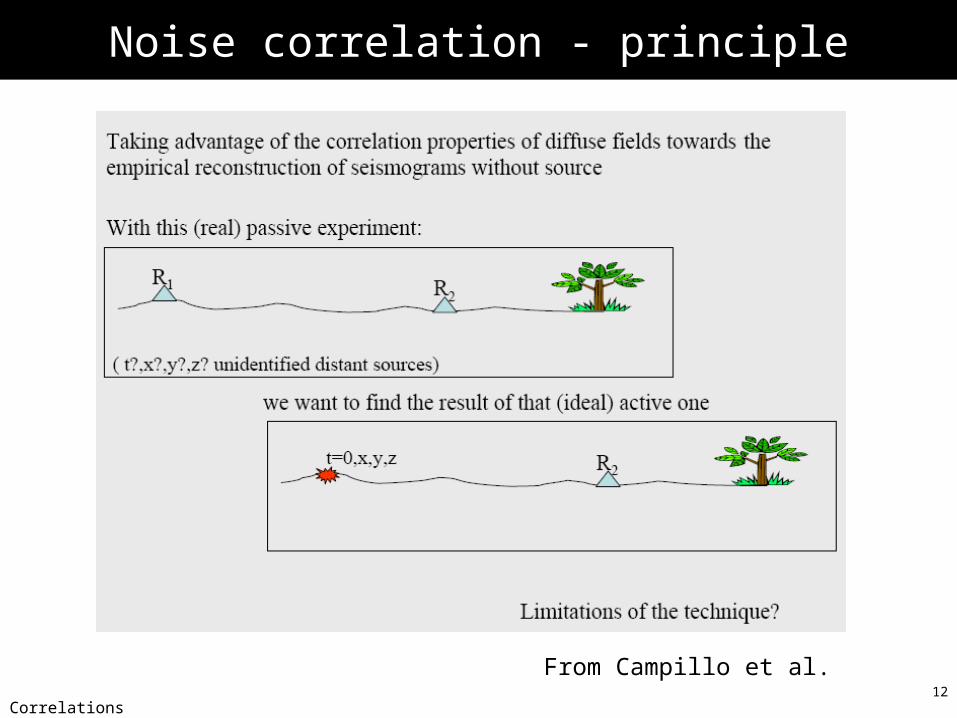
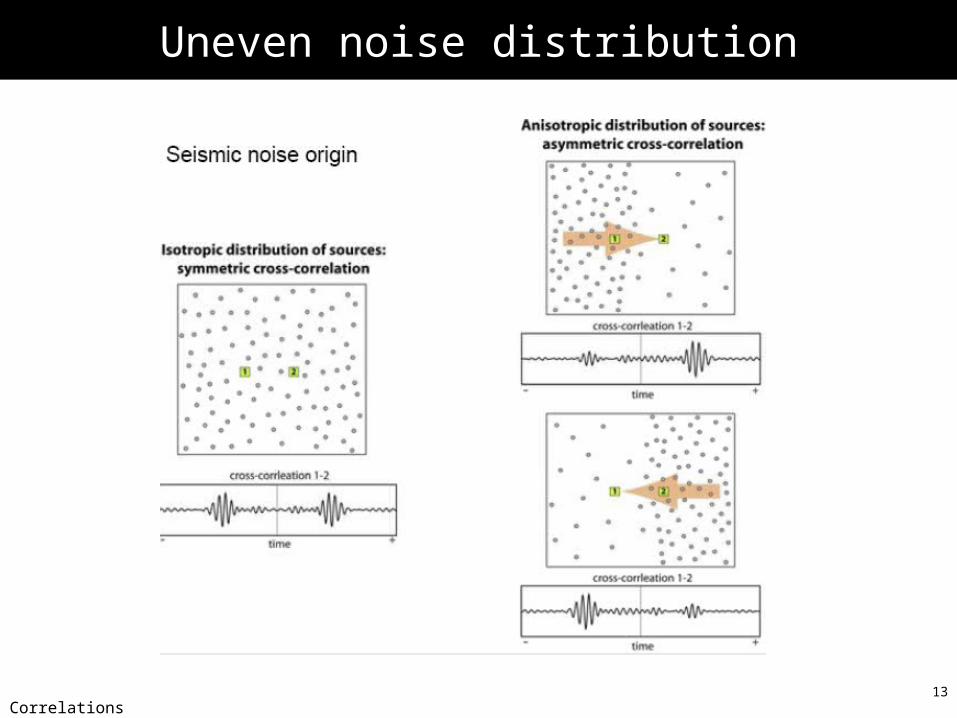
Noise correlation - principle
From Campillo et al.
13Correlations
Uneven noise distribution
14Correlations
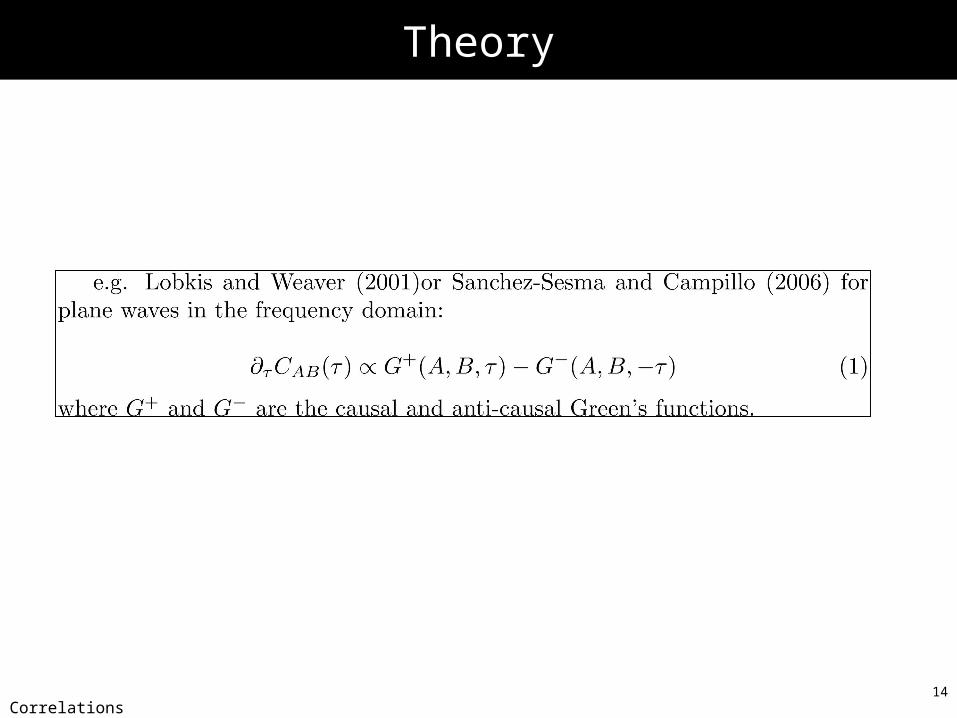
Theory
15Correlations
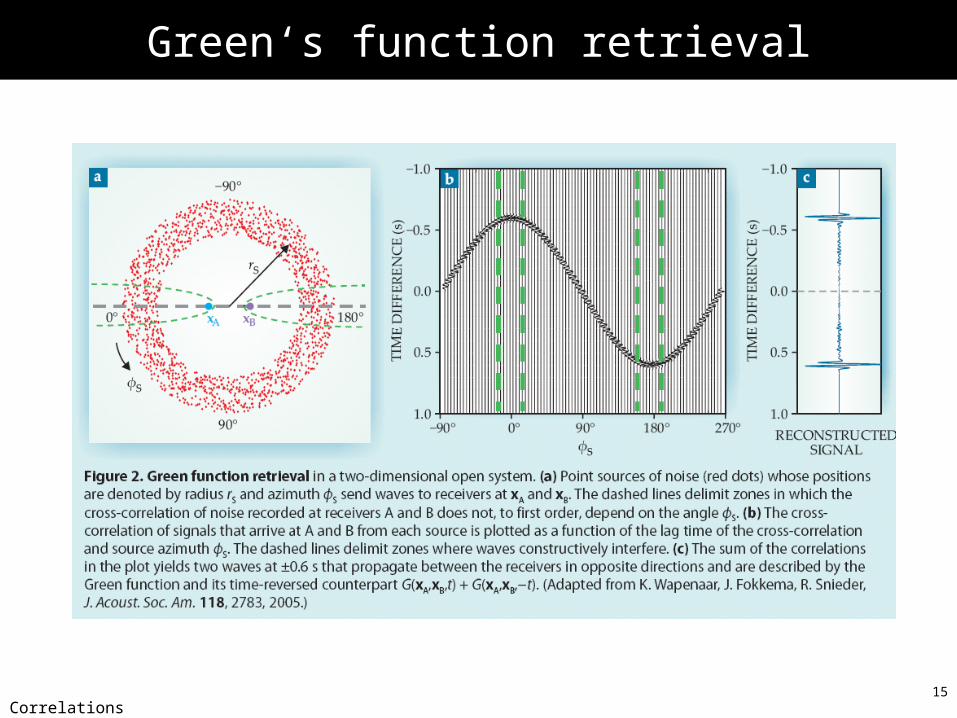
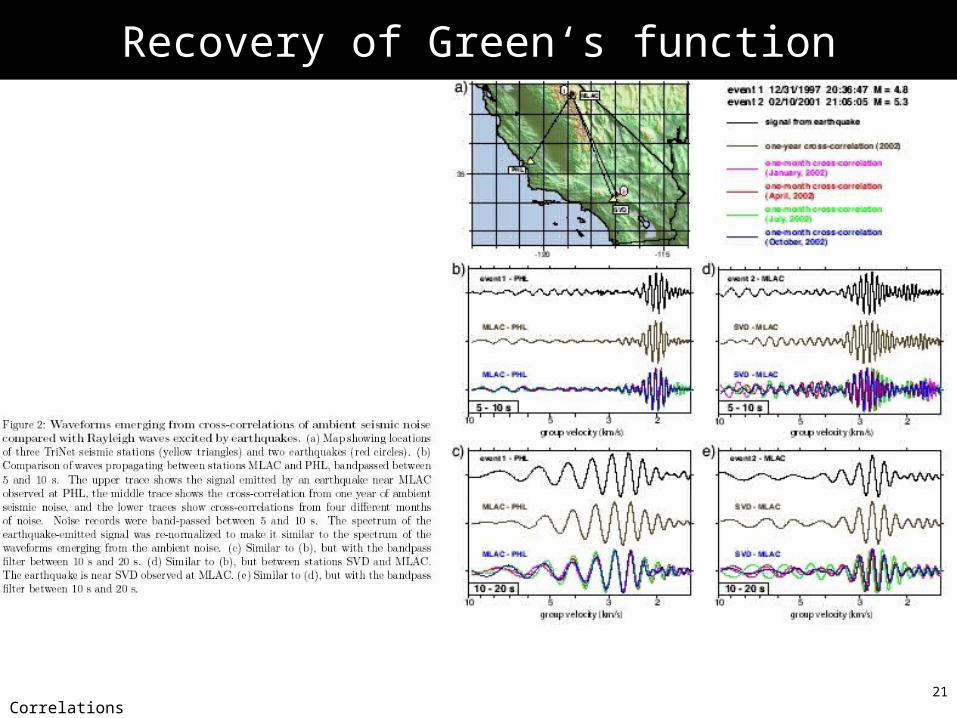
Green‘s function retrieval
16Correlations
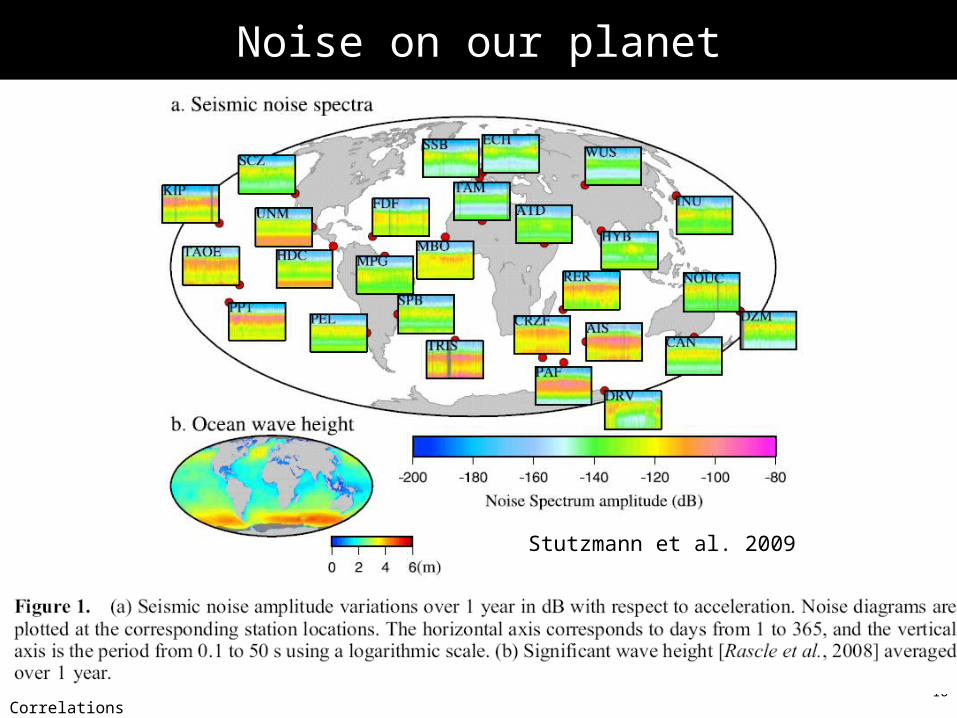
Noise on our planet
Stutzmann et al. 2009
17Correlations
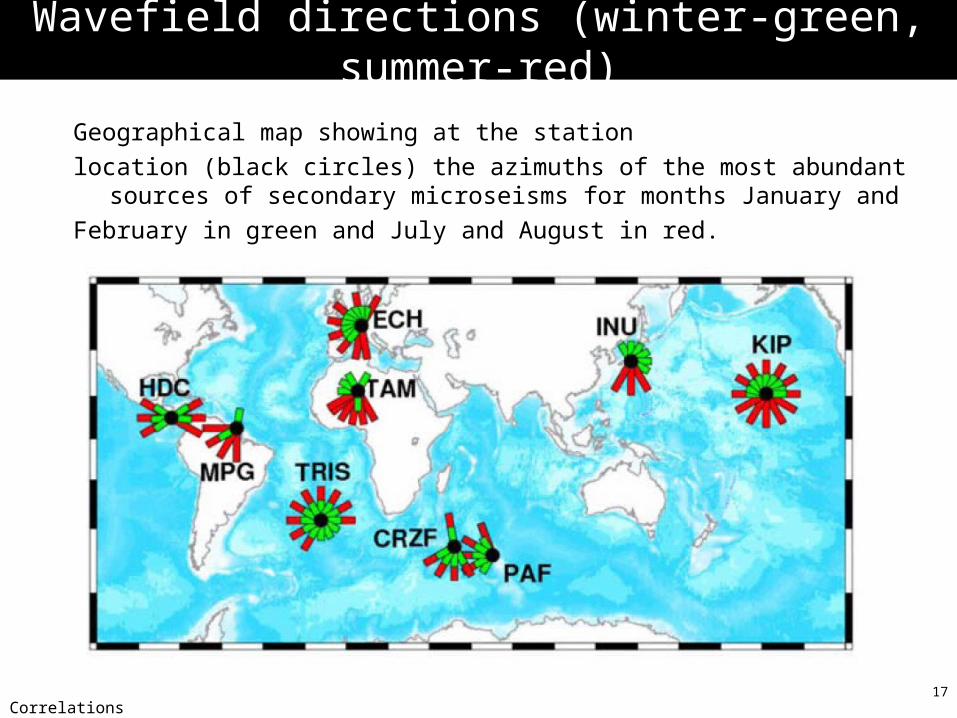
Wavefield directions (winter-green, summer-red)
Geographical map showing at the station
location (black circles) the azimuths of the most abundant sources of secondary microseisms for months January and
February in green and July and August in red.
18Correlations
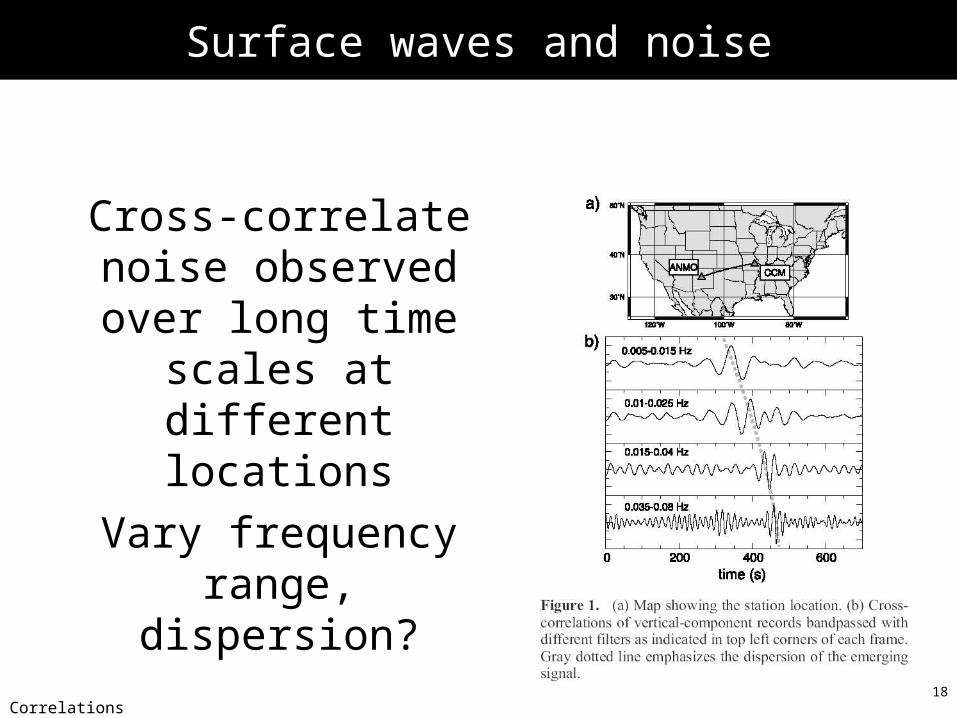
Surface waves and noise
Cross-correlate noise observed over long
time scales at different locations
Vary frequency range, dispersion?
19Correlations
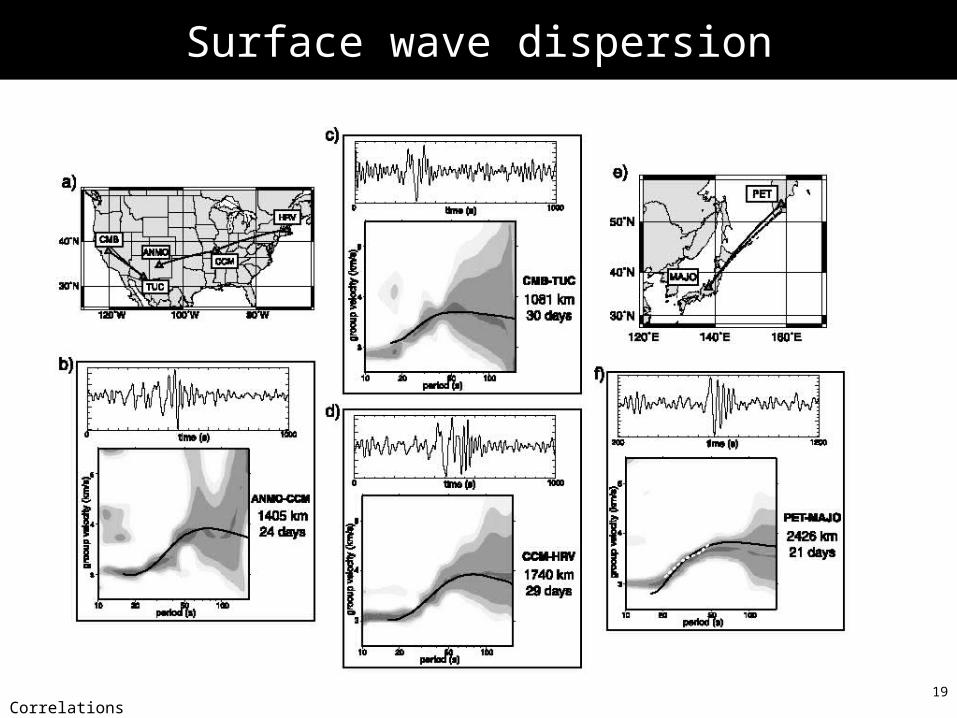
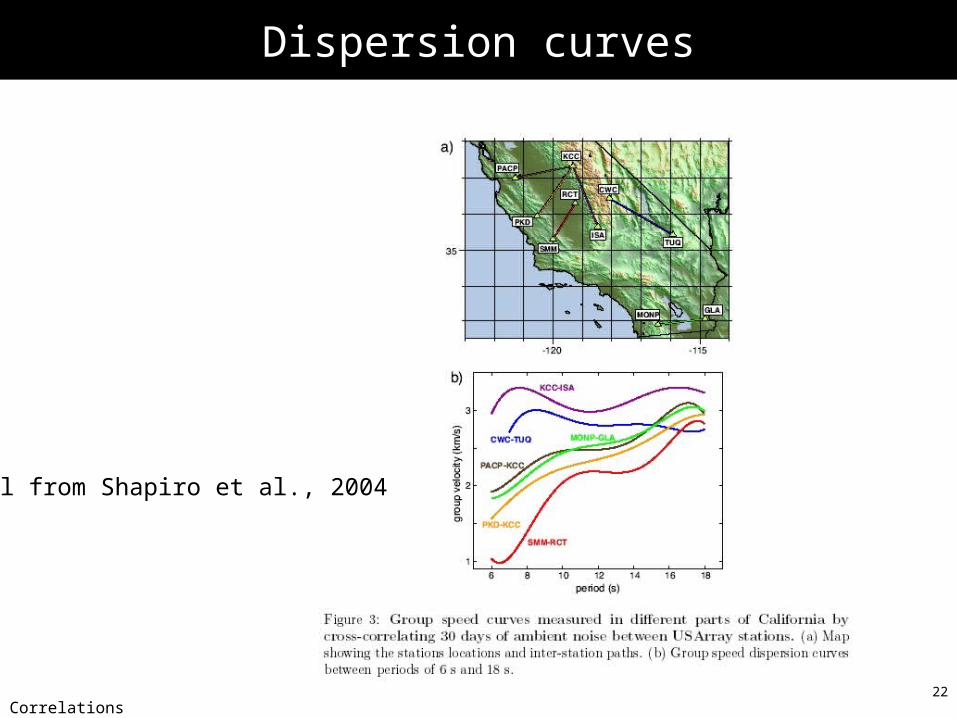
Surface wave dispersion
20Correlations
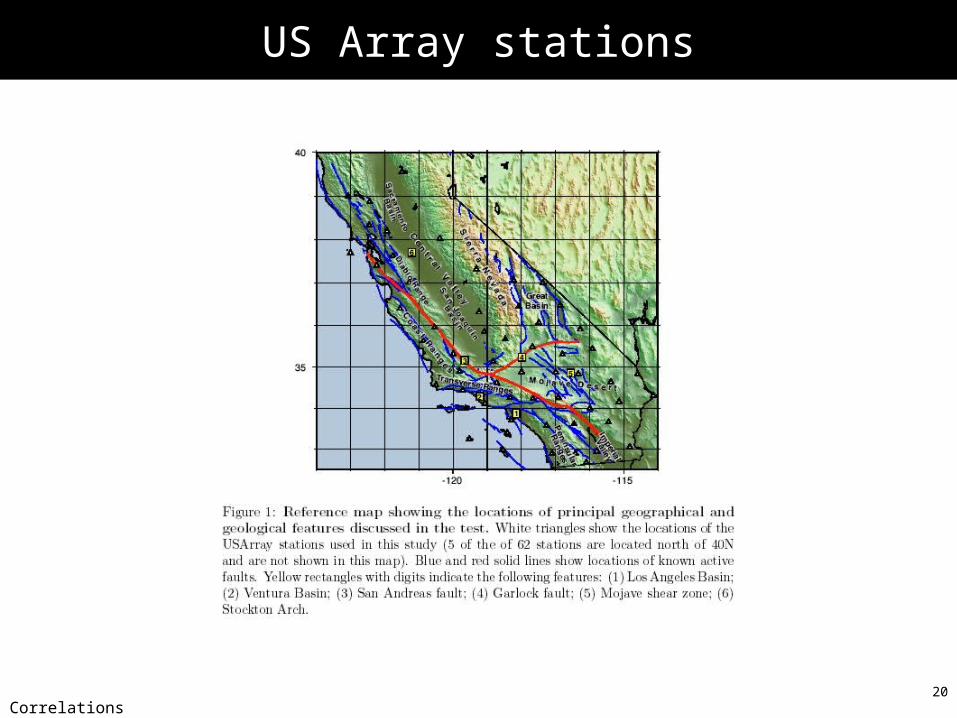
US Array stations
21Correlations
Recovery of Green‘s function
22Correlations
Dispersion curves
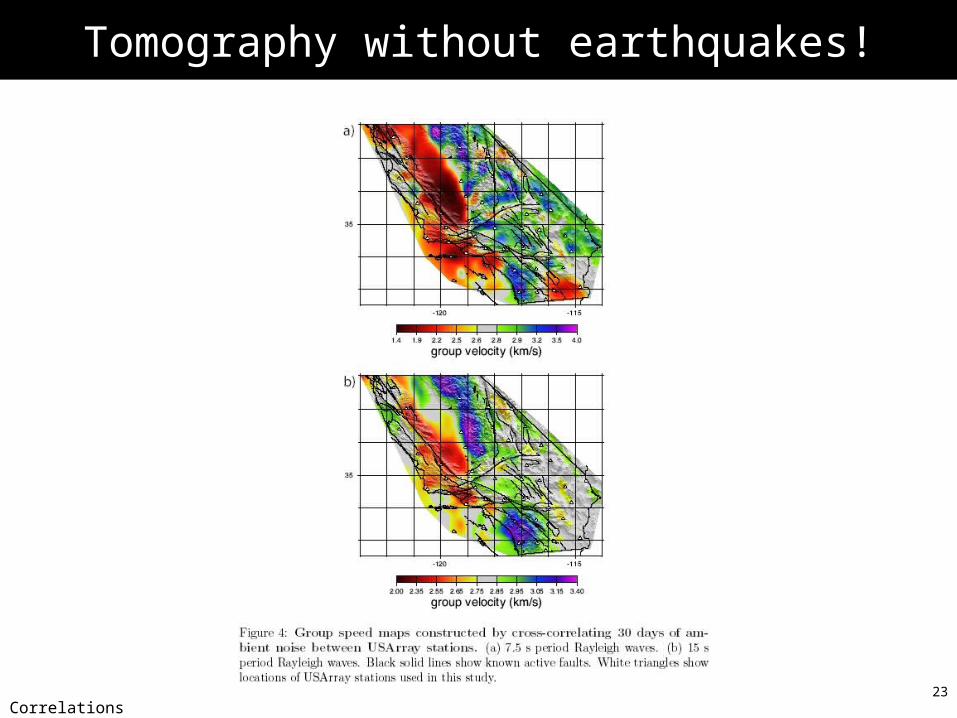
All from Shapiro et al., 2004
23Correlations
Tomography without earthquakes!
24Correlations
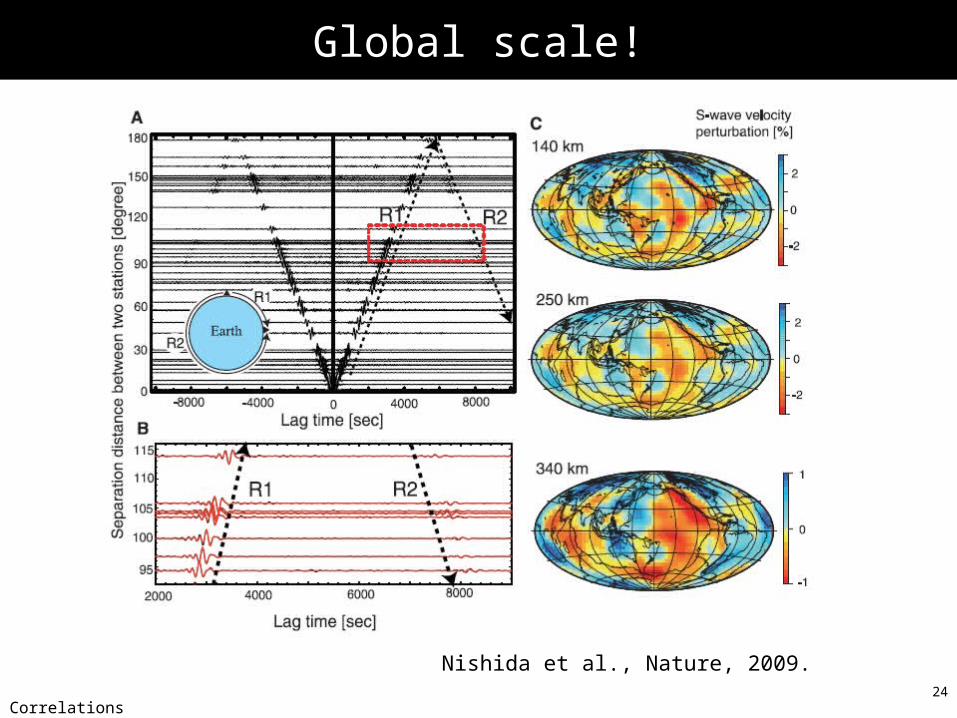
Global scale!
Nishida et al., Nature, 2009.
25Correlations
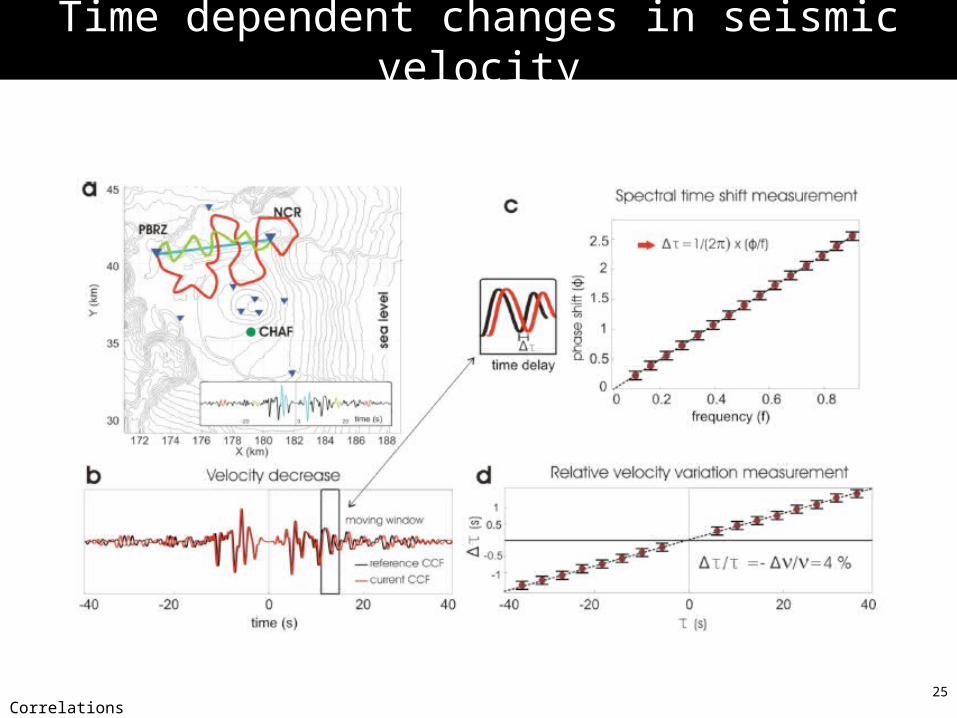
Time dependent changes in seismic velocity
26Correlations
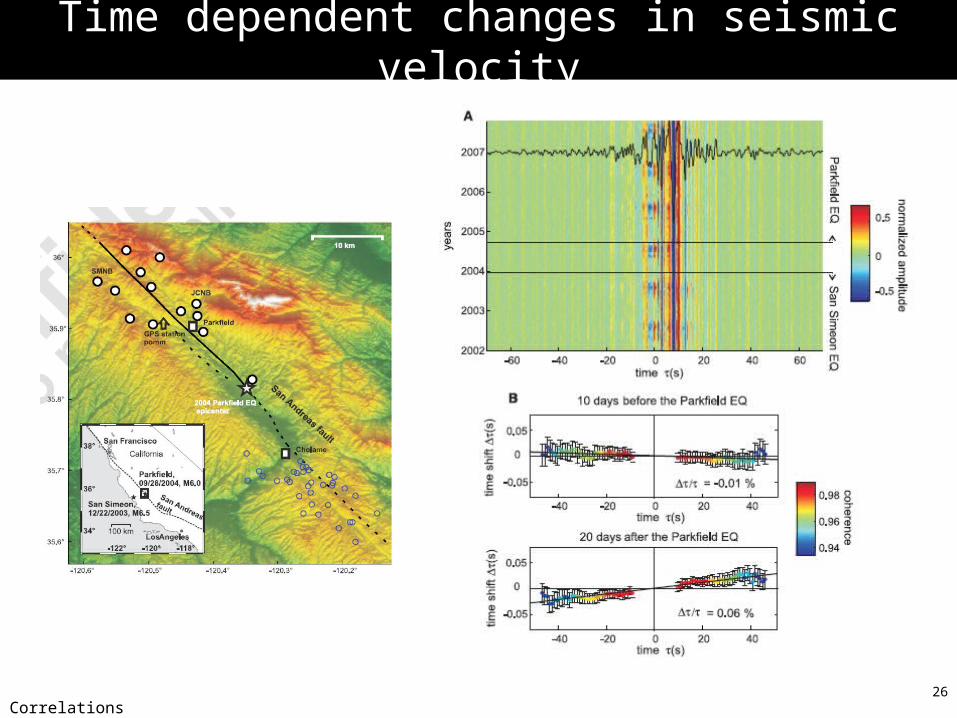
Time dependent changes in seismic velocity
27Correlations
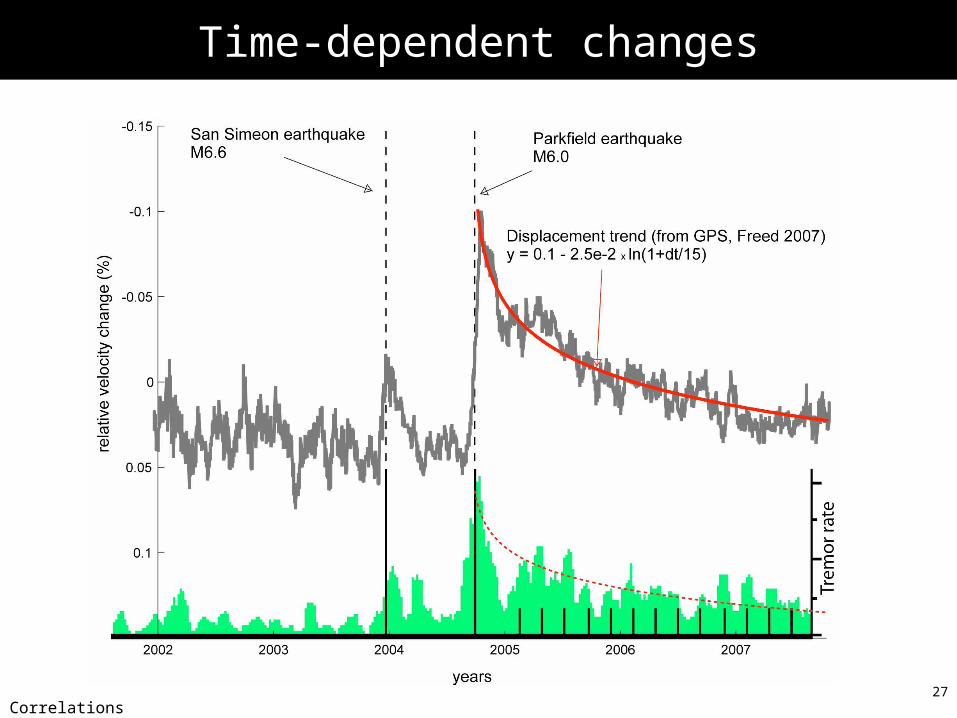
Time-dependent changes
28Correlations
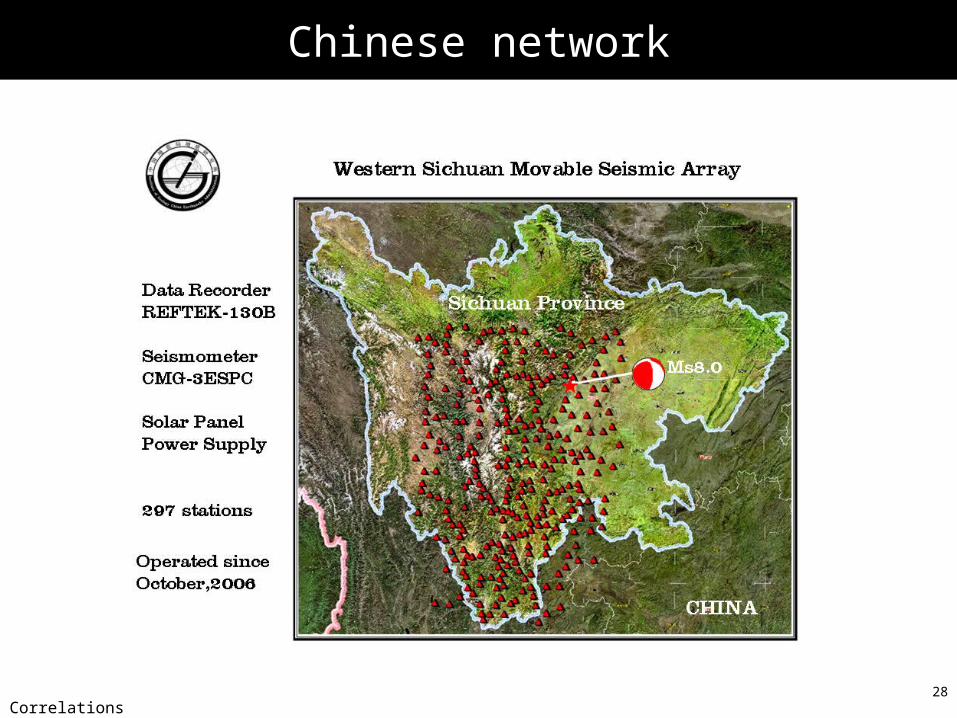
Chinese network
29Correlations
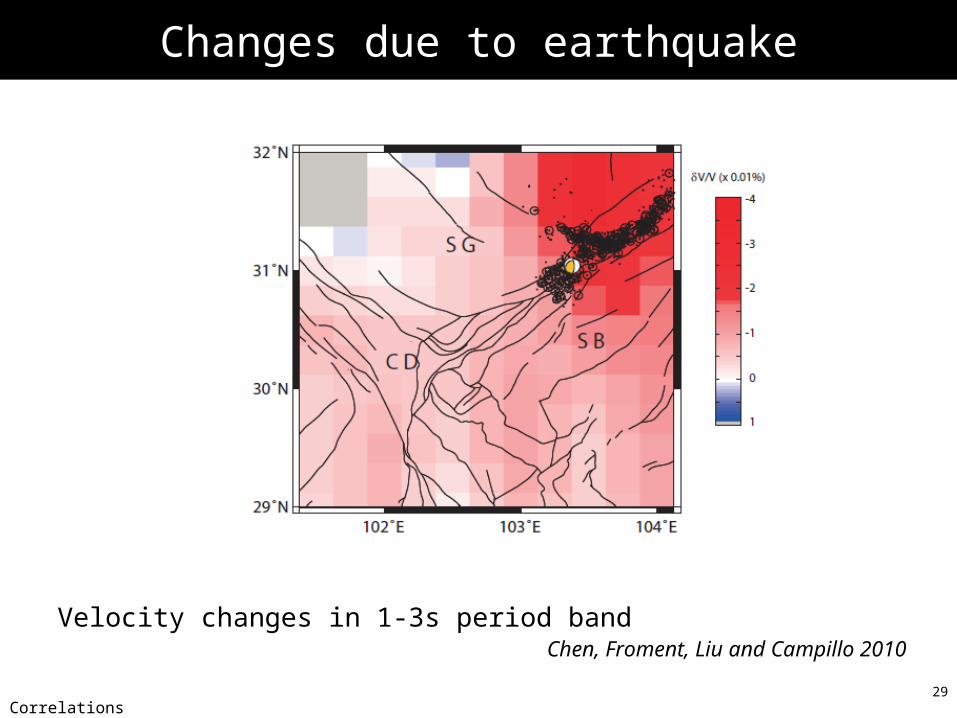
Changes due to earthquake
Velocity changes in 1-3s period bandChen, Froment, Liu and Campillo 2010
30Correlations
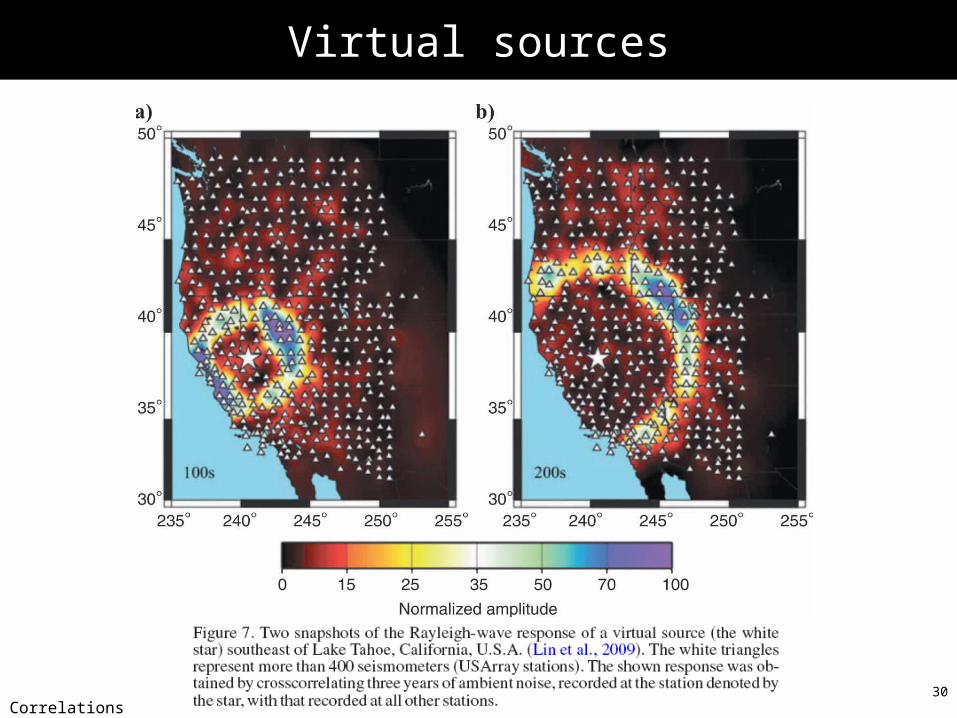
Virtual sources
31Correlations
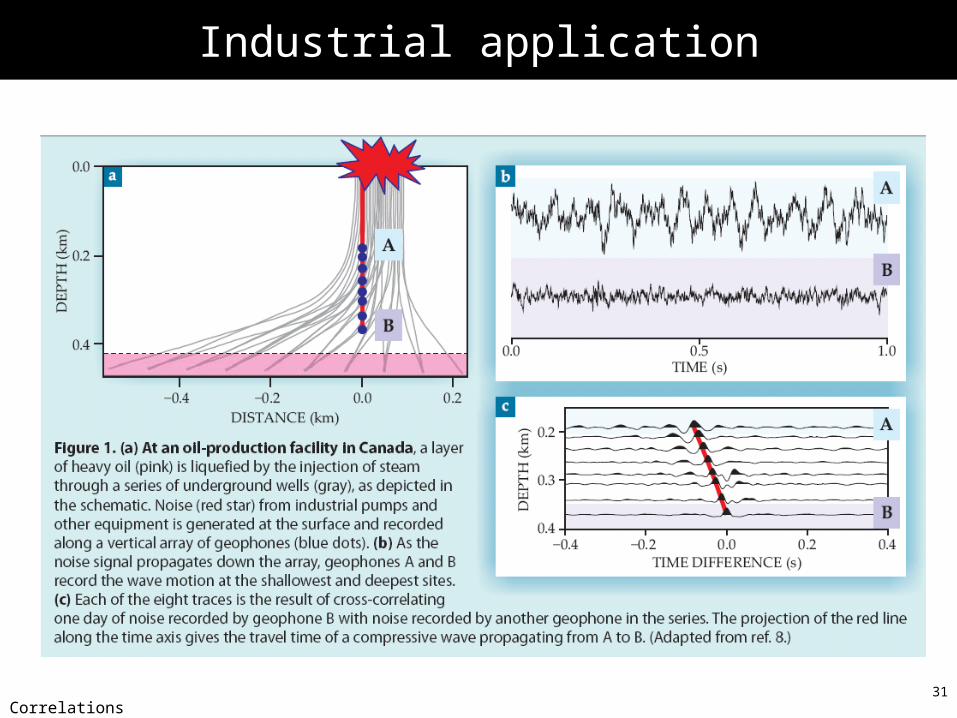
Industrial application
32Correlations
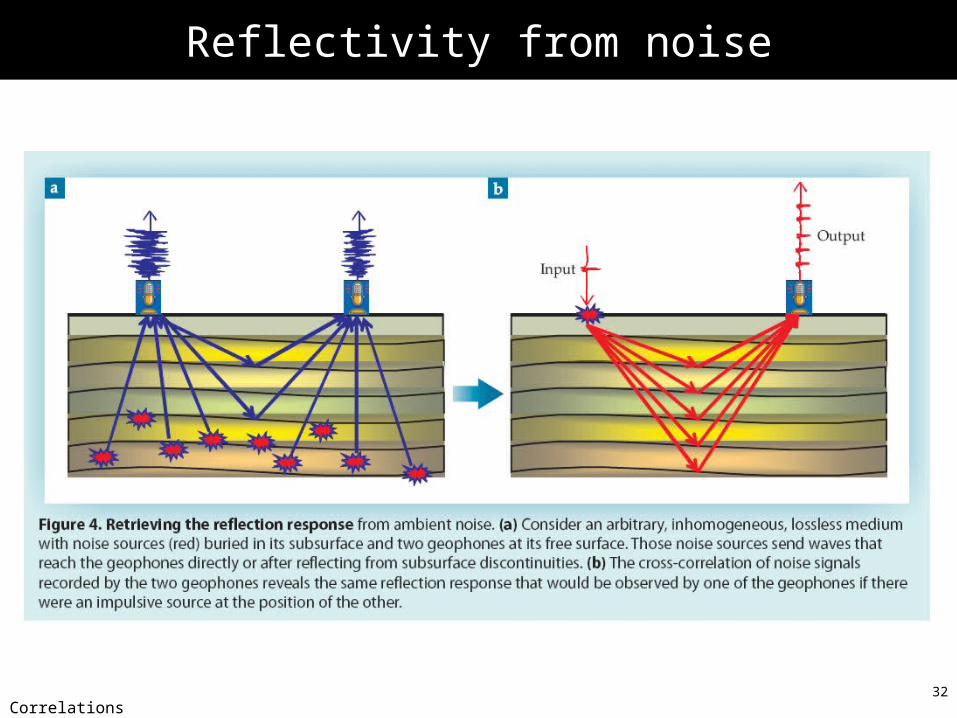
Reflectivity from noise
33Correlations
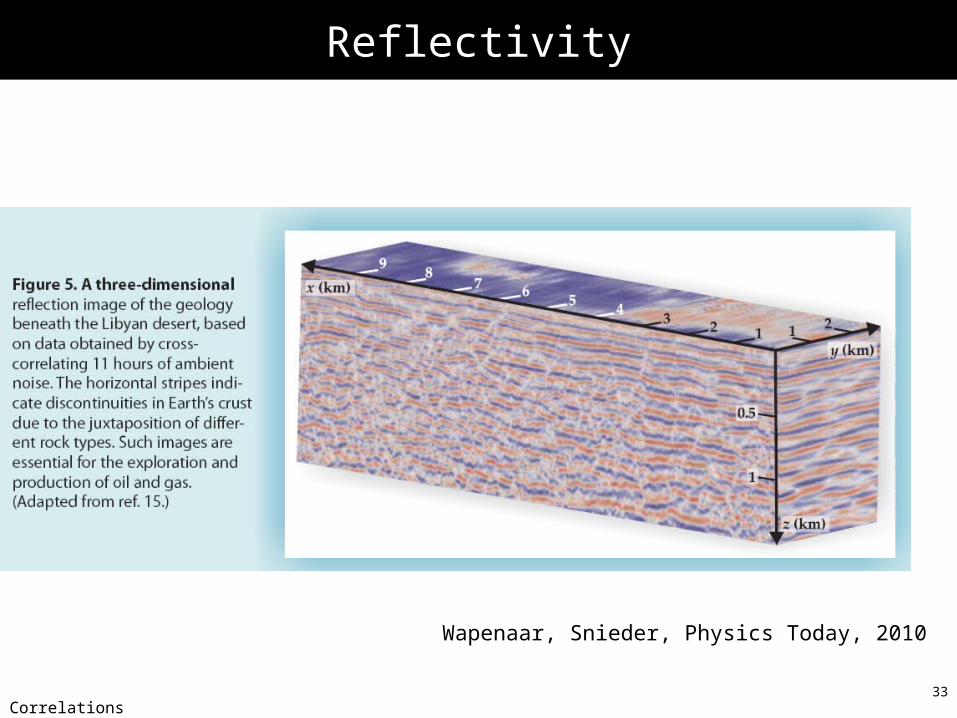
Reflectivity
Wapenaar, Snieder, Physics Today, 2010
34Correlations
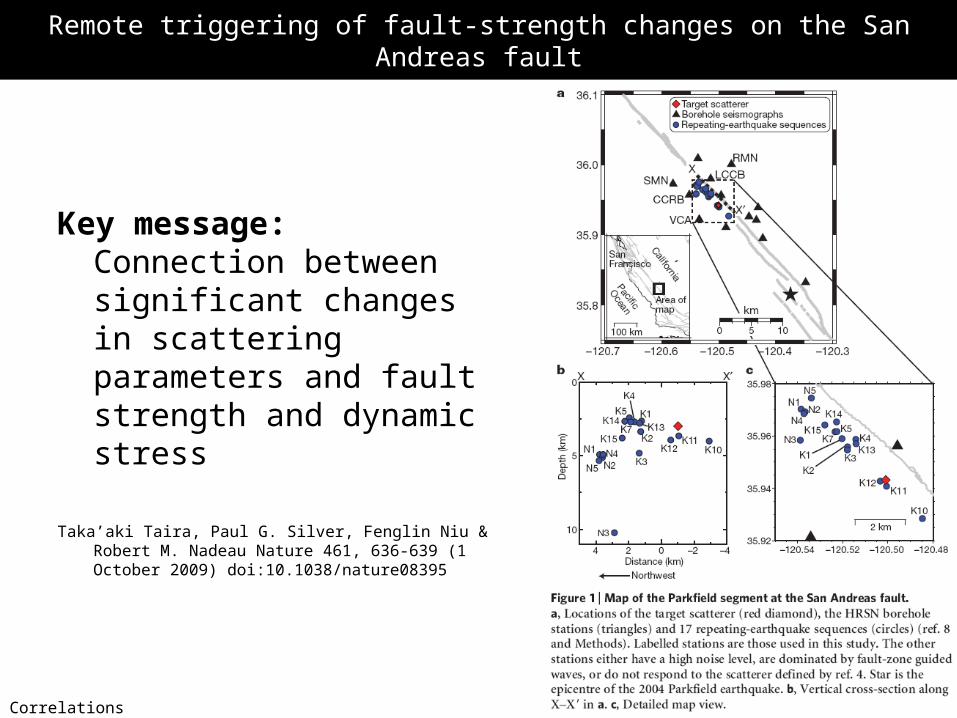
Remote triggering of fault-strength changes on the San Andreas fault
Key message: Connection between significant changes in scattering parameters and fault strength and dynamic stress
Taka’aki Taira, Paul G. Silver, Fenglin Niu & Robert M. Nadeau Nature 461, 636-639 (1 October 2009) doi:10.1038/nature08395
35Correlations
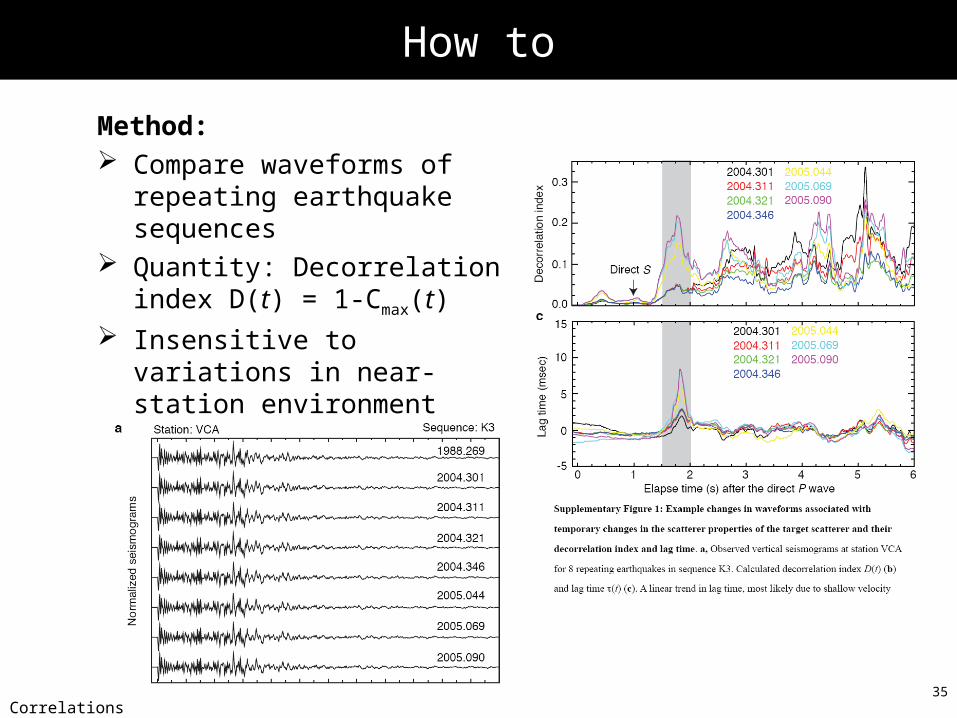
How to
Method: Compare waveforms of
repeating earthquake sequences
Quantity: Decorrelation index D(t) = 1-Cmax(t)
Insensitive to variations in near-station environment(Snieder, Gret, Douma & Scales 2002)
37Correlations
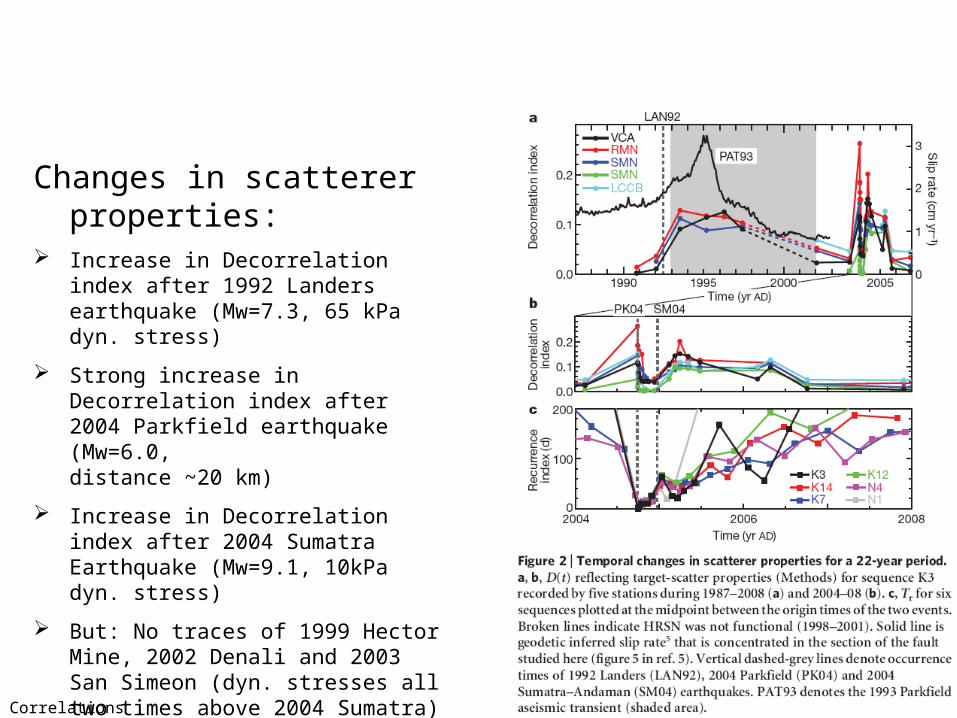
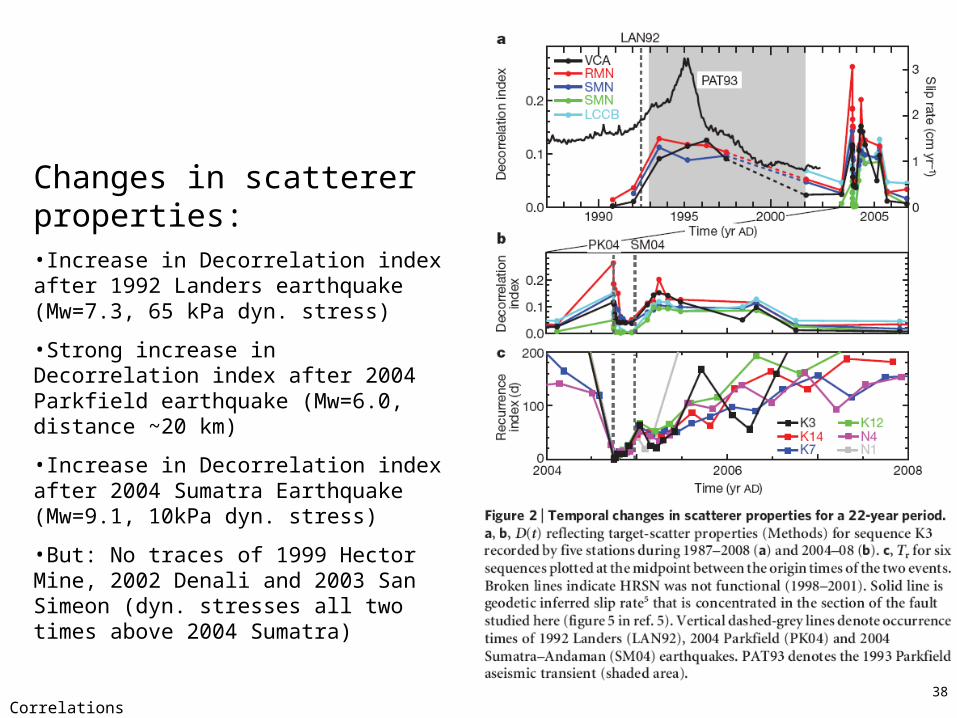
Changes in scatterer properties:
Increase in Decorrelation index after 1992 Landers earthquake (Mw=7.3, 65 kPa dyn. stress)
Strong increase in Decorrelation index after 2004 Parkfield earthquake (Mw=6.0, distance ~20 km)
Increase in Decorrelation index after 2004 Sumatra Earthquake (Mw=9.1, 10kPa dyn. stress)
But: No traces of 1999 Hector Mine, 2002 Denali and 2003 San Simeon (dyn. stresses all two times above 2004 Sumatra)
38Correlations
Changes in scatterer properties:•Increase in Decorrelation index after 1992 Landers earthquake (Mw=7.3, 65 kPa dyn. stress)
•Strong increase in Decorrelation index after 2004 Parkfield earthquake (Mw=6.0, distance ~20 km)
•Increase in Decorrelation index after 2004 Sumatra Earthquake (Mw=9.1, 10kPa dyn. stress)
•But: No traces of 1999 Hector Mine, 2002 Denali and 2003 San Simeon (dyn. stresses all two times above 2004 Sumatra)
39Correlations
Summary
The simple correlation technique has turned into one of the most important processing tools for seismograms
Passive imaging is the process with which noise recordings can be used to infer information on structure
Correlation of noisy seismograms from two stations allows in principle the reconstruction of the Green‘s function between the two stations
A whole new family of tomographic tools emerged CC techniques are ideal to identify time-dependent changes in the
structure (scattering) The ideal tool to quantify similarity (e.g., frequency dependent)
between various signals (e.g., rotations, strains with translations)