Embed Size (px)
Citation preview
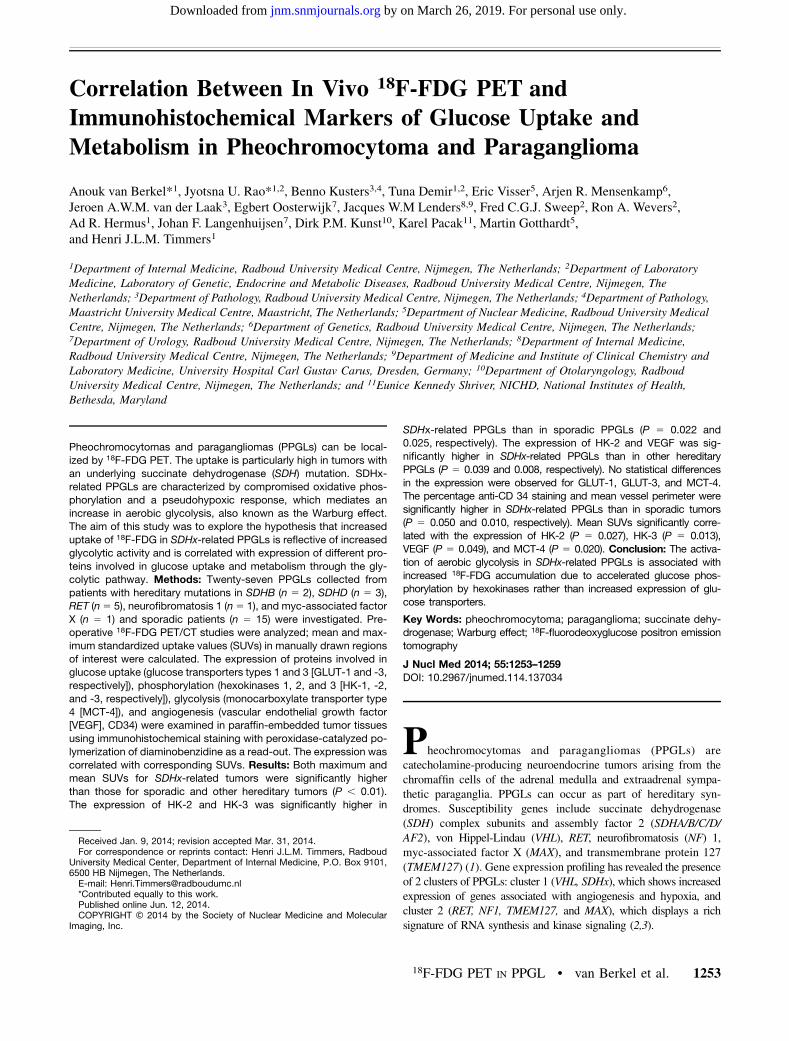
Correlation Between In Vivo 18F-FDG PET andImmunohistochemical Markers of Glucose Uptake andMetabolism in Pheochromocytoma and Paraganglioma
Anouk van Berkel*1, Jyotsna U. Rao*1,2, Benno Kusters3,4, Tuna Demir1,2, Eric Visser5, Arjen R. Mensenkamp6,Jeroen A.W.M. van der Laak3, Egbert Oosterwijk7, Jacques W.M Lenders8,9, Fred C.G.J. Sweep2, Ron A. Wevers2,Ad R. Hermus1, Johan F. Langenhuijsen7, Dirk P.M. Kunst10, Karel Pacak11, Martin Gotthardt5,and Henri J.L.M. Timmers1
1Department of Internal Medicine, Radboud University Medical Centre, Nijmegen, The Netherlands; 2Department of LaboratoryMedicine, Laboratory of Genetic, Endocrine and Metabolic Diseases, Radboud University Medical Centre, Nijmegen, TheNetherlands; 3Department of Pathology, Radboud University Medical Centre, Nijmegen, The Netherlands; 4Department of Pathology,Maastricht University Medical Centre, Maastricht, The Netherlands; 5Department of Nuclear Medicine, Radboud University MedicalCentre, Nijmegen, The Netherlands; 6Department of Genetics, Radboud University Medical Centre, Nijmegen, The Netherlands;7Department of Urology, Radboud University Medical Centre, Nijmegen, The Netherlands; 8Department of Internal Medicine,Radboud University Medical Centre, Nijmegen, The Netherlands; 9Department of Medicine and Institute of Clinical Chemistry andLaboratory Medicine, University Hospital Carl Gustav Carus, Dresden, Germany; 10Department of Otolaryngology, RadboudUniversity Medical Centre, Nijmegen, The Netherlands; and 11Eunice Kennedy Shriver, NICHD, National Institutes of Health,Bethesda, Maryland
Pheochromocytomas and paragangliomas (PPGLs) can be local-
ized by 18F-FDG PET. The uptake is particularly high in tumors with
an underlying succinate dehydrogenase (SDH) mutation. SDHx-related PPGLs are characterized by compromised oxidative phos-
phorylation and a pseudohypoxic response, which mediates an
increase in aerobic glycolysis, also known as the Warburg effect.The aim of this study was to explore the hypothesis that increased
uptake of 18F-FDG in SDHx-related PPGLs is reflective of increased
glycolytic activity and is correlated with expression of different pro-
teins involved in glucose uptake and metabolism through the gly-colytic pathway. Methods: Twenty-seven PPGLs collected from
patients with hereditary mutations in SDHB (n 5 2), SDHD (n 5 3),
RET (n5 5), neurofibromatosis 1 (n5 1), and myc-associated factor
X (n 5 1) and sporadic patients (n 5 15) were investigated. Pre-operative 18F-FDG PET/CT studies were analyzed; mean and max-
imum standardized uptake values (SUVs) in manually drawn regions
of interest were calculated. The expression of proteins involved inglucose uptake (glucose transporters types 1 and 3 [GLUT-1 and -3,
respectively]), phosphorylation (hexokinases 1, 2, and 3 [HK-1, -2,
and -3, respectively]), glycolysis (monocarboxylate transporter type
4 [MCT-4]), and angiogenesis (vascular endothelial growth factor[VEGF], CD34) were examined in paraffin-embedded tumor tissues
using immunohistochemical staining with peroxidase-catalyzed po-
lymerization of diaminobenzidine as a read-out. The expression was
correlated with corresponding SUVs. Results: Both maximum andmean SUVs for SDHx-related tumors were significantly higher
than those for sporadic and other hereditary tumors (P , 0.01).
The expression of HK-2 and HK-3 was significantly higher in
SDHx-related PPGLs than in sporadic PPGLs (P 5 0.022 and0.025, respectively). The expression of HK-2 and VEGF was sig-
nificantly higher in SDHx-related PPGLs than in other hereditary
PPGLs (P 5 0.039 and 0.008, respectively). No statistical differences
in the expression were observed for GLUT-1, GLUT-3, and MCT-4.The percentage anti-CD 34 staining and mean vessel perimeter were
significantly higher in SDHx-related PPGLs than in sporadic tumors
(P 5 0.050 and 0.010, respectively). Mean SUVs significantly corre-lated with the expression of HK-2 (P 5 0.027), HK-3 (P 5 0.013),
VEGF (P 5 0.049), and MCT-4 (P 5 0.020). Conclusion: The activa-
tion of aerobic glycolysis in SDHx-related PPGLs is associated with
increased 18F-FDG accumulation due to accelerated glucose phos-phorylation by hexokinases rather than increased expression of glu-
cose transporters.
Key Words: pheochromocytoma; paraganglioma; succinate dehy-drogenase; Warburg effect; 18F-fluorodeoxyglucose positron emission
tomography
J Nucl Med 2014; 55:1253–1259DOI: 10.2967/jnumed.114.137034
Pheochromocytomas and paragangliomas (PPGLs) arecatecholamine-producing neuroendocrine tumors arising from thechromaffin cells of the adrenal medulla and extraadrenal sympa-thetic paraganglia. PPGLs can occur as part of hereditary syn-dromes. Susceptibility genes include succinate dehydrogenase(SDH) complex subunits and assembly factor 2 (SDHA/B/C/D/AF2), von Hippel-Lindau (VHL), RET, neurofibromatosis (NF) 1,myc-associated factor X (MAX), and transmembrane protein 127(TMEM127) (1). Gene expression profiling has revealed the presenceof 2 clusters of PPGLs: cluster 1 (VHL, SDHx), which shows increasedexpression of genes associated with angiogenesis and hypoxia, andcluster 2 (RET, NF1, TMEM127, and MAX), which displays a richsignature of RNA synthesis and kinase signaling (2,3).
Received Jan. 9, 2014; revision accepted Mar. 31, 2014.For correspondence or reprints contact: Henri J.L.M. Timmers, Radboud
University Medical Center, Department of Internal Medicine, P.O. Box 9101,6500 HB Nijmegen, The Netherlands.E-mail: [email protected]*Contributed equally to this work.Published online Jun. 12, 2014.COPYRIGHT © 2014 by the Society of Nuclear Medicine and Molecular
Imaging, Inc.
18F-FDG PET IN PPGL • van Berkel et al. 1253
by on March 26, 2019. For personal use only. jnm.snmjournals.org Downloaded from
Enhanced uptake of glucose by tumor cells, compared withnormal cells, is the hallmark of in vivo cancer imaging with 18F-FDG PET/CT. We have shown previously that 18F-FDG PET/CTis superior to other functional imaging techniques for localizingmetastatic PPGL, particularly in those with an underlying SDHBmutation (4–6). 18F-FDG PET/CT is also useful for localizing be-nign PPGLs (7). Interestingly, 18F-FDG uptake varies among PPGLsof different genotypes, with the highest standard uptake values(SUVs) being observed in SDH and VHL-related tumors (5,8).The precise mechanism behind these genotype-specific differencesin 18F-FDG uptake has not been elucidated.SDHx mutations cause impairment of SDH function in the mito-
chondrial electron transport chain and hence compromise oxidativephosphorylation (9–11). Abolition of SDH enzymatic activityresults in activation of the hypoxic-angiogenic pathway via transcrip-tion factor hypoxia-inducible factors (HIFs)-1a and -2a (12). Theirmain target genes include genes involved in glucose metabolism (glu-cose transporters [GLUTs], hexokinases [HK], angiogenesis [vascularendothelial growth factor, VEGF]), survival, and motility (13–15).Activation of HIF-a further supports the shift of tumor cell energymetabolism from oxidative phosphorylation toward aerobic glycoly-sis, also known as the Warburg effect (16). The alternative energy-generation pathway is somewhat less efficient, requiring amuch largercellular influx of glucose to maintain the energy needs tumor cells.High uptake of 18F-FDG by SDHx-related tumors has been sug-
gested to be a reflection of theWarburg effect. Various mechanisms foraccelerated glucose use by tumor cells have been described. Enhancedinflux of glucose via GLUTs is considered to be the most important.The overexpression of GLUT isoforms GLUT-1 and -3 is closelyrelated to 18F-FDG uptake in tumor cells (17). In addition, acceleratedglucose phosphorylation by the cytosolic enzyme HK as the first steptoward glycolysis results in enhanced 18F-FDG accumulation. HK-2 ispredominantly expressed in tumor cells that exhibit the Warburg effect(18) and is associated with elevated 18F-FDG uptake in malignantconditions (19,20). The upregulation of both GLUTs and HK is fre-quently associated with malignant transformation of cells (21). Fur-thermore, activity of HK-3 and monocarboxylate transporter type 4(MCT-4), which facilitates the cellular lactate transport, possibly isregulated by hypoxia (10,22). In addition, hypoxia also promotesanaerobic glycolysis, and several studies have demonstrated that18F-FDG uptake is an indirect reflection of tumor hypoxia (23,24).The aim of this study was to explore the hypothesis that increased
uptake of 18F-FDG is reflective of increased glycolytic activity and
is correlated with the expression of different proteins involved inglucose uptake and metabolism through the glycolytic pathway. There-fore, the immunohistochemical expression of GLUT-1, GLUT-3, HK-1,HK-2, HK-3, and MCT-4 was directly correlated with in vivo 18F-FDGuptake in PPGLs of different genotypes. Additionally, VEGF expres-sion, to account for hypoxia-regulated angiogenesis, and CD34, toaccount for genotype-specific differences in microvasculature that couldalter the radiotracer supply to tumor cells, were examined.
MATERIALS AND METHODS
Patients
The study included 27 consecutive patients (17 men and 10 women;
mean age 6 SD, 51 6 15 y) in whom PPGL was histopathologicallyconfirmed and of which 22 (81%) were adrenal and 5 (19%) extra-
adrenal in location. Patient characteristics are listed in Table 1 andSupplemental Table 1 (available at http://jnm.snmjournals.org). The in-
stitutional review board approved this retrospective study, and the re-quirement to obtain informed consent was waived.
18F-FDG PET/CT Scanning
All patients underwent presurgical evaluation with 18F-FDG PET/
CT at the Radboud University Medical Center between December2007 and February 2012 (Fig. 1). Patients fasted for at least 6 h before
receiving a 241 6 73 MBq dose of intravenous 18F-FDG based onbody weight. PET/CT scans were obtained approximately 1 h (range,
55–74 min) after injection. Before November 2011, imaging was per-formed using a Biograph 2 PET/CT scanner, and after November 2011
using an mCT-40 scanner (both Siemens Healthcare). Both scannerswere calibrated and certified by the European Association of Nuclear
Medicine (EANM) Research Ltd. in accordance with the EANMguidelines for PET/CT (25). First, a low-dose CT scan using CareDose
with a reference of 40 mA and 130 kV was obtained from the base ofthe skull to the mid thigh. Instructions for breathing and positioning
were given to patients. The CT transaxial matrix size was 512 · 512,with pixels of 0.98 · 0.98 mm for both scanners. CT slice width was
3 mm for the Biograph 2 and 1.5 mm for the mCT. PET images wereobtained using 2-dimensional ordered-subset expectation maximiza-
tion reconstruction on the Biograph 2 with 4 iterations and 16 subsetsand a postreconstruction gaussian filter of 5 mm in full width at half
maximum. The transaxial PET matrix size was 128 · 128, and pixelsize was 5.31 · 5.31 · 3 mm. For the mCT scanner, images were
obtained using time-of-flight and high-definition reconstruction with 3iterations and 21 subsets and a postreconstruction gaussian filter of
8 mm in full width at half maximum. The transaxial PET matrix size
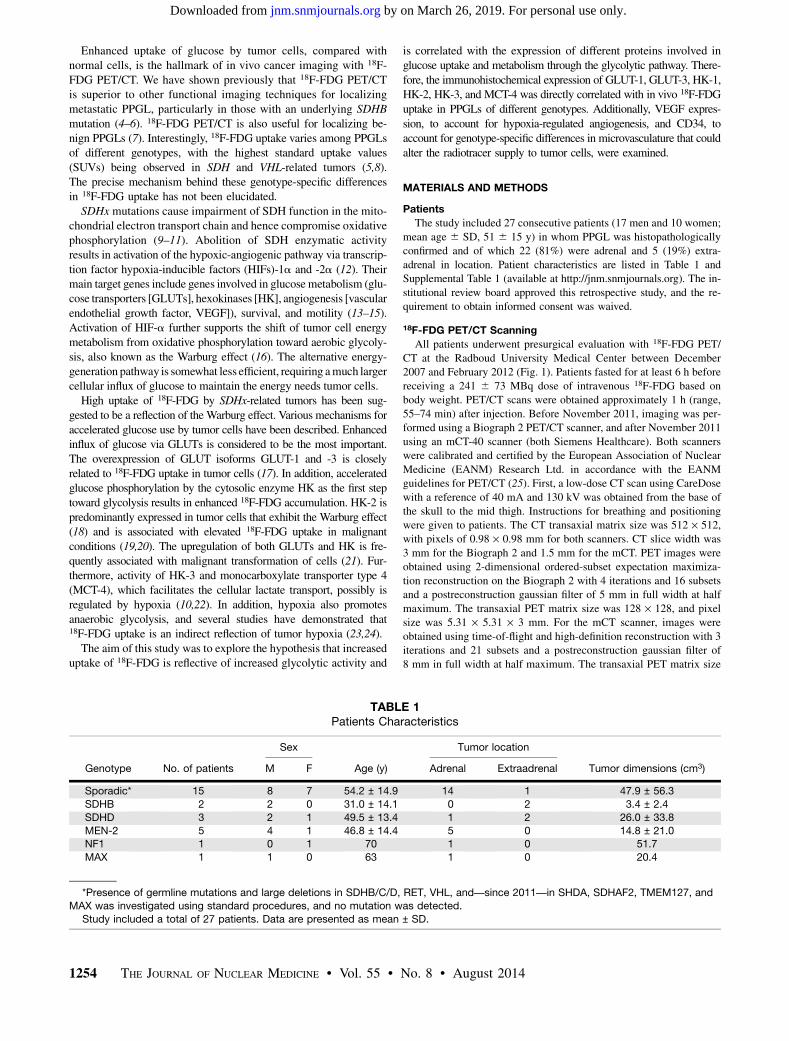
TABLE 1Patients Characteristics
Sex Tumor location
Genotype No. of patients M F Age (y) Adrenal Extraadrenal Tumor dimensions (cm3)
Sporadic* 15 8 7 54.2 ± 14.9 14 1 47.9 ± 56.3
SDHB 2 2 0 31.0 ± 14.1 0 2 3.4 ± 2.4
SDHD 3 2 1 49.5 ± 13.4 1 2 26.0 ± 33.8
MEN-2 5 4 1 46.8 ± 14.4 5 0 14.8 ± 21.0NF1 1 0 1 70 1 0 51.7
MAX 1 1 0 63 1 0 20.4
*Presence of germline mutations and large deletions in SDHB/C/D, RET, VHL, and—since 2011—in SHDA, SDHAF2, TMEM127, and
MAX was investigated using standard procedures, and no mutation was detected.
Study included a total of 27 patients. Data are presented as mean ± SD.
1254 THE JOURNAL OF NUCLEAR MEDICINE • Vol. 55 • No. 8 • August 2014
by on March 26, 2019. For personal use only. jnm.snmjournals.org Downloaded from
was 256 · 256, and pixel size was 3.18 · 3.18 · 3 mm. The large valueof the gaussian filter for the mCT images resulted in additional smooth-
ing and was used to comply with the EANM guidelines for PET/CT (25)allowing direct comparison of quantitative data from both scanners.
Image Interpretation and Quantitative Measurements
PET/CT images were reviewed using Inveon Research Workplace
software (version 4.1; Siemens Healthcare). Regions of interest weremanually drawn in each transversal slice over visually assessed
lesions in correspondence with CT images. Regions of interest werecombined to form a volume of interest, which was used for
quantitative analysis. Maximum and mean standardized uptake values(SUVmax and SUVmean, respectively) normalized for body weight
were calculated as SUV 5 A/IA · BW (A, activity concentrationof VOI [Bq/mL]; BW, body weight [g]; IA, injected activity [Bq]).
Liver-normalized standardized uptake value (SUVs) were calculated
as PPGL SUVs divided by corresponding liver mean SUVs in a fixed
volume of interest in the upper central liver. All calculated SUVswere-decay corrected using the following formula: A0 5 At · elt
(A0, corrected activity; At, uncorrected activity; l, decay constant[ln2/110] min21; t, elapsed time in min).
Immunohistochemical Staining and Quantification and
Quantitative Polymerase Chain Reaction (qPCR)
Information for immunohistochemical staining and quantificationand qPCR is given in the supplemental material.
Statistical Analysis
Statistical analysis was conducted using SPSS 20 (SPSS Inc.) and
GraphPad Prism 6 software (GraphPad Inc.). For comparison ofimmunohistochemical staining scores and SUVs of different genotypes,
scores and SUVs were analyzed using the Kruskal–Wallis test with thepost hoc Dunn test. Results are presented as mean 6 SD. Correlations
were examined using the Spearman correlation test. A 2-side P value ofless than 0.05 was considered to be statistically significant.
RESULTS
18F-FDG Uptake in PPGLs
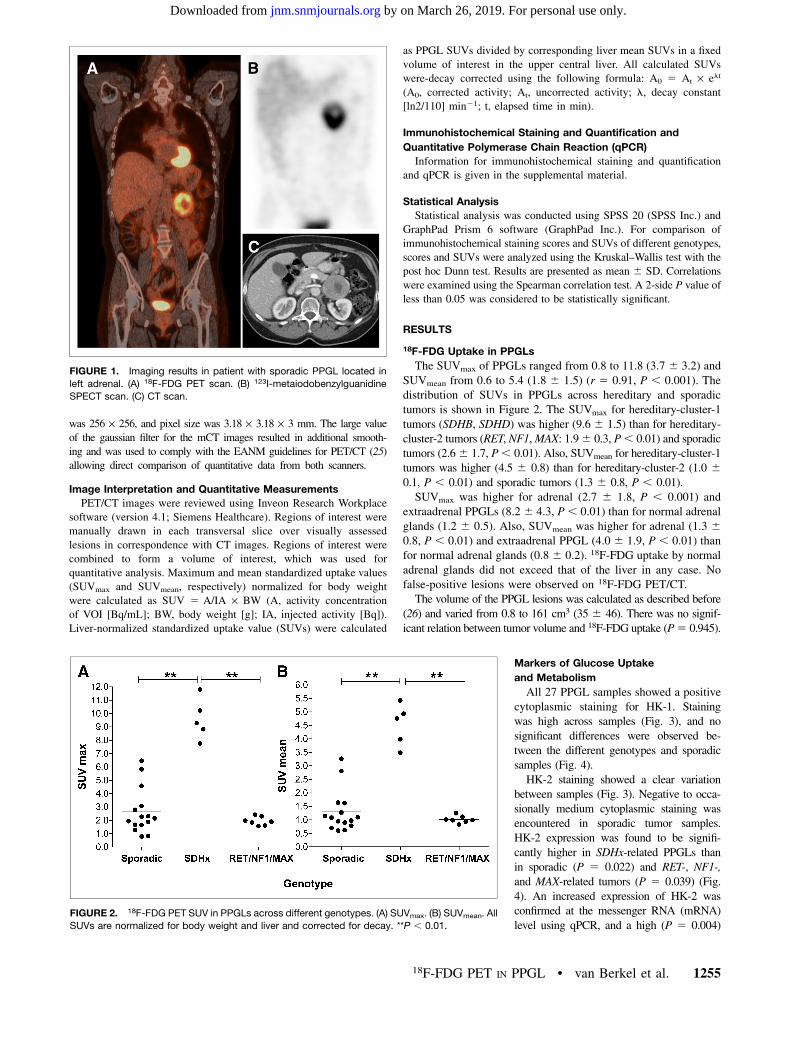
The SUVmax of PPGLs ranged from 0.8 to 11.8 (3.7 6 3.2) andSUVmean from 0.6 to 5.4 (1.8 6 1.5) (r 5 0.91, P , 0.001). Thedistribution of SUVs in PPGLs across hereditary and sporadictumors is shown in Figure 2. The SUVmax for hereditary-cluster-1tumors (SDHB, SDHD) was higher (9.6 6 1.5) than for hereditary-cluster-2 tumors (RET, NF1,MAX: 1.96 0.3, P, 0.01) and sporadictumors (2.66 1.7, P, 0.01). Also, SUVmean for hereditary-cluster-1tumors was higher (4.5 6 0.8) than for hereditary-cluster-2 (1.0 60.1, P , 0.01) and sporadic tumors (1.3 6 0.8, P , 0.01).SUVmax was higher for adrenal (2.7 6 1.8, P , 0.001) and
extraadrenal PPGLs (8.2 6 4.3, P , 0.01) than for normal adrenalglands (1.2 6 0.5). Also, SUVmean was higher for adrenal (1.3 60.8, P , 0.01) and extraadrenal PPGL (4.0 6 1.9, P , 0.01) thanfor normal adrenal glands (0.8 6 0.2). 18F-FDG uptake by normaladrenal glands did not exceed that of the liver in any case. Nofalse-positive lesions were observed on 18F-FDG PET/CT.The volume of the PPGL lesions was calculated as described before
(26) and varied from 0.8 to 161 cm3 (35 6 46). There was no signif-icant relation between tumor volume and 18F-FDG uptake (P5 0.945).
Markers of Glucose Uptake
and Metabolism
All 27 PPGL samples showed a positivecytoplasmic staining for HK-1. Stainingwas high across samples (Fig. 3), and nosignificant differences were observed be-tween the different genotypes and sporadicsamples (Fig. 4).HK-2 staining showed a clear variation
between samples (Fig. 3). Negative to occa-sionally medium cytoplasmic staining wasencountered in sporadic tumor samples.HK-2 expression was found to be signifi-cantly higher in SDHx-related PPGLs thanin sporadic (P 5 0.022) and RET-, NF1-,and MAX-related tumors (P 5 0.039) (Fig.4). An increased expression of HK-2 wasconfirmed at the messenger RNA (mRNA)level using qPCR, and a high (P 5 0.004)
FIGURE 1. Imaging results in patient with sporadic PPGL located in
left adrenal. (A) 18F-FDG PET scan. (B) 123I-metaiodobenzylguanidine
SPECT scan. (C) CT scan.
FIGURE 2. 18F-FDG PET SUV in PPGLs across different genotypes. (A) SUVmax. (B) SUVmean. All
SUVs are normalized for body weight and liver and corrected for decay. **P , 0.01.
18F-FDG PET IN PPGL • van Berkel et al. 1255
by on March 26, 2019. For personal use only. jnm.snmjournals.org Downloaded from
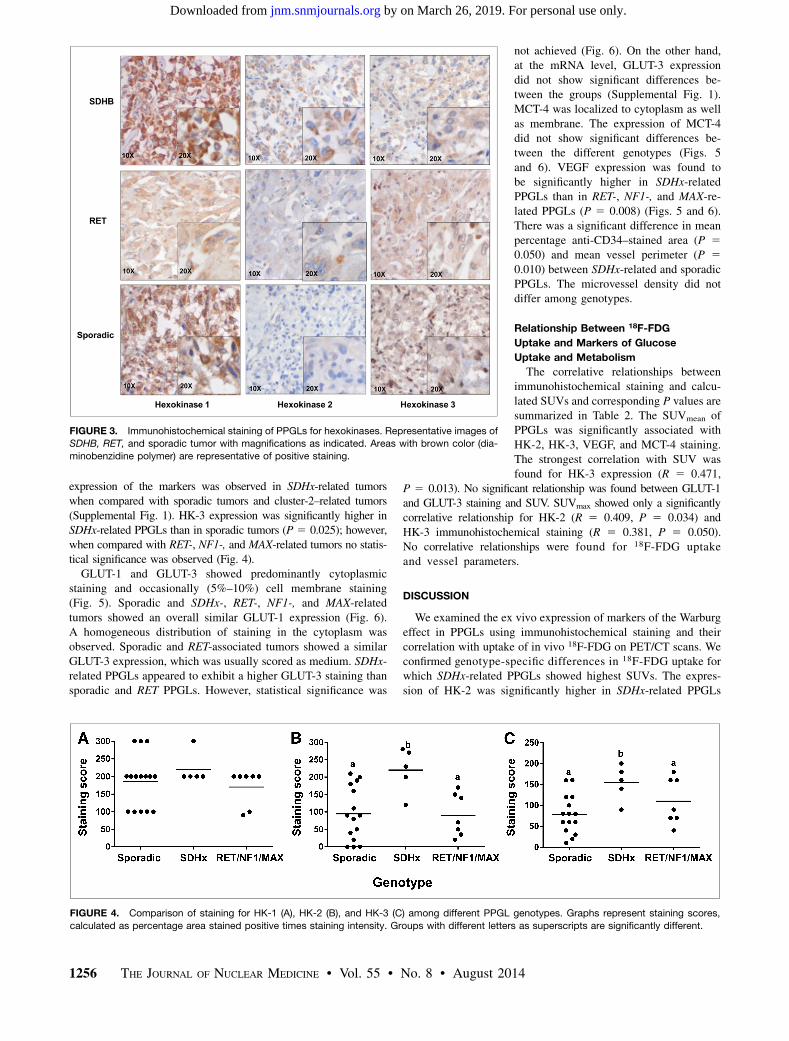
expression of the markers was observed in SDHx-related tumorswhen compared with sporadic tumors and cluster-2–related tumors(Supplemental Fig. 1). HK-3 expression was significantly higher inSDHx-related PPGLs than in sporadic tumors (P 5 0.025); however,when compared with RET-, NF1-, and MAX-related tumors no statis-tical significance was observed (Fig. 4).GLUT-1 and GLUT-3 showed predominantly cytoplasmic
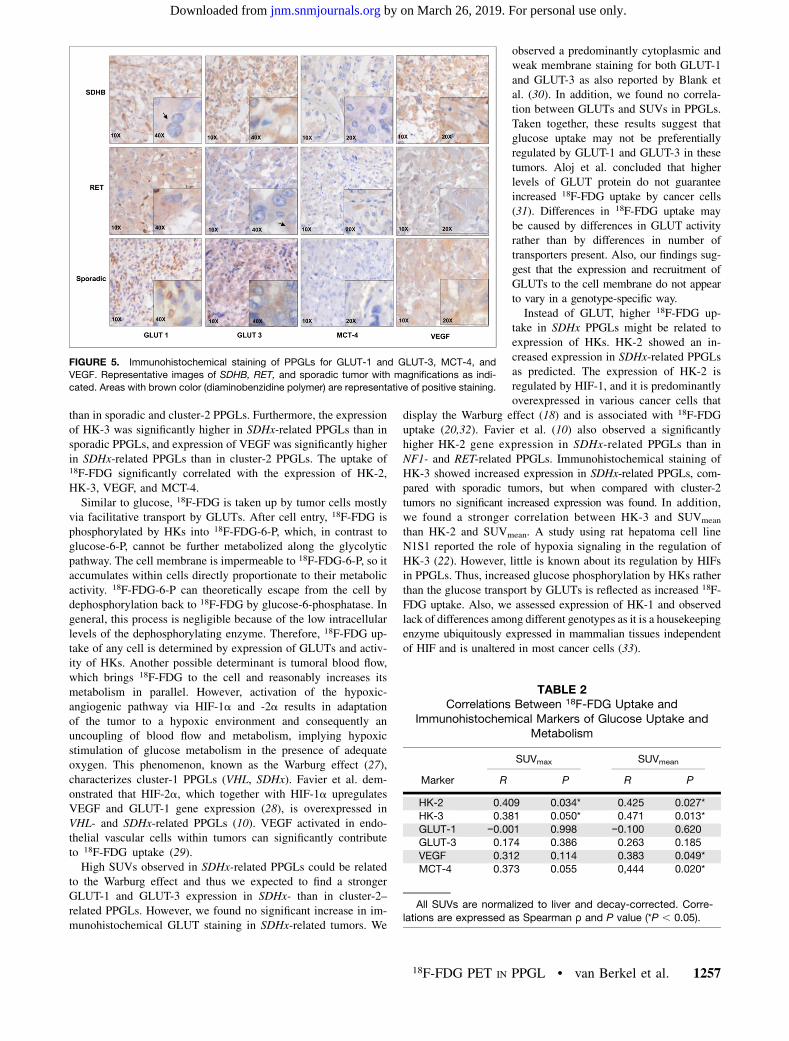
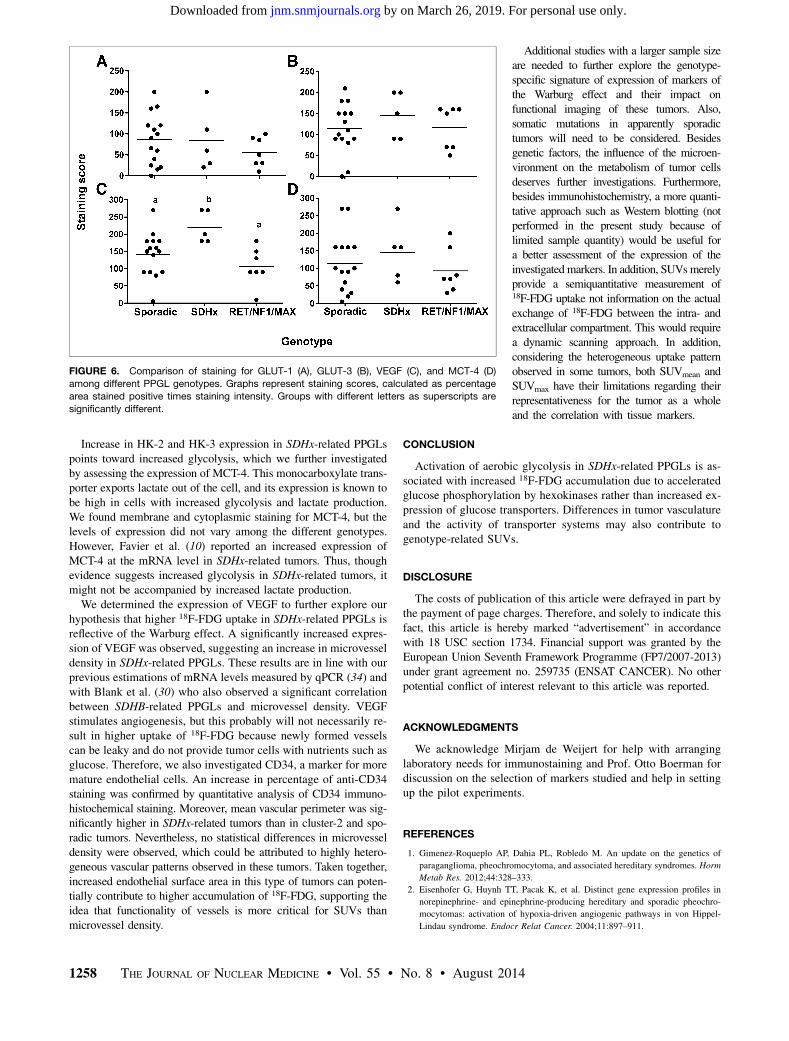
staining and occasionally (5%–10%) cell membrane staining(Fig. 5). Sporadic and SDHx-, RET-, NF1-, and MAX-relatedtumors showed an overall similar GLUT-1 expression (Fig. 6).A homogeneous distribution of staining in the cytoplasm wasobserved. Sporadic and RET-associated tumors showed a similarGLUT-3 expression, which was usually scored as medium. SDHx-related PPGLs appeared to exhibit a higher GLUT-3 staining thansporadic and RET PPGLs. However, statistical significance was
not achieved (Fig. 6). On the other hand,at the mRNA level, GLUT-3 expressiondid not show significant differences be-tween the groups (Supplemental Fig. 1).MCT-4 was localized to cytoplasm as wellas membrane. The expression of MCT-4did not show significant differences be-tween the different genotypes (Figs. 5and 6). VEGF expression was found tobe significantly higher in SDHx-relatedPPGLs than in RET-, NF1-, and MAX-re-lated PPGLs (P 5 0.008) (Figs. 5 and 6).There was a significant difference in meanpercentage anti-CD34–stained area (P 50.050) and mean vessel perimeter (P 50.010) between SDHx-related and sporadicPPGLs. The microvessel density did notdiffer among genotypes.
Relationship Between 18F-FDG
Uptake and Markers of Glucose
Uptake and Metabolism
The correlative relationships betweenimmunohistochemical staining and calcu-lated SUVs and corresponding P values aresummarized in Table 2. The SUVmean ofPPGLs was significantly associated withHK-2, HK-3, VEGF, and MCT-4 staining.The strongest correlation with SUV wasfound for HK-3 expression (R 5 0.471,
P 5 0.013). No significant relationship was found between GLUT-1and GLUT-3 staining and SUV. SUVmax showed only a significantlycorrelative relationship for HK-2 (R 5 0.409, P 5 0.034) andHK-3 immunohistochemical staining (R 5 0.381, P 5 0.050).No correlative relationships were found for 18F-FDG uptakeand vessel parameters.
DISCUSSION
We examined the ex vivo expression of markers of the Warburgeffect in PPGLs using immunohistochemical staining and theircorrelation with uptake of in vivo 18F-FDG on PET/CT scans. Weconfirmed genotype-specific differences in 18F-FDG uptake forwhich SDHx-related PPGLs showed highest SUVs. The expres-sion of HK-2 was significantly higher in SDHx-related PPGLs
FIGURE 3. Immunohistochemical staining of PPGLs for hexokinases. Representative images of
SDHB, RET, and sporadic tumor with magnifications as indicated. Areas with brown color (dia-
minobenzidine polymer) are representative of positive staining.
FIGURE 4. Comparison of staining for HK-1 (A), HK-2 (B), and HK-3 (C) among different PPGL genotypes. Graphs represent staining scores,
calculated as percentage area stained positive times staining intensity. Groups with different letters as superscripts are significantly different.
1256 THE JOURNAL OF NUCLEAR MEDICINE • Vol. 55 • No. 8 • August 2014
by on March 26, 2019. For personal use only. jnm.snmjournals.org Downloaded from
than in sporadic and cluster-2 PPGLs. Furthermore, the expressionof HK-3 was significantly higher in SDHx-related PPGLs than insporadic PPGLs, and expression of VEGF was significantly higherin SDHx-related PPGLs than in cluster-2 PPGLs. The uptake of18F-FDG significantly correlated with the expression of HK-2,HK-3, VEGF, and MCT-4.Similar to glucose, 18F-FDG is taken up by tumor cells mostly
via facilitative transport by GLUTs. After cell entry, 18F-FDG isphosphorylated by HKs into 18F-FDG-6-P, which, in contrast toglucose-6-P, cannot be further metabolized along the glycolyticpathway. The cell membrane is impermeable to 18F-FDG-6-P, so itaccumulates within cells directly proportionate to their metabolicactivity. 18F-FDG-6-P can theoretically escape from the cell bydephosphorylation back to 18F-FDG by glucose-6-phosphatase. Ingeneral, this process is negligible because of the low intracellularlevels of the dephosphorylating enzyme. Therefore, 18F-FDG up-take of any cell is determined by expression of GLUTs and activ-ity of HKs. Another possible determinant is tumoral blood flow,which brings 18F-FDG to the cell and reasonably increases itsmetabolism in parallel. However, activation of the hypoxic-angiogenic pathway via HIF-1a and -2a results in adaptationof the tumor to a hypoxic environment and consequently anuncoupling of blood flow and metabolism, implying hypoxicstimulation of glucose metabolism in the presence of adequateoxygen. This phenomenon, known as the Warburg effect (27),characterizes cluster-1 PPGLs (VHL, SDHx). Favier et al. dem-onstrated that HIF-2a, which together with HIF-1a upregulatesVEGF and GLUT-1 gene expression (28), is overexpressed inVHL- and SDHx-related PPGLs (10). VEGF activated in endo-thelial vascular cells within tumors can significantly contributeto 18F-FDG uptake (29).High SUVs observed in SDHx-related PPGLs could be related
to the Warburg effect and thus we expected to find a strongerGLUT-1 and GLUT-3 expression in SDHx- than in cluster-2–related PPGLs. However, we found no significant increase in im-munohistochemical GLUT staining in SDHx-related tumors. We
observed a predominantly cytoplasmic andweak membrane staining for both GLUT-1and GLUT-3 as also reported by Blank etal. (30). In addition, we found no correla-tion between GLUTs and SUVs in PPGLs.Taken together, these results suggest thatglucose uptake may not be preferentiallyregulated by GLUT-1 and GLUT-3 in thesetumors. Aloj et al. concluded that higherlevels of GLUT protein do not guaranteeincreased 18F-FDG uptake by cancer cells(31). Differences in 18F-FDG uptake maybe caused by differences in GLUT activityrather than by differences in number oftransporters present. Also, our findings sug-gest that the expression and recruitment ofGLUTs to the cell membrane do not appearto vary in a genotype-specific way.Instead of GLUT, higher 18F-FDG up-
take in SDHx PPGLs might be related toexpression of HKs. HK-2 showed an in-creased expression in SDHx-related PPGLsas predicted. The expression of HK-2 isregulated by HIF-1, and it is predominantlyoverexpressed in various cancer cells that
display the Warburg effect (18) and is associated with 18F-FDGuptake (20,32). Favier et al. (10) also observed a significantlyhigher HK-2 gene expression in SDHx-related PPGLs than inNF1- and RET-related PPGLs. Immunohistochemical staining ofHK-3 showed increased expression in SDHx-related PPGLs, com-pared with sporadic tumors, but when compared with cluster-2tumors no significant increased expression was found. In addition,we found a stronger correlation between HK-3 and SUVmean
than HK-2 and SUVmean. A study using rat hepatoma cell lineN1S1 reported the role of hypoxia signaling in the regulation ofHK-3 (22). However, little is known about its regulation by HIFsin PPGLs. Thus, increased glucose phosphorylation by HKs ratherthan the glucose transport by GLUTs is reflected as increased 18F-FDG uptake. Also, we assessed expression of HK-1 and observedlack of differences among different genotypes as it is a housekeepingenzyme ubiquitously expressed in mammalian tissues independentof HIF and is unaltered in most cancer cells (33).
FIGURE 5. Immunohistochemical staining of PPGLs for GLUT-1 and GLUT-3, MCT-4, and
VEGF. Representative images of SDHB, RET, and sporadic tumor with magnifications as indi-
cated. Areas with brown color (diaminobenzidine polymer) are representative of positive staining.
TABLE 2Correlations Between 18F-FDG Uptake and
Immunohistochemical Markers of Glucose Uptake andMetabolism
SUVmax SUVmean
Marker R P R P
HK-2 0.409 0.034* 0.425 0.027*
HK-3 0.381 0.050* 0.471 0.013*
GLUT-1 −0.001 0.998 −0.100 0.620GLUT-3 0.174 0.386 0.263 0.185
VEGF 0.312 0.114 0.383 0.049*
MCT-4 0.373 0.055 0,444 0.020*
All SUVs are normalized to liver and decay-corrected. Corre-
lations are expressed as Spearman ρ and P value (*P , 0.05).
18F-FDG PET IN PPGL • van Berkel et al. 1257
by on March 26, 2019. For personal use only. jnm.snmjournals.org Downloaded from
Increase in HK-2 and HK-3 expression in SDHx-related PPGLspoints toward increased glycolysis, which we further investigatedby assessing the expression of MCT-4. This monocarboxylate trans-porter exports lactate out of the cell, and its expression is known tobe high in cells with increased glycolysis and lactate production.We found membrane and cytoplasmic staining for MCT-4, but thelevels of expression did not vary among the different genotypes.However, Favier et al. (10) reported an increased expression ofMCT-4 at the mRNA level in SDHx-related tumors. Thus, thoughevidence suggests increased glycolysis in SDHx-related tumors, itmight not be accompanied by increased lactate production.We determined the expression of VEGF to further explore our
hypothesis that higher 18F-FDG uptake in SDHx-related PPGLs isreflective of the Warburg effect. A significantly increased expres-sion of VEGF was observed, suggesting an increase in microvesseldensity in SDHx-related PPGLs. These results are in line with ourprevious estimations of mRNA levels measured by qPCR (34) andwith Blank et al. (30) who also observed a significant correlationbetween SDHB-related PPGLs and microvessel density. VEGFstimulates angiogenesis, but this probably will not necessarily re-sult in higher uptake of 18F-FDG because newly formed vesselscan be leaky and do not provide tumor cells with nutrients such asglucose. Therefore, we also investigated CD34, a marker for moremature endothelial cells. An increase in percentage of anti-CD34staining was confirmed by quantitative analysis of CD34 immuno-histochemical staining. Moreover, mean vascular perimeter was sig-nificantly higher in SDHx-related tumors than in cluster-2 and spo-radic tumors. Nevertheless, no statistical differences in microvesseldensity were observed, which could be attributed to highly hetero-geneous vascular patterns observed in these tumors. Taken together,increased endothelial surface area in this type of tumors can poten-tially contribute to higher accumulation of 18F-FDG, supporting theidea that functionality of vessels is more critical for SUVs thanmicrovessel density.
Additional studies with a larger sample sizeare needed to further explore the genotype-specific signature of expression of markers ofthe Warburg effect and their impact onfunctional imaging of these tumors. Also,somatic mutations in apparently sporadictumors will need to be considered. Besidesgenetic factors, the influence of the microen-vironment on the metabolism of tumor cellsdeserves further investigations. Furthermore,besides immunohistochemistry, a more quanti-tative approach such as Western blotting (notperformed in the present study because oflimited sample quantity) would be useful fora better assessment of the expression of theinvestigated markers. In addition, SUVsmerelyprovide a semiquantitative measurement of18F-FDG uptake not information on the actualexchange of 18F-FDG between the intra- andextracellular compartment. This would requirea dynamic scanning approach. In addition,considering the heterogeneous uptake patternobserved in some tumors, both SUVmean andSUVmax have their limitations regarding theirrepresentativeness for the tumor as a wholeand the correlation with tissue markers.
CONCLUSION
Activation of aerobic glycolysis in SDHx-related PPGLs is as-sociated with increased 18F-FDG accumulation due to acceleratedglucose phosphorylation by hexokinases rather than increased ex-pression of glucose transporters. Differences in tumor vasculatureand the activity of transporter systems may also contribute togenotype-related SUVs.
DISCLOSURE
The costs of publication of this article were defrayed in part bythe payment of page charges. Therefore, and solely to indicate thisfact, this article is hereby marked “advertisement” in accordancewith 18 USC section 1734. Financial support was granted by theEuropean Union Seventh Framework Programme (FP7/2007-2013)under grant agreement no. 259735 (ENSAT CANCER). No otherpotential conflict of interest relevant to this article was reported.
ACKNOWLEDGMENTS
We acknowledge Mirjam de Weijert for help with arranginglaboratory needs for immunostaining and Prof. Otto Boerman fordiscussion on the selection of markers studied and help in settingup the pilot experiments.
REFERENCES
1. Gimenez-Roqueplo AP, Dahia PL, Robledo M. An update on the genetics of
paraganglioma, pheochromocytoma, and associated hereditary syndromes. Horm
Metab Res. 2012;44:328–333.
2. Eisenhofer G, Huynh TT, Pacak K, et al. Distinct gene expression profiles in
norepinephrine- and epinephrine-producing hereditary and sporadic pheochro-
mocytomas: activation of hypoxia-driven angiogenic pathways in von Hippel-
Lindau syndrome. Endocr Relat Cancer. 2004;11:897–911.
FIGURE 6. Comparison of staining for GLUT-1 (A), GLUT-3 (B), VEGF (C), and MCT-4 (D)
among different PPGL genotypes. Graphs represent staining scores, calculated as percentage
area stained positive times staining intensity. Groups with different letters as superscripts are
significantly different.
1258 THE JOURNAL OF NUCLEAR MEDICINE • Vol. 55 • No. 8 • August 2014
by on March 26, 2019. For personal use only. jnm.snmjournals.org Downloaded from
3. López-Jiménez E, Gomez-Lopez G, Leandro-Garcia LJ, et al. Research resource:
Transcriptional profiling reveals different pseudohypoxic signatures in SDHB
and VHL-related pheochromocytomas. Mol Endocrinol. 2010;24:2382–2391.
4. Timmers HJ, Chen CC, Carrasquillo JA, et al. Comparison of 18F-fluoro-L-
DOPA, 18F-fluoro-deoxyglucose, and 18F-fluorodopamine PET and 123I-MIBG
scintigraphy in the localization of pheochromocytoma and paraganglioma. J Clin
Endocrinol Metab. 2009;94:4757–4767.
5. Timmers HJ, Chen CC, Carrasquillo JA, et al. Staging and functional character-
ization of pheochromocytoma and paraganglioma by 18F-fluorodeoxyglucose (18F-
FDG) positron emission tomography. J Natl Cancer Inst. 2012;104:700–708.
6. Timmers HJ, Kozupa A, Chen CC, et al. Superiority of fluorodeoxyglucose
positron emission tomography to other functional imaging techniques in the
evaluation of metastatic SDHB-associated pheochromocytoma and paragan-
glioma. J Clin Oncol. 2007;25:2262–2269.
7. Taieb D, Sebag F, Barlier A, et al. 18F-FDG avidity of pheochromocytomas and
paragangliomas: a new molecular imaging signature? J Nucl Med. 2009;50:711–717.
8. Blanchet EM, Gabriel S, Martucci V, et al. F-FDG PET/CT as a predictor of
hereditary head and neck paragangliomas. Eur J Clin Invest. 2014;44:325–332.
9. Gimenez-Roqueplo AP, Favier J, Rustin P, et al. Functional consequences of
a SDHB gene mutation in an apparently sporadic pheochromocytoma. J Clin
Endocrinol Metab. 2002;87:4771–4774.
10. Favier J, Briere JJ, Burnichon N, et al. The Warburg effect is genetically de-
termined in inherited pheochromocytomas. PLoS ONE. 2009;4:e7094.
11. Rao JU, Engelke UF, Rodenburg RJ, et al. Genotype-specific abnormalities in
mitochondrial function associate with distinct profiles of energy metabolism and
catecholamine content in pheochromocytoma and paraganglioma. Clin Cancer
Res. 2013;19:3787–3795.
12. Jochmanová I, Yang C, Zhuang Z, Pacak K. Hypoxia-inducible factor signaling
in pheochromocytoma: turning the rudder in the right direction. J Natl Cancer
Inst. 2013;105:1270–1283.
13. Gordan JD, Simon MC. Hypoxia-inducible factors: central regulators of the
tumor phenotype. Curr Opin Genet Dev. 2007;17:71–77.
14. Dahia PL, Familial Pheochromocytoma C. Transcription association of VHL and
SDH mutations link hypoxia and oxidoreductase signals in pheochromocytomas.
Ann N Y Acad Sci. 2006;1073:208–220.
15. Selak MA, Armour SM, MacKenzie ED, et al. Succinate links TCA cycle dys-
function to oncogenesis by inhibiting HIF-alpha prolyl hydroxylase. Cancer
Cell. 2005;7:77–85.
16. Warburg O. On the origin of cancer cells. Science. 1956;123:309–314.
17. Macheda ML, Rogers S, Best JD. Molecular and cellular regulation of glucose
transporter (GLUT) proteins in cancer. J Cell Physiol. 2005;202:654–662.
18. Mathupala SP, Ko YH, Pedersen PL. Hexokinase-2 bound to mitochondria:
cancer’s stygian link to the “Warburg Effect” and a pivotal target for effective
therapy. Semin Cancer Biol. 2009;19:17–24.
19. Ahn KJ, Hwang HS, Park JH, et al. Evaluation of the role of hexokinase type II
in cellular proliferation and apoptosis using human hepatocellular carcinoma cell
lines. J Nucl Med. 2009;50:1525–1532.
20. Yamada T, Uchida M, Kwang-Lee K, et al. Correlation of metabolism/hypoxia
markers and fluorodeoxyglucose uptake in oral squamous cell carcinomas. Oral
Surg Oral Med Oral Pathol Oral Radiol. 2012;113:464–471.
21. de Geus-Oei LF, van Krieken JH, Aliredjo RP, et al. Biological correlates of FDG
uptake in non-small cell lung cancer. Lung Cancer. 2007;55:79–87.
22. Wyatt E, Wu R, Rabeh W, Park HW, Ghanefar M, Ardehali H. Regulation and
cytoprotective role of hexokinase III. PLoS ONE. 2010;5:e13823.
23. Dierckx RA, Van de Wiele C. FDG uptake, a surrogate of tumour hypoxia? Eur J
Nucl Med Mol Imaging. 2008;35:1544–1549.
24. Clavo AC, Brown RS, Wahl RL. Fluorodeoxyglucose uptake in human cancer
cell lines is increased by hypoxia. J Nucl Med. 1995;36:1625–1632.
25. Boellaard R, O’Doherty MJ, Weber WA, et al. FDG PET and PET/CT: EANM
procedure guidelines for tumour PET imaging: version 1.0. Eur J Nucl Med Mol
Imaging. 2010;37:181–200.
26. Eisenhofer G, Pacak K, Huynh TT, et al. Catecholamine metabolomic and se-
cretory phenotypes in phaeochromocytoma. Endocr Relat Cancer. 2011;18:97–
111.
27. Vander Heiden MG, Cantley LC, Thompson CB. Understanding the Warburg
effect: the metabolic requirements of cell proliferation. Science. 2009;324:1029–
1033.
28. Semenza GL. Hypoxia-inducible factors in physiology and medicine. Cell.
2012;148:399–408.
29. Maschauer S, Prante O, Hoffmann M, Deichen JT, Kuwert T. Characterization of18F-FDG uptake in human endothelial cells in vitro. J Nucl Med. 2004;45:455–
460.
30. Blank A, Schmitt AM, Korpershoek E, et al. SDHB loss predicts malignancy in
pheochromocytomas/sympathethic paragangliomas, but not through hypoxia sig-
nalling. Endocr Relat Cancer. 2010;17:919–928.
31. Aloj L, Caraco C, Jagoda E, Eckelman WC, Neumann RD. Glut-1 and hexoki-
nase expression: relationship with 2-fluoro-2-deoxy-D-glucose uptake in A431
and T47D cells in culture. Cancer Res. 1999;59:4709–4714.
32. Watanabe Y, Suefuji H, Hirose Y, et al. 18F-FDG uptake in primary gastric
malignant lymphoma correlates with glucose transporter 1 expression and his-
tologic malignant potential. Int J Hematol. 2013;97:43–49.
33. Wolf A, Agnihotri S, Micallef J, et al. Hexokinase 2 is a key mediator of aerobic
glycolysis and promotes tumor growth in human glioblastoma multiforme. J Exp
Med. 2011;208:313–326.
34. Span PN, Rao JU, Oude Ophuis SB, et al. Overexpression of the natural
antisense hypoxia-inducible factor-1a transcript is associated with malig-
nant pheochromocytoma/paraganglioma. Endocr Relat Cancer. 2011;18:
323–331.
18F-FDG PET IN PPGL • van Berkel et al. 1259
by on March 26, 2019. For personal use only. jnm.snmjournals.org Downloaded from
Doi: 10.2967/jnumed.114.137034Published online: June 12, 2014.
2014;55:1253-1259.J Nucl Med. F. Langenhuijsen, Dirk P.M. Kunst, Karel Pacak, Martin Gotthardt and Henri J.L.M. Timmersvan der Laak, Egbert Oosterwijk, Jacques W.M Lenders, Fred C.G.J. Sweep, Ron A. Wevers, Ad R. Hermus, Johan Anouk van Berkel, Jyotsna U. Rao, Benno Kusters, Tuna Demir, Eric Visser, Arjen R. Mensenkamp, Jeroen A.W.M. Glucose Uptake and Metabolism in Pheochromocytoma and Paraganglioma
F-FDG PET and Immunohistochemical Markers of18Correlation Between In Vivo
http://jnm.snmjournals.org/content/55/8/1253This article and updated information are available at:
http://jnm.snmjournals.org/site/subscriptions/online.xhtml
Information about subscriptions to JNM can be found at:
http://jnm.snmjournals.org/site/misc/permission.xhtmlInformation about reproducing figures, tables, or other portions of this article can be found online at:
(Print ISSN: 0161-5505, Online ISSN: 2159-662X)1850 Samuel Morse Drive, Reston, VA 20190.SNMMI | Society of Nuclear Medicine and Molecular Imaging
is published monthly.The Journal of Nuclear Medicine
© Copyright 2014 SNMMI; all rights reserved.
by on March 26, 2019. For personal use only. jnm.snmjournals.org Downloaded from