Embed Size (px)
DESCRIPTION
Correlation. Assumptions: You can plot a scatter graph You know what positive, negative and no correlation look like on a scatter graph. Correlation describes the strength of the relationship between two variables. Paired data is often known as bivariate data. - PowerPoint PPT Presentation
Citation preview
Correlation
Assumptions:You can plot a scatter graph
You know what positive, negative and no correlation look like on a scatter graph
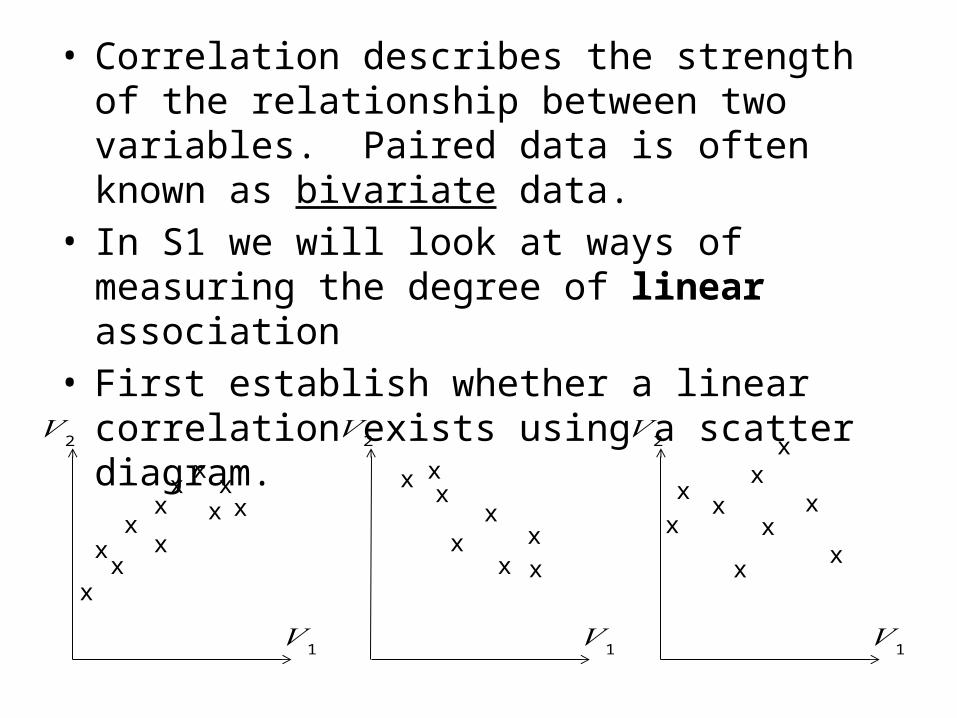
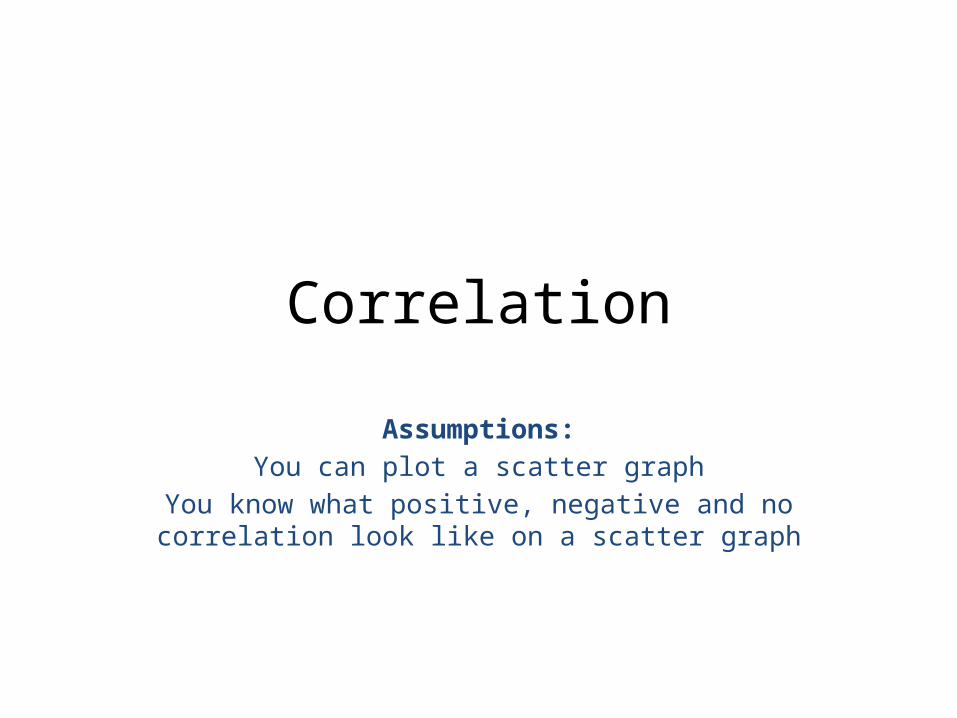
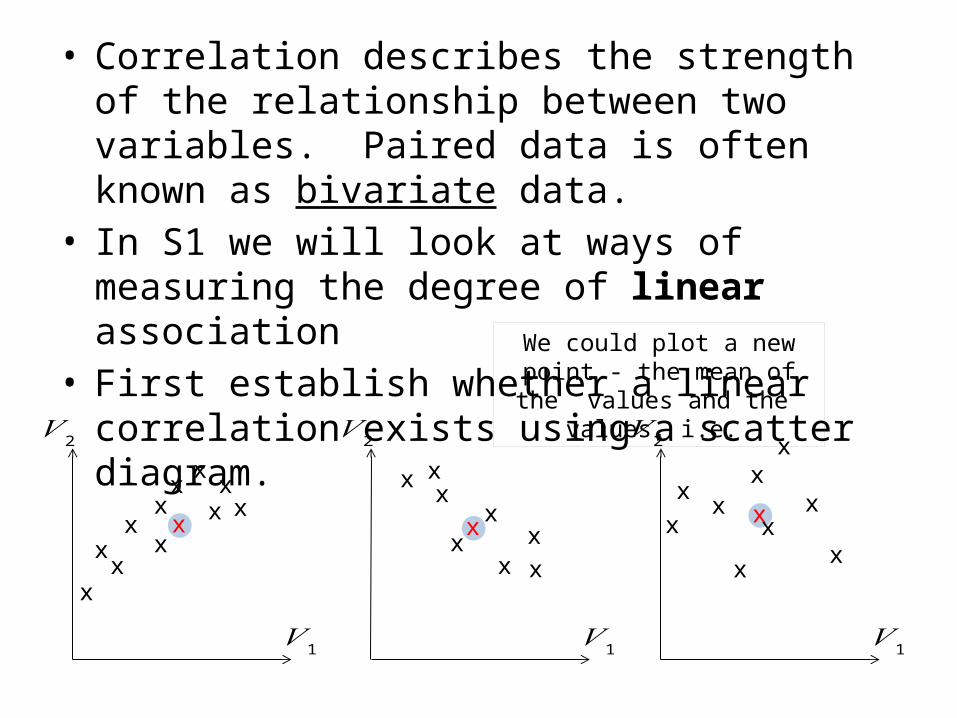
• Correlation describes the strength of the relationship between two variables. Paired data is often known as bivariate data.
• In S1 we will look at ways of measuring the degree of linear association
• First establish whether a linear correlation exists using a scatter diagram.
𝑉 2
𝑉 1
xx
xx
xx
x
xxx x
𝑉 2
𝑉 1
x
x x
xx
xxx
𝑉 2
𝑉 1
xx
x
x
x
x
xx
x
• Correlation describes the strength of the relationship between two variables. Paired data is often known as bivariate data.
• In S1 we will look at ways of measuring the degree of linear association
• First establish whether a linear correlation exists using a scatter diagram.
𝑉 2
𝑉 1
𝑉 2
𝑉 1
𝑉 2
𝑉 1
xx
xx
xx
x
xxx x
x
x xx
x
x xx
xx
x
x
x
xx
x
x x xx
We could plot a new point - the mean of the values and the
values, i.e.
𝑉 2
𝑉 1
𝑉 2
𝑉 1
𝑉 2
𝑉 1
xx
xx
xx
x
xxx x
x
x xx
x
x xx
xx
x
x
x
xx
x
x x xx
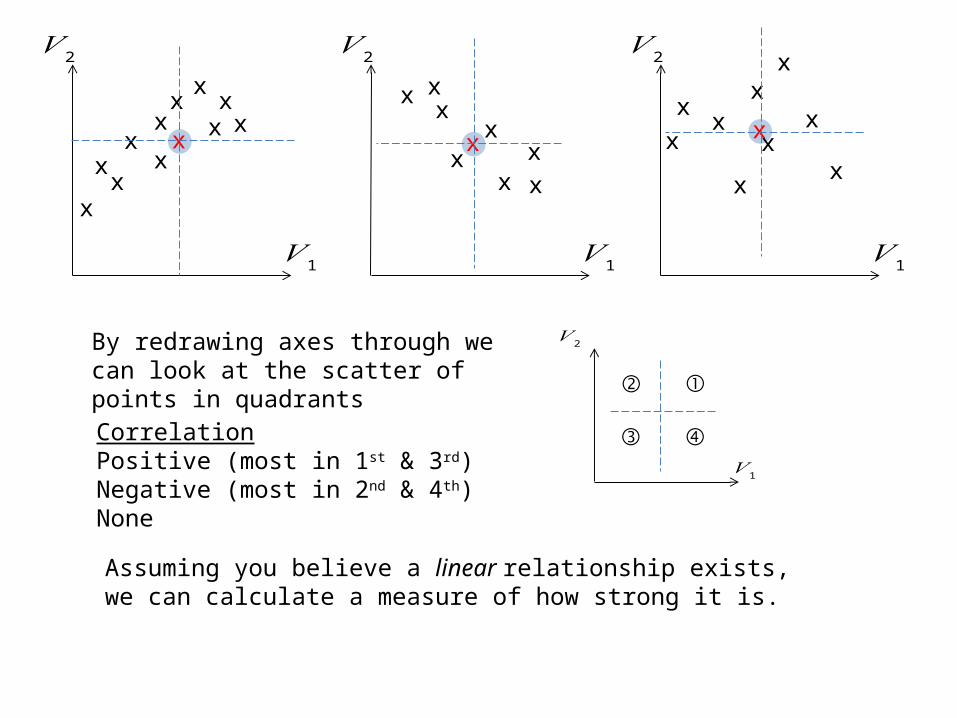
By redrawing axes through we can look at the scatter of points in quadrants
𝑉 2
𝑉 1
①②
③ ④CorrelationPositive (most in 1st & 3rd)Negative (most in 2nd & 4th)None
Assuming you believe a linear relationship exists, we can calculate a measure of how strong it is.
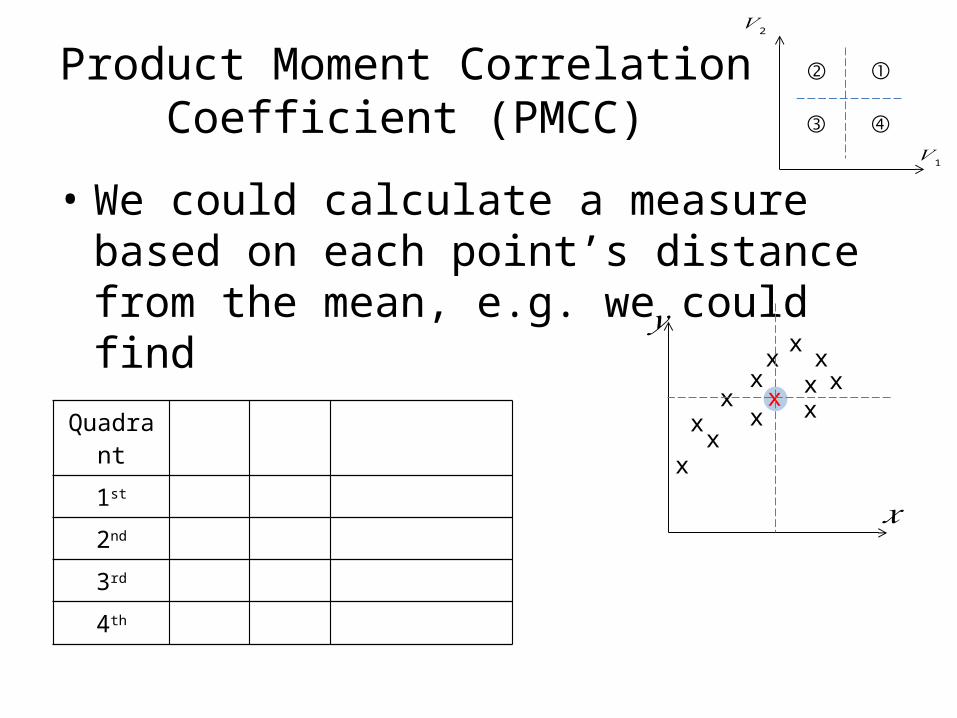
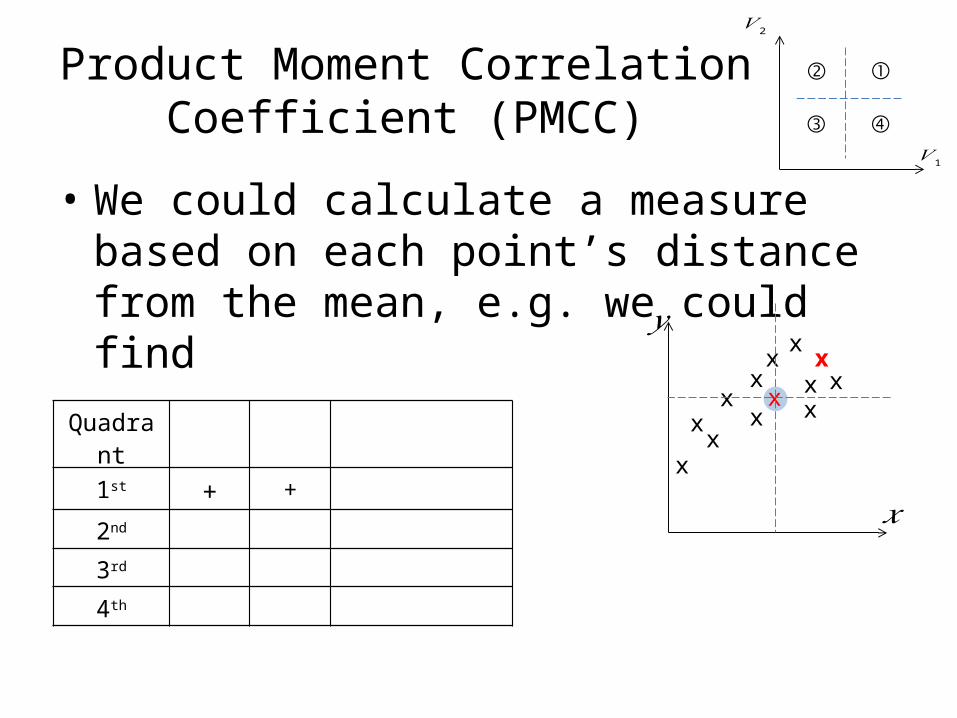
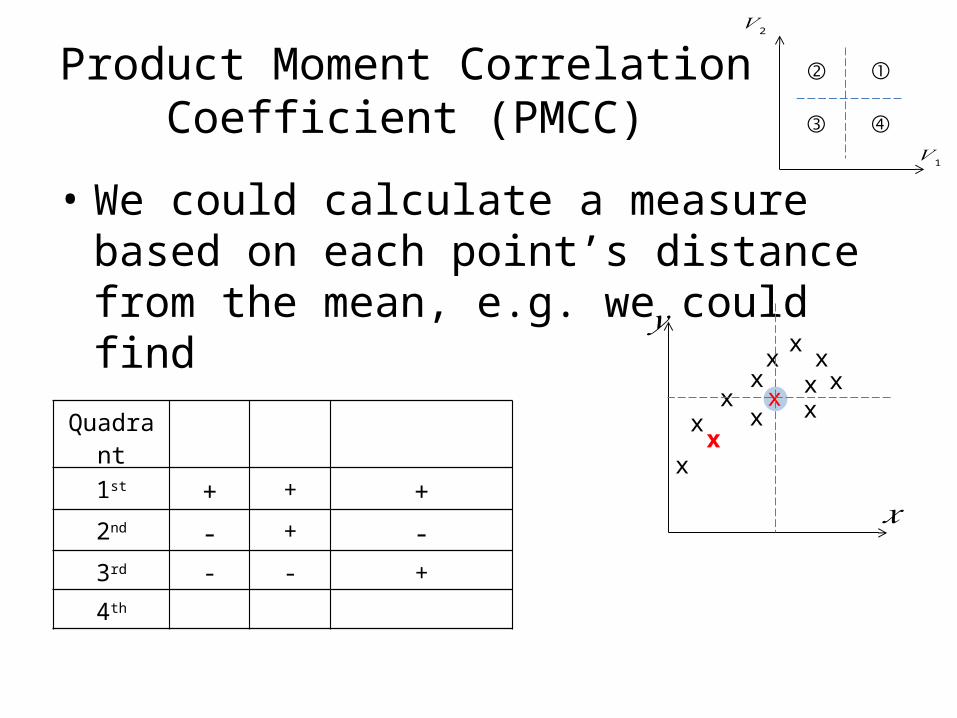
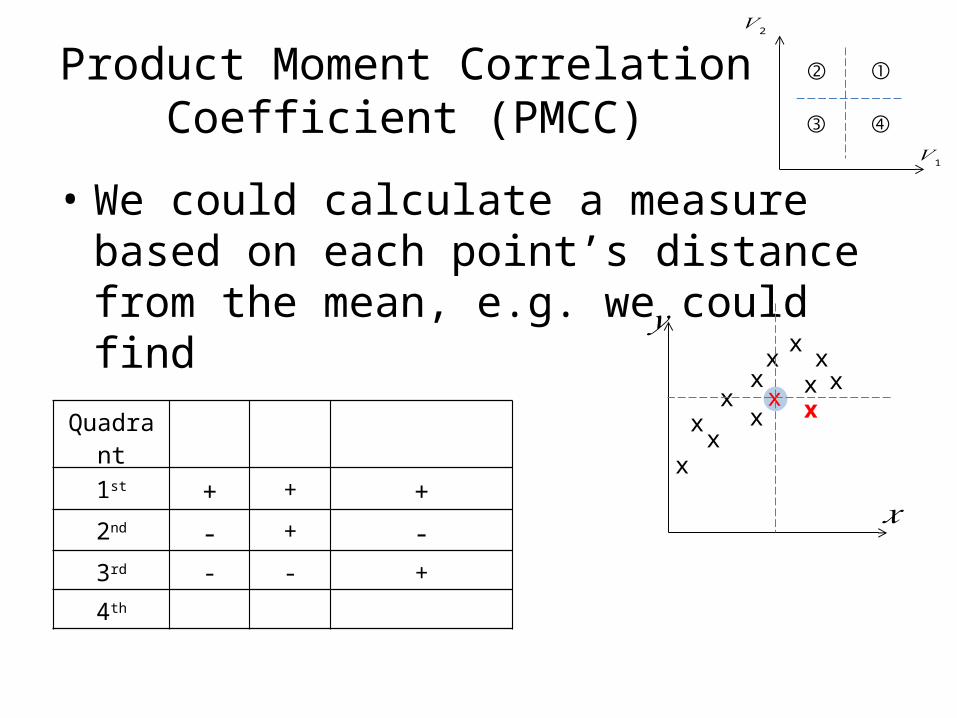
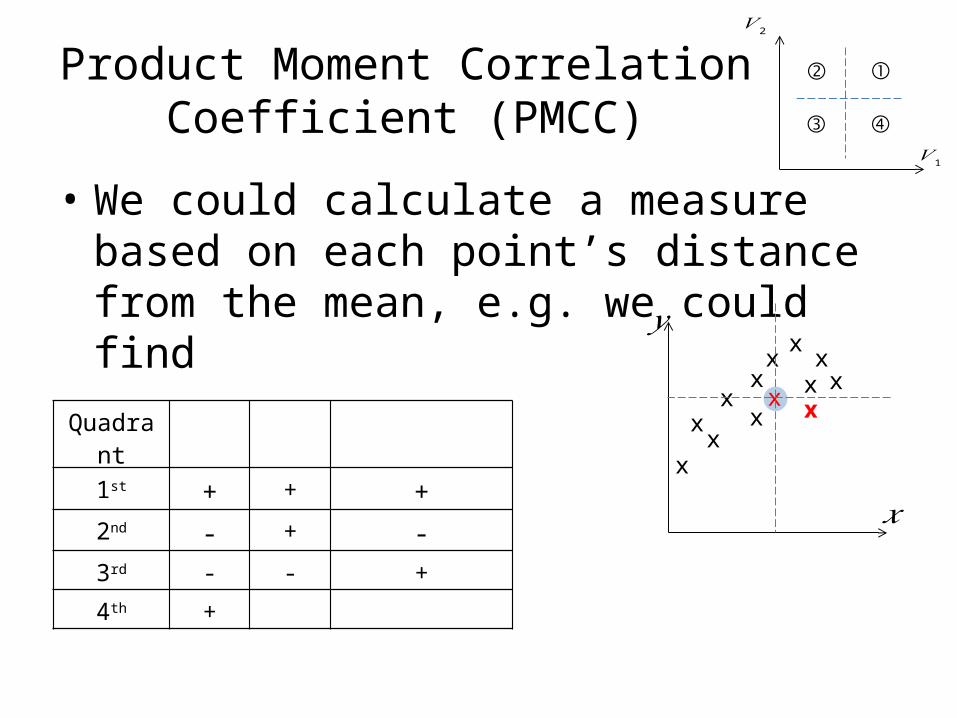
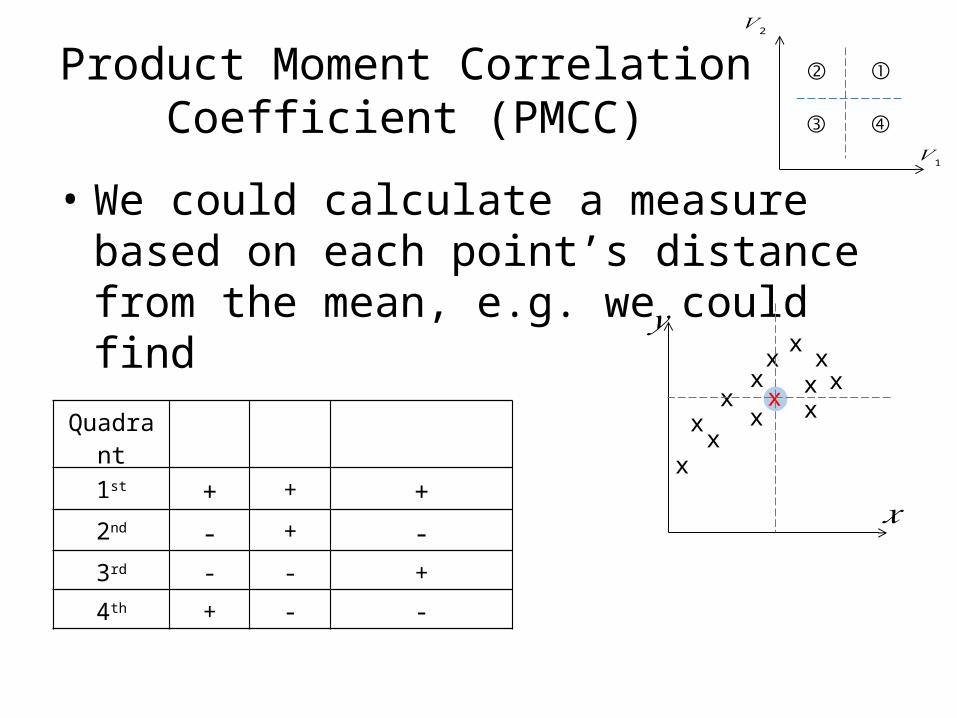
Product Moment Correlation Coefficient (PMCC)
• We could calculate a measure based on each point’s distance from the mean, e.g. we could find
Quadrant
1st
2nd
3rd
4th
𝑉 2
𝑉 1
①②
③ ④
𝑦
𝑥
xx
xx
xx
x
xxx x
x x
Product Moment Correlation Coefficient (PMCC)
• We could calculate a measure based on each point’s distance from the mean, e.g. we could find 𝑦
𝑥
xx
xx
xx
x
xxx x
xQuadrant
1st
2nd
3rd
4th
𝑉 2
𝑉 1
①②
③ ④
x
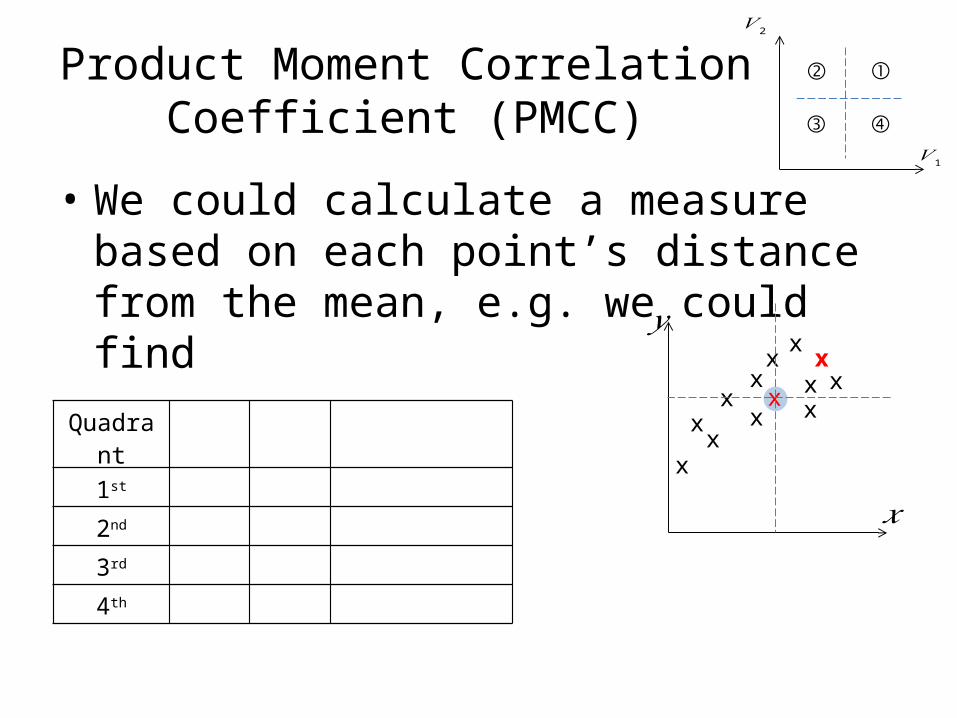
Product Moment Correlation Coefficient (PMCC)
• We could calculate a measure based on each point’s distance from the mean, e.g. we could find 𝑦
𝑥
xx
xx
xx
x
xxx x
xQuadrant
1st +2nd
3rd
4th
𝑉 2
𝑉 1
①②
③ ④
x
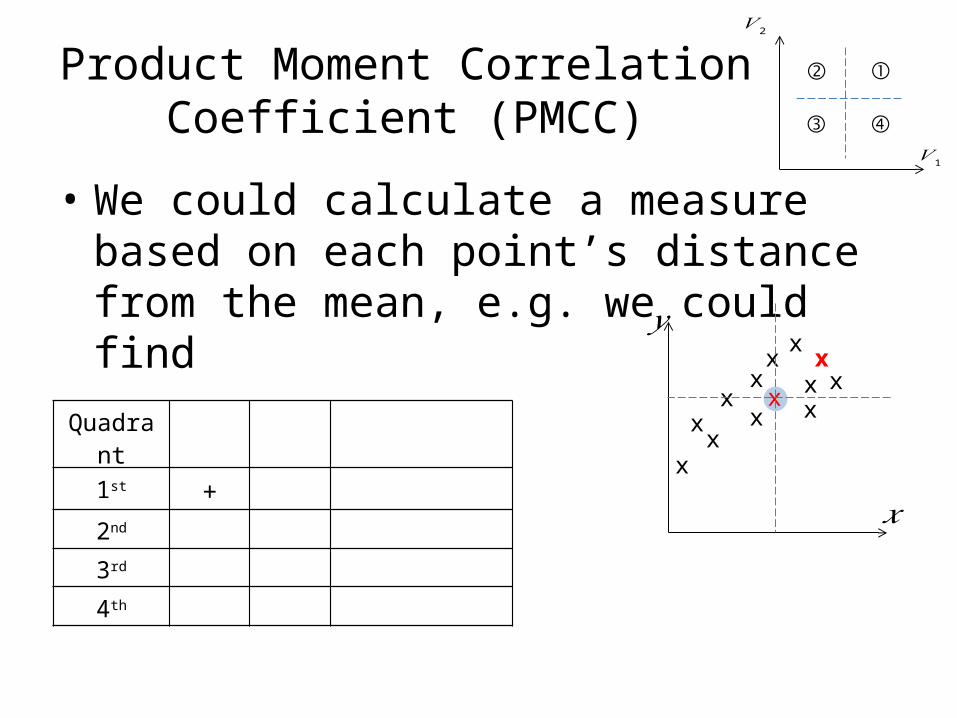
Product Moment Correlation Coefficient (PMCC)
• We could calculate a measure based on each point’s distance from the mean, e.g. we could find 𝑦
𝑥
xx
xx
xx
x
xxx x
xQuadrant
1st + +
2nd
3rd
4th
𝑉 2
𝑉 1
①②
③ ④
x

Product Moment Correlation Coefficient (PMCC)
• We could calculate a measure based on each point’s distance from the mean, e.g. we could find 𝑦
𝑥
xx
xx
xx
x
xxx x
xQuadrant
1st + + +2nd
3rd
4th
𝑉 2
𝑉 1
①②
③ ④
x
Product Moment Correlation Coefficient (PMCC)
• We could calculate a measure based on each point’s distance from the mean, e.g. we could find 𝑦
𝑥
xx
xx
xx
x
xxx x
xQuadrant
1st + + +2nd
3rd
4th
𝑉 2
𝑉 1
①②
③ ④
x
Complete the table…
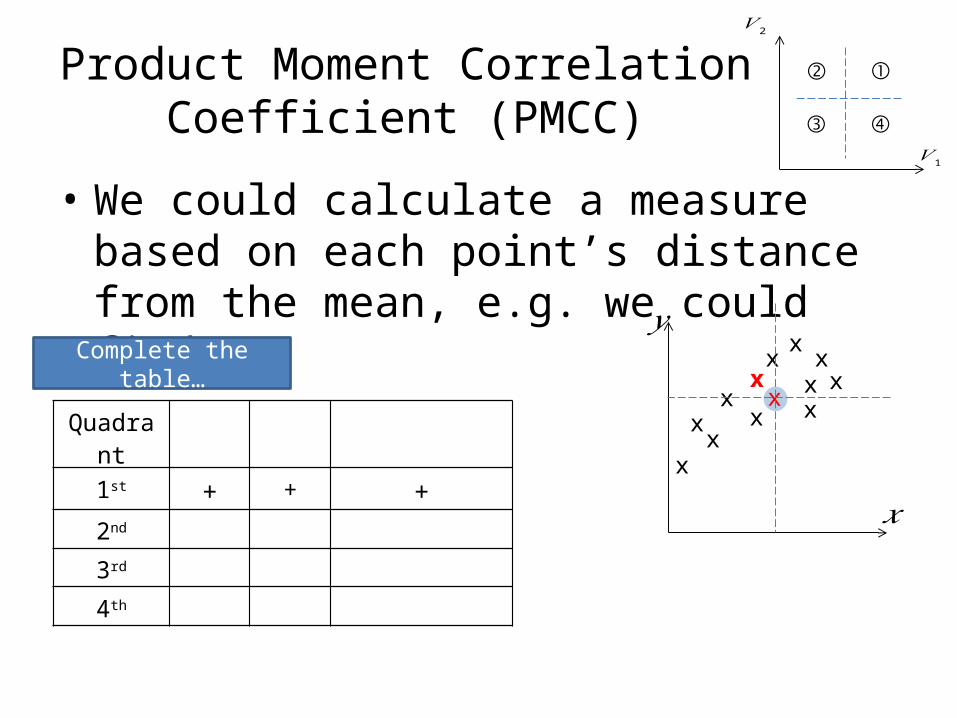
Product Moment Correlation Coefficient (PMCC)
• We could calculate a measure based on each point’s distance from the mean, e.g. we could find 𝑦
𝑥
xx
xx
xx
x
xxx x
xQuadrant
1st + + +2nd -3rd
4th
𝑉 2
𝑉 1
①②
③ ④
x
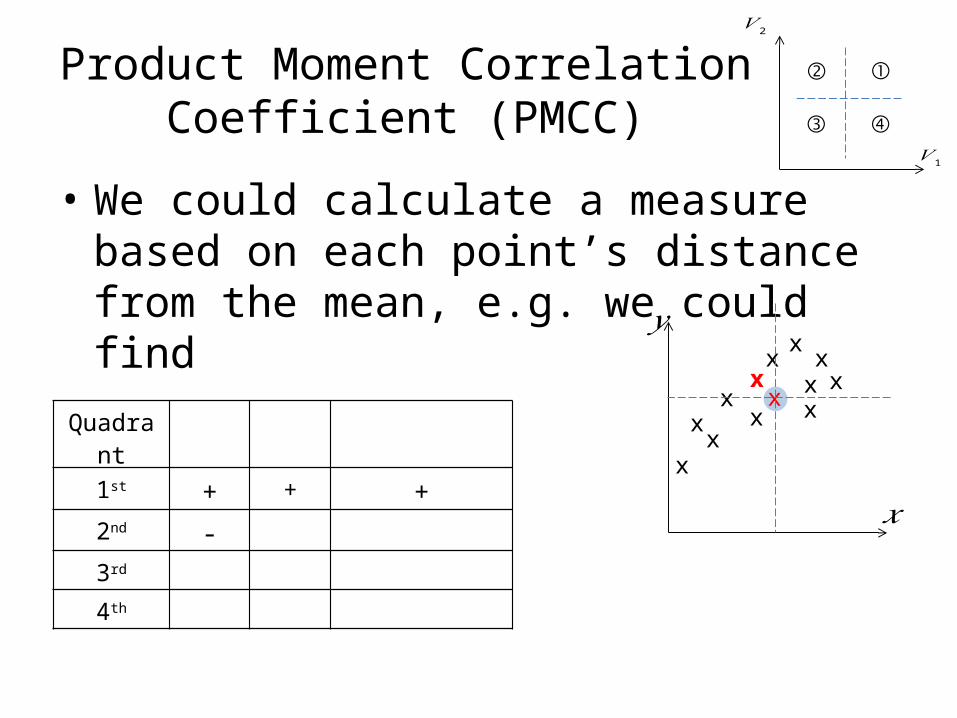
Product Moment Correlation Coefficient (PMCC)
• We could calculate a measure based on each point’s distance from the mean, e.g. we could find 𝑦
𝑥
xx
xx
xx
x
xxx x
xQuadrant
1st + + +2nd - +
3rd
4th
𝑉 2
𝑉 1
①②
③ ④
x

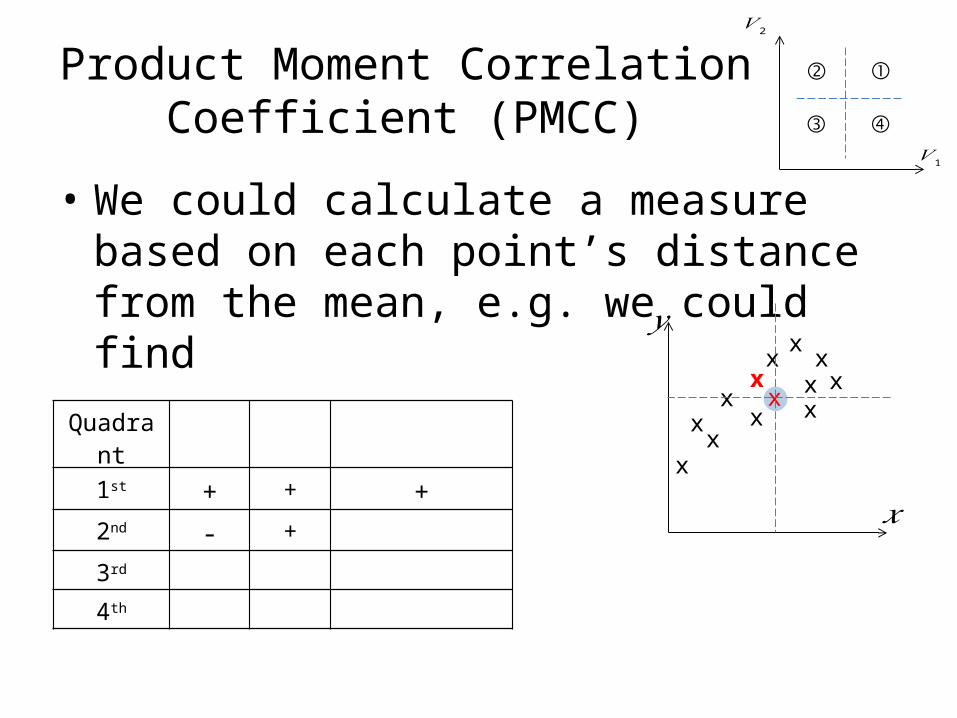
Product Moment Correlation Coefficient (PMCC)
• We could calculate a measure based on each point’s distance from the mean, e.g. we could find 𝑦
𝑥
xx
xx
xx
x
xxx x
xQuadrant
1st + + +2nd - + -3rd
4th
𝑉 2
𝑉 1
①②
③ ④
x

Product Moment Correlation Coefficient (PMCC)
• We could calculate a measure based on each point’s distance from the mean, e.g. we could find 𝑦
𝑥
xx
xx
xx
x
xxx x
xQuadrant
1st + + +2nd - + -3rd
4th
𝑉 2
𝑉 1
①②
③ ④
x

Product Moment Correlation Coefficient (PMCC)
• We could calculate a measure based on each point’s distance from the mean, e.g. we could find 𝑦
𝑥
xx
xx
xx
x
xxx x
xQuadrant
1st + + +2nd - + -3rd -
4th
𝑉 2
𝑉 1
①②
③ ④
x

Product Moment Correlation Coefficient (PMCC)
• We could calculate a measure based on each point’s distance from the mean, e.g. we could find 𝑦
𝑥
xx
xx
xx
x
xxx x
xQuadrant
1st + + +2nd - + -3rd - -
4th
𝑉 2
𝑉 1
①②
③ ④
x
Product Moment Correlation Coefficient (PMCC)
• We could calculate a measure based on each point’s distance from the mean, e.g. we could find 𝑦
𝑥
xx
xx
xx
x
xxx x
xQuadrant
1st + + +2nd - + -3rd - - +
4th
𝑉 2
𝑉 1
①②
③ ④
x
Product Moment Correlation Coefficient (PMCC)
• We could calculate a measure based on each point’s distance from the mean, e.g. we could find 𝑦
𝑥
xx
xx
xx
x
xxx x
xQuadrant
1st + + +2nd - + -3rd - - +
4th
𝑉 2
𝑉 1
①②
③ ④
x
Product Moment Correlation Coefficient (PMCC)
• We could calculate a measure based on each point’s distance from the mean, e.g. we could find 𝑦
𝑥
xx
xx
xx
x
xxx x
xQuadrant
1st + + +2nd - + -3rd - - +
4th +
𝑉 2
𝑉 1
①②
③ ④
x

Product Moment Correlation Coefficient (PMCC)
• We could calculate a measure based on each point’s distance from the mean, e.g. we could find 𝑦
𝑥
xx
xx
xx
x
xxx x
xQuadrant
1st + + +2nd - + -3rd - - +
4th + -
𝑉 2
𝑉 1
①②
③ ④
x

Product Moment Correlation Coefficient (PMCC)
• We could calculate a measure based on each point’s distance from the mean, e.g. we could find 𝑦
𝑥
xx
xx
xx
x
xxx x
xQuadrant
1st + + +2nd - + -3rd - - +
4th + - -
𝑉 2
𝑉 1
①②
③ ④
x
Product Moment Correlation Coefficient (PMCC)
• We could calculate a measure based on each point’s distance from the mean, e.g. we could find 𝑦
𝑥
xx
xx
xx
x
xxx x
xQuadrant
1st + + +2nd - + -3rd - - +
4th + - -
𝑉 2
𝑉 1
①②
③ ④
x
Product Moment Correlation Coefficient (PMCC)
𝑦
𝑥
xx
xx
xx
x
xxx x
x
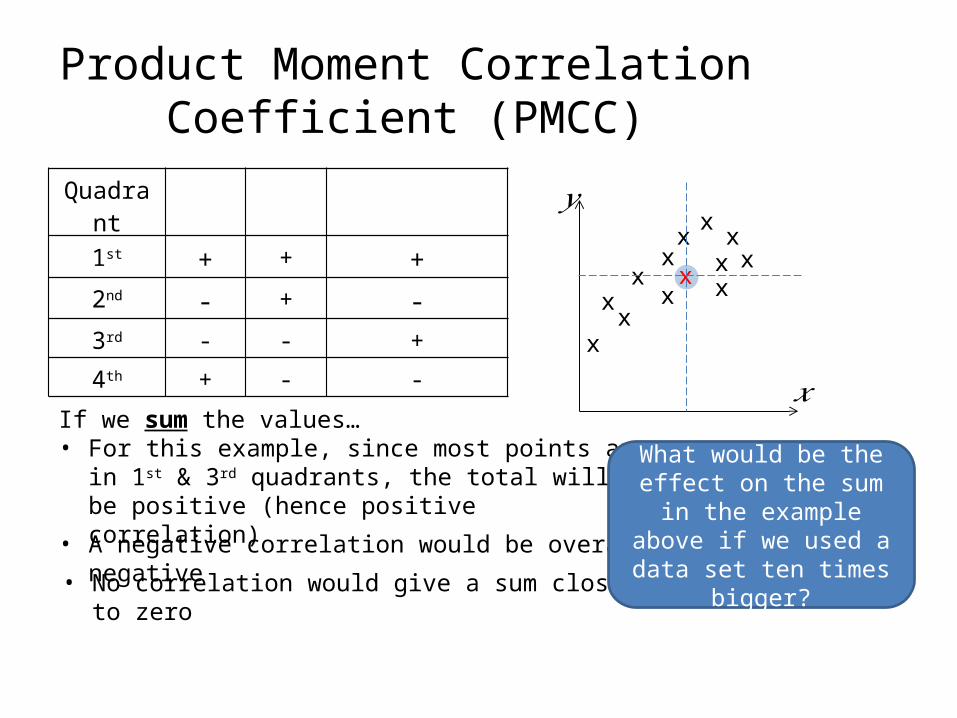
Quadrant
1st + + +2nd - + -3rd - - +
4th + - -
x
If we sum the values… • For this example, since most points are in 1st & 3rd
quadrants, the total will be positive (hence positive correlation)
• A negative correlation would be overall negative
• No correlation would give a sum close to zero
What would be the effect on the sum in the example above if we used a data set
ten times bigger?
Product Moment Correlation Coefficient (PMCC)
𝑦
𝑥
xx
xx
xx
x
xxx x
x
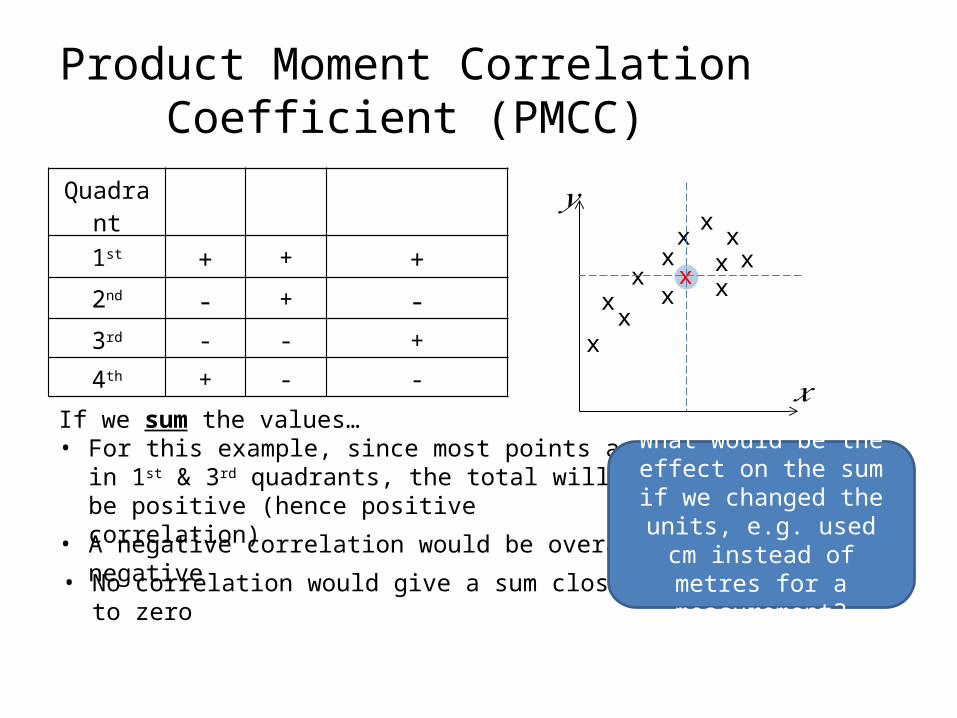
Quadrant
1st + + +2nd - + -3rd - - +
4th + - -
x
If we sum the values… • For this example, since most points are in 1st & 3rd
quadrants, the total will be positive (hence positive correlation)
• A negative correlation would be overall negative
• No correlation would give a sum close to zero
What would be the effect on the sum if we changed
the units, e.g. used cm instead of metres for a
measurement?
Product Moment Correlation Coefficient (PMCC)
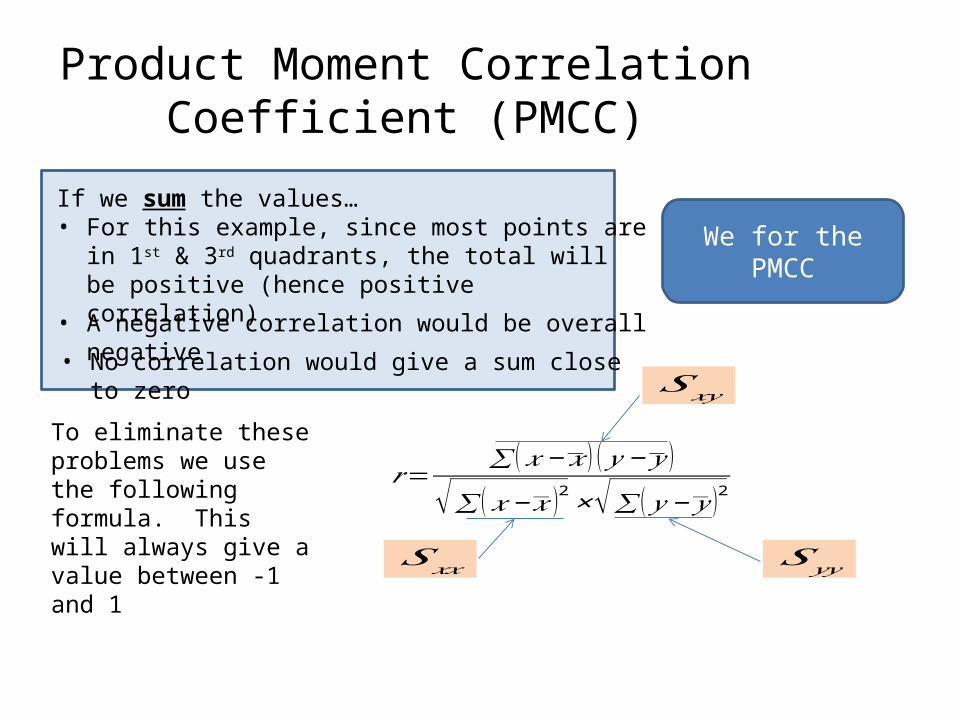
If we sum the values… • For this example, since most points are in 1st & 3rd
quadrants, the total will be positive (hence positive correlation)
• A negative correlation would be overall negative
• No correlation would give a sum close to zero
To eliminate these problems we use the following formula. This will always give a value between -1 and 1
𝑟=∑ (𝑥−𝑥 ) (𝑦− 𝑦 )
√∑ (𝑥−𝑥 )2×√∑ ( 𝑦− 𝑦 )2
𝑆𝑥𝑥 𝑆 𝑦𝑦
𝑆𝑥𝑦
We for the PMCC
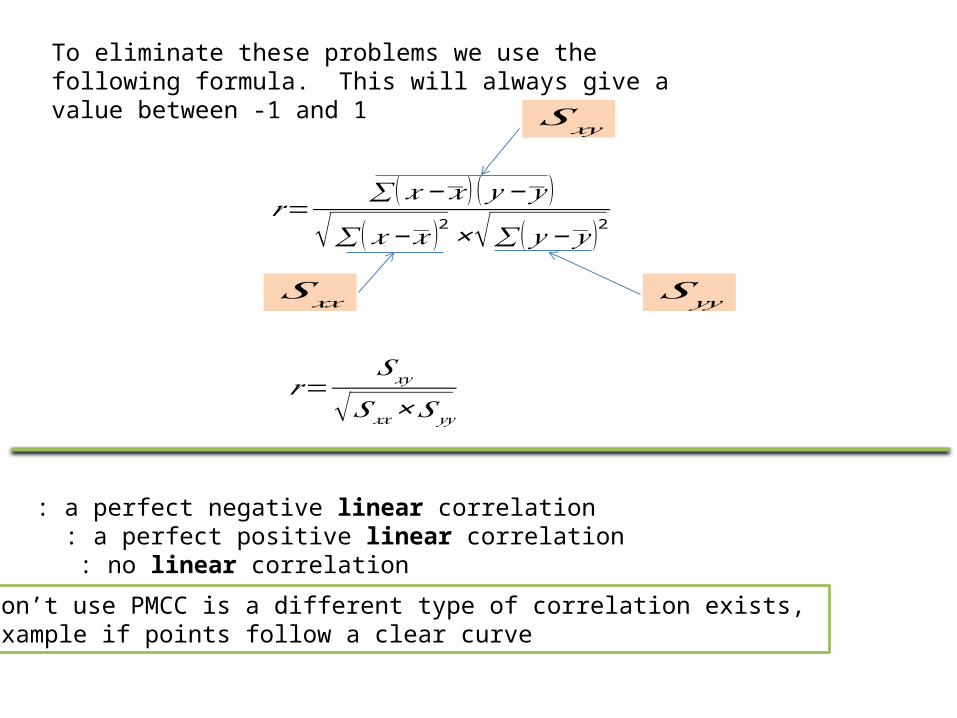
To eliminate these problems we use the following formula. This will always give a value between -1 and 1
𝑟=∑ (𝑥−𝑥 ) (𝑦− 𝑦 )
√∑ (𝑥−𝑥 )2×√∑ ( 𝑦− 𝑦 )2
𝑆𝑥𝑥 𝑆 𝑦𝑦
𝑆𝑥𝑦
𝑟=𝑆𝑥𝑦
√𝑆𝑥𝑥×𝑆𝑦𝑦
: a perfect negative linear correlation : a perfect positive linear correlation : no linear correlation
NB. Don’t use PMCC is a different type of correlation exists, For example if points follow a clear curve
An easier version of the formula
• The following are easier to use in calculations
NB You are given all these formulas in the exam

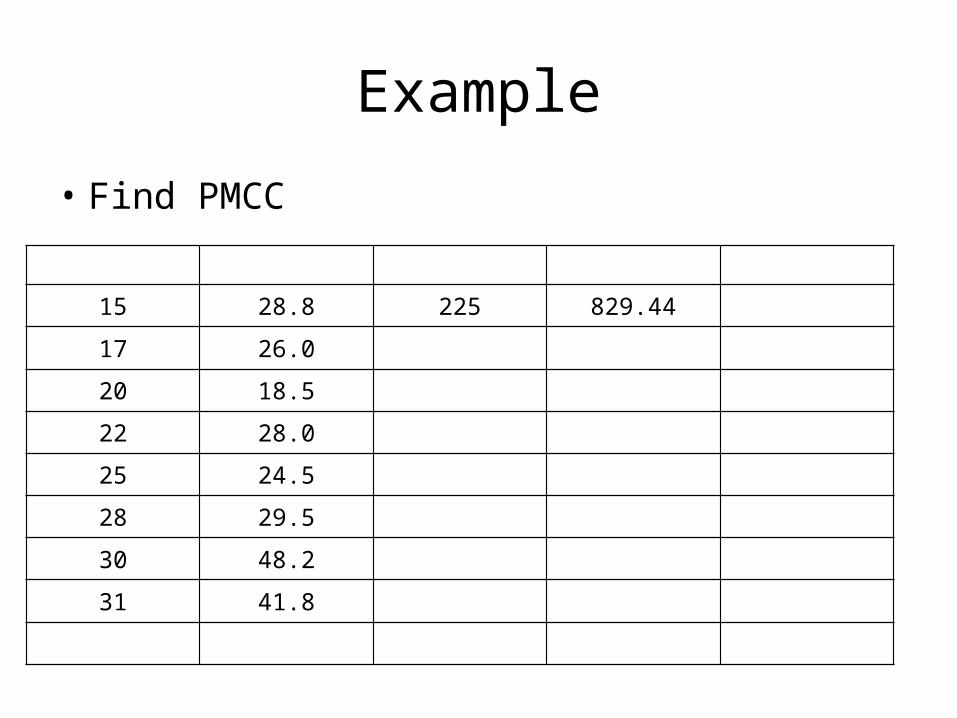
Example
• Find PMCC
15 28.8
17 26.0
20 18.5
22 28.0
25 24.5
28 29.5
30 48.2
31 41.8

Example
• Find PMCC
15 28.8 225
17 26.0
20 18.5
22 28.0
25 24.5
28 29.5
30 48.2
31 41.8
Example
• Find PMCC
15 28.8 225 829.44
17 26.0
20 18.5
22 28.0
25 24.5
28 29.5
30 48.2
31 41.8
Example
• Find PMCC
15 28.8 225 829.44 432
17 26.0
20 18.5
22 28.0
25 24.5
28 29.5
30 48.2
31 41.8
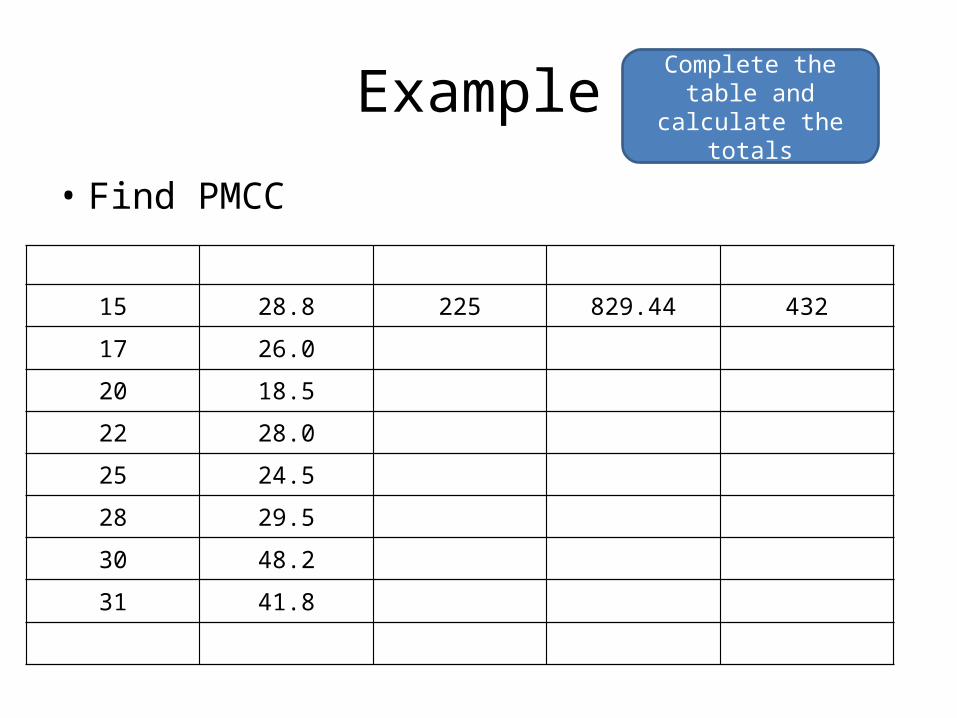
Complete the table and calculate the totals
Example
• Find PMCC
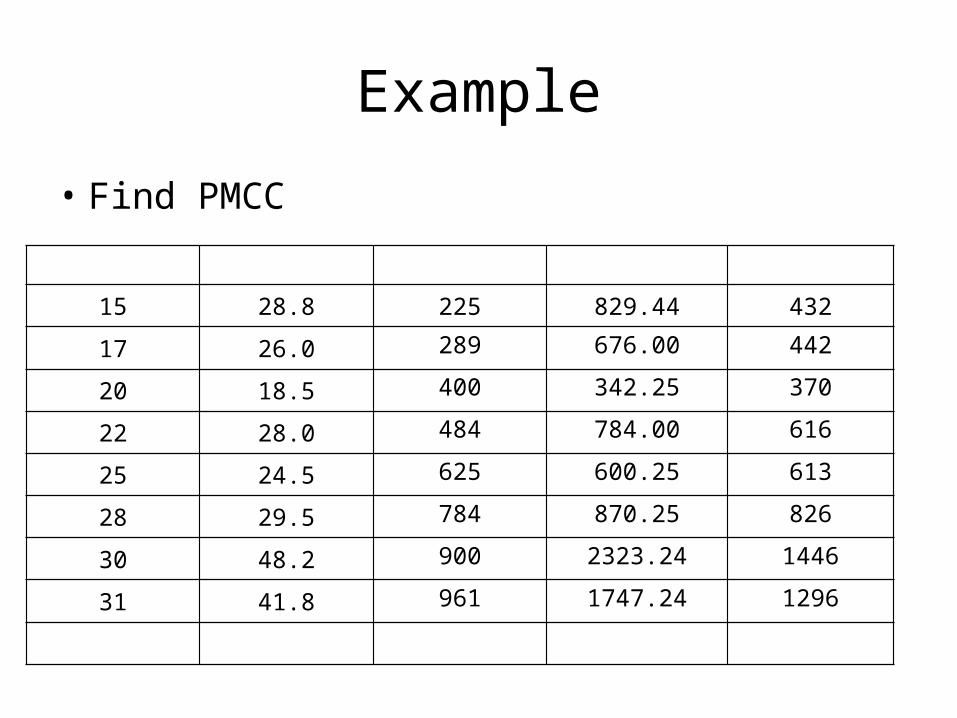
15 28.8 225 829.44 432
17 26.0 289 676.00 442
20 18.5 400 342.25 370
22 28.0 484 784.00 616
25 24.5 625 600.25 613
28 29.5 784 870.25 826
30 48.2 900 2323.24 1446
31 41.8 961 1747.24 1296
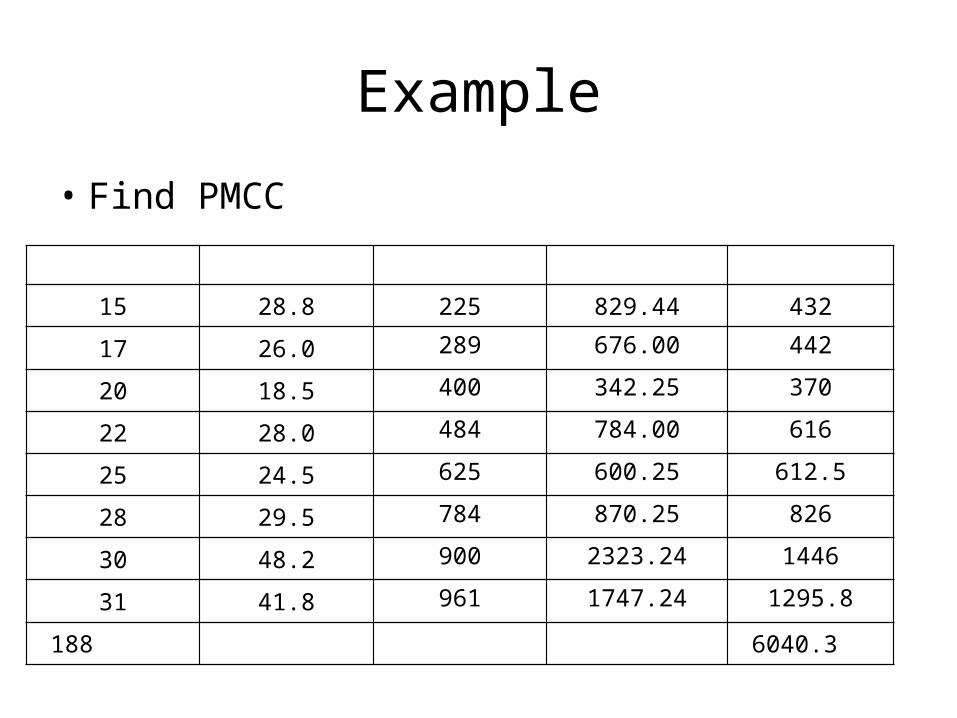
Example
• Find PMCC
15 28.8 225 829.44 432
17 26.0 289 676.00 442
20 18.5 400 342.25 370
22 28.0 484 784.00 616
25 24.5 625 600.25 612.5
28 29.5 784 870.25 826
30 48.2 900 2323.24 1446
31 41.8 961 1747.24 1295.8
188 6040.3
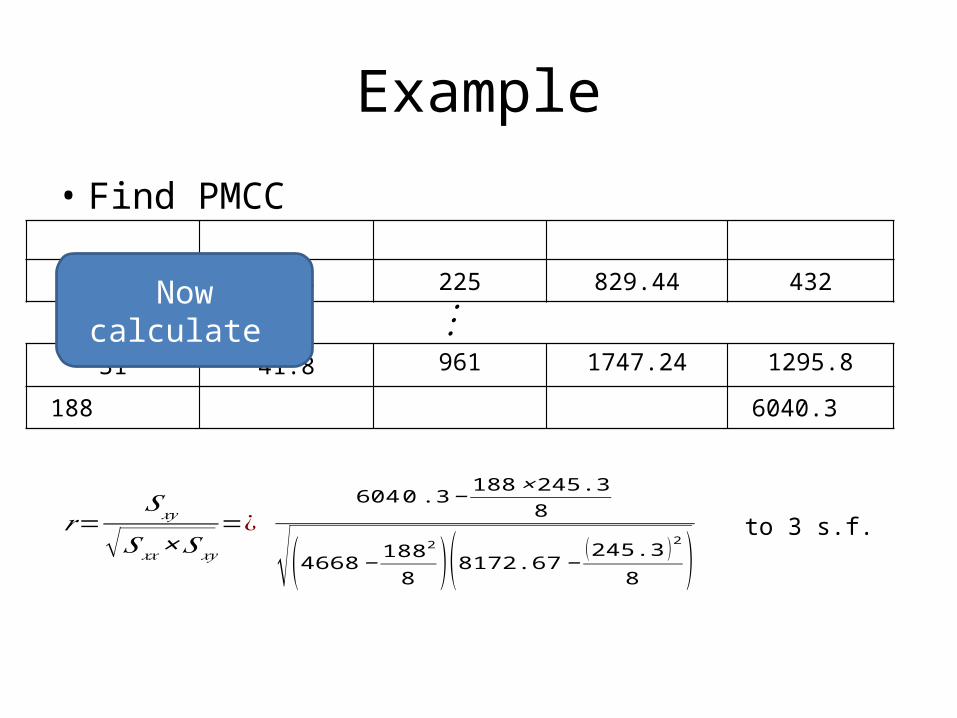
Example
• Find PMCC
31 41.8 961 1747.24 1295.8
188 6040.3
15 28.8 225 829.44 432
⋮Now calculate
𝑟=𝑆𝑥𝑦
√𝑆𝑥𝑥×𝑆𝑥𝑦
=¿604 0 .3−
188×245.38
√(4668−1882
8 )(8172.67−(245.3 )2
8 ) to 3 s.f.
Example
• Find PMCC
𝑟=𝑆𝑥𝑦
√𝑆𝑥𝑥×𝑆𝑥𝑦
=¿604.3−
188×245.38
√(4668−1882
8 )(8172.67−(245.3 )2
8 ) to 3 s.f.
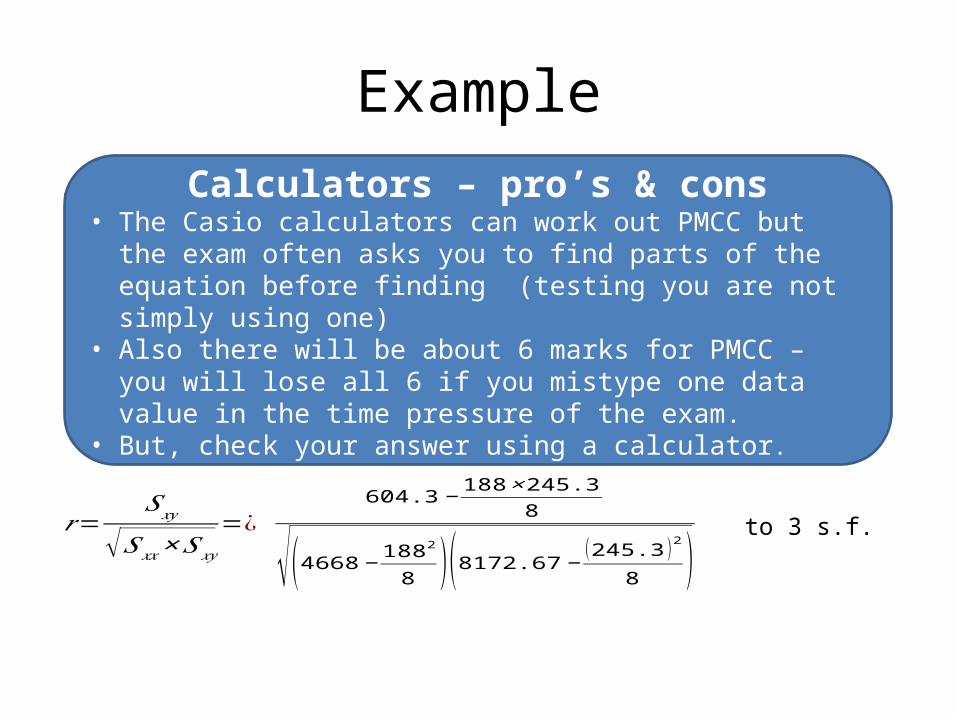
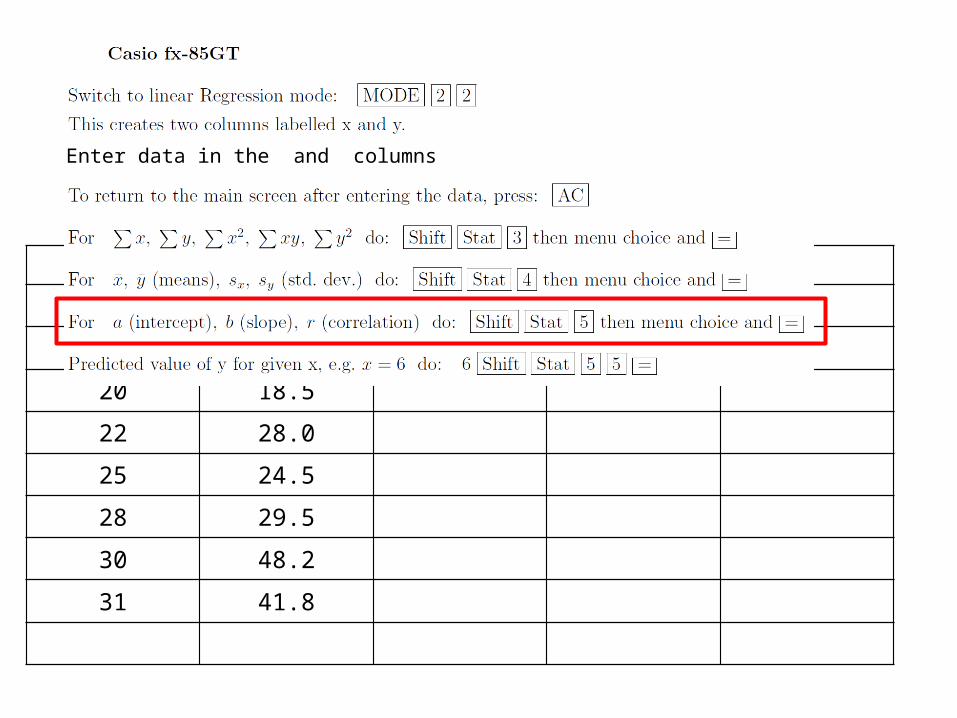
Calculators – pro’s & cons• The Casio calculators can work out PMCC but the exam often asks
you to find parts of the equation before finding (testing you are not simply using one)
• Also there will be about 6 marks for PMCC – you will lose all 6 if you mistype one data value in the time pressure of the exam.
• But, check your answer using a calculator.
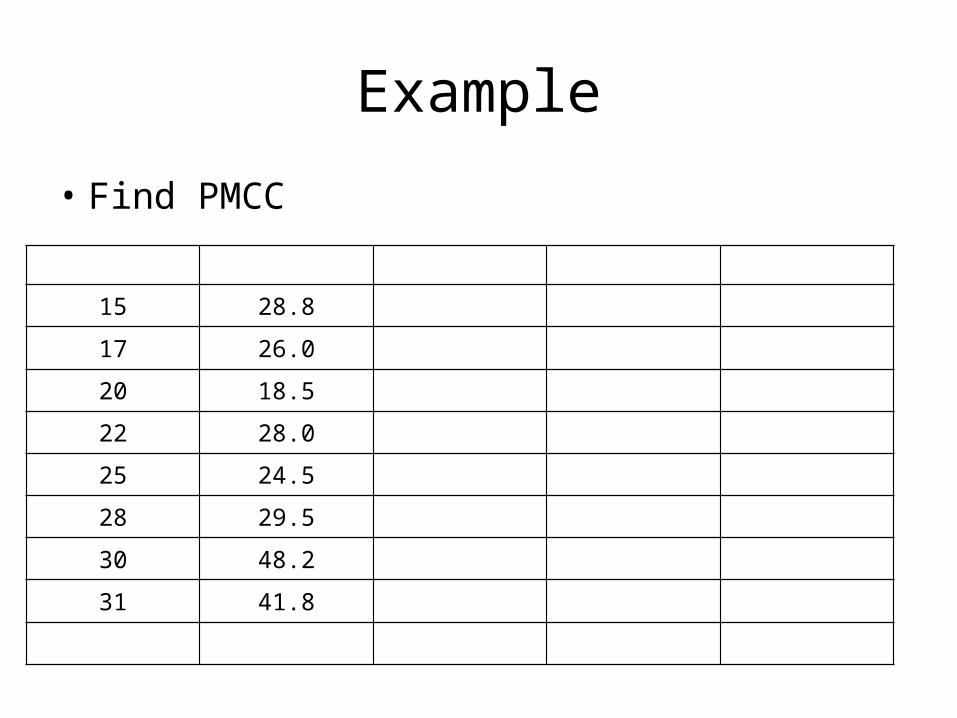
Example
• Find PMCC
15 28.8
17 26.0
20 18.5
22 28.0
25 24.5
28 29.5
30 48.2
31 41.8
Example
15 28.8
17 26.0
20 18.5
22 28.0
25 24.5
28 29.5
30 48.2
31 41.8
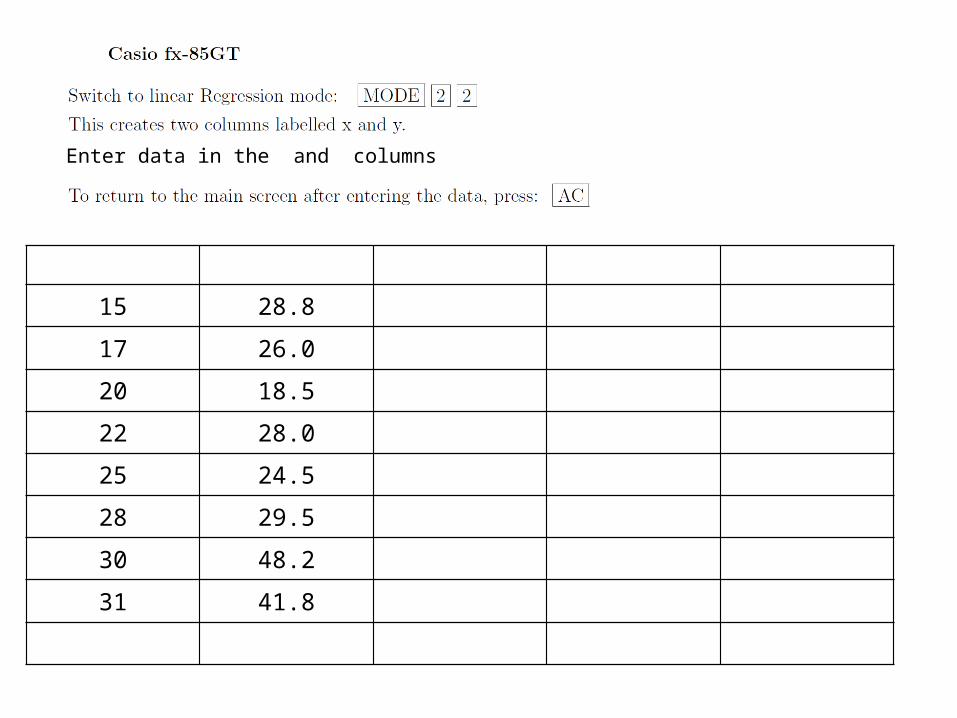
Enter data in the and columns
Example
• Find PMCC
15 28.8
17 26.0
20 18.5
22 28.0
25 24.5
28 29.5
30 48.2
31 41.8
Enter data in the and columns
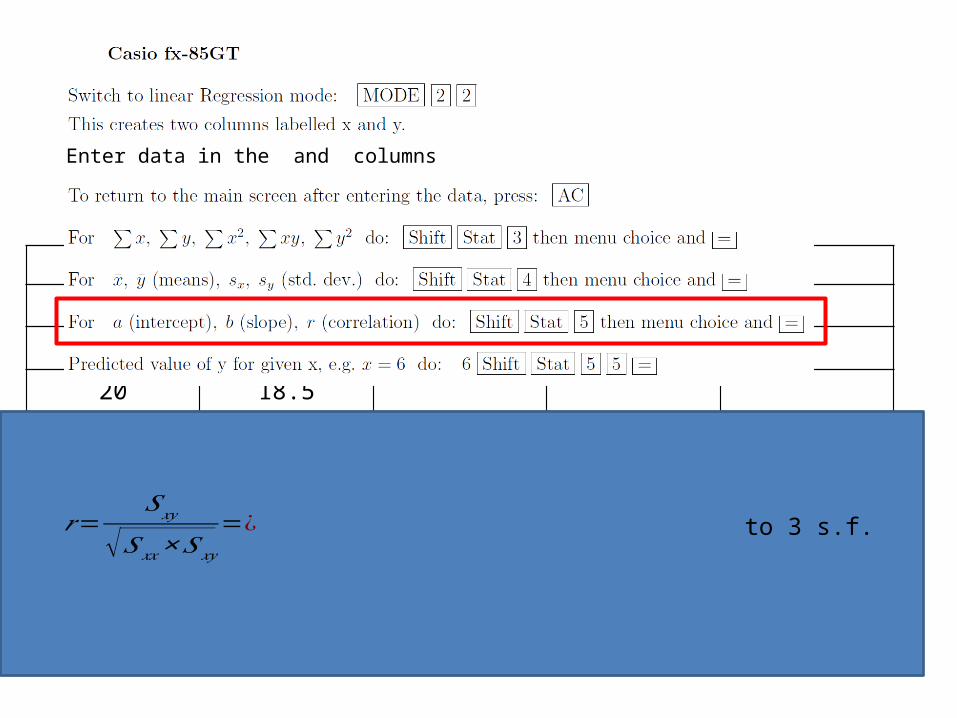
Example
• Find PMCC
15 28.8
17 26.0
20 18.5
22 28.0
25 24.5
28 29.5
30 48.2
31 41.8
Enter data in the and columns
𝑟=𝑆𝑥𝑦
√𝑆𝑥𝑥×𝑆𝑥𝑦
=¿ to 3 s.f.
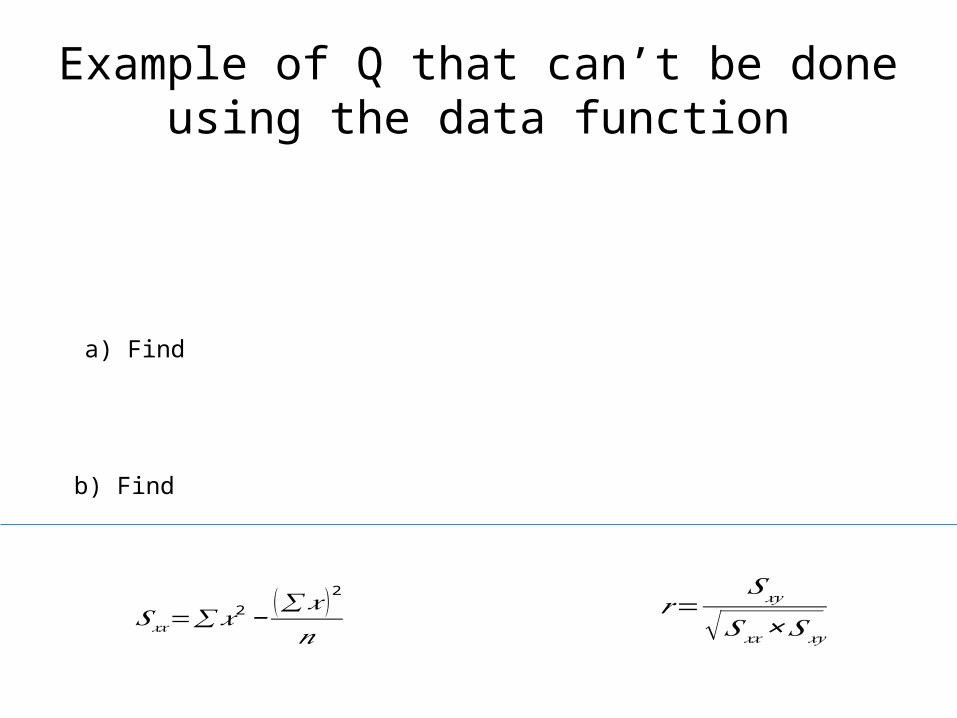
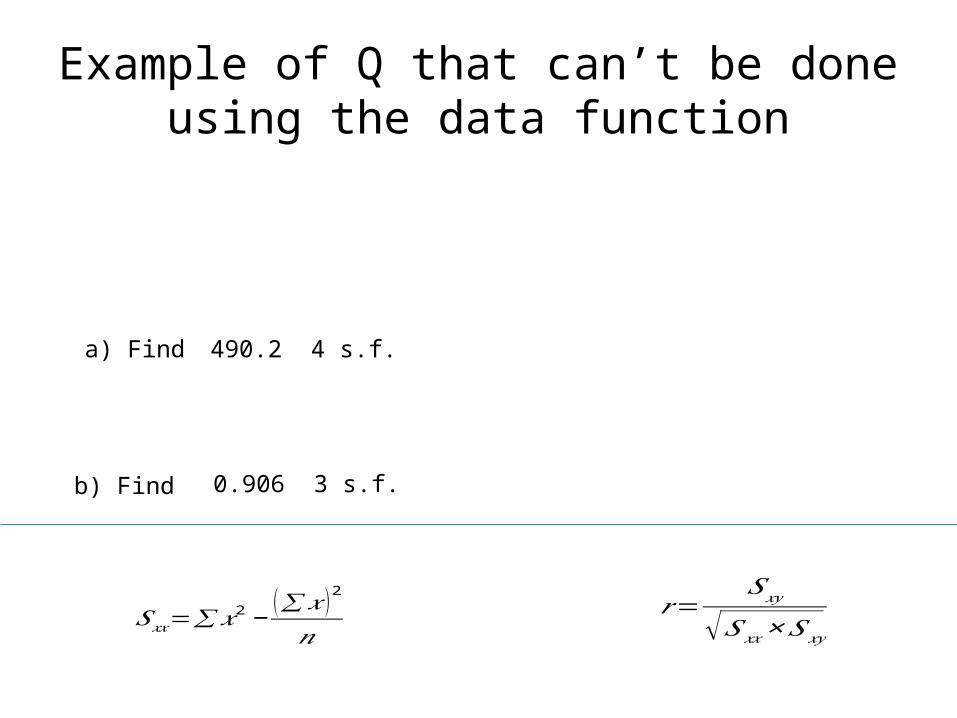
Example of Q that can’t be done using the data function
a) Find
b) Find
𝑟=𝑆𝑥𝑦
√𝑆𝑥𝑥×𝑆𝑥𝑦𝑆𝑥𝑥=∑𝑥
2−(∑𝑥 )2
𝑛
Example of Q that can’t be done using the data function
a) Find
b) Find
𝑟=𝑆𝑥𝑦
√𝑆𝑥𝑥×𝑆𝑥𝑦𝑆𝑥𝑥=∑𝑥
2−(∑𝑥 )2
𝑛
490.2 4 s.f.
0.906 3 s.f.