Embed Size (px)
Citation preview

CORRELATING WEBSITE FUNCTIONALITY WITH POPULARITY
BY
LEE GUAN CHUAN
A REPORT
SUBMITTED TO
University Tunku Abdul Rahman
In partial fulfillment of the requirements
For the degree of
BACHELOR OF INFORMATION SYSTEM (HONS)
INFORMATION SYSTEM ENGINEERING
Faculty of Information Communication Technology
(Perak Campus)
JANUARY 2015

ii
DECLARATION OF ORIGINALITY
I declare that this report entitled “CORRELATING WEBSITE FUNCTIONALITY
WITH POPULARITY” is my own work except as cited in the references. The report
has not been accepted for any degree and is not being submitted concurrently in
candidature for any degree or other award.
Signature : _____________________
Name : _____________________
Date : _____________________

iii
ACKNOWLEDGEMENTS
I would like to express my sincere thanks and appreciation to my supervisor, Dr. Ng Yen
Kaow who has given me a chance to engage in this website classification project. Besides,
he also provided me a lot of constructive feedback and idea for completing this project
and he kept putting effort on us. At times when I wanted to give up, he guided me
throughout the project. It is my first step to establish a career in machine learning field. A
million thanks to you.
Apart from that, I would like to thank all my friends. This is because I learned a lot from
them. Different knowledge that I gained that allows me to do this project easily was
taught by my friends. Last but not least, I would like to thank my family that sent me to
UTAR.
iv
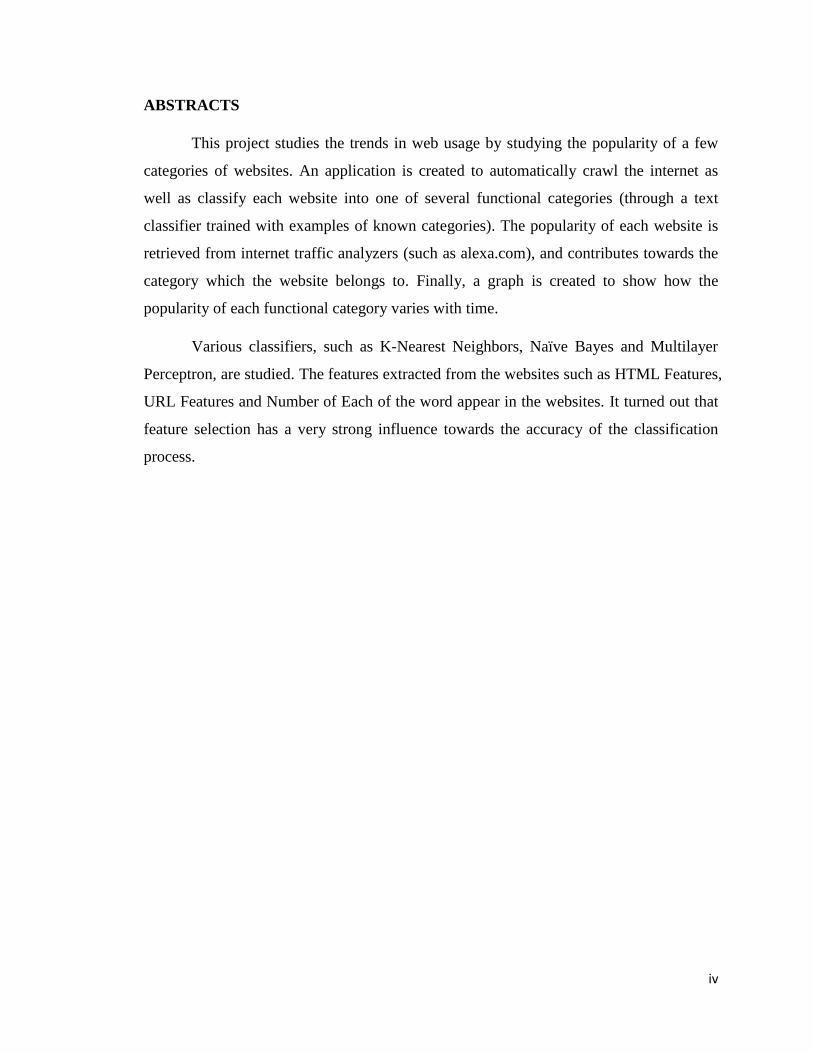
ABSTRACTS
This project studies the trends in web usage by studying the popularity of a few
categories of websites. An application is created to automatically crawl the internet as
well as classify each website into one of several functional categories (through a text
classifier trained with examples of known categories). The popularity of each website is
retrieved from internet traffic analyzers (such as alexa.com), and contributes towards the
category which the website belongs to. Finally, a graph is created to show how the
popularity of each functional category varies with time.
Various classifiers, such as K-Nearest Neighbors, Naïve Bayes and Multilayer
Perceptron, are studied. The features extracted from the websites such as HTML Features,
URL Features and Number of Each of the word appear in the websites. It turned out that
feature selection has a very strong influence towards the accuracy of the classification
process.
v
TABLE OF CONTENTS
List of Tables .................................................................................................................... vii
Chapter 1: Introduction ..................................................................................................... 1
1.1 Motivation and Problem Statement ................................................................. 1
1.2 Project Scope ........................................................................................................... 1
1.2.1 Crawl the world wide web ............................................................................... 1
1.2.2 Feature Extractor ............................................................................................. 1
1.2.3 Classifier ............................................................................................................ 2
1.2.4 Traffic or Hit Rate Retrieve ............................................................................ 2
1.2.5 Calculate Traffic ............................................................................................... 2
1.2.6 VISUALIZATION ............................................................................................ 2
1.3 Project Objectives ................................................................................................... 3
1.4 Impact, Significance and Contribution ................................................................. 4
1.5 Background Information ........................................................................................ 4
Chapter 2: Literature Review ............................................................................................ 6
2.1 Literature Review .................................................................................................... 6
2.1.1 Website Directories with Functional Classified Website .............................. 6
2.1.1.1 DMOZ ......................................................................................................... 6
2.1.1.2 OpenDNS .................................................................................................... 7
2.1.2 Features Extracted From Website .................................................................. 8
2.1.2.1 HTML Features ......................................................................................... 8
2.1.2.2 URL Features ............................................................................................. 9
2.1.2.3 FEATURES FROM word OCCURRENCES ....................................... 10
2.1.3 Classifier .......................................................................................................... 13
2.1.3.1 KNN (K-Nearest Neighbor) Text Categorization ................................. 13
2.1.3.2 Naïve Bayes ............................................................................................... 15
2.1.3.3 Multilayer Perceptron ............................................................................. 17
Chapter 3: Proposed Method or Approach ..................................................................... 19
vi
3.1 Design Specifications ............................................................................................. 19
3.1.1 Methodology .................................................................................................... 19
3.1.2 Tools ................................................................................................................. 21
3.1.2.3 R ................................................................................................................. 21
3.2.1 The Homepage .................................................................................................... 23
3.2.1 The TRAFFIC page ........................................................................................... 25
3.2.1 The MANAGE page ........................................................................................... 25
3.3 Implementation Issues and Challenges ............................................................... 29
3.4 Method to setup the project and run ................................................................... 32
3.5 Timeline .................................................................................................................. 35
CHAPTER 4: EXPERIMENTAL RESULTS ................................................................. 36
4.1 Data Collection ...................................................................................................... 36
4.2 Website Classes ...................................................................................................... 36
4.3 Features Extraction ............................................................................................... 37
4.4 Testing Result ........................................................................................................ 38
Chapter 5: Conclusion ..................................................................................................... 40

vii
LIST OF TABLES
Table 1 Number of word in a particular website .............................................................. 10
viii
List of Figures
Figure 1: Total Number of Website World Wide ............................................................... 4
Figure 2 DMOZ Website Information ................................................................................ 6
Figure 3 OpenDNS Website Information ........................................................................... 7
Figure 4 Waterfall by applying application process ......................................................... 19
Figure 5 System Flow Chart of the Application Program ................................................ 23
Figure 6 Flow of category retrieving ................................................................................ 24
Figure 7 Flow of getting traffic data from database ........................................................ 24
Figure 8 traffic page graphical user interface ................................................................... 25
Figure 9 Flow of Scrape Website from Alexa .................................................................. 26
Figure 10 Flow of Retrain the Machine Learning ............................................................ 26
Figure 11 Entity relation diagram ..................................................................................... 28
Figure 12 Time taken to check an URL category ............................................................. 29
Figure 13 list of classifier saved files and database backup files ..................................... 30
Figure 14 7 millions of urls ............................................................................................... 31
Figure 15 paging files size in my local computer ............................................................. 31
Figure 16 access the web through the link ........................................................................ 34
Figure 17 Gantt chart Part I .............................................................................................. 35
Figure 18 Gantt chart Part II ............................................................................................. 35
Figure 19 Graph of Testing result ..................................................................................... 38

BIS (Hons) Information System Engineering Faculty of Information and Communication Technology (Perak Campus), UTAR
1
CHAPTER 1: INTRODUCTION
1.1 Motivation and Problem Statement
Many business decisions depend on trends in web usage. For instance, if users are
not ready to perform a specific task on their browser, it would not be advisable to
introduce a website that requires such a task. Advertisers would benefit from knowledge
of such trends as well, as this would allow them to position their advertisements to better
capture the attention of web users.
Website traffic analyzers such as Alexa, Google Analytics, etc., allow us to
analyze the popularity of specific websites. However, it is difficult to determine if the
popularity of a specific website can be interpreted as a general trend in web usage. The
aim of this project is an application that automatically classifies internet websites into one
of several categories, and shows how the popularity of each category changes with time.
It is hoped that the application will allow better understanding of trends in web usage.
1.2 PROJECT SCOPE
The deliverables of this project is an application which crawls the world wide web
and automatically classifies each of website according to its functionality. The
application obtains the traffic or hit rate for each of the website, and total up the
popularity of the websites of each functional category – thus allowing us to analyze the
popularity of each functional category.
The application consists of the following parts.
1.2.1 CRAWL THE WORLD WIDE WEB
This part of the application crawls the world wide web.
1.2.2 FEATURE EXTRACTOR
This part of the application extracts features from each website for classification
purpose. Besides text, these features also include elements such as tag, Meta tag, and
information images will be extracted.
BIS (Hons) Information System Engineering Faculty of Information and Communication Technology (Perak Campus), UTAR
2
1.2.3 CLASSIFIER
This part of the application classifies each website based on their features into one
of several functional categories. This classifier is trained using a portion of the websites
obtained by the crawler; the categories of these training example websites are determined
by consulting a database website.
1.2.4 TRAFFIC OR HIT RATE RETRIEVE
This part of the application obtains the traffic or hit rate information of each
website, at different times in the past, from a web traffic analyzer such as Alexa.
1.2.5 CALCULATE TRAFFIC
This part of the application calculates the total traffic of each category through
aggregating the popularity of each of the websites which belong to the category.
1.2.6 VISUALIZATION
This part of the application generates a chart which plots the popularity of a
category across time.
BIS (Hons) Information System Engineering Faculty of Information and Communication Technology (Perak Campus), UTAR
3
1.3 PROJECT OBJECTIVES
There are a few important requirements for the application program. First, the
application should be able to classify most of the websites on the internet into their
functional categories. Next, the application should be able to get the latest hit rate or
traffic in certain period and total up every single website from the particular category.
Finally, the application should be able to rank those categories and generate a graph that
will show the popularity of each of the website within a given period.
To fulfill the first requirement, a classifier is used. The second requirement is
partially fulfilled by consulting a web traffic analyzer with a complete database that
includes every single website‟s hit rate or traffic, e.g. Google and Alexa. The third
requirement needs us to calculate the total traffic of a category from its constituent
websites.
BIS (Hons) Information System Engineering Faculty of Information and Communication Technology (Perak Campus), UTAR
4
1.4 IMPACT, SIGNIFICANCE AND CONTRIBUTION
As mentioned, many business decisions depend on an analysis of web usage
trends. Companies which deal a lot with the World Wide Web such as Google, Alexa are
particularly familiar with the benefits which they can reap from such analysis. For
example, a Google search may benefit from an understanding of current trends, which
can allow the search to return results that are more likely to be relevant to what the user is
searching for. Knowing past trends also allows us to predict upcoming trends, and allows
businesses to make decisions based on these predictions. For example, website
developers may use this to predict the reception of certain features of their websites.
1.5 BACKGROUND INFORMATION
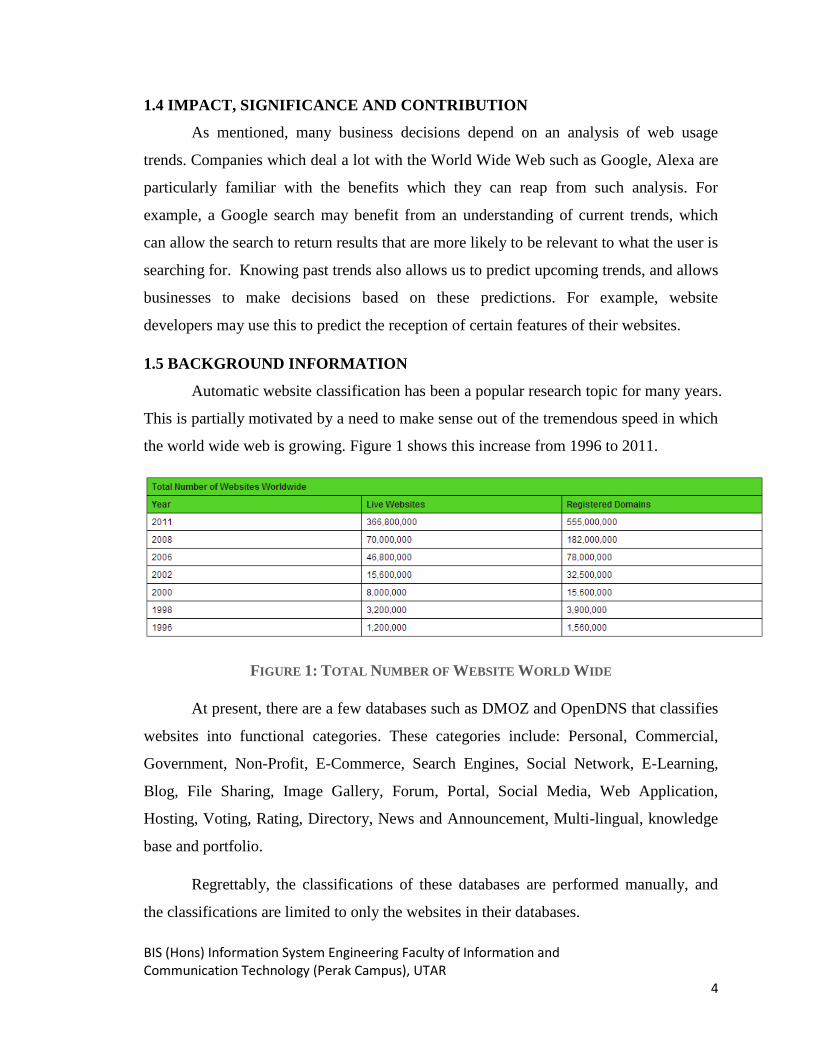
Automatic website classification has been a popular research topic for many years.
This is partially motivated by a need to make sense out of the tremendous speed in which
the world wide web is growing. Figure 1 shows this increase from 1996 to 2011.
FIGURE 1: TOTAL NUMBER OF WEBSITE WORLD WIDE
At present, there are a few databases such as DMOZ and OpenDNS that classifies
websites into functional categories. These categories include: Personal, Commercial,
Government, Non-Profit, E-Commerce, Search Engines, Social Network, E-Learning,
Blog, File Sharing, Image Gallery, Forum, Portal, Social Media, Web Application,
Hosting, Voting, Rating, Directory, News and Announcement, Multi-lingual, knowledge
base and portfolio.
Regrettably, the classifications of these databases are performed manually, and
the classifications are limited to only the websites in their databases.

BIS (Hons) Information System Engineering Faculty of Information and Communication Technology (Perak Campus), UTAR
5
In order to be able to automatically classify all the websites in the internet, the use
of machine learning techniques was being considered. As training examples the websites
that are readily classified by DMOZ or OpenDNS can be used. Hence, the only
conceivable difficulty left is in identifying suitable features from the websites for the
classifier.

BIS (Hons) Information System Engineering Faculty of Information and Communication Technology (Perak Campus), UTAR
6
CHAPTER 2: LITERATURE REVIEW
2.1 LITERATURE REVIEW
2.1.1 WEBSITE DIRECTORIES WITH FUNCTIONAL CLASSIFIED WEBSITE
As mentioned, there are several databases which classify websites into several
functional categories.
2.1.1.1 DMOZ
FIGURE 2 DMOZ WEBSITE INFORMATION
DMOZ is an open directory which classifies websites. The classifications are
performed manually by editors. As shown in figure 2, by the end of April, 2014, the open
directory DMOZ consists of 5 million plus websites, around hundred thousands of editors,
and about a million categories.
DMOZ classification is fairly reliable since they are performed by human.
However, there are two drawbacks which make the use of DMOZ unsuitable for the
current project:
1. The DMOZ database is constructed manually and hence may not contain the
entire world wide web.
2. The present study is concerned only with functional categories. However, DMOZ
categories are much more fine-grained, consisting of about a million categories.
Consequentially, a search for the category of a website also takes significantly
more time with DMOZ‟s database.

BIS (Hons) Information System Engineering Faculty of Information and Communication Technology (Perak Campus), UTAR
7
2.1.1.2 OPENDNS
FIGURE 3 OPENDNS WEBSITE INFORMATION
OpenDNS is a World‟s Largest Internet Security Network which has a
community allows users to submit domains according to the category. Based on Figure 3,
by July 2014, over 8 million domains have been submitted to OpenDNS, classifying
nearly 2 million domains.
OpenDNS provides a functionality that is more readily applicable than DMOZ for
the Classifier component of the project, since its search function allows users to search a
website based on its domain. Users can reach the website category immediately as long
as the domain is correctly input.
However, the domains in OpenDNS were submitted and voted by users, which
may not be experts in the field, and may have different opinions regarding specific
websites. Furthermore, each domain is given one category, which may not describe it in
full.
Finally, OpenDNS is also a paid-for service. It only shows the undecided website
to us; decided websites were hidden and requires payment to view. This makes it
impractical for this project.
Since both DMOZ and OpenDNS are not suitable for use in this project, a
machine learner classifier will be constructed, which, when given the content of a website,
returns the category which the website belongs to. The first step to the construction of
such a classifier is feature extraction.
BIS (Hons) Information System Engineering Faculty of Information and Communication Technology (Perak Campus), UTAR
8
2.1.2 FEATURES EXTRACTED FROM WEBSITE
Feature selection and feature extraction play important roles in data mining. This
is because a good feature extracted from the samples can improve the classification
effectiveness as well as computational efficiency. Good features can be defined as feature
that shows the uniqueness of each of the samples.
2.1.2.1 HTML FEATURES
There are a lot of ways to extract information from HTML. The title of
each of the webpages can be extracted. This is because the title of the website can
often give user clues on what the webpage is about. The title of the webpages will
be stored in their title tag.
<title>Title of the webpage</title>
Next, the information from the Meta description and keyword tag can be
extracted as well. Meta tag are routinely used in Search Engine Optimization. All
the item type in Meta will show in the Search Engine when your website is listed.
Meta description and keywords are like,
<meta name=”description” content=”your content here”/>
<meta name=”keywords” content=”your keywords here”/>
In HTML Features, the features from tags such as Headings also can be
extracted. This is because Headings tag allows user to know the main title for
each part of the webpages. This allows user to know the website in more detail.
Normally the Headings tag will store in this form.
<h1>Your Headings Here</h1>
<h2>Your Headings Here</h2>

BIS (Hons) Information System Engineering Faculty of Information and Communication Technology (Perak Campus), UTAR
9
2.1.2.2 URL FEATURES
Next, the information from URL features can be extracted as well.
Example
www.utar.edu.my
Splitting the URL through the dot „.‟ will return 4 substrings, namely,
www, utar, edu, and my. From the word edu, one can deduce that this is an
education page.
The substrings between slashes can give valuable information as well, for
example,
www.utar.edu.my/FICT
This will return 2 results which are www.utar.edu.my and FICT. The word
FICT allows user to know that this webpage is likely concerned with FICT.
Some developers use variable names with underscores like
THIS_IS_JUST_AN_EXAMPLE_OF_VARIABLE_NAME. So, there is a very
high chance that the developer will use variable name like this for their webpage.
www.utar.edu.my/BUSINESS_DOCUMENT
Therefore, the substrings between underscores and the substring between
slashes can be extracted as features as well. This will give us a result of
www.utar.edu.my, BUSINESS and DOCUMENT. This allows us to know that
the page will be likely discussing businesses, and is likely to be in the form of a
document.
BIS (Hons) Information System Engineering Faculty of Information and Communication Technology (Perak Campus), UTAR
10
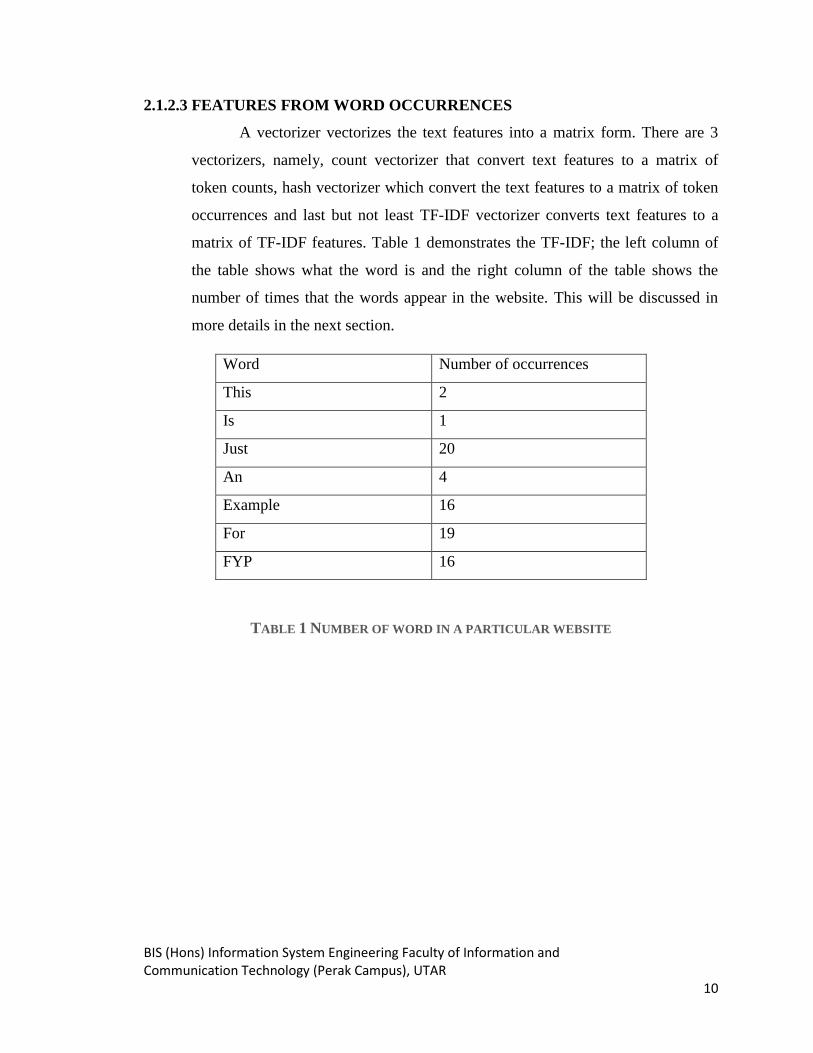
2.1.2.3 FEATURES FROM WORD OCCURRENCES
A vectorizer vectorizes the text features into a matrix form. There are 3
vectorizers, namely, count vectorizer that convert text features to a matrix of
token counts, hash vectorizer which convert the text features to a matrix of token
occurrences and last but not least TF-IDF vectorizer converts text features to a
matrix of TF-IDF features. Table 1 demonstrates the TF-IDF; the left column of
the table shows what the word is and the right column of the table shows the
number of times that the words appear in the website. This will be discussed in
more details in the next section.
Word Number of occurrences
This 2
Is 1
Just 20
An 4
Example 16
For 19
FYP 16
TABLE 1 NUMBER OF WORD IN A PARTICULAR WEBSITE
BIS (Hons) Information System Engineering Faculty of Information and Communication Technology (Perak Campus), UTAR
11
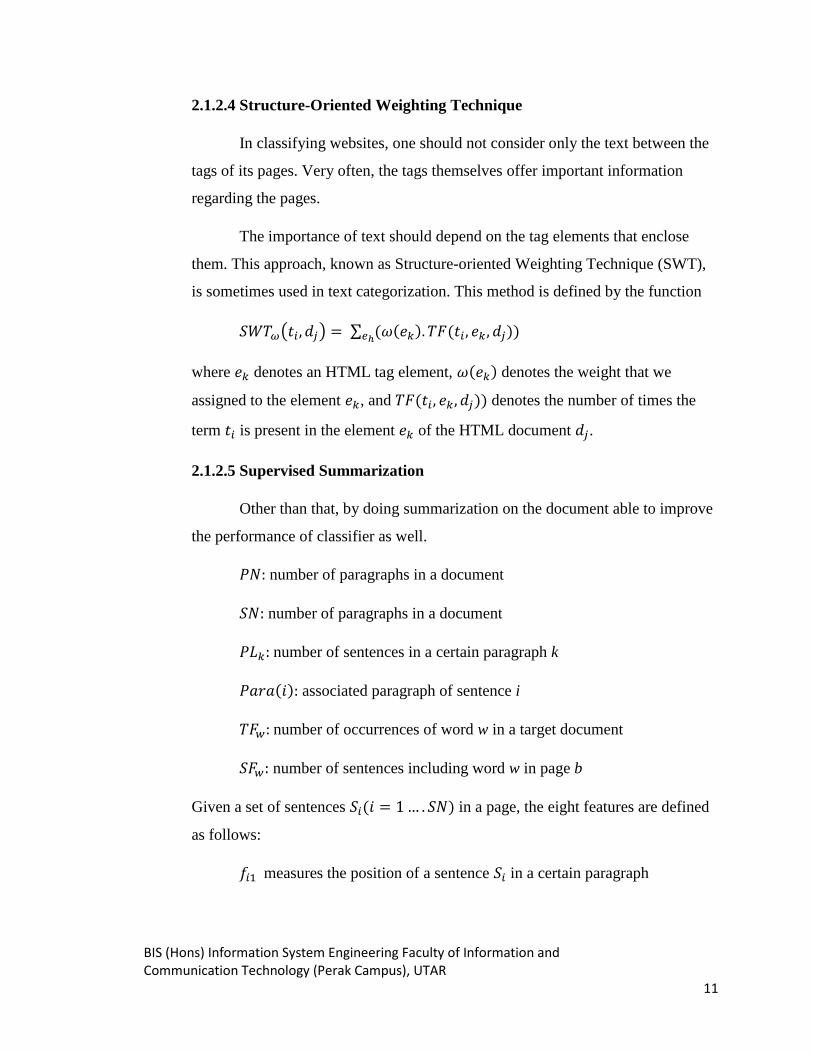
2.1.2.4 Structure-Oriented Weighting Technique
In classifying websites, one should not consider only the text between the
tags of its pages. Very often, the tags themselves offer important information
regarding the pages.
The importance of text should depend on the tag elements that enclose
them. This approach, known as Structure-oriented Weighting Technique (SWT),
is sometimes used in text categorization. This method is defined by the function
( ) ∑ ) ))
where denotes an HTML tag element, ) denotes the weight that we
assigned to the element , and )) denotes the number of times the
term is present in the element of the HTML document .
2.1.2.5 Supervised Summarization
Other than that, by doing summarization on the document able to improve
the performance of classifier as well.
number of paragraphs in a document
number of paragraphs in a document
number of sentences in a certain paragraph k
) associated paragraph of sentence i
number of occurrences of word w in a target document
number of sentences including word w in page b
Given a set of sentences ) in a page, the eight features are defined
as follows:
measures the position of a sentence in a certain paragraph
BIS (Hons) Information System Engineering Faculty of Information and Communication Technology (Perak Campus), UTAR
12
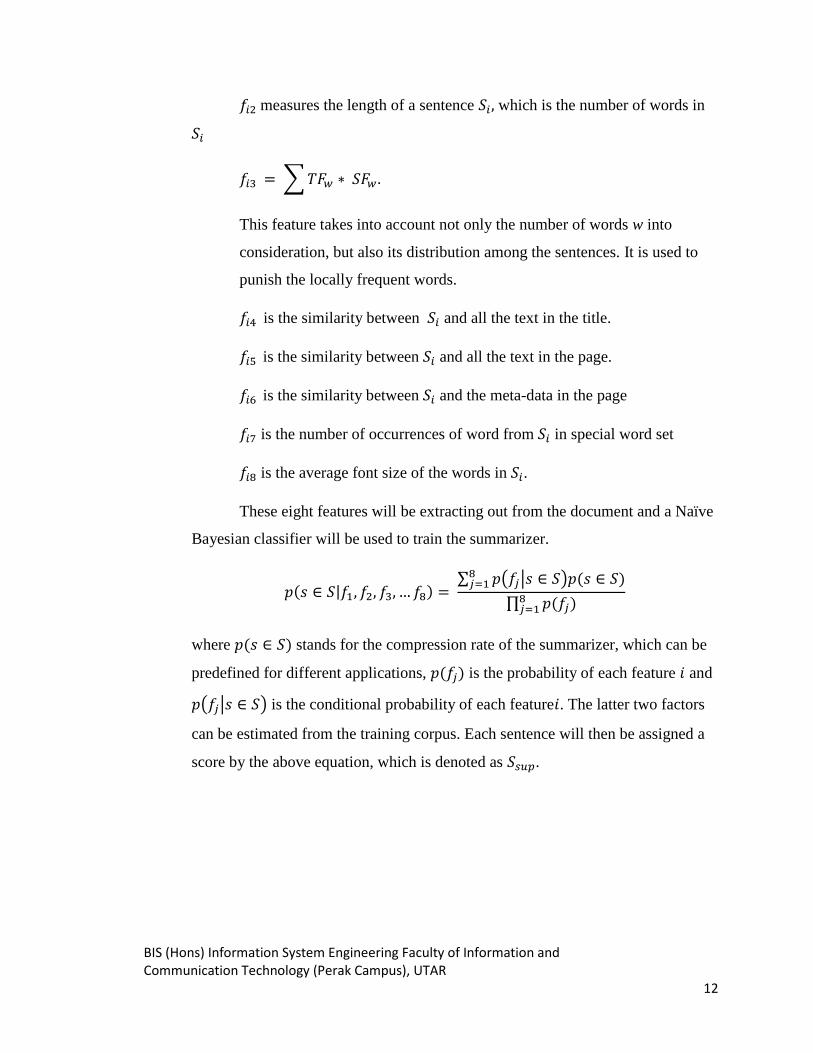
measures the length of a sentence which is the number of words in
∑
This feature takes into account not only the number of words w into
consideration, but also its distribution among the sentences. It is used to
punish the locally frequent words.
is the similarity between and all the text in the title.
is the similarity between and all the text in the page.
is the similarity between and the meta-data in the page
is the number of occurrences of word from in special word set
is the average font size of the words in .
These eight features will be extracting out from the document and a Naïve
Bayesian classifier will be used to train the summarizer.
| ) ∑ ( | ) )
∏ )
where ) stands for the compression rate of the summarizer, which can be
predefined for different applications, ) is the probability of each feature and
( | ) is the conditional probability of each feature . The latter two factors
can be estimated from the training corpus. Each sentence will then be assigned a
score by the above equation, which is denoted as .
BIS (Hons) Information System Engineering Faculty of Information and Communication Technology (Perak Campus), UTAR
13
2.1.3 CLASSIFIER
2.1.3.1 KNN (K-NEAREST NEIGHBOR) TEXT CATEGORIZATION
In pattern recognition, k-nearest neighbors (KNN) was considered as a non-
parametric method for regression and classification. KNN is a type of learning where the
function is only approximated locally and all the computation is deferred until
classification. This type of learning is called instance-based learning or lazy learning. The
model of the KNN is Vector Space Model. This method has been used by, for example,
Kwon & Lee (2000), Calado et al. (2003), and Qi & Davison (2007).
In order to use KNN for categorizing, the distinct words in collection must be
extracted out at first. By getting distinct words in collection, KNN would not compare the
similar words again and again. Next, the weight of the ith
words in each of the jth
document will be calculated. There are a few ways that are used by some researchers to
determine the weight. The first way to weight the document is by using Boolean
Weighting. The concept of Boolean Weighting is whenever the text was occurring, aij
will be 1 else aij will be 0. Besides, the frequency of the word was being used to weight
the document. Therefore the frequency of the ith
word in the jth
document will be the
weight.
There is another way to weight the document. In order to get the weight from this
method, the inverse document frequency was being minus by term frequency which is
TF-IDF (Term Frequency-Inverse Document Frequency)
BIS (Hons) Information System Engineering Faculty of Information and Communication Technology (Perak Campus), UTAR
14
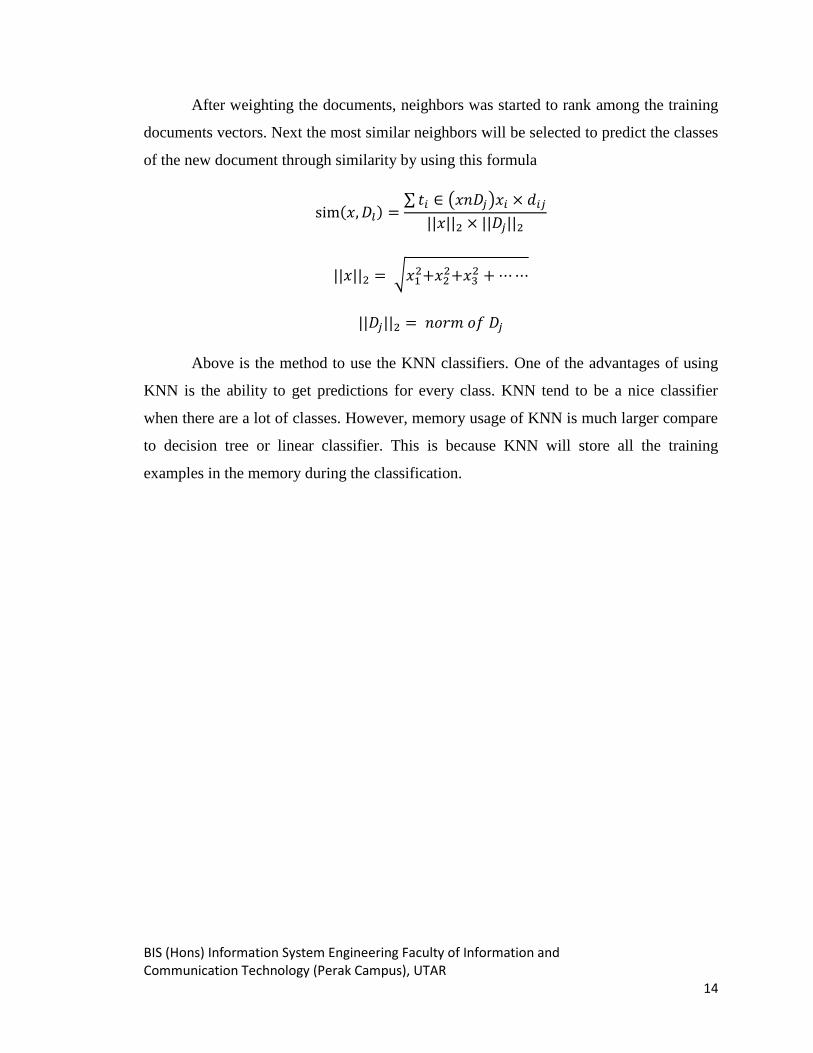
After weighting the documents, neighbors was started to rank among the training
documents vectors. Next the most similar neighbors will be selected to predict the classes
of the new document through similarity by using this formula
) ∑ ( )
|| || || ||
|| || √
|| ||
Above is the method to use the KNN classifiers. One of the advantages of using
KNN is the ability to get predictions for every class. KNN tend to be a nice classifier
when there are a lot of classes. However, memory usage of KNN is much larger compare
to decision tree or linear classifier. This is because KNN will store all the training
examples in the memory during the classification.
BIS (Hons) Information System Engineering Faculty of Information and Communication Technology (Perak Campus), UTAR
15
2.1.3.2 NAÏVE BAYES
Naïve Bayes is a simple probabilistic classifier. Naïve Bayes was implemented
based on the Bayes‟ theorem with strong independence assumptions. Therefore, the
model of Naïve Bayes is Independent Feature Model. Naïve Bayes was used by Mihalcea
and Liu on 2006 to classify the blog, a trained Naïve Bayes on unigram features able to
achieved 79% accuracy over 10 thousands mood-annotated blog posts. Besides, Qu et al
also proposed an approach that will classify the blogs into four genres automatically by
using Naïve Bayes. This approach achieved 84% of accuracy (Qi & Davison, 2007).
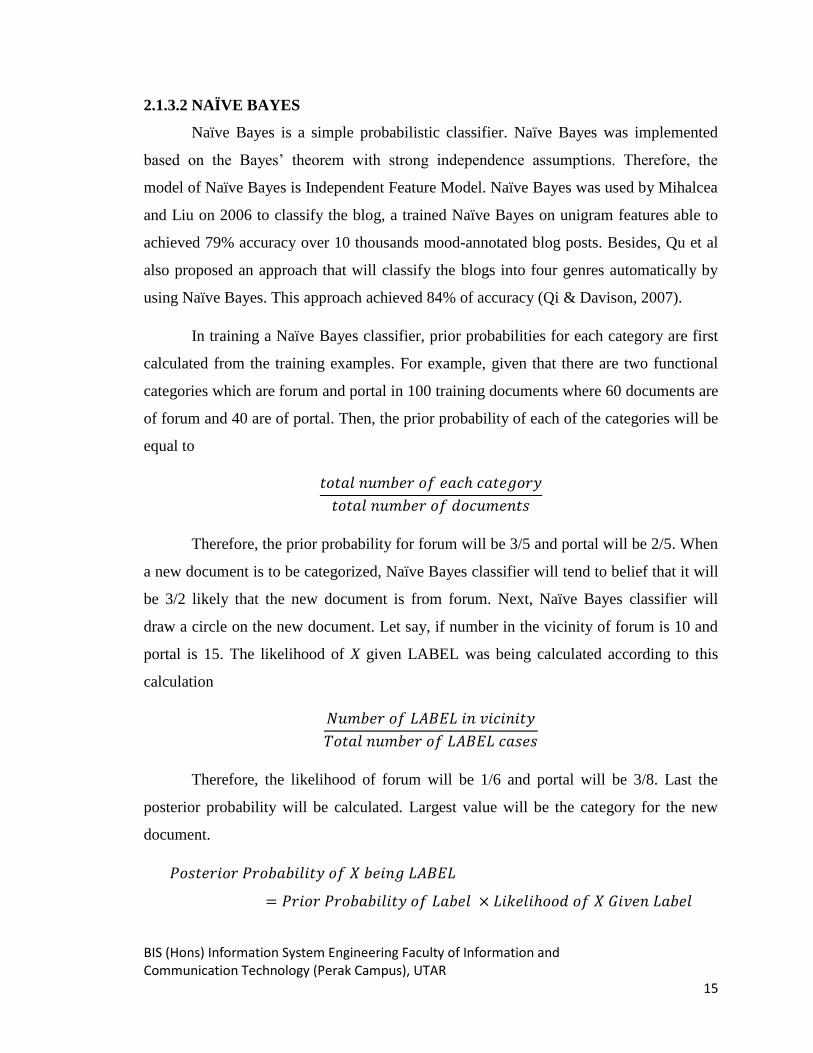
In training a Naïve Bayes classifier, prior probabilities for each category are first
calculated from the training examples. For example, given that there are two functional
categories which are forum and portal in 100 training documents where 60 documents are
of forum and 40 are of portal. Then, the prior probability of each of the categories will be
equal to
Therefore, the prior probability for forum will be 3/5 and portal will be 2/5. When
a new document is to be categorized, Naïve Bayes classifier will tend to belief that it will
be 3/2 likely that the new document is from forum. Next, Naïve Bayes classifier will
draw a circle on the new document. Let say, if number in the vicinity of forum is 10 and
portal is 15. The likelihood of X given LABEL was being calculated according to this
calculation
Therefore, the likelihood of forum will be 1/6 and portal will be 3/8. Last the
posterior probability will be calculated. Largest value will be the category for the new
document.
BIS (Hons) Information System Engineering Faculty of Information and Communication Technology (Perak Campus), UTAR
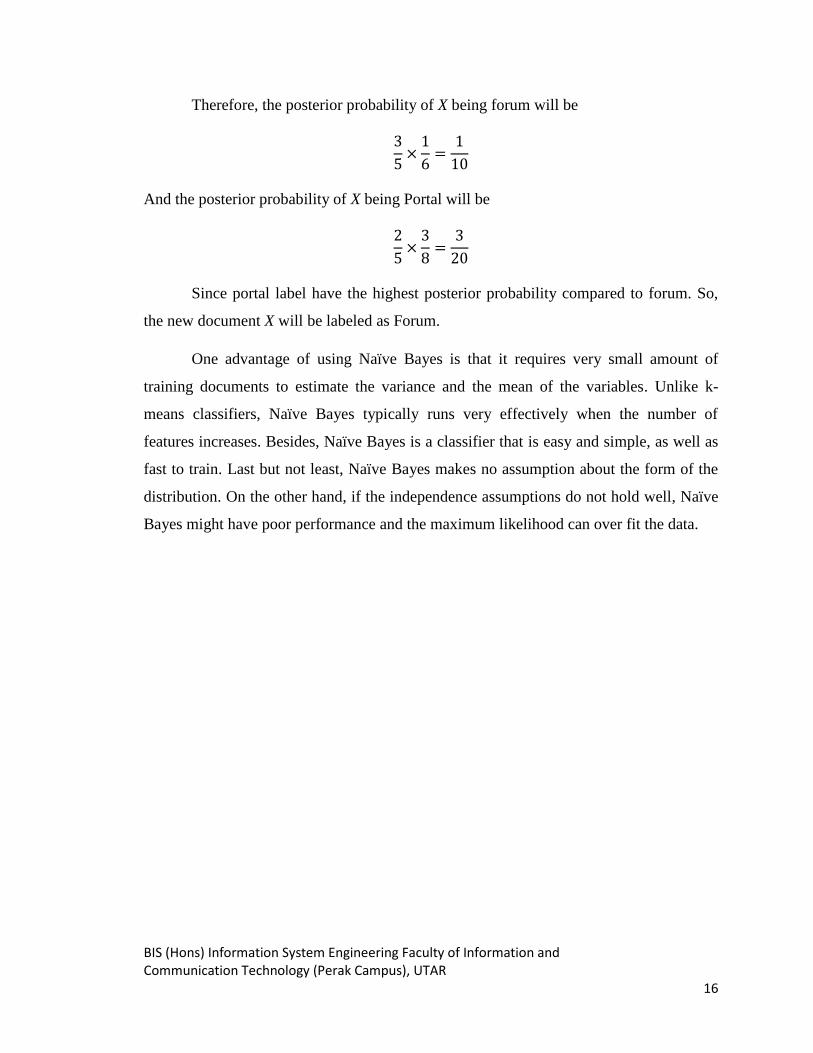
16
Therefore, the posterior probability of X being forum will be
And the posterior probability of X being Portal will be
Since portal label have the highest posterior probability compared to forum. So,
the new document X will be labeled as Forum.
One advantage of using Naïve Bayes is that it requires very small amount of
training documents to estimate the variance and the mean of the variables. Unlike k-
means classifiers, Naïve Bayes typically runs very effectively when the number of
features increases. Besides, Naïve Bayes is a classifier that is easy and simple, as well as
fast to train. Last but not least, Naïve Bayes makes no assumption about the form of the
distribution. On the other hand, if the independence assumptions do not hold well, Naïve
Bayes might have poor performance and the maximum likelihood can over fit the data.
BIS (Hons) Information System Engineering Faculty of Information and Communication Technology (Perak Campus), UTAR
17
2.1.3.3 MULTILAYER PERCEPTRON
A multilayer perceptron (MLP) is a feedback artificial neural model that tends to
map into a set an appropriate data from different sets of input data. This method was
studied by Kavitha & Vijaya (2013), where an accuracy of around 95% and 96% is
obtained.
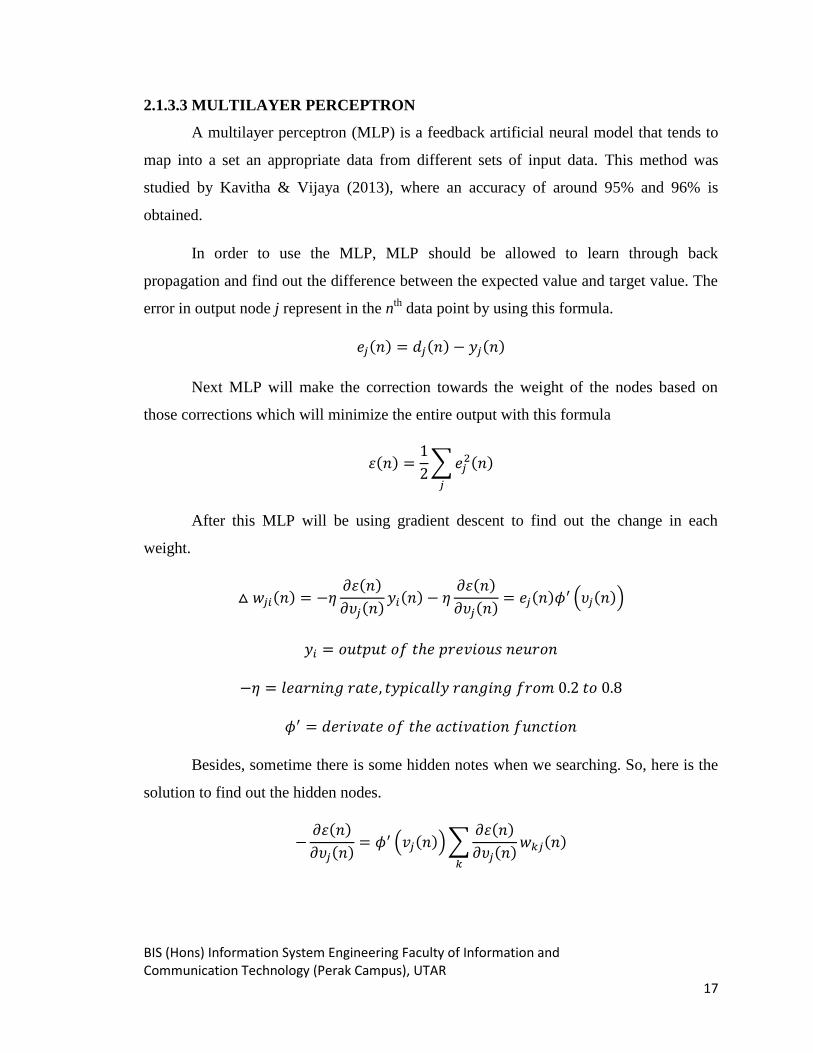
In order to use the MLP, MLP should be allowed to learn through back
propagation and find out the difference between the expected value and target value. The
error in output node j represent in the nth
data point by using this formula.
) ) )
Next MLP will make the correction towards the weight of the nodes based on
those corrections which will minimize the entire output with this formula
)
∑
)
After this MLP will be using gradient descent to find out the change in each
weight.
) )
) )
)
) )
( ))
Besides, sometime there is some hidden notes when we searching. So, here is the
solution to find out the hidden nodes.
)
) ( ))∑
)
) )
BIS (Hons) Information System Engineering Faculty of Information and Communication Technology (Perak Campus), UTAR
18
Before the hidden layer weights are changed, the output layer weights have to be
changed according to the derivative of the activation function.
There are good reasons to use MLP to classify websites. This is because an MLP
is able to approximate any function. It makes no assumption of the probabilistic
information about the pattern classes under consideration in comparison to other
probabilistic models.
However, MLP cannot be programmed to run specific tasks. If the training
examples are incorrect, the trained MLP will not function correctly.
BIS (Hons) Information System Engineering Faculty of Information and Communication Technology (Perak Campus), UTAR
19
CHAPTER 3: PROPOSED METHOD OR APPROACH
3.1 DESIGN SPECIFICATIONS
3.1.1 METHODOLOGY
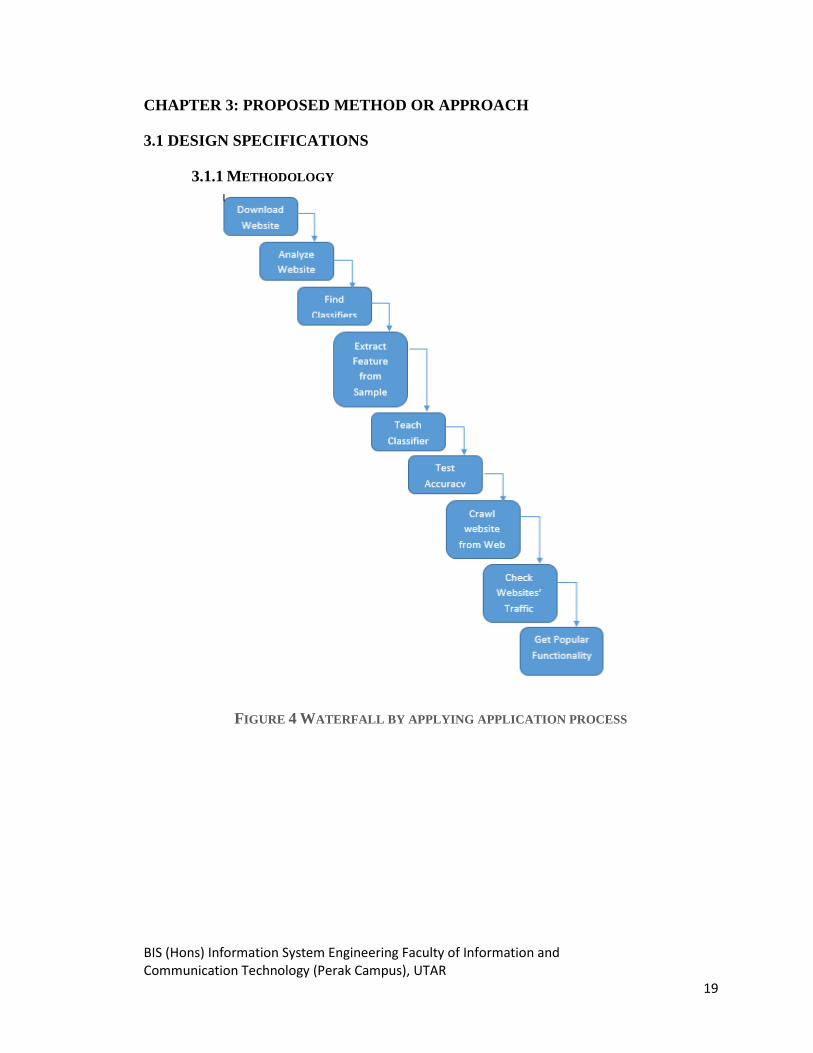
FIGURE 4 WATERFALL BY APPLYING APPLICATION PROCESS

BIS (Hons) Information System Engineering Faculty of Information and Communication Technology (Perak Campus), UTAR
20
In developing the application, the following steps are taken.
Step 1. Download website
In this step, website will be crawled from World Wide Web and be classified into
testing and training website. The training websites will be used to train the classifiers and
testing websites will be used to test the classifiers once the testing is done.
Step 2. Resolving the functionality of test/training websites
In order to train and test the classifier, the functionality of the input websites must be
known. This information is retrieve from the websites which I reviewed in part 2.1.1.
Step 3. Obtain classifiers
In this step, a library is identified for each of the classifiers reviewed in part 2.1.3.
Step 4. Extract the feature from the sample
In this step, each of the features that reviewed in part 2.1.2 is extracted.
Step 5. Train classifiers
In this step, the features from the training data are used to train each of the classifiers.
Step 6. Test classifier accuracy
In this step, the classifiers are evaluated according to their accuracies on the test
examples. The classifier with the best accuracy is selected for use in the system.
Step 7. Crawl website from World Wide Web
In this step, the system crawls the World Wide Web and classifying each website
using the selected classifier.
Step 8. Check traffic or Hit Rate of each website
In this step, the system obtains the traffic or hits, at different times, of each of the
websites crawled.
BIS (Hons) Information System Engineering Faculty of Information and Communication Technology (Perak Campus), UTAR
21
Step 9. Get Popular Functionality
In this step, the popularity of each category is determined and plotted against time.
3.1.2 TOOLS
3.1.2.1 Eclipse
Eclipse is an Integrated Development Environment developed for developers to
program most of the language as long as plugin for the specific language has been
installed. Eclipse is used for Java programming in this project. Java language is a
programming language. The reason Java being chosen is because that Java can run
independently in any platform.
3.1.2.2 Virtual private server (VPS), dedicated server, cloud computing
These cloud computing resources are used for web crawling, since a PC‟s
performance is much weaker compared to them. It also have better download and upload
speed compared to our personal computer.
3.1.2.3 R
The R Language is a programming language that is usually used to manipulate
data or for data mining. R provides a lot of built in library that can let us prototype part of
the system easily. A disadvantage, however, is that the R Language interface does not
utilize threading. So, when something that takes a lot of time being process within the
tool, the tool will be not responded for long time.
3.1.2.4 Python
Python is a programming language that is widely used. This is because python
comes with better control which makes programs easy to code, and the machine learning
support in python is strong compared to a lot of other programming languages. For
example, this project uses the scikit learn package in Python.
3.1.2.5 Django
Django is a website framework built on top of Python. The end product of this
project is implemented as a website by using Python through Django.
BIS (Hons) Information System Engineering Faculty of Information and Communication Technology (Perak Campus), UTAR
22
3.2 System Design or Overview
BIS (Hons) Information System Engineering Faculty of Information and Communication Technology (Perak Campus), UTAR
23
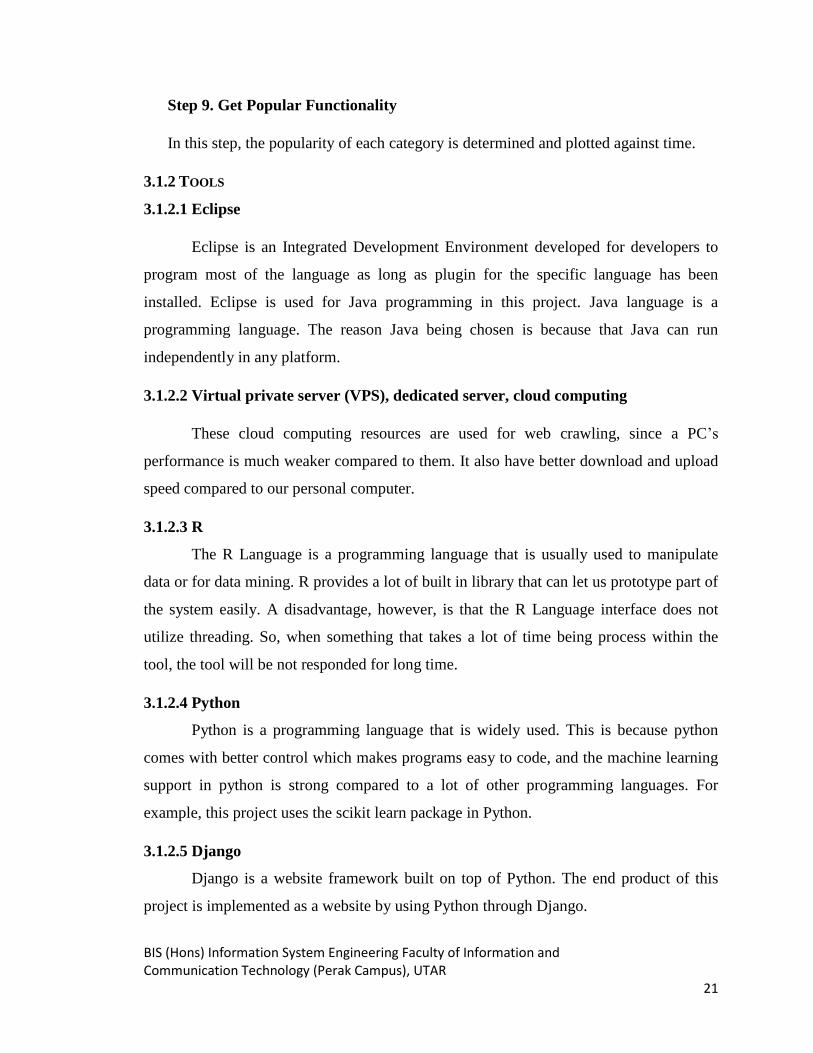
FIGURE 5 SYSTEM FLOW CHART OF THE APPLICATION PROGRAM
The system flow chart of this application is shown in Figure 5. It consists of 2
system flows. The left one will be scraping the samples for training the classifier. First,
the system will be making 8 samples out of the URLs that provided. Each of the samples
consists of hundred thousands of URLs. Next, the system will check the category for each
of the URLS in each of the samples. Finally, the classifiers are trained on these URLs.
The right one will classify the website automatically and get their popularity. First,
the system will crawl websites and check each of the websites‟ category and popularity.
This step will be repeated until we stop it or until the entire World Wide Web is crawled.
However, this might not happen. For sure we will run out of hard disk space before that
happens. After this is done, the system will calculate the total popularity for each of the
categories and draw a graph accordingly.
Finally, the system shows the result through a web application. This web
application consists of 3 pages which is home page, the traffic page, and the admin page.
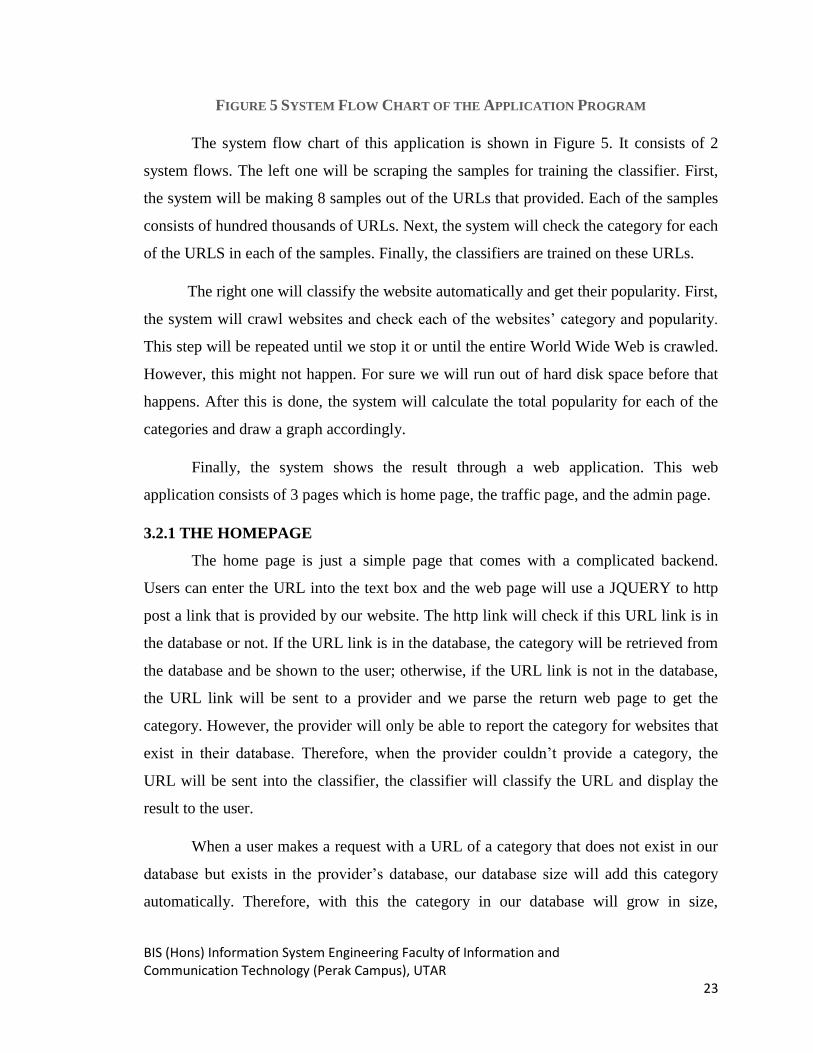
3.2.1 THE HOMEPAGE
The home page is just a simple page that comes with a complicated backend.
Users can enter the URL into the text box and the web page will use a JQUERY to http
post a link that is provided by our website. The http link will check if this URL link is in
the database or not. If the URL link is in the database, the category will be retrieved from
the database and be shown to the user; otherwise, if the URL link is not in the database,
the URL link will be sent to a provider and we parse the return web page to get the
category. However, the provider will only be able to report the category for websites that
exist in their database. Therefore, when the provider couldn‟t provide a category, the
URL will be sent into the classifier, the classifier will classify the URL and display the
result to the user.
When a user makes a request with a URL of a category that does not exist in our
database but exists in the provider‟s database, our database size will add this category
automatically. Therefore, with this the category in our database will grow in size,
BIS (Hons) Information System Engineering Faculty of Information and Communication Technology (Perak Campus), UTAR
24
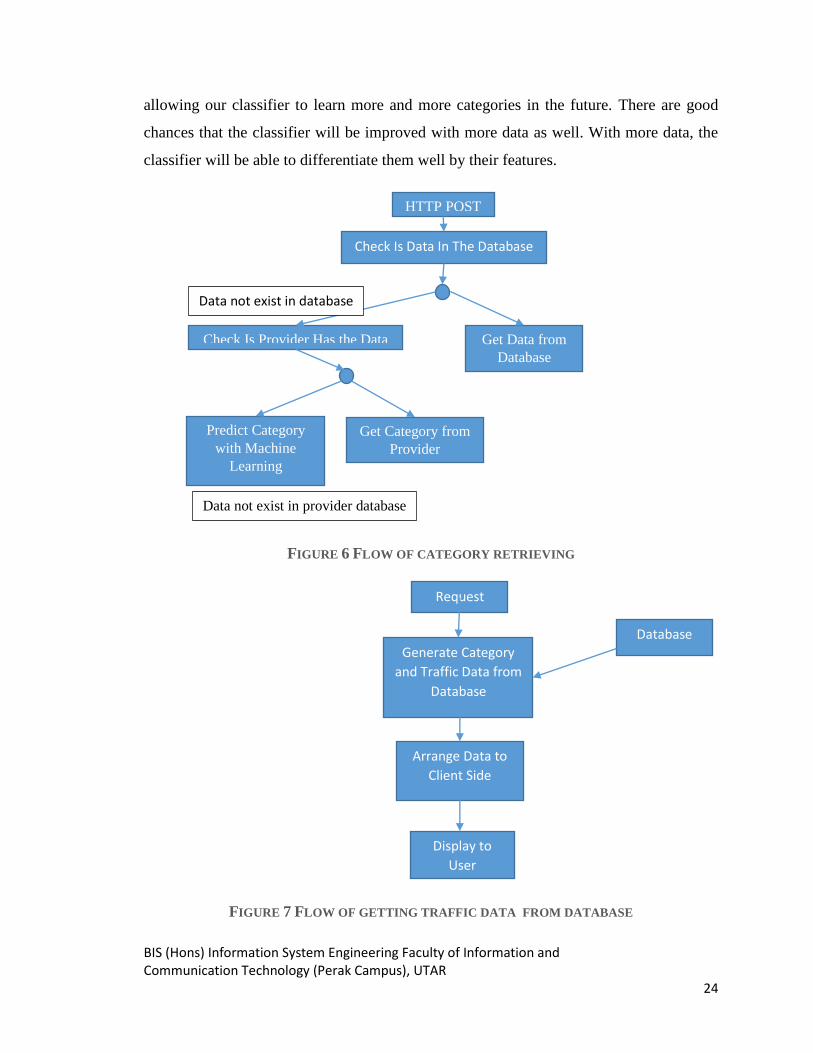
allowing our classifier to learn more and more categories in the future. There are good
chances that the classifier will be improved with more data as well. With more data, the
classifier will be able to differentiate them well by their features.
FIGURE 6 FLOW OF CATEGORY RETRIEVING
FIGURE 7 FLOW OF GETTING TRAFFIC DATA FROM DATABASE
Check Is Data In The Database
Check Is Provider Has the Data Get Data from
Database
Predict Category
with Machine
Learning
Get Category from
Provider
Data not exist in database
Data not exist in provider database
HTTP POST
Request
Database Generate Category
and Traffic Data from
Database
Arrange Data to
Client Side
Display to
User
BIS (Hons) Information System Engineering Faculty of Information and Communication Technology (Perak Campus), UTAR
25
3.2.1 THE TRAFFIC PAGE
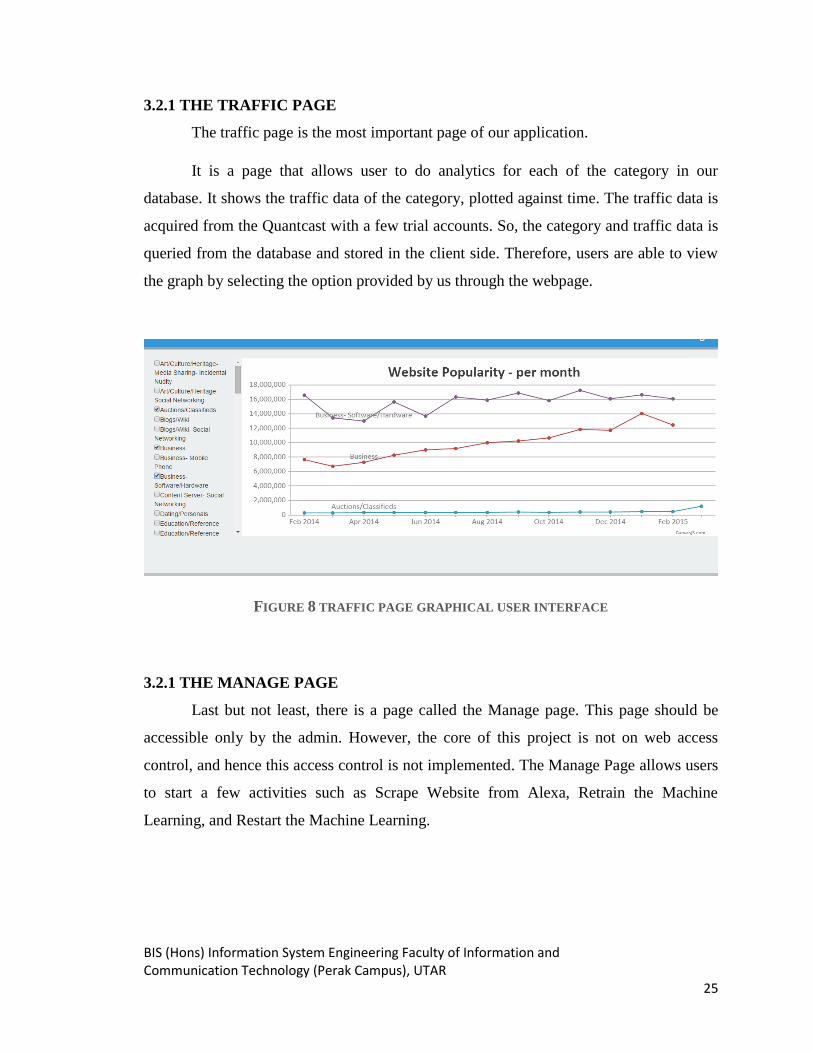
The traffic page is the most important page of our application.
It is a page that allows user to do analytics for each of the category in our
database. It shows the traffic data of the category, plotted against time. The traffic data is
acquired from the Quantcast with a few trial accounts. So, the category and traffic data is
queried from the database and stored in the client side. Therefore, users are able to view
the graph by selecting the option provided by us through the webpage.
FIGURE 8 TRAFFIC PAGE GRAPHICAL USER INTERFACE
3.2.1 THE MANAGE PAGE
Last but not least, there is a page called the Manage page. This page should be
accessible only by the admin. However, the core of this project is not on web access
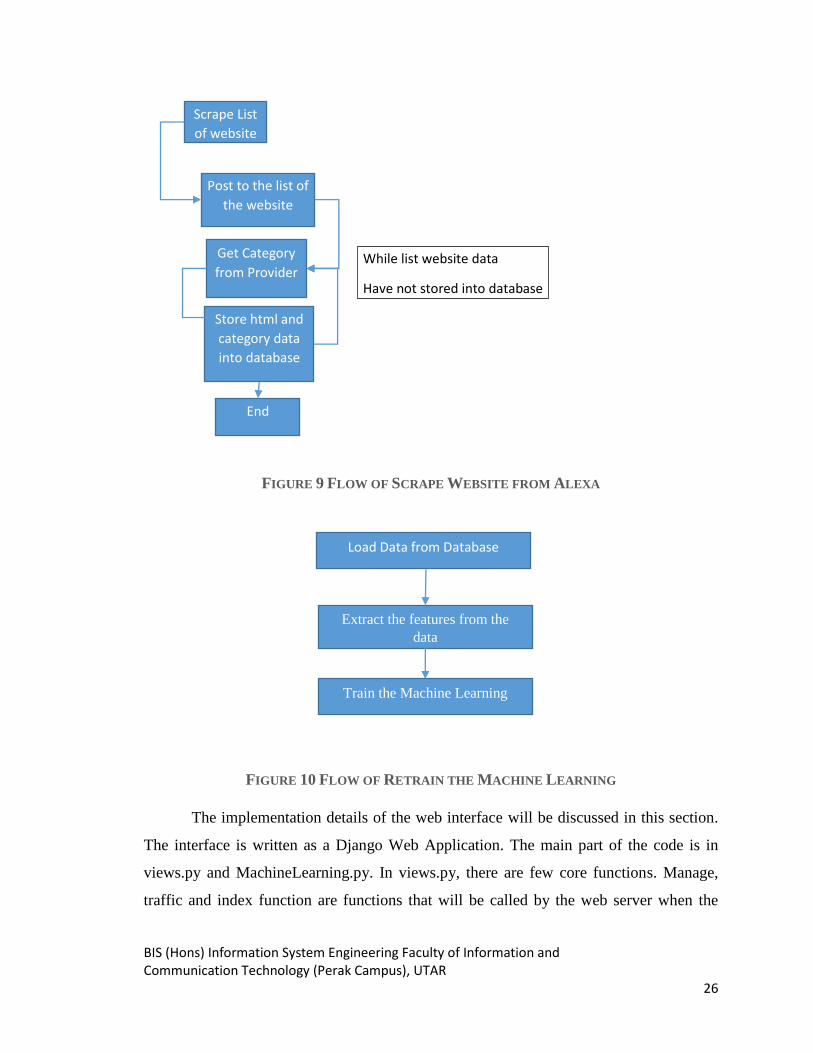
control, and hence this access control is not implemented. The Manage Page allows users
to start a few activities such as Scrape Website from Alexa, Retrain the Machine
Learning, and Restart the Machine Learning.
BIS (Hons) Information System Engineering Faculty of Information and Communication Technology (Perak Campus), UTAR
26
FIGURE 9 FLOW OF SCRAPE WEBSITE FROM ALEXA
FIGURE 10 FLOW OF RETRAIN THE MACHINE LEARNING
The implementation details of the web interface will be discussed in this section.
The interface is written as a Django Web Application. The main part of the code is in
views.py and MachineLearning.py. In views.py, there are few core functions. Manage,
traffic and index function are functions that will be called by the web server when the
Scrape List
of website
from Alexa
Post to the list of
the website
Store html and
category data
into database
Get Category
from Provider
End
While list website data
Have not stored into database
Load Data from Database
Extract the features from the
data
Train the Machine Learning
BIS (Hons) Information System Engineering Faculty of Information and Communication Technology (Perak Campus), UTAR
27
user browses the manage page, traffic page and the home page respectively. The
categorize function is the function that will be called by the home page through the
JQuery when a user requests the category of an URL. In manage page, there are few
functions that will be called by the page when users select certain actions such as
alexa_top_sites_extract, which is a function that is used to extract alexa top 500 sites. The
function will be called inside a thread which wouldn‟t affect the user experience.
Get_trusted_Source_category is a function that scrapes the category of a URL from the
provider. Insert_url_traffic is a function that get the popularity of the URL and store that
into the database. Insert_url_html is a function that gets the html markup of the page and
stores it into the database. Insert_url is a function that stores the URL into the database.
Get_category_avg_traffic is a function that gets the average of the traffic of each of the
category and passes the data to traffic page in order to show the graph.
Next will be MachineLearning class, this class is used to handle all the machine
learning steps. There is an initialize function, which is used to load the classifier,
vectorizer from the stored data. This function will be called when the application is
started. In the future, any function that is related to machine learning and needs to be
called when the application starts up can be included inside this function.
Next, classify is a function that allows users to pass in html markups; the function
will call html_feature_extract to extract the features from the html markup and vectorize
it with vectorizer, then scale the data to between 0 and 1000. Finally, the result is
returned as text. Last but not least, there is a training function. This is a function that uses
the confirmed and existing data in our database to do the training. So, first of all, features
of all the trained data will be extracted and vectorize them with vectorizer which will be
transform into binary form and non-negative value. Next tfidf transformer will transform
the data into form that can be read by the machine learning and last the data being scaled
to between 0 and 100 and pass into the classifier and let the classifier learn it. Last, the
classifier, vectorizer data will be save as a files which allow the system to load more
quickly in the future.
BIS (Hons) Information System Engineering Faculty of Information and Communication Technology (Perak Campus), UTAR
28
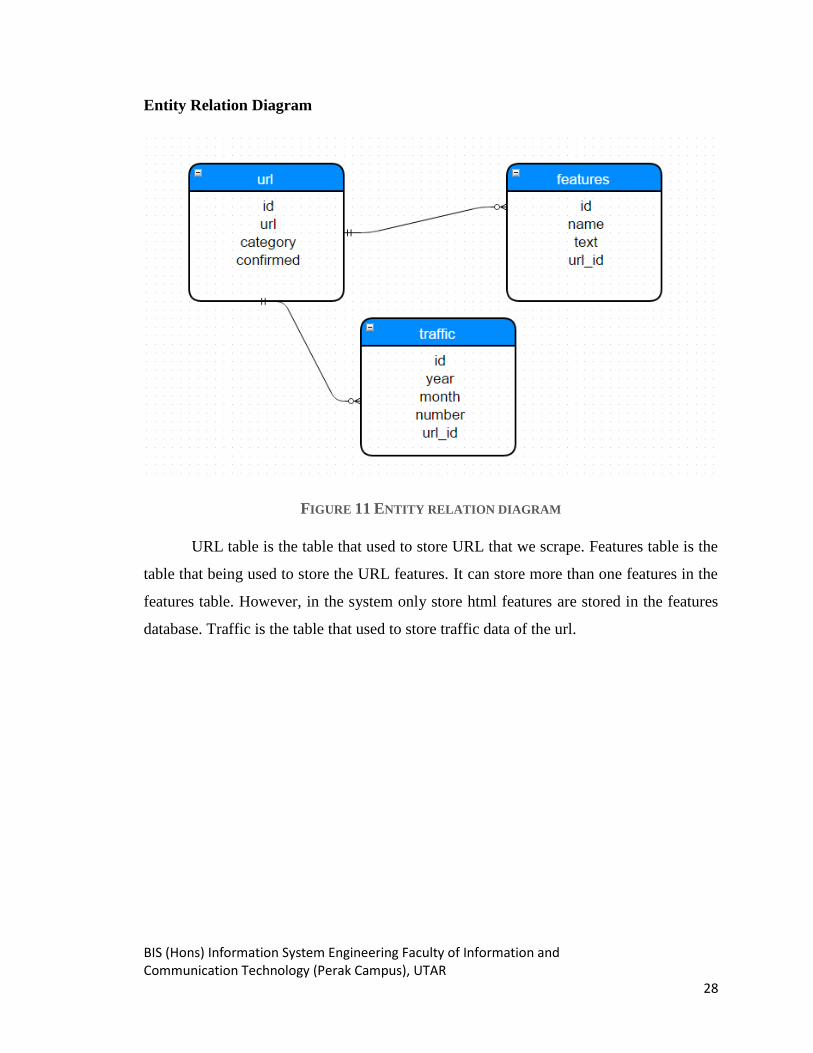
Entity Relation Diagram
FIGURE 11 ENTITY RELATION DIAGRAM
URL table is the table that used to store URL that we scrape. Features table is the
table that being used to store the URL features. It can store more than one features in the
features table. However, in the system only store html features are stored in the features
database. Traffic is the table that used to store traffic data of the url.
BIS (Hons) Information System Engineering Faculty of Information and Communication Technology (Perak Campus), UTAR
29
3.3 IMPLEMENTATION ISSUES AND CHALLENGES
The first challenge during the implementation is that it takes a long time to crawl
the websites in the World Wide Web. This is because there are a lot of websites on the
World Wide Web. This required high processing power and fast internet connection
speed to reduce the time taken.
Next, the challenge faced is that the question of whether a category that is
retrieved for a URL is correct or incorrect. A wrong category for a website might very
severely affect the result of the application. Besides that, the time taken to retrieve a
category for a website is approximately 3 seconds. 8 samples were being sampled out
from the 7 million URLs; each of the samples consists of hundred thousands of URLs. So,
each sample took approximately 4 days to complete.
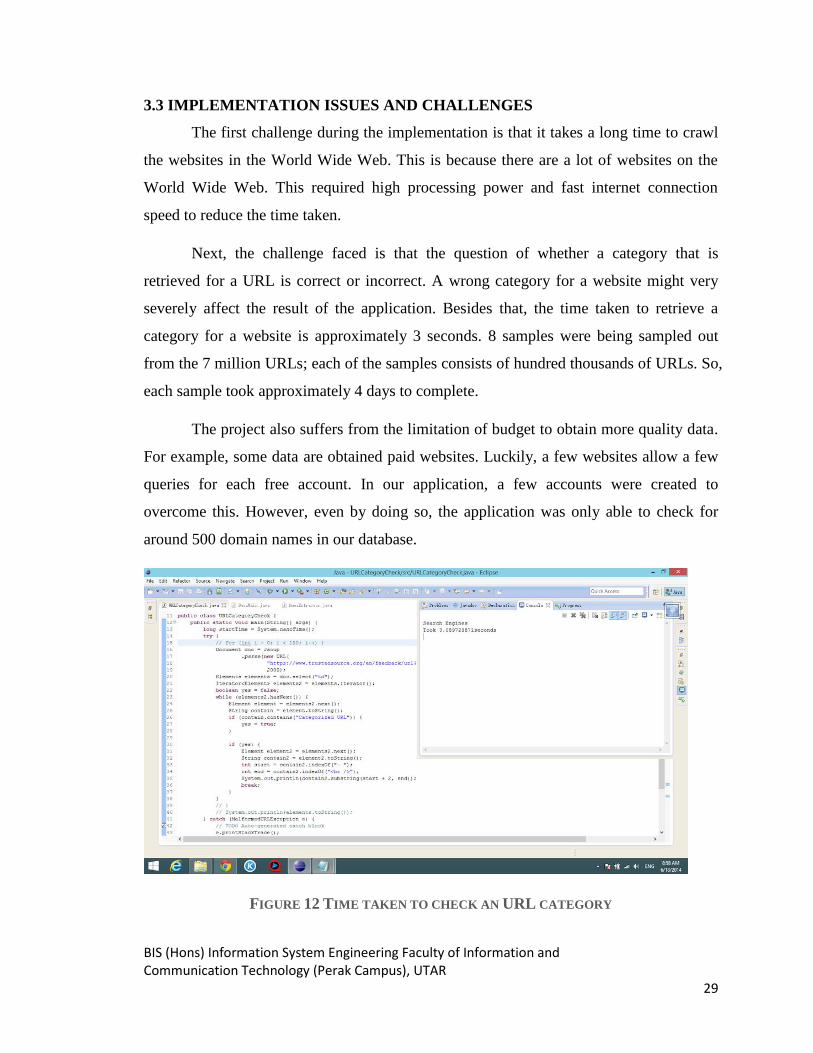
The project also suffers from the limitation of budget to obtain more quality data.
For example, some data are obtained paid websites. Luckily, a few websites allow a few
queries for each free account. In our application, a few accounts were created to
overcome this. However, even by doing so, the application was only able to check for
around 500 domain names in our database.
FIGURE 12 TIME TAKEN TO CHECK AN URL CATEGORY
BIS (Hons) Information System Engineering Faculty of Information and Communication Technology (Perak Campus), UTAR
30
Computing resources pose another challenge. To overcome this problem, cloud
services such AWS (Amazon Web Services) are used. However, such services typically
require payments; free accounts are available, but they provide only a few gigabytes of
memory space. When the application was run on these services, out of memory errors are
reported.
In the end, I was forced to run the system in a personal computer. However, with
so much data, websites, information in the World Wide Web, my PC kept running out of
memory.
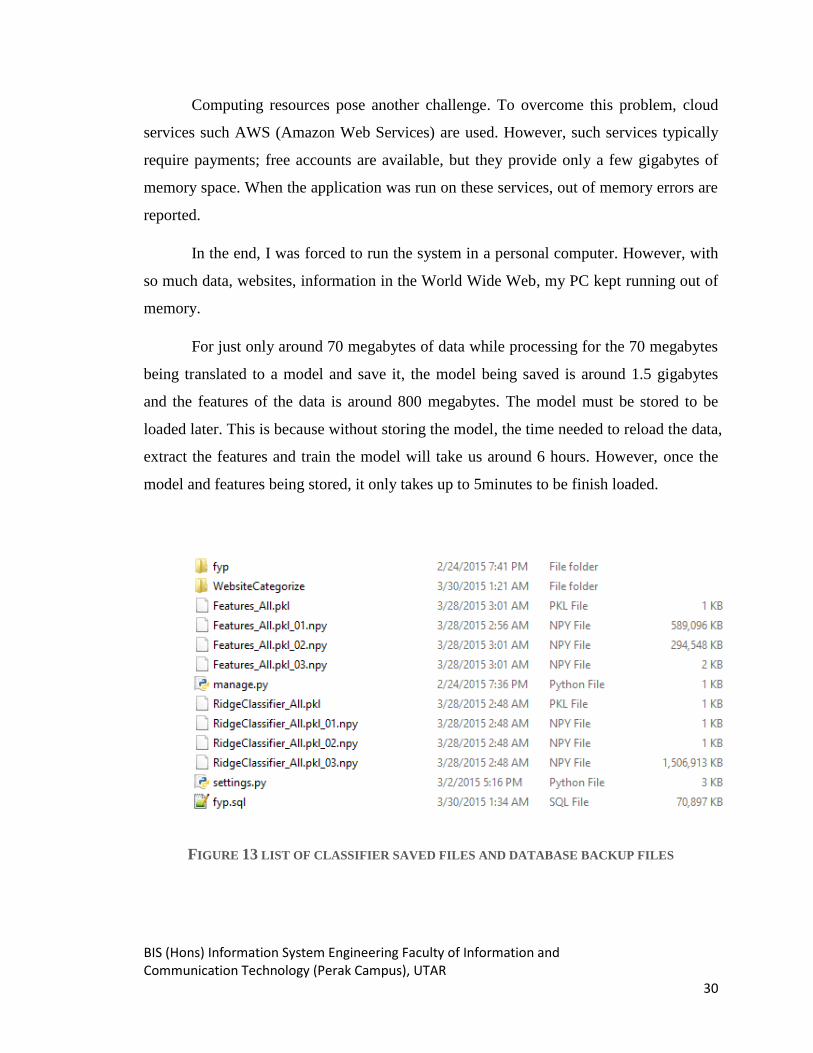
For just only around 70 megabytes of data while processing for the 70 megabytes
being translated to a model and save it, the model being saved is around 1.5 gigabytes
and the features of the data is around 800 megabytes. The model must be stored to be
loaded later. This is because without storing the model, the time needed to reload the data,
extract the features and train the model will take us around 6 hours. However, once the
model and features being stored, it only takes up to 5minutes to be finish loaded.
FIGURE 13 LIST OF CLASSIFIER SAVED FILES AND DATABASE BACKUP FILES
BIS (Hons) Information System Engineering Faculty of Information and Communication Technology (Perak Campus), UTAR
31
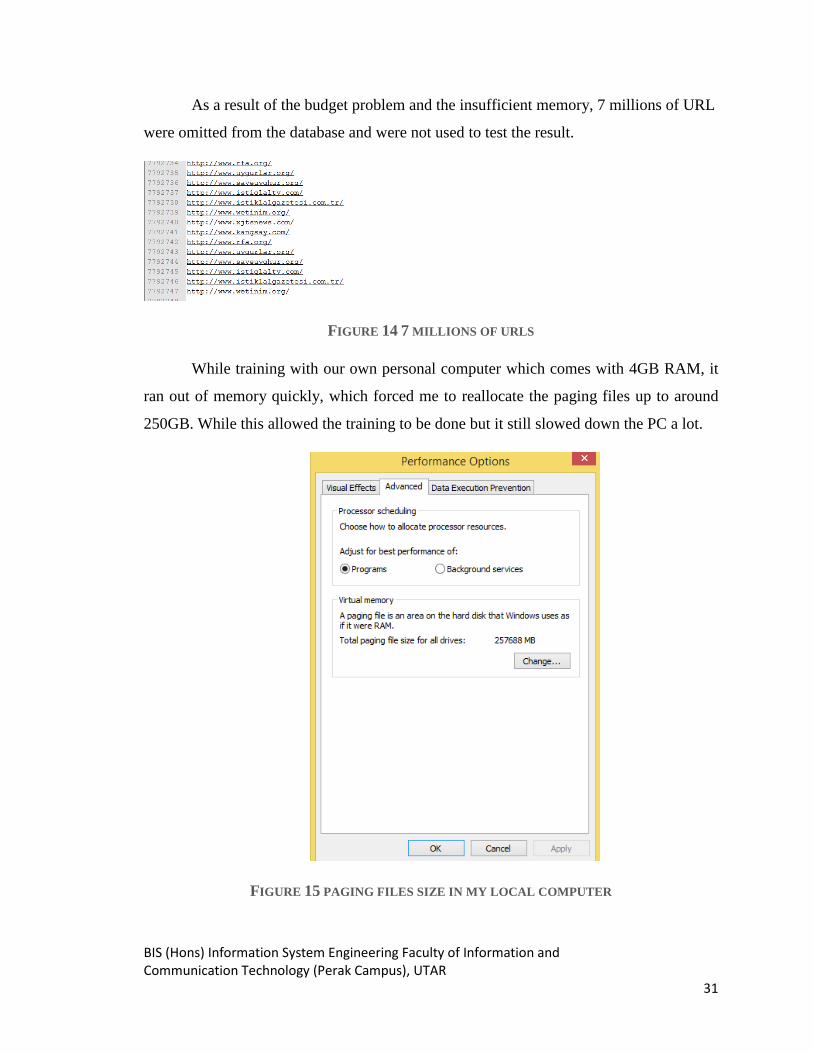
As a result of the budget problem and the insufficient memory, 7 millions of URL
were omitted from the database and were not used to test the result.
FIGURE 14 7 MILLIONS OF URLS
While training with our own personal computer which comes with 4GB RAM, it
ran out of memory quickly, which forced me to reallocate the paging files up to around
250GB. While this allowed the training to be done but it still slowed down the PC a lot.
FIGURE 15 PAGING FILES SIZE IN MY LOCAL COMPUTER
BIS (Hons) Information System Engineering Faculty of Information and Communication Technology (Perak Campus), UTAR
32
3.4 METHOD TO SETUP THE PROJECT AND RUN
As what mentioned in the above section, this application is a web application.
Therefore the application was being decided to host in a Linux platform. In this section,
the step by step for setting up a clean Linux platform to run this web application was
being listed below.
To setting up the system, the following UNIX commands must be performed.
sudo su
This command being performed was used to gain the full access of the system.
sudo apt-get install python
This command being performed was used to install Python.
sudo apt-get install python3-pip
This command being performed is used to install the python pip library. Pip is a
library that used to install python library.
sudo apt-get install mysql-server
This command being performed was used to install mysql server in the system.
sudo apt-get install python3-numpy
This command being performed was used to install numpy which required by the
scikit-learn.
sudo apt-get install python3-scipy
This command being performed was used to install scipy which required by the
scikit-learn.
sudo apt-get install build-essential python3-dev python3-setupstools python3-
numpy python3-scipy libatlas-dev libatlas3gf-base
BIS (Hons) Information System Engineering Faculty of Information and Communication Technology (Perak Campus), UTAR
33
This command being performed was used to install setuptools. However, scipy
and numpy can be installed through this command as well just in case users forget
to run the previous command.
sudo update-alternatives –set libblas.so.3 /usr/lib/atlas-base/atlas/libblas.so.3
sudoupdate-alternatives –set liblapack.so.3 /usr/lib/atlas-
base/atlas/liblapack.so.3
Command above was used to install package that required by python.
sudo pip3 install scikit-learn
This command was used to install scikit-learn. Scikit-learn is a well-known open
source machine learning library in python community.
pip3 install BeautifulSoup4
This command was used to install BeautifulSoup4. BeautifulSoup4 is a library
that used to read html markup tag.
pip3 install PyMySQL
pip3 install –allow-external mysql-connector-python
The command above was used to install PyMySQL which required for django to
connect to the MySQL database.
After installing all the needed files, copy the fyp folder to any location and it
normally being moved to location /var/. So, after this, user able to change
directory to this location and start the server through the command below.
cd /var/fyp
Next, users have to restore the mysql database from the backup sql script with the
following command
mysql –h localhost –u [username] –p [database name] < backup.sql
BIS (Hons) Information System Engineering Faculty of Information and Communication Technology (Perak Campus), UTAR
34
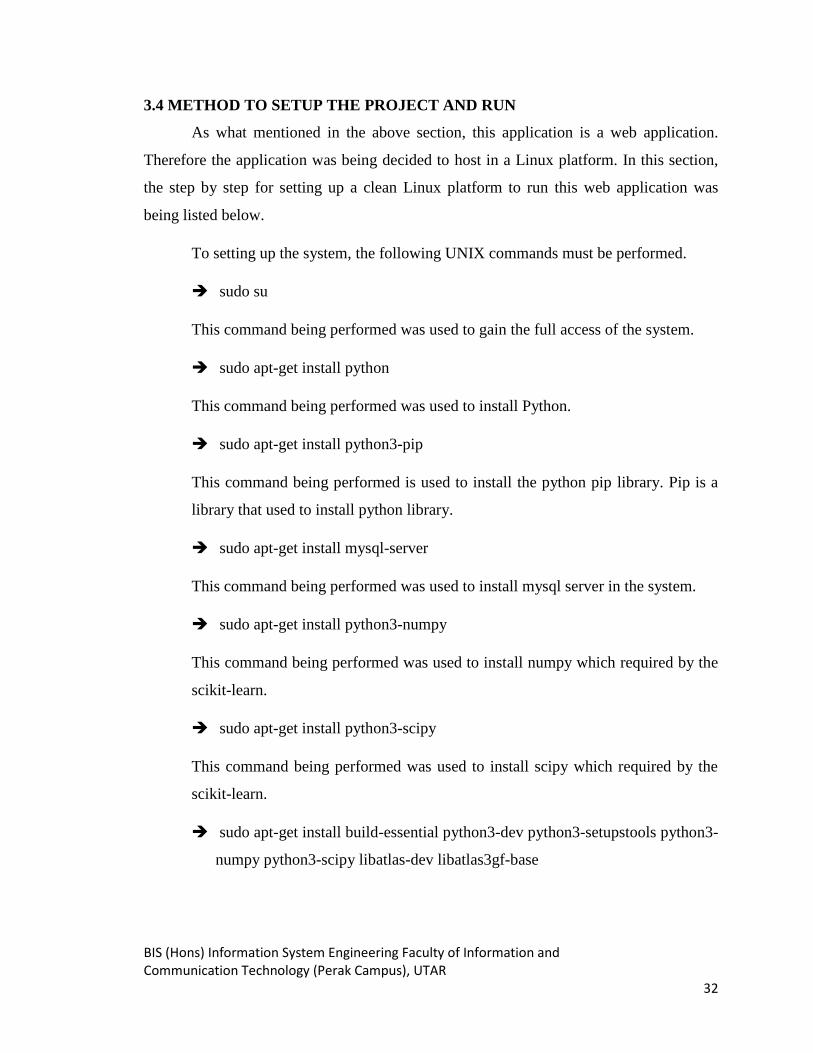
In order to let users access it through their browser, the server must be
started through the command below.
python3 manage.py runserver 0.0.0.0:port_number
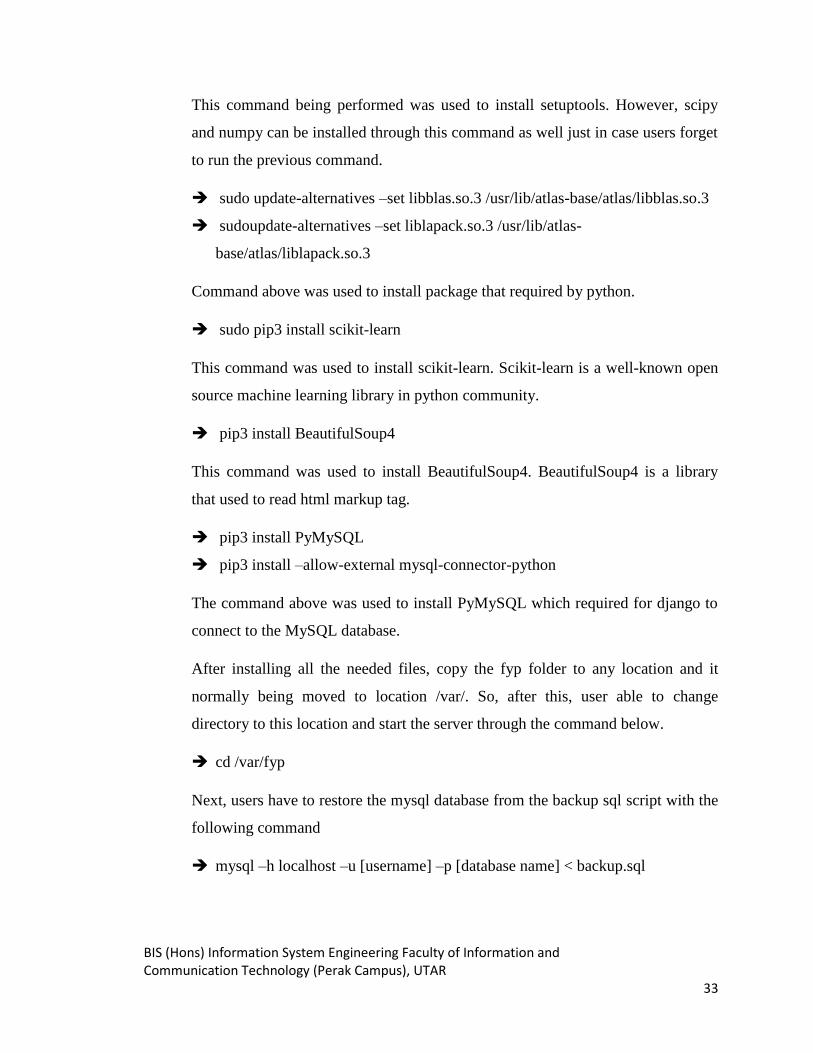
So, a web client will be able to access to the web through
<your_domain_or_your_ip_address>:port_number/WebsiteCategorize/
FIGURE 16 ACCESS THE WEB THROUGH THE LINK
BIS (Hons) Information System Engineering Faculty of Information and Communication Technology (Perak Campus), UTAR
35
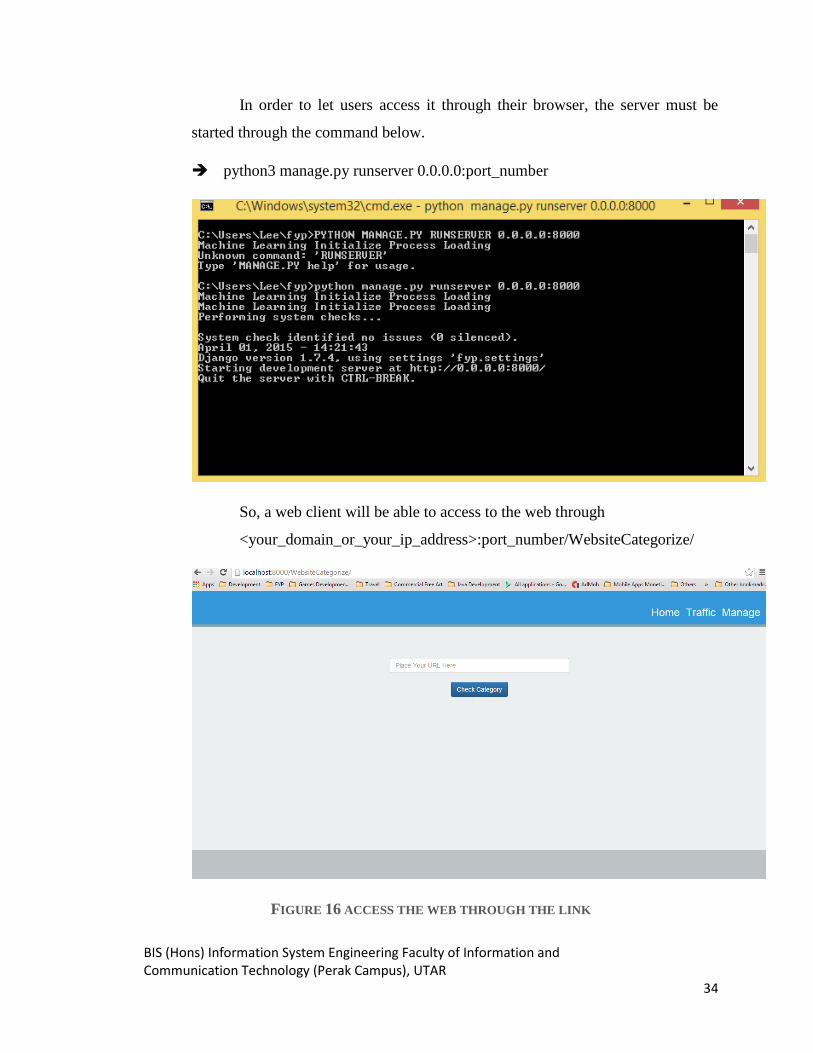
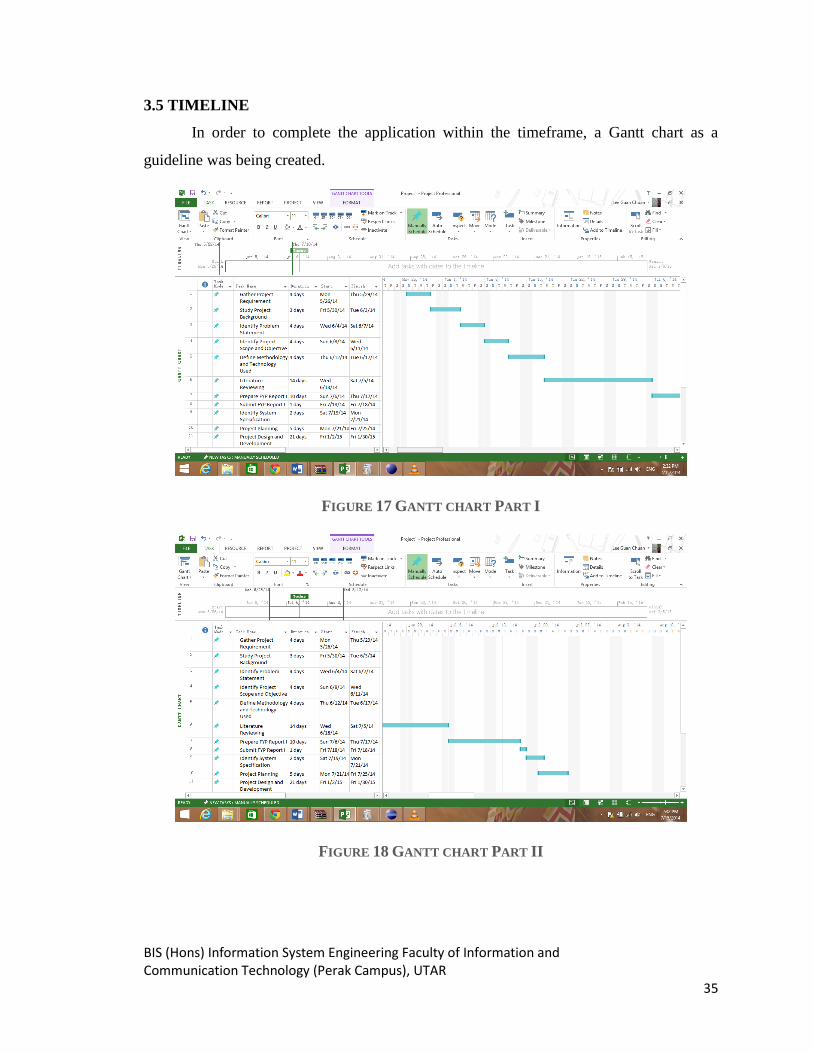
3.5 TIMELINE
In order to complete the application within the timeframe, a Gantt chart as a
guideline was being created.
FIGURE 17 GANTT CHART PART I
FIGURE 18 GANTT CHART PART II
BIS (Hons) Information System Engineering Faculty of Information and Communication Technology (Perak Campus), UTAR
36
CHAPTER 4: EXPERIMENTAL RESULTS
4.1 DATA COLLECTION
Data are obtained from DMOZ, which consists of around 7 million URLs.
However, these data cannot be used in its entirety due to budget issues. Also, DMOZ
provides up to which could not be loaded into the memory to process. Furthermore,
traffic data may not be available for a majority of these URLs. Therefore, only a subset of
the URLs was sampled out from the URL list.
On the other hand, Alexa provides the long-term traffic information of 500 sites,
which provides a good starting point for the sampling. After decided where to get all the
data, the system started to scrape the top 500 sites from Alexa and http request to the
URL and get the html markup last send the URL to compete to get the traffic data. Last,
the traffic data, URL name and html markup will be stored into the database. However,
the html special tags are stripped away before it store into the database. This is because
some of the html special tag could not be stored into the database. Next, the category of
each of the URL will be scraped from the trusted source.
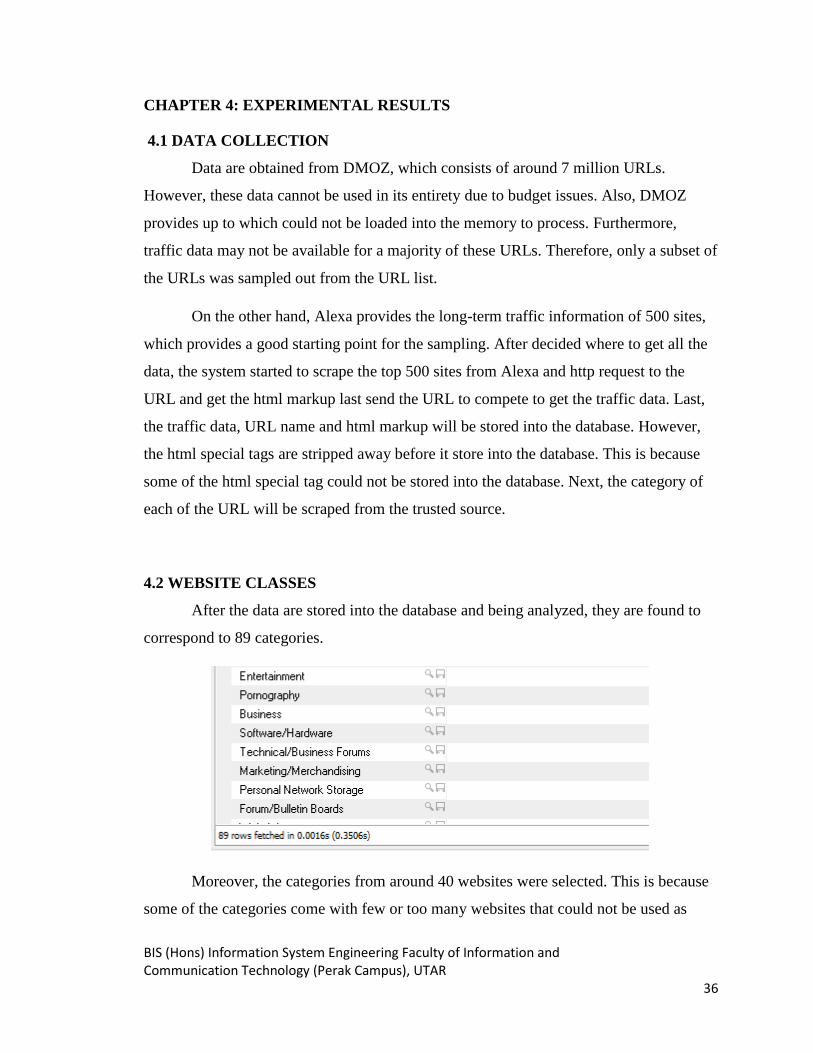
4.2 WEBSITE CLASSES
After the data are stored into the database and being analyzed, they are found to
correspond to 89 categories.
Moreover, the categories from around 40 websites were selected. This is because
some of the categories come with few or too many websites that could not be used as
BIS (Hons) Information System Engineering Faculty of Information and Communication Technology (Perak Campus), UTAR
37
training data. Those excessive number websites will make the classifier full with their
category data and classifier could not differentiate them with those low data categories.
Search Engine, General News, Portal Sites, Online Shopping and Internet Services were
selected from the database as data. Each of them has around 40 websites.
4.3 FEATURES EXTRACTION
After the categories to train the classifier was decided, the samples in each
category was split into two sets of 8:2 ratio which means 80% of the data will be used to
train the model while the remaining 20% will be used to test the classifier‟s accuracy.
Therefore, the data being vectorized with CountVectorizer, HashVectorizer and
TfidfVectorizer and all of the vectorized data is combined. Next, the vectorized data is
transformed by TfidfTransformer. However, the data being transformed by
TfidfTransformer gave exceptions due to negative values. Hence, all of the vectorized
data are vectorized into positive values only and transformed with TfidfTransformer. Last,
the features that are obtained from vectorizer are combined with the output from
TfidfTransformer.
BIS (Hons) Information System Engineering Faculty of Information and Communication Technology (Perak Campus), UTAR
38
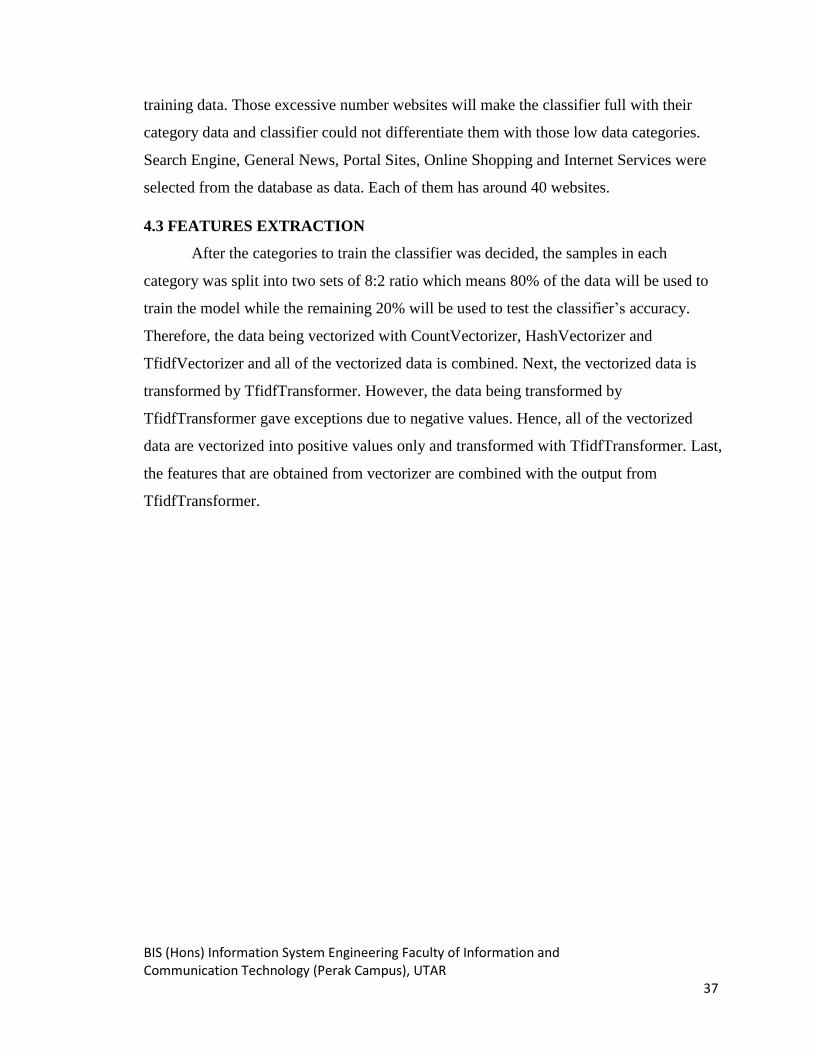
4.4 TESTING RESULT
FIGURE 19 GRAPH OF TESTING RESULT
First, the features were tested with Support Vector Machine classifier. However, it
only achieved an accuracy of around 26%. Then, the features were tested with Naïve
Bayes classifier which returns an accuracy of 55%. The problem might cause by the
directly vectorize the html markup without getting the specific information. Therefore, all
the html tags were being taken away, leaving only the text in the webpage. However, this
returned even lower accuracy. When the script tags from the html markup were taken
away, the accuracy was increased to 61%. Here, the style tags and html tags cannot be
removed because to classify the functionality of a web page, the design features of the
web page should be used as input as well, since different classes of website have different
and similarities of their design.
Using a Ridge classifier, with the same features that mentioned above with
achieved around 66% accuracy. That is, Ridge classifier gives the highest accuracy
compared to others. This could be due to over-fitting in Support Vector Machine and
Naïve Bayes, whereas the Ridge Classifier is a classifier that utilize Ridge Regression
0%
10%
20%
30%
40%
50%
60%
70%
80%
90%
Support VectorMachine with all
html tags and text
Naïve Bayes with allhtml tags and text
Naïve Bayes withtext and all html tags
except script tags
Ridge Classifier withtext and all html tags
except script tag
Ridge Classifier withtext and all html tagsexcept script tag but
normalize withMinMaxScaler
Graph of Testing Result
Series 1
BIS (Hons) Information System Engineering Faculty of Information and Communication Technology (Perak Campus), UTAR
39
which comes with regularization, which is able to regularize the data and solve the over-
fitting situation.
In order to increase these accuracies, a preliminary examination of the output of
the vectorizer was peformed. It was then noticed that these outputs were not in binary
form. Therefore, the vectorizer was configured to return the result in binary form. With
binary form of data, the accuracy increased to around 76%.
To achieve least 80% above accuracy, more methods were further tested. First of
all, the features were scaled based on a few sizes, e.g. 10, 100, 1000 and 10000. However,
that did not improve the result.
Various normalization with the other functions provided by scikit learn are then
attempted. Different arguments provided by scikit learn in the normalize function was
tested with different data to normalize the data. However, the result remained the same or
even deteriorated.
Finally, a graph was plotted based on the features data to check whether the
examples are separable or not in the first place. The data was found to lie very closely
together which might be the reasons that the classifier unable to differentiate them.
To solve this, MinMaxScaler was used to scale the features to around 0 to 100.
However, the result that we get is lower than the previous one. Therefore,
CountVectorizer, HashVectorizer and TfidfVectorizer were used to vectorize the features
into binary form and MinMaxScaler to scale the binary form to between 0 and 100 then
the features that scaled by the MinMaxScaler is transformed to Tfidf Features through
Tfidf Transformer. When all these are performed, the accuracy in cross validation was
increased up to around 82%-93%.
BIS (Hons) Information System Engineering Faculty of Information and Communication Technology (Perak Campus), UTAR
40
CHAPTER 5: CONCLUSION
An application that will automatically classify websites is developed. This
application is created to allow the analysis of trend of web usage. Insights obtained from
these trends are useful for various purposes.
The application developed consists of 2 parts. The first part of the application
trains a classifier for website functionality. Features like URL feature, HTML Features
will be extracted from the website in order to teach the classifiers.
The second part of the application fulfills the main function of this project. It
crawls websites from the World Wide Web, classifies them automatically, and analyzes
the popularity of the websites. A graph is produced to allow users to analyze trends in the
popularity for websites of different functionalities.
Dealing with the scale of the World Wide Web presents a tremendous problem to
this project. Limitations and challenges abound, such as Internet Connection, Memory
space, Correctness of Website Category to particular website, etc. Working without a
budget, I resolved to various methods to overcome these challenges, e.g. running the
application on own personal computer, and running a website locally. Also, the personal
computer could not be used when running the CPU intensive classifier training.
For future work, the image data in the web page should be extracted out and used
as features, together with the text data from the website for categorization. Audio and
video can perhaps, be analyzed as well for classifications. A lot of websites may look
almost the same but belong to different categories. Therefore, every single possible data
and features that lies inside the website for their classification should be treated as an
important feature to differentiate the websites.
Other than that, this system can be enhanced and embedded into a search engine
system. Searches are based mostly on keywords at present; by adding in category
information, more refined searches can be performed. This is able to increase the efficient
and effectiveness of the search engine as well.

BIS (Hons) Information System Engineering Faculty of Information and Communication Technology (Perak Campus), UTAR
41
Currently, the system classifies only English websites. Other languages such as
Chinese, Japanese, Malay or other more languages should be tested as well.
References
Qi, X & Davison, B D., DW 2007, „Web Page Classification: Features and Algorithms‟,
ACM Computing Surveys (CSUR), vol. 41, no.12, pp.228-237.
Kavitha, S & Vijaya, M. S., DW March 2013, „Web Page Categorization using
Multilayer Perceptron with Reduced Features‟, International Journal of Computer
Applications, vol.65, no.1, pp 22-27.
Gupta, S & Bhatia, K K., DW December 2012, „A system‟s approach towards domain
identification of web pages.‟, Proceedings of the Second IEEE International
Conference on Parallel, Distributed and Grid Computing, vol.2, no. 6.
Meshkizadeh, S & Dr Masoud-Rahmani, A., DW 2010 „Webpage Classification based
on Compound of Using HTML Features & URL Features and Features of Sibling
Pages‟, Proceedings of International Journal of Advancements in Computing
Technology , vol.2, no 4, pp 36-46.
Ting, S L , Lp, W H & Tsang H C T., DW 2011 „Is Naïve Bayes a Good Classifier for
Document Classification‟, Proceedings of International Journal of Software
Engineering and its Applications , vol.5, no 3.
Kadry, S & Kalakech A., DW 2013 „On the Improvement of Weighted Page Content
Rank‟, Journal of Advances in Computer Networks, vo1.1, no 2.
Sebastiani, S., DW 1999. „A tutorial on automated text categorization‟, Proceedings of
ASAI-99, 1st Argentinian Symposium on Artificial Intelligence, pp7-35.
Mangai, J A, Kothari, D D & Kumar V S., DW 2012. „A Novel Approach for Automatic
Web Page Classification using Feature Intervals‟, IJCSI International Journal of
Computer Science Issues, vol.9, no 2.
Mangai, J A, Kumar V S., DW 2011. „A Novel Approach for Web Page Classification
using Optimum features,‟ IJCSNS International Journal of Computer Science and
Network Security, vol.11, no 5.
Tsukada, M, Washio, T & Motoda, H., DW 2001. „Automatic Web-Page Classification
by Using Machine Learning Methods,‟ Web Intelligence : Research and
Development, LNCS, Springer, vol.2198, pp 303-313.
Wen, H, Fang, L & Guan L., DW 2008. „Automatic Web Page Classification using
various Features‟, LNCS, Springer Verlag, vol.5353, pp 368-376.
Kwon, O W & Lee, J H., DW 2000. „Web page classification based on k-nearest
neighbor approach‟, Proceedings of the fifth international workshop on on
Information retrieval with Asian languages, pp 9-15.
Sebastiani, F., DW 2002. „Machine learning in automated text categorization‟, ACM
Computing Surveys (CSUR) archive, vol .34, issue 1, pp 1-47.
Shen, D, Chen, Z, Yang, Q, Zhen, H J, Zhang, B, Lu, Y & Ma W Y., DW 2004. „Web-
page classification through summarization‟, SIGIR, pp 242-249.

Riboni, D., DW 2003, „Feature selection for web page classification‟, EURASIA-ICT
2002 Proceedings of the workshop.