Embed Size (px)
Citation preview

Correlate the Coronary Arteries
Inferior – RCA – II, III, AVFSeptal – LAD – V1, V2Anterior – LAD – V3, V4Lateral – Circumflex – I, AVL, V5, V6

Cardiac Anatomy
Rightcoronary
artery
RV marginalbranch
Rightventricle
Pulmonaryartery
Left atrium
Leftventricle
LV inferior wall
AnteriorPosterior

Atherosclerosis

Cascade effects of atherosclerotic
plaque rupture
� Platelet aggregation� Fibrin accumulation� Thrombus formation� Bleeding into the
plaque� Vasospasm
ARTERY OCCULUSION


Time Is MuscleMuscle is Ejection Fraction
Ejection Fraction isQuality of Life

Target
Door to Balloon < 90 minutes(Class 1, Level A)
or Door to Needle < 30 minutes
(Class 1, Level B)
ACC/AHA 2013 Guidelines for Management of STEMI

CRUSADING towards a GOAL
Door to EKG
10 minutes or less(Class 1: Level C)

EKG Changes with MI: Ischemia
Ischemia < 20 MinutesLack of oxygen to the myocardial muscle
♥ Peaked T Waves♥ Inverted T Waves♥ ST Segment Depression
Ischemia = screaming for oxygen

EKG Changes with MI: Injury
Injury 20 - 40 minutesWhen the period of ischemia is prolong more than a few minutes, ischemic areas of the heart become damaged (injured)♥ ST segment elevation

The ST Segment
� From the end of the QRS complex to the beginning of the T wave
� Should be at the baseline

Measurement of
ST-Segment Deviation
STEMI: ≥1 mm ST-segment elevation in 2 leads.*NSTEMI/UA: ≥0.5 mm ST-segment ischemic depression in 2 leads.**Anatomically (regionally) contiguous leads.
Source: AHA ACLS EP

EKG Changes with MI: Infarction
Infarction > 1 - 2 hours♥ Abnormal Q waves
> 1/3 the height of R wave in that leador> 0.03 ms wide
Normal Q wave 1st downward deflection of QRS
Abnormal (significant Q waves)

Normal QRS complex – The Q wave
� Q wave is the first negative deflection after the p wave� Always first may or may not be there. � Comes first in the alphabet � There are normal and abnormal Q waves
Q

Normal QRS complex – The R wave
� R wave is the first positive deflection after the p wave� Always Rising above
R

Normal QRS complex – The S wave
� S wave is the second negative deflection after the R wave� Slipping down� Always after R wave like in the alphabet
S

Review of Normal QRS complex
� Q wave is the first negative deflection after the p wave� R wave is the first positive deflection after the p wave� S wave is the second negative deflection after the R wave

EKG Changes with MI: Infarction
Infarction > 1 - 2 hours♥ Abnormal Q waves
> 1/3 the height of R wave in that leador> 0.03 ms wide
Normal Q wave 1st downward deflection of QRS
Abnormal (significant Q waves)
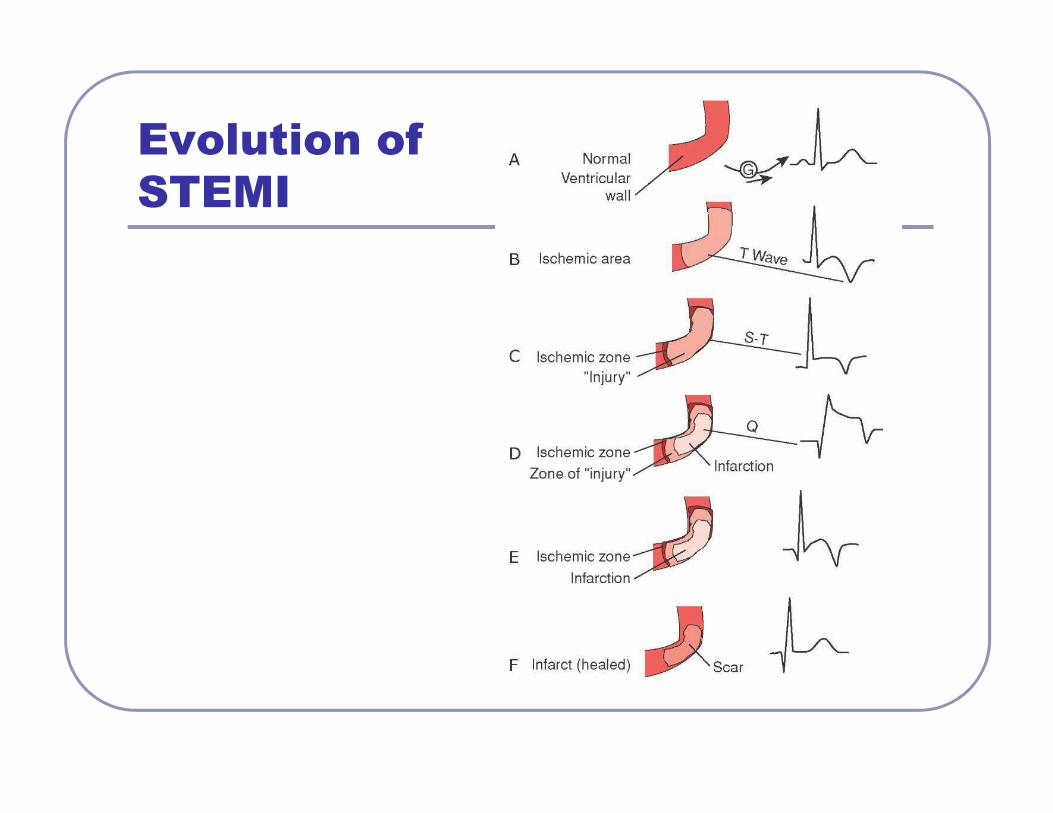
Evolution of
STEMI
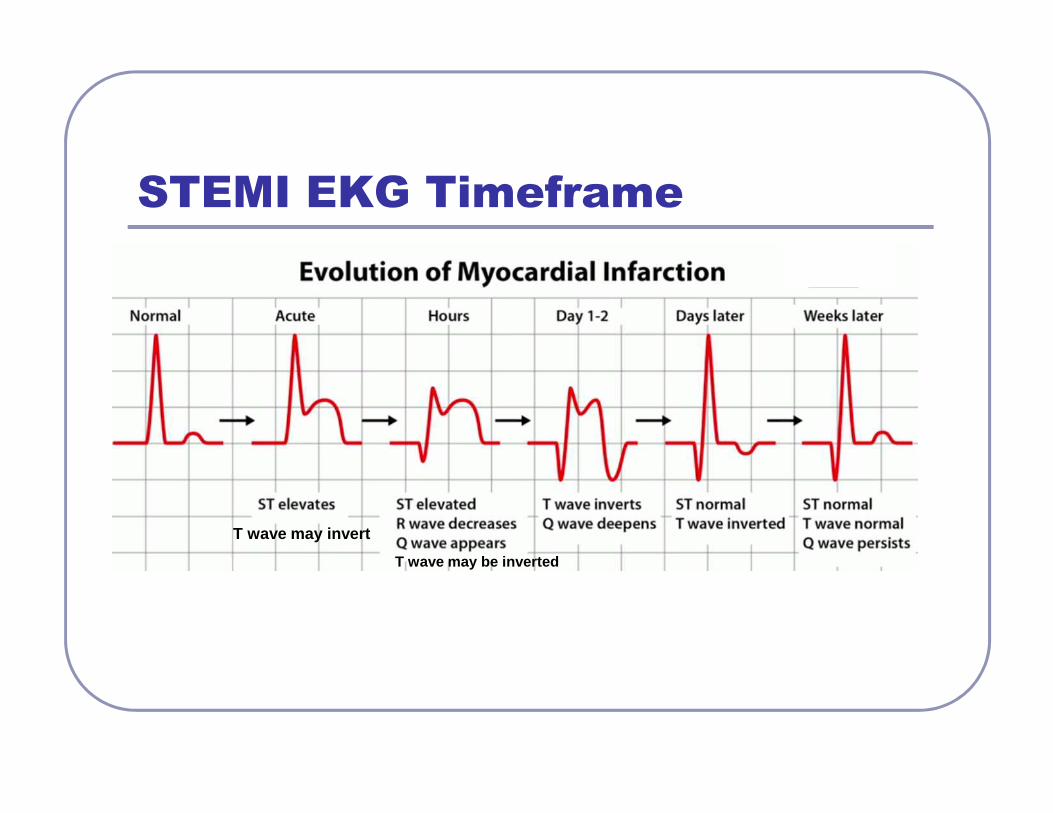
STEMI EKG Timeframe
T wave may invert
T wave may be inverted

Evolving AMI:EM #1 December 13 at 1701

EM # 2 December 13 at 1823
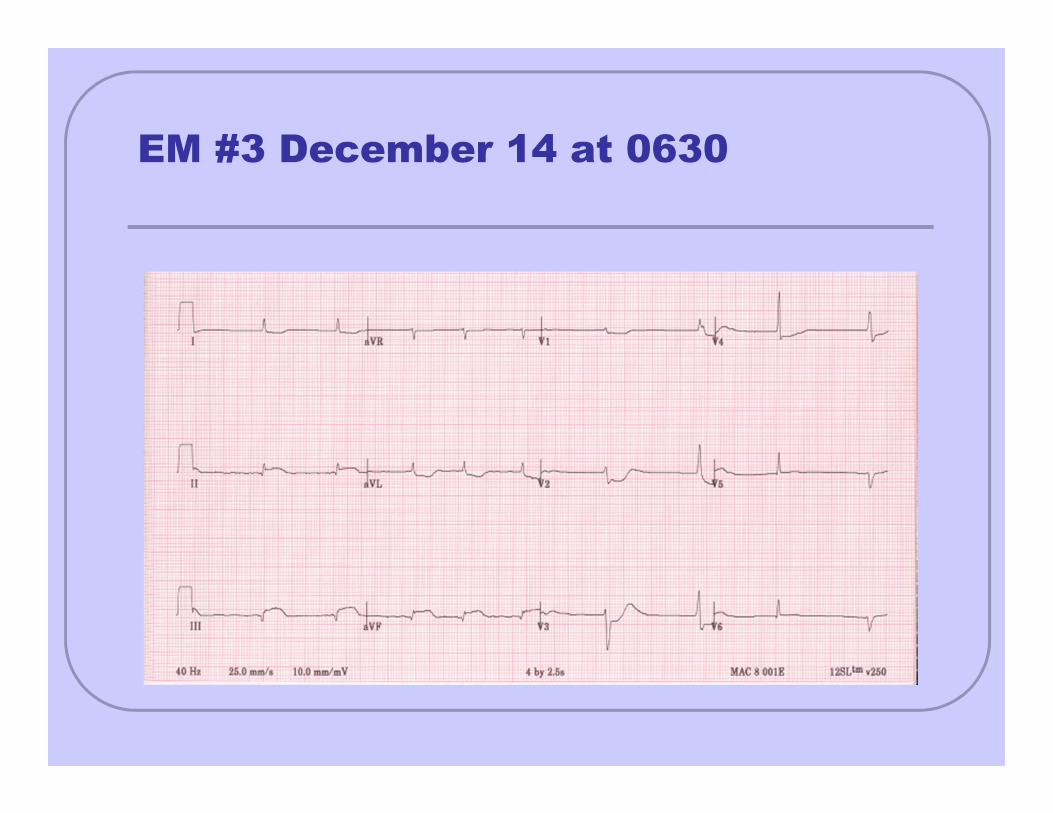
EM #3 December 14 at 0630

EM # 4 December 15 0600

CC: Admission EKG 1445

CC: 3 hours later

CC: 28 hours later
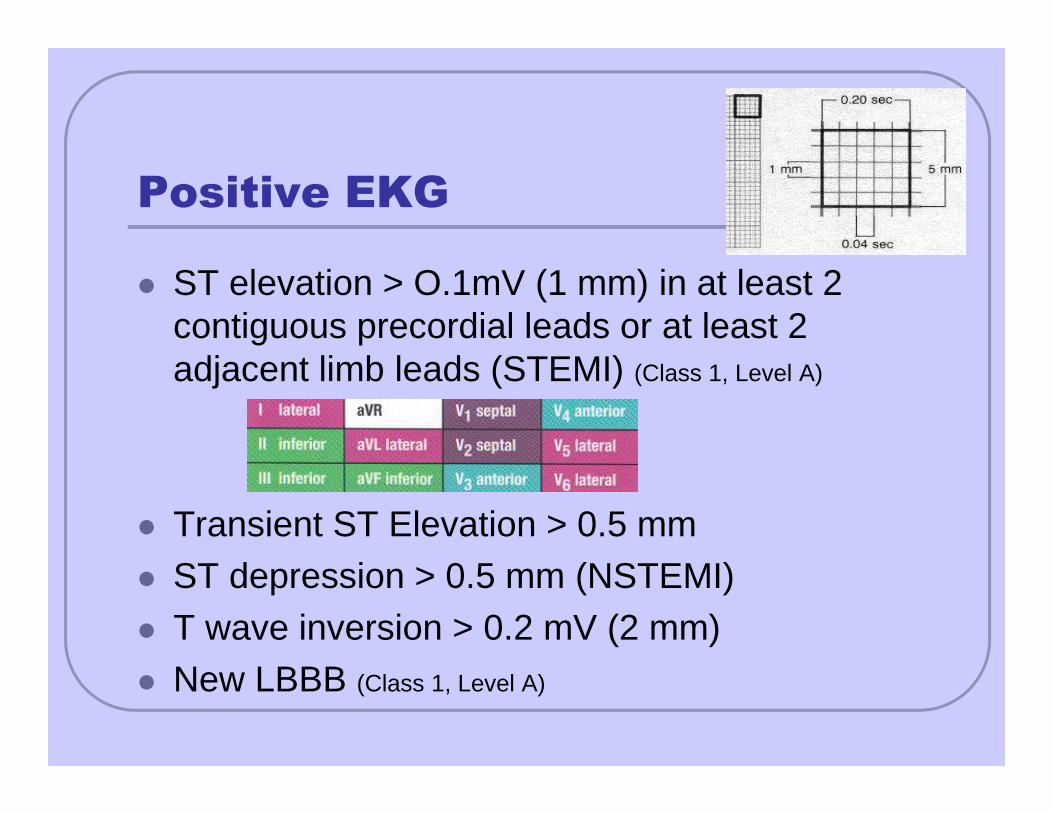
Positive EKG
� ST elevation > O.1mV (1 mm) in at least 2 contiguous precordial leads or at least 2 adjacent limb leads (STEMI) (Class 1, Level A)
� Transient ST Elevation > 0.5 mm� ST depression > 0.5 mm (NSTEMI)� T wave inversion > 0.2 mV (2 mm)� New LBBB (Class 1, Level A)

LBBB = QRS > 0.12 sec
Negative QRS in V1 (carrot)

RBBB = QRS > 0.12 sec
Positive QRS in V1 (rabbit ears)

BBB = QRS > 0.12sec
� LBBB = QRS > 0.12 sec Negative QRS in V1 (carrot)
� RBBB = QRS > 0.12 sec Positive QRS in V1 (rabbit ears)
LBBB
RBBB
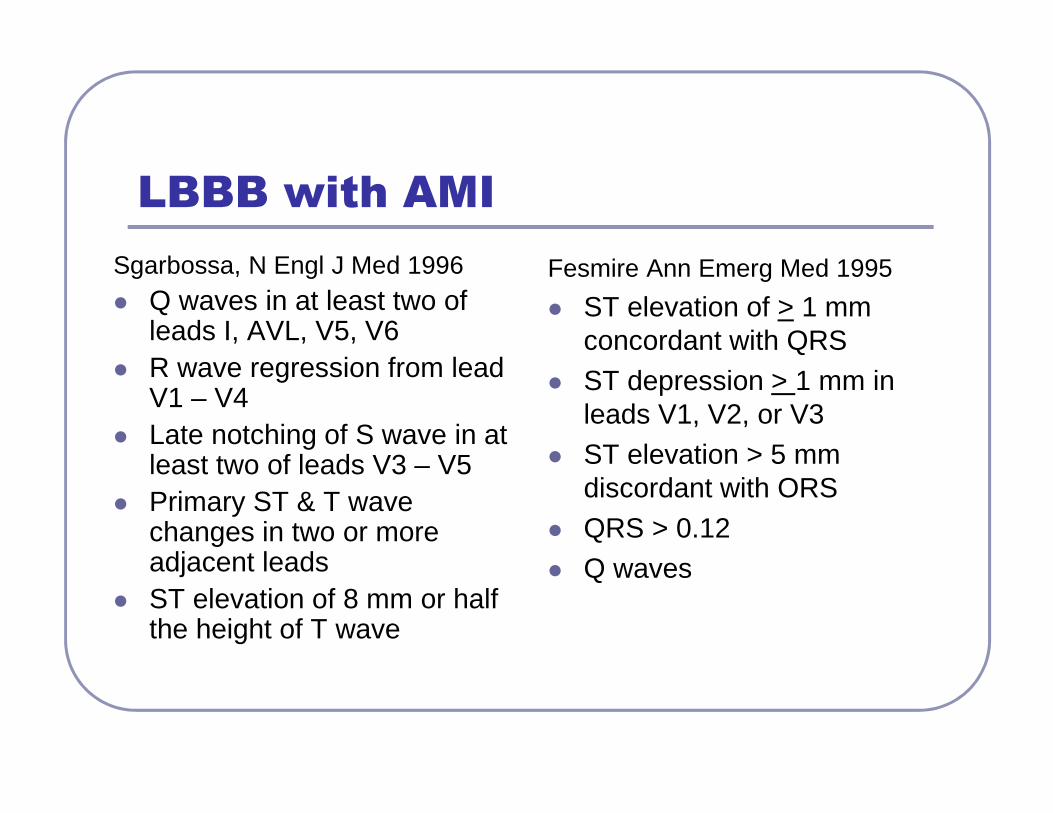
LBBB with AMI
Sgarbossa, N Engl J Med 1996� Q waves in at least two of
leads I, AVL, V5, V6� R wave regression from lead
V1 – V4� Late notching of S wave in at
least two of leads V3 – V5� Primary ST & T wave
changes in two or more adjacent leads
� ST elevation of 8 mm or half the height of T wave
Fesmire Ann Emerg Med 1995
� ST elevation of > 1 mm concordant with QRS
� ST depression > 1 mm in leads V1, V2, or V3
� ST elevation > 5 mm discordant with ORS
� QRS > 0.12� Q waves

NSTEMINon ST Segment Elevation MI
♥ No ST segment Elevation♥ ST segment depression


STEMI
PCI < 90 minutesBoth elevatedTroponins
NSTEMI
Inversion of the T wave Depression of ST segment
PCI within 24 - 48 hours

12 Lead EKG
Understanding Lead Placement

12 Lead EKG 101 Learn the Normal so you can detect the abnormal

To Learn 12 Lead EKG
You MUST pick them up
and LOOK at them!

Leads Are Like Pictures
Camera is on the positive lead

The 12 Leads
Bipolar LeadsEach lead has two poles:
One positive & one negative
I, II, III
Unipolar LeadsOnly one lead is physically positive.
Negative lead is not a specific site on the body
AVR, AVL, AVF, V1-V6

Cube Concept of Left Ventricle
Each face of the cube represents a different part of the left ventricle

LIMB LEADS
l, II, III
� Also referred to as extremity leads due to placement on the body
� Record electrical forces two points equidistant fro m the heart.
� Each lead has two poles: one positive & one negative
� Two leads to give the picture� Current travels Negative to Positive to create the
electrical complex� 12 Lead EKG Reads or takes the picture from the
positive electrode to the heart

Lead IViews the heart fromleft arm to right arm
Area: Lateral Artery: Circumflex

Lead IIViews the heart fromleft leg to right arm
Area: InferiorArtery: RCA
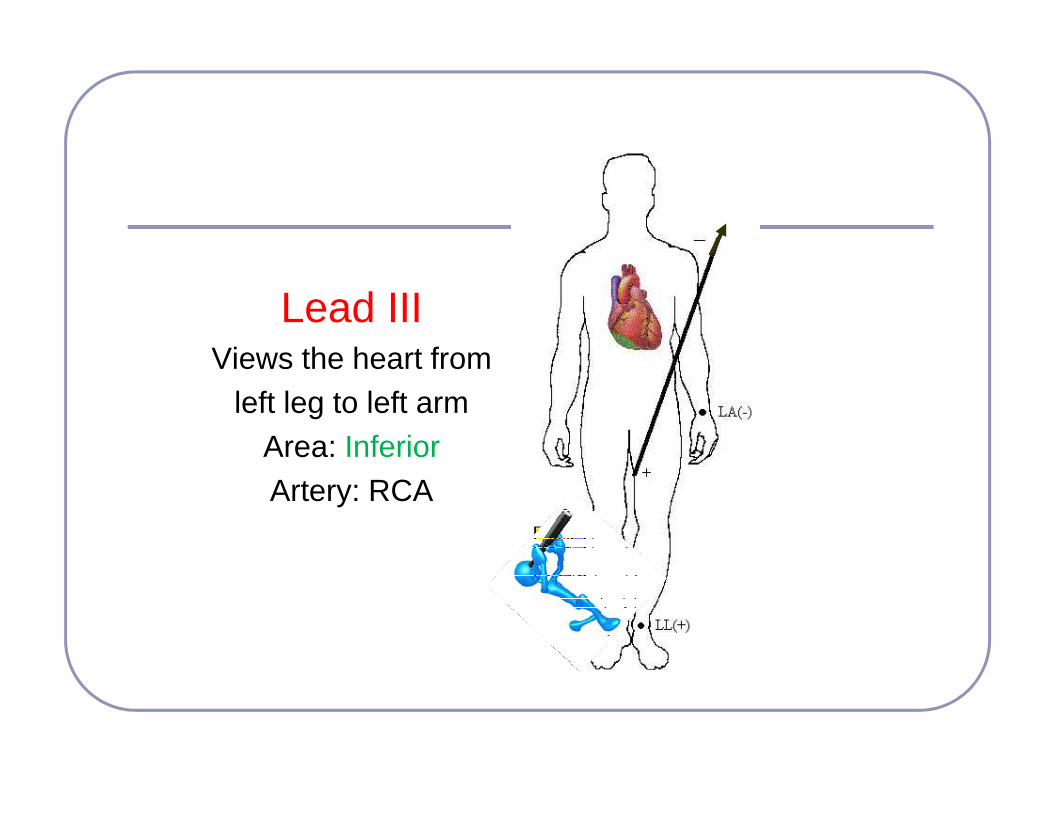
Lead IIIViews the heart from
left leg to left armArea: InferiorArtery: RCA

Einthoven’s Triangle
By connecting the electrodes of the limb leads, the Einthoven’s Triangle is formed.

Augmented Limb Leads
AVR, AVL, AVF
♥ Records electrical activity between the center of the heart and an extremity
♥ Since these leads are low voltage they are artificially augmented
♥ Unipolar leads: Negative pole is the heart

AVRAugmented Voltage Right
� Views electrical activity directed rightward.
� Very minimal rightward electrical activity occurs.
� Looks at great vessels not myocardium
� Configuration should be negative

AVLAugmented Voltage Left
Views the heart from the left arm to the mid-point
between right arm & right leg
Area: Lateral Artery: Circumflex

AVFAugmented Voltage FootViews the heart from the
feet to the chinArea: InferiorArtery: RCA
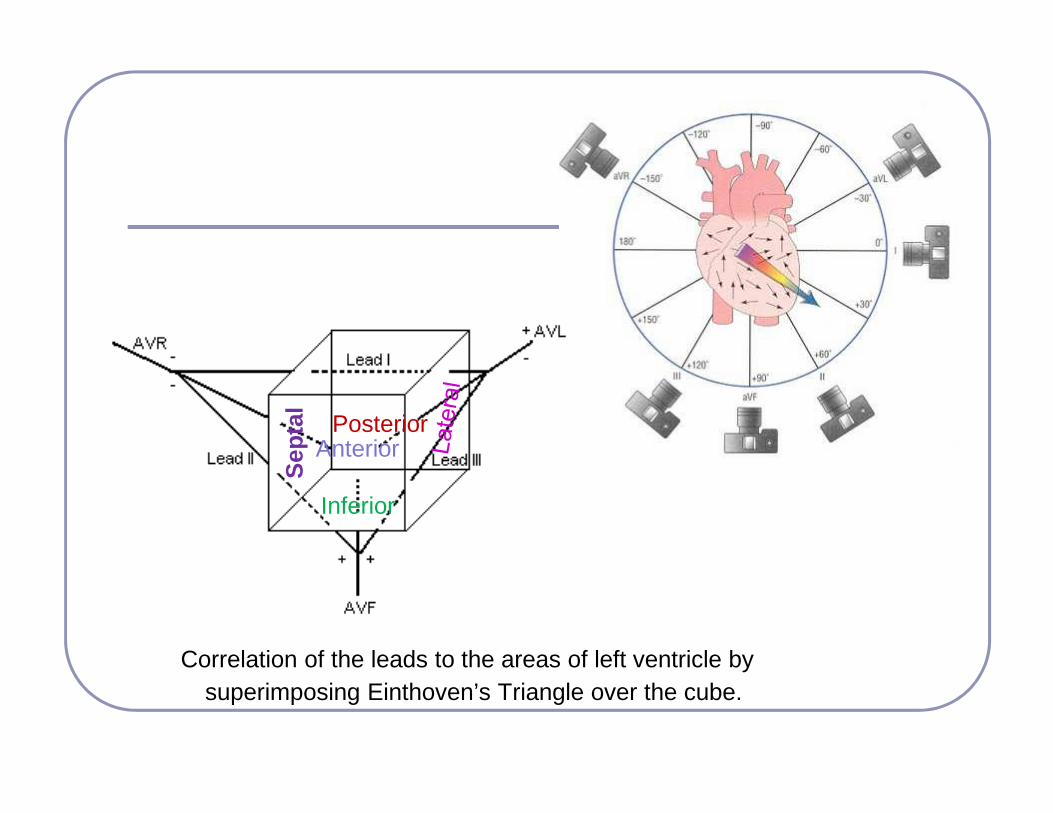
Correlation of the leads to the areas of left ventricle by superimposing Einthoven’s Triangle over the cube.
Inferior
Anterior
Sep
tal
Posterior
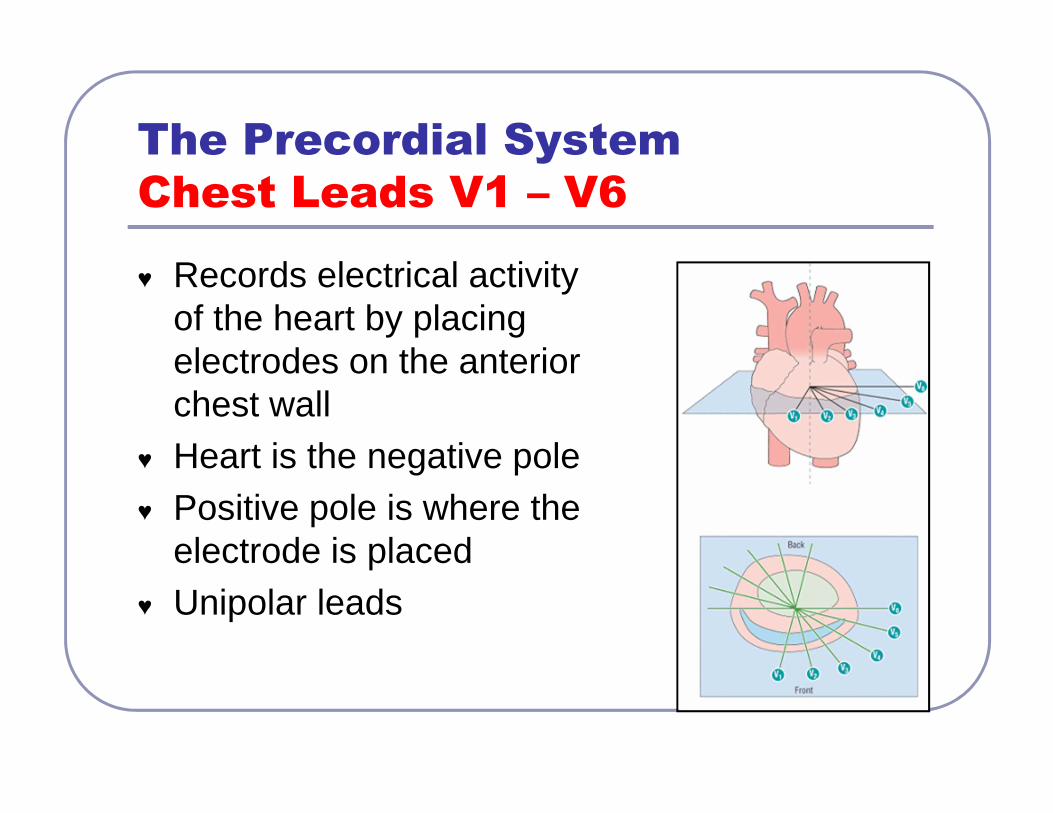
The Precordial System
Chest Leads V1 – V6
♥ Records electrical activity of the heart by placing electrodes on the anterior chest wall
♥ Heart is the negative pole♥ Positive pole is where the
electrode is placed♥ Unipolar leads

Precordial Leads Placement
� V1 4th intercostal space (ICS) right sternal border (septum)
� V2 4th ICS, left sternal border (septum)
� V3 Midway between V2 and V4 (anterior)
� V4 5th ICS, left midclavicular line (anterior)
� V5 5th ICS, left anterior axillary line (lateral)
� V6 5th ICS, left midaxillary line (lateral)

Precordial Leads

R Wave Transition
R: Rises above baseline

V1 & V2Views the septum
of the heartArea: SeptalArtery: LAD

V3 & V4Views the anterior area
of the left ventricleArea: AnteriorArtery: LAD

V5 & V6Views the lateral area
of the left ventricleArea: Lateral
Artery: Circumflex

Cardiac Anatomy in Relation to Coronary Artery
Cardiac Anatomy in Relation to Coronary Artery
www.aha.channing-bete.com 1-800-611-6083ACLS pocket cards or poster

Reciprocal ChangesReciprocal Leads that are opposite the damaged area will
show opposite EKG Changes
� Mirror Image� Two different electrodes
viewing AMI from opposite angles
� Example: Take photo of male from front and from back – still a male but different view

I

Primary changesII, III, AVF
Reciprocal ChangesI, AVL

Reciprocal Changes
Secondary Changes
� Ischemia , Injury , and infarction are primary changes
� Reciprocal changes are secondary changes� Reciprocal Leads that are opposite the
damaged area will show opposite EKG Changes
� Reciprocal changes = confirm primary changes

� Inferior � Lateral
• II, III, AVF � I, AVL, V5, V6
� Anterior � Posterior• V1 – V4

Reciprocal ChangesReciprocal Leads that are opposite the damaged area will
show opposite EKG Changes
� If you see ST segment depression, look in opposite leads for primary changes
� If you see tall R waves in the V leads, question if this is an old posterior AMI and look for Q waves in the inferior leads

� To learn you need to hear something
•6 times •6 different ways6
sixVI seis IIII I
SIX

Differential Diagnosis
12 Lead EKG in Acute Coronary Syndrome

Right Coronary Artery RCA
Inferior Wall
II, III, AVF

Occluded RCA RCA post stent

Inferior Injury

Old Inferior Infarction

Inferior AMI
� Involves right ventricle – may also get right ventricular infarct
� Need lots of fluids to increase preload since RV is involved
� Arrhythmias= Blocks� RCA wraps around the back of the heart and
changes to PDA. Typically have inferior –posterior AMI.
� Inferior- Posterior AMI: • ST Elevation: II, III, AVF and • ST depression V1, V2, V3

Inferior AMIWhat’s the rhythm?

Left Anterior Descending Artery LADAnterior Wall V3 & V4
Septal Wall V1 & V2

Anterior-septal Injury

Precordial Leads – Know normal

Old Anterior Infarction

Occluded High LAD LAD post stent

Anterior AMI
� Lose the most muscle mass� Usually have the lowest EF� Arrhythmias = VT or VF

Stress Test – Angio found 3 occlusions in the LAD

Circumflex Artery Cx
Lateral Wall
I, AVL V5 & V6

High Lateral Injury

Anterior Lateral Injury
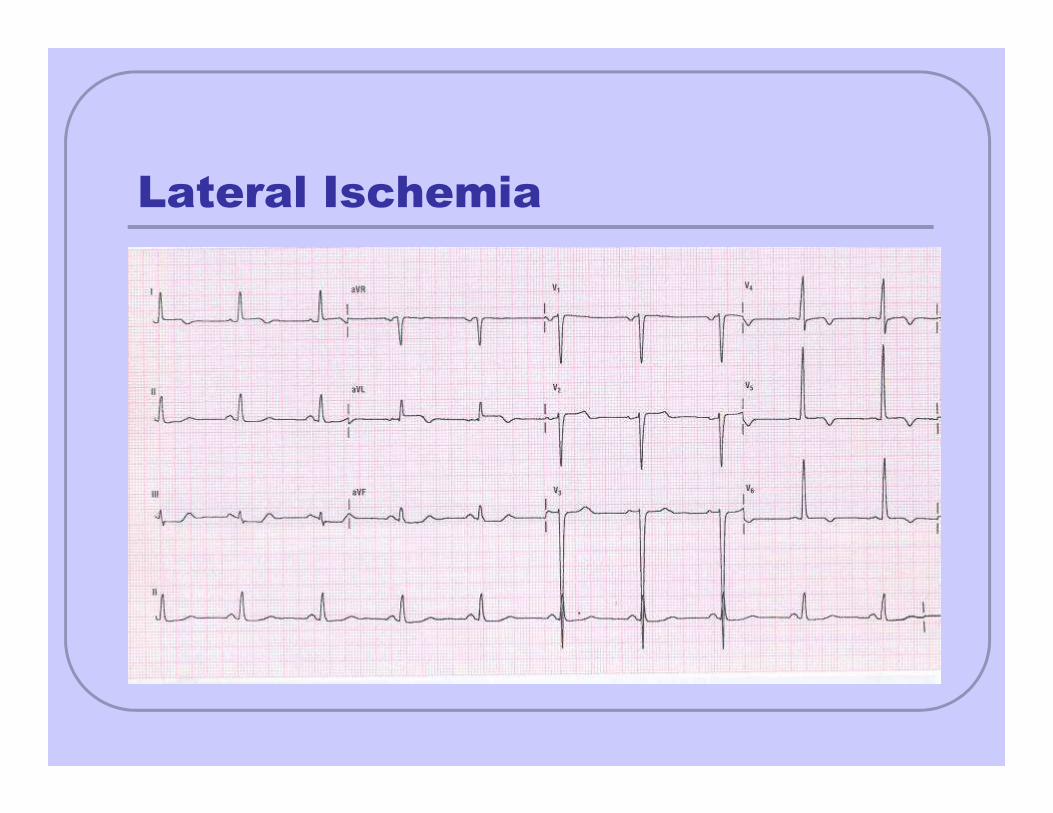
Lateral Ischemia

Posterior Descending Artery PDA
Posterior Wall
Reciprocal Changes
� Usually see with Inferior AMI asRCA wraps around the back of the heart and changes to PDA
� Reciprocal Changes V1 , V2, V3(ST segment depression or Tall R Waves)
� 18 Lead EKG

Mirror ChangesMirror Changes
Inferior &
Posterior
Injury

Mirror ChangesMirror Changes
Old Inferior-
posterior
Infarction

Lead Placement: Right-Sided ECG

Right-Sided 12-Lead ECG: Patient
With Inferior ST-Segment Changes
V3R
V4R
V5R
V6R

18 Lead EKG
Anterior Chest Posterior Chest
V4R = 5th ICS at RMCLV5R = 5th ICS at RAALV6R = 5th ICS at RMAL
V7 = 5th ICS at Left Posterior axillary lineV8 = Halfway between V7 & V9V9 = 5th ICS next to vertebral column

Right Chest and Posterior EKG
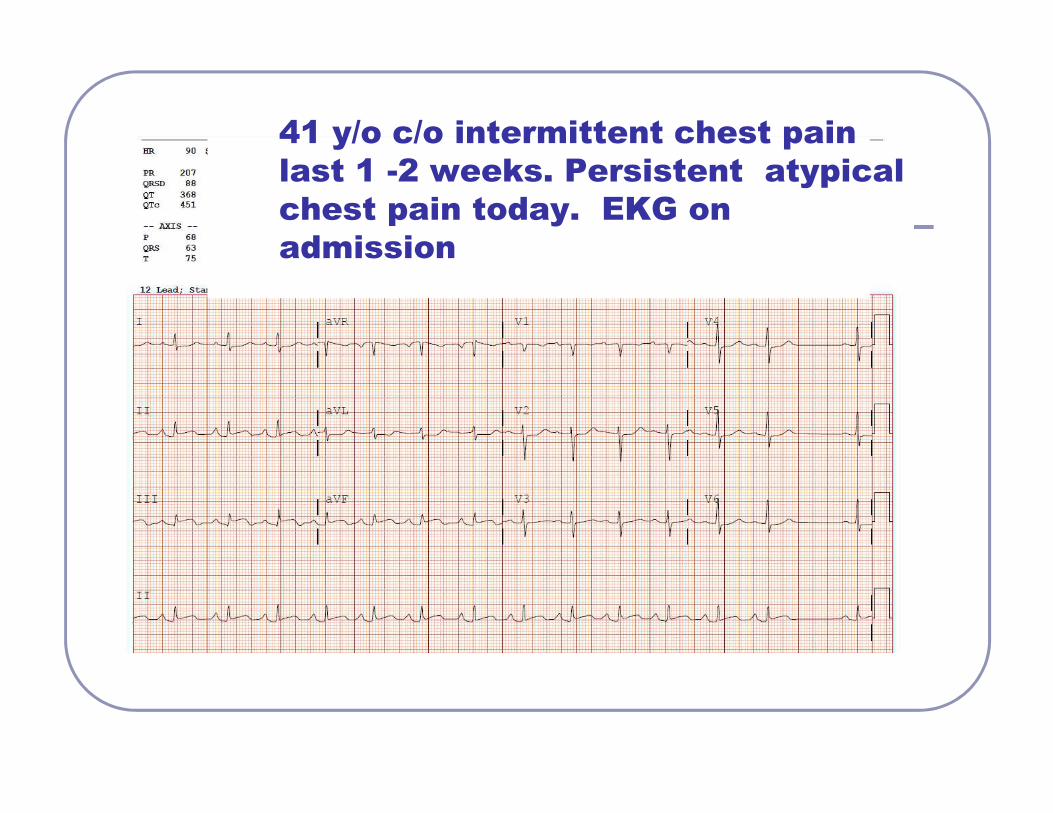
41 y/o c/o intermittent chest pain
last 1 -2 weeks. Persistent atypical
chest pain today. EKG on
admission

Right Chest and Posterior EKGRight Chest and Posterior EKG
Stent to RCA & PDA

Pattern to Read EKG
Be consistent
� Rate & Rhythm� QRS Interval V1 – for RBBB or LBBB� QT interval� Normal Depolarization – If not, why not� ST & T waves� What lead is abnormal and what other lead
goes with it� Evaluate axis� Evaluate for hypertrophy

Example & Analysis Time
Peaked T wavesT Wave inversionST DepressionST Elevation
Q wavesType of AMI
Coronary Artery Involved

A

A

B

D

48 y/o male has crushing chest pain
Calls 911
E

Top: three stenosis in RCA & post 3 stents to RCA
Bottom: Stenosis in Cx & post stent

Door to PCI time = 49 minutes
� Initial CK = 72 IU/L, CK MB = 1.0 ng/ml Troponin = < 0.4 ng/ml
� 8 hours later CK MB = 2.8 ng/ml, Troponin = 0.58 ng/ml
� 12 hours later CK MB = 3.3 ng/ml, Troponin = 0.51ng/ml

Case Study: 42 year old male comes
to ED (wife drives him)
� Came to ED due to c/o substernal burning pain that radiates up chest to both arms.
� Becomes SOB with Chest pain� Episodes last approx 10 minutes at a time.� Episodes occur more when lying flat.� Episodes have been occurring for last 4 months. � Had a negative stress test & normal GI workup.� Denies any drug use of cocaine or other medications� Quit Smoking 4 months ago. No other past medical
history� Father had some cardiac problems when he was in his
50s or 60s --- history unclear.

� Pain free on arrival to ED� Alert, Oriented� Skin Warm/dry� When laid down for EKG developed chest pain� BP 122/77, HR 87, RR 20 SpO2 99%� Chest pain 7/10� Weight: 70 kg

� This 12 Lead was done when he was lying down and complaining of chest pain on Feb 24 at 1333.
� Patient is SOB & in severe pain at the time of the EKG.� First time EKG done during chest pain F
� Chest pain resolved when sat up� BP 118/56, HR 74, RR 20

� At 1339 on 2-24 (6 minutes later), the chest pain w as gone. Pt was sitting up at the time. This is the 1 2 Lead EKG. G

� Serial troponin levels & lipid levels ordered� Troponin < 0.4 ng/ml� CK = 71� Total Cholesterol = 161� Triglycerides = 66� HDL = 35� LDL = 113

� Called cardiologist� 1st EKG STEMI that resolved after a few
minutes.� Admit patient to CVICU. Started on
ASA, plavix, heparin drip, nitroglycerin drip, and lopressor
� Hold cardiac cath for now as pain free with normal EKG

Cardiac Cath Feb 25
Initial Injection of RCA
70% Occlusion

Cardiac Cath Feb 25
RCA after administration of
Intracoronary Nitroglycerin
10 % Occlusion after NTG

Management
� Diltiazem 180 mg � Nitroglycerin 0.4 mg Transdermal patch.
Apply at bedtime and remove at 10 am.� Two days later, stated, “ I am finally
sleeping at night!”� Discharged with
• Diltiazem 180 mg daily • Nitroglycerin 0.4 mg Transdermal patch at HS