Embed Size (px)
Citation preview
www.pca.state.mn.us
Minnesota Pollution Control Agency 651-296-6300 | 800-657-3864 or use your preferred relay service | [email protected]
March 2017 | c-prp7-01 Available in alternative formats
Corrective action design and implementation Petroleum Remediation Program This document describes the process for obtaining Minnesota Pollution Control Agency (MPCA) corrective action design (CAD) approval at petroleum release sites and provides technical information to support the approval process, from design through implementation. See Risk Evaluation and Site Management Decision at Petroleum Release Sites for information regarding when corrective action is needed.
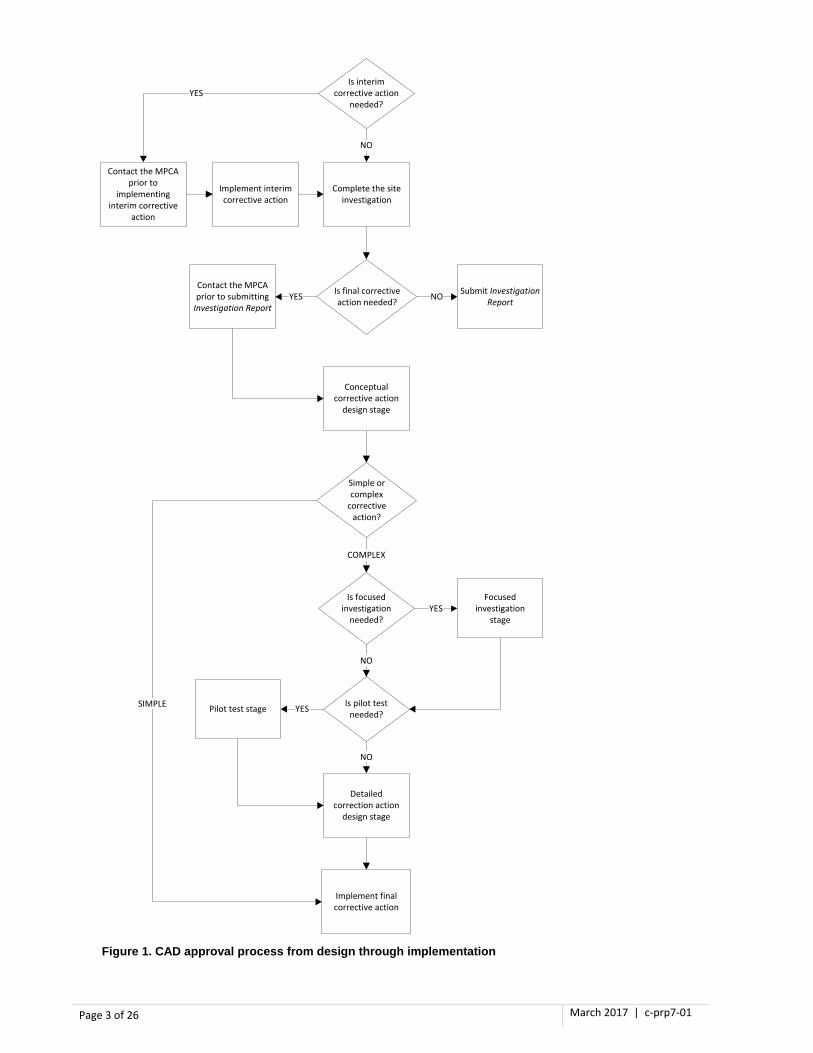
1.0 Corrective action design approval process The CAD approval process is completed in two phases: the design phase and the implementation phase. Figure 1 outlines the general CAD approval process. The design and implementation phases may be completed in one or more stages depending upon the complexity of the proposed corrective action. The approval process begins when the MPCA is notified that corrective action is needed. The process is designed to respond to site-specific conditions while focusing on the goals of permanently reducing risk and achieving site closure. Corrective action implemented before the site investigation is completed is managed as an interim corrective action, whereas a final corrective action is based on a comprehensive risk evaluation following the site investigation.
The approval process requires use of standard reports for each stage of the design phase as well as for the implementation phase for soil excavation and remediation systems (Table 1). Site-specific circumstances may require report modification or use of non-standard reporting requirements. Where applicable, reports are referenced in Section 3 to identify which report the information or requirement applies to. CAD reports are also used to document additional site investigation, site monitoring, and interim corrective actions completed throughout the approval process rather than in a separate report, such as the Monitoring Report. Each CAD report integrates several features of the Monitoring Report for documenting these activities. Additional instructions and requirements can be found in the reports.
Table 1. Standard corrective action design approval reports Design phase Conceptual Corrective Action Design Report (CCAD) Focused Investigation Work Plan Focused Investigation Report Pilot Test Work Plan Pilot Test Report Remediation System Detailed Corrective Action Design Report (SDCAD) Excavation Detailed Corrective Action Design Report (EDCAD)
Implementation phase Corrective Action Excavation Report Remediation System Operation Monitoring Report (RSOM)
Page 2 of 26 March 2017 | c-prp7-01
1.1 Interim corrective action Emergency sites and some high-priority sites require immediate corrective action that is implemented before the site investigation and risk evaluation are completed and, therefore, is managed as an interim corrective action. The MPCA must be notified as soon as possible when immediate corrective action is necessary. An interim corrective action is typically initiated as soon as the MPCA is notified and may be approved and implemented under the MPCA’s Emergency Response Program before the site is transferred to the PRP. Interim corrective actions are managed on a case-by-case basis, with implementation reporting requirements determined accordingly. See the Petroleum Release Reporting and Response Guide for additional information regarding the need for immediate corrective action.
Typical examples of interim corrective actions include manual or passive light non-aqueous phase liquid (LNAPL) recovery, bottled water supply, point-of-use or point-of-entry potable water treatment, building ventilation, sub-slab depressurization, and other active or passive interceptor or barrier methods. An interim corrective action is driven by site-specific circumstances and may include more aggressive actions such as remediation systems and soil excavation.
Interim corrective action may only address an immediate and obvious risk and may not result in permanent or comprehensive risk reduction. All risks must be addressed and permanent and comprehensive risk reduction achieved before site closure can be granted. If the subsequent site investigation and risk evaluation indicate that additional or more aggressive corrective action is necessary, a final corrective action is required. If an ongoing interim corrective action can be considered a final corrective action, submit the Conceptual Corrective Action Design Report (CCAD) to document this approach and to obtain MPCA approval. If an interim corrective action is proposed to continue during the implementation phase of a final corrective action (i.e., after CAD approval), it will be considered part of the final corrective action.
1.2 Final corrective action A final corrective action is proposed upon completion of the site investigation and risk evaluation and addresses all high risks. Final corrective actions are initiated by completing a CCAD. The consultant must contact the MPCA prior to CCAD preparation to discuss the conceptual approach, approval and implementation process, and management scenario. Depending on the nature of the proposed corrective action, a final corrective action will be managed as either a simple corrective action or a complex corrective action.
In general, a final corrective action focuses on one primary corrective action approach. There may be times, however, when complementary actions are taken in addition to the primary approach to achieve permanent risk reduction. The management of complementary corrective actions within the framework of final corrective action approval is described in Section 3.14.
Page 3 of 26 March 2017 | c-prp7-01
Figure 1. CAD approval process from design through implementation
Focused investigation
stage
Pilot test stage
Detailed correction action
design stage
Implement interim corrective action
Conceptual corrective action
design stage
Implement final corrective action
Is pilot test needed?
Is focused investigation
needed?
Simple or complex
corrective action?
COMPLEX
YES
NO
NO
YESSIMPLE
Is interim corrective action
needed?
Complete the site investigation
NO
Is final corrective action needed?
Submit Investigation ReportNO
Contact the MPCA prior to submitting
Investigation ReportYES
Contact the MPCA prior to
implementing interim corrective
action
YES
Page 4 of 26 March 2017 | c-prp7-01
1.2.1 Simple corrective action A simple corrective action is intended to eliminate high risks in a straightforward manner, usually resulting in site closure. Examples of simple corrective actions include contaminated surface soil excavation and treatment, water supply well replacement with municipal water connection, and manual or passive LNAPL recovery. A simple corrective action only requires submittal of a CCAD. Provide sufficient information in the CCAD to allow for MPCA approval. A simple corrective action usually involves one corrective action, but multiple corrective actions can be proposed provided they do not meet the criteria of a complex corrective action.
1.2.2 Complex corrective action A complex corrective action requires collecting and evaluating more detailed information prior to preparing a detailed corrective action design report (DCAD). Examples of complex corrective actions include remediation systems, stimulated biodegradation, in situ chemical oxidation injection, subsurface LNAPL body excavation, and combined approaches. Because of the increased complexity in design and implementation of a complex corrective action, technical and economic feasibility are carefully considered during the design phase. The following sequential design stages will generally precede MPCA approval of complex corrective actions:
1. Conceptual corrective action design 2. Focused investigation 3. Pilot test 4. Detailed corrective action design
For a complex corrective action, the design phase begins after CCAD review. The design phase ends and the implementation phase begins upon CAD approval, which typically will be granted after DCAD review. The need for a focused investigation, pilot test, or other limited field-testing will be determined and requested on a site-specific basis.
2.0 Corrective action implementation
2.1 General implementation requirements Typically, the MPCA will approve a simple corrective action after review of a CCAD. A complex corrective action will usually be approved only after review of a DCAD. The CAD can be implemented upon MPCA approval. Following implementation, submit a report documenting the results, conclusions, and recommendations. The report format and submittal schedule will depend on the type of corrective action approved.
2.2 Remediation systems The implementation phase for remediation systems consists of the following sequential stages:
1. Installation 2. Operation 3. Post-shutdown monitoring 4. Dismantlement
Following completion of system startup, submit the Remediation System Operation Monitoring Report (RSOM) within 30 days to notify the MPCA of system installation and startup. Submit subsequent RSOMs on a quarterly basis until the system is shut down and all operation monitoring results are reported. A successful system should achieve its corrective action objectives and be shut down within two years of system startup. Systems that do not accomplish their objectives within two years may be subjected to shutdown. System performance will be evaluated on system efficiency and system effectiveness, which includes evidence of active project management by the technical lead. Specific details regarding corrective action objectives, system efficiency, system effectiveness, and active project management are discussed in Section 3.
Page 5 of 26 March 2017 | c-prp7-01
3.0 Technical information to support corrective action design and implementation This section provides detailed information for important aspects of the CAD approval process and is intended to assist in completing approval requirements. The purpose of this section is two-fold. First, it is meant to clarify concepts or explain the reasoning behind a requirement. Second, it details the expectations of design and reporting requirements.
3.1 Corrective action goals Corrective action goals are based on the high-risk conditions that drive the need for corrective action. High-risk conditions are listed in Risk Evaluation and Site Management Decision at Petroleum Release Sites. The corrective action goal focuses on identifying the site conditions that will demonstrate permanent risk reduction relative to the high-risk condition. Corrective action goals are presented below for specific pathways and conditions, along with examples of potential corrective actions. The corrective action examples are not comprehensive nor include details specific to their approval.
3.1.1 Water supply well The corrective action goal is to provide water that meets applicable standards for the intended use (e.g., drinking, industrial, irrigation). This may be accomplished by eliminating the contaminant exposure pathway, such as installing a new well in an uncontaminated area, or by remediating the contaminant source (i.e., LNAPL body) such that the existing water supply no longer exceeds any standards or an imminent impact is abated.
3.1.2 Water line permeation The corrective action goal is to provide water that meets applicable standards for the intended use (e.g., drinking, industrial, irrigation). This may be accomplished by replacing impacted lines with nonpermeable materials or by rerouting impacted lines outside of contaminated areas.
3.1.3 Expanding groundwater plume within a five-year travel time of a well The corrective action goal is to stabilize the groundwater plume. This may be accomplished by remediating the contaminant source to achieve stability. If a single receptor is the cause of the high-risk condition, eliminating the contaminant exposure pathway may be considered. Eliminating the pathway, however, does not eliminate the need to monitor, and possibly mitigate, the expanding plume.
3.1.4 Sensitive groundwater condition with aquifer impacts above standards The corrective action goal is to hasten natural attenuation of the plume to shorten the lifetime of groundwater impacts to the aquifer. This may be accomplished by remediating the contaminant source to the extent practicable.
3.1.5 Surface water The corrective action goal is to eliminate long-term discharge to the surface water body above surface water standards. When the surface water impact occurs via groundwater plume discharge, the goal may be accomplished by remediating the source of contamination to the point where natural attenuation is hastened and the plume is shrinking based on decreasing contaminant concentrations at the compliance point. When the surface water impact occurs via a conduit such as a storm sewer line, the goal may be accomplished by replacement or in situ repair of the leaking line.
3.1.6 Explosive vapors The corrective action goal is to eliminate actual or potential explosive vapor concentrations. This may be accomplished by remediating the source of vapors to the point where unsafe levels will not occur. In the case of a leaky storm sewer, the goal may be accomplished by replacement or in situ repair of the sewer line.

Page 6 of 26 March 2017 | c-prp7-01
3.1.7 Vapor intrusion The corrective action goal is to eliminate actual or potential vapor concentrations above intrusion screening values inside a habitable structure. This may be accomplished by eliminating the contaminant exposure pathway, such as installing a sub-slab depressurization system, or by remediating the source of vapors to the point where unsafe levels will not occur.
3.1.8 Surface soil The corrective goal is to eliminate exposure to contaminated surface soil. This typically involves excavation of the contaminated soil and backfilling with clean soil to the original surface grade. Other corrective action options may be considered, such as capping, if shown to be cost effective.
3.1.9 Mobile and migrating LNAPL The corrective action goal for mobile LNAPL is to recover it to the maximum extent practicable as described in Light Non-Aqueous Phase Liquid Management Strategy. If another high-risk condition requires remediation, the mobile LNAPL corrective goal may be superseded or encompassed by another corrective action goal. The corrective action goal for migrating LNAPL is to recover or remediate to the point where migration is no longer occurring under existing conditions.
3.2 Corrective action objectives Corrective action objectives define how the corrective action goal will be met such that permanent risk reduction can be achieved. Corrective action objectives may focus on directly eliminating the contaminant exposure pathway, such as replacing an impacted water supply well, or remediating the source of contaminants that pose the risk to the receptor. When remediation is being considered as the corrective action alternative, the cleanup must focus on targeting the LNAPL body and must be technically feasible. A corrective action may have a single objective such as excavating contaminated surface soil or, in the case of a remediation system, may have numerous objectives such as subsurface response to pumping, contaminant mass removal, and contaminant concentration reduction at specific compliance points. Corrective action objectives are measurable so they can be used to evaluate progress toward meeting the corrective action goal.
3.3 Consultant staff experience Starting at the conceptual design stage, the corrective action approach should be evaluated by a consultant familiar with the conceptual site model and high-risk condition and experienced with the corrective action alternatives being proposed. A qualified consulting firm should have experience in designing and implementing a complex corrective action that is appropriate for the site conditions and should not propose a specific corrective action solely on the basis that it is an approach or technology within that firm’s experience.
If a consultant relies on past experience as a rationale for a specific design aspect or for taking specific actions while implementing a complex corrective action, provide documentation of those specific experiences in sufficient detail to allow the MPCA to determine its relevance and applicability to the proposed corrective action.
3.4 Life-cycle cost estimates A life-cycle cost estimate is an estimate of all project costs that will be incurred during design and implementation of a final corrective action, including costs for any ongoing interim corrective action, complementary corrective actions, site investigation, and site monitoring. A qualified consulting firm experienced in designing and implementing the proposed corrective action alternatives should have direct knowledge of approximate costs or other practical sources (e.g., potential subcontractors and service providers) of preliminary cost information such that reasonably accurate cost estimates can be prepared within a reasonable amount of time and effort. Cost estimates should be based on the most likely scenario of events using present-day costs; do not include contingent costs for unanticipated events. It is not
Page 7 of 26 March 2017 | c-prp7-01
necessary to prepare detailed specifications or solicit formal bids when preparing cost estimates. Document the assumptions, including sources of cost information, that have a major effect on costs to support the estimates for each corrective action alternative.
Present cost estimates following these guidelines: Break out costs over time by the major activities completed during each stage for both design and implementation phases. Distinguish major activity costs by factors such as consultant, subcontractors, equipment vendors, and other services such as utilities, laboratory analyses, or waste disposal fees. Appendix A contains an example format showing how costs are broken out over time for the major activities associated with the focused investigation stage of the design phase. This format can be extended to include subsequent design and implementation stages. As shown in Appendix A, assume the MPCA will respond to work plans and reports within 60 days when estimating costs to be incurred over the life of the project.
The initial cost estimate for the selected corrective action alternative is updated in the pilot test and detailed design stages. When updating the selected alternative’s initial cost estimate, the format must be consistent with the estimate presented in the CCAD. Replace estimated costs with incurred costs as the design phase progresses and update estimated implementation phase costs as needed. If focused investigation and pilot test results affect the assumptions made when preparing initial estimates for the non-selected alternatives, describe how the assumptions are affected in the Focused Investigation Report and the Pilot Test Report. The MPCA may request updated cost estimates for non-selected alternatives to assure that the selected alternative is still the most cost-effective option.
Throughout the CAD approval process, the MPCA will request additional work or provide CAD approval based on reports that may include cost estimates; however, MPCA requests and approvals are not the same as cost proposal approval for purposes of Petrofund reimbursement. Only Petrofund has the authority to review and approve cost proposals for work to be completed after a site investigation is completed, including final corrective action.
3.5 Cost-effectiveness evaluation Cost effectiveness is evaluated by comparing life-cycle cost estimates for several corrective action alternatives in relation to their probability of meeting the corrective action goal within a reasonable time frame. The evaluation may need to address geology, contaminant type and phases, migration pathways, and potential receptors. In the CCAD, initial cost estimates are compared to help select the proposed alternative. This initial evaluation is an important factor in most complex corrective actions when selecting the proposed alternative.
For complex corrective actions that require pilot testing, an updated cost estimate is compared to the initial cost estimate to determine if the selected alternative is still cost effective after factoring in pilot test results. In a DCAD, cost effectiveness is re-evaluated by comparing an updated cost estimate based on the proposed detailed design to the initial cost estimates of all alternatives presented in the CCAD. In some cases, initial estimates for non-selected alternatives may be updated so that cost estimates are more comparable and the re-evaluation more meaningful. After a complex corrective action is implemented, overall corrective action effectiveness may be evaluated by comparing actual implementation costs to estimated costs, particularly when the selected alternative is a remediation system or is composed of multiple events implemented over an extended period.
3.6 Corrective action feasibility Corrective action feasibility refers to the likelihood of a corrective action to achieve the corrective action goal within a reasonable amount of time and cost. Feasibility reflects a corrective action’s technical and economic capability. Technical feasibility is the physical capability of a corrective action to achieve the corrective action goal. Economic feasibility is the ability of a technically feasible corrective action to achieve the corrective action goal within a reasonable cost compared to other alternatives. Economic feasibility is determined through a cost-effectiveness evaluation.
Page 8 of 26 March 2017 | c-prp7-01
For simple corrective actions, the approach is usually technically and economically straightforward such that alternatives do not need to be considered. For complex corrective actions, technical and economic feasibility may be evaluated during pilot testing. In the case of a remediation system, if the system is technically feasible but not economically feasible, then the system is not feasible. It is acceptable to come to a conclusion that a full-scale system is not feasible after pilot testing or during the detailed design stage.
3.7 Conceptual site model update Evaluate the most recent investigation and monitoring data to determine if they are consistent with the current conceptual site model (CSM) and whether they affect the need for the proposed corrective action or alter the corrective action goal or objectives. Contact the MPCA to discuss any changes to the CSM prior to preparing a CAD report. The CAD reports require an updated CSM that integrates all investigation data as it relates to current site conditions. The updated CSM provides the basis for defining the high-risk condition and identifying corrective action objectives that will be used to evaluate progress toward meeting the corrective action goal and achieving site closure. Update the CSM as necessary to include newly acquired data, such as focused investigation or recent groundwater monitoring results, and to reflect any modifications to the understanding of the site, including evidence for natural attenuation. The level of detail required for the CSM depends upon the complexity of the site conditions, the risk scenario, the corrective action being proposed, and the corrective action objectives. See Soil and Groundwater Investigations Performed During Site Investigations for more information regarding the CSM purpose and requirements.
3.8 Conceptual corrective action design stage The Conceptual Corrective Action Design Report (CCAD) has two main purposes:
1. To document the corrective action scope and goal; and
2. To provide measurable corrective action objectives.
The corrective action scope and goal must be applicable to the high-risk condition, site conditions, and corrective action method’s capabilities and limitations. The corrective action objectives must be measurable so that progress and completion can be evaluated.
When assessing the corrective action approach at this stage, consider only those corrective action alternatives thought to have a high probability of accomplishing the goal within a reasonable amount of time. In some cases, it may be obvious what corrective action is needed and alternatives do not need to be considered.
CCAD responses should be concise, requiring only a paragraph or two of text in most cases. In the case of a simple corrective action, provide sufficient detail for the MPCA to approve implementation. Depending on the type of proposed corrective action, the MPCA will respond to a CCAD with CAD approval (for simple corrective actions), CCAD modification requirements, or a request for more work. For complex corrective actions, the MPCA will request more work such as a focused investigation, pilot test, or preparation of a DCAD.
When a remediation system is proposed in the CCAD, basic information about the proposed system is required, which will require more time and consideration than a simple corrective action at this stage. The conceptual design presented in the CCAD provides criteria for evaluating system feasibility with respect to other alternatives considered in the cost-effectiveness evaluation and to accomplishing the corrective action goal within a reasonable amount of time and cost. A focused investigation or pilot test may result in modification or abandonment of the conceptual design, which will require re-evaluation of system feasibility in subsequent design stages.
3.9 Technical lead For complex corrective actions, the technical lead will be responsible for the oversight of the design and implementation of the proposed corrective action, including CCAD preparation and preparation of all subsequent corrective action design and implementation reports. The technical lead should be
Page 9 of 26 March 2017 | c-prp7-01
knowledgeable of the CSM and have experience with the specific type of complex corrective action being proposed.
3.10 Remediation strategy The remediation strategy refers to the subsurface physical, chemical, and biological processes that a selected remediation technology is trying to influence and how those processes are used in a planned manner to remove or treat contaminants in their targeted in situ phases. Typical processes consist of: 1) hydraulic or pneumatic effects, 2) contaminant mass removal or elimination, and 3) enhancement of natural attenuation. The remediation strategy is the basis for the design of a remediation system and for the approach under which it is operated.
Refinement of the remediation strategy may occur throughout the design phase based on data collected through a focused investigation and/or pilot test. For example, following a focused investigation, the remediation strategy can be better defined for addressing a target zone in terms of the interrelated subsurface physical (e.g., capture, control, area of effective influence, transport), chemical (e.g., chemicals-of-concern (COC) phase changes, chemical reactions), and biological (e.g., biodegradation) processes that the remediation system will employ or affect to improve subsurface conditions and reduce risk. These processes are generally rate-limited and the rates at which some processes occur are dependent on the magnitude and rates of other processes. In other words, a remediation strategy must describe each process the remediation system is designed to control or affect while also describing how all the processes work together synergistically, both concurrently and/or sequentially, over time to accomplish permanent risk reduction. The remediation strategy must also incorporate risk reduction aspects of other complementary corrective actions.
3.11 Focused investigation stage The initial site investigation for determining the extent and magnitude of contamination often does not yield adequate data to design a complex corrective action. Complex corrective actions require a detailed understanding of site geology, groundwater occurrence and behavior, contaminant migration pathways, subsurface contaminant phase occurrence and behavior, and risk scenario; therefore, a focused investigation may be required before a pilot test can be planned or a DCAD can be prepared. A focused investigation is generally proposed in a CCAD and is intended to collect physical, chemical, and biological data necessary to advance the design of the proposed corrective action and/or support design of a pilot test. A focused investigation is completed in three sequential steps: preparing the Focused Investigation Work Plan, completing the investigation, and reporting the results in the Focused Investigation Report.
A focused investigation may focus on one or multiple aspects of the conceptual site model, such as delineating the target zone (see Section 3.12) or collecting soil samples for determining the suitability of in situ chemical oxidation. There are a variety of methods such as standard sampling and analysis, geophysical, and bench-scale testing that can be used to supplement and enhance the initial site investigation for the purpose of corrective action design. The key requirement is that the method employed provides the necessary information to continue detailed design of the proposed corrective action.
A focused investigation is often necessary to provide a detailed understanding of one or more of the four subsurface petroleum contaminant phases (non-aqueous, aqueous, vapor, adsorbed). Of the four phases, it is usually most important to understand the three-dimensional occurrence and behavior of the LNAPL. Targeting the LNAPL body is necessary when permanent risk reduction via source remediation is a corrective action goal. The spatial distribution of LNAPL is often complex, especially if heterogeneous lithology, soil structure, or stratigraphy is present. Therefore, it is important to have a detailed understanding of the geology relative to the targeted contaminant phase. This knowledge is critical for the design and construction of remediation system extraction, injection, or monitoring points to focus remediation efforts and quickly reduce COC concentrations specific to the LNAPL body. Moreover, in some complex settings, each remediation well must be designed and constructed so as to be adaptive to location-specific data integrated with an overall conceptual site model rather than designing an entire remediation well field with a singular, one-size-fits-all approach. If the objective of the focused investigation is to refine understanding
Page 10 of 26 March 2017 | c-prp7-01
of occurrence and distribution of selected contaminant phases, then describe and map these phases and illustrate them in cross sections to show three-dimensional distribution.
In Appendix B, examples of two common geophysical methods are provided to demonstrate their applicability and requirements when used for a focused investigation as well as to describe how the results are presented to advance the design of a complex corrective action. These two methods are not required at every site nor are they the only methods available; however, the concepts presented in the appendix can be applied to other focused investigation methods in terms of data evaluation and presentation.
3.12 Target zone The target zone refers to the targeted contaminant phase that remediation efforts are focused on with respect to its spatial location and geologic setting. Target-zone identification and characterization is usually completed through a focused investigation, with the primary products being detailed maps and cross sections showing the geometry, geology, and hydrogeology of the target zone. The chosen remediation technology must be able to control the intended subsurface processes for remediating the target zone. Physical access to the target zone can have profound feasibility implications for any chosen technology, including source-area excavation and in situ remediation; therefore, consideration of the target zone and corrective action alternatives occurs during the conceptual design stage to identify any deficiencies in the conceptual site model that need to be addressed to advance the design of the proposed corrective action.
In addition to identifying the spatial location of the targeted contaminant phase, target-zone characterization will include a description of the geology and hydrogeology within and immediately surrounding the target zone relevant to the remediation strategy. Maps and cross-sections will be used to show the geometry of the targeted contaminant phase superimposed with the geology and hydrogeology across the target zone. Target-zone geology refers to the subsurface conditions including lithology; lithologic structure (e.g., primary and secondary porosity); stratigraphy; geologic structure; facies changes; and, as applicable, the hydraulic and pneumatic properties of different stratigraphic units. Target-zone hydrogeology refers to the site hydrogeology, including groundwater occurrence; hydraulically confined or unconfined conditions; minimum, maximum, and average groundwater depths and elevations; fluctuation patterns (e.g., seasonal); flow directions; and background chemistry.
Remediation systems must focus on a well-defined target zone. During the design phase, describe the target zone in terms of the targeted contaminant phase’s relevant physical (e.g., LNAPL density and viscosity) and chemical (e.g., LNAPL composition in terms of COCs) properties. If relevant to the remediation strategy, describe evidence regarding natural attenuation of the COCs, including COC partitioning rates out of the LNAPL under prevailing environmental conditions. If aqueous-phase COC biodegradation is relevant to the remediation strategy, describe the aerobic and anaerobic biodegradation zones.
3.13 Pilot test stage For complex corrective actions, additional design stages are usually required, in part, to evaluate technical feasibility, such as pilot testing of an in situ remediation technology. A pilot test is completed to determine if a proposed technology will be technically feasible and, if so, determine whether it will be economically feasible when implemented on a full scale. The following discussion focuses on remediation system pilot testing, but the concepts presented here can be applied to other remediation technologies.
As one of the overall remediation system pilot test objectives, a technical feasibility evaluation focuses on three general questions. First, does the technology correctly address the target zone? Second, will the technology be able to achieve the intended subsurface response across the target zone? Third, can the technology handle and, if necessary, treat recovered wastes to meet any disposal, emission, or discharge limitations and full-scale system efficiency goals?
In the Pilot Test Work Plan, consultants must describe the criteria that will be used to determine if the technology is technically feasible once, the pilot test is completed. If more than one technology is to be tested, criteria must be described for each. Technical feasibility criteria may be general or specific and can be of a pass or fail nature depending on the technology, operation strategy, and site-specific circumstances.
Page 11 of 26 March 2017 | c-prp7-01
Subsurface response criteria are technology dependent but typically include physical responses such as pneumatic or hydraulic effects and contaminant mass removal rates. For example, one of the subsurface response criteria for soil vapor extraction (SVE) could simply be that subsurface airflow is induced in the target zone. However, if access to the target zone is limited due to surface obstructions such as a building or a road, the subsurface response criterion could be that subsurface airflow is induced at a distance of 40 feet from an extraction point. An example of a subsurface response criterion for a vacuum-enhanced extraction strategy is to dewater below the base of the LNAPL body.
Waste stream criteria may encompass handling, disposal, and treatment. The criteria must take into account expected full-scale system waste volumes, contaminant concentrations, and likely limitations. For example, if wastewater discharge from the full-scale system will be subject to National Pollutant Discharge Elimination System permit requirements, evaluate the ability of the treatment technology to meet these requirements during the pilot test.
Evaluating technical feasibility is an exercise in confirming the validity of assumptions used when completing the CCAD. It is important to distinguish fatal flaws from minor flaws that can be accommodated in the final design. If the pilot test does not demonstrate technical feasibility, alternative corrective action approaches must be considered.
For a system to be technically feasible, the pilot test needs to demonstrate capability in influencing the intended subsurface processes for remediating the target zone. These processes are primarily physical and chemical, but they may also be biological, and are measured over distance and time during a pilot test in terms of the induced subsurface response. The subsurface response can be expected to decrease with increasing distance from a remediation point while stabilizing at a given monitoring point over time under prevailing operating conditions. If the system will generate wastes, additional data must be collected to evaluate technical feasibility of waste treatment.
A pilot test is completed in three sequential steps: preparing the Pilot Test Work Plan, completing the test, and reporting the results in the Pilot Test Report. Evaluate major technological assumptions identified in the CCAD during the pilot test. Conduct the pilot test with equipment and in a configuration and location consistent with that envisioned for the full-scale system. Pilot testing is usually conducted over three distinct periods: pre-system operation, system operation, and post-system operation, referred to as baseline, system operation, and rebound, respectively. Baseline and rebound monitoring are used to evaluate the extent and magnitude of changes due to controlled and documented operation of the system versus changes due to natural or other background conditions.
During the system operation period, the test may be completed in stages if a combination of technologies is proposed or a given technology needs to be tested in more than one configuration or location. For example, testing SVE in combination with air sparging (AS) can consist of at least two stages, whereby SVE is first independently tested followed by an independent AS test. Operating the SVE and AS systems concurrently would constitute another stage. Varying topography, varying contaminant-phase geometry or characteristics, geologic heterogeneity, physical accessibility, or the need to measure pneumatic or hydraulic interferences between wells may require testing the technology in more than one location or using multiple wells set at different depths, alone or in combination. Any major equipment or well reconfiguration is considered a separate stage of a pilot test.
In addition to multiple stages, an individual stage may be completed in steps. Typically, a step test consists of incrementally adjusting a selected variable, often flow rate, in a step-up or step-down sequence with a minimum of three incremental adjustments. A step test is conducted during a given pilot test stage, so the system configuration must not be modified during a step test. For some technologies, a step test is conducted in order to select equipment such as pumps, compressors, and blowers.
The duration of individual stages and steps is based on collecting operation-monitoring data. Data need to be collected and evaluated for each stage and step. Stage and step durations are generally dependent on the specific technology and often are based on stabilization of subsurface responses and specific operation monitoring parameters or upon achieving a predetermined measurable parameter. See Section 3.22 for more information regarding operation-monitoring data.

Page 12 of 26 March 2017 | c-prp7-01
Not including collection of baseline and rebound monitoring data, the total duration of a pilot test generally is no longer than three days. Do not operate the pilot test beyond that which is necessary to determine feasibility. Conduct the pilot test with system equipment mobilized to the site for the duration of the pilot test. After the pilot test, the equipment is usually demobilized.
If pilot test data demonstrate technical feasibility, the data are used to verify or update the assumptions used for the conceptual design presented in the CCAD. Pilot test data will be used to extrapolate and/or support full-scale design parameters such as radius of influence, equipment specifications, and waste treatment options. Pilot test data also will be used to refine the operation strategy and estimate the amount of time needed to achieve measurable performance objectives, including remediation endpoints.
3.14 Detailed corrective action design stage A DCAD is required for approval of a complex corrective action. The DCAD describes how a final corrective action will be implemented. The type of corrective action will determine which DCAD report will be used. For remediation systems and other in situ remediation technologies, the Remediation System Detailed Corrective Action Design Report (SDCAD) is completed. For source-area excavations, the Excavation Detailed Corrective Action Design Report (EDCAD) is completed. In limited cases, site-specific DCAD requirements may be necessary if neither the SDCAD nor the EDCAD is suitable, as determined by the MPCA.
Many final corrective actions have complementary corrective actions, such as limited soil excavation, water supply well replacement, engineered and institutional controls, or ongoing interim corrective action. Describe in the DCAD all complementary corrective actions so that their complementary risk reduction elements can be appropriately integrated into the remediation strategy and the system operation strategy, if applicable. DCAD approval of a final corrective action will encompass approval of any complementary corrective actions.
3.14.1 Remediation system detailed corrective action design The objectives of the SDCAD are to provide an outline of the full-scale remediation system design relative to the remediation strategy and the achievement of measurable performance objectives. Focused investigation and/or pilot test results are summarized in the SDCAD to confirm that feasibility has been carefully considered and to confirm what primary site- and technology-specific criteria have been used to complete the full-scale design. The SDCAD is not meant to be used as a document for soliciting bids from vendors and contractors.
The SDCAD is organized to provide an updated description of site conditions followed by descriptions of the remediation system equipment, how the equipment will be operated, how equipment and site conditions will be monitored during system operation, and an updated life-cycle cost estimate. The basic description of the remediation system should identify the general type of remediation system with a brief description of its basic design elements such as the type and number of remediation points, type of major equipment, and the waste types that will be generated during system operation. If multiple remediation systems are proposed to be used in combination to implement the remediation strategy, each system and associated remediation and monitoring points must be described separately in the SDCAD but integrated under one operation strategy.
Although the SDCAD is intended for describing an automated remediation system, it can be adapted for other stand-alone in situ remediation technologies such as oxidant, surfactant, or nutrient injection. The report also can be adapted for interim corrective actions.
3.14.2 Excavation detailed corrective action design Excavation of a subsurface LNAPL body is considered a complex corrective action and, therefore, sequential steps are generally required, including a CCAD and a focused investigation. Once the focused investigation is completed, an EDCAD is prepared. The EDCAD is organized to provide an updated description of site conditions, followed by a description of the purpose and goals of the correction action and the activities to be undertaken. Additional discussion of excavation of an LNAPL body can be found in Excavation of Petroleum-Contaminated Soil and Tank Removal Sampling.

Page 13 of 26 March 2017 | c-prp7-01
3.15 Remediation and monitoring points Remediation points include subsurface structures such as wells, sumps, or trenches used to focus remediation efforts such as extraction, injection, and induction directly on the target zone. Remediation points are usually connected to other system equipment. As such, the design and construction of remediation points are critical components of a remediation system.
Monitoring points include subsurface structures such as groundwater monitoring wells or soil vapor monitoring points used to monitor a remediation system’s effects on subsurface conditions such as fluid levels, pressures, and COC concentrations at various distances from the remediation points. They provide important data for evaluating system effectiveness, including key measurable objectives. Their use must be integrated into the operation strategy. Remediation system designs must include a sufficient number of strategically located and constructed monitoring points both inside and outside the target zone so that the spatial distribution and the magnitude of the physical, chemical, and biological effects of remediation can be adequately monitored. Monitoring points usually are not connected to the remediation system. Inactive remediation points are sometimes used as monitoring points on a limited basis; this situational usage must be explained. Under some remediation strategies, remediation or monitoring points may be located within structures such as basements or utilities. Most remediation system designs will require additional monitoring points beyond existing monitoring points.
Remediation and monitoring points must be designed based on the remediation strategy and spatially-specific criteria such as target-zone geometry, geology, and hydrogeology. In complex geologic settings, stratigraphy can be important for determining proper remediation point-screen settings, for example, to focus extraction, injection, or data collection on a specific stratigraphic unit or avoid short-circuiting. Collection and observation of soil samples or other methods to obtain geologic and contamination information are needed when installing remediation points at sites with complex geology. In this case, actual screen intervals may need to be determined in the field.
Full-scale system use of existing remediation points, such as pilot test wells and monitoring points and typical groundwater monitoring wells, must be carefully considered since they were likely installed without knowledge of full-scale system design criteria. What at first appears to be a simple question of economics may not turn out that way if the points cannot adequately perform their intended remediation-related purpose.
Some remediation systems require access to the in-well environment while the system is operating to measure physical and chemical parameters that cannot be directly obtained by measuring system processes between the intake and discharge points. For example, it is often necessary to measure water levels in an active groundwater pumping well or active soil vapor extraction point. Show access portals and associated appurtenances on remediation point construction diagrams.
3.15.1 Remediation and monitoring point construction diagrams Detailed construction diagrams are required for each existing and proposed remediation and monitoring point in several reports, beginning in the conceptual design phase and continuing through the detailed design phase. In addition, a remediation and monitoring point construction summary table is requested in the same reports to summarize construction details. The construction details shown in the summary table must be consistent with those shown on respective construction diagrams. Construction diagrams must conform to the following standards and requirements:
• Scale all diagrams using a common scale. • Update diagrams for existing points as needed to show proposed modifications such as installing
remediation-related equipment. • Include the following constructions details on each diagram: a unique identifier (e.g., RW1,
SVE2), Minnesota Department of Health unique number, installation date, drilling method, borehole dimensions, screen and riser material and dimensions, screen type, screen interval, screen slot size, sand pack interval, sand pack gradation, annular seal, surface completion, and elevation measurement points.

Page 14 of 26 March 2017 | c-prp7-01
• Show all remediation-related down-hole equipment, including pumps, floats, sensors, and drop tubes.
• Show all remediation-related appurtenances located at the wellhead, including wellhead sealing apparatuses, valves, gauges, access portals, and other instrumentation and control mechanisms.
• Show the layout of remediation point connections to conveyance piping or manifolds.
3.16 System equipment, process flow, and system controls System equipment includes all equipment extending from the extraction point to the point of recovery or discharge or, in the case of injection, all equipment connected to the injection point. System equipment includes all major equipment such as pumps, compressors, blowers, separators, tanks, and treatment units. In addition, wellhead and down-hole equipment such as pumps, floats, sensors, controls, and drop tubes are considered system equipment.
Process flow refers to the transfer of materials such as gases, liquids, solids, and energy (e.g., for soil heating technologies) through the system equipment from intake to discharge points. Process flow includes all points of intake, filtration, separation, dilution, storage, treatment, modification, addition, and discharge. Along the pathway, instruments are used to measure process flow and controls are used to manage process flow.
System controls are the devices used to control equipment processes and flow. Controls can take many forms and functions depending on the type of remediation system and the operation strategy. Control devices may include valves, regulators, drives, switches, timers, solenoids, sensors, pump intakes, and extraction point drop tubes, used individually or in combination. Controls may be located within or at the wellhead of a remediation point or along conveyance lines, manifolds, or on other equipment. Most automated remediation systems have both manual and automated controls. Manual controls include LNAPL skimmer intake depth, dilution valves, or remediation point drop tube depths. Automated controls include on/off floats, timer-controlled solenoid valves, or equipment shut-off sensors. Some controls may be used to modify remediation system configuration such as manifold valves used to control well-field configuration.
The culmination of equipment, flow, and controls is illustrated in a process and instrumentation diagram (P&ID), which depicts the configuration of the proposed or as-built remediation system equipment and how it is structured to convey materials from intake through discharge. The P&ID also shows the locations of system control devices, dedicated instruments, and access portals where processes and materials will be controlled, measured, and sampled. Label each piece of equipment, instrument, control device, monitoring location, and sampling point with a unique identifier to reference specific operation monitoring locations in data tables and to prevent confusion if there is more than one piece of similar equipment.
Process flow data can be used to indirectly measure subsurface responses induced by system operation, which in turn can be used to evaluate system effectiveness. For example, because in situ measurement of subsurface airflow can be difficult and problematic, it is usually measured ex situ as a component of process flow. If the system extracts air from the subsurface, an airflow meter positioned upstream of the blower and before any dilution or pressure relief valves will measure extracted subsurface airflow. This measurement, in combination with monitoring point vacuum measurements, can be used to infer subsurface airflow distribution.
3.16.1 Measuring and reporting volumetric airflow rates The volume of air expands and contracts as temperature and pressure vary, while its mass remains unchanged; therefore, volumetric airflow rates measured under different temperatures and pressures are not comparable in terms of mass balance. To compensate, convert all volumetric airflow measurements to PRP’s standard temperature and pressure conditions to yield flow rates in standard cubic feet per minute. This requires collecting concurrent and proximal temperature and pressure measurements. PRP’s standard temperature and pressure conditions are defined in Air Emission Controls and are the same conditions laboratories are required to use when converting analytical results from parts per million volume (ppmv) to mass per unit volume (µg/m3). Volumetric airflow rates and
Page 15 of 26 March 2017 | c-prp7-01
analytical results must be based on the same conditions to calculate accurate contaminant mass removal rates and for accurate air emissions risk assessment.
For SVE systems, including those used in a dual-phase extraction configuration, collect airflow measurements at the following locations:
• along the conveyance lines from each active SVE remediation point to confirm that subsurface air is being removed from all active remediation points as intended and to measure the total volume of air extracted from the subsurface
• downstream of the blower prior to atmospheric discharge or an air treatment unit in order to collect flow data that, along with COC concentration data, will be used for air emissions risk assessment and vapor phase contaminant removal calculations
• if applicable, upstream of the blower before any dilution or pressure relief valves, which along with a downstream measurement, will allow calculating dilution air volumes
For multiphase extraction systems (MPE), collect airflow measurements upstream of the blower and any dilution or pressure relief valves, but downstream of the vapor/liquid separator, to measure the total volume of air extracted from the subsurface. Airflow measurements do not need to be collected at each conveyance line.
If applicable for either SVE or MPE systems, identify dilution or pressure relief valves located upstream of the airflow measurement location, including those located at extraction point wellheads, and discuss their use relative to accurately measuring the volume of air extracted from the subsurface.
For AS systems, collect injected airflow measurements at each active air sparge point; this is especially important if there are multiple active air sparge points manifolded together so as to confirm that air is being injected at all active points as intended.
The need and methods for collecting airflow measurements at passive air induction wells, sometimes used to allow an extraction system to induct atmospheric air into the subsurface, or passive pressure relief wells, sometimes used instead of SVE during AS, will be determined on a case-by-case basis. It is not necessary to measure airflow from water treatment systems such as air strippers since the air emissions risk assessment calculations use water flow volumes.
Note that some airflow meters are calibrated at the factory for specific conditions, including the pressure and temperature of the air being measured. Calibrated conditions, though, may not coincide with operating conditions or PRP’s standardized conditions. If operating conditions do not match calibrated conditions, the measured flow rates need to be corrected to generate flow rates for calibrated conditions. Contact the equipment supplier or manufacturer to obtain the correction equations if not provided in the instrument manual. Subsequently, if calibrated conditions do not match PRP standard conditions, the corrected airflow rates need to be converted to PRP standard conditions.
3.17 Process material chemistry Process material chemistry refers to the monitoring or sampling of process flow materials (e.g., groundwater, air) from locations between intake and discharge points and, if necessary, from remediation points. Measurement of process material samples may be performed in the field and/or by off-site laboratory analysis. This includes process material monitoring and sampling to comply with waste disposal requirements and to use in mass balance calculations. This does not include chemistry data collected at monitoring points, which is included as a part of operation monitoring.
3.18 Waste generation, handling, and disposal The system operator should anticipate all the waste streams that will be generated and the regulatory conditions under which the wastes must be handled and disposed of. Waste handling is the process by which contaminated material is captured, collected, separated, conveyed, stored, treated, measured, monitored, and/or sampled prior to on- or off-site disposal. Disposal is the culmination of the waste
Page 16 of 26 March 2017 | c-prp7-01
handling process when the waste is directly discharged to the air, water, or land at or near the site or removed and transported from the site for off-site disposal.
Waste generation, handling, and disposal activities are generally subject to permitting or other regulatory requirements, including documentation of disposal activities. Most on- or near-site water discharges and air emissions from a remediation system are subject to quantity and/or quality limitations, often resulting in the need for treatment prior to disposal. Additional information about air emission controls and wastewater treatment is provided in the following guidance documents:
Air Emission Controls Discharging Contaminated Groundwater
Waste treatment equipment operation costs often represent a significant portion of overall system costs. These economic considerations, along with treatment technology limitations, can have a significant effect on the system design and operation strategy. For example, in the case of sustained high LNAPL recovery rates, it is important that the system design includes a large enough storage tank or the operation strategy includes more frequent disposal events to prevent recurrent automated tank-full shutdown. The chosen strategy must be based on cost effectiveness. In the case of extremely high initial vapor phase COC concentrations with high flow rates, it may be necessary to initially limit extracted airflow rates even though this results in longer system operation. Alternatively, multiple treatment units may be more cost effective than limiting extraction rates and extending system operation.
3.19 System installation activities Many installation-related activities include tasks that need to be completed prior to installing a remediation system. Typical installation activities include:
• Acquiring permits, approvals, and variances • Preparing bid specifications, soliciting and evaluating bids, and contracting • Ordering equipment • Obtaining Petrofund pre-approvals • Making utility arrangements • Conducting field activities such as installing remediation and monitoring points and other
equipment • Arranging for waste disposal • Testing installed equipment
If the remediation system involves groundwater pumping, it may be necessary to obtain a water appropriation permit from the Minnesota Department of Natural Resources (DNR). More information about water appropriation permits and links to applicable permit application forms can be found at the DNR’s website: http://www.dnr.state.mn.us/waters/watermgmt_section/appropriations/permits.html.
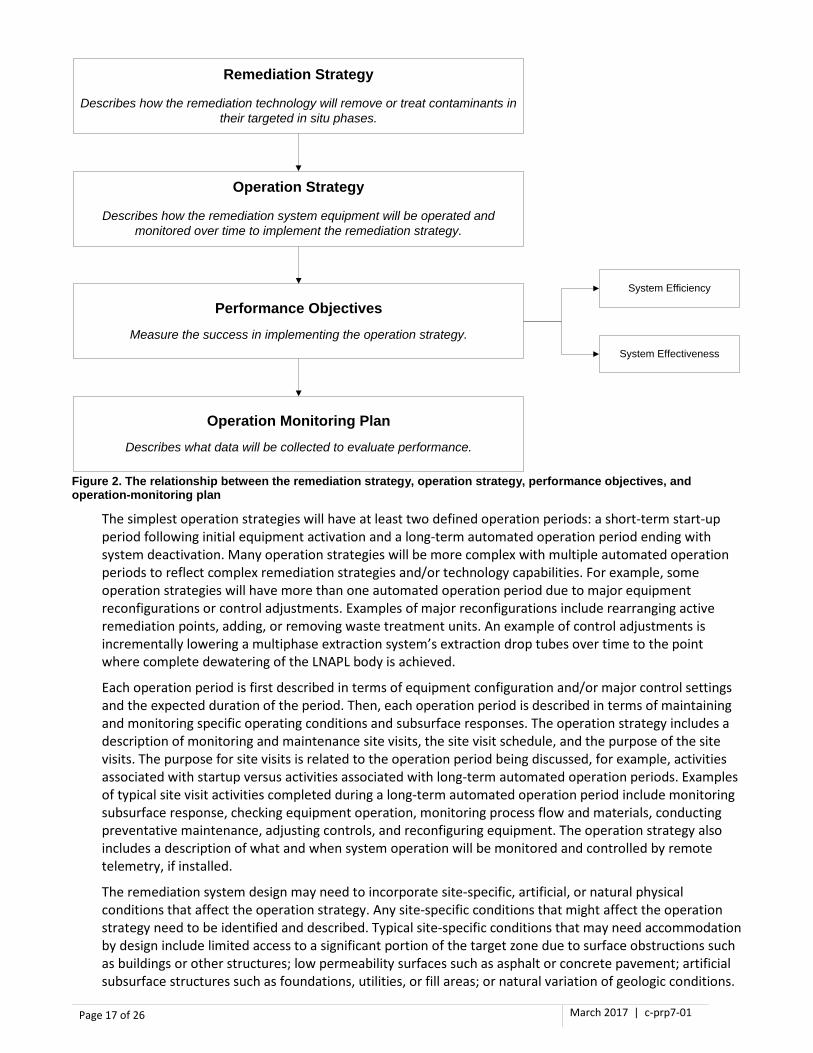
3.20 Operation strategy A remediation system is operated under a well-defined operation strategy to meet measurable performance objectives, with progress tracked and action taken through collecting and evaluating operation-monitoring data (Figure 2). The operation strategy is a comprehensive plan that describes how the remediation system equipment will be operated and monitored over time to implement the remediation strategy and to ultimately reach the remediation endpoints when the system can be deactivated. The operation strategy is organized in terms of operation periods that reflect the sequential aspects of the remediation strategy while integrating technology capabilities, regulatory requirements, and practical considerations. The operation strategy must reflect active project management principles, described in Section 3.23.
Page 17 of 26 March 2017 | c-prp7-01
Figure 2. The relationship between the remediation strategy, operation strategy, performance objectives, and operation-monitoring plan
The simplest operation strategies will have at least two defined operation periods: a short-term start-up period following initial equipment activation and a long-term automated operation period ending with system deactivation. Many operation strategies will be more complex with multiple automated operation periods to reflect complex remediation strategies and/or technology capabilities. For example, some operation strategies will have more than one automated operation period due to major equipment reconfigurations or control adjustments. Examples of major reconfigurations include rearranging active remediation points, adding, or removing waste treatment units. An example of control adjustments is incrementally lowering a multiphase extraction system’s extraction drop tubes over time to the point where complete dewatering of the LNAPL body is achieved.
Each operation period is first described in terms of equipment configuration and/or major control settings and the expected duration of the period. Then, each operation period is described in terms of maintaining and monitoring specific operating conditions and subsurface responses. The operation strategy includes a description of monitoring and maintenance site visits, the site visit schedule, and the purpose of the site visits. The purpose for site visits is related to the operation period being discussed, for example, activities associated with startup versus activities associated with long-term automated operation periods. Examples of typical site visit activities completed during a long-term automated operation period include monitoring subsurface response, checking equipment operation, monitoring process flow and materials, conducting preventative maintenance, adjusting controls, and reconfiguring equipment. The operation strategy also includes a description of what and when system operation will be monitored and controlled by remote telemetry, if installed.
The remediation system design may need to incorporate site-specific, artificial, or natural physical conditions that affect the operation strategy. Any site-specific conditions that might affect the operation strategy need to be identified and described. Typical site-specific conditions that may need accommodation by design include limited access to a significant portion of the target zone due to surface obstructions such as buildings or other structures; low permeability surfaces such as asphalt or concrete pavement; artificial subsurface structures such as foundations, utilities, or fill areas; or natural variation of geologic conditions.
Operation Strategy
Describes how the remediation system equipment will be operated andmonitored over time to implement the remediation strategy.
Performance Objectives
Measure the success in implementing the operation strategy.
Operation Monitoring Plan
Describes what data will be collected to evaluate performance.
System Effectiveness
System Efficiency
Remediation Strategy
Describes how the remediation technology will remove or treat contaminants intheir targeted in situ phases.

Page 18 of 26 March 2017 | c-prp7-01
Often, these conditions need to be accommodated due to their effects on air and/or liquid flow paths resulting in physical barriers or short-circuiting routes.
Because a proposed final corrective action may involve ongoing interim corrective actions, complementary corrective actions, additional site investigation, or site monitoring, the operation strategy discussion must include how these additional actions are integrated into the operation strategy. This includes site monitoring that may not be directly related to system operation monitoring.
Summarize the operation strategy in an operation strategy schedule. This schedule will be carried forward from the SDCAD to the RSOM where it will be used as a baseline for evaluating system effectiveness once the system begins operating.
3.21 Performance objectives Performance objectives are defined to measure success in implementing the operation strategy. Measurable performance objectives are the key operating conditions and subsurface responses expected during each operation period. There are two general types of measurable performance objectives: system efficiency and system effectiveness.
System efficiency is defined as the percent time the system is fully operational, or the percent uptime. The MPCA expects a 95% or greater system efficiency. Fully operational means all of the equipment, including remediation points, is active and functioning as planned. The amount of time the system is fully operational does not include planned downtime, such as short periods of downtime for routine system maintenance or monitoring. A certain amount of unplanned downtime may be incorporated into the efficiency objective as long as the efficiency objective remains at least 95%. System efficiency objectives are defined for each operation period. Efficiency objectives are usually calculated by dividing the amount of time (hours) the system is expected to be fully operational during a given operation period by the total amount of time in the given operation period.
System effectiveness is defined by compliance objectives and strategic objectives for each operation period. Compliance objectives are based on regulatory requirements, usually for waste disposal. Strategic objectives are based on maintaining and optimizing system processes and the progressive nature of intended subsurface responses envisioned by the remediation strategy.
Compliance objectives are defined by identifying specific regulatory requirements and describing how those requirements will be met, for example, meeting quantity and quality limitations via waste handling, waste disposal monitoring requirements, and reporting schedules.
Strategic objectives are composed of expected operating conditions and subsurface responses. The strategic objectives consider the location or extent, magnitude, and timing of progressive physical and chemical effects on the target zone. Measuring the progression of physical and chemical effects on the target zone provides the basis for responsive system operation as the operation strategy is implemented. As such, defining specific effects expected over time constitutes the most useful measurable objectives and serves as milestones for evaluating system effectiveness and managing system operation. Define strategic objectives for each operation period with accomplishment of key objectives defining the end of a given operation period.
3.21.1 Remediation endpoints Remediation endpoints are the final strategic objectives that indicate the system has successfully and fully implemented the remediation strategy in reducing risk to the extent the technology is cost effectively capable. Remediation endpoints are measurable objectives generally consisting of a combination of certain site condition and system performance criteria. As such, a remediation endpoint can be the culmination of a trend or process. Examples of site condition criteria are eliminating LNAPL or reducing aqueous-phase contaminant concentrations to a specified level at specified monitoring points. An example of system performance criterion is achieving an asymptotic contaminant mass removal rate. Upon achieving remediation endpoints, the system can be deactivated and post-shutdown monitoring initiated.

Page 19 of 26 March 2017 | c-prp7-01
3.22 Operation monitoring Once measurable performance objectives are clearly defined, a detailed operation-monitoring plan can be developed. The monitoring plan outlines the necessary data collected to evaluate performance. A monitoring plan describes how monitoring will be conducted, the data collection locations, the data collection methods and procedures, and the monitoring schedule.
Identify locations by referencing the process and instrumentation diagram (P&ID), remediation/monitoring point construction diagrams, and other applicable diagrams or drawings. Identify plans for using and integrating data acquired by remote telemetry. In addition, clearly identify other site monitoring not directly associated with the system operation-monitoring plan. The schedule for completing site monitoring should not be driven by the system operation monitoring, although it should be completed coincidental with system operation monitoring to the extent possible.
Data tables must indicate the specific location (e.g., dedicated instrument, monitoring port) where data will be collected. Use the unique identifiers provided on the P&ID for this purpose. When requested, populate example tables with example data and calculation results. The example units of measurement must be consistent with those of the measurement instrumentation. Describe all calculations, including unit conversions and those embedded within tables. Present and describe examples of data evaluation methods (e.g., graphs, maps, calculations). The description of example data evaluation methods must include how the methods yield results for evaluating progress toward and achievement of measurable performance objectives during each operation period.
Due to the “snapshot” nature of operation monitoring, evaluate data in context with the operation status of the system. Generally, subsurface condition monitoring should precede any other system operation monitoring activities. Some types of operation monitoring data, such as some process flow data, cannot be collected if the system is not operating.
System startup or restart and automated long-term operation periods are two typical but different contexts under which operation monitoring data must be evaluated. During long-term automated operation periods, it is important to capture operation-monitoring data under prevailing operating conditions prior to any system maintenance, control adjustment, equipment reconfiguration, repair, and/or restart activities. Therefore, collect operation-monitoring data prior to modifying the system or performing maintenance activities. In the case of an unexpected shutdown, some specific operation monitoring data should be collected as soon as possible upon detection of the shutdown and/or prior to restart. This includes subsurface response data (e.g., fluid levels, contaminant concentrations) if relevant for evaluating the consequences of shutdown relative to the operation strategy’s strategic objectives.
More importantly, to achieve expected operation efficiencies, restart the system as soon as possible after an unexpected shutdown is detected. After system restart, it is usually necessary to collect another round of operation monitoring data before leaving the site to confirm a successful system restart or to comply with waste disposal requirements. This short-term, post-restart data should be evaluated as such and not be construed to represent prevailing conditions under long-term automated operation. Note that you must notify the MPCA upon detecting an unplanned shutdown or other system malfunction. The notification must include identification of the problem and a schedule for taking the necessary response actions and restarting the system.
The operation-monitoring plan is summarized in an operation-monitoring schedule. The schedule must be consistent with the operation strategy. The schedule should include site visit and RSOM submittal events listed sequentially, such as Site Visit #1, Site Visit #2, Report #1, and Report #2. Identify the main reason for each event, such as system startup, routine operation and maintenance, equipment reconfiguration, system deactivation, installation report, and routine quarterly report submittal. Include a general description of the major tasks and activities to be completed during each event, such as collect baseline data, start system, troubleshoot, balance flows, adjust system, achieve nominal operating status, check system status, collect specified types of operation monitoring data, perform system maintenance, make nominal system adjustments, reconfigure equipment, submit RSOM with installation and/or operation data to MPCA, and deactivate system.

Page 20 of 26 March 2017 | c-prp7-01
3.23 Active project management Successful implementation of the operation strategy requires active project management by the technical lead. From a project management perspective, the operation strategy describes the intentions for managing system operation. Active project management means that the technical lead is reviewing operation monitoring data as they become available rather than waiting until the next report is due. The technical lead must review the operation monitoring data as soon as possible to plan and schedule necessary actions to be taken at the next scheduled monitoring and maintenance event or arrange for necessary modifications or repairs to be completed as soon as practicable. Discuss unanticipated events, such as equipment malfunctions or unexpected changes in site conditions, and the recommended response actions with the MPCA as soon as practicable, regardless of reporting deadlines. In addition, active project management means that an ineffective system with minimal prospects for achieving remediation endpoints is detected as soon as possible. In most cases, an ineffective system should be shut down, with the technical lead formulating and evaluating alternatives and recommending a different approach.
3.24 Operation monitoring reporting The RSOM assumes that the SDCAD contains a comprehensive operation strategy and operation-monitoring plan. The RSOM further assumes that the operation-monitoring plan describes what data will be collected, with specific descriptions and examples (source documents, tables, figures, calculations) of how the data will be presented and evaluated in the RSOM. The operation monitoring data are used to determine the extent to which the operation strategy has been implemented as of the ending date of an RSOM reporting period.
Each RSOM should be as up to date as possible. For example, do not omit process flow measurement data collected during the final system operation-monitoring event of an RSOM reporting period because the laboratory report for an associated sampling event is unavailable. Include unavailable data in the subsequent RSOM and integrate into the data evaluation presented in that RSOM.
3.24.1 Event tracking table The event-tracking table is a table listing all site visits and operation monitoring events beginning with system startup and concluding with post-shutdown monitoring. Summarize the type of event under event description. Typical event descriptions include consultant site visits, consultant telemetry (if telemetry was used to acquire system operating monitoring data or adjust the system), and other party (e.g. responsible party, site occupant, contractor) system checks. Summarize activities completed during a given event in the order they were completed. Examples of general activities completed while the system is operating include monitoring subsurface response, monitoring equipment operation, monitoring process flow and materials, sampling process materials, preventative maintenance, equipment repair or replacement, control adjustments, and equipment reconfiguration. Activities summaries must be specific to the completed tasks, for example, subsurface response monitoring at monitoring points MW1, MW2, and MW3; airflow measurements at flow meters FM1, FM2 and FM3; and water treatment system influent and effluent sample collection at SP1 and SP2. Although this table’s primary purpose is to track operation monitoring events and associated activities, other site activities completed during an operation-monitoring event should also be summarized in the table. These activities might include additional site investigation and site monitoring not directly associated with operation monitoring, complementary corrective actions, and post-shutdown monitoring.

Page 21 of 26 March 2017 | c-prp7-01
4.0 Glossary Complex corrective action: A final corrective action requiring a more rigorous approval process than a simple corrective action because a complex corrective action has multiple design stages and a potentially longer implementation phase.
Compliance objectives: Performance objectives relative to meeting regulatory requirements for waste disposal.
Corrective action goal: The site conditions that will demonstrate permanent risk reduction relative to the high-risk condition(s).
Corrective action objectives: Measurable outcomes that can be used to show progress toward the corrective action goal and completion of the corrective action.
Cost-effectiveness evaluation: An evaluation that compares life-cycle cost estimates of several corrective action alternatives or updated cost estimates to initial estimates in relation to their probability of meeting the corrective action goal within a reasonable time frame.
Economic feasibility: An evaluation of a technically feasible corrective action’s ability to accomplish the corrective action goal within a reasonable cost in comparison to alternative corrective actions.
Final corrective action: A corrective action implemented after the site investigation and risk evaluation are completed that addresses all high risks. A final corrective action may be completed with a single action or a combination of actions addressing one or more receptors.
Focused investigation: Investigation completed after the initial site investigation to obtain more detailed information to advance the design of a complex corrective action.
Interim corrective action: A corrective action typically implemented before the site investigation and risk evaluation are completed to address an emergency situation or a situation requiring immediate action.
Life-cycle costs: Total costs for a corrective action from design through implementation.
Operation monitoring data: Data collected during operation of a remediation system used to evaluate performance and assess progress toward meeting performance objectives.
Operation monitoring plan: A plan that describes operation monitoring data collection based on a remediation system’s performance objectives.
Operation strategy: A planned approach for operating a remediation system based on the remediation strategy to achieve the corrective action objectives.
Performance objectives: Corrective action objectives used to evaluate success in implementing the operation strategy for a remediation system.
Pilot test: Procedures used to evaluate a proposed remediation system’s technical feasibility, economic feasibility, and extrapolate full-scale system design parameters. In some cases, pilot tests may be required for non-mechanical remediation system technologies such as in situ chemical oxidation and stimulated biodegradation.
Process flow: Process flow refers to the transfer of materials such as gases, liquids, solids, and energy (e.g., for soil heating technologies) through the system equipment from intake to discharge points.
Remediation endpoints: Final strategic objectives that signify when remediation system shutdown can occur.
Remediation strategy: The subsurface physical, chemical, and biological processes that a selected remediation technology is trying to influence and how those processes are used, either concurrently or sequentially, in a planned manner to remove or treat contaminants in their targeted in situ phases.
Simple corrective action: A final corrective action that addresses all high risks in a straightforward manner, usually requiring one or few steps implemented over a short period of time. As such, the design phase can be completed during the conceptual corrective action design stage.
Page 22 of 26 March 2017 | c-prp7-01
Strategic objectives: Performance objectives relative to the expected operating conditions and subsurface responses as defined in the operation strategy.
System effectiveness: An effective system is defined as an efficient system meeting prescribed strategic and compliance objectives.
System efficiency: The percentage of actual system uptime relative to the expected uptime as defined in the operation strategy.
Target zone: The three-dimensional subsurface region that remediation is focused on, coincidental with the targeted contaminant phase(s).
Technical feasibility: An evaluation of a proposed corrective action’s physical capability of accomplishing the corrective action goal.
5.0 Acronyms AS: air sparging
CAD: corrective action design
CCAD: conceptual corrective action design (Guidance Document 7-02)
COCs: chemicals of concern
CSM: conceptual site model
DCAD: detailed corrective action design report
EC: electrical conductivity
EDCAD: excavation detailed corrective action design (Guidance Document 7-07b)
LIF: laser-induced fluorescence
LNAPL: light non-aqueous phase liquid
MPCA: Minnesota Pollution Control Agency
P&ID: process and instrumentation diagram
PRP: Petroleum Remediation Program
RSOM: remediation system operation monitoring (Guidance Document 7-08)
SDCAD: remediation system detailed corrective action design (Guidance Document 7-07a)
SVE: soil vapor extraction
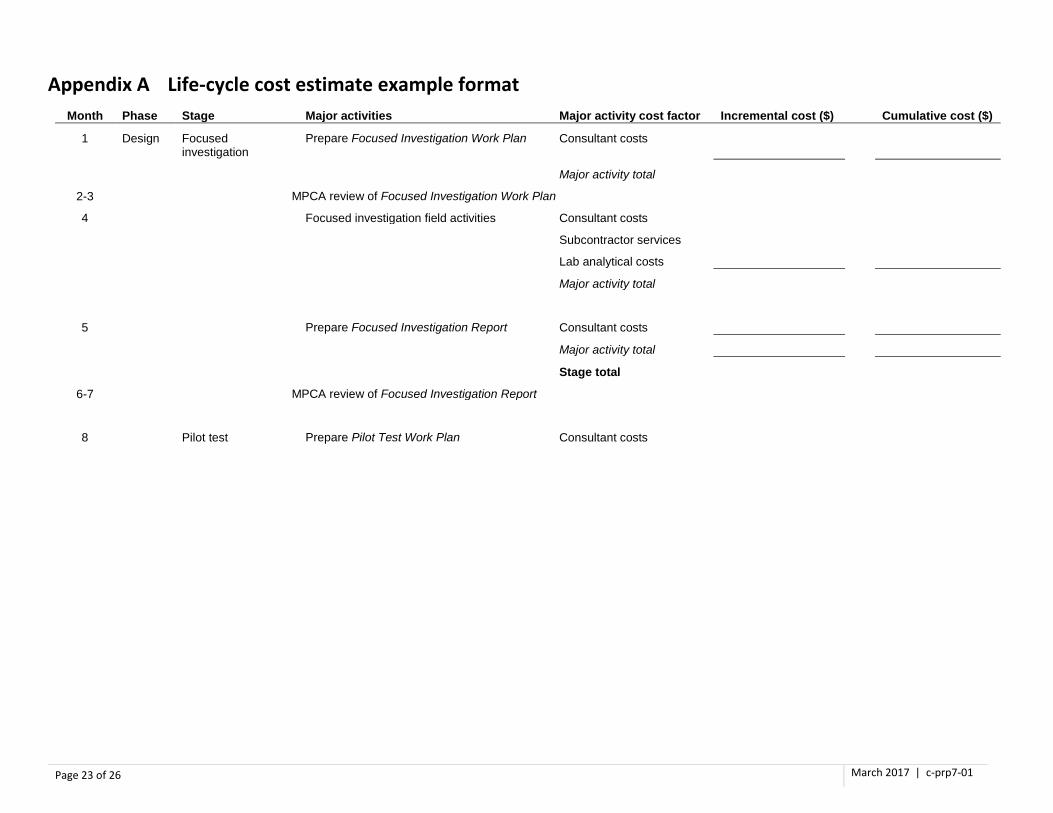
Page 23 of 26 March 2017 | c-prp7-01
Appendix A Life-cycle cost estimate example format Month Phase Stage Major activities Major activity cost factor Incremental cost ($) Cumulative cost ($)
1 Design Focused investigation
Prepare Focused Investigation Work Plan Consultant costs
Major activity total
2-3 MPCA review of Focused Investigation Work Plan
4 Focused investigation field activities Consultant costs
Subcontractor services
Lab analytical costs
Major activity total
5 Prepare Focused Investigation Report Consultant costs
Major activity total
Stage total
6-7 MPCA review of Focused Investigation Report
8 Pilot test Prepare Pilot Test Work Plan Consultant costs
Page 24 of 26 March 2017 | c-prp7-01
Appendix B Laser-induced fluorescence and electrical conductivity probes Laser-induced fluorescence (LIF) and electrical conductivity (EC) probes are two geophysical methods than can be quickly deployed using direct push technology with little to no generation of investigative waste. LIF probes identify the occurrence and distribution of LNAPL, and EC probes refine lithologic, stratigraphic, geologic structure, and facies interpretations for targeting remediation efforts. Under complex geologic conditions, it is important to collect EC data coincidental with LIF data. If the site geology is already demonstrably homogenous, EC may not be needed.
Probe locations and depths Base LIF and EC probe locations on a grid pattern with 25- to 35-foot node spacing unless an alternative spacing is pre-approved. Some locations may need to be adjusted to be adjacent to known sources, known LNAPL occurrences, or to avoid obstructions. For calibration purposes, advance at least one EC probe adjacent to an existing or new soil boring where continuous soil sampling was employed and reliable geology data are available. It is often useful to collect soil samples from different lithologies for grain size analyses, including sieve and hydrometer, in order to refine geologic interpretations. The EC probe and the standard boring results can then be correlated and the interpretations tabulated (i.e., lithology types versus conductivity response). This calibrated EC log can then be used to interpret the lithology and stratigraphy at the other EC probe locations. It may be useful to advance an EC probe adjacent to an existing monitoring well to compare present and historical fluid levels measured in the monitoring well to geology from the EC log.
The 25- to 35-foot spacing is designed to provide sufficient data to document and infer abrupt changes in LNAPL distribution and potential geologic variation. It is just as important to understand the variation within the area of the LNAPL body as it is to understand the horizontal extent. Extend the grid laterally from known or suspected LNAPL as necessary to complete horizontal delineation of LNAPL.
Plan LIF and EC probe depths based on what is already known about vertical contamination extent, geology, and groundwater occurrence. In most cases, advance each probe to10 feet below the deepest observed water table depth or to 10 feet below the base of the deepest LNAPL zone encountered at the site, whichever is deeper. Advance at least one LIF and EC probe to 20 feet below the deepest observed water table depth or 20 feet below the base of the deepest LNAPL zone encountered at the site, whichever is deeper. Advance deeper EC probes if deeper geology and stratigraphic data are necessary in the immediate vicinity of the release.
Data presentation Provide two complete sets of color LIF logs. Base one set of logs on a common, low maximum fluorescent response (e.g., %RE for UVOST®) scale (e.g., 10 to 25%) for evaluating near base-line response. The second set of logs does not need to have a common fluorescent response scale; the scale can vary between each probe log to capture the entire response at each location. All logs in a given set must have a common vertical scale. This common vertical scale may not be practical for probes significantly deeper than the rest of the set, so deeper probes within the set can have a scale appropriate for their depth. Each log must have the probe’s measured surface elevation posted on it and an elevation scale posted adjacent to the depth scale.
Only one set of EC logs must be provided, but it can be useful if two sets are provided, with one set of all logs having common depth and conductivity scales. A common depth scale (and conductivity scale) facilitates comparison and correlation of the logs from different probes. The common depth scale preference may not be practical for probes significantly deeper than the rest of the set, so deeper probes within the set can have a scale appropriate for their depth. Each log must have the probe’s measured surface elevation posted on it and an elevation scale posted adjacent to the depth scale.

Page 25 of 26 March 2017 | c-prp7-01
Data interpretation When interpreting an LIF log for LNAPL occurrence, base the presence of an LNAPL signature on a response exceeding the base line (e.g., background signal) and the waveform pattern. Do not assume an arbitrary minimum fluorescent response (FR) cutoff as indicating the absence of LNAPL. The vertical profile of the LNAPL signature on a given log can illuminate the relative vertical distribution of LNAPL pore saturation.
If site-specific LNAPL samples are available, a sample waveform can be obtained for comparison to waveforms from the LIF probes. Waveform patterns are very useful for evaluating false positives. Due to many factors (e.g., weathering) affecting the response of a given petroleum product to LIF at specific locations, interpretation of waveforms to identify different product types at a given site must be done carefully to avoid false conclusions about product type.
Correlate logs for adjacent LIF probes to determine continuous LNAPL zones. Use Table 2 to document LIF probe results and interpretation. Following interpretation and correlation of the LIF probes, map structural elements of the LNAPL zone (or zones) using contour intervals. Construct the following four contour maps:
1. Maximum FR
2. Depth to/elevation of the top of the LNAPL zone
3. Depth to/elevation of the bottom of the LNAPL zone
4. LNAPL zone thickness isopach
Post contoured data on the maps adjacent to respective probe locations. Contouring the maximum FR illustrates the horizontal extent of LNAPL and areas within the LNAPL body with relatively high pore saturation. Given that the horizontal delineation of the LNAPL was accomplished, the maximum FR contour map should have a continuous line indicating non-detection (i.e., horizontal extent of LNAPL). Use this line of non-detection as the footprint within which the three other contour maps are constructed.
To better characterize the vertical distribution of relative LNAPL pore saturation across the LNAPL body, it can be useful to contour FR on vertically exaggerated cross sections using several representative, depth-specific FR values from each LIF log. Please refer to Figure X6.10 of American Society for Testing and Materials’ E 2531-6(2014) Standard Guide for Development of Conceptual Site Models and Remediation Strategies for Light Nonaqueous-Phase Liquids Released to the Subsurface as an example of a cross section showing contoured LIF responses.
Copies of electrical conductivity logs must have geologic and stratigraphic interpretations in the form of a stratigraphic column posted on each log. Groundwater occurrence must also be posted on the EC logs if known from a nearby monitoring well or easily interpolated or extrapolated from a recent flow map. Map structural elements of key stratigraphic features, such as elevation of clay/sand contacts, and present in cross sections.
Digital LIF and EC data sets can be imported into contouring and mapping programs allowing quick generation of various contour maps, cross sections, fence diagrams, etc. If computer data evaluation methods are planned, discuss their use and include example output in the Focused Investigation Work Plan.
Integrate and correlate LNAPL occurrence with geology, especially lithology, soil structures, stratigraphy, geologic structures, and the historical water table fluctuation zone. Present and discuss the results of this evaluation. The integration and correlation of these data are often most readily presented in the form of multiple cross sections. If flow maps are used to interpolate or extrapolate water levels to LIF or EC locations, include copies of the flow maps. Logs from EC probes are useful for determining LNAPL occurrence in context with stratigraphy. Document this relationship using an appropriate number of cross sections. Cross sections with smaller-scaled LIF and/or EC signatures posted on them are preferred.

Page 26 of 26 March 2017 | c-prp7-01
1 TD = termination depth 2 FR = maximum fluorescent response (e.g., %RE for UVOST®) 3 LNAPL = light non-aqueous phase liquid 4 Depth below ground surface (bgs) 5 Elevation based on referenced site datum
Add additional rows as needed. Notes:
Table 2. Laser-induced fluorescence probe results
Probe
ID Probe Date
Probe TD1 (ft bgs)
Probe Surface Elevation (ft)
Max FR2
(%)
LNAPL3 Zone Depths4 LNAPL
Zone
Thickness (ft)
LNAPL Zone Elevations5
Comments Max FR (ft bgs)
Top
(ft bgs) Bottom (ft bgs)
Max FR
(ft)
Top
(ft)
Bottom
(ft)