Embed Size (px)
Citation preview

John Keells Holdings PLC Interim Condensed Financial Statements Nine months ended 31 December 2017
CorporateCraftsmanship


1
Chairman's Review
Dear Stakeholder,
The cumulative revenue for
the first nine months of the
financial year 2017/18 at
Rs.87.66 billion is an increase
of 15 per cent over the revenue
of Rs.76.43 billion recorded
in the same period of the
previous financial year. The
revenue at Rs.31.22 billion for
the quarter under review is a
12 per cent increase over the
Rs.27.94 billion recorded in the
previous financial year.
The Group profit before tax
(PBT) for the first nine months
of the financial year 2017/18 at
Rs.14.87 billion is a decrease
of 4 per cent over the PBT of
Rs.15.48 billion recorded in the
same period of the previous
financial year. The Group PBT
at Rs.5.83 billion in the third
quarter of the financial year
2017/18 is a decrease of 13
per cent over the Rs.6.72 billion
recorded in the corresponding
period of the previous financial
year.
The profit attributable to
shareholders in the first nine
months at Rs.11.06 billion is
a decrease of 2 per cent over
the corresponding period of the
previous financial year while
the Rs.4.49 billion recorded in
the third quarter is a decrease
of 13 per cent over the previous
year.
The Company PBT for the first
nine months of the financial
year 2017/18 at Rs.7.90 billion
is an increase of 7 per cent over
the previous financial year. The
Company PBT for the third
quarter of 2017/18 at Rs.2.36
billion is a decrease of 16 per
cent over the Rs.2.83 billion
recorded in the corresponding
period of 2016/17.
Transportation The Transportation industry
group PBT of Rs.945 million
in the third quarter of 2017/18
is an increase of 12 per cent
over the third quarter of
the previous financial year
[2016/17 Q3: Rs.845 million].
During the calendar year 2017,
the Port of Colombo witnessed
a year on year growth of 8 per
cent whilst South Asia Gateway
Terminals (SAGT) recorded a
growth in throughput of 11 per
cent. The market share and
profits of the Group’s Bunkering
business increased as a result
of a double-digit growth in
volumes. The performance of
the Logistics business was in
line with expectations. A new
57,000 sq. ft. warehouse was
commissioned in Enderamulla
during the quarter under
review. DHL Keells recorded an
improvement in performance
driven by a growth in its active
customer base.
Leisure The Leisure industry group
PBT of Rs.901 million in the
third quarter of 2017/18 is
a decrease of 34 per cent
over the third quarter of
the previous financial year
[2016/17 Q3: Rs.1.36 billion].
The decline in profitability is
mainly attributable to the City
Hotel sector which witnessed
a decline in occupancies
primarily as a result of the
increase in room inventory
within Colombo. However, it
is encouraging that the total
number of rooms occupied in
the city witnessed a double-
digit growth in the quarter
under review. Whilst the Sri
Lankan Resorts segment
recorded an improvement in
room rates and maintained
occupancies, profit for the
quarter under review was
lower when compared to the
corresponding period of the
previous financial year which
included the operations of
“Bentota Beach by Cinnamon”
which is now closed for the
construction of a new hotel.
The Maldivian Resorts segment
recorded an improvement in
average room rates, although
profitability was impacted by
lower occupancies and the
partial closure of “Ellaidhoo
Maldives by Cinnamon” for
refurbishments in October
2017. However, occupancies at
our hotels remained above the

2 John Keells Holdings PLC | Interim Condensed Financial Statements Nine months ended 31 December 2017
Chairman’s Review
industry average during the
quarter under review.
PropertyThe Property industry group
PBT of Rs.34 million in the
third quarter of 2017/18 is a
decrease of 83 per cent over
the third quarter of the previous
financial year [2016/17 Q3:
Rs.196 million]. The decline
in profitability is on account
of the third quarter of the
previous year which included
recognition of revenue on the
“7th Sense” on Gregory’s Road
residential development. The
construction of Cinnamon Life
is progressing well with the
super structure approximately
50 per cent complete. Parallel
to the ongoing construction
work of the super structure,
the installation of the façade
of the hotel will commence
shortly. The construction work
on the main access point via
a six lane bridge is nearing
completion. The pre-sales
of both the residential and
commercial space continue to
be encouraging.
The concept design for the new
800-apartment joint venture
residential development
project, “Tri-Zen”, in Union Place,
Colombo, has been finalised
whilst the schematic designs
are currently underway. This
unique development will target
a broader section of the market
with apartments offered at
attractive price points. Pre-
sales have commenced and
initial bookings are very
encouraging.
Consumer Foods and RetailThe Consumer Foods and Retail
industry group PBT of Rs.947
million in the third quarter of
2017/18 is a decrease of 26
per cent over the third quarter
of the previous financial year
[2016/17 Q3: Rs.1.29 billion].
The decline in profitability is on
account of the Consumer Foods
sector and to a lesser extent
the Retail sector. The Beverage
and Frozen Confectionery
businesses recorded a
decline in volumes as a result
of continued tapering of
demand arising from subdued
consumer discretionary
spending. The volume decline
in the Beverage business was
further exacerbated by the
implementation of a sugar
tax from November 2017,
which resulted in substantial
price increases across the
industry. Whilst over the years
we have taken measures to
reduce a significant quantum
of sugar in our beverages, we
will continue to aggressively
expand our low sugar product
range by accelerating the
launch of such new products.
As a continuing part of our
beverage portfolio strategy,
we will also launch more
non-carbonated beverages to
broaden our offerings. Keells
Food Products PLC recorded
an increase in profitability on
account of a better sales mix.
The Retail sector recorded
growth in footfall contributing
towards a year-on-year growth
in same store sales, although
profitability was impacted by
store expansion related costs
and promotional expenses.
During the quarter under
review, three new outlets were
opened, bringing the total store
count to 72 as at 31 December
2017. The stores opened
during the quarter featured
the new branding which will be
rolled out to the existing stores
as well in the ensuing quarters.
The branding initiative
encompasses new elements to
the store in line with evolving
consumer needs which we
are confident will drive footfall,
although this impacted the roll
out of the store openings for
the quarter under review.
Financial ServicesThe Financial Services industry
group PBT of Rs.1.54 billion in
the third quarter of 2017/18 is
an increase of 35 per cent over
the third quarter of the previous
financial year [2016/17 Q3:
Rs.1.14 billion]. The increase
in profitability is on account
of the performance of Union
Assurance PLC, where gross

3
written premiums recorded
strong growth above industry
average whilst Nations Trust
Bank recorded sound loan
growth during the quarter
under review.
Information Technology The Information Technology
industry group PBT of Rs.86
million in the third quarter of
2017/18 is a decrease of 56
per cent over the third quarter
of the previous financial
year [2016/17 Q3: Rs.195
million]. The corresponding
quarter of the previous
year included profits of the
Group’s BPO business which
was divested in September
2017. The Office Automation
businesses recorded a decline
in profitability on account of
lower volumes in its product
segments.
Other, Including Plantation ServicesOther, comprising of the
Holding Company and other
investments, and the Plantation
Services sector, recorded a PBT
of Rs.1.37 billion in the third
quarter of 2017/18, which is a
decrease of 19 per cent over
the third quarter of the previous
financial year [2016/17 Q3:
Rs.1.70 billion]. The decrease
in PBT is mainly attributable to
lower exchange gains recorded
at the Company on its foreign
currency denominated cash
holdings compared to the
corresponding quarter of the
previous financial year. The
performance of the Plantation
Services sector was impacted
by trading losses due to a
decline in tea prices within the
quarter under review.
Sustainability Initiatives Demonstrating the ongoing
efficiency initiatives
implemented by the Group,
the carbon footprint and
water withdrawn per million
rupees of revenue decreased
by 6 per cent and 18 per cent
respectively to 0.79 MT and
15.12 cubic meters during the
quarter. In absolute terms, the
carbon footprint increased
by 2 per cent to 23,244 MT
mainly as a result of increased
operational activities in the
Retail sector and the inclusion
of Cinnamon Air to the Group’s
sustainability reporting scope
whilst water withdrawal
decreased by 11 per cent to
443,384 cubic meters mainly
due to decreased operational
activities in the Consumer
Foods sector and the closing
down of “Bentota Beach by
Cinnamon” for refurbishment.
The quarter on quarter
performance when assessed
against the 2020 Group
sustainability goals, indicates
a 5 per cent increase in
energy usage and a 7 per cent
reduction in water usage, from
the targets established against
the baseline year of 2015/16.
The Group continuously
monitors the progress towards
the established goals and will
strive to achieve the 2020
Goal. Group employees were
provided with approximately 9
hours of training per employee,
whilst 61 occupational injuries
were reported during the
quarter under review.
Corporate Social Responsibility Following are some of the
highlights of John Keells
Foundation’s (JKF) initiatives
during the quarter under
review:
• Under the John Keells
English Language
Scholarship Programme,
a total of 1,248 school
children followed classes
under “English for Teens”
courses held in various
parts of the country.
• Under the Neighbourhood
Schools Development
Project, Ordinary Level
revision classes were
conducted benefiting 196
students sitting for the
examination in December
2017.
• The third and final phase of
the three-year Science Day
Programme (conducted in
collaboration with the Sri

4 John Keells Holdings PLC | Interim Condensed Financial Statements Nine months ended 31 December 2017
Chairman’s Review
Lanka Association for the
Advancement of Science)
was completed with a
cumulative participation
of 858 students and 66
teachers from 62 schools
in 6 districts.
• Under “Project WAVE”
(Working Against Violence
through Education), 741
employees were sensitised
on gender based violence
and child abuse. JKF
conducted its second public
awareness campaign
against sexual harassment
in public transport to
coincide the International
Day for the Elimination of
Violence Against Women.
The campaign targeting
train commuters and
undertaken in collaboration
with the Sri Lanka Railways
saw 107 John Keells
volunteers disseminating
approximately 30,000
information cards to
commuters as well as
pasting 1,500 stickers in
railway carriages. Parallel
to the public campaign, a
social media campaign and
a campaign targeting staff
were also carried out.
• Under the John Keells
Vision Project, 6,008
students of 30 schools
in the Colombo district
underwent vision
screening and 475 eye
glasses were donated to
students.
• A total of 1,901 persons
were sensitised under the
John Keells HIV and AIDS
Awareness Campaign.
World AIDS Day falling
on 1st December was
commemorated across
the Group with awareness
raising initiatives for
internal and external
audiences.
• Under the Village Adoption
Project, 30 low income
families in Mullaitivu were
provided seed capital
and guidance to pursue
self-enterprises under
a Family Empowerment
Programme conducted
in collaboration with Sri
Lanka Red Cross Society.
• Under Project Gathering (a
2-year research initiative
on elephant gathering,
behavioural and dispersion
patterns undertaken by
Cinnamon Nature Trails
in collaboration with JKF),
the satellite tracking of
two elephant herds was
initiated through GPS
collaring.
DividendsThe Company paid a first
interim dividend for the
financial year 2017/18 in
November 2017, amounting to
Rs.2.00 per share. Your Board
declared a second interim
dividend of Rs.2.00 per share
to be paid on 22 February 2018.
Retirements and Appointments I would like to place on record
our deep appreciation for the
invaluable contribution made
by Mr. Ajit Gunewardene,
Deputy Chairman, and Mr.
Ronnie Peiris, Group Finance
Director, who retired with effect
from 31 December 2017.
As announced in the Group’s
succession plan, Mr. Krishan
Balendra and Mr. Gihan Cooray
assumed office as the Deputy
Chairman and the Group
Finance Director respectively,
effective from 1 January 2018.
Further, Mr. Balendra will take
over as Chairman and Mr.
Cooray as Deputy Chairman/
Group Finance Director upon
my retirement at the end of
this year.
Susantha RatnayakeChairman
30 January 2018

5
Consolidated Income Statement
Quarter ended 31 December Nine months ended 31 December
Note 2017 2016 Change
%
2017 2016 Change
%
Continuing operations Sale of goods 21,416,901 18,314,008 17 60,126,523 49,798,413 21Rendering of services 9,799,269 9,623,298 2 27,535,893 26,626,732 3Revenue 31,216,170 27,937,306 12 87,662,416 76,425,145 15
Cost of sales (24,332,208) (19,798,782) 23 (66,946,413) (53,735,578) 25
Gross profit 6,883,962 8,138,524 (15) 20,716,003 22,689,567 (9)Other operating income 529,179 437,382 21 1,559,797 1,167,109 34Selling and distribution expenses (1,136,594) (1,108,166) 3 (3,133,636) (3,010,665) 4Administrative expenses (3,125,619) (3,067,844) 2 (9,573,199) (8,674,756) 10Other operating expenses (751,675) (863,701) (13) (2,310,726) (2,539,028) (9)Results from operating activities 2,399,253 3,536,195 (32) 7,258,239 9,632,227 (25)
Finance cost (153,308) (3,090) 4,861 (414,081) (310,955) 33Finance income 2,615,340 2,647,664 (1) 8,609,699 7,290,398 18Change in insurance contract
liabilities 6 663 (347,633) (100) (3,626,788) (3,543,541) 2
Change in fair value of investment property
- 9,677 - - 9,677 -
Share of results of equity accounted investees
967,702 881,754 10 3,039,962 2,401,645 27
Profit before tax 5,829,650 6,724,567 (13) 14,867,031 15,479,451 (4)Tax expense 8 (1,025,294) (1,067,235) (4) (3,038,730) (2,981,582) 2Profit for the period 4,804,356 5,657,332 (15) 11,828,301 12,497,869 (5)
Attributable to: Equity holders of the parent 4,492,196 5,149,282 (13) 11,055,001 11,289,298 (2)Non-controlling interest 312,160 508,050 (39) 773,300 1,208,571 (36)
4,804,356 5,657,332 (15) 11,828,301 12,497,869 (5)
LKR. LKR. LKR. LKR.
Earnings per share
Basic 3.24 3.73 7.97 8.24 Diluted 3.24 3.73 7.97 8.24
Dividend per share 2.00 2.00 4.00 3.50
Note : All values are in LKR '000s, unless otherwise stated. Figures in brackets indicate deductions. The above figures are not audited.

6 John Keells Holdings PLC | Interim Condensed Financial Statements Nine months ended 31 December 2017
Consolidated Statement of Comprehensive Income
Quarter ended 31 December
Nine months ended 31 December
Note 2017 2016 2017 2016
Profit for the period 4,804,356 5,657,332 11,828,301 12,497,869
Other comprehensive incomeOther comprehensive income to be reclassified to
income statement in subsequent periodsCurrency translation of foreign operations (339,895) 815,457 (15,719) 622,439 Net (loss)/gain on cash flow hedges 128,311 514,744 108,384 383,331 Share of other comprehensive income of equity-
accounted investees (20,018) 101,274 181,459 183,658
Net gain/(loss) on available-for-sale financial assets (32,293) (470,462) 831,630 (194,709)Net other comprehensive income to be reclassified to
income statement in subsequent periods (263,895) 961,013 1,105,754 994,719
Other comprehensive income not to be reclassified to income statement in subsequent periods
Revaluation of land and buildings 1,916,986 202,753 1,983,986 202,753
Remeasurement gain / (loss) on defined benefit plans - - (9,600) - Share of other comprehensive income of equity
accounted investees - 6,525 - 6,525
Net other comprehensive income not to be reclassified to income statement in subsequent periods
1,916,986 209,278 1,974,386 209,278
Tax on other comprehensive income 8 (20,007) - (22,708) (1,185)
Other comprehensive income for the period, net of tax 1,633,084 1,170,291 3,057,432 1,202,812
Total comprehensive income for the period, net of tax 6,437,440 6,827,623 14,885,733 13,700,681
Attributable to:Equity holders of the parent 5,787,298 6,236,930 13,664,328 12,433,493 Non-controlling interest 650,142 590,693 1,221,405 1,267,188
6,437,440 6,827,623 14,885,733 13,700,681
Note : All values are in LKR '000s, unless otherwise stated. Figures in brackets indicate deductions. The above figures are not audited.

7
Consolidated Statement of Financial Position
As at 31.12.2017 31.03.2017
ASSETSNon-current assetsProperty, plant and equipment 71,279,577 64,396,373 Lease rentals paid in advance 12,945,581 13,206,058 Investment property 9,763,471 5,366,180 Intangible assets 2,053,284 2,118,160 Investments in equity accounted investees 21,403,633 17,718,887 Non current financial assets 33,222,818 27,666,621 Deferred tax assets 162,741 143,548 Other non current assets 48,239,825 41,692,316
199,070,930 172,308,143 Current assetsInventories 5,880,019 5,605,712 Trade and other receivables 11,836,506 11,687,429 Amounts due from related parties 159,925 111,639 Other current assets 3,741,415 3,265,327 Short term investments 67,328,052 79,174,327 Cash in hand and at bank 6,119,004 5,119,185
95,064,921 104,963,619 Total assets 294,135,851 277,271,762 EQUITY AND LIABILITIESEquity attributable to equity holders of the parentStated capital 62,796,910 62,790,080 Revenue reserves 83,090,827 77,193,184 Other components of equity 41,614,053 38,651,568
187,501,790 178,634,832 Non-controlling interest 15,720,253 15,695,543 Total equity 203,222,043 194,330,375 Non-current liabilitiesInsurance contract liabilities 34,955,793 31,700,278 Interest bearing loans and borrowings 17,964,254 14,202,636 Deferred tax liabilities 2,696,934 2,336,241 Employee benefit liabilities 2,044,109 1,880,287 Other deferred liabilities 749,541 838,891 Other non-current liabilities 4,861,464 3,933,882
63,272,095 54,892,215 Current liabilitiesTrade and other payables 14,437,256 14,136,040 Amounts due to related parties 1,945 10,434 Income tax liabilities 1,820,551 2,395,379 Short term borrowings 2,332,599 1,380,238 Interest bearing loans and borrowings 1,829,066 2,918,854 Other current liabilities 3,241,367 2,944,118 Bank overdrafts 3,978,929 4,264,109
27,641,713 28,049,172 Total equity and liabilities 294,135,851 277,271,762
LKR. LKR.
Net assets per share 135.14 128.75 Note : All values are in LKR '000s, unless otherwise stated. The above figures are not audited.I certify that the financial statements comply with the requirements of the Companies Act No.7 of 2007.
Suran WijesingheGroup Financial Controller
The Board of Directors is responsible for the preparation and presentation of these financial statements.
S C Ratnayake J G A CoorayChairman Group Finance Director
30 January 2018

8 John Keells Holdings PLC | Interim Condensed Financial Statements Nine months ended 31 December 2017
Consolidated Statement of Cash Flows
For the nine months ended 31 December Note 2017 2016
CASH FLOWS FROM OPERATING ACTIVITIESProfit before working capital changes A 7,163,091 9,507,755
(Increase) / Decrease in inventories (274,307) (1,026,620)(Increase) / Decrease in trade and other receivables (389,004) 502,392 (Increase) / Decrease in other current assets 165,661 (369,460)(Increase) / Decrease in other non-current assets (6,193,604) (3,783,608)Increase / (Decrease) in trade and other payables and other non-current liabilities 1,160,608 21,187 Increase / (Decrease) in other current liabilities 355,814 811,509 Increase / (Decrease) in insurance contract liabilities 3,255,515 3,321,119 Cash generated from operations 5,243,774 8,984,274
Finance income received 8,281,122 6,959,628 Finance costs paid (414,081) (204,679)Dividend received 1,341,176 1,280,475 Tax paid (4,004,514) (3,081,590)Gratuity paid (129,525) (143,213)Net cash flow from operating activities 10,317,952 13,794,895
CASH FLOWS FROM/(USED IN) INVESTING ACTIVITIESPurchase and construction of property, plant and equipment (7,506,746) (3,312,458)Purchase of intangible assets (180,314) (72,053)Purchase of lease rights - (2,653,534)Addition to investment property (4,397,291) (98)Acquisition of subsidiaries (net of cash acquired) 7.1 (78,584) - Investments in equity accounted investees 7.3 (1,804,500) - Proceeds from sale of property, plant and equipment and intangible assets 215,090 448,886 Proceeds from sales of non-current investments 7.4 207,164 - Proceeds from sale of financial instruments - fair valued through profit or loss 759,411 829,009 Purchase of financial instruments - fair valued through profit or loss (969,932) (1,013,092)(Purchase) / disposal of short term investments (net) (13,439,257) (12,587,078)(Purchase) / disposal of non current financial assets (net) (4,706,672) (3,307,739)Grants received for investing activities 32,476 69,511 Net cash flow from / (used in) investing activities (31,869,155) (21,598,646)
CASH FLOWS FROM/(USED IN) FINANCING ACTIVITIESProceeds from issue of shares 5,369 4,088,103 Changes in non controlling interest (293,890) 65,660 Payment of other deferred liability - (115,407)Dividend paid to equity holders of parent (5,549,936) (4,505,563)Dividend paid to shareholders with non-controlling interest (538,002) (757,231)Proceeds from long term borrowings 4,990,503 3,044,513 Repayment of long term borrowings (2,489,187) (2,937,587)Proceeds from/(repayment of) other financial liabilities (net) 952,361 727,287 Net cash flow from / (used in) financing activities (2,922,782) (390,225)
NET INCREASE / (DECREASE) IN CASH AND CASH EQUIVALENTS (24,473,985) (8,193,976)
CASH AND CASH EQUIVALENTS AT THE BEGINNING 47,643,605 48,398,696 CASH AND CASH EQUIVALENTS AT THE END 23,169,620 40,204,720
ANALYSIS OF CASH AND CASH EQUIVALENTSFavourable balancesShort term investments 21,029,545 38,007,139 Cash in hand and at bank 6,119,004 6,040,302 Unfavourable balancesBank overdrafts (3,978,929) (3,842,721)Total cash and cash equivalents 23,169,620 40,204,720
Note : All values are in LKR '000s, unless otherwise stated. Figures in brackets indicate deductions. The above figures are not audited.

9
For the nine months ended 31 December Note 2017 2016
A. Profit before working capital changes
Profit before tax 14,867,031 15,479,451Adjustments for:
Finance income (8,609,699) (7,290,398)Finance cost 414,081 310,955 Change in fair value of investment property - (9,677)Share-based payment expense 382,778 329,992 Share of results of equity accounted investees (3,039,962) (2,401,645)Depreciation of property, plant and equipment 2,424,430 2,114,046 (Profit)/loss on sale of property, plant and equipment and intangible assets (103,821) 15,840 Profit on sale of investment in subsidiaries 7.4 (28,575) - Amortisation of lease rentals paid in advance 327,486 483,896 Amortisation of intangible assets 245,190 249,410 Amortisation of other deferred liabilities (17,824) (18,365)Gratuity provision and related costs 284,854 237,519 Goodwill Impairement 7.1 23,445 - Accumulated unrecognised (gain)/ loss net (31,392) - Unrealised (gain) / loss on foreign exchange (net) 25,069 6,731
7,163,091 9,507,755
Note : All values are in LKR '000s, unless otherwise stated. Figures in brackets indicate deductions. The above figures are not audited.

10 John Keells Holdings PLC | Interim Condensed Financial Statements Nine months ended 31 December 2017
Consolidated Statement of Changes in EquityAt
trib
utab
le to
equ
ityho
lder
s of
par
ent
Not
e S
tate
dca
pita
l R
eval
uatio
n re
serv
e F
orei
gn c
urre
ncy
tran
slat
ion
re
serv
e
Cas
h flo
w h
edge
res
erve
Oth
er
cap
ital
res
erve
s
Ava
ilabl
efo
r sa
le r
eser
ve
Rev
enue
r
eser
ves
Tot
al N
on-
con
trol
ling
inte
rest
Tot
al
Equ
ity
As a
t 1 A
pril
2016
58,
701,
977
20,
846,
190
7,0
80,9
79
- 9
58,3
10
(170
,217
) 6
7,56
4,51
3 1
54,9
81,7
52
13,
498,
570
168
,480
,322
Pr
ofit f
or th
e pe
riod
- -
- -
- -
11,
289,
298
11,
289,
298
1,2
08,5
71
12,
497,
869
Othe
r com
preh
ensi
ve in
com
e -
201
,206
7
03,4
65
361
,273
-
(127
,168
) 5
,419
1
,144
,195
5
8,61
7 1
,202
,812
To
tal c
ompr
ehen
sive
inco
me
- 2
01,2
06
703
,465
3
61,2
73
- (1
27,1
68)
11,
294,
717
12,
433,
493
1,2
67,1
88
13,
700,
681
Exer
cise
of s
hare
war
rant
s 3
,176
,842
-
- -
- -
- 3
,176
,842
-
3,1
76,8
42
Exer
cise
of s
hare
opt
ions
911
,261
-
- -
- -
- 9
11,2
61
- 9
11,2
61
Shar
e ba
sed
paym
ents
- -
- -
329
,992
-
- 3
29,9
92
- 3
29,9
92
Fina
l div
iden
d pa
id -
2015
/16
11 -
- -
- -
- (1
,784
,105
) (1
,784
,105
) -
(1,7
84,1
05)
Inte
rim d
ivid
end
paid
- 20
16/1
711
- -
- -
- -
(2,7
21,4
58)
(2,7
21,4
58)
- (2
,721
,458
)Su
bsid
iary
div
iden
d to
non
-co
ntro
lling
inte
rest
- -
- -
- -
381
,084
3
81,0
84
(1,1
38,3
15)
(757
,231
)
Acq
uisi
tion,
dis
posa
l and
cha
nges
in
non
-con
trol
ling
inte
rest
- -
- -
- -
46,
682
46,
682
18,
978
65,
660
As
at 3
1 De
cem
ber
2016
6
2,79
0,08
0 2
1,04
7,39
6 7
,784
,444
3
61,2
73
1,2
88,3
02
(297
,385
) 7
4,78
1,43
3 1
67,7
55,5
43
13,
646,
421
181
,401
,964
As a
t 1 A
pril
2017
62,
790,
080
28,
994,
792
8,3
03,8
95
312
,529
1
,402
,656
(3
62,3
04)
77,
193,
184
178
,634
,832
1
5,69
5,54
3 1
94,3
30,3
75
Profi
t for
the
perio
d -
- -
- -
- 1
1,05
5,00
1 1
1,05
5,00
1 7
73,3
00
11,
828,
301
Othe
r com
preh
ensi
ve in
com
e -
1,5
98,0
74
(21,
681)
102
,878
-
901
,655
2
8,40
1 2
,609
,327
4
48,1
05
3,0
57,4
32
Tota
l com
preh
ensi
ve in
com
e -
1,5
98,0
74
(21,
681)
102
,878
-
901
,655
1
1,08
3,40
2 1
3,66
4,32
8 1
,221
,405
1
4,88
5,73
3 Ex
erci
se o
f sha
re o
ptio
ns 4
,985
-
- -
- -
- 4
,985
-
4,9
85
Shar
e ba
sed
paym
ents
1,8
45
- -
- 3
80,9
33
- -
382
,778
-
382
,778
Fi
nal d
ivid
end
paid
- 20
16/1
711
- -
- -
- -
(2,7
74,9
34)
(2,7
74,9
34)
- (2
,774
,934
)In
terim
div
iden
d pa
id -
2017
/18
11 -
- -
- -
- (2
,775
,002
) (2
,775
,002
) -
(2,7
75,0
02)
Subs
idia
ry d
ivid
end
to n
on-
cont
rolli
ng in
tere
st -
- -
- -
- 3
64,5
31
364
,531
(9
02,5
33)
(538
,002
)
Acqu
isiti
on, d
ispo
sal a
nd c
hang
es in
no
n-co
ntro
lling
inte
rest
- 6
26
- -
- -
(354
) 2
72
(294
,162
) (2
93,8
90)
As
at 3
1 De
cem
ber
2017
6
2,79
6,91
0 3
0,59
3,49
2 8
,282
,214
4
15,4
07
1,7
83,5
89
539
,351
8
3,09
0,82
7 1
87,5
01,7
90
15,
720,
253
203
,222
,043
Not
e :
All
valu
es a
re in
LK
R '0
00s,
unl
ess
othe
rwis
e st
ated
.
Figu
res
in b
rack
ets
indi
cate
ded
uctio
ns.
Th
e ab
ove
figur
es a
re n
ot a
udite
d.

11
Company Income Statement
Quarter ended 31 December Nine months ended 31 December
Note 2017 2016 Change
%
2017 2016 Change
%
Continuing operations Rendering of services 327,990 269,214 22 982,277 795,114 24 Revenue 327,990 269,214 22 982,277 795,114 24
Cost of sales (130,113) (101,196) 29 (475,841) (396,732) 20
Gross profit 197,877 168,018 18 506,436 398,382 27 Dividend income 990,478 1,680,378 (41) 3,558,331 4,441,412 (20) Other operating income 2,935 5,153 (43) 10,208 13,710 (26) Administrative expenses (259,598) (756,312) (66) (879,328) (1,282,759) (31) Other operating expenses (7,643) (11,178) (32) (23,495) (31,917) (26) Results from operating activities 924,049 1,086,059 (15) 3,172,152 3,538,828 (10)
Finance cost (32,692) 78,160 (142) (69,681) (69,222) 1 Finance income 1,473,386 1,662,542 (11) 4,802,228 3,946,799 22
Profit before tax 2,364,743 2,826,761 (16) 7,904,699 7,416,405 7 Tax expense 8 (314,690) (290,788) 8 (1,034,659) (780,448) 33 Profit for the period 2,050,053 2,535,973 (19) 6,870,040 6,635,957 4
LKR. LKR. LKR. LKR.
Dividend per share 2.00 2.00 4.00 3.50
Note : All values are in LKR '000s, unless otherwise stated. Figures in brackets indicate deductions. The above figures are not audited.

12 John Keells Holdings PLC | Interim Condensed Financial Statements Nine months ended 31 December 2017
Company Statement of Comprehensive Income
Quarter ended 31 December Nine months ended 31 December
Note 2017 2016 2017 2016
Profit for the period 2,050,053 2,535,973 6,870,040 6,635,957
Other comprehensive incomeOther comprehensive income to be reclassified to
income statement in subsequent periodsNet gain/(loss) on available-for-sale financial assets (77,699) 10,896 (67,840) 23,424 Net other comprehensive income to be reclassified to
income statement in subsequent periods (77,699) 10,896 (67,840) 23,424
Tax on other comprehensive income 8 - - - -
Other comprehensive income for the period, net of tax (77,699) 10,896 (67,840) 23,424
Total comprehensive income for the period, net of tax 1,972,354 2,546,869 6,802,200 6,659,381
Note : All values are in LKR '000s, unless otherwise stated. Figures in brackets indicate deductions. The above figures are not audited.

13
Company Statement of Financial Position
As at 31.12.2017 31.03.2017
ASSETSNon-current assetsProperty, plant and equipment 129,296 93,913 Intangible assets 30,694 30,801 Investments in subsidiaries 53,931,171 42,987,395 Investments in equity accounted investees 8,910,800 8,910,800 Non current financial assets 2,948,960 2,789,980 Other non current assets 19,695 16,254
65,970,616 54,829,143
Current assetsTrade and other receivables 127,909 118,076 Amounts due from related parties 213,137 286,735 Other current assets 53,458 99,442 Short term investments 50,478,079 60,243,280 Cash in hand and at bank 263,441 304,265
51,136,024 61,051,798 Total assets 117,106,640 115,880,941
EQUITY AND LIABILITIESStated capital 62,796,910 62,790,080 Revenue reserves 51,308,599 49,988,495 Other components of equity 1,817,969 1,504,876 Total equity 115,923,478 114,283,451
Non-current liabilitiesEmployee benefit liabilities 266,370 217,910 Other deferred liabilities - 103,218
266,370 321,128
Current liabilitiesTrade and other payables 261,184 330,078 Amounts due to related parties 4,064 210,029 Income tax liabilities 438,841 635,532 Other current liabilities 8,544 16,441 Bank overdrafts 204,159 84,282
916,792 1,276,362 Total equity and liabilities 117,106,640 115,880,941
LKR. LKR.Net assets per share 83.55 82.37
Note : All values are in LKR '000s, unless otherwise stated. The above figures are not audited.I certify that the financial statements comply with the requirements of the Companies Act No.7 of 2007.
Suran WijesingheGroup Financial Controller
The Board of Directors is responsible for the preparation and presentation of these financial statements.
S C Ratnayake J G A CoorayChairman Group Finance Director
30 January 2018

14 John Keells Holdings PLC | Interim Condensed Financial Statements Nine months ended 31 December 2017
Company Statement of Cash Flows
For the nine months ended 31 December Note 2017 2016
CASH FLOWS FROM OPERATING ACTIVITIESProfit before tax 7,904,699 7,416,405 Adjustments for: Finance income (4,802,228) (3,946,799) Dividend income (3,558,331) (4,441,412) Finance cost 69,681 69,222 Impairment losses of non financial assets - 544,343 (Profit) / Loss on sale of non-current investments - 1,649 Depreciation of property, plant and equipment 22,913 25,951 (Profit)/ loss on sale of property, plant and equipment and intangible assets (354) (17) Amortisation of intangible assets 14,383 15,350 Share based payment expenses 123,610 90,509 Gratuity provision and related costs 28,330 21,165
Profit before working capital changes (197,297) (203,634)
(Increase) / Decrease in trade and other receivables (41,770) 79,334 (Increase) / Decrease in other current assets 45,984 75,107 (Increase) / Decrease in other non-current assets (3,441) 1,190 Increase / (Decrease) in trade and other payables (379,909) 16,062 Increase / (Decrease) in other current liabilities (7,897) 26,941 Cash generated from operations (584,330) (5,000)
Finance income received 4,411,596 3,044,716 Finance costs paid (67,848) (66,970)Dividend received 3,682,864 4,886,686 Tax paid (1,231,350) (668,434)Gratuity paid (Net of transfers) 20,131 (7,334)Net cash flow from operating activities 6,231,063 7,183,664
CASH FLOWS FROM/ (USED IN) INVESTING ACTIVITIESPurchase and construction of property, plant and equipment (77,449) (5,595)Purchase of intangible assets (14,278) (3,335)Investment in subsidiaries (6,177,680) - Increase in interest in subsidiaries (4,506,927) (3,431,973)Proceeds from sale of property, plant and equipment 507 20 Proceeds from sale of non-current investments - 36,357 (Purchase) / disposal of short term investments (net) (15,986,570) (9,150,240)(Purchase) / disposal of non current financial assets (net) (18,501) 8,134 Net cash flow from/(used in) investing activities (26,780,898) (12,546,632)
CASH FLOWS FROM / (USED IN) FINANCING ACTIVITIESProceeds from issue of shares 4,985 4,088,103 Settlement of other deferred liabilities - (199,893)Dividend paid (5,549,936) (4,505,563)Repayment of long term borrowings - (1,469,884)Net cash flow from / (used in) financing activities (5,544,951) (2,087,237)
NET INCREASE / (DECREASE) IN CASH AND CASH EQUIVALENTS (26,094,786) (7,450,205)
CASH AND CASH EQUIVALENTS AT THE BEGINNING 39,989,190 37,135,335
CASH AND CASH EQUIVALENTS AT THE END 13,894,404 29,685,130
ANALYSIS OF CASH & CASH EQUIVALENTSFavourable balancesShort term investments 13,835,122 28,023,390 Cash in hand and at bank 263,441 1,738,562 Unfavourable balancesBank overdrafts (204,159) (76,822)Total cash and cash equivalents 13,894,404 29,685,130
Note : All values are in LKR '000s, unless otherwise stated. Figures in brackets indicate deductions. The above figures are not audited.

15
Company Statement of Changes in Equity
Note Statedcapital
Other capital
reserves
Available for
sale reserve
Revenue reserves
Total Equity
As at 1 April 2016 58,701,977 958,310 126,307 41,121,860 100,908,454
Profit for the period - - - 6,635,957 6,635,957
Other comprehensive income - - 23,424 - 23,424
Total comprehensive income - - 23,424 6,635,957 6,659,381
Exercise of share warrants 3,176,842 - - - 3,176,842
Exercise of share options 911,261 - - - 911,261
Share based payments - 329,992 - - 329,992
Final dividend paid - 2015/16 11 - - - (1,784,105) (1,784,105)
Interim dividend paid - 2016/17 11 - - - (2,721,458) (2,721,458)
As at 31 December 2016 62,790,080 1,288,302 149,731 43,252,254 107,480,367
As at 1 April 2017 62,790,080 1,402,656 102,220 49,988,495 114,283,451
Profit for the period - - - 6,870,040 6,870,040
Other comprehensive income - - (67,840) - (67,840)
Total comprehensive income - - (67,840) 6,870,040 6,802,200
Exercise of share options 4,985 - - - 4,985
Share based payments 1,845 380,933 - - 382,778
Final dividend paid - 2016/17 11 - - - (2,774,934) (2,774,934)
Interim dividend paid - 2017/18 11 - - - (2,775,002) (2,775,002)
As at 31 December 2017 62,796,910 1,783,589 34,380 51,308,599 115,923,478
Note : All values are in LKR '000s, unless otherwise stated. Figures in brackets indicate deductions. The above figures are not audited.

16 John Keells Holdings PLC | Interim Condensed Financial Statements Nine months ended 31 December 2017
Notes to the Interim Condensed Financial Statements
Operating segment information Business segments The following tables present revenue, profit information and other disclosures regarding Group's business segments.
Transportation Leisure Property Consumer Foods & Retail Financial Services Information Technology Others Group Total
For the Quarter ended 31 December 2017 2016 2017 2016 2017 2016 2017 2016 2017 2016 2017 2016 2017 2016 2017 2016
External revenue 4,754,366 3,169,473 6,062,660 6,497,193 165,076 487,468 13,433,509 11,859,726 2,804,795 2,171,078 3,163,229 3,036,001 832,535 716,367 31,216,170 27,937,306
Inter segment revenue 140,289 97,142 5,430 9,031 53,495 52,655 91,504 102,349 - - 73,337 57,709 237,292 194,893 601,347 513,779
Total segment revenue 4,894,655 3,266,615 6,068,090 6,506,224 218,571 540,123 13,525,013 11,962,075 2,804,795 2,171,078 3,236,566 3,093,710 1,069,827 911,260 31,817,517 28,451,085
Eliminations of inter segment revenue (601,347) (513,779)
Net revenue 31,216,170 27,937,306
Segment results 264,146 206,766 845,959 1,272,839 30,019 381,867 896,535 1,224,971 1,225,995 860,490 86,662 (605,611) (50,011) (1,250,731) 3,299,305 2,090,591
Finance cost (14,520) (7,574) (56,862) (47,610) (9,959) 2,546 (9,926) (4,647) - - (11,424) (1,710) (50,617) 55,905 (153,308) (3,090)
Finance income 36,023 31,893 100,446 123,052 21,910 12,301 38,655 69,518 25,039 30,843 10,519 11,273 1,477,287 1,762,769 1,709,879 2,041,649
Change in fair value of investment property
- - - - - 9,677 - - - - - - - - - 9,677
Share of results of equity accounted investees
660,035 614,517 15,963 18,361 - - - - 291,704 248,876 - - - - 967,702 881,754
Eliminations / adjustments (780) (759) (4,601) (4,206) (7,971) (210,472) 22,000 (3,000) - - - 790,785 (2,576) 1,131,638 6,072 1,703,986
Profit / (loss) before tax 944,904 844,843 900,905 1,362,436 33,999 195,919 947,264 1,286,842 1,542,738 1,140,209 85,757 194,737 1,374,083 1,699,581 5,829,650 6,724,567
Tax expense (60,432) (27,363) (261,825) (164,833) (6,866) (5,541) (273,898) (378,467) (1,280) 3,347 (29,087) (41,829) (391,906) (452,549) (1,025,294) (1,067,235)
Profit / (loss) for the period 884,472 817,480 639,080 1,197,603 27,133 190,378 673,366 908,375 1,541,458 1,143,556 56,670 152,908 982,177 1,247,032 4,804,356 5,657,332
Purchase and construction of PPE* 13,838 40,722 1,136,328 606,746 21,408 21,846 2,302,016 1,039,144 13,359 28,703 36,701 59,602 98,143 13,251 3,621,793 1,810,014
Addition to IA* - 4,400 - - - - 13,666 - 136,684 34,173 2,732 5,010 4,152 3,334 157,234 46,917
Depreciation of PPE* 28,600 50,648 362,302 773,490 8,366 8,830 258,391 400,338 17,567 40,222 32,409 65,698 37,448 66,195 745,083 1,405,421
Amortisation / impairment of IA* 769 840 13,572 33,546 193 247 3,530 5,978 54,227 109,821 1,810 5,108 4,758 10,263 78,859 165,803
Amortisation of LRPA* - - 103,331 308,985 5,077 9,469 757 885 - - - - 293 587 109,458 319,926
Gratuity provision and related costs 4,113 6,783 31,266 53,665 581 1,206 43,800 53,823 12,450 10,940 5,186 7,986 6,962 21,046 104,358 155,449
Note : All values are in LKR '000s, unless otherwise stated. Figures in brackets indicate deductions. The above figures are not audited.
*PPE (Property, plant and equipment), IA (Intangible assets), LRPA (Lease rentals paid in advance)

17
Operating segment information Business segments The following tables present revenue, profit information and other disclosures regarding Group's business segments.
Transportation Leisure Property Consumer Foods & Retail Financial Services Information Technology Others Group Total
For the Quarter ended 31 December 2017 2016 2017 2016 2017 2016 2017 2016 2017 2016 2017 2016 2017 2016 2017 2016
External revenue 4,754,366 3,169,473 6,062,660 6,497,193 165,076 487,468 13,433,509 11,859,726 2,804,795 2,171,078 3,163,229 3,036,001 832,535 716,367 31,216,170 27,937,306
Inter segment revenue 140,289 97,142 5,430 9,031 53,495 52,655 91,504 102,349 - - 73,337 57,709 237,292 194,893 601,347 513,779
Total segment revenue 4,894,655 3,266,615 6,068,090 6,506,224 218,571 540,123 13,525,013 11,962,075 2,804,795 2,171,078 3,236,566 3,093,710 1,069,827 911,260 31,817,517 28,451,085
Eliminations of inter segment revenue (601,347) (513,779)
Net revenue 31,216,170 27,937,306
Segment results 264,146 206,766 845,959 1,272,839 30,019 381,867 896,535 1,224,971 1,225,995 860,490 86,662 (605,611) (50,011) (1,250,731) 3,299,305 2,090,591
Finance cost (14,520) (7,574) (56,862) (47,610) (9,959) 2,546 (9,926) (4,647) - - (11,424) (1,710) (50,617) 55,905 (153,308) (3,090)
Finance income 36,023 31,893 100,446 123,052 21,910 12,301 38,655 69,518 25,039 30,843 10,519 11,273 1,477,287 1,762,769 1,709,879 2,041,649
Change in fair value of investment property
- - - - - 9,677 - - - - - - - - - 9,677
Share of results of equity accounted investees
660,035 614,517 15,963 18,361 - - - - 291,704 248,876 - - - - 967,702 881,754
Eliminations / adjustments (780) (759) (4,601) (4,206) (7,971) (210,472) 22,000 (3,000) - - - 790,785 (2,576) 1,131,638 6,072 1,703,986
Profit / (loss) before tax 944,904 844,843 900,905 1,362,436 33,999 195,919 947,264 1,286,842 1,542,738 1,140,209 85,757 194,737 1,374,083 1,699,581 5,829,650 6,724,567
Tax expense (60,432) (27,363) (261,825) (164,833) (6,866) (5,541) (273,898) (378,467) (1,280) 3,347 (29,087) (41,829) (391,906) (452,549) (1,025,294) (1,067,235)
Profit / (loss) for the period 884,472 817,480 639,080 1,197,603 27,133 190,378 673,366 908,375 1,541,458 1,143,556 56,670 152,908 982,177 1,247,032 4,804,356 5,657,332
Purchase and construction of PPE* 13,838 40,722 1,136,328 606,746 21,408 21,846 2,302,016 1,039,144 13,359 28,703 36,701 59,602 98,143 13,251 3,621,793 1,810,014
Addition to IA* - 4,400 - - - - 13,666 - 136,684 34,173 2,732 5,010 4,152 3,334 157,234 46,917
Depreciation of PPE* 28,600 50,648 362,302 773,490 8,366 8,830 258,391 400,338 17,567 40,222 32,409 65,698 37,448 66,195 745,083 1,405,421
Amortisation / impairment of IA* 769 840 13,572 33,546 193 247 3,530 5,978 54,227 109,821 1,810 5,108 4,758 10,263 78,859 165,803
Amortisation of LRPA* - - 103,331 308,985 5,077 9,469 757 885 - - - - 293 587 109,458 319,926
Gratuity provision and related costs 4,113 6,783 31,266 53,665 581 1,206 43,800 53,823 12,450 10,940 5,186 7,986 6,962 21,046 104,358 155,449
Note : All values are in LKR '000s, unless otherwise stated. Figures in brackets indicate deductions. The above figures are not audited.
*PPE (Property, plant and equipment), IA (Intangible assets), LRPA (Lease rentals paid in advance)

18 John Keells Holdings PLC | Interim Condensed Financial Statements Nine months ended 31 December 2017
Operating segment information Business segments The following tables present revenue, profit information and other disclosures regarding Group's business segments.
Transportation Leisure Property Consumer Foods & Retail
Financial Services Information Technology Others Group Total
For the nine months ended 31 December 2017 2016 2017 2016 2017 2016 2017 2016 2017 2016 2017 2016 2017 2016 2017 2016
External revenue 12,291,331 7,655,267 16,758,666 17,745,368 500,951 949,334 39,350,862 34,195,187 7,587,920 6,099,523 8,613,298 7,710,334 2,559,388 2,070,132 87,662,416 76,425,145
Inter segment revenue 365,240 269,776 19,578 21,321 161,062 154,793 285,896 279,212 69 110 212,614 153,780 691,014 560,635 1,735,473 1,439,627
Total segment revenue 12,656,571 7,925,043 16,778,244 17,766,689 662,013 1,104,127 39,636,758 34,474,399 7,587,989 6,099,633 8,825,912 7,864,114 3,250,402 2,630,767 89,397,889 77,864,772
Eliminations of inter segment revenue (1,735,473) (1,439,627)
Net revenue 87,662,416 76,425,145
Segment result 585,431 546,430 1,705,197 3,110,168 126,868 476,818 3,025,906 4,016,656 1,171,049 765,421 517,038 (428,954) (278,431) (1,462,924) 6,853,058 7,023,615
Finance cost (39,562) (17,363) (175,318) (136,480) (24,569) (19,118) (18,311) (15,005) (309) (5) (25,280) (8,306) (130,732) (114,678) (414,081) (310,955)
Finance income 99,644 88,614 357,492 289,847 71,660 63,861 110,322 199,485 91,621 92,873 29,369 27,959 4,817,412 3,959,729 5,577,520 4,722,368
Change in fair value of investment property
- - - - - 9,677 - - - - - - - - - 9,677
Share of results of equity accounted investees
2,098,960 1,647,107 43,562 32,602 2,574 - - - 894,866 721,936 - - - - 3,039,962 2,401,645
Eliminations / adjustments 72,493 (41,794) (12,826) (12,618) (23,829) (225,910) 16,000 (9,000) - - (223,857) 790,785 (17,409) 1,131,638 (189,428) 1,633,101
Profit / (loss) before tax 2,816,966 2,222,994 1,918,107 3,283,519 152,704 305,328 3,133,917 4,192,136 2,157,227 1,580,225 297,270 381,484 4,390,840 3,513,765 14,867,031 15,479,451
Tax expense (119,047) (59,773) (453,496) (402,785) (31,564) (26,405) (915,285) (1,216,590) (5,809) 4,066 (92,517) (97,652) (1,421,012) (1,182,443) (3,038,730) (2,981,582)
Profit / (loss) for the period 2,697,919 2,163,221 1,464,611 2,880,734 121,140 278,923 2,218,632 2,975,546 2,151,418 1,584,291 204,753 283,832 2,969,828 2,331,322 11,828,301 12,497,869
Purchase and construction of PPE* 409,208 68,162 2,668,396 1,290,323 28,491 21,994 4,034,505 1,781,377 26,743 45,170 179,251 85,783 160,152 19,649 7,506,746 3,312,458
Addition to IA* - 4,400 - - - - 14,052 - 144,971 56,582 7,013 7,737 14,278 3,334 180,314 72,053
Depreciation of PPE* 82,858 75,401 1,320,423 1,163,997 19,137 16,170 742,123 600,606 53,776 60,832 107,777 97,191 98,336 99,849 2,424,430 2,114,046
Amortisation / impairment of IA* 2,306 1,260 47,118 50,319 579 580 10,144 8,964 165,091 165,042 5,571 7,897 14,381 15,348 245,190 249,410
Amortisation of LRPA* - - 309,450 466,901 15,230 15,230 1,926 885 - - - - 880 880 327,486 483,896
Gratuity provision and related costs 12,980 10,162 98,842 83,099 2,259 2,013 98,118 80,705 24,968 16,509 15,025 13,017 32,662 32,014 284,854 237,519
Note : All values are in LKR '000s, unless otherwise stated. Figures in brackets indicate deductions. The above figures are not audited.
*PPE (Property, plant and equipment), IA (Intangible assets), LRPA (Lease rentals paid in advance)
Notes to the Interim Condensed Financial Statements

19
Operating segment information Business segments The following tables present revenue, profit information and other disclosures regarding Group's business segments.
Transportation Leisure Property Consumer Foods & Retail
Financial Services Information Technology Others Group Total
For the nine months ended 31 December 2017 2016 2017 2016 2017 2016 2017 2016 2017 2016 2017 2016 2017 2016 2017 2016
External revenue 12,291,331 7,655,267 16,758,666 17,745,368 500,951 949,334 39,350,862 34,195,187 7,587,920 6,099,523 8,613,298 7,710,334 2,559,388 2,070,132 87,662,416 76,425,145
Inter segment revenue 365,240 269,776 19,578 21,321 161,062 154,793 285,896 279,212 69 110 212,614 153,780 691,014 560,635 1,735,473 1,439,627
Total segment revenue 12,656,571 7,925,043 16,778,244 17,766,689 662,013 1,104,127 39,636,758 34,474,399 7,587,989 6,099,633 8,825,912 7,864,114 3,250,402 2,630,767 89,397,889 77,864,772
Eliminations of inter segment revenue (1,735,473) (1,439,627)
Net revenue 87,662,416 76,425,145
Segment result 585,431 546,430 1,705,197 3,110,168 126,868 476,818 3,025,906 4,016,656 1,171,049 765,421 517,038 (428,954) (278,431) (1,462,924) 6,853,058 7,023,615
Finance cost (39,562) (17,363) (175,318) (136,480) (24,569) (19,118) (18,311) (15,005) (309) (5) (25,280) (8,306) (130,732) (114,678) (414,081) (310,955)
Finance income 99,644 88,614 357,492 289,847 71,660 63,861 110,322 199,485 91,621 92,873 29,369 27,959 4,817,412 3,959,729 5,577,520 4,722,368
Change in fair value of investment property
- - - - - 9,677 - - - - - - - - - 9,677
Share of results of equity accounted investees
2,098,960 1,647,107 43,562 32,602 2,574 - - - 894,866 721,936 - - - - 3,039,962 2,401,645
Eliminations / adjustments 72,493 (41,794) (12,826) (12,618) (23,829) (225,910) 16,000 (9,000) - - (223,857) 790,785 (17,409) 1,131,638 (189,428) 1,633,101
Profit / (loss) before tax 2,816,966 2,222,994 1,918,107 3,283,519 152,704 305,328 3,133,917 4,192,136 2,157,227 1,580,225 297,270 381,484 4,390,840 3,513,765 14,867,031 15,479,451
Tax expense (119,047) (59,773) (453,496) (402,785) (31,564) (26,405) (915,285) (1,216,590) (5,809) 4,066 (92,517) (97,652) (1,421,012) (1,182,443) (3,038,730) (2,981,582)
Profit / (loss) for the period 2,697,919 2,163,221 1,464,611 2,880,734 121,140 278,923 2,218,632 2,975,546 2,151,418 1,584,291 204,753 283,832 2,969,828 2,331,322 11,828,301 12,497,869
Purchase and construction of PPE* 409,208 68,162 2,668,396 1,290,323 28,491 21,994 4,034,505 1,781,377 26,743 45,170 179,251 85,783 160,152 19,649 7,506,746 3,312,458
Addition to IA* - 4,400 - - - - 14,052 - 144,971 56,582 7,013 7,737 14,278 3,334 180,314 72,053
Depreciation of PPE* 82,858 75,401 1,320,423 1,163,997 19,137 16,170 742,123 600,606 53,776 60,832 107,777 97,191 98,336 99,849 2,424,430 2,114,046
Amortisation / impairment of IA* 2,306 1,260 47,118 50,319 579 580 10,144 8,964 165,091 165,042 5,571 7,897 14,381 15,348 245,190 249,410
Amortisation of LRPA* - - 309,450 466,901 15,230 15,230 1,926 885 - - - - 880 880 327,486 483,896
Gratuity provision and related costs 12,980 10,162 98,842 83,099 2,259 2,013 98,118 80,705 24,968 16,509 15,025 13,017 32,662 32,014 284,854 237,519
Note : All values are in LKR '000s, unless otherwise stated. Figures in brackets indicate deductions. The above figures are not audited.
*PPE (Property, plant and equipment), IA (Intangible assets), LRPA (Lease rentals paid in advance)
20 John Keells Holdings PLC | Interim Condensed Financial Statements Nine months ended 31 December 2017
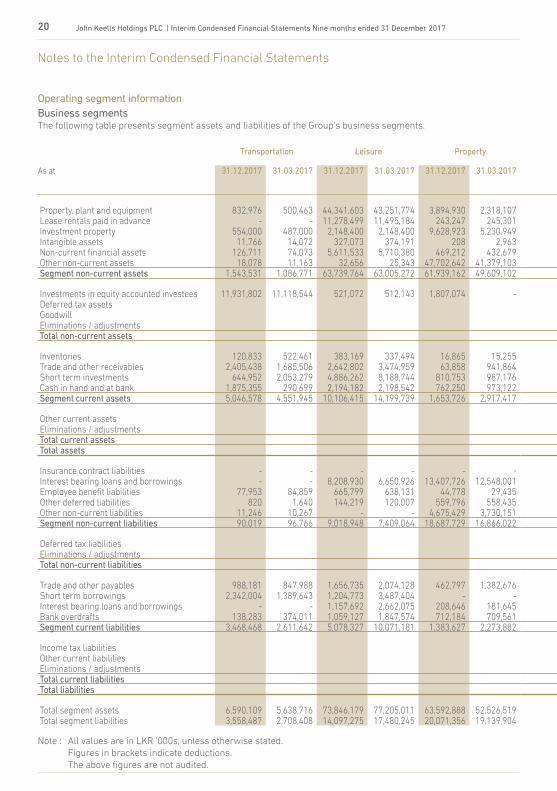
Operating segment information Business segments The following table presents segment assets and liabilities of the Group’s business segments. .
Transportation Leisure Property Consumer Foods & Retail Financial Services Information Technology Others Group Total
As at 31.12.2017 31.03.2017 31.12.2017 31.03.2017 31.12.2017 31.03.2017 31.12.2017 31.03.2017 31.12.2017 31.03.2017 31.12.2017 31.03.2017 31.12.2017 31.03.2017 31.12.2017 31.03.2017
Property, plant and equipment 832,976 500,463 44,341,603 43,251,774 3,894,930 2,318,107 12,572,335 9,290,844 2,005,469 1,498,964 328,950 260,153 1,332,631 1,287,795 65,308,894 58,408,100 Lease rentals paid in advance - - 11,278,499 11,495,184 243,247 245,301 147,019 174,701 - - - - 39,798 40,679 11,708,563 11,955,865 Investment property 554,000 487,000 2,148,400 2,148,400 9,628,923 5,230,949 207,042 207,042 - - - - 3,434,063 3,434,063 15,972,428 11,507,454 Intangible assets 11,766 14,072 327,073 374,191 208 2,963 41,594 37,685 871,426 891,546 29,750 28,305 32,871 30,802 1,314,688 1,379,564 Non-current financial assets 126,711 74,073 5,611,533 5,710,380 469,212 432,679 259,361 226,097 28,863,291 23,645,619 57,162 57,131 3,011,796 2,827,038 38,399,066 32,973,017 Other non-current assets 18,078 11,163 32,656 25,343 47,702,642 41,379,103 726,539 553,357 80,256 51,378 13,017 15,994 32,263 21,603 48,605,451 42,057,941 Segment non-current assets 1,543,531 1,086,771 63,739,764 63,005,272 61,939,162 49,609,102 13,953,890 10,489,726 31,820,442 26,087,507 428,879 361,583 7,883,422 7,641,980 181,309,090 158,281,941
Investments in equity accounted investees 11,931,802 11,118,544 521,072 512,143 1,807,074 - - - 7,143,685 6,088,200 - - - - 21,403,633 17,718,887 Deferred tax assets 162,741 143,548 Goodwill 738,596 738,596 Eliminations / adjustments (4,543,130) (4,574,829) Total non-current assets 199,070,930 172,308,143
Inventories 120,833 522,461 383,169 337,494 16,865 15,255 4,200,251 3,840,380 21,521 14,966 778,540 676,063 361,230 217,483 5,882,409 5,624,102 Trade and other receivables 2,405,438 1,685,506 2,642,802 3,474,959 63,858 941,864 2,946,768 2,720,088 847,159 1,415,290 2,367,649 1,938,636 456,601 1,084,448 11,730,275 13,260,791 Short term investments 644,952 2,053,279 4,886,262 8,188,744 810,753 987,176 1,107,774 553,219 9,349,923 9,318,833 1,094,834 994,577 50,704,116 60,565,974 68,598,614 82,661,802 Cash in hand and at bank 1,875,355 290,699 2,194,182 2,198,542 762,250 973,122 634,457 232,360 587,545 336,648 185,740 580,119 378,144 456,679 6,617,673 5,068,169 Segment current assets 5,046,578 4,551,945 10,106,415 14,199,739 1,653,726 2,917,417 8,889,250 7,346,047 10,806,148 11,085,737 4,426,763 4,189,395 51,900,091 62,324,584 92,828,971 106,614,864
Other current assets 3,741,415 3,265,327 Eliminations / adjustments (1,505,465) (4,916,572) Total current assets 95,064,921 104,963,619 Total assets 294,135,851 277,271,762
Insurance contract liabilities - - - - - - - - 34,955,793 31,700,278 - - - - 34,955,793 31,700,278 Interest bearing loans and borrowings - - 8,208,930 6,650,926 13,407,726 12,548,001 1,462,522 289,896 - - 34,961 - 12,000 12,000 23,126,139 19,500,823 Employee benefit liabilities 77,953 84,859 665,799 638,131 44,778 29,435 612,724 549,079 153,056 138,656 110,972 106,889 387,591 333,238 2,052,873 1,880,287 Other deferred liabilities 820 1,640 144,219 120,007 559,796 558,435 44,734 55,490 - - - - 643 103,991 750,212 839,563 Other non-current liabilities 11,246 10,267 - - 4,675,429 3,730,151 174,789 193,464 - - - - - - 4,861,464 3,933,882 Segment non-current liabilities 90,019 96,766 9,018,948 7,409,064 18,687,729 16,866,022 2,294,769 1,087,929 35,108,849 31,838,934 145,933 106,889 400,234 449,229 65,746,481 57,854,833
Deferred tax liabilities 2,696,934 2,336,241 Eliminations / adjustments (5,171,320) (5,298,859) Total non-current liabilities 63,272,095 54,892,215
Trade and other payables 988,181 847,988 1,656,735 2,074,128 462,797 1,382,676 7,075,668 5,293,347 1,764,197 1,955,235 2,033,388 1,994,141 490,783 768,391 14,471,749 14,315,906 Short term borrowings 2,342,004 1,389,643 1,204,773 3,487,404 - - - - - - - - 12,074 12,074 3,558,851 4,889,121 Interest bearing loans and borrowings - - 1,157,692 2,662,075 208,646 181,645 462,727 65,000 - - - 10,134 - - 1,829,065 2,918,854 Bank overdrafts 138,283 374,011 1,059,127 1,847,574 712,184 709,561 1,454,730 766,477 203,647 137,849 275,233 338,122 207,725 90,515 4,050,929 4,264,109 Segment current liabilities 3,468,468 2,611,642 5,078,327 10,071,181 1,383,627 2,273,882 8,993,125 6,124,824 1,967,844 2,093,084 2,308,621 2,342,397 710,582 870,980 23,910,594 26,387,990
Income tax liabilities 1,820,551 2,395,379 Other current liabilities 3,241,367 2,944,118 Eliminations / adjustments (1,330,799) (3,678,315) Total current liabilities 27,641,713 28,049,172 Total liabilities 90,913,808 82,941,387
Total segment assets 6,590,109 5,638,716 73,846,179 77,205,011 63,592,888 52,526,519 22,843,140 17,835,773 42,626,590 37,173,244 4,855,642 4,550,978 59,783,513 69,966,564 274,138,061 264,896,805 Total segment liabilities 3,558,487 2,708,408 14,097,275 17,480,245 20,071,356 19,139,904 11,287,894 7,212,753 37,076,693 33,932,018 2,454,554 2,449,286 1,110,816 1,320,209 89,657,075 84,242,823
Note : All values are in LKR '000s, unless otherwise stated. Figures in brackets indicate deductions. The above figures are not audited.
Notes to the Interim Condensed Financial Statements

21
Operating segment information Business segments The following table presents segment assets and liabilities of the Group’s business segments. .
Transportation Leisure Property Consumer Foods & Retail Financial Services Information Technology Others Group Total
As at 31.12.2017 31.03.2017 31.12.2017 31.03.2017 31.12.2017 31.03.2017 31.12.2017 31.03.2017 31.12.2017 31.03.2017 31.12.2017 31.03.2017 31.12.2017 31.03.2017 31.12.2017 31.03.2017
Property, plant and equipment 832,976 500,463 44,341,603 43,251,774 3,894,930 2,318,107 12,572,335 9,290,844 2,005,469 1,498,964 328,950 260,153 1,332,631 1,287,795 65,308,894 58,408,100 Lease rentals paid in advance - - 11,278,499 11,495,184 243,247 245,301 147,019 174,701 - - - - 39,798 40,679 11,708,563 11,955,865 Investment property 554,000 487,000 2,148,400 2,148,400 9,628,923 5,230,949 207,042 207,042 - - - - 3,434,063 3,434,063 15,972,428 11,507,454 Intangible assets 11,766 14,072 327,073 374,191 208 2,963 41,594 37,685 871,426 891,546 29,750 28,305 32,871 30,802 1,314,688 1,379,564 Non-current financial assets 126,711 74,073 5,611,533 5,710,380 469,212 432,679 259,361 226,097 28,863,291 23,645,619 57,162 57,131 3,011,796 2,827,038 38,399,066 32,973,017 Other non-current assets 18,078 11,163 32,656 25,343 47,702,642 41,379,103 726,539 553,357 80,256 51,378 13,017 15,994 32,263 21,603 48,605,451 42,057,941 Segment non-current assets 1,543,531 1,086,771 63,739,764 63,005,272 61,939,162 49,609,102 13,953,890 10,489,726 31,820,442 26,087,507 428,879 361,583 7,883,422 7,641,980 181,309,090 158,281,941
Investments in equity accounted investees 11,931,802 11,118,544 521,072 512,143 1,807,074 - - - 7,143,685 6,088,200 - - - - 21,403,633 17,718,887 Deferred tax assets 162,741 143,548 Goodwill 738,596 738,596 Eliminations / adjustments (4,543,130) (4,574,829) Total non-current assets 199,070,930 172,308,143
Inventories 120,833 522,461 383,169 337,494 16,865 15,255 4,200,251 3,840,380 21,521 14,966 778,540 676,063 361,230 217,483 5,882,409 5,624,102 Trade and other receivables 2,405,438 1,685,506 2,642,802 3,474,959 63,858 941,864 2,946,768 2,720,088 847,159 1,415,290 2,367,649 1,938,636 456,601 1,084,448 11,730,275 13,260,791 Short term investments 644,952 2,053,279 4,886,262 8,188,744 810,753 987,176 1,107,774 553,219 9,349,923 9,318,833 1,094,834 994,577 50,704,116 60,565,974 68,598,614 82,661,802 Cash in hand and at bank 1,875,355 290,699 2,194,182 2,198,542 762,250 973,122 634,457 232,360 587,545 336,648 185,740 580,119 378,144 456,679 6,617,673 5,068,169 Segment current assets 5,046,578 4,551,945 10,106,415 14,199,739 1,653,726 2,917,417 8,889,250 7,346,047 10,806,148 11,085,737 4,426,763 4,189,395 51,900,091 62,324,584 92,828,971 106,614,864
Other current assets 3,741,415 3,265,327 Eliminations / adjustments (1,505,465) (4,916,572) Total current assets 95,064,921 104,963,619 Total assets 294,135,851 277,271,762
Insurance contract liabilities - - - - - - - - 34,955,793 31,700,278 - - - - 34,955,793 31,700,278 Interest bearing loans and borrowings - - 8,208,930 6,650,926 13,407,726 12,548,001 1,462,522 289,896 - - 34,961 - 12,000 12,000 23,126,139 19,500,823 Employee benefit liabilities 77,953 84,859 665,799 638,131 44,778 29,435 612,724 549,079 153,056 138,656 110,972 106,889 387,591 333,238 2,052,873 1,880,287 Other deferred liabilities 820 1,640 144,219 120,007 559,796 558,435 44,734 55,490 - - - - 643 103,991 750,212 839,563 Other non-current liabilities 11,246 10,267 - - 4,675,429 3,730,151 174,789 193,464 - - - - - - 4,861,464 3,933,882 Segment non-current liabilities 90,019 96,766 9,018,948 7,409,064 18,687,729 16,866,022 2,294,769 1,087,929 35,108,849 31,838,934 145,933 106,889 400,234 449,229 65,746,481 57,854,833
Deferred tax liabilities 2,696,934 2,336,241 Eliminations / adjustments (5,171,320) (5,298,859) Total non-current liabilities 63,272,095 54,892,215
Trade and other payables 988,181 847,988 1,656,735 2,074,128 462,797 1,382,676 7,075,668 5,293,347 1,764,197 1,955,235 2,033,388 1,994,141 490,783 768,391 14,471,749 14,315,906 Short term borrowings 2,342,004 1,389,643 1,204,773 3,487,404 - - - - - - - - 12,074 12,074 3,558,851 4,889,121 Interest bearing loans and borrowings - - 1,157,692 2,662,075 208,646 181,645 462,727 65,000 - - - 10,134 - - 1,829,065 2,918,854 Bank overdrafts 138,283 374,011 1,059,127 1,847,574 712,184 709,561 1,454,730 766,477 203,647 137,849 275,233 338,122 207,725 90,515 4,050,929 4,264,109 Segment current liabilities 3,468,468 2,611,642 5,078,327 10,071,181 1,383,627 2,273,882 8,993,125 6,124,824 1,967,844 2,093,084 2,308,621 2,342,397 710,582 870,980 23,910,594 26,387,990
Income tax liabilities 1,820,551 2,395,379 Other current liabilities 3,241,367 2,944,118 Eliminations / adjustments (1,330,799) (3,678,315) Total current liabilities 27,641,713 28,049,172 Total liabilities 90,913,808 82,941,387
Total segment assets 6,590,109 5,638,716 73,846,179 77,205,011 63,592,888 52,526,519 22,843,140 17,835,773 42,626,590 37,173,244 4,855,642 4,550,978 59,783,513 69,966,564 274,138,061 264,896,805 Total segment liabilities 3,558,487 2,708,408 14,097,275 17,480,245 20,071,356 19,139,904 11,287,894 7,212,753 37,076,693 33,932,018 2,454,554 2,449,286 1,110,816 1,320,209 89,657,075 84,242,823
Note : All values are in LKR '000s, unless otherwise stated. Figures in brackets indicate deductions. The above figures are not audited.

22 John Keells Holdings PLC | Interim Condensed Financial Statements Nine months ended 31 December 2017
Notes to the Interim Condensed Financial Statements
1 CORPORATE INFORMATION John Keells Holdings PLC. is a public limited company incorporated and domiciled in Sri Lanka and listed on
the Colombo Stock Exchange. Ordinary shares of the company are listed on the Colombo Stock Exchange and Global Depository Receipts (GDRs) are listed on the Luxembourg Stock Exchange.
2 INTERIM CONDENSED FINANCIAL STATEMENTS The financial statements for the period ended 31 December 2017 , includes “the Company” referring to John
Keells Holdings PLC., as the holding company and “the Group” referring to the companies whose accounts have been consolidated therein.
3 APPROVAL OF FINANCIAL STATEMENTS The interim condensed financial statements of the Group and the Company for the 9 months ended 31
December 2017 were authorised for issue by the Board of Directors on 30 January 2018.
4 BASIS OF PREPARATION The interim condensed financial statements have been prepared in compliance with Sri Lanka Accounting
Standard LKAS 34 - Interim Financial Reporting. These interim condensed financial statements should be read in conjunction with the annual financial statements for the year ended 31 March 2017.
The presentation and classification of the financial statements of the previous period have been amended, where relevant, for better presentation and to be comparable with those of the current period.
The interim condensed financial statements are presented in Sri Lankan Rupees (LKR) and all values are rounded to the nearest thousand except when otherwise indicated.
5 OPERATING SEGMENTS For management purposes, the Group is organised into business units based on their products and services
and has seven reportable operating segments as follows: Transportation Leisure Property Consumer Foods & Retail Financial Services Information Technology Others
6 CHANGE IN INSURANCE CONTRACT LIABILITIES The results of Union Assurance PLC are consolidated line by line into the Group's consolidated
income statement. The change in insurance contract liabilities represents the transfer to the Life Fund, the difference between all income and expenditure attributable to life policy holders during the period.

23
7 BUSINESS COMBINATIONS AND ACQUISITIONS OF NON-CONTROLLING INTERESTS7.1 Obtaining control of subsidiaries Mack International Freight (Pvt) Ltd
In June 2017, Mack International Freight (Pvt) Ltd (formerly known as NDO Lanka (Pvt) Ltd), became a fully
owned subsidiary of the Group, arising from the buyout of the 40% stake from the other venture partner, for a
nominal value by John Keells Holdings PLC.
The fair value of assets acquired and liabilities assumed were as follows:
In LKR '000s Mack International
Freight (Pvt) Ltd
ASSETS
Cash 3,211
Trade and other receivables 125,200
Other current assets 26,425
Non-current financial assets 23,335
Non-current assets 524
Property, plant and equipment 1,445
LIABILITIES
Bank overdrafts (153,795)
Income tax liabilities (12,040)
Other current liabilities (795)
Trade and other payables (64,588)
Employee benefit liabilities (7,535)
Total identifiable net assets at fair value (58,613)
Share of net assets acquired (23,445)
Goodwill 23,445
Purchase consideration -
Bank overdraft directly settled by other venture partner 72,000
Cash and cash equivalent acquired (150,584)
Net cash outflow on acquisition of the subsidiary (78,584)
7.2 Increase in interest in subsidiaries Waterfront Properties (Pvt) Ltd John Keells Holdings PLC. (JKH) further invested LKR 4,202Mn in Waterfront Properties (Pvt) Ltd, a subsidiary
of JKH involved in developing, owning, managing, operating, selling, leasing and renting of a luxury multi/mixed use Integrated Resort.
Trans-Ware Logistics (Private) Limited In November 2017, Trans-Ware Logistics (Private) Limited, became a fully owned subsidiary of the Group,
arising from the buyout of the 50% stake from the other venture partners, for a cash consideration of LKR 305Mn by John Keells Holdings PLC.

24 John Keells Holdings PLC | Interim Condensed Financial Statements Nine months ended 31 December 2017
Notes to the Interim Condensed Financial Statements
7 BUSINESS COMBINATIONS AND ACQUISITIONS OF NON-CONTROLLING INTERESTS (Contd.)
7.3 Investment in equity accounted investees Baybrook Residential Properties (Pvt) Ltd In September 2017, the Group acquired a 50% stake with a total investment of LKR 1,804Mn in Baybrook
Residential Properties (Pvt) Ltd. (formally known as Indra Holdings (Pvt) Ltd).
Nations Trust Bank PLC (NTB) The Director of Bank Supervision of the Central Bank of Sri Lanka (CBSL) has by letter dated 12 October 2017
informed NTB that the Monetary Board of the CBSL has permitted the John Keells Group to retain its current shareholdings in the Bank till 31 December 2020 and to reduce it to 15 per cent with effect from that date. The Monetary Board has also required NTB to limit the voting rights of the John Keells Group to 10 per cent with effect from 31 March 2018. NTB will continue to be an associate company of the JKH Group. The Group's External Auditors have concurred with this position.
7.4 Disposal of a subsidiary John Keells BPO Solutions India (Pvt) Ltd In September 2017, the Group disposed of its 100% interest in John Keells BPO Solutions India (Pvt) Ltd for a
sales consideration of LKR 633Mn.
The fair value of assets and liabilities disposed were as follows:
In LKR '000s
John Keells
BPO Solutions
India (Pvt) Ltd
ASSETS
Cash 277,276
Short term investments 65,789
Trade and other receivables 287,142
Other current assets 81,657
Property, plant and equipment 48,741
LIABILITIES
Bank overdrafts (3,828)
Income tax liabilities (27,756)
Other current liabilities (5,121)
Trade and other payables (109,937)
Employee benefit liabilities (8,763)
Total identifiable net assets at fair value 605,200
Gain on disposal 28,575
Sales consideration 633,775
Deferred sales consideration (153,163)
Cash and cash equivalent disposed (273,448)
Net cash inflow on disposal of non current investments 207,164

25
8 TAX EXPENSE The Inland Revenue Act No. 24 of 2017 was certified on 24 October 2017 and is effective from 1 April 2018.
Accordingly, Income tax provisions for the period ended 31 December 2017 were made based on rates applicable for Year of Assessment 2017/18 with Deferred tax for the same period being computed based on rates applicable post 1 April 2018, other than for any impact on Land revaluations, which is currently being evaluated.
Group Company
For the nine months ended 31 December 2017 2016 2017 2016
In LKR '000s
Income statement
Current income tax 2,804,110 2,862,709 1,034,659 780,448
Deferred tax charge/(reversal) 234,620 118,873 - -
3,038,730 2,981,582 1,034,659 780,448
Other comprehensive Income
Deferred tax charge/(reversal) (22,708) (1,185) - -
(22,708) (1,185) - -
9 RELATED PARTY TRANSACTIONS
Group Company
For the nine months ended 31 December 2017 2016 2017 2016
In LKR '000s
Transactions with related parties
Subsidiaries
Purchase of goods - - 16,973 2,961
Rendering of services - - 628,923 508,365
Receiving of services - - 44,256 54,325
Rent paid - - 28,880 26,670
Equity accounted investees
Sale of goods 5,681 11,488 - -
Rendering of services 483,006 380,731 254,533 207,711
Receiving of services 373,133 327,925 1,228 203
Interest received 199,146 173,318 94,534 70,206
Interest paid 1,340 7,627 - -
Key management personnel (KMP)
Sale of goods - - - -
Close family members of KMP
Sale of goods - - - -
Companies controlled/jointly controlled/significantly influenced by KMP and their close family members of KMP
Sale of goods - - - -
Post employment benefit plan
Contributions to the provident fund 203,057 192,813 48,387 43,105

26 John Keells Holdings PLC | Interim Condensed Financial Statements Nine months ended 31 December 2017
Notes to the Interim Condensed Financial Statements
10 SHARE INFORMATION10.1 Stated capital Stated capital is represented by the number of shares in issue as given below:
As at 31-12-2017 30-09-2017
Ordinary shares* 1,387,501,097 1,387,495,797 * Includes global depository receipts of 1,320,942 (30.09.2017 - 1,320,942).
10.2 Public share holdings Percentage of shares held by the public and the number of public shareholders is as given below:
As at 31-12-2017 30-09-2017
Public share holding (%) 97.53 97.53
Public share holders 11,358 10,992
10.3 Net assets per share Net assets per share have been calculated, for all periods, based on the number of shares in issue as at 31
December 2017.
10.4 Market price per share The Company's highest, lowest and last traded market price is as given below:
For the quarter ended 31 December 2017
LKR.
2016
LKR.
Highest 166.10 158.00
Lowest 145.00 143.00
Last traded 148.50 145.00
10.5 Directors' share holdings The number of shares held by the Board of Directors (including their spouses) are as given below:
As at 31-12-2017 30-09-2017
S C Ratnayake – Chairman/CEO 9,241,144 9,241,144
A D Gunewardene – Deputy Chairman (Retired w.e.f. 31 December 2017) 10,989,350 10,989,350
J R F Peiris (Retired w.e.f. 31 December 2017) 2,966,800 2,966,800
K N J Balendra 10,914,400 10,914,400
J G A Cooray 207,105 207,105
D A Cabraal 137 137
A N Fonseka Nil Nil
M A Omar Nil Nil
M P Perera Nil Nil
S S H Wijayasuriya Nil Nil
27
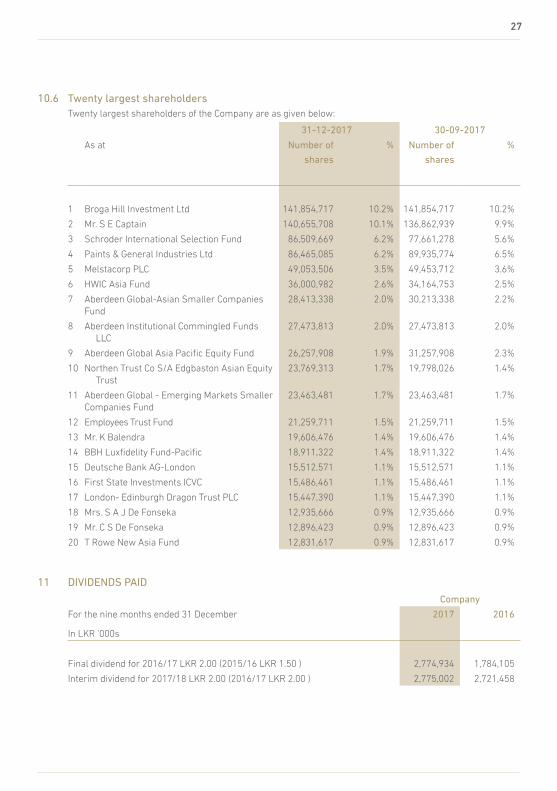
10.6 Twenty largest shareholders Twenty largest shareholders of the Company are as given below:
31-12-2017 30-09-2017
As at Number of
shares
% Number of
shares
%
1 Broga Hill Investment Ltd 141,854,717 10.2% 141,854,717 10.2%
2 Mr. S E Captain 140,655,708 10.1% 136,862,939 9.9%
3 Schroder International Selection Fund 86,509,669 6.2% 77,661,278 5.6%
4 Paints & General Industries Ltd 86,465,085 6.2% 89,935,774 6.5%
5 Melstacorp PLC 49,053,506 3.5% 49,453,712 3.6%
6 HWIC Asia Fund 36,000,982 2.6% 34,164,753 2.5%
7 Aberdeen Global-Asian Smaller Companies Fund
28,413,338 2.0% 30,213,338 2.2%
8 Aberdeen Institutional Commingled Funds LLC
27,473,813 2.0% 27,473,813 2.0%
9 Aberdeen Global Asia Pacific Equity Fund 26,257,908 1.9% 31,257,908 2.3%
10 Northen Trust Co S/A Edgbaston Asian Equity Trust
23,769,313 1.7% 19,798,026 1.4%
11 Aberdeen Global - Emerging Markets Smaller Companies Fund
23,463,481 1.7% 23,463,481 1.7%
12 Employees Trust Fund 21,259,711 1.5% 21,259,711 1.5%
13 Mr. K Balendra 19,606,476 1.4% 19,606,476 1.4%
14 BBH Luxfidelity Fund-Pacific 18,911,322 1.4% 18,911,322 1.4%
15 Deutsche Bank AG-London 15,512,571 1.1% 15,512,571 1.1%
16 First State Investments ICVC 15,486,461 1.1% 15,486,461 1.1%
17 London- Edinburgh Dragon Trust PLC 15,447,390 1.1% 15,447,390 1.1%
18 Mrs. S A J De Fonseka 12,935,666 0.9% 12,935,666 0.9%
19 Mr. C S De Fonseka 12,896,423 0.9% 12,896,423 0.9%
20 T Rowe New Asia Fund 12,831,617 0.9% 12,831,617 0.9%
11 DIVIDENDS PAID
Company
For the nine months ended 31 December 2017 2016
In LKR '000s
Final dividend for 2016/17 LKR 2.00 (2015/16 LKR 1.50 ) 2,774,934 1,784,105
Interim dividend for 2017/18 LKR 2.00 (2016/17 LKR 2.00 ) 2,775,002 2,721,458

28 John Keells Holdings PLC | Interim Condensed Financial Statements Nine months ended 31 December 2017
Notes to the Interim Condensed Financial Statements
12 CONTINGENCIES, CAPITAL AND OTHER COMMITMENTS There has been no significant change in the nature of the contingencies and other commitments, which were
disclosed in the annual report for the year ended 31 March 2017.
13 EVENTS AFTER THE REPORTING PERIOD Nation Trust Bank PLC (NTB) On 12th January 2018, the shareholders of NTB approved to issue 40,105,614 Ordinary Non-Voting Convertible
Shares in the proportion of four (4) Ordinary Non-Voting Convertible Shares for every twenty three (23) Ordinary Shares held in the capital of the bank by way of a Rights Issue, at a price of Rupees eighty (LKR 80/-) per share. The last date for the acceptance and payment for the rights is 30 January 2018. The John Keells Group has subscribed to its entitlement of rights and also applied for additional rights (if available).
Interim Dividend The Board of Directors of the Company declared a second interim dividend of LKR 2.00 per share for the
financial year 2017/18. As required by section 56 (2) of the Companies Act No. 07 of 2007, the Board of Directors have confirmed that the Company satisfied the solvency test in accordance with section 57 of the Companies Act No. 07 of 2007, and obtained a certificate from the auditors, prior to declaring the dividend, which is to be paid on 22 February 2018.

Corporate Information
Name of CompanyJohn Keells Holdings PLC
Legal FormPublic Limited Liability CompanyIncorporated in Sri Lanka in 1979
Ordinary Shares listed on the Colombo Stock ExchangeGDRs listed on the Luxembourg Stock Exchange
Company Registration No.PQ 14
DirectorsS C Ratnayake - Chairman/CEOK N J Balendra - Deputy ChairmanJ G A CoorayD A CabraalA N FonsekaM A OmarM P PereraS S H Wijayasuriya
Senior Independent DirectorA N Fonseka
Audit CommitteeA N Fonseka - ChairmanD A CabraalM P Perera
Human Resources and Compensation CommitteeD A Cabraal - ChairmanM A OmarS S H Wijayasuriya
Nominations CommitteeM A Omar - ChairmanM P PereraS C RatnayakeS S H Wijayasuriya
Related Party Transaction Review CommitteeM P Perera - ChairpersonD A CabraalA N FonsekaS C Ratnayake
Registered Office of the Company117 Sir Chittampalam A. Gardiner Mawatha,Colombo 2, Sri LankaTelephone : +94 11 230 6000Internet : www.keells.comEmail : [email protected]
SecretariesKeells Consultants (Private) Limited117 Sir Chittampalam A. Gardiner Mawatha,Colombo 2, Sri LankaTelephone : +94 11 230 6245Facsimile : +94 11 243 9037
Investor RelationsJohn Keells Holdings PLC117 Sir Chittampalam A. Gardiner Mawatha,Colombo 2, Sri LankaTelephone : +94 11 230 6166Facsimile : +94 11 230 6160Email : [email protected]
Sustainability, Enterprise Risk Management and Group Initiatives186 Vauxhall StreetColombo 2, Sri LankaTelephone : +94 11 230 6182Facsimile : +94 11 230 6249Email : [email protected]
Contact for MediaCorporate Communications DivisionJohn Keells Holdings PLC117 Sir Chittampalam A. Gardiner Mawatha,Colombo 2, Sri LankaTelephone : +94 11 230 6191Email : [email protected]
AuditorsErnst & YoungChartered AccountantsP.O. Box 101Colombo, Sri Lanka
Bankers for the CompanyBank of CeylonCitibank N.A.Commercial Bank of CeylonDeutsche Bank A.G.DFCC BankHabib BankHatton National BankHongkong and Shanghai Banking CorporationMCB BankNational Savings BankNations Trust BankNDB BankPan Asia Banking CorporationPeople’s BankSampath BankSeylan BankStandard Chartered Bank
Depository for GDRsCitibank N.A. New York

www.keells.com