Embed Size (px)
Citation preview

0
Corporate Tax Planning and Stock Returns
Shane Heitzman
Maria Ogneva
University of Southern California – Marshall School of Business
October 30, 2015
Abstract
This paper investigates the asset pricing implications of corporate tax planning. Tax planning
influences real and reported activities to optimize expected tax liabilities. As a result, it changes
the amounts, timing and variance of corporate cash flows. Basic intuition suggests that tax
planning can significantly influence firm value by changing expected after-tax cash flows. It is
less clear whether it can also affect expected returns. By exposing the firm to higher uncertainty
associated with government actions, tax planning may increase the firm’s non-diversifiable risk.
Our results suggest that a tax planning-based risk premium exists but depends on firm size, the
political party of the President, and the ideology of US Tax Court judges. These results have
implications for assessing the importance of tax planning risks in the contexts of both capital
markets and corporate governance and control. While the expected cash flows should remain the
primary focus of evaluating the net present value of tax strategy, managers, boards and investors
should also consider the impact of tax strategy on discount rates.
Keywords: Tax Planning; Tax Avoidance; Risk; Asset Pricing
We appreciate the comments and suggestions of Michelle Hanlon, Ed Maydew and participants at the 2015 Oxford Tax
Symposium and the discussant Robert Ullman. This paper benefited from conversations with Robert Novy-Marx and Cliff Smith.
Email: [email protected]; [email protected]

1
Corporate Tax Planning and Stock Returns
1. Introduction
Corporate tax planning investments generate cash flows for shareholders by reducing the
share of asset returns paid to the tax authority. These risky cash flows must then be priced.
Relative to other key corporate finance decisions—capital structure and payout policy, for
example—we know surprisingly little about the capital market implications of tax planning. The
purpose of this paper is twofold: to motivate the conditions under which tax planning
investments affect investors’ risk exposure and to provide empirical evidence on the association
between tax planning and investors’ expected returns, a first-order determinant of share values.
The impact of corporate tax planning on security values depends on how tax planning affects
after-tax cash flows and the discount rate. The numerator in a typical valuation model picks up
the effect of tax planning on expected cash flows (cash tax savings less the costs of defending the
position, accounting and audit costs, restructuring costs and agency costs).1 In the denominator,
the discount rate reflects investors’ exposure to risk, specifically risk that cannot be eliminated
through diversification. Tax planning investment affects risk by increasing the variance of after-
tax cash flows. However, it is not clear a priori how it should affect expected returns, if at all.
Risk driven by randomness in the audit process for example should not require a risk premium.
When tax planning risk is diversifiable, incremental cash flows becomes the only relevant metric
for investor valuation and tax strategy purposes (ignoring agency considerations). But if this
strategy exposes investors to systematic risk, investors should demand a risk premium. To the
extent these premiums are more than negligible, they should be detectable in firms’ stock returns.
1 These net cash flow benefits clearly exist but can be challenging to document since the costs of tax planning
primarily affect earnings before tax while the benefits of tax planning are difficult to infer given the limited
disclosure required by financial reporting rules. See Hanlon and Heitzman (2010) for a review of the recent
literature.
2
To motivate the potential for tax planning to affect investors’ risk exposure, consider the
government’s resemblance to a minority shareholder with a legal claim to a share of the firm’s
economic profits (Desai, Dyck and Zingales 2007). What makes this claim on firm value unique
is that this sharing rule varies, both over time and in the cross-section, depending on how
managers and the government behave. Corporate tax planning by managers typically results in
transactions that reduce the share of corporate profits paid to the tax authority. This alters the
firm’s cost structure by reducing costs that have a relatively strong covariance with performance
(by lowering the effective marginal tax rate) and increasing costs that have a significantly weaker
covariance with performance (the fixed costs of tax planning). Thus, a leverage-like financial
risk arises that increases the volatility of residual cash flows to shareholders and should be
associated with higher betas.2
A more appealing question is whether the firm’s tax planning policies expose investors to
greater risk from future changes in the government’s tax policies. There is growing evidence to
suggest that exposure to government policy risks are important determinants of stock returns
(Boutchkova et al. 2012; Croce et al. 2012; Pastor and Veronesi 2013). Tax legislation,
enforcement and judicial decisions combine to determine the government’s claim on asset
returns. And every taxpayer faces some risk that this claim—the expected cash flows paid to
government—will change in the future. However, for such policy risk to affect expected stock
returns, it must be that the market expects tax policy changes to disproportionately affect high
tax planning firms, thereby creating a co-variation among their returns because of correlated
exposure to the shift in policy. This expectation might depend on business cycles (such as greater
2 In other words, in good times, shareholders benefit from a low marginal tax rate and hence have the equivalent of
levered cash flows, raising returns. In bad times, managers have limited flexibility to unwind the transactions
implemented precisely to reduce the marginal tax rate in good times. If tax planning increases investors’ exposure to
financial risk, it should be priced.

3
enforcement in bad times) or political cycles (such as greater enforcement in Democratic
administrations), and can vary in the cross section if firms differ in their adaptability to changing
tax rules.3
Across all potential sources of risk—and there could be others—the question is the same:
does the intensity of corporate tax planning affect expected stock returns? An empirical answer
to this question requires proxies for expected returns and tax planning intensity. Following prior
asset pricing research, we match historical accounting and tax information from year t – 1 with
monthly realized returns from July of year t through June of year t + 1.
Our primary tax planning proxy is an effective tax rate constructed from accrual-based
measures of tax expense and pretax income over a three year period. We adopt this measure over
the alternatives for several reasons. First, regressions of tax planning proxies on tax planning
determinants indicate that the variation in the effective tax rate is driven by factors with higher
tax uncertainty—international operations and mobile capital (R&D)—and not by variation in
capital intensity which affects the timing of the tax liability but not the uncertainty. Because our
tax planning proxy is accrual-based, it is potentially more informative about long-run tax
planning policies than a cash-based measure. Additionally, Armstrong, Blouin and Larcker
(2012) find that tax director compensation is most highly correlated with accrual-based effective
tax rates, suggesting it is a more informative measure about tax planning performance. Finally,
we show that accrual-based tax rates explain future settlement with the tax authority in the
predicted direction; other measures do not.
3 For example, a tax authority might respond to a negative demand shock with a more aggressive approach to firms
determined to “push the limits”, perhaps due to revenue or public pressure (Bagchi 2015). Similarly, Congress might
respond to a negative demand shock by increasing incentives for investment or loss carryback in a way that
primarily benefits tax-abiding firms. There is some evidence that the government responds to economic shocks both
in writing tax law (Romer and Romer 2010) and interpreting it (Brennan, Epstein and Staudt 2009). If more
intensive tax planning exposes shareholders to policy-based systematic risk, it should be priced.

4
We adopt industry-level measures of tax planning intensity to mitigate measurement error
driven by firm-specific short-run measures (Dyreng, Hanlon and Maydew 2008) and biased
inferences caused by dropping firms with losses (Henry and Sansing 2014).4 This approach
assumes that the potential for exposure to a tax planning risk factor is present for all firms, even
those with current losses, and that opportunities for tax planning are correlated with industry-
specific asset and operating characteristics.
The results in this study provide evidence of a tax planning-induced risk premium. The
average equal-weighted excess stock return for the portfolio of firms in industries with the lowest
accrual-based tax rates is 3.6% higher annually than the return on the portfolio of firms in
industries with the highest tax rates. These results are supported by cross-sectional regressions of
monthly returns on industry effective tax rates. 5
Tests based on tax planning sorts within size quintiles suggest that the tax planning-based
risk premium observed with equal-weighted returns is stronger in smaller firms. The average
value-weighted returns are significantly higher for the lowest effective tax rate portfolios than for
the highest effective tax rate portfolios, but only among the smallest stocks. This is not surprising
4 Problems attributed to firm-specific measures of tax planning include: a) bias caused by dropping or eliminating
firms with negative pretax income, b) the impact of idiosyncratic accounting shocks in the measurement of earnings,
c) the need for a long time series of data to calculate long-run cash tax rate measures, d) the relatively short time
series of data on unrecognized tax benefits, e) lack of observability due to incentives for opaque disclosures, f)
correlations between tax proxies and shocks to economic performance. In robustness tests, we examine the
sensitivity of the results to two firm-specific measures of tax planning: long run cash tax rates and the tax reserve for
uncertain tax benefits. 5 Of course, one can argue that the results are influenced by the mispricing of cash flows from tax planning. Suppose
investors systematically underweight the cash savings from tax planning. This will cause high tax planning firms to
have higher future returns as future cash flow realizations surprise investors. This could happen, for example, if
investors are misled by a manager’s decision to “over-reserve” for expected settlements with the tax authority. If this
mispricing explanation is valid, however, it implies that the returns to an investment strategy that is long in high-tax
planning firms and short in low-tax planning firms will earn excess positive returns in years where tax policy is
more likely to be pro-taxpayer and negative in years where tax policy is more likely to be pro-government. It is also
possible this risk premium will vary over time. If governmental responses to tax planning are expected to be more
severe during Democratic presidencies, the risk premium required to invest in high tax planning firms will increase.
This runs counter to the argument that cash flows are somehow mispriced. Chi, Pincus and Teoh (2013) argue that
firms with low tax liabilities are overpriced and generate low future earnings and returns, suggesting that firms with
low tax rates should also have lower returns. Our results do not support this.

5
if small firms find it costlier to hedge against future shifts in tax policy or protect their interest
through political influence, or if the exposure to policy changes at large firms is lower because
such firms are already under continuous audit by the tax authority.
We also examine whether the tax planning premium is associated with time-varying factors
that capture increased uncertainty in government reactions to corporate tax planning. We find
evidence that a tax planning-based risk premium is stronger during Democratic presidencies, and
holds for both equal- and value-weighted returns suggesting it is less sensitive to size effects.
This is consistent with Bagchi (2015) who finds that IRS enforcement efforts increase when a
Democrat is in office and with Belo, Gala and Li (2013) who find that stock returns are higher
during Democratic presidencies for firms that benefit more from government spending. There is
also some evidence that the ideology of the US Tax Court, measured by the political party of
each judge’s appointing President, affects returns. In periods with more Democrat-appointed
judges on the Tax Court (19 judges each serving 15-year terms), stock returns are higher for high
tax planning firms. The results for both the President and Tax Court are consistent with an ex
ante premium to tax planning in periods of heighted risk of an adverse policy change. In contrast,
we find evidence that high tax planning firms generate higher returns during periods of low IRS
enforcement measured by corporate return audits. One explanation for this is that news about
low realized audit rates causes investors to revalue expected cash flows from prior tax planning.
This study contributes to the growing literature on the economic consequences of tax
planning and the specific properties of firms’ tax policies. An implicit assumption in this
literature is that greater tax planning has an effect on cash flow risk orthogonal to operating and
investing risks. Our paper provides two key innovations. First, we focus on the non-diversifiable
risk of tax planning, which is the only risk that should affects firms’ cost of capital in an efficient

6
market. Second, we consider a direct link between tax planning and firms’ systematic risk that
results from the correlated shocks due to government’s tax policy and tax enforcement changes.
This is motivated by the recent work on the pricing of policy uncertainty and stands in contrast to
existing studies that argue tax planning affects stock returns through corporate transparency.
That approach relies on strong assumptions about the link between tax planning and corporate
transparency as well as the pricing of transparency.
Our research also contributes to a growing body of evidence on the importance of economic
policy risk by focusing on a key element of fiscal policy: taxation and tax enforcement. Remarks
by the IRS, law firms, governance advisors and accounting firms point to the increasing
importance of managing tax risk.6 The evidence presented here on shareholders’ demand for a
premium to invest in firms with more intensive tax planning contributes to our understanding of
the pricing of the firm’s securities, and by extension, the types of company policies that will
maximize firm value. Moreover, understanding the valuation consequences of tax planning
appears crucial for the efficient design of incentives and organizational structures that exploit
value-enhancing opportunities for coordinated tax planning. Thus, our findings are relevant to
studies on the role of agency conflicts in tax planning and the broader discussion of tax risk
management occurring in the boardroom. While managers and boards should continue to focus
on the numerator—expected incremental cash flows—when evaluating tax planning
opportunities, our results suggest that denominator effects can be an important consideration
depending on the attributes of the firm, economic conditions and the political climate.7
6 IRS News Release IR-2009-95; “The Role of Executives, Counsel and Boards of Directors in Tax Risk Oversight”
Skadden, May 18, 2010; “Bridging the divide; Highlights from the 2014 Tax risk and controversy survey” Ernst and
Young 2014. 7 Of course, if the t-statistic cutoffs for statistical significance are increased following the suggestions of Harvey, Liu
and Zhu (2014], the strength of our inferences must be moderated.

7
2. Prior literature
2.1. Valuation consequences of tax planning
Economic intuition tells us that managers, properly incentivized, should adopt tax planning
strategies that maximize firm value.8 As firms have unique optimal investment and financing
choices, the efficient tax strategy will also be unique, leading to variation in tax planning over
time and across firms. If managers implement tax strategies that maximize firm value on
average, there should be no association between measures of tax planning and equity values.
However, if tax planning is associated with unresolved agency problems such predictions can
change. Desai and Dharmapala (2006) link aggressive tax planning to corporate opacity and
argue that the value of tax planning to shareholders is conditional on corporate governance.9 In
support of this, Desai and Dharmapala (2009) provide evidence that market-to-book, their proxy
for value, is increasing in tax avoidance but only among firms with more institutional
ownership.10 This interpretation relies on the argument that tax planning has a directional effect
on firm value and that the direction is conditional on external monitoring. Of course, agency
conflicts can cause managers to choose too much or little tax planning and thus any deviation
from optimal will reduce value. Consistent with this, Armstrong et al. (2014) provide evidence
suggesting that greater monitoring appears to reign in both overly-conservative and overly-
8 Agency conflicts complicate the matter if managerial preferences for tax strategy diverge from shareholder
preferences (Crocker and Slemrod 2005; Desai and Dharmapala 2006; Rego and Wilson 2012). 9 If opacity is required to hide aggressive tax positions from the tax authority, monitoring of managers also becomes
more difficult, reducing the manager’s cost to extract rents from shareholders (Desai and Dharmapala 2006). In this
world, more aggressive tax planning signals an increase in agency costs and self-serving managerial behavior, but
can be mitigated by greater monitoring. Kim, Li and Zhang (2011) provide evidence that firms that avoid more taxes
are also more likely to experience a future stock price crash, but this likelihood apparently falls with stronger
monitoring by analysts and institutions. 10 In related studies, Koester (2011) finds that the liability reserve for uncertain tax benefits is positively associated
with share values, suggesting that investors view aggressive tax planning activity as value-increasing. Koester, Lim
and Vigeland (2014) show that the valuation of this tax reserve falls when the internal controls have a tax-related
material weakness.

8
aggressive tax avoidance. Given incomplete models of optimal tax planning, an inherent
complexity and opacity of corporate tax reporting, and infrequent natural experiments, it has
been difficult to draw concrete inferences about the relation between tax planning and value.
In contrast to price-level studies, event studies offer the potential for more powerful
identification of tax-based effects. Hanlon and Slemrod (2009) examine market reactions to
allegations the firm is involved in a tax shelter. If this very aggressive form of tax planning is
value destroying, and the public allegation informs market participants about this activity (as
well as managers’ preference for it), the reaction should be negative. While they find negative
average market reactions across the entire tax shelter sample, firms that appear to be less
intensive tax planners have less negative market reactions, implying a positive market response
to news of aggressive tax avoidance among firms perceived as not aggressive enough
beforehand. Gallemore, Maydew and Thornock (2014) show that the average price declines at
the announcement of the allegations are only temporary, consistent with tax shelter participation
having minimal negative long-run effects on managerial reputation.11
2.2. Tax planning and risk
The notion of tax planning is broad and is often described with more colorful language
depending on the context: avoidance, aggressiveness, sheltering or evasion, for example. It
11 Examining market reactions to corporate inversion announcements, Desai and Hines (2002) and Cloyd, Mills and
Weaver (2003) find mixed evidence that the market responds systematically to announcements to relocate offshore.
Part of the difficulty in interpreting market reactions in the inversion case arise because of investor level tax effects.
In studies related to changes in accounting rules, Frischmann, Shevlin and Wilson (2008) examine the market’s
response to new uncertain tax benefit disclosure requirements under FIN48. They find little evidence that a firm’s
tax planning activity predicts stock returns around key FASB pronouncement dates related to FIN48, suggesting that
the new accounting rule has little expected effect on the costs or benefits of tax planning. When the event date is
centered on the firm’s initial disclosure of the tax reserve, stock returns are positive and increasing in the reserve,
suggesting that investors are, on average, positively surprised by the level of tax planning. Robinson and Schmidt
(2013) find that the market’s positive reaction to the initial disclosure of uncertain tax benefits is significantly
weaker when the firm’s disclosure quality is high, suggesting the value of aggressive tax planning is mitigated when
firms are more transparent (and thus more likely to have a weaker position when challenged).

9
requires intentional actions that involve structuring the organization, its investments, transactions
and reporting to exploit tax-based opportunities to increase shareholder wealth. These
opportunities can arise from investments that are tax favored, transactions that exploit ambiguity
in the tax law to reduce marginal tax costs, and discretion over the location, timing and
characterization of reported income and deductions in the tax returns. There should be little
disagreement that tax planning increases the riskiness of cash flows to investors: holding pretax
cash flows constant, any reduction in the marginal tax rate will increase the volatility of after-tax
cash flows.12 However, whether tax planning leads to higher expected returns depends on how it
affects the covariance of cash flows with performance and whether it changes the firm’s
exposure to tax policy shocks.
The idea that tax planning has implications for the risk profile of the firm is gaining traction.
Practitioner literature in tax management and corporate governance point to the increasing
prominence of tax risk considerations in corporate decision making and control (Levin et al.
2006; Larsen 2011; Ernst & Young 2014). Neubig and Sangha (2004) describe a number of tax-
based sources of risk that managers and directors should consider, some which apply to all firms
and other that apply only to firms that exploit ambiguity in the tax law. Though the distinction is
imperfect, one can think of tax risk as exposure to things in the manager’s control (tax
compliance activities, the location and type of investment and financial policies) as well as
things out of his control (political ideologies of the President and Congress, IRS budgets and
enforcement priorities, the macroeconomy, etc.). The IRS is becoming more outspoken on the
role of corporate governance structures in addressing tax risk, ostensibly to influence corporate
tax planning by appealing directly to those responsible for tax decision making and control.
12 Even if perfectly legal and certain, a reduction in the government’s claim to firm assets increases the variance of
returns to shareholders.

10
Recently, a number of studies address the basic link between tax planning and risk relying on
an indirect corporate transparency argument. They argue that if aggressive tax planning is
associated with greater asymmetric information a la Desai and Dharmapala (2006), and if
asymmetric information is priced, then greater tax planning will increase the cost of equity
capital. In contrast, one can appeal to the narrative in Gallemore and Labro (2015) who show that
firms engaged in more intensive tax planning actually require high quality information systems
to actually identify and support their tax planning strategies. Henry (2014) proposes a discount
rate explanation for the link between stock returns and tax expense surprises (Hanlon, Laplante
and Shevlin 2005; Thomas and Zhang 2014), and argues that tax surprises proxy for priced
information risk arising from earnings manipulation and tax planning-driven opacity (Francis et
al. 2005; Desai and Dharmapala 2006).13 In debt markets, Shevlin, Urcan and Vasvari (2013)
provide evidence that more aggressive tax avoidance leads to higher bond yields by reducing
transparency.
On the other hand, Goh et al. (2014) follow Gallemore and Labro and predict that greater tax
avoidance should decrease the cost of equity capital by enhancing information quality. Using
implied measures of expected returns and book-tax differences, and effective tax rates to
measure tax planning, they document a negative association between tax avoidance and expected
returns. This results in Shevlin et al. (2013) and Goh et al. (2014) are intriguing as one would
13 Henry (2014) uses variance decomposition techniques to link tax surprises to contemporaneous changes in stock
prices and concludes that changes in tax expense are correlated with changes in priced risk. The results in Henry
(2014) are difficult to interpret. Tax surprises appear negatively related to total news, although the effect is larger for
the portion of news attributed to changes in the discount rate. However, when the regressions are estimated on firms
with positive tax surprises only, the conditional association with discount rate news is only one-quarter the
magnitude of the association with cash flow news. Henry partitions the sample on the sign of tax surprise to obtain a
sort on firms more or less likely to have used tax expense to manage earnings, however, the sort on tax surprise is
also a sort on profitability and growth: firms with increasing tax expense are also the same firms with expanding
taxable profits.

11
expect tax-driven information quality problems to affect debt and equity in similar ways.14
Guenther, Matsunaga and Williams (2013) argue that the volatility of a firm’s cash tax payments
is more indicative of “tax risk” than the level of tax payments used in prior studies, and show
that the variance of a cash tax rate is positively correlated with future stock return volatility while
the level of the effective tax rate is not. Rego and Wilson (2012) argue that tax planning
increases risk and that risk-averse managers must be incentivized to undertake such risk.
Consistent with that, they document that CEOs with stronger wealth sensitivity to risk (portfolio
vega) appear to implement more risky tax strategies. However, they are silent on the link
between tax planning and priced risk.
This paper differs from existing work on several key dimensions. First, we provide a simple
descriptive theoretical framework to motivate the existence and pricing of a tax planning risk
factor. This contrasts with prior studies that either ignore the conditions under which tax
planning should lead to higher expected returns or rely on tenuous links between tax planning,
information quality and the pricing of information risk. Second, we employ standard empirical
asset pricing methodologies to test whether tax planning is associated with expected returns.15
Concurrent studies that measure expected returns using implied cost of capital measures suffer
from bias caused by correlations between tax planning proxies and earnings shocks, exclusion of
firms without analyst coverage and exclusion of firms with losses or negative expected earnings.
Third, we employ industry-level accrual-based proxies for tax planning. We use correlations
between tax planning proxies and firm’s exposure to future conflicts with the tax authority to
14 Hutchens and Rego (2013) also examine the association between a number of firm-specific tax proxies and the
discount rate implied by the relation between prices and analyst earnings forecasts. They find little evidence linking
tax planning proxies to expected returns. 15 See Core, Guay and Verdi (2008) and Barth, Konchitchki and Landsman (2013) for examples from the
accounting literature.

12
identify the proxy most consistent with our research question: accrual-based effective tax rates.
Moreover, we rely on the logical assumption that tax planning incentives and opportunities are
driven primarily by industry-based competition in product markets, organizational structure and
investment opportunities. Because expected returns are based on forward looking assumptions,
this allows us to maximize sample size and reduce bias induced by researchers’ typical selection
on historical profitability.
3. Theoretical development
3.1. Tax planning and financial risk
There are at least two potential channels through which tax planning should affect expected
returns: financial risk and tax policy risk. It is well known that financial leverage from debt
financing should be priced. Investors also appear to demand a risk premium to invest in firms
with higher operating leverage, that is, firms whose operating cost structure is comprised of
relatively greater fixed costs that have a lower covariance with the market (Lev, 1974; Novy-
Marx, 2011). In a similar vein, tax planning can exhibit leverage-like characteristics depending
on how it alters the total tax cost function.
To illustrate, consider the taxable firm. Notwithstanding the asymmetry in the taxation of
profits and losses embedded in the tax code, a firm’s tax costs absent planning will be highly
sensitive to profitability. When the firm engages in tax planning, it incurs new costs that to a first
approximation do not vary with economic performance—they are fixed (Mills, Erickson and
Maydew 1998). These costs include the costs of identifying tax planning transactions, direct
legal and accounting costs to structure the transactions, indirect costs when tax planning
activities affect the distribution of information within the firm, legal costs and opportunity costs
of managerial time if transactions are challenged by tax authorities, and lower pretax returns on

13
tax-favored investment structures. With positive demand shocks, shareholders benefit from the
lower marginal tax rate created by tax planning, generating the equivalent of leveraged cash
flows and raising returns. In bad times, managers have limited flexibility to unwind the
investments, transactions and policies implemented precisely to reduce the marginal tax rate in
good times. By reducing the covariance of tax costs with market performance, tax planning that
induces leverage-like behavior in the firm’s cost structure increases shareholders’ exposure to
financial risk that should affect financial risk.16
3.2. Tax planning and policy risk
A second channel runs through exposure to tax policy risk. Tax policy is a cornerstone of the
government’s economic policies. Uncertainty about the government’s policies can affect stock
returns in the cross-section if a) investors expect tax policies to change, and b) the expected
policy response has a disproportionate effect on firms that engage in more intensive tax planning.
A growing literature in financial economics addresses the link between policy uncertainty
and stock returns. In Pastor and Veronesi (2013), policy uncertainty matters because future
policy choices can affect firm cash flows independent of the broader economic conditions and
because of uncertainty about the impact of current policies on cash flows. Moreover, exposure to
policy risk is magnified in weak economic conditions if policies are more likely to change during
those times. Using the economic policy uncertainty index constructed by Baker, Bloom and
Davis (2012)—an instrument constructed from news coverage of policy uncertainty, expiration
of tax provisions, and macroeconomic forecast disagreement—they find consistent evidence that
periods of greater policy uncertainty are associated with stronger correlations in stock returns,
16 Of course, if tax planning does not affect cost structure in this way, it may not affect investors’ exposure to
systematic risk and thus will not be associated with returns through this channel.

14
higher risk premia, and risk premia that increase in weak economic conditions. In the cross
section, Belo, Gala and Li (2013) show that firms in industries exposed to government
expenditure policy (those in industries where more of the output is purchased by the government)
command risk premiums in periods when a Democrat holds the presidency.
The risks that derive from tax policy uncertainty result from at least three sources: tax
legislation, tax enforcement and judicial ideology. Analyzing several decades of tax legislation,
Romer and Romer (2010) conclude that tax legislation appears motivated by attempts to
encourage and stimulate long-term growth. In some periods, tax policy is countercyclical—
increasing tax burdens to slow down expansions while providing tax breaks to stimulate
investment and hiring in bad times. Only before the 1980s are tax changes spending driven.
Uncertainty about future tax legislation is a key component of the economic policy uncertainty
index of Baker et al. (2012). However, the extent to which uncertainty about tax legislation
matters more for investors in high tax planning firms is not obvious. If investors expect tax
legislation will directly target high tax planning firms (perhaps because the ability of these firms
to effectively manage taxes downward is a response to controversial tax rules or incentives
implemented to favor certain industries), then high tax planning firms should command a
premium. If not, the impact on expected returns is not clear.
Tax enforcement offers a more direct link between tax planning and policy uncertainty. The
government’s enforcement policies affect firms by changing the expected payoffs to tax
planning. These policies are likely a function of political ideologies and macroeconomic
conditions. For example, Bagchi (2015) finds that the political party of the President appears to
influence how IRS enforcement resources are allocated, specifically the number of returns that
get audited during the year. When a Democrat occupies the White House, more corporate returns

15
are audited. The number of corporate returns audited is also increasing in the federal deficit and
decreasing in GDP growth, consistent with revenue pressures driving variation in enforcement
efforts. Of course, the agency charged with enforcing tax laws sets tax policy other ways as well:
evidence from the Treasury Department’s anti-inversion guidance suggests targeted responses to
firms pursuing mergers with low-tax foreign partners (IRS Notice 2014-52), transactions viewed
politically as having primarily a tax avoidance motive.
Finally, an interesting question is whether uncertainty about judicial perceptions of tax
planning, and their impact on tax policy, also matter. This is relevant because controversial tax
strategies with high potential payoffs are those where the wedge between the firm’s and the tax
authority’s interpretations is large. Like enforcement, this offers a direct link between tax
planning choices and policy risk. Before a tax position is adopted, the firm forecasts expected
outcomes if challenged to determine expected cash flows. Ex post, when a dispute with the tax
authority arises, the firm and IRS assess the optimal settlement strategy, both forming
expectations of an uncertain judicial response. In both cases, knowing how the court is likely to
rule will impact the decision to adopt the tax plan or fight the challenge. The potential for a
systematic risk factor enters in if the court’s attitude toward tax planning shifts over time due to
economic or political forces. Brennan, Epstein and Staudt (2009) find that Supreme Court tax
decisions vary predictably, becoming pro-government in periods of depression. Staudt, Epstein,
and Wiedenbeck (2006) find that Supreme Court ideology (liberal vs. conservative) affects the
likelihood of a pro-government ruling. More liberal courts are more likely to rule against
corporate taxpayers, but are no different in their rulings against individual taxpayers. In this
paper, we consider time series variation in the composition of the US Tax Court, the venue
where most challenges to corporate tax planning are decided.

16
The collective evidence above suggests that economic policy uncertainty matters to investors,
and that tax enforcement and judicial ideology are particularly relevant tax policy instruments
that affect the government’s claim to firm cash flows through their targeted impact on firms
engaged in more tax planning (and hence more likely subject to enforcement or to end up in
court). Not only do tax laws, enforcement efforts and judicial beliefs change over time, they can
also be explained by the political ideology of the President and macroeconomic conditions. We
consider a variety of instruments designed to capture time-varying risk that the government’s tax
policies shift against firms that engage in more aggressive tax planning: including the political
party of the President, the intensity of corporate tax enforcement, and the composition of the Tax
Court.
3.3. Caveats
Despite these arguments, the theoretical and empirical progress on understanding tax
planning cost behavior and fiscal policy motivations is still early and incomplete, making room
for a credible (and interesting) null. The basic proposition that more intensive tax planning
increases the variance of after-tax cash flows and hence firm risk is unsurprising, but whether
investors require compensation for such risk is not obvious ex ante. If tax planning risks are
driven by enforcement outcomes that are largely idiosyncratic and diversifiable, there should be
no obvious risk premium. Even if a policy-based risk premium does exist, it may be too small to
detect or may switch signs over time. Moreover, if tax planning does not change the firm’s cost
structure in a way that leads to increased financial risk—for example, if tax planning investments
are reversible in bad times or managers have other ways to hedge the downside risk of these
positions—a risk premium should not exist. We also lack a robust and well-accepted theory on
the definition and measurement of tax planning risk, in part due to its correlation with business

17
risk and the interdependence of tax strategies. Ultimately, we adopt accrual-based effective tax
rates because they perform the best at predicting future settlements with the tax authority. With
that in mind, the growing importance of tax planning risk to regulators and practitioners suggests
a clear demand for evidence on the apparent economic consequences of tax planning.
4. Empirical Methodology
4.1. Sample and variable definitions
The sample consists of all U.S. firms traded on NYSE, AMEX or Nasdaq with at least two
years of Compustat coverage and monthly returns available from CRSP between July of 1988
and December 2013. The sample begins in 1988 to ensure consistency in the definitions of tax
expense. Stock returns from July of year t through June of year t + 1 are matched to accounting
and industry information for the fiscal year ending in year t – 1. Market returns are based on the
value-weighted market portfolio. Industry classifications are obtained from Compustat.
Tax planning measures
Following recent research, we rely on effective tax rates to measure the tax planning
intensity. Our setting requires a measure of exposure to future government actions that affect
payoffs to tax planning policies. Prior research provides little guidance on which proxies for tax
planning capture such risk best. To select the most appropriate measure, we examine correlations
between three commonly used candidate proxies (effective tax rates, cash tax rates and book-tax
differences) and subsequent adverse outcomes associated with the firm’s tax policy (tax
settlements). We measure tax planning proxies over a three-year window ending in year t, and
look for settlements over the following three-year period as reported in mandated accounting
disclosures that begin in 2007. We summarize our findings in Table 1.

18
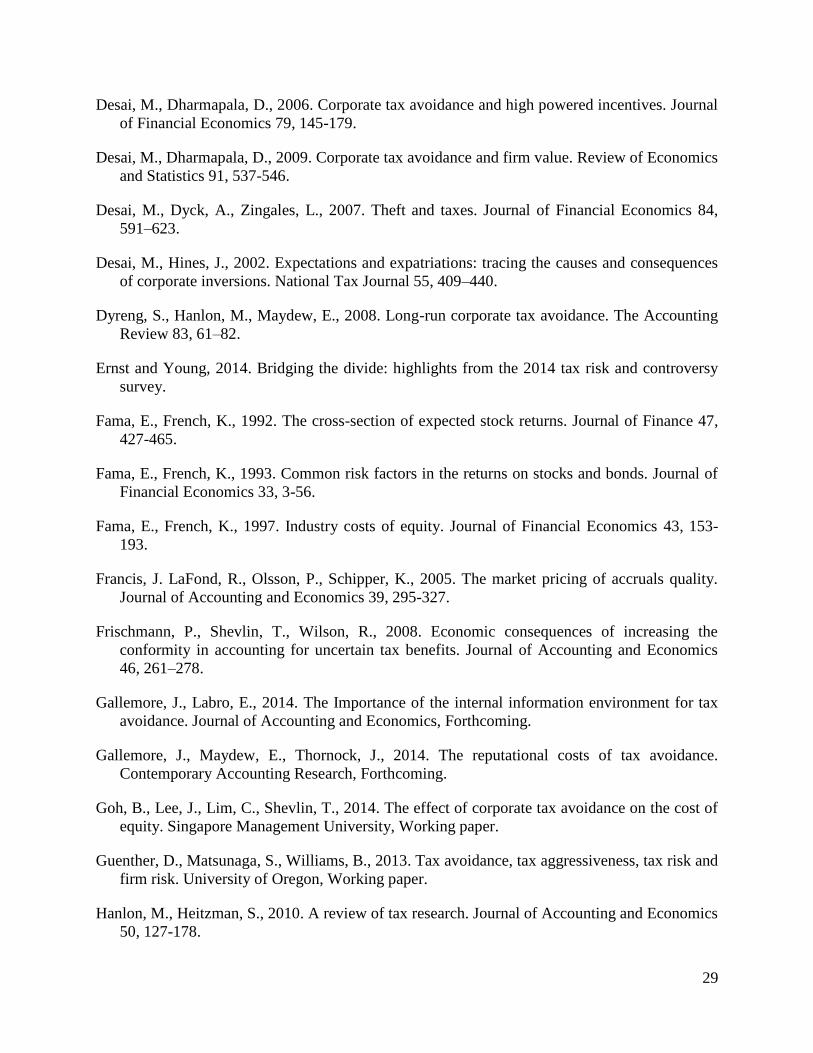
We find that firms with low effective tax rates (high tax planning) have significantly higher
rates of settlements with the tax authority. Surprisingly, firms with high cash tax rates (low tax
planning) also have the highest rate of settlements even after controlling for size and
profitability, suggesting that cash tax rates do a poor job picking up exposure to the types of tax
planning that are subject to ex post challenges by the tax authority. We also consider book-tax
differences—calculated as the spread between book income and grossed-up current tax expense
divided by assets—and find that it behaves similarly to cash tax rates.
Our primary tax planning measure, the effective tax rate, is defined at the industry level. We
do so to mitigate measurement error in firm-specific measures and to accommodate the inclusion
of firms with negative earnings or unreasonable tax rate proxies—these firms are typically
dropped from studies using effective tax rates proxies. The industry effective tax rate is the
median three-year effective tax rate of firms with positive pretax income before special items in
the firm’s industry. It is measured as the sum of total tax expense over the three year period
ending in year t – 1 divided by the sum of pretax income before special items over the same
period.17 The cash tax rate is defined similarly except that cash taxes paid replaces total tax
expense in the numerator. Industries are defined using the 3-digit SIC codes.
Firm characteristics
In the cross-sectional asset pricing regressions, we control for the common characteristics
associated with firm risk, including market capitalization measured at the end of June in year t,
book-to-market measured as the book value of equity (shareholders’ equity less book value of
preferred stock plus deferred taxes) divided by the market value of equity at the end of the fiscal
year, and leverage measured as total debt divided by the market value of assets (total assets less
17 The results are robust to using pretax income without adjusting for special items.

19
book value of equity plus market value of equity). We also include additional controls associated
with incentives and opportunities for tax planning, including net property plant and equipment
(PPE), balance sheet intangibles, and R&D and advertising expenditures (Dyreng, Hanlon and
Maydew 2008). We control for financial performance with EBT (earnings before taxes and
special items, scaled by assets). We also control for foreign operations, an important driver of tax
planning opportunities, by including an indicator variable equal to one when the firm reports
foreign pretax earnings. Because the existence of NOL carryforwards mitigates the value of tax
planning, we include an indicator equal to one when the firm has positive net operating loss
carryforwards at the end of the year.
4.2. Descriptive statistics and determinants of tax planning
Table 2, Panel A reports average characteristics for portfolios sorted into quintiles each year
based on effective tax rates. Firms are assigned to portfolios at the end of each June based on
their tax planning intensity measured in the prior year. Assets and market value are adjusted for
inflation. Panel A suggests key differences between high and low tax planning firms along
dimensions such as growth opportunities, R&D, fixed assets and foreign operations. To explore
these associations more formally, and to compare the drivers of effective tax rates with those of
cash tax rates, we regress the effective tax rates on firm characteristics and compare these results
to regressions using cash-based tax rates. The regressions are estimated annually using one
observation per firm. The table reports averages of the time-series of coefficient estimates and
their t-statistics.
In the first regression, high tax planning firms (those with low effective tax rates] have higher
book-to-market ratios, lower leverage, greater R&D and less advertising. They are also more
likely to have foreign income or NOL carryforwards and have greater past return volatility.

20
The results paint an intuitive picture: firms with high growth opportunities (low book-to-
market) have yet to generate taxable profits to shield while firms with high leverage have higher
effective tax rates when the tax benefits of debt (and thus marginal tax rates) are higher. Capital
intensity reduces current tax payments under the long-standing accelerated deduction regime and
affects cash tax rates, but not effective tax rates that include an accrual for the timing difference.
Firms with R&D not only benefit from tax credits, the assets created from that investment are
more mobile and generate income streams that can be shifted to lower-taxed jurisdictions. Firms
with foreign income have greater opportunities through income shifting, and a negative
association between loss carryforwards and effective tax rates can be driven by the fact that firms
with loss carryforward have lower marginal tax rates by definition.
Before continuing, we briefly consider the explanatory power of industry membership in
determining firm-level tax planning, a key consideration of our use of industry proxies for firm-
level tax planning risks. Panel C of Table 2 reports incremental adjusted R-squared values from
regressions of firm-level effective tax rates on year dummies, industry dummies and firm
controls. Industry effects increase explanatory power by 120% for effective tax rates (from
4.09% to 9.00%) and 197% for cash tax rates (from 3.55% to 10.54%), both relative to year
effects alone. Once year and industry effects are included, firm-specific controls contribute just
11.2% to effective tax rate variation (from 9% to 10.01%) and 27.6% to cash tax rate variation
(from 10.54% to 13.45%). Industry membership explains tax planning proxies relatively well
and avoids the problems inherent in using firm-specific measures described earlier.
4.3. Cross-sectional regressions of returns on tax planning
To test whether tax planning intensity is able to predict returns, we first estimate Fama-
MacBeth regressions of monthly stock returns on industry effective tax rates and firm

21
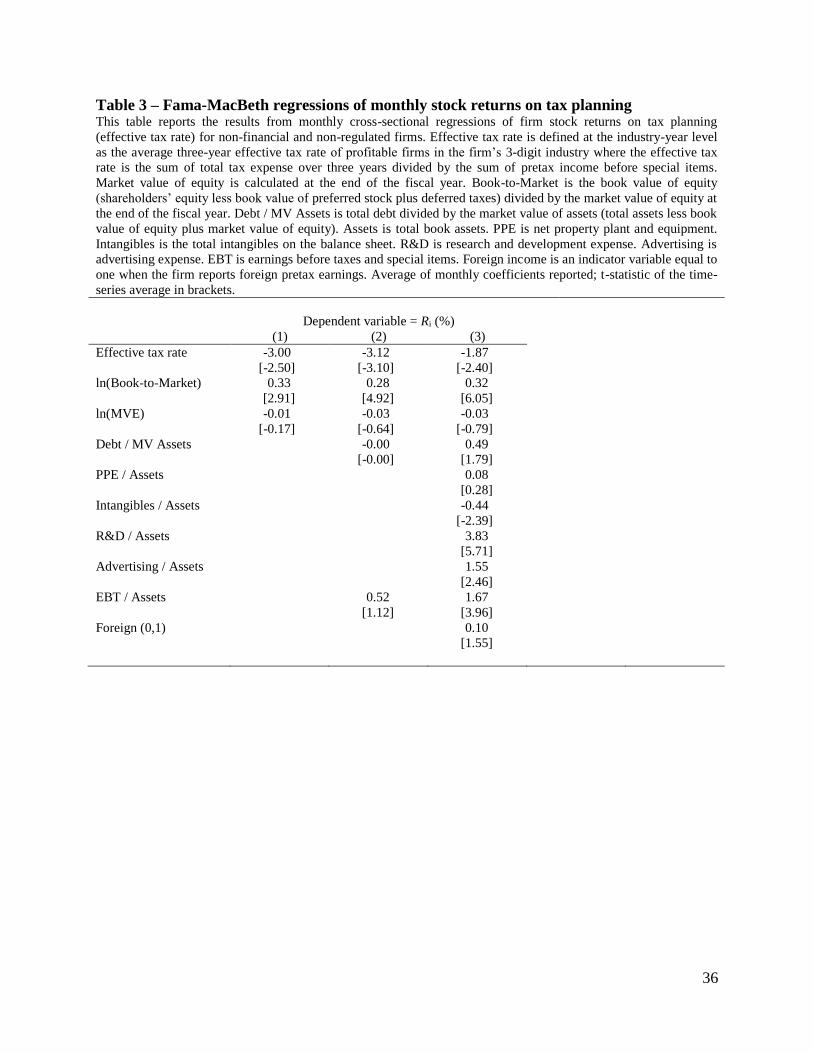
characteristics (e.g. Fama and French 1992). Table 3 reports average coefficients from the
monthly cross-sectional regressions and the t-statistics corresponding to the time-series
distribution of these coefficients. Effective tax rates have a statistically significant association
with returns. The coefficients on the effective tax rate reported in the first three columns are
statistically significant at conventional levels. In column (2), reducing the effective tax rate by
ten percentage points (from 35% to 25%) is associated with a 3.74% higher stock return
(annualized) after controlling for book-to-market, size and leverage (0.312 coeff. x 0.1 ETR
change x 12 months), and 2.24% when the full complement of control variables are included
(col. 3).
4.4. Evidence from portfolio returns
The cross-sectional tests suggest that tax planning intensity can explain future stock returns.
In this section, we examine returns on portfolios formed on the basis of effective tax rates.
Stocks are assigned to quintile portfolios at the end of June in year t based on the tax planning
measure from year t – 1. This timing ensures that public information about tax planning activity
is impounded in price prior to the measurement of stock returns. The portfolios are re-balanced
monthly to incorporate stock delistings. When a stock delists, we include the delisting return in
the portfolio return calculation. Missing delisting returns are substituted with average delisting
returns from Shumway (1997) and Shumway and Warther (1999).
Table 4 reports average returns on tax planning portfolios. We estimate returns in excess of
the risk-free rate, as well as alphas—intercepts from the time-series regressions of excess returns
on risk factors. The one-factor model includes excess return on the market, the three-factor
model includes the market, size and book-to-market factors, and the four-factor model includes
the market, size, book-to-market and momentum factors. All factor series are obtained from

22
Kenneth French’s website. The last column contains returns on the hedge portfolio that is long
(short) in the quintile of stocks with low (high) effective tax rates.
The portfolio returns in Table 4 are almost monotonically decreasing along effective tax rate
portfolios. The excess returns, three- and four-factor alphas on hedge portfolios based on
effective tax rates are statistically significant. The average alpha from the three-factor model
amounts to 37 basis points per month (4.4% annually) (t = 2.55), while the average alpha from
the four-factor model amounts to 30 basis points per month (3.6% annually) (t = 2.01).
These results suggest limited evidence of a tax planning-based risk premium. Of course, if
the t-statistic cutoff for statistical significance were closer to 3.0 to account for the long history
of risk factor tests as suggested by Harvey, Liu and Zhu (2014), these results would effectively
disappear, suggesting no link between tax planning intensity and priced risk. In the following
section, we consider the role of firm size, and time-series variation in tax planning premiums.
4.5. Sensitivity tests
Time-series variation in risk premiums.
The tax planning-induced systematic risk may be stronger in some periods than in others. For
example, there is a significant increase in the proportion of IRS resources devoted to criminal
investigations and in the number of corporate tax audits during the Democratic presidential
administrations (Bagchi 2015). If Democratic administrations are perceived by the market as
being more determined to curtail tax planning opportunities (through legislated tax policy,
appointments to the Treasury Department, enforcement budgets and mandates and so on), and
political interest in tax law depends on broader economic conditions (Romer and Romer 2006;
Pastor and Veronesi 2013), then firms with more intensive tax planning should be exposed to
more policy risk during those administrations.

23
Table 5, Panel A reports the average coefficients from monthly cross-sectional regressions of
returns on tax planning proxies and firm controls, where regressions are estimated separately
across months in which either a Democrat or Republican held the presidency. The results suggest
a significant premium on tax planning firms with Democratic presidents. In Column 5 of Panel
B, a reduction in the effective tax rate from 35% to 25% is associated with a 31 basis point per
month (3.72% annually) higher return during Democratic presidencies (p-value < 0.01) and
insignificant returns during Republican presidencies.
Table 6 reports the returns on quintile portfolios, partitioned into periods with Democratic
and Republican presidencies. The results support the cross-sectional evidence. The industry
effective tax rate is significantly associated with future returns during Democratic presidencies,
but not during Republican presidencies. Using equal weighted returns in Panel A, The average
hedge portfolio alpha from the four-factor model amounts to 63 basis points per month (7.56%
annually) (t = 2.87).
We also build on the findings in Staudt, Epstein, and Wiedenbeck (2006) who show that
Supreme Court ideology (liberal vs. conservative) affects the likelihood of a pro-government
ruling in corporate tax cases. Because most tax cases involving federal income tax issues are
heard by the United States Tax Court, we focus on variation in the political ideology of the tax
court judges over time. Because it is more difficult to measure the ideology of specific Tax Court
judges, we look to the appointment date. Tax Court judges are appointed by the President and
confirmed by the Senate. They serve 15-year terms after which they remain on as senior judges.
Each year, we identify the fraction of all active Tax Court judges appointed by Democratic
presidents. We sort the sample into periods of relatively high and low fractions democratic
judges. In Table 5, Panel B we report the results from cross-sectional regressions and find that

24
high tax planning firms have higher returns in periods where Democrat-appointed judges make
up a larger fraction of the Tax Court. This effect, however, disappears when the full set of
controls is included in column 5. We find similar results using hedge portfolio returns, with a
hedge return of 51 basis points per month (t = 1.92) when Democrat-appointed judges dominate
the tax court.
Finally, we turn to the impact of time-series variation in IRS enforcement. If tax enforcement
priorities transmit to the variation in reported audit rates, and if these priorities can be expected
to impact high-tax planning firms disproportionately, we expect to find that expected returns of
high tax planning will increase when tax enforcement ramps up. We measure enforcement as the
likelihood of a tax return audit for all firms above $10 million in assets as reported in the Internal
Revenue Service Data Book, adjusting for time trends. The results from cross-sectional
regressions estimated across periods of high and low enforcement are reported in Table 5, Panel
C, and indicate that high tax planning firms do indeed earn higher returns, but only during
periods when tax enforcement is low. We find similar results using hedge portfolio returns in
Panel C of Table 6.
This apparently anomalous result has a potentially simple explanation. The market learns
from the IRS disclosure that the probability of an audit falls and infers (correctly) that high tax
planning firms will keep more of the tax cash flows than expected. The prices for these firms are
immediately adjusted upward, even if there is no information about penalties for particular firms
yet.
Firm size.
The findings reported are sensitive to portfolio weighting—the equal-weighted returns are
significantly associated with industry effective tax rates. However, with the general exception of

25
time-series cuts on ideology of the President and Tax Court, value-weighted returns generally are
not. Since small firms have a larger relative influence on equal-weighted returns, the results
likely depend on size. In Table 7, we estimate value-weighted returns to tax planning portfolios
within size quintiles. Portfolios are formed by sequentially sorting stocks into quintiles based on
size and then, within each size partition, into quintiles based on tax planning. Size is the
beginning-of-the-month market value of equity. For convenience, only alphas from the one-
factor and three-factor models are reported. Results for other models are similar. The results
suggest a significant premium to high tax planning that is concentrated among smaller firms.
Within the lowest size quintile, the alphas for hedge portfolios that are long (short) in low tax
(high tax) amount to 79 basis points per month using the three-factor model across the entire
time period and are statistically significant at conventional levels (t = 4.09). The hedge returns
drop as firm size increases, with hedge returns positive but insignificant in the largest two
quintiles.
One possibility is that small firms, because they lack scale and complexity, have less
diversified tax strategies than large, complex firms. For a given tax planning intensity, this could
increase exposure to adverse consequences of government actions more for small firms.
Alternatively, there is evidence to suggest small firms are less likely to lobby because of high
fixed costs. To the extent larger firms can better insulate themselves from adverse tax policy
changes through political influence, this could explain the variation across size. Finally, large
firms may have less scope for exposure to tax policy risk due to the fact that that they are often
already under continuous audit.

26
4.6. Caveats
This study sheds light on the economic tradeoffs faced by managers in developing and
implementing tax strategy, but important caveats remain. First, any study in this area suffers
from a lack of detailed information about the firm’s tax planning; empirical examinations of tax
planning are contaminated by complexity and aggregation that can yield only limited inferences.
Thus, it is not clear precisely how tax planning changes the behavior of tax costs. Second, we
lack a well-accepted theory on the political economy of tax legislation, enforcement and
interpretation, how it responds to economic conditions and whether it affects firms as a function
of their stance against the tax authority. Like the large body of research on the organizational
determinants of asset prices, the theoretical predictions behind a tax planning risk factor are
largely ad hoc. Third, to the extent tax planning proxies are correlated with a risk factor we have
not controlled for, or if stocks are inefficiently priced with respect to the tax planning proxy we
measure, the inferences will be biased.
5. Conclusion
This study tackles a question of growing interest in political, practitioner and academic
circles: the capital market implications of tax planning intensity. We focus on the potential for
tax planning to induce risk, specifically risk that increases investors’ expected returns. While tax
planning is likely to increase cash flow volatility—and should do so mechanically—whether it
has any effect on expected returns and managers’ valuation of tax planning investments is an
open question. Tax legislation, tax enforcement efforts and judicial tax decisions vary over time
and appear to depend on political ideology. For tax planning to increase priced risk, it must be
the case that tax planning exposes the firm to greater risk from adverse tax policy changes that
systematically work against high tax planning firms.

27
The results in this paper provide some support for a tax-planning based risk premium in stock
returns. We employ accrual-based effective tax rates to measure tax planning following our
evidence that such tax rates capture the types of tax planning risk we are most interested in.
Using realized stock returns consistent with empirical asset pricing research and industry tax
planning proxies to mitigate measurement error and sample selection issues, we find that tax
planning risk premiums are concentrated in small firms and are largest during Democratic
presidencies. This evidence is broadly consistent with the recent findings that fiscal policy
uncertainty is priced, in particular among firms with more exposure to a change in fiscal policy.
The potential for economically significant tax planning-based risk effects appears to be an item
of growing importance on the agendas of corporate decision makers, monitors and regulators.
The evidence here suggests that boards and managers should primarily focus on the expected
incremental cash flows from tax planning, and under certain circumstances, consider the
potential for an impact on the discount rate.

28
References
Armstrong, C., Blouin, J., Jagolinzer, A., Larcker, D., 2015. Corporate governance, incentives,
and tax avoidance. Journal of Accounting and Economics 60, 1-17.
Armstrong, C., Blouin, J., Larcker, D., 2012. The incentives for tax planning. Journal of
Accounting and Economics 53, 391 - 411.
Bagchi, S., 2015. The political economy of tax enforcement: A look at the IRS from 1978-2010.
Journal of Public Policy, Forthcoming.
Baker, S., Bloom, N., Davis, S., 2012. Measuring economic policy uncertainty. Stanford
University, working paper.
Barth, M., Konchitchki, Y., Landsman, W., 2013. Cost of capital and earnings transparency.
Journal of Accounting and Economics 55, 206-224.
Belo, F., Gala, V., Li, J., 2013. Government spending, political cycles and the cross-section of
stock returns. Journal of Financial Economics 107, 305-324.
Boutchkova, M., Doshi, H., Durnev, A., Molchanaov, A., 2012. Precarious politics and return
volatility. Review of Financial Studies 25, 1111-1154.
Brennan, T., Epstein, L., Staudt, N., 2009. Economic trends and judicial outcomes: a
macrotheory of the court. Duke Law Journal 58, 1191-1230.
Carhart, M., 1997. On persistence in mutual fund performance. Journal of Finance 52, 57-82.
Chi, S., Pincus, M., Teoh, S.H., 2014. Mispricing of book-tax differences and the trading
behavior of short sellers and insiders. The Accounting Review 89, 511-543
Cloyd, B., Mills, L., Weaver, C., 2003. Firm valuation effects of the expatriation of US
corporations to tax-haven countries. Journal of the American Taxation Association 25, 87-
109.
Core, J., Guay, W., Verdi, R., 2008. Is accruals quality a priced risk factor? Journal of
Accounting and Economics 46, 2-22.
Croce, M., Kung, H., Nguyen, T., Schmid, L., 2012. Fiscal policies and asset prices. Review of
Financial Studies
Crocker, K., Slemrod, J., 2005. Corporate tax evasion with agency costs. Journal of Public
Economics 89, 1593-1610.
Daniel, K., Grinblatt, M., Titman, S., Wermers, R., 1997. Measuring mutual fund performance
with characteristic-based benchmarks. Journal of Finance 52, 1035-1058.
29
Desai, M., Dharmapala, D., 2006. Corporate tax avoidance and high powered incentives. Journal
of Financial Economics 79, 145-179.
Desai, M., Dharmapala, D., 2009. Corporate tax avoidance and firm value. Review of Economics
and Statistics 91, 537-546.
Desai, M., Dyck, A., Zingales, L., 2007. Theft and taxes. Journal of Financial Economics 84,
591–623.
Desai, M., Hines, J., 2002. Expectations and expatriations: tracing the causes and consequences
of corporate inversions. National Tax Journal 55, 409–440.
Dyreng, S., Hanlon, M., Maydew, E., 2008. Long-run corporate tax avoidance. The Accounting
Review 83, 61–82.
Ernst and Young, 2014. Bridging the divide: highlights from the 2014 tax risk and controversy
survey.
Fama, E., French, K., 1992. The cross-section of expected stock returns. Journal of Finance 47,
427-465.
Fama, E., French, K., 1993. Common risk factors in the returns on stocks and bonds. Journal of
Financial Economics 33, 3-56.
Fama, E., French, K., 1997. Industry costs of equity. Journal of Financial Economics 43, 153-
193.
Francis, J. LaFond, R., Olsson, P., Schipper, K., 2005. The market pricing of accruals quality.
Journal of Accounting and Economics 39, 295-327.
Frischmann, P., Shevlin, T., Wilson, R., 2008. Economic consequences of increasing the
conformity in accounting for uncertain tax benefits. Journal of Accounting and Economics
46, 261–278.
Gallemore, J., Labro, E., 2014. The Importance of the internal information environment for tax
avoidance. Journal of Accounting and Economics, Forthcoming.
Gallemore, J., Maydew, E., Thornock, J., 2014. The reputational costs of tax avoidance.
Contemporary Accounting Research, Forthcoming.
Goh, B., Lee, J., Lim, C., Shevlin, T., 2014. The effect of corporate tax avoidance on the cost of
equity. Singapore Management University, Working paper.
Guenther, D., Matsunaga, S., Williams, B., 2013. Tax avoidance, tax aggressiveness, tax risk and
firm risk. University of Oregon, Working paper.
Hanlon, M., Heitzman, S., 2010. A review of tax research. Journal of Accounting and Economics
50, 127-178.

30
Hanlon, M., Laplante, S., Shevlin, T., 2005. Evidence for the possible information loss of
conforming book income and taxable income. Journal of Law and Economics 48, 407-442.
Hanlon, M., Slemrod, J., 2009. What does tax aggressiveness signal?: Evidence from stock price
reactions to news about tax shelter involvement. Journal of Public Economics 93, 126–141.
Harvey, C., Liu, Y., Zhu, H., 2014. …And the cross-section of expected returns. Duke
University, Working paper.
Henry, E., 2014. The information content of tax expense: A discount rate explanation. University
of Tennessee, Working paper.
Henry, E., Sansing, R., 2014. Data truncation bias and the mismeasurement of corporate tax
avoidance. Dartmouth College, Working paper.
Hou, K., Robinson, D., 2006. Industry concentration and average stock returns. Journal of
Finance 61, 1927-1956.
Hutchens, M., Rego, S., 2013. Tax risk and the cost of equity capital. Indiana University,
Working Paper.
Jensen, M., 1968. The performance of mutual funds in the period 1945-1964. Journal of Finance
23, 389-416.
Kim, J., Li, Y., Zhang, L., 2011. Corporate tax avoidance and stock price crash risk: Firm-level
analysis. Journal of Financial Economics 100, 639-662.
Koester, A., 2011. Investor valuation of tax avoidance through uncertain tax positions.
Georgetown University, Working Paper.
Koester, A., Lim, S., Vigeland, R., 2014. The effect of tax-related material weaknesses in
internal controls on the market valuation of unrecognized tax benefits. Journal of the
American Taxation Association, Forthcoming.
Larsen, R., 2011. Communicating with the board of directors on taxes. The Tax Executive (July-
August), 241-245.
Lev, B., 1974. On the association between operating leverage and risk. Journal of Financial and
Quantitative Analysis 9, 627–641.
Levin, J., Petrini, K., Smith, L., White, T., 2006. The view from above; reactions of audit
committees to tax risks. Taxes, the Tax Magazine 84, 95-105.
Mills, L., Erickson, M., Maydew, E., 1998. Investments in tax planning. Journal of the American
Taxation Association 20, 1-20.
Neubig, T., Sangha, B., 2004. Tax risk and strong corporate governance. Tax Executive 56, 114-
119.

31
Novy-Marx, R., 2011. Operating leverage. Review of Finance 15, 103-134.
Pastor, L., Veronesi, P., 2013. Political uncertainty and risk premia. Journal of Financial
Economics 110, 520-545.
Rego, S., Wilson, R., 2012. Equity risk incentives and corporate tax aggressiveness. Journal of
Accounting Research 50, 775-810
Robinson, L., Schmidt, A., 2013. Firm and investor responses to uncertain tax benefit
disclosures. Journal of the American Taxation Association 35, 85-120.
Romer, C., Romer, D., 2010. The macroeconomic effects of tax changes: estimates based on a
new measure of fiscal shocks. American Economic Review 100.3, 763-801
Shevlin, T., Urcan, O., Vasvari, F., 2013. Corporate tax avoidance and public debt costs.
London Business School, Working paper.
Shumway, T., 1997. The delisting bias in CRSP data. Journal of Finance 52, 327–340.
Shumway, T., Warther, V. A., 1999. The delisting bias in CRSP’s NASDAQ data and its
implications for the size effect. Journal of Finance 54, 2361–2379.
Staudt, N., Epstein, L., Wiedenbeck, P., 2006. The ideological component of judging in the
taxation context. Washington University Law Review 84, 1797-1821.
Thomas, J., Zhang, F., 2014. Valuation of tax expense. Review of Accounting Studies 19, 1436-
1467.
Wilson, R., 2009. An examination of corporate tax shelter participants. The Accounting Review
84, 969-999.
32
Figure 1
Do tax planning proxies explain future tax settlements?
0.30
0.32
0.34
0.36
0.38
0.40
0.42
0.44
Low Tax Planning High Tax Planning
Pro
bab
ilit
y o
f F
utu
re S
ettl
emen
t
Probability of settlement with tax authority as a function of
prior tax planning
Effective Tax Rate Cash Tax RAte Book-Tax Difference

33
Table 1 – Tax proxies and the probability of settlement This table provides statistics on the frequency of future tax settlements for firms as a function of their effective
tax rates. Every year, we sort firms independently into terciles based on their average ROA and average total
assets over the three year period ending in year t. Within each of the nine resulting groups, firms are further
sorted into terciles based on their effective tax rate, cash tax rate or book-tax difference measured over the same
three year period. For each tercile of the tax proxy over the three year period starting in t + 1, we identify the
fraction of firms with a settlement and with a settlement amount (as a percentage of assets) that exceeds 50% of
the reported settlements over the three years. The results are reported below and include results for a two-way
sort on cash and effective tax rates.
Panel A: Rank Correlations Between Tax Proxies
Cash tax rate -[Book – tax] Current tax rate
Effective tax rate 0.421 0.386 0.487
Cash tax rate 0.601 0.707
-[Book – tax] 0.818
Panel B: Probability of future tax enforcement conditional on tax avoidance proxy
Effective tax rate
Median
Effective tax rate Pr(Settle) Pr(HiSettle)
Low 0.217 0.413 0.326
Medium 0.334 0.442 0.313
High 0.382 0.371 0.251
Low – High [t-stat]
0.042 [2.59] 0.075 [5.05]
Cash tax rate
Median
Cash tax rate Pr(Settle) Pr(HiSettle)
Low 0.111 0.338 0.261
Medium 0.267 0.437 0.311
High 0.375 0.434 0.297
Low – High [t-stat]
-0.096 [-6.11] -0.036 [-2.50]
-[Book – Tax]
Median
-[Book – Tax] Pr(Settle) Pr(HiSettle)
Low -0.055 0.331 0.257
Medium -0.021 0.411 0.295
Low 0.002 0.417 0.282
Low – High [t-stat]
-0.086 [-5.76] -0.025 [-1.82]
Panel C: Pr(Settle) as a function of effective and cash tax rates
Effective tax rate
Low – High
Cash tax rate Low Medium High [t-stat]
Low 0.377 0.372 0.281 0.096 [3.02]
Medium 0.473 0.469 0.361 0.112 [3.84]
High 0.443 0.472 0.414 0.029 [1.00]
Low - High -0.066 -0.100 -0.133

34
Table 2 – Descriptive statistics Panel A reports average values within quartiles of tax planning by effective tax rate. Panel B reports the results of
annual regressions of the tax planning proxy on firm-level characteristics. The time-series average and t-statistic
of that average are reported. Panel C reports the incremental explanatory power of year and industry effects in
explaining firm level effective tax rates. The sample begins with fiscal years ending in 1987 for effective tax
rates and 1990 for cash tax rates. The effective tax rate is the average three-year effective tax rate of profitable
firms in the firm’s 3-digit industry where effective tax rate is the sum of total tax expense over three years divided
by the sum of pretax income before special items. The cash tax rate is defined similarly except that cash taxes
paid is in the numerator. Assets is total book assets, market value of equity is calculated at the end of the fiscal
year; both are adjusted for inflation. Book-to-Market is the book value of equity (shareholders’ equity less book
value of preferred stock plus deferred taxes) divided by the market value of equity at the end of the fiscal year.
Market leverage is total debt divided by the market value of assets (total assets less book value of equity plus
market value of equity). PPE is net property plant and equipment. Intangibles is the total intangibles on the
balance sheet. R&D is research and development expense. Advertising is advertising expense. EBT is earnings
before taxes and special items. Pretax loss is an indicator variable equal to 1 when EBT is less than zero. Foreign
income is an indicator variable equal to one when the firm reports foreign pretax earnings. NOL Carryforward is
an indicator equal to one when the firm has positive net operating loss carryforwards at the end of the year. UTB
Reserve is the reserve for uncertain tax benefits. σ(Ret)t is the standard deviation of stock returns estimated over
the 60 month period ending in December of the calendar year in which the fiscal year ends.
Panel A: Sample averages by effective tax rate: fiscal 1987 – 2012
Quintile of effective tax rate
Q1 – Low
Tax Q2 Q3 Q4
Q5 – High
Tax
Effective tax rate 0.264 0.312 0.336 0.360 0.389
Cash tax rate 0.232 0.261 0.274 0.298 0.314
Assets ($BB) 1.829 1.655 2.022 2.159 2.222
MV Equity ($BB) 2.278 2.086 1.980 1.936 2.300
Book-to-Market 0.617 0.581 0.597 0.685 0.710
Debt / MV Assets 0.285 0.268 0.290 0.356 0.374
PPE / Assets 0.275 0.230 0.234 0.281 0.308
Intangibles / Assets 0.091 0.102 0.117 0.120 0.120
R&D / Assets 0.088 0.092 0.062 0.025 0.009
Advertising / Assets 0.008 0.011 0.014 0.018 0.019
EBT / Assets -0.019 -0.006 0.020 0.046 0.059
Pretax Loss (0,1) 0.339 0.285 0.234 0.190 0.165
Foreign Income (0,1) 0.410 0.389 0.388 0.350 0.255
NOL Carryforward (0,1) 0.397 0.381 0.362 0.312 0.278
UTB Reserve / Assets 0.019 0.016 0.014 0.011 0.007
σ(Ret)t 0.171 0.166 0.161 0.145 0.140

35
Table 2 (cont’d) – Descriptive statistics
Panel B: Determinants of tax planning
Dependent Variable = Effective tax rate (%) Cash tax rate (%)
Coeff. [t-stat] Coeff. [t-stat]
Intercept 33.71 [48.91] 31.30 [41.76]
ln(Assets) 0.04 [1.76] -0.08 [-3.51]
ln(Book-to-Market) -0.32 [-7.03] -0.20 [-3.07]
Debt / MV Assets 2.09 [12.31] 2.99 [10.27]
PPE / Assets -0.35 [-0.56] -7.31 [-12.25]
Intangibles / Assets 1.75 [6.50] -0.30 [-0.68]
R&D / Assets -6.62 [-6.70] -7.41 [-12.86]
Advertising / Assets 7.94 [10.45] 14.78 [9.73]
EBT / Assets 0.37 [1.06] -0.81 [-2.76]
Foreign income (0,1) -1.32 [-13.48] -0.93 [-6.31]
NOL carryforward (0,1) -0.47 [-6.94] -0.61 [-7.79]
σ(Ret)t -5.12 [-9.15] -9.97 [-9.95]
Average R2 11.67% 10.45%
Average firms/year 2,810 2,874
Number of years 26 23
Panel C: Explanatory power of industry membership for firm-level tax planning proxies
Dependent variable = Effective tax rate Cash tax rate
Adj. R2 Increase Adj. R2 Increase
Industry effects alone 5.09% 7.25%
Year effects alone 4.09% 3.55%
+ Industry Effects 9.00% 120.05% 10.54% 196.90%
+ Firm Controls 10.01% 11.22% 13.45% 27.61%
N 51,485 47,165
36
Table 3 – Fama-MacBeth regressions of monthly stock returns on tax planning This table reports the results from monthly cross-sectional regressions of firm stock returns on tax planning
(effective tax rate) for non-financial and non-regulated firms. Effective tax rate is defined at the industry-year level
as the average three-year effective tax rate of profitable firms in the firm’s 3-digit industry where the effective tax
rate is the sum of total tax expense over three years divided by the sum of pretax income before special items.
Market value of equity is calculated at the end of the fiscal year. Book-to-Market is the book value of equity
(shareholders’ equity less book value of preferred stock plus deferred taxes) divided by the market value of equity at
the end of the fiscal year. Debt / MV Assets is total debt divided by the market value of assets (total assets less book
value of equity plus market value of equity). Assets is total book assets. PPE is net property plant and equipment.
Intangibles is the total intangibles on the balance sheet. R&D is research and development expense. Advertising is
advertising expense. EBT is earnings before taxes and special items. Foreign income is an indicator variable equal to
one when the firm reports foreign pretax earnings. Average of monthly coefficients reported; t-statistic of the time-
series average in brackets.
Dependent variable = Ri (%)
(1) (2) (3)
Effective tax rate -3.00
[-2.50]
-3.12
[-3.10]
-1.87
[-2.40]
ln(Book-to-Market) 0.33
[2.91]
0.28
[4.92]
0.32
[6.05]
ln(MVE) -0.01
[-0.17]
-0.03
[-0.64]
-0.03
[-0.79]
Debt / MV Assets -0.00
[-0.00]
0.49
[1.79]
PPE / Assets 0.08
[0.28]
Intangibles / Assets -0.44
[-2.39]
R&D / Assets 3.83
[5.71]
Advertising / Assets 1.55
[2.46]
EBT / Assets 0.52
[1.12]
1.67
[3.96]
Foreign (0,1) 0.10
[1.55]

37
Table 4 – Returns on portfolios sorted on tax planning This table reports average equal-weighted excess returns and alphas (intercepts) from the time-series regressions
of excess returns on risk factors for quintile portfolios of stocks sorted by the effective tax rate. The alphas are
from the single-factor (market), three-factor (market, size, and book-to-market) and four-factor (market, size,
book-to-market, and momentum) models. The portfolio returns are equal-weighted. The last column reports excess
returns and alphas on a hedge portfolio that is long (short) in the Low Tax (High Tax) stocks. Returns are in
monthly percentage points. t-statistics are reported in brackets.
Quintile of effective tax rate
Q1 – Low
Tax Q2 Q3 Q4
Q5 – High
Tax
Low Tax –
High Tax
R – Rf
0.95 1.00 0.82 0.68 0.62 0.32
[2.42] [2.64] [2.09] [2.10] [1.86] [1.83]
α [CAPM]
0.15 0.20 0.01 -0.01 -0.10 0.25
[0.64] [0.93] [0.03] [-0.07] [-0.56] [1.41]
α [Three factor] 0.12 0.14 0.00 -0.18 -0.25 0.37
[0.86] [0.95] [-0.02] [-1.43] [-1.96] [2.55]
α [Four factor] 0.30 0.42 0.27 0.05 0.00 0.30
[2.19] [3.33] [2.07] [0.43] [-0.01] [2.01]

38
Table 5 – Fama-MacBeth results across political ideology and tax enforcement regimes This table reports the results from monthly cross-sectional regressions of firm stock returns on industry tax planning,
in Panel A conditional on the political party of the President in office at the time returns are measured, in Panel B
conditional on the ideology of the US Tax Court judges, and in Panel C based on the relative likelihood of a tax return
audit. Tax planning is measured using an effective tax rate, defined as the average three-year effective tax rates of
profitable firms in the firm’s 3-digit industry where the effective tax rate is the sum of total tax expense over three
years divided by the sum of pretax income before special items. Panel A reports the distribution of tax rates across
administrations. Panels B reports the results for effective tax rates. Market value of equity is calculated at the end of
the fiscal year. Book-to-Market is the book value of equity (shareholders’ equity less book value of preferred stock
plus deferred taxes) divided by the market value of equity at the end of the fiscal year. Debt / MV Assets is total debt
divided by the market value of assets (total assets less book value of equity plus market value of equity). Assets is
total book assets. PPE is net property plant and equipment. Intangibles is the total intangibles on the balance sheet.
R&D is research and development expense. Advertising is advertising expense. EBT is earnings before taxes and
special items. Foreign income is an indicator variable equal to one when the firm reports foreign pretax earnings.
Average of monthly coefficients reported. *,**,*** indicate statistical significance at the 0.10, 0.05, and 0.01 levels
(two-tailed).
Panel A: Stock returns and tax planning across presidential party
Dependent variable = Ri (%)
(1) (2) (3) (4) (5) (6)
Dem. Rep. Dem. Rep. Dem. Rep.
Effective tax rate -5.55*** -0.45 -5.29*** -0.85 -3.13*** -0.56
ln(Book-to-Market) 0.33** 0.27* 0.30*** 0.26*** 0.34*** 0.29***
ln(MVE) 0.02 -0.04 0.03 -0.09 0.01 -0.09
Debt / MV Assets 0.31 -0.33 0.99** -0.03
PPE / Assets 0.11 0.05
Intangibles / Assets -0.72*** -0.15
R&D / Assets 4.81*** 2.81***
Advertising / Assets 1.29 1.86**
EBT / Assets -0.23 1.31** 1.24** 2.13***
Foreign (0,1) 0.19** -0.01
Panel B: Stock returns and tax planning across U.S. Tax Court ideology
Dependent variable = Ri (%)
(1) (2) (3) (4) (5) (6)
High-Dem Low-Dem High-Dem Low-Dem High-Dem Low-Dem
Effective tax rate -4.26** -1.36 -4.08** -1.81* -1.31 -0.98
ln(Book-to-Market) 0.28** 0.33*** 0.33*** 0.25*** 0.38*** 0.27***
ln(MVE) -0.10 0.07 -0.10 0.03 -0.10 0.02
Debt / MV Assets -0.34 0.27 0.36** 0.55
PPE / Assets -0.07 0.18
Intangibles / Assets -0.82*** -0.13
R&D / Assets 5.14*** 2.77***
Advertising / Assets 2.01** 1.11
EBT / Assets -0.01 1.00** 1.60** 1.75***
Foreign (0,1) 0.16 0.19

39
Table 5 (cont’d) – Fama-MacBeth results across regimes
Panel C: Stock returns and tax planning across tax enforcement regimes
Dependent variable = Ri (%)
(1) (2) (3) (4) (5) (6)
High-Enf Low-Enf High-Enf Low-Enf High-Enf Low-Enf
Effective tax rate 0.15 -6.45** -0.59 -6.00*** 0.24 -2.61*
ln(Book-to-Market) 0.29** 0.32* 0.23*** 0.34*** 0.25*** 0.39***
ln(MVE) 0.12** -0.14 0.06 -0.12 0.05 -0.13*
Debt / MV Assets 0.02 0.00 0.25 0.71
PPE / Assets 0.22 -0.11
Intangibles / Assets -0.03 -0.89***
R&D / Assets 2.58*** 5.22***
Advertising / Assets 0.49 2.60**
EBT / Assets 1.39*** -0.33 2.12*** 1.24*
Foreign (0,1) 0.02 0.20**

40
Table 6 –Political ideology and tax enforcement This table reports average portfolio excess returns and alphas estimated separately for the years when a
Democratic or a Republican president was in office (Panel A), the proportion of Democratic administration
appointees among the US Tax Court judges was high or low (Panel B), or tax audit rates were low or high (Panel
C). The alphas are from the single-factor (market), three-factor (market, size, and book-to-market) and four-factor
(market, size, book-to-market, and momentum) models. The last column reports excess returns and alphas on a
hedge portfolio that is long (short) in the Low Tax (High Tax) stocks. Returns are in monthly percentage points. t-
statistics are reported in brackets.
Panel A: Portfolio returns across presidential party
Quintile of effective tax rate
Q1 – Low
Tax Q2 Q3 Q4
Q5 – High
Tax
Low Tax –
High Tax
Democratic
R – Rf 1.56 1.51 1.26 1.00 0.95 0.62
[2.82] [2.96] [2.38] [2.27] [2.11] [2.11]
α [CAPM] 0.14 0.07 -0.21 -0.27 -0.37 0.51
[0.37] [0.24] [-0.65] [-1.11] [-1.57] [1.70]
α [3F] 0.33 0.19 -0.03 -0.29 -0.39 0.72
[1.53] [0.92] [-0.14] [-1.52] [-2.12] [3.26]
α [4F] 0.50 0.45 0.16 -0.01 -0.13 0.63
[2.42] [2.57] [0.94] [-0.06] [-0.96] [2.87]
Republican
R – Rf 0.30 0.46 0.37 0.35 0.28 0.02
[0.55] [0.83] [0.63] [0.74] [0.57] [0.10]
α [CAPM] 0.23 0.39 0.29 0.29 0.22 0.01
[0.79] [1.27] [0.87] [1.12] [0.80] [0.06]
α [3F] 0.01 0.12 0.06 -0.06 -0.10 0.11
[0.05] [0.61] [0.27] [-0.36] [-0.60] [0.61]
α [4F] 0.15 0.35 0.35 0.04 0.06 0.09
[0.84] [1.94] [1.85] [0.28] [0.37] [0.49]
Panel B: Portfolio returns across Tax Court ideology
High Percentage Judges Appointed by Democratic Presidents
R – Rf 1.40 1.35 1.26 0.96 0.89 0.51
[2.27] [2.39] [1.99] [2.23] [1.93] [1.56]
α [CAPM] 0.30 0.28 0.10 0.15 0.00 0.30
[0.71] [0.78] [0.23] [0.56] [-0.00] [0.93]
α [3F] 0.25 0.15 0.16 -0.25 -0.35 0.61
[1.01] [0.59] [0.55] [-1.19] [-1.59] [2.35]
α [4F] 0.55 0.59 0.64 0.08 0.04 0.51
[2.34] [2.82] [2.64] [0.45] [0.22] [1.92]
Low Percentage Judges Appointed by Democratic Presidents
R – Rf 0.53 0.66 0.39 0.40 0.39 0.14
[1.13] [1.35] [0.86] [0.86] [0.83] [0.94]
α [CAPM] -0.01 0.10 -0.14 -0.14 -0.15 0.15
[-0.03] [0.44] [-0.68] [-0.69] [-0.74] [0.96]
α [3F] 0.01 0.12 -0.13 -0.14 -0.16 0.17
[0.06] [0.77] [-1.05] [-1.06] [-1.15] [1.13]
α [4F] 0.09 0.25 -0.03 -0.01 -0.03 0.13
[0.64] [1.79] [-0.25] [-0.10] [-0.28] [0.86]

41
Table 6 (cont’d) Panel C: Portfolio returns across tax enforcement regimes
Quintile of effective tax rate
Q1 – Low
Tax Q2 Q3 Q4
Q5 – High
Tax
Low Tax –
High Tax
Low Enforcement
R – Rf 1.06 0.93 0.71 0.43 0.45 0.61
[1.70] [1.56] [1.11] [0.86] [0.88] [2.01]
α [CAPM] 0.50 0.36 0.11 -0.05 -0.05 0.55
[1.26] [1.05] [0.29] [-0.17] [-0.17] [1.82]
α [3F] 0.42 0.25 0.06 -0.27 -0.25 0.67
[1.74] [1.00] [0.23] [-1.29] [-1.14] [2.90]
α [4F] 0.66 0.61 0.43 0.04 0.09 0.57
[2.98] [3.01] [1.93] [0.24] [0.50] [2.46]
High Enforcement
R – Rf 0.83 1.06 0.92 0.94 0.82 0.01
[1.92] [2.46] [2.20] [2.39] [2.09] [0.05]
α [CAPM] -0.24 0.01 -0.11 -0.05 -0.18 -0.06
[-1.05] [0.03] [-0.49] [-0.28] [-0.95] [-0.36]
α [3F] -0.14 0.12 0.01 -0.03 -0.16 0.03
[-1.08] [0.91] [0.07] [-0.32] [-1.66] [0.16]
α [4F] -0.11 0.21 0.06 0.00 -0.11 -0.01
[-0.87] [1.60] [0.56] [0.02] [-1.11] [-0.04]

42
Table 7 – Returns on portfolios sorted by tax planning and size This table reports average value-weighted excess returns and alphas for portfolios of stocks sorted by industry tax
planning and size. The stocks are first sorted into quintiles based on the market value of equity at the beginning of
the month and then, within each size quintile, into quintiles based on the tax planning measure. The alphas are
from the single-factor (market], three-factor (market, size, and book-to-market] and four-factor (market, size,
book-to-market, and momentum] models. The last column reports excess returns and alphas on a hedge portfolio
that is long (short] in the Low Tax (High Tax] stocks. Returns are in monthly percentage points. t-statistics are
reported in brackets.
Quintile of effective tax rate
Size quintile Q1 – Low Tax Q2 Q3 Q4 Q5 – High Tax Low Tax –
High Tax
α [CAPM]
1 - Small 0.38 0.10 0.20 -0.09 -0.32 0.70
[1.10] [0.29] [0.56] [-0.33] [-1.04] [3.46]
2 0.18 0.01 -0.12 0.03 -0.14 0.32
[0.58] [0.05] [-0.41] [0.10] [-0.58] [1.40]
3 0.08 -0.07 -0.11 -0.08 -0.13 0.22
[0.29] [-0.27] [-0.40] [-0.37] [-0.60] [0.93]
4 -0.09 0.26 -0.08 0.11 -0.02 -0.07
[-0.38] [1.32] [-0.40] [0.66] [-0.14] [-0.30]
5 - Large 0.01 0.06 0.00 0.15 -0.12 0.13
[0.11] [0.44] [0.04] [1.28] [-1.13] [0.81]
α [3F]
1 - Small 0.31 0.08 0.14 -0.22 -0.48 0.79
[1.08] [0.25] [0.43] [-0.90] [-1.78] [4.09]
2 0.09 -0.08 -0.20 -0.19 -0.36 0.45
[0.42] [-0.35] [-0.97] [-1.04] [-1.95] [2.19]
3 0.05 -0.10 -0.16 -0.29 -0.34 0.39
[0.33] [-0.69] [-0.99] [-2.14] [-2.26] [1.95]
4 -0.10 0.22 -0.08 -0.05 -0.18 0.07
[-0.76] [1.56] [-0.75] [-0.43] [-1.43] [0.38]
5 - Large 0.08 0.21 0.07 0.09 -0.10 0.18
[0.72] [1.54] [0.65] [0.80] [-0.95] [1.09]