Embed Size (px)
Citation preview

Corporate Sustainability and Financial Performance - The influence of board diversity in a
Swedish context
Master’s Thesis 30 credits
Department of Business Studies
Uppsala University
Spring Semester of 2015
Date of Submission: 2015-05-29
Sanna-Lena Bäckström
Jenny Karlsson
Supervisor: Mattias Hamberg
I
ABSTRACT
Keywords: corporate sustainability performance, financial performance, board diversity, index
construction
Purpose: The aim of this thesis is to analyse the relationship between corporate sustainability
performance and financial performance in a new contextual setting, i.e. Sweden. Furthermore, the
thesis contributes by creating a sustainability index as well as investigating the impact of board
diversity on the relationship.
Theoretical framework and hypotheses: With support from instrumental stakeholder theory and
previous empirical findings, a positive relationship between sustainability performance and
financial performance is hypothesised. Furthermore, with support from previous studies on the
effect of board diversity on sustainability and financial performance, the second and final
hypothesis predicts a positive impact of board diversity components on the relationship between
the two components.
Methodology: This thesis takes on a deductive approach in which a multivariate regression
method is used. The final sample constitutes of 1,015 observations of firms listed on the
NASDAQ OMX Stockholm during 2009-2013.
Findings: The results indicate a positive relationship between corporate sustainability and
financial performance. However, the findings of a robustness test suggest a more complex
relationship. Instead of a complete positive relationship, there are indications that the positive
relationship is only true for low and moderate sustainability performers. Lastly, only educational
board diversity was found to have an impact on the relationship between sustainability and firm
profitability.

II
ACKNOWLEDGEMENTS
We would like to express our gratitude to our supervisor Mattias Hamberg who has contributed
with expertise, constructive criticism and suggestions to our thesis. Furthermore, we are grateful
to all members of our seminar group for their valuable feedback during the whole process.
Finally, we would like to thank our family and friends for their valuable support and insights.

III
TABLE OF CONTENT
1. INTRODUCTION ....................................................................................................................................... 1 1.1. DOES IT REALLY PAY TO BE GOOD? ......................................................................................................................... 1 1.2. INCONSISTENCIES IN PREVIOUS RESEARCH ........................................................................................................... 2 1.3. AIM ............................................................................................................................................................................... 3
2. CLARIFICATION OF CONCEPTS ...................................................................................................... 4 3. THEORETICAL FRAMEWORK AND HYPOTHESES .................................................................. 5 3.1. CORPORATE SUSTAINABILITY PERFORMANCE AND FINANCIAL PERFORMANCE ............................................. 5
3.1.1. Negative relationship ........................................................................................................................................ 5 3.1.2. Positive relationship .......................................................................................................................................... 6 3.1.3. Contradictory results in previous research .............................................................................................. 7 3.1.4. Causality ................................................................................................................................................................ 9
3.2. BOARD DIVERSITY -‐ SUSTAINABILITY PERFORMANCE AND FINANCIAL PERFORMANCE ............................. 11 3.3. SUMMARY OF HYPOTHESES .................................................................................................................................... 13
4. METHODOLOGY ........................................................................................................................................ 14 4.1. OVERALL RESEARCH DESIGN .................................................................................................................................. 14 4.2. OPERATIONALIZATION ............................................................................................................................................ 14
4.2.1. Corporate financial performance measurement .................................................................................. 14 4.2.2. Corporate sustainability performance measurement ......................................................................... 14 4.2.3. Board diversity .................................................................................................................................................. 18
4.3. CONTROL VARIABLES .............................................................................................................................................. 19 4.4. SAMPLE AND DATA COLLECTION ........................................................................................................................... 20 4.5. STATISTICAL TESTS .................................................................................................................................................. 22
5. EMPIRICAL RESULTS AND ANALYSIS ........................................................................................ 25 5.1. DESCRIPTIVE STATISTICS AND CORRELATIONS .................................................................................................. 25 5.2. POSITIVE RELATIONSHIP BETWEEN SUSTAINABILITY PERFORMANCE AND FINANCIAL PERFORMANCE .. 28
5.2.1. Robustness test and sensitivity analysis ................................................................................................... 31 5.3. BOARD DIVERSITY .................................................................................................................................................... 35
6. DISCUSSION ............................................................................................................................................. 38 6.1. HYPOTHESIS 1: CETERIS PARIBUS, THERE IS A POSITIVE RELATIONSHIP BETWEEN SUSTAINABILITY PERFORMANCE AND FINANCIAL PERFORMANCE ......................................................................................................... 38 6.2. HYPOTHESIS 2: CETERIS PARIBUS, BOARD DIVERSITY COMPONENTS HAVE A POSITIVE IMPACT ON THE RELATIONSHIP BETWEEN CORPORATE SUSTAINABILITY PERFORMANCE AND FINANCIAL PERFORMANCE. .... 40 6.3. CONCLUSIONS ........................................................................................................................................................... 41
REFERENCES ............................................................................................................................................... 44 APPENDIX I ................................................................................................................................................... 51 APPENDIX II ................................................................................................................................................. 56
IV
TABLE OF ILLUSTRATIONS
Table I. Sample adjustments Table II. Average corporate sustainability performance (CSP) over time Table III. Variable descriptions Table IV. Descriptive statistics and correlations – ROA & CSP Table V. Descriptive statistics and correlations – Board diversity Table VI. Multivariate regression analysis – ROA & CSP Table VII. Multivariate regression analysis – ROA & Stakeholder categories Table VIII. Multivariate regression analysis – Robustness tests ROA & CSP Table IX. Multivariate regression analysis – Board diversity Figure 1. Summary of hypotheses Figure 2. Curvilinear relationship between sustainability performance and financial performance Figure 3. Curvilinear relationship between sustainability performance and financial performance and the impact of educational diversity

1
1. INTRODUCTION
The first chapter problematizes the issue of corporate sustainability and financial performance beginning with a discussion on the dilemma of short-termism and long-termism. This is followed by a discussion of the inconsistencies and lacks in previous research. The section is ended with the aim of the thesis.
1.1. Does it really pay to be good?
Considering corporate social responsibility (CSR) as an automatic loss of profit - makes CSR
“…as meaningful as cotton candy. The more you try to bite into it the faster it dissolves” (Reich,
2008:6). From an historical point of view, corporate sustainability has been viewed upon by
businesses as predominantly a cost or an obligation that slows down efficiency and hinders
development of profitable growth. However, over the past fifty years, business leaders have begun
to perceive corporate sustainability as an opportunity rather than as a necessity – gradually
redefining the way that businesses interpret and create value (Berthon, Abood & Lacy, 2010;
Ludema, Laszlo & Lynch, 2012). This development has been driven and encouraged by higher
expectations and requirements from various stakeholders concerning the level of transparency of
corporations’ operational activities (Fischer & Sawczyn, 2013). Furthermore, the rise of different
corporate sustainability reporting standards (e.g. Global Reporting Initiative, GRI) and stricter
public regulations (e.g. Directive 2014/95/EU1) are placing additional pressure on corporations to
develop or expand their sustainability practices.
However, the short-termism prevalent in many businesses create potential barriers for
corporations to invest in more long-term sustainability practices (Bansal & DesJardine, 2014). For
example, the market’s expectations on quarterly reports may pressure top management to smooth
earnings to secure stock prices and as a result possibly sacrificing sustainable value creation
(Bansal & DesJardine, 2014). Consequently, leading to potential trade-offs between being
sustainable from a long-term perspective or profit seeking from a short-term perspective.
However, due to improvements in technology and communication, it is becoming increasingly
difficult to ‘get away’ with more questionable unethical corporate behaviours - at least for
extended periods of time. Furthermore, since the level of global sustainability reporting is rapidly
growing (KPMG, 2013), it is becoming easier to compare corporations’ choice of sustainability
practices and their level of transparency.
1 The recently decided European Union directive stating that certain large corporations and groups need to disclose non-financial and diversity information (European Commission, Directive 2014/95/EU).

2
Nevertheless, despite these benefits, there has been an extensive criticism aimed at sustainability
reporting, such as it being too costly and complex, debateable in regards of its return on
investment, or that the reports are simply used as a tool for ‘greenwashing’ or corporate magic -
that is, deprived of any true intentions of actually contributing to society at large (KPMG, 2013).
To eliminate such beliefs, as well as motivating sustainability practices into becoming an
established part of corporations’ strategies, more evidence is needed showing that corporate
sustainability behaviour could be beneficial also from an economic perspective – as opposed to
only being philanthropic. Thus, reducing the trade-offs and potentially creating shared value for
the corporation as well as relevant stakeholders from a long-term perspective. However, does it
really pay to be good? Or does increased focus on corporate sustainability practices result in
financial drawbacks?
1.2. Inconsistencies in previous research
The issue of whether there is a trade-off between corporations’ investments in corporate
sustainability and profitability has been heavily debated. Yet, despite approximately fifty years of
previous research (Margolis & Walsh, 2003), there are still inconsistencies in the results. While
many previous empirical studies have reached the conclusion that there is a positive relationship
between corporate sustainability performance and financial performance (e.g. Orlitzky, Schmidt,
& Rynes, 2003), there has also been several studies resulting in negative (e.g. Wright & Ferris,
1997; Brammer, Brooks, & Pavelin, 2006), neutral/non-significant findings (e.g. McWilliams &
Siegel, 2001), or mixed relationships (Hillman & Keim, 2001; Barnett & Salomon, 2012) as well
as various causal directions (e.g. Scholtens, 2008). The reason behind these contradictory results
could be explained by the inconsistencies or vagueness in the construct of the measurements
aimed at capturing sustainability and financial performance (van Beurden & Gössling, 2008;
Callan & Thomas, 2009).
According to Callan and Thomas (2009), there is therefore need for more research concerning the
relationship between sustainability performance and financial performance. This, to be able to
determine the level of generalization that is possible between various empirical studies. There is
also, to a certain degree, need for updated research, since several previous studies could be
considered as dated, due to the fast development of sustainability practices and the surrounding
context in recent years (Callan & Thomas, 2009). Furthermore, previous research has focused
almost exclusively on U.S. firms (Surroca, Tribó, & Waddock, 2010). Thus, more research should
be conducted on non-U.S. companies to be able to establish whether there are any differences
between nations; where societal or cultural traditions may differ in regards to how corporations
should respond to environmental and social concerns (Callan & Thomas, 2009).

3
Previous research has also suggested that there is a need for greater analysis of the components
that may affect the level of sustainability practices as well as its effect on financial performance.
More specifically, while it is important to establish whether there is a relationship between
sustainability performance and financial performance, it is also vital to determine what
components may potentially impact this relationship. Since the board is responsible for the
creation of long-term objectives for the firm and as it also manages the relationship with various
external stakeholders (Pfeffer, 1972); board composition could be considered as a potential factor
contributing to the focus (or lack thereof) on sustainability practices. A more diverse group of
board directors, with different knowledge base and priorities, may be able to better respond to
multiple stakeholder interests, thus affecting the potential success of sustainability practices
(Harjoto, Laksmana, & Lee, 2014). However, despite an expanding focus on diversity in boards,
there is a lack of evidence on how a diverse board composition may influence management
decision making (Harjoto et al., 2014). Moreover, it is only recently that the academic community
has started to pay closer attention to the relationship between board composition and corporate
sustainability performance (Walls, Berrone & Phan, 2012; Harjoto et al., 2014) as well as
financial performance (Ayuso, Rodríguez, García-Castro, & Ariño, 2014).
1.3. Aim
The aim of this thesis is to analyse and clarify the relationship between corporate sustainability
and financial performance. Establishing and examining the relationship between corporate social
performance and financial performance should be of interest for both academics and corporations
as well as different corporate stakeholders (e.g. investors and NGOs). More specifically, this
thesis contributes to previous research by developing a sustainability measure, which takes into
consideration the multidimensional aspects of stakeholder activities. Additionally, the study
contributes by further investigating the relationship between corporate sustainability performance
and financial performance by examining the effects of a diverse board composition. Moreover, by
focusing on the Swedish context, this study also adds to existing studies by considering a different
cultural tradition and regulatory environment.

4
2. CLARIFICATION OF CONCEPTS
The following chapter provides a discussion of concepts and clarifies the similarities and differences between terms often used to describe social, environmental, and governmental activities of corporations.
One of the most commonly used and acknowledged definitions of sustainable development is a
“development that meets the needs of the present without compromising the ability of future
generations to meet their own needs”, which was presented by the World Commission on
Environment and Development in the commonly referred ‘Brundtland report’ in 1987 (World
Commission on Environment Development, 1987:43). With regards to this, business sustainability
can be expressed as the ability of firms to meet their “short-term financial needs without
compromising their (or ‘others’) ability to meet their future needs” (Bansal & DesJardine,
2014:71).
However, there is confusion regarding the terminology set to describe business activities aimed at
stakeholders and society at large - a confusion that encompasses both academic literature as well
as corporate reporting. For instance, corporate social responsibility (CSR), corporate citizenship,
and sustainability have all been used synonymously to describe the same business practices.
However, in many cases these phrases include different aspects of stakeholder activities, such as
social, environmental, and/or economic and governmental factors. (Bansal & DesJardine, 2014)
Corporate social responsibility (CSR) has long been a popular phrase to describe business
activities aimed at stakeholder-interests. However, despite numerous attempts, no consensus has
been reached regarding its definition and what the term actually encompasses. For instance, a
common division is to only attribute it with social factors, thus disregarding other aspects, such as
the environmental impact. This has contributed to criticism against the use of the term, which also
extends to its main focus on philanthropic responsibility. Instead, sustainability (a successor to
‘sustainable development’) is rapidly becoming more popular in strategic management. Yet, as
with corporate social responsibility, its meaning is often considered as vague and ambiguous, e.g.
in some instances it is only associated with environmental issues (Bansal & DesJardine, 2014;
White, 2013). However, sustainability and CSR is often conceptualized by the ‘triple bottom line’
approach (Elkington, 1998), which includes environmental, social, and economic/governmental
impact of corporations (Hart, Milstein, & Caggiano, 2003; Bansal, 2005).
A major difference between sustainability and CSR (as well as corporate citizenship and triple
bottom line) is their relation to time. According to Bansal and DesJardine (2014), a sustainable
business is one “that manage inter-temporal trade-offs in strategic decision making, so that both
5
the short and long-term is considered” (Bansal & DesJardine, 2014:71). Thus, companies need to
decide between either investing less to secure smaller profits faster and investing more to receive
greater profits in the future (Laverty, 1996). Corporate social responsibility on the other hand does
not automatically necessitate trade-offs, but is instead often related to ideas, such as ‘shared
value’ and ‘win-win’-situations. In these situations businesses and society is believed to gain
instant and simultaneous value from a corporation’s actions (Porter & Kramer, 2006). Therefore,
since sustainability - in comparison with its related terms - to a greater extent considers the
complexity of balancing short- and long-term decisions, the following thesis will hereafter use the
term sustainability (including environmental, social, and governmental factors) when referring to
business stakeholder activities.
3. THEORETICAL FRAMEWORK AND HYPOTHESES
The following chapter will provide an overview of the theoretical underpinnings and the empirical evidence aimed at disentangling the complex relationship between corporate sustainability and financial performance. This discussion will lead up to the first hypothesis - followed by a reflection of the causality between the two components. Lastly, the section will present theoretical and empirical background of the impact of a diverse board composition and its effect on the relationship between sustainability performance and financial performance, leading to the second and final hypothesis.
3.1. Corporate sustainability performance and financial performance
Prior research has, both theoretically and empirically, tried to establish the relationship between
corporate sustainability performance and financial performance. However, so far the results have
been either inconclusive or inconsistent. As a result, roughly dividing previous research into two
main camps supporting either a positive or negative relationship.
3.1.1. Negative relationship
The most referred to proponent of a negative relationship between corporate sustainability
performance and financial performance is Milton Friedman. Friedman (1970) argues that
corporations engaging in sustainability activities incur more costs, thus reducing their net
financial performance (Friedman, 1970). Since these additional costs and administrative burdens
may affect the corporation’s bottom line negatively it may potentially lead to competitive
disadvantages for the firm (Friedman, 1970; McWilliams & Siegel, 1997; Jensen, 2001; Barnett &
Salomon, 2006). Therefore, a focus on corporate sustainability challenges the traditional main
objective of corporations, which is to maximize shareholder value. More specifically, according to
this view, it is believed that any manager who makes investments that is not beneficial for

6
employees, shareholders or its customers, is believed to abuse the firm’s resources (Friedman,
1970). Instead, the cost of social issues and inequality are perceived as problems that may best be
solved by others, for instance the government (Waddock & Graves, 1997) and that corporations,
thus, should do no more than to abide the law (Friedman, 1970). Jensen (2001), however, has
suggested a more nuanced view on value maximization, in which companies should satisfy the
needs of their stakeholders as long as the cost of doing so does not distort shareholder value.
3.1.2. Positive relationship
Proponents of a positive relationship on the other hand often derive their arguments from
stakeholder theory. According to stakeholder theory, corporations are responsible to a variety of
stakeholders - with their potential of having positive and/or negative impact on the society in
which they operate. Often referred to as the father of stakeholder theory (Laplume, Sonpar, &
Litz, 2008), Freeman (1984) proposed that a firm’s stakeholders are “any group or individual who
can affect or is affected by the achievement of the organisation’s objectives” (Freeman, 1984:46).
Thus, due to this potential impact, it is believed that corporations should take consideration not
only to the interests of their shareholders, but to all their constituents (Laplume et al., 2008).
Stakeholder theory has thereafter moved into different directions. Donaldson and Preston (1995)
propose that stakeholder theory can be sorted into three groups: descriptive, normative, and
instrumental stakeholder theory. The descriptive stakeholder theory is concerned with how
different stakeholders are attended to by the corporation whilst the normative stakeholder theory
focuses on the moral and ethical arguments aimed at guiding stakeholder-oriented managers.
Finally, the instrumental stakeholder theory is directed to investigating the consequences, i.e. the
profit/wealth-enhancing possibilities, of considering a wide range of stakeholders in corporate
strategy. Thus, making the latter most relevant to investigate and explain the linkage between
corporate sustainability and financial performance.
According to instrumental stakeholder theory, if a corporation manages its relationships with
stakeholders properly the firm can improve its financial performance over time (Donaldson &
Preston, 1995; Freeman, 1984). Sustainability practices can therefore be motivated by self-interest
and as means to increase profit and shareholder value (Harjoto et al., 2014). For instance, with
better sustainability performance a firm may entice more resources (Cochran & Wood, 1984),
increase market opportunities and pricing premiums (Fombrun, Gardberg, & Barnett, 2000) as
well as attracting employees (Turban & Greening, 1997). Thus, managing stakeholder relations
may result in competitive advantages (Barnett & Salomon, 2006; Porter & van der Linde, 1995).
7
Building upon stakeholder theory and agency theory (Hill & Jones, 1992), Jones (1995) proposes
that instrumental stakeholder theory considers the firm as a ‘nexus of contracts’ (Jensen &
Meckling, 1976) between the corporation and all its stakeholders. In this context, a firm that
fosters a moral culture is believed to be able to curb opportunistic behaviour among its employees
as well as gaining a positive reputation and relationship with its external and internal stakeholders
(Jones, 1995). Therefore, resulting in minimised agency and transaction costs. Hence,
instrumental stakeholder theory implies that profitability and sustainability are not mutually
exclusive, but rather that a firm’s ethical considerations may prove to be a competitive advantage
(Jones, 1995). This is in accordance with Cornell and Shapiro (1987), who suggest that firm value
is dependent on the ability to fulfil explicit and implicit contracts2 with various stakeholders.
Failure to do so may lead to damaged firm reputation as well as decreased financial performance.
3.1.3. Contradictory results in previous research
The relationship between corporate sustainability performance and financial performance has
been analysed empirically in several previous studies. However, due to differences in
methodology, the findings have either been inconclusive or contradictory, with studies supporting
both a positive and negative relationship (Margolis & Walsh, 2003; Orlitzky, Smith, & Rynes,
2003). There have also been studies suggesting a more complex relationship between corporate
sustainability and financial performance. For instance, according to Barnett and Salomon (2012),
the success of sustainability activities on financial performance (measured in return on assets
(ROA) and net income) depends on how “well firms are able to capitalize on their social
responsibility efforts” (p. 1304). They base this reasoning upon the results from examining U.S.
firms, which resulted in a positive relationship for low and high sustainability performers and a
negative relationship for moderate sustainability performers between the two components; more
specifically, an U-shaped relationship. Thus, social responsibility might be more profitable for
some firms than for others (Barnett & Salomon, 2012). When investigating the relationship
between corporate charitable giving and corporate financial performance (i.e. market-based),
Brammer and Millington (2008) similarly find differences in companies with remarkably low
respectively remarkably high sustainability performance. Firms with low sustainability
performance achieved better financial results in the short-term, whereas firms with higher
sustainability performance exceeded in the long-term.
2 Explicit contracts refer to, for instance, investment contracts with shareholders or loan contracts with creditors. Implicit contracts refer to, for example, the promise of offering quality products and services to customers or to ensure a safe work environment for employees (Cornell & Shapiro, 1987).

8
However, relatively few studies document a completely negative relation between sustainability
and financial performance (van Beurden & Gössling, 2008). For instance, Brammer et al. (2006)
find a negative relationship between corporate responsibility and stock returns in the U.K. Their
conclusion is that firms, which engage in stakeholder activities that focus on environment and
community, have a lower stock return compared to their not equally ethical peers. A possible
explanation for this is that shareholders in socially responsible firms are willing to accept lower
stock returns; this due to moral or ethical considerations (Brammer et al., 2006).
Instead, most previous empirical examinations have shown a positive relationship between
corporate sustainability performance and financial performance (Margolis & Walsh, 2003;
Orlitzky et al., 2003). One of the most cited studies on the topic is conducted by Waddock and
Graves (1997). Using three measurements of firm performance, the authors conclude that high
sustainability performance improves profitability measured as return on assets (ROA) and return
on sales (ROS), but not as measured in return on equity (ROE).
In the first meta-analysis on the subject, Orlitzky et al. (2003) analysed 52 previous U.S. based
studies to clarify the issue further. The authors find that, although the results are stronger for
social responsibility activities than for environmental-related actions, there are indications of a
reasonable positive relationship between sustainability performance and financial performance.
They further argue that the results of the meta-analysis indicate that the level of certainty ascribed
to the sustainability performance and financial performance relationship are greater than what is
usually presumed by several business researchers. However, Margolis and Walsh (2003) argue
that these forms of findings need to be considered with caution, since the underlying aggregated
studies supporting this research are often based on limitations or flawed methodology (Wood &
Jones, 1995; Griffin & Mahon, 1997; Rowley & Berman, 2000). Empirical studies based on more
recent data have, however, also reached conclusions supporting a positive relationship between
sustainability performance and financial performance. For instance, Ameer and Othman (2012)
compared the financial performance of firms listed as top sustainability performers and firms
ranked as low sustainability performers. They find that return on assets (ROA), profit before
taxation, and cash flows from operations are higher in companies with superior sustainability
performance in comparison with those with lower sustainability performance. However, the
results are not equally strong across industries. For instance, sustainability performance has the
strongest positive impact on firms within service industries (i.e. consumer discretionary and
telecommunication). Similar industrial differences are presented by Lev, Petrovits, and
Radhakrishnan (2010). The authors conclude that firms operating in retail or financial services
9
industries have the most to gain from sustainability performance (i.e. charitable giving) in terms
of revenue growth.
With support from instrumental stakeholder theory and a majority of previous empirical findings,
we hypothesize that:
Hypothesis 1: Ceteris paribus, there is a positive relationship between corporate sustainability
performance and financial performance.
3.1.4. Causality
In relation to the discussion regarding the relationship between corporate sustainability
performance and financial performance, the causality between the two components has also been
greatly discussed and investigated both theoretically and empirically3.
Proponents of a causal relationship where high levels of sustainability performance leads to higher
financial performance often seeks theoretical support in the social impact hypothesis and/or the
good management theory, both primarily derived from instrumental stakeholder theory (Orlitzky
et al., 2003; Salzmann, Ionescu-Somers, & Steger, 2005). Social impact hypothesis theory
highlights the importance of corresponding to more implicit stakeholder needs. More specifically,
failing to properly satisfy less explicit demands of stakeholders might result in market shocks (e.g.
product recalls or litigation), which may potentially affect the reputation of the corporation. This
may in turn result in negative impact of its financial performance and affect the value of the firm
(Cornell & Shapiro, 1987; Salzmann et al., 2005). It is further believed that the costs of
sustainability activities are minimal in comparison to the possible benefits that are related with
more ethical firm behaviour (Salzmann et al., 2005). Hence, the theory supports an increase in
financial performance if the firm properly responds to various non-investor stakeholders’ needs.
Similarly, good management theory proposes that overall company performance will improve
when the needs of various stakeholders are addressed (Waddock & Graves, 1997). For instance, a
firm that seeks to form good relations with employees (e.g. by considering minorities and gender
diversity) might establish “morale, productivity, and satisfaction” within its workforce and thus
improve productivity (Waddock & Graves, 1997:307).
Turban and Greening (1997) provide empirical support for this notion, finding evidence that firms
with high sustainability performance are more attractive as employers. More specifically, these
firms receive more applicants, which could be considered as a competitive advantage. Further
3 As a positive relationship has been hypothesised, the section will focus on positive causality, for a review of a negative causality see Preston and O’Bannon (1997) and Salzmann et al. (2005).

10
empirical support for the proposition that sustainability performance leads to greater financial
performance is provided by Callan and Thomas (2009), who used accounting based measures of
firm profitability. They find that both return on assets (ROA) and return on sales (ROS) are
positively influenced by firms’ sustainability performance.
Previous research has also concluded in an opposite relationship, i.e. that higher financial
performance leads to higher sustainability performance. This link is usually supported by slack-
resources theory (also referred to as the available funding hypothesis), stating that greater
corporate financial performance allows firms to allocate more resources towards sustainability
enhancing activities (Waddock & Graves, 1997; Salzmann et al., 2005). Thus, if there are
resources to spare within the organisation - corporations will be more willing to act in accordance
with the normative rules associated with a corporate social citizen; resulting in periods of various
funding towards sustainability projects (Allouche & Laroche, 2005). Hence, although a positive
relationship between sustainability performance and financial performance is still supported - the
slack resources theory suggests that the causal relationship goes from financial performance to
sustainability performance instead (Preston & O’Bannon, 1997). Empirically this causal
relationship has been supported by, for instance, Scholtens (2008), who investigate 289 U.S.
corporations between 1991 and 2004, with financial performance measured in total stock returns.
According to the findings, there are indications supporting that the causation mainly moves from
financial to sustainability performance.
Finally, previous research has also suggested that there might be a ‘virtuous cycle’ between the
two components (Waddock & Graves, 1997). When investigating the relationship between
sustainability and financial performance further, Waddock & Graves (1997) discovered equally
significant positive results were found for both directions of the relationship, i.e. both when
sustainability performance was set as dependent of financial performance and the reverse
condition. They, thus, conclude that the relationship between the two components is formed as a
‘virtuous cycle’. That is, that good financial performance creates possibilities for investments in
activities with a long-term strategic impact (i.e. sustainability activities) whereas at the same time,
increased sustainability activities improves financial performance. Thus, indicating that if a
positive relationship can be established the effects may move in both directions.
The above mentioned inconclusiveness of previous research investigating the relationship
between corporate sustainability performance and financial performance calls for a deeper
analysis of components that may potentially affect the relationship, for instance the level of board
diversity.

11
3.2. Board diversity - sustainability performance and financial performance
The traditional monitoring role of the board of directors is based on a principal-agent theory of the
firm (Hillman & Keim, 2003). Also known as the finance view of corporate governance (Letza,
Sun, & Kirkbride, 2004), this perspective asserts that the primary goal of corporations, thus, the
obligation of the board, is to create maximum shareholder value (Jensen & Meckling, 1976). This
perspective has, however, been questioned as being too narrow and insufficient, as it fails to see
how a wider group of stakeholders can influence firm performance (Letza et al., 2004). Instead,
Pfeffer (1972) suggests that directors can be seen as an instrument with which the firm manages
various external stakeholders. An optimal board structure - regarding size and capabilities of the
directors - can facilitate stakeholder management. However, failure to do so could lead to
decreased profitability (Pfeffer, 1972). Findings by Westphal and Fredrickson (2001) conclude
that the board of directors plays an essential role in deciding the strategic direction of the firm.
They argue that board members’ prior experiences and background have a significant influence on
organisational outcome.
Instrumental stakeholder theory, similarly, perceives effective management of stakeholder claims
as vital for corporate success (Donaldson & Preston, 1995). As representatives of shareholders,
the board of directors, thus, constitute an essential part in ensuring that the interests from a wide
array of stakeholders are balanced with the overall strategy of the firm. However, depending on
the background of the directors, the group dynamic and decision making environment may differ,
therefore affecting how various stakeholder interests are handled or prioritised (Harjoto et al.,
2014; Zhang, Zhu, & Ding, 2013). A more heterogeneous or diverse board of directors increases
the mix of knowledge, previous experiences, preferences, and perspectives within the group. This
could potentially result in an increased ability to recognize and respond to different stakeholder
interests and improve sustainability performance (Harjoto et al., 2014). For instance, the level of
educational background is believed to have an impact on the director's’ reasoning and decision
making process (Johnson, Schnatterly, & Hill 2013). Furthermore, according to Kim and Lim
(2010), a higher level of academic major or age heterogeneity among independent outside board
members in Korea are linked to positive effects on the valuation of the firm. Contrary to this,
Rose (2007) fails to find significant influence of diverse director educational background on
financial performance in Danish firms. Instead, the author concludes that any higher educational
degree is sufficient for successfully managing the work as a director.
Furthermore, the influence of board gender diversity on board’s decision making and financial
performance has been greatly investigated (Johnson et al., 2013). For instance, Erhardt, Werbel,
and Shrader (2003) investigate demographic diversity on boards and financial performance among
12
U.S. firms. According to the results, diversity (measured in gender and ethnicity) is positively
related to financial performance (e.g. return on assets, ROA). Furthermore, Nielsen and Huse
(2010) find that female directors have a different leadership style than men. Their findings of
Norwegian firms imply that women bring important capabilities to the board by being more
sensitive to multiple stakeholders’ needs. This way, female directors influence the decision
making of the board concerning firm strategy positively. However, previous studies have also
reached different conclusions, i.e. negative relationships (e.g. Adams & Ferreira, 2009) or
insignificant relationships (e.g. Rose, 2007) between gender diversity and financial performance.
In the research context of corporate sustainability performance, investigating a large sample of
international companies, Bear, Rahman, and Post (2010) conclude that board gender diversity has
a positive impact on how firms choose to engage in sustainability activities. More specifically,
they find that the number of women on the board is positively associated with improved
sustainability performance. The authors suggest that these findings support that improved board
gender diversity leads to a better ability of understanding stakeholder needs and, thus, to more
effective stakeholder management. In studies of U.S. companies, the proportion of women on the
board has also been found to be positively related to corporate charitable giving (Williams, 2003;
Kabongo, Chang, & Li, 2013). Zhang et al. (2013) similarly discovered that female directors
positively influence overall corporate sustainability performance. However, the authors argue that
stakeholders vary between industries, and as a consequence firms therefore adapt their
sustainability activities depending on industry belonging (Zhang et al., 2013). Findings by
Benson, Davidson, and Wang (2011) support the proposition that industry belonging influences
corporate governance mechanisms. The authors conclude that the board of directors’ ability to
effectively manage different stakeholders’ interests differs between consumer-oriented and
industrial-oriented firms.
Studies incorporating several aspects or dimensions of board diversity to examine corporate
sustainability are rare (Harjoto et al., 2014). Instead, most research on board of directors has
focused on board characteristics separately (Johnson et al., 2013). However, a newly conducted
research performed by Harjoto et al. (2014), use a multidimensional measure of board diversity
(including gender, ethnicity, age, director experience, tenure, director power, and
expertise/education) to investigate its relationship with corporate sustainability performance
among U.S. firms. The authors conclude that more diverse boards appear to more effectively meet
the demands of various stakeholders than less diverse boards. More specifically, the authors state
that gender, tenure, and expertise appear to be the driving forces of companies’ chosen level of
corporate sustainability. However, the authors also stress that group diversity could potentially

13
have a negative impact on board effectiveness, resulting in a negative influence on the board’s
ability in overseeing the sustainability activities in the company. For instance, different
perspectives and priorities may lead to complicated decision making processes, i.e. creating
difficulties in reaching consensus (Harjoto et al., 2014).
As each director brings different sets of human capital, e.g. knowledge, expertise and education
(Hillman, Cannella, & Harris, 2002), a more diverse board brings together different perspectives
and knowledge bases. Diversity therefore enhances the ability of recognizing different stakeholder
needs and influencing sustainability decisions. A board composition that potentially enhances
sustainability issues, thus, become important for stakeholder management, which – if handled
properly – may lead to a competitive advantage and financial success for the company (Hillman &
Keim, 2003). Therefore, as implied by instrumental stakeholder theory as well as previous
empirical findings, the second and final hypothesis is:
Hypothesis 2: Ceteris paribus, board diversity components have a positive impact on the
relationship between corporate sustainability performance and financial performance.
3.3. Summary of hypotheses
Figure 1. Summary of hypotheses

14
4. METHODOLOGY
The following chapter describes the methodology - beginning with a brief overall research design and the operationalization of the variables investigated in this thesis, i.e. corporate financial performance, corporate sustainability performance, and board diversity. This will be followed by a description of our control variables, sample and data collection, and, lastly, the statistical tests used to test our hypotheses. Reliability and validity will be discussed throughout the section.
4.1. Overall research design
This study investigates the relationship between corporate sustainability performance and
financial performance, as well as the impact of board composition, by using a quantitative
research design. Based on the instrumental stakeholder theory, we adopt a deductive approach to
test our hypotheses (Saunders, Lewis, & Thornhill, 2012) on firms listed on NASDAQ OMX
Stockholm between the years 2009 and 2013. In a first step, correlation analysis will determine
the relationship between sustainability performance, financial performance, and board
composition. The relationship between sustainability and financial performance will then be
tested using multivariate regression analysis. The following generic model is used to test the two
hypotheses:
Financial performance = f(sustainability performance + board diversity + control variables)
4.2. Operationalization
4.2.1. Corporate financial performance measurement
In their meta-analysis of the sustainability-financial performance relationship, Orlitzky et al.
(2003) found that accounting based measures of financial performance have a stronger
relationship to corporate sustainability performance than market based measures. Following much
previous research, e.g. Waddock and Graves (1997), Orlitzky et al. (2003), Callan and Thomas
(2009), and Barnett and Salomon (2012), this thesis uses the return on assets (ROA) to measure
financial performance. ROA is not only a standard measurement of corporate performance within
corporate sustainability literature, it is also commonly used in the majority of strategy research
(Barnett & Salomon, 2012). ROA is calculated as the net profit in relation to total assets.
4.2.2. Corporate sustainability performance measurement
An often credited explanation for the inconsistent and inconclusive results in prior studies, is the
various constructs used to measure sustainability performance (Salzmann et al., 2005). Despite
approximately fifty years of previous research (Margolis & Walsh, 2003), there is still no
consensus on how to properly measure sustainability within corporations (Ameer & Othman,

15
2012; Montiel & Delgado-Ceballos, 2014). According to a literature review performed by Montiel
and Delgado-Ceballos (2014), there are two main data collecting methods used to capture
corporate sustainability performance. Firstly, previous empirical research has used various
secondary sources in the form of different sustainability indexes as a proxy for measuring
corporate sustainability. Among the most commonly used indexes are, for instance, the Kinder
Lydenberg, and Domini (KLD) index (e.g. Waddock & Graves, 1997; Hillman & Keim, 2001;
Mattingly & Berman, 2006), the Dow Jones Sustainability Index, DJSI (e.g. Lopez, Garcia, &
Rodriguez, 2007), and the ASSET4 ESG index (e.g. Trumpp, Endrikat, Zopf, & Guenther, 2015).
These indexes are based upon a set of sustainability criteria and indicators, which are evaluated by
third-party observers; either by the use of surveys, interviews, and/or by content analysis of public
corporate disclosure material (Soana, 2011; Chatterji & Levine, 2006). However, there are several
potential drawbacks using these forms of secondary sources. For instance, there is a risk of
subjectivity, as rating agencies might interpret sustainability performance differently (Soana,
2011). Furthermore, rating agencies may also use different methodologies, e.g. use of criteria,
amount of qualitative or quantitative indicators, and weighting systems, which may affect the end
results (Chatterji & Levine, 2006). Another issue is the lack of transparency, since indicators used
by these agencies may not be publically available; therefore limiting the reliability of the results.
The second method of collecting data used by prior empirical research, is the construct of new
indexes and scales to measure corporate sustainability performance - thus, collecting own primary
data (Montiel & Delgado-Ceballos, 2014). This is done either by using surveys or by analysing
public corporate reporting directly (e.g. Bansal, 2005; Ameer & Othman, 2012). As with
secondary sustainability indexes, this method is also associated with a certain level of subjectivity.
However, it also allows for a greater consideration to contextual factors. For instance, several
indicators in secondary sustainability-measurements are usually formulated based on American
regulations and reporting standards (e.g. labour and health care). Thus, making them less relevant
for other contexts where other regulations and cultural traditions apply, such as the Swedish
context. According to Gjølberg (2009), Nordic companies are well committed to CSR activities
and also operate under stringent social and environmental regulations.
As only few Swedish companies are included in the present acknowledged sustainability rating
databases and because of limited accessibility and appropriateness, it is not suitable to use these
secondary databases. Since doing so would result in a too limited sample. We therefore
constructed a new sustainability performance index based on publically disclosed reporting
material.

16
Disclosure or performance?
Before constructing a sustainability performance index based upon corporate disclosures, it is
important to consider whether sustainability performance is related to the level of disclosure
quality of sustainability or not. Herbohn, Walker, and Loo (2014) found that among mining and
energy firms in Australia, there was a strongly significant positive relationship between the
quality of sustainability disclosures and sustainability performance. Similarly, Al-Tuwaijri,
Christensen, and Hughes (2004) found a significant positive relationship between environmental
performance and comprehensive environmental disclosures. Thus, these results indicate that the
quality of company disclosure of sustainability activities is appropriate to assess the level of
sustainability performance.
However, a common concern regarding sustainability performance, is that most information is
provided by the companies themselves (Orlitzky et al., 2003; Soana, 2011); therefore, increasing
the risk for ‘greenwashing’ activities (Baumgartner & Ebner, 2010). Thus, to determine the
quality of corporate sustainability reporting, critical examinations are needed. To mitigate the risk
of ‘greenwashing’, a performance index should therefore consist of both qualitative (‘soft’) and
quantitative (‘hard’) indicators, since the latter is more difficult to mimic or alter – i.e. to be
perceived as more sustainable (Clarkson, Li, Richardson, & Vasvari, 2008). Furthermore, to
determine the quality of sustainability reporting, the performance index may also include, for
instance, whether the corporation uses a renowned sustainability reporting standard or if it
monitors or verifies its results by a third party (Thomson Reuters ASSET4, 2015).
Index construction
Creating a composite index involves selecting and categorising appropriate indicators aimed at
capturing corporate sustainability performance, i.e. “how do companies actually integrate
environmental and social responsibility activities within business processes?” (Ameer & Othman,
2014:66). According to Singh, Murty, Gupta, and Dikshit (2009), this procedure needs to be based
on both theory and empirical analysis. Thus, in accordance with instrumental stakeholder theory,
the sustainability measurement was divided into primary stakeholder groups (Clarkson, 1995), i.e.
(1) Corporate Governance (CG)4, (2) Employees & Suppliers (ES), (3) Customers & Society (CS),
and (4) the Environment (E). This stakeholder approach is supported by previous research, for
instance Ameer and Othman (2014), who made a division into community, diversity,
environment, and ethical standards. Thereafter, appropriate key performance indicators, aimed at
capturing corporate sustainability performance, were selected for each stakeholder group –
4 The Corporate Governance indicator does not include any aspects that can impede with board composition and financial performance.
17
underpinned by both theoretical and empirical research to increase the validity of the
sustainability index (Ameer & Othman, 2012). For example, the sustainability-rating index
ASSET45 provides a detailed list of indicators used in its assessment (Thomson Reuters ASSET4,
2015) and was, therefore, used as input for our index. In Appendix 1, Table 2, a list is presented
with the theoretical and empirical used to support the sustainability index.
A binary coding scheme (0 or 1) (Herbohn et al., 2014) was used for the eighteen indicators
constituting the index. As mentioned above, quantitative indicators are more difficult to mimic.
Therefore, six indicators6 are divided into three levels: 1) qualitative reporting, 2) proactive
quantitative target setting, and 3) quantitative progress. To reward those companies that showed
proactive initiatives or explicitly improved their sustainability performance, (i.e. not only the
amount of qualitative disclosure), the second and third level represent two and three scores
respectively. Thus, resulting in that companies reporting quantitative data are scored higher than
companies only reporting qualitative data (Al-Tuwaijri et al., 2004). In those instances where the
company did not report data on an indicator, these were assumed to be insignificant or less
important for the company and, thus, assigned a zero score. In addition, we further tested whether
replacing these missing values with the industry mean value for that indicator would change the
score (Barnett & Salomon, 2012). However, we found no significant changes. Instead the
sustainability performance score remained relatively constant.
Finally, each stakeholder group includes a various number of indicators, thus resulting in different
total score per category. Thus, to ensure equal weighting of each group, the total score for each
category is scaled by the total maximum score of the category in question (Herbohn et al., 2014).
This resulted in four (4.0) being the maximum possible sustainability performance score. Further,
due to inter-industry variations in sustainability practices, industry needs to be accounted for to
mitigate the effect of these differences (Margolis & Walsh, 2007). For instance, occurrence or
differences in proprietary costs of pollution (Clarkson et al., 2008) or the degree of regulation
imposed on a firm could influence sustainability performance differently (Margolis & Walsh,
2007). However, no industry weighting was performed in the index. Instead these industry
differences are taken into account by adding industry as a fixed variable (see Section 4.5.
Statistical tests).
”The reliability of a scale indicates how free it is from random error.” (Ameer & Othman,
2012:67). To assess reliability of the index results, Cronbach’s Alpha was used to test the internal
consistency among the indicators within each category. The Cronbach’s coefficient is measured 5 ASSET4 has been found to be a suitable measure of firm long-term value creation (Ribando & Bonne, 2010). 6 One of the six indicators was changed and is divided into two levels (i.e. 1 and 2).

18
from 0 to 1 - with a higher value indicating higher reliability. More specifically, a value within
0.6-0.7 is considered acceptable and a value above 0.8 is considered good (Nunnally, 1978 cited
in Ameer & Othman, 2012, p. 67). We therefore tested the indicators within the four categories
and found values of 0.72 (CG), 0.65 (ES), 0.67 (CS), and 0.83 (E). This suggests that the selected
indicators are acceptable for constructing a multidimensional measurement of sustainability
performance.
Before conducting the main data collection, a pilot study, including fifteen randomly selected
companies (of different sizes and industries) for the years 2010 and 2013, were performed. This
study was conducted to test the relevance of the sustainability performance index – i.e. the choice
of indicators, time required for data collection for each observation, etc. As a result of the pilot
study, some indicators were removed or slightly altered due to the lack of company reporting of
those indicators. For instance, the points for quantitative progress of diversity were removed, due
to differences in reporting and, which therefore resulted in difficulties of interpretation. The
remaining final sustainability performance index is presented in Appendix 1, Table 1, followed by
the list of the theoretical and empirical literature used to support each indicator, Table 2. To
ensure transparency, and thus reliability, examples of interpretations are included in the index
next to each indicator.
4.2.3. Board diversity
In accordance with Harjoto et al. (2014), multiple board diversity components are tested. Board
diversity is operationalized by four variables - gender, age, education and an aggregated diversity
measurement of the former variables. The variables are constructed into separate diversity indexes
using Blau’s index of heterogeneity. The level of heterogeneity of a characteristic within a group
is calculated as (1−∑pi2), where P represents the proportion of directors in a given category and i
stands for the number of categories represented (Blau, 1977). Depending on the number of
categories, the score for perfect heterogeneity varies. More specifically, gender measures the level
of gender heterogeneity - male and female - present on the board. This implies that a diversity
index of 0.0 represents complete gender homogeneity and a value of 0.5 represents perfect gender
heterogeneity of the board7. Age represents the level of diversity regarding director’s age, which
is divided into five different categories - younger than 40 years old, 40 to 49, 50 to 59, 60 to 69,
and 70 years old or higher. With these five categories, perfect heterogeneity of director’s age
represents a Blau’s index value of 0.8. Education measures the heterogeneity of the director’s
educational background. These are divided into eight categories - business, engineering, law,
7 More specifically, the maximum value of the gender diversity index with two categories is 0.5=(1-0.52+0.52).

19
other education (e.g. medicine), combined degrees of business and engineering, combined degrees
of business and law, other combinations of degrees, and no educational background or
unspecified. Thus, Blau’s index for perfect educational heterogeneity is 0.875.
However, to be able to construct an aggregated board diversity measurement (DIV), each of the
three diversity indexes is divided by the total score (i.e. perfect heterogeneity) for each category.
Thus, the minimum and maximum level for each separate diversity component is 0.00
respectively 1.00. By adding the three separate diversity indexes together, the aggregated board
diversity measurement has a minimum level of 0.00 and a maximum level of 3.00.
4.3. Control variables
When investigating the relationship between corporate sustainability performance and financial
performance, it is important to take into account variables that may influence a corporation’s
performance. Failing to do so may lead to biased results (Saunders et al., 2012). According to the
findings of the meta-analysis performed by Orlitzky et al. (2003) and Margolis and Walsh (2007),
the most common control variables within corporate sustainability literature are firm size, industry
and financial risk (e.g. debt ratio). Firm size (i.e. total assets) and debt ratio are therefore included
in the analysis together with fixed (industry and year) effects, to control for unobservable
variables influence (see Section 4.5. ‘Statistical tests’ for a specification of fixed effects).
Firm-size
According to Waddock and Graves (1997), firm size should be considered because of its potential
influence on both corporate sustainability and financial performance. Indeed, empirical research
has found that there is a relationship between the size of the firm and sustainability performance
as well as to some measurements of financial performance (Fischer & Sawczyn, 2013; Orlitzky et
al., 2003) and to the sustainability rating of the firm (Johnson & Greening, 1999). For instance,
stakeholders may have greater expectations and concerns regarding the level of responsibility of
actions and activities performed by larger firms (Hillman & Keim, 2001). Furthermore, the size of
the corporation might also affect the availability of resources that can be used for the creation of
performance disclosures (Herbohn et al., 2014). For instance, previous research has found a
positive relationship between firm size and the amount of corporate disclosure (e.g. Clarkson et
al., 2008). In accordance with Waddock and Graves (1997), firm size is measured by the
logarithm of total assets.
20
Debt ratio
The second control variable accounts for the risk associated with debt burden. The level of debt
might have implications on managerial behaviour. More specifically, it may constrain managers’
opportunity seeking behaviour as well as controlling managers into making decisions that are in
the best long-term interest of the company (Waddock & Graves, 1997; Barnett & Salomon, 2012).
Following much previous research (e.g. Waddock & Graves, 1997; Nelling & Webb, 2009;
Barnett & Salomon, 2012), the proxy measurement for financial risk is debt ratio, calculated as
the ratio of total debt to total assets.
Board size
Previous research has investigated whether the size of the board has an impact on board decisions.
For our second hypothesis, board size will therefore be added to the control variables in
accordance with Hillman and Keim (2001). For example, Kassinis and Vafeas (2002) have found
that the risk of the firm being charged with environmental litigation, increased with board size.
This finding indicates that large boards are less effective in monitoring and preventing such
behaviour (Kassinis & Vafeas, 2002). Similarly, Walls et al. (2012) discovered that firms with
larger boards had poorer environmental performance. Supporting this, Benson et al. (2011) found
that smaller boards have more effective monitoring processes that prevent excessive spending of
firm resources on stakeholder management activities. Thus, board size may influence board
effectiveness and, as a result also sustainability and financial performance. Board size refers to the
total number of directors on the board.
4.4. Sample and data collection
The thesis considers discretionary sustainability related material available in the public domain;
thus, only data that is available to all stakeholders (van der Ploeg & Vanclay, 2013). Therefore,
the data collection for the sustainability index relies on corporate annual reports and sustainability
reports as sources of information. This approach is used in previous studies, for example Clarkson
et al. (2008) and Herbohn et al. (2014). The financial performance data is collected from
Thomson Reuters’ Datastream and board data is manually collected from annual reports and
corporate governance reports.
The thesis uses an unbalanced data set of firms listed on NASDAQ OMX Stockholm during
2009-2013. An advantage of using an unbalanced sample is that the risk of survival bias is
eliminated. As presented in Table I, our initial sample constitutes of 1,193 observations (300
firms) from various industries. However, in accordance with previous research, financial
institutions and investment companies are excluded - as these companies do not report any
21
operational profit and also follow different regulatory requirements compared to other firms
represented in the sample. We also exclude, observations with zero sustainability performance
and missing accounting data. These adjustments resulted in a final unbalanced sample of 1,015
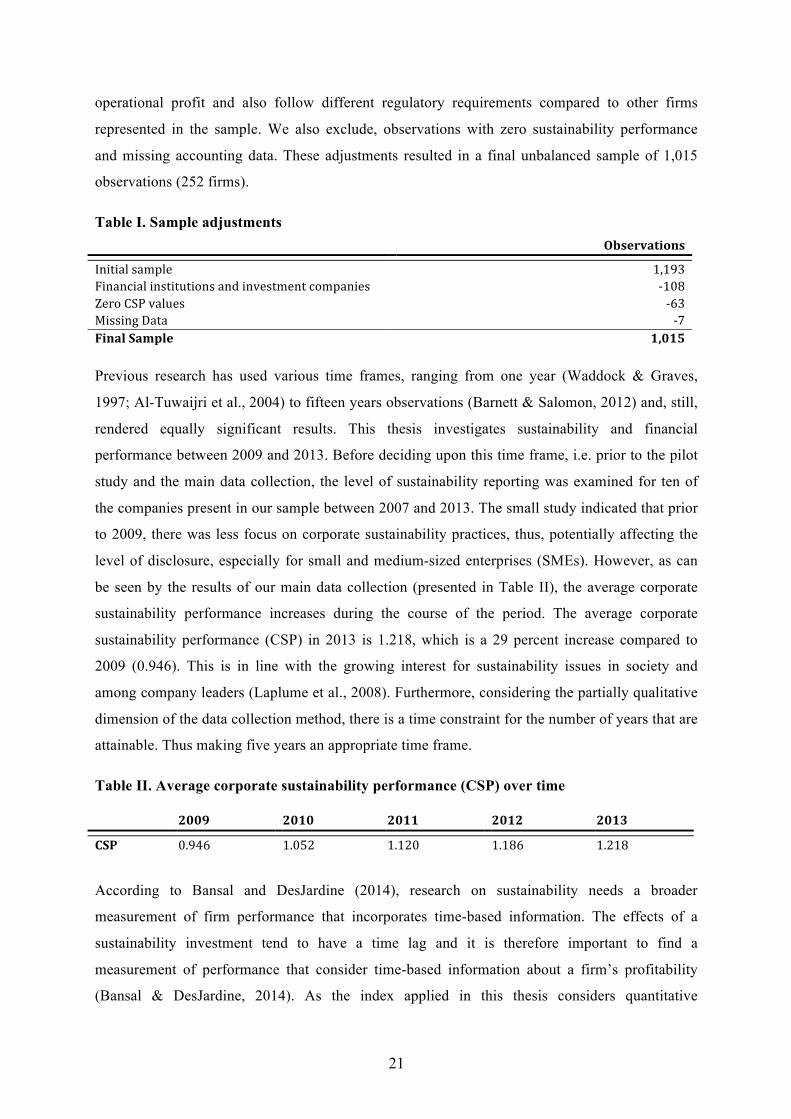
observations (252 firms).
Table I. Sample adjustments Observations
Initial sample 1,193 Financial institutions and investment companies -‐108 Zero CSP values -‐63 Missing Data -‐7 Final Sample 1,015
Previous research has used various time frames, ranging from one year (Waddock & Graves,
1997; Al-Tuwaijri et al., 2004) to fifteen years observations (Barnett & Salomon, 2012) and, still,
rendered equally significant results. This thesis investigates sustainability and financial
performance between 2009 and 2013. Before deciding upon this time frame, i.e. prior to the pilot
study and the main data collection, the level of sustainability reporting was examined for ten of
the companies present in our sample between 2007 and 2013. The small study indicated that prior
to 2009, there was less focus on corporate sustainability practices, thus, potentially affecting the
level of disclosure, especially for small and medium-sized enterprises (SMEs). However, as can
be seen by the results of our main data collection (presented in Table II), the average corporate
sustainability performance increases during the course of the period. The average corporate
sustainability performance (CSP) in 2013 is 1.218, which is a 29 percent increase compared to
2009 (0.946). This is in line with the growing interest for sustainability issues in society and
among company leaders (Laplume et al., 2008). Furthermore, considering the partially qualitative
dimension of the data collection method, there is a time constraint for the number of years that are
attainable. Thus making five years an appropriate time frame.
Table II. Average corporate sustainability performance (CSP) over time
2009 2010
2011
2012
2013
CSP 0.946 1.052 1.120 1.186 1.218
According to Bansal and DesJardine (2014), research on sustainability needs a broader
measurement of firm performance that incorporates time-based information. The effects of a
sustainability investment tend to have a time lag and it is therefore important to find a
measurement of performance that consider time-based information about a firm’s profitability
(Bansal & DesJardine, 2014). As the index applied in this thesis considers quantitative
22
information about firms’ sustainability performance. The potential influence of a time lag between
disclosure and performance is minimised when the voluntary (sustainability) disclosures impact
the operations for that year (e.g. use of energy or resources). Additionally, as financial
performance and certain aspects of sustainability disclosure behaviour are relatively static, the
effects of time lags are further reduced. Furthermore, time lags between financial and
sustainability performance might not be necessary due to the previously mentioned ‘virtuous
cycle’, where the variables positively influence each other simultaneously (Waddock & Graves,
1997; Nelling & Webb, 2009). Or, alternatively due to the ‘negative synergy hypothesis’, where
sustainability activities and financial performance affect each other negatively (Makni, Francoeur,
& Bellavance, 2009).
4.5. Statistical tests
To examine the underlying hypothesised relationship between corporate sustainability
performance and financial performance, a univariate regression analysis is conducted - using
ROA as the dependent variable and corporate sustainability performance (CSP) as the
independent variable. However, to be able to determine the strength of this relationship, an
ordinary least squares (OLS) multivariate regression analysis is performed to control for other
potentially influential variables. This procedure is commonly used within the corporate
sustainability literature (e.g. Waddock & Graves, 1997; Barnett & Salomon, 2012). Furthermore,
to test the four stakeholder categories (Corporate Governance, Employees & Suppliers, Customer
& Society, and Environment) from the sustainability index, a second model regresses ROA on
each category separately. This allows further investigation of the relationship between financial
performance and different aspects of sustainability performance. The following general regression
models are tested, with slight modifications (presented as Model 1-3 and 4a-d in the empirical
results):
ROAit = β0 + CSPitβ1 + Xitβ2 + Ztβ3 + Iiβ4 + εit
ROAit = β0 + CGitβ1 + ESitβ2 + CSitβ3 + Eitβ4 + Xitβ5 + Ztβ6 + Iiβ7 + εit
A multivariate regression analysis is also used to examine our second hypothesis, i.e. the impact
of board diversity on the relationship between corporate sustainability performance and financial
performance. To test the impact of board diversity, an interaction term of corporate sustainability
performance (i.e. the independent variable) and for each board diversity variable is computed
(Aiken & West, 1991). However, prior to computing the interaction term, the variables are
centred to avoid issues of multicollinearity, i.e. by subtracting the mean from the independent
variables. A dummy is also created for each diversity variable - between those who scored 0.50 or

23
higher on the diversity scale and those who scored lower. This procedure allows for a comparison
of the influence on the sustainability-financial performance relationship between firms with the
most and the least diverse boards of directors. Each of the four diversity variables is included
separately, below categorized as BOARD. The following general regression model are tested for
board (presented as Model 6-9 in the results):
ROAit = β0 + CSPitβ1 + BOARDitβ2 + CSPit*BOARDitβ3 + Xitβ4 + Ztβ5 + Iiβ6 + εit
Table III. Variable descriptions
ROAit = Square transformation of return on assets
CSPit = Corporate sustainability performance
CGit = Corporate Governance ESit = Employees and Suppliers CSit = Customers and Society Eit = Environment
BOARDit Board diversity DIVit = Aggregated board diversity GENDERit = Gender diversity EDUCATIONit = Education diversity AGEit = Age diversity
Xit = Control variables FIRM SIZEit = The logarithm of total assets DEBT RATIOit = Financial risk, measured by debt-ratio BOARD SIZEit = Total number of directors
Zt
= Fixed year effects Ii = Fixed industry effects
β0 = Intercept εit = Error term
i = Observation t = Year of observation
An assumption in OLS regression is independence of observations, thus any serial correlation
would therefore violate this assumption (Brooks, 2002). Due to the use of panel data, i.e. several
observations per firm over several years, the risk exists that errors are correlated across
observations over time (Greene, 2012). Furthermore, there might be a systematic variation of
performance within industries, i.e. that performance varies between industries due to non-
temporal factors (e.g. seasonal fluctuations). To account for this unobserved heterogeneity, we
include (fixed) year and industry effects8 in the models (Greene, 2012). By including these fixed
8 For each year (i.e. 2009-2013) and industry (divided into four industries – manufacturing, services, trade, and real estate) dummies are created.
24
variables, we are able to control for characteristics that are not directly measured by the other
variables.
4.5.1. Sample adjustments and tests
Parametric tests require the data variables to have a normal distribution. Thus, it is necessary to
normalize the variables before conducting the statistical analysis. A box-plot visualising the
distribution of observations demonstrated existence of extreme values, which without action may
distort the regression results and lead to overestimated results. This thesis uses winsorisation to
eliminate the influence of outlier values, which entails moving the extreme values from the tails
towards the mean of the sample. More specifically, with a set limit of one percent for both tails,
outlier values were moved to the 1st and 99th percentile respectively. This method of handling
outliers is preferred since it improves the distribution of our sample and is a common outlier
screening method within accounting research (Leone, Minutti-Meza, & Wasley, 2014). A further
prerequisite for running a multivariate regression model is that the variance in the residuals is
homogenous (Brooks 2002). A visual inspection of the predicted residuals (through a P-P plot)
indicated a random pattern, thus lending support to assuming homoscedasticity.
To examine whether the independent variables correlate, a multicollinearity assessment was
conducted by investigating the Variance Inflation Faction (VIF). However, there are differences
in opinion when the VIF value is perceived as too high. For instance, prior research has used a
VIF-level ranging from 4 to 10 to signal excessive multicollinearity (O’Brien, 2007). Therefore,
in lack of a long-established critical VIF-level (Stine, 1995), this thesis has set the VIF-limit to the
frequently used maximum of 10 (e.g. Barnett & Salomon, 2012). Our results (see Appendix II,
Table 6 and 7) indicated a low level of multicollinearity, since all variables had a VIF-level
ranging between one and three; hence lower than our maximum level of acceptance. Thus, we can
assume that the level of multicollinearity does not have a negative influence our results presented
herein.

25
5. EMPIRICAL RESULTS AND ANALYSIS
This chapter entails the results from the statistical analysis. Beginning with a presentation and analysis of the descriptive statistics and correlation analysis. This is followed by the findings from the first (H1) and second (H2) multivariate regressions as well as robustness tests.
5.1. Descriptive statistics and correlations
Table IV presents the descriptive statistics and correlations for the variables used to assess the
relationship between corporate sustainability performance (CSP) and corporate financial
performance (ROA), i.e. the first hypothesis. ROA is on average 0.02, with a minimum and
maximum level of -0.74 and 0.26. The average CSP is 1.10 - with a minimum and maximum level
of 0.04 and 3.83. The average sustainability score of 1.10 is relatively low in comparison with the
maximum index score of 4.00. However, this may be explained by the structure of the
sustainability index, which rewards quantitative improvement disclosure higher than qualitative
reporting. Thus, to qualify as a top sustainability performer, both high scores in terms of
qualitative and quantitative disclosure is required. Therefore, the average score indicate that
relatively few were able to fulfil both these conditions. To increase the transparency of the results,
descriptive statistics for transformed variables (i.e. ROA and FIRM SIZE) as well as skewness
and kurtosis are presented in Appendix II, Table 3.
CSP and ROA show a significant positive correlation at 0.25 (p<0.01). This supports our first
hypothesis, i.e. that there is a positive relationship between corporate sustainability activities and
financial performance. ROA and FIRM SIZE have a positive correlation at 0.10 (p<0.0.1).
Furthermore, CSP and FIRM SIZE are positively correlated at 0.45 (p<0.01). This could be
explained by that larger firms, on average, score higher on sustainability performance than smaller
firms. This result is as expected, since larger firms, generally, have more resources to spend on
sustainability enhancing activities than smaller firms.
Each separate dimension of the sustainability index, i.e. Corporate Governance, Employees &
Suppliers, Customer & Society, and Environment, is positively correlated to ROA (p<0.01). Thus,
the first hypothesis is supported for each stakeholder category of the index, that is, all four aspects
indicate a positive relationship between corporate sustainability performance and financial
performance. Thus, further supporting our first hypothesis.

26
Table IV. Descriptive statistics and correlations – ROA & CSP
1. 2. 3. 4. 5. 6. 7. 8.
1. ROA
1
2. CSP
0.25** 1
3. CG
0.22** 0.88** 1
4. ES
0.15** 0.80** 0.64** 1
5. CS
0.23** 0.79** 0.55** 0.46** 1
6. E
0.20** 0.84** 0.70** 0.60** 0.51** 1
7. FIRM SIZE
0.10** 0.45** 0.41** 0.41** 0.32** 0.34** 1
8. DEBT RATIO
-‐0.01 0.24** 0.19** 0.17** 0.21** 0.22** 0.15** 1 Mean 0.02 1.10 0.26 0.26 0.35 0.22 16,955.8 0.52 Standard dev. 0.15 0.81 0.26 0.22 0.28 0.23 47,291.7 0.19 Minimum -‐0.74 0.04 0.00 0.00 0.00 0.00 24.3 0.01 Maximum 0.26 3.83 1.00 1.00 1.00 1.00 396,110.5 1.41 N 1,015 1,015 1,015 1,015 1,015 1,015 1,015 1,015
** Significant at 0.01 level (2-‐tailed). * Significant at 0.05 level (2-‐tailed).
Table V, presents the descriptive statistics and correlations for the variables used to answer the
second hypothesis – including the aggregated diversity measurement (DIV) and the separate
diversity components, GENDER, EDUCATION, and AGE. Aggregated diversity (DIV) is on
average 2.03, with a minimum and maximum of 0.00 and 2.68, where 3.0 is the highest score for
complete heterogeneity. On average, gender board diversity (GENDER) is approximately 0.64.
The minimum and maximum level for GENDER is 0.00 respectively 1.0, thus boards are
represented with both complete homogeneous and heterogeneous boards. AGE is on average 0.73,
with a minimum level of 0.0 and a maximum level of 0.99. Therefore, no board among the sample
constitutes of perfect heterogeneity regarding director age. The last and fourth diversity
measurement, EDUCATION has a mean of 0.66 – with a minimum level of 0.00 and a maximum
level of 0.93. As with AGE, there is no board with perfect heterogeneity in the sample.
Concerning the size of the board (BOARD SIZE), the number of board members varies between 3
and 12 - and constitutes on average of 6 board members.
The correlation between ROA and DIV shows a positive relationship, 0.09 (p<0.01). There is
furthermore a positive correlation between CSP and DIV at 0.24 (p<0.01). This implies that a
heterogeneous board is positively related with both sustainability and financial performance.
GENDER is positively correlated with both ROA, 0.12 (p<0.01) and CSP, 0.22 (p<0.01).
Indicating that an even distribution between male and female board members among the board of
directors is positively associated with corporate sustainability performance and financial
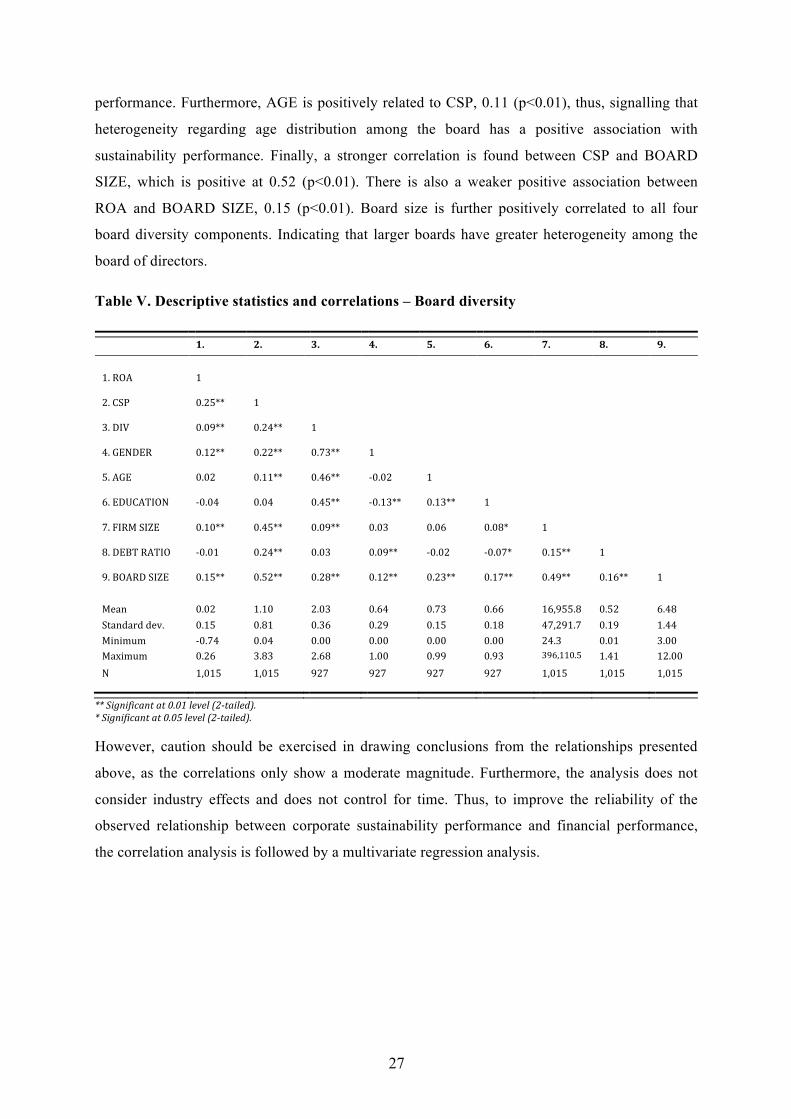
27
performance. Furthermore, AGE is positively related to CSP, 0.11 (p<0.01), thus, signalling that
heterogeneity regarding age distribution among the board has a positive association with
sustainability performance. Finally, a stronger correlation is found between CSP and BOARD
SIZE, which is positive at 0.52 (p<0.01). There is also a weaker positive association between
ROA and BOARD SIZE, 0.15 (p<0.01). Board size is further positively correlated to all four
board diversity components. Indicating that larger boards have greater heterogeneity among the
board of directors.
Table V. Descriptive statistics and correlations – Board diversity
1. 2. 3. 4. 5. 6. 7. 8. 9.
1. ROA
1
2. CSP
0.25** 1
3. DIV
0.09** 0.24** 1
4. GENDER
0.12** 0.22** 0.73** 1
5. AGE
0.02 0.11** 0.46** -‐0.02 1
6. EDUCATION
-‐0.04 0.04 0.45** -‐0.13** 0.13** 1
7. FIRM SIZE
0.10** 0.45** 0.09** 0.03 0.06 0.08* 1
8. DEBT RATIO
-‐0.01 0.24** 0.03 0.09** -‐0.02 -‐0.07* 0.15** 1
9. BOARD SIZE
0.15** 0.52** 0.28** 0.12** 0.23** 0.17** 0.49** 0.16** 1 Mean 0.02 1.10 2.03 0.64 0.73 0.66 16,955.8 0.52 6.48 Standard dev. 0.15 0.81 0.36 0.29 0.15 0.18 47,291.7 0.19 1.44 Minimum -‐0.74 0.04 0.00 0.00 0.00 0.00 24.3 0.01 3.00 Maximum 0.26 3.83 2.68 1.00 0.99 0.93 396,110.5 1.41 12.00 N
1,015 1,015 927 927 927 927 1,015 1,015 1,015
** Significant at 0.01 level (2-‐tailed). * Significant at 0.05 level (2-‐tailed).
However, caution should be exercised in drawing conclusions from the relationships presented
above, as the correlations only show a moderate magnitude. Furthermore, the analysis does not
consider industry effects and does not control for time. Thus, to improve the reliability of the
observed relationship between corporate sustainability performance and financial performance,
the correlation analysis is followed by a multivariate regression analysis.

28
5.2. Positive relationship between sustainability performance and financial performance
To test the first hypothesis, a multivariate regression analysis was conducted with ROA as the
dependent variable. However, prior to the multivariate regression, a univariate regression analysis
was performed with ROA as the dependent variable and corporate sustainability performance
(CSP) as the independent variable – to test the underlying relationship (See Appendix II, Table 4
for results). The results indicate a significant (p<0.01) positive relationship between ROA and
CSP – with an adjusted R-square at 0.059. However, to be able to determine the strength of the
relationship, multivariate regression analyses were also conducted to control for other influential
variables.
The results from the multivariate regression analyses, which are divided into three models, are
presented in Table VI. In Model 1, ROA is regressed based on corporate sustainability
performance (CSP) using firm size and debt ratio as control variables and without fixed year and
industry effects. In Models 2 and 3, the same multivariate regression was conducted, with the
exception that year effects are included in the second model and both year and industry effects are
added into the third model. Thus, these models are imposed to stricter tests in comparison with the
first regression model.
As can be seen at the end of each column (Table VI), the adjusted R-square, i.e. the explanatory
power of the regression model, improves continuously in each of the three models, i.e. 0.102
(Model 1), 0.105 (Model 2), and 0.159 (Model 3). That is, the explanatory power of the regression
model improves when year and industry effects are added to the analysis. This indicates that there
is no substantial year-specific and industry-specific variation in performance of observations. If
this had been the case, the explanatory power of the model would have been reduced as opposed
to being improved. However, as depicted in Table VI, the industry fixed effects were greater than
the year fixed effects.
Model 1 (i.e. with control variables and no fixed effects) supports the results from the correlation
analysis, that is, there is a significant (p<0.01) positive relationship between corporate
sustainability (CSP) and ROA. More specifically, when the corporate sustainability activities of
companies improve, the financial performance in terms of ROA increases. These findings are
consistent with previous empirical research investigating the relationship of the two components
(e.g. Waddock & Graves, 1997; Orlitzky et al., 2003).
These results remain consistent in, Model 2 (i.e. with control variables and year fixed effects).
That is, adding year fixed effects did not have any major effects of the results from the first
model. However, as already mentioned, the explanatory power improved slightly.
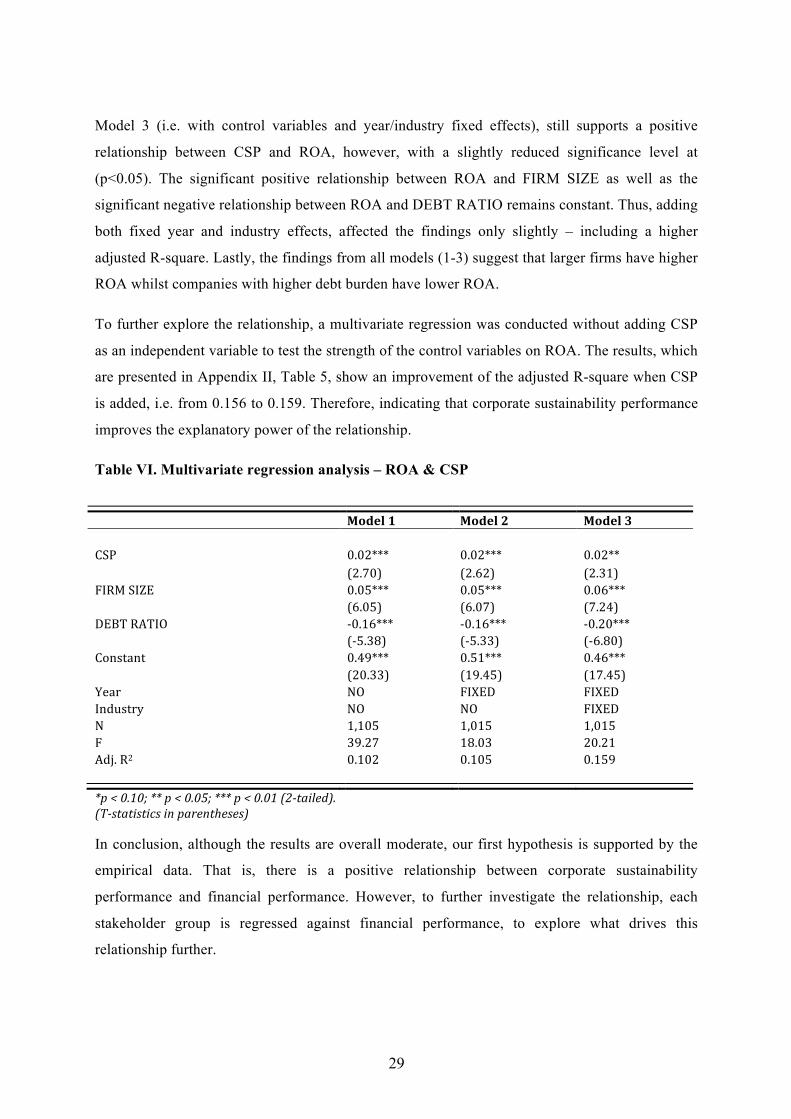
29
Model 3 (i.e. with control variables and year/industry fixed effects), still supports a positive
relationship between CSP and ROA, however, with a slightly reduced significance level at
(p<0.05). The significant positive relationship between ROA and FIRM SIZE as well as the
significant negative relationship between ROA and DEBT RATIO remains constant. Thus, adding
both fixed year and industry effects, affected the findings only slightly – including a higher
adjusted R-square. Lastly, the findings from all models (1-3) suggest that larger firms have higher
ROA whilst companies with higher debt burden have lower ROA.
To further explore the relationship, a multivariate regression was conducted without adding CSP
as an independent variable to test the strength of the control variables on ROA. The results, which
are presented in Appendix II, Table 5, show an improvement of the adjusted R-square when CSP
is added, i.e. from 0.156 to 0.159. Therefore, indicating that corporate sustainability performance
improves the explanatory power of the relationship.
Table VI. Multivariate regression analysis – ROA & CSP
Model 1 Model 2 Model 3 CSP 0.02*** 0.02*** 0.02** (2.70) (2.62) (2.31) FIRM SIZE 0.05*** 0.05*** 0.06*** (6.05) (6.07) (7.24) DEBT RATIO -‐0.16*** -‐0.16*** -‐0.20*** (-‐5.38) (-‐5.33) (-‐6.80) Constant 0.49*** 0.51*** 0.46*** (20.33) (19.45) (17.45) Year NO FIXED FIXED Industry NO NO FIXED N 1,105 1,015 1,015 F 39.27 18.03 20.21 Adj. R2 0.102 0.105 0.159
*p < 0.10; ** p < 0.05; *** p < 0.01 (2-‐tailed). (T-‐statistics in parentheses)
In conclusion, although the results are overall moderate, our first hypothesis is supported by the
empirical data. That is, there is a positive relationship between corporate sustainability
performance and financial performance. However, to further investigate the relationship, each
stakeholder group is regressed against financial performance, to explore what drives this
relationship further.

30
Table VII, therefore, separates the aggregated corporate sustainability performance (CSP) index
into its four stakeholder categories, i.e. Corporate Governance (CG), Employees & Suppliers
(ES), Consumer & Society (CS), and Environment (E). However, out of these four sustainability
categories, only Consumer & Society can for certainty explain variations in ROA. More
specifically, there is a significant (p<0.01) positive relationship between CS and ROA. That is,
despite the fact that all stakeholder categories are positively correlated to ROA (see Table IV),
only Consumer & Society is significant when controlling for firm size, debt ratio, and
industry/year fixed effects in the regression. Thus, implying that for three of the stakeholder
categories, other variables have stronger influence in explaining ROA. To investigate these effects
further, additional tests of the stakeholder categories were performed where the two control
variables, i.e. firm size and debt ratio, were each excluded from the analysis. The findings, which
are presented in Appendix II (Table 8), indicate that when firm size is excluded from the
regression, the influence of each stakeholder category is positive and significant at (p<0.01).
Therefore, implying that firm size has a stronger effect in explaining ROA, than the separate
stakeholder categories (i.e. CG, ES, and E).
However, despite insignificant results for the stakeholder category, the adjusted R-squares for
Model 4a, 4c, and 4d remain relatively constant - ranging from 0.155-0.157 - in comparison with
the adjusted R-squared in Model 3 (Table VI) at 0.159. The highest adjusted R-square is present
in Model 4b, i.e. with the significant stakeholder category (Consumer & Society, CS), at 0.165 -
indicating that this model has the highest explanatory power of ROA. These findings are
consistent with those of Orlitzky et al. (2003), i.e. that social aspects of corporate sustainability
show the strongest relation to good financial performance.
Whilst the other categories were insignificant, no dimension of the sustainability index indicates a
negative association with firm profitability. This is in accordance with the proposition that firm
profitability and sustainability are not mutually exclusive (Jones, 1995).

31
Table VII. Multivariate regression analysis –ROA & Stakeholder categories
Model 4a Model 4b Model 4c Model 4d CG 0.04 (1.55) ES 0.00 (0.91) CS 0.07*** (3.52) E 0.02 (0.88) FIRM SIZE 0.07*** 0.08*** 0.06*** 0.07*** (8.08) (9.83) (8.93) (9.23) DEBT RATIO -‐0.20*** -‐0.20*** -‐0.21*** -‐0.20*** (-‐6.71) (-‐6.80) (-‐6.97) (-‐6.79) Constant 0.46*** 0.44*** 0.46*** 0.45*** (17.09) (17.31) (18.24) (17.15) Year FIXED FIXED FIXED FIXED Industry FIXED FIXED FIXED FIXED N 1,015 1,015 1,015 1,015 F-‐stat. 19.86 19.57 21.05 19.67 Adj. R2 0.157 0.155 0.165 0.155
*p < 0.10; ** p < 0.05; *** p < 0.01 (2-‐tailed). (T-‐statistics in parentheses)
5.2.1. Robustness test and sensitivity analysis
To test the robustness and sensitivity of the results presented above, different variations of the
regression models were conducted. The results from these tests are presented below in Table VIII,
with the results from Model 3 (Table VI) presented again to facilitate referencing. Firstly, ROA is
replaced by the following year’s ROA (‘lagged’), to test the possible time delay between
sustainability activities and financial outcome. Secondly, the appropriateness of using ROA as our
financial performance measurement was tested by using both return on equity (ROE) and return
on sales (ROS) as the dependent variable respectively. Finally, a curvilinear regression was
conducted to test whether the assumption of linearity holds.
ROA lag
The results from using the following year’s ROA as the dependent variable are presented in Table
VIII, Model 3a and 3b. In likeness with Waddock & Graves (1997), in Model 3a, the ROA used
in the previous models (i.e. Model 1-3 and 4a-d) was replaced by the ‘lagged’ ROA9, i.e. the
following year’s ROA. In comparison with the present ROA (Model 3), which produced
significant results at (p<0.05), the lagged ROA also indicated significant results; however, with a
lower significance level, (p<0.10). Furthermore, the adjusted R-square (i.e. the explanatory 9 ROAit+1 = β0 + CSPitβ1 + Xit+1β2 + Ztβ3 + Iiβ4 + εit+1

32
power) for the lagged ROA-model is lower at 0.129 in comparison with the adjusted R-square for
the present ROA-model at 0.159.
However, it is possible that the lagged ROA is more dependent on the present year’s ROA than
CSP. Thus, in accordance with Barnett & Salomon (2012), the present ROA is added as an
independent variable in Model 3b10. As expected, the results indicate that the coefficient for
present ROA is the most influential determinant of lagged ROA (p<0.01), whilst the influence of
CSP is insignificant. This is further confirmed by that the adjusted R-square is considerably
improved to 0.573 compared to 0.159 (Model 3), that is, the inclusion of the present year’s ROA,
explains lagged ROA better than CSP.
Different performance measurements
Although ROA is frequently used in previous research aimed at investigating the relationship
between corporate sustainability performance and financial performance. Prior studies have also
used other measurements to capture various aspects of financial performance, for instance return
on equity (ROE) and return on sales (ROS). To further test our model, we replaced our financial
performance measurement, i.e. ROA, with ROE and ROS. As with ROA, winsorisation was used
to eliminate the impact of outliers, with a set limit of one percent in each tail before conducting
the regression analyses.
The results, which are presented in Table VIII (ROS in Model 3c and ROE in Model 3d), suggest
that there are no significant findings for our independent variable (CSP) when adding different
financial performance measurements other than ROA. However, despite insignificant results for
CSP, the adjusted R-square was slightly improved for ROE. These results are similar to previous
research, which has found stronger significance level for ROA than other measurements of
financial performance (e.g. Waddock & Graves, 1997). This has contributed to ROA being one of
the most used financial measurements to investigate the relationship between sustainability
performance and financial performance.
A potential reason for these mixed results might be that ROA is more static across firms with
different business operations and capital structure in comparison with ROS and ROE. For
instance, our sample constitutes of both industrial firms with larger capital base and service firms
with smaller capital base. Therefore, there is a large variance between firms when performance is
measured as profit in relation to their capital base. This could explain why ROE does not capture
a significant effect of CSP. For ROS, greater fluctuations in sales for certain companies (e.g.
10 ROAit+1 = β0 + CSPitβ1 + ROAitβ2+ Xit+1β3 + Ztβ4 + Iiβ5 + εit+1
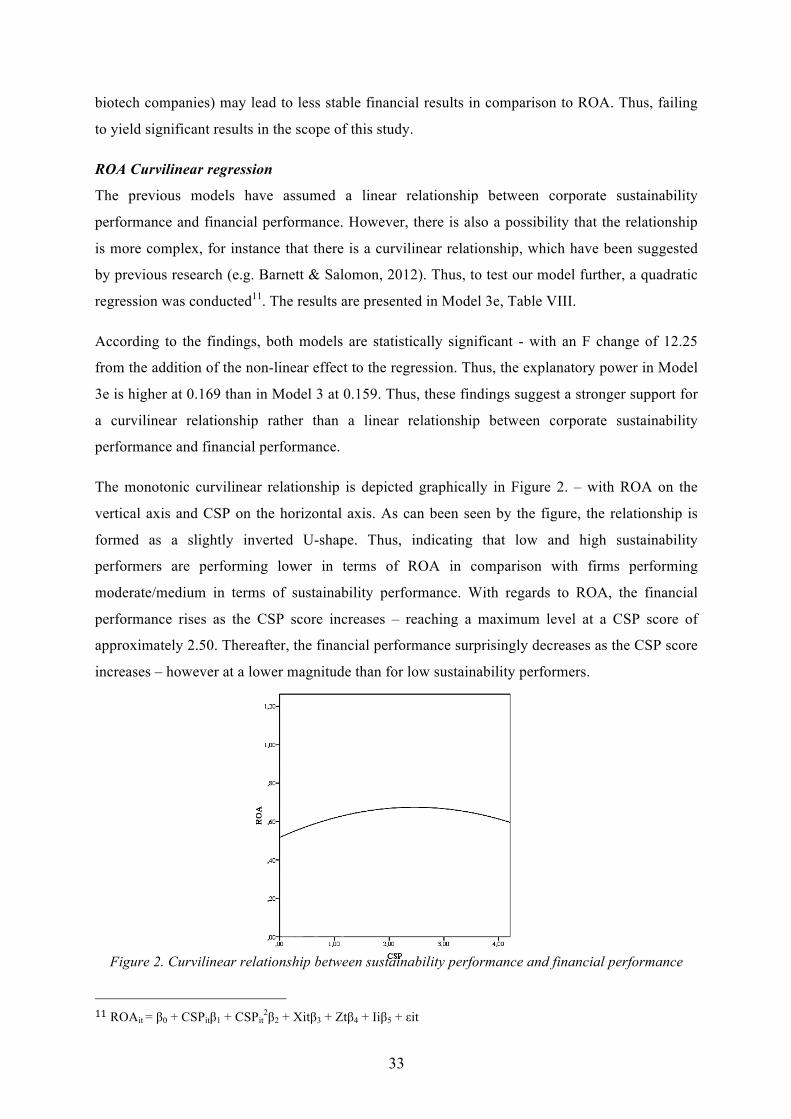
33
biotech companies) may lead to less stable financial results in comparison to ROA. Thus, failing
to yield significant results in the scope of this study.
ROA Curvilinear regression
The previous models have assumed a linear relationship between corporate sustainability
performance and financial performance. However, there is also a possibility that the relationship
is more complex, for instance that there is a curvilinear relationship, which have been suggested
by previous research (e.g. Barnett & Salomon, 2012). Thus, to test our model further, a quadratic
regression was conducted11. The results are presented in Model 3e, Table VIII.
According to the findings, both models are statistically significant - with an F change of 12.25
from the addition of the non-linear effect to the regression. Thus, the explanatory power in Model
3e is higher at 0.169 than in Model 3 at 0.159. Thus, these findings suggest a stronger support for
a curvilinear relationship rather than a linear relationship between corporate sustainability
performance and financial performance.
The monotonic curvilinear relationship is depicted graphically in Figure 2. – with ROA on the
vertical axis and CSP on the horizontal axis. As can been seen by the figure, the relationship is
formed as a slightly inverted U-shape. Thus, indicating that low and high sustainability
performers are performing lower in terms of ROA in comparison with firms performing
moderate/medium in terms of sustainability performance. With regards to ROA, the financial
performance rises as the CSP score increases – reaching a maximum level at a CSP score of
approximately 2.50. Thereafter, the financial performance surprisingly decreases as the CSP score
increases – however at a lower magnitude than for low sustainability performers.
Figure 2. Curvilinear relationship between sustainability performance and financial performance
11 ROAit = β0 + CSPitβ1 + CSPit
2β2 + Xitβ3 + Ztβ4 + Iiβ5 + εit

34
Thus, for remarkably high sustainability performers the quadratic regression indicates a slightly
negative relationship between sustainability performance and financial performance. Therefore,
this contradicts our first hypothesis, at least to a certain extent. More specifically, our hypothesis
is only supported by low to moderate sustainability performers, but rejected for remarkably high
sustainability performers. Thus, according to this additional analysis, the first hypothesis is
rejected.
Table VIII. Multivariate regression analysis – Robustness tests ROA & CSP
Model 3 Model 3a Lag I
Model 3b Lag II
Model 3c ROS
Model 3d ROE
Model 3e Curvilinear
ROA 0.66***
(26.38)
CSP 0.02** 0.02* 0.00 0.08 0.22 0.09***
(2.31) (1.78) (0.20) (1.24) (1.28) (4.12)
CSP2 -‐0.03*** (-‐3.50)
FIRM SIZE 0.06*** 0.06*** 0.03*** 0.47*** 0.89*** 0.06*** (7.24) (5.66) (4.58) (7.49) (5.17) (7.08)
DEBT RATIO -‐0.20*** -‐0.13*** -‐0.11*** -‐1.24*** -‐0.73 -‐0.21***
(-‐6.80) (-‐3.67) (-‐4.42) (-‐5.80) (-‐1.22) (-‐7.05) Constant 0.46*** 0.43*** 0.12*** 3.94*** 17.70*** 0.44***
(17.45) (14.31) (4.82) (20.72) (33.35) (16.01) Year FIXED FIXED FIXED FIXED FIXED FIXED
Industry FIXED FIXED FIXED FIXED FIXED FIXED N 1,015 1,015 1,015 1,015 1,015 1,015
F-‐stat. change 12.25 F-‐stat. 20.21 20.21 102.41 18.84 20.34 19.69
Adj. R2 0.159 0.129 0.573
0.150 0.161
0.169
Model 3 repeats data from Table VI to facilitate referencing. *p < 0.10; ** p < 0.05; *** p < 0.01 (2-‐tailed). (T-‐statistics in parentheses)

35
5.3. Board diversity
Our second hypothesis predicts that board diversity enhances the relationship between
sustainability performance and financial performance, that is, a more diverse board of directors
has a positive influence on the relationship as opposed to a more homogeneous board. Table IX,
presents the regression results for the second hypothesis. Models 6-9 show the results with linear
multivariate regressions whereas Models 6a-9a present the results for the non-linear regressions
This will enable an assessment of whether the addition of the board diversity components affect
the linear and curvilinear relationship, in accordance with the findings from the previous analyses
including the robustness test. More specifically, there is a possibility that increased board
diversity will buffer the negative relationship for high sustainability performers which is depicted
in Figure 2.
As shown in Table IX, the findings in Model 6 indicate that the aggregated board diversity (DIV)
does not significantly differ from more homogenous boards in terms of the influence on the
relationship between sustainability performance and financial performance. Similarly, the separate
diversity measurements, gender diversity (GENDER) and age diversity (AGE), do not show any
significant results (Model 7-8). This indicates that gender or age diverse boards do not moderate a
stronger relationship between sustainability and profitability.
Model 9, however, shows a significant positive influence at 0.07 (p<0.10) for the impact of
educational diversity on the relationship between sustainability and financial performance. This
supports the findings by Harjoto et al. (2014), who argue that expertise diversity among directors
of the board is one of the driving forces of the level of corporate sustainability. It is also in
accordance with Kim and Lim (2010) who find that directors’ educational background influences
financial performance.
Models 6a-9a show the results from the addition of the curvilinear regressions. These follow the
results from the linear multivariate regressions, that is, there is only a slightly significant positive
impact of educational diversity on the relationship (Model 9a). With educational diversity, the
addition of the curvilinear regression had an F change of 9.65 and an adjusted R-square of 0.166.
Thus, showing a improved explanatory power for the curvilinear model as opposed to the linear
model (Model 9), which had an adjusted R-square of 0.158.

36
Table IX. – Multivariate regression analysis – Board diversity12 Model 6 Model 7 Model 8 Model 9 Model
6a Model 7a
Model 8a
Model 9a
CSP 0.02** 0.02** 0.03*** 0.03*** 0.10*** 0.10*** 0.09*** 0.09*** (2.47) (2.31) (2.72) (2.80) (4.04) (4.02) (3.91) (3.96) CSP2 -‐0.03*** -‐0.03*** -‐0.02*** -‐0.02*** (-‐3.33) (-‐3.38) (-‐3.08) (-‐3.11) Interaction term 0.02 0.01 -‐0.06 0.07* 0.03 0.04 -‐0.05 0.07* (0.71) (0.35) (-‐1.19) (1.94) (1.43) (1.18) (-‐1.10) (1.91) DIV 0.01 0.13 (0.66) (0.65) GENDER 0.02* 0.03** (1.79) (2.06) AGE -‐0.01 -‐0.10 (-‐0.39) (-‐0.47) EDUCATION 0.13 0.01 (0.83) (0.62) FIRM SIZE 0.07*** 0.07*** 0.08*** 0.07*** 0.07*** 0.07*** 0.07*** 0.07*** (6.45) (6.30) (6.39) (6.28) (6.28) (6.18) (6.20) (3.96) DEBT RATIO -‐0.21*** -‐0.21*** -‐0,21*** -‐0.21*** -‐0.21*** -‐0.22*** -‐0.22*** -‐0.21*** (-‐6.52) (-‐6.51) (-‐6.57) (-‐6.48) (-‐6.77) (-‐6.80) (-‐6.79) (-‐6.75) BOARD SIZE -‐0.01 -‐0.01 -‐0.01 -‐0.01 -‐0.01 0.00 -‐0.01 -‐0.01 (-‐1.44) -‐1.03 (-‐1.21) (-‐1.53) (-‐1.13) (-‐0.62) (-‐0.91) (-‐1.25) Constant 0.48*** 0.46*** 0.47*** 0.46*** 0.42*** 0.49*** 0.44*** 0.43*** (13.81) (13.51) (13.15) (13.04) (11.83) (13.19) (12.18) (11.89) Year FIXED FIXED FIXED FIXED FIXED FIXED FIXED FIXED Industry FIXED FIXED FIXED FIXED FIXED FIXED FIXED FIXED N 927 927 927 927 927 927 927 927 F-‐stat change -‐ -‐ -‐ -‐ 11.10 11.42 9.50 9.65 F-‐stat 14.02 14.25 14.09 14.33 13.95 14.20 13.88 14.12 Adj. R2
0.155 0.157 0.155 0.158 0.164 0.167 0.163 0.166
*p < 0.10; ** p < 0.05; *** p < 0.01 (2-‐tailed). (T-‐statistics in parentheses)
However, to be able to facilitate interpretation, the results of the curvilinear regression are
presented graphically below in Figure 3., with financial performance on the vertical axis and
corporate sustainability performance on the horizontal axis. As shown by the figure, the effect of a
more heterogeneous board (i.e. the green line), in similarity with the findings of hypothesis 1, has
a maximum ROA at the CSP level of approximately 2.50. ROA thereafter decreases for high
sustainability performers as the CSP score increases, but at a lower magnitude than for low
sustainability performers. A more homogenous board (i.e. the blue line), on the other hand has a
maximum ROA at a CSP level of approximately 1.30, however with a weaker curvilinear
relationship. Thus, the inclusion of the educational diversity component did not improve the
relationship, but it did not distort it either.
12 A significant interaction term indicates a positive impact on the CSP-ROA relationship.
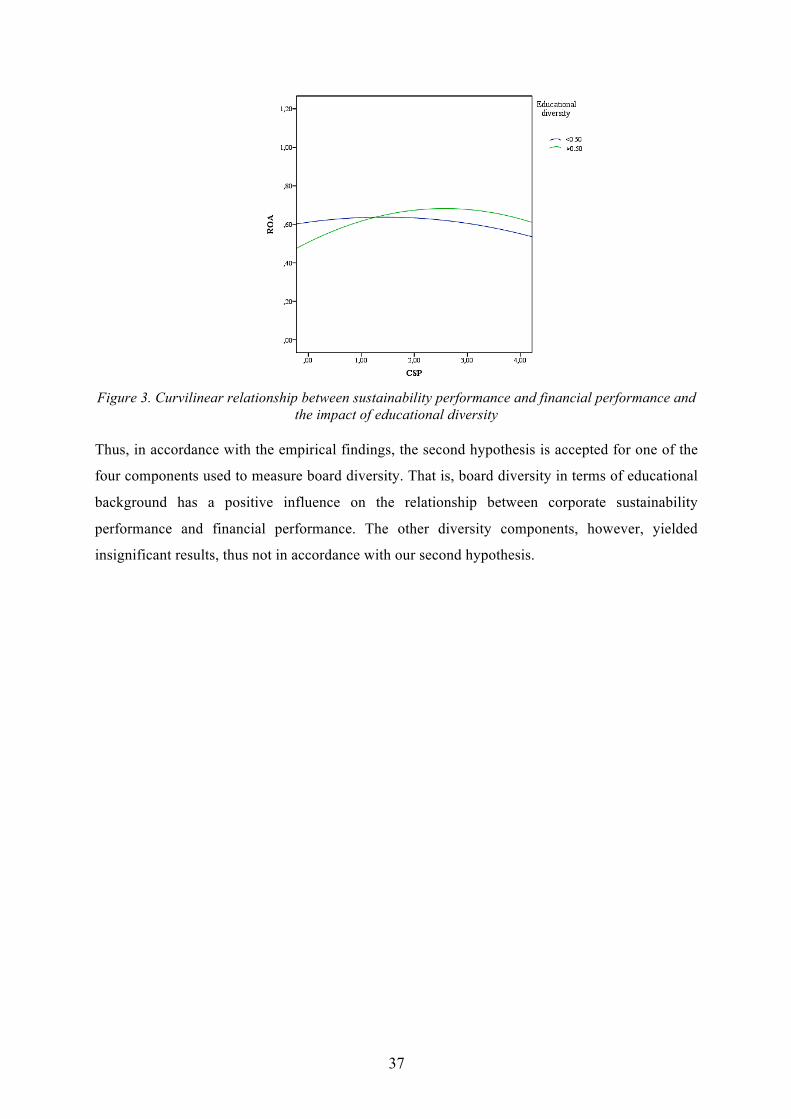
37
Figure 3. Curvilinear relationship between sustainability performance and financial performance and
the impact of educational diversity Thus, in accordance with the empirical findings, the second hypothesis is accepted for one of the
four components used to measure board diversity. That is, board diversity in terms of educational
background has a positive influence on the relationship between corporate sustainability
performance and financial performance. The other diversity components, however, yielded
insignificant results, thus not in accordance with our second hypothesis.

38
6. DISCUSSION
In the following chapter the findings from the previous chapter will be discussed and reflected upon with support from theoretical and previous empirical research. The chapter ends with the conclusions from the study as well as contributions, limitations, and avenues for future research.
6.1. Hypothesis 1: Ceteris paribus, there is a positive relationship between sustainability performance and financial performance
The question whether it pays to be good or if an increased focus on corporate sustainability
practices result in financial disadvantages has been heavily debated. However, there is still no
clear consensus whether there is a positive or negative relationship between corporate
sustainability performance and financial performance. Nevertheless - despite inconclusive results
- most empirical studies have reached a positive relationship when investigating the association
between the two components; for instance Waddock and Graves (1997), Hillman and Keim
(2001), Orlitzky et al. (2003), and Al-Tuwaijri et al. (2004). These previous empirical findings,
thus, support our first results in the linear univariate and multivariate regression analyses, which
all indicate a significant positive relationship between corporate sustainability performance and
financial performance.
Moreover, our positive significant findings in these models are consistent with instrumental
stakeholder theory, which states that if a corporation handles its stakeholder relationships
effectively it can benefit financially (Donaldson & Preston, 1995). Furthermore, the positive
significant results supports the arguments by Jones (1995), who argues that corporate
sustainability performance and financial performance are not mutually exclusive, but
sustainability practices can lead to competitive advantages due to minimised agency and
transaction costs. That is, rather than distorting financial performance and shareholder value - as
believed by advocators of a negative relationship (e.g. Friedman, 1979) - a focus on sustainability
practices may actually be beneficial from a financial point of view.
The assessment of each separate stakeholder group, i.e. Corporate Governance, Employees &
Suppliers, Customer & Society, and Environment, shed a light of what may be the driving force
behind the positive relationship between sustainability and financial performance. However,
according to the results, Customer & Society was the only significant factor, thus indicating that a
focus on product or service quality, safety and community (e.g. charitable donations) are essential
strategy tools for stakeholder management. By engaging in salient sustainability activities (e.g.
community involvement) the firm might improve its reputation and thereby, as proposed by
Cornell and Shapiro (1987) improve profitability. This is in accordance with considering

39
stakeholder management as a way to create a competitive advantage for the company (Barnett &
Salomon, 2006). These findings are also similar to the results by Orlitzky et al. (2003), who found
that ‘social’ performance indicators are more associated with improved financial performance
than environmental performance indicators.
However, all these findings – in accordance with the first hypothesis – assume a linear
relationship between corporate social responsibility and financial performance. When further
testing the model, we found that the explanatory power of the model increased when a curvilinear
(i.e. quadratic) regression was added to the analysis. The findings from the quadratic regression
suggested a more complex relationship than depicted by the previous analyses. Instead of a
complete linear relationship, the results indicated a slightly inverted U-shaped relationship
between corporate sustainability performance and financial performance. Thus, instead of a
complete positive relationship, there are indications that the positive relationship is only true for
low and moderate sustainability performers and not for high sustainability performers. Thus, the
case of the inverted U-shaped relationship between sustainability performance and financial
performance asserts that there may be a suboptimal level of sustainability that diminishes
shareholder wealth to a certain extent.
The findings that certain firms perform better than others are similar to Barnett and Salomon
(2012), who found an U-shaped relationship between the two components. The authors explained
these findings with the notion that some firms are better at capitalizing on the efforts aimed at
corporate social responsibility than others. This may also be the case with our findings. However,
contrary to the results discovered by Barnett and Salomon (2012), we found that medium firms
performed highest in regards of ROA as opposed to the lowest. Furthermore, our results
surprisingly indicate that there is a negative - although slight - relationship between the two
components for high corporate sustainability achievers. Thus, the results from high sustainability
performers thus reject our first hypothesis. Instead indicating support for a negative relationship
as advocated by for instance Friedman (1970) for certain firms. More specifically, it may be that
the effect of sustainability activities (i.e. stakeholder management) on financial performance may
decline after a certain level of achievement is reached.
However, a possible explanation for the negative relationship for high sustainability performers
might be the time horizon used in this study. When investigating high and low sustainability
performers, Brammer and Millington (2008) found that poor sustainability performers achieved
better financial results in the short term whilst high sustainability performers attained better
financial results in the long-term. Thus, it can be speculated whether a longer time horizon would
have yielded similar results as the study performed by Brammer and Millington.
40
In conclusion, according to the results from the linear multivariate regression analyses the first
hypothesis is accepted, i.e. there is a positive relationship between corporate sustainability
performance and financial performance. However, the robustness test indicated that the
relationship is more complex than originally expected, i.e. rather than a linear relationship there is
a curvilinear relationship between the two components. More specifically, there is a positive
relationship for low and moderate sustainability performance, yet, a slightly negative relationship
for remarkably high sustainability performances.
6.2. Hypothesis 2: Ceteris paribus, board diversity components have a positive impact on the relationship between corporate sustainability performance and financial performance.
In accordance with the reasoning by Letza et al. (2004), it is not sufficient to view the function of
the board as merely a monitoring mechanism (Jensen & Meckling, 1976). Instead, as proposed by
Pfeffer (1972) and Westphal and Fredrickson (2001), the directors of the board have important
implications for firm management and performance through the unique set of capabilities each
director brings to the board. As a more diverse board increases the variation of these capabilities
and priorities, the ability of responding to various stakeholder needs increases, thus potentially
leading to a more effective stakeholder management (Harjoto et al., 2014). In turn, instrumental
stakeholder theory proposes that a more effective stakeholder management leads to improved
financial profitability (Donaldson & Preston, 1995). A more diverse board may therefore facilitate
the relationship between corporate sustainability and financial performance.
However, out of the four board diversity components, only one showed significant impact on the
relationship between the two components. More specifically, our results suggest that only a more
diverse board in regards of director educational background has a positive impact on the
relationship. These findings are supported by previous research. For instance, diversity in terms of
expertise/educational background has been found to be one of the driving factors of corporate
sustainability (Harjoto et al. 2014) as well positively affecting financial performance (Kim & Lim,
2010). A more diverse board in terms of educational background enhances the knowledge base of
the board, thus facilitating the possibility of responding to the - at times - conflicting interests of
stakeholders. This is, however, somewhat contradictory to the findings by Rose (2007), who
concluded that educational diversity does not impact board work in any greater extent. Instead the
author argues that it is sufficient that the directors have higher educational degrees to successfully
perform their duties as directors of the board.
41
The other diversity measurements, however, did not yield any significant results. This implies that
overall diversity (i.e. the aggregated measurement), gender diversity, and age diversity among the
board of directors do not significantly influence the relationship between corporate sustainability
and financial performance. We therefore fail to find results in likeness with Bear et al. (2010) and
Erhardt et al. (2003), who conclude that gender diversity positively influence corporate
sustainability performance and financial performance respectively. The findings instead follow
the results of Rose (2007). That is, significant findings of the influence of gender diversity on firm
financial performance could not be confirmed. Furthermore, the significant positive findings of
the impact of age diversity by Kim and Lim (2010) on financial performance could not be
repeated. Instead, the insignificant findings of age diversity by Harjoto et al. (2014) are echoed.
The reason for these insignificant findings may be that increased board diversity has a negative
effect on board effectiveness.
According to Harjoto et al. (2014), too much diversity may impede the board’s ability of handling
various stakeholder interests. More explicitly, differences in perspectives and priorities might lead
to prolonged decision making processes, thus stagnating the potential impact on the relationship
between sustainability and financial performance. However, although several diversity
components did not yield significant results when the impact of board diversity was investigated
on the relationship between sustainability and financial performance. The diversity measurements
may have significant influence when each diversity dimension is tested on each performance
component separately. This is however beyond the scope of the thesis.
In summary, our results indicate that only high levels of educational diversity among the board of
directors positively influence the corporate sustainability and financial performance relationship.
Thus, our second hypothesis is confirmed for one of the four diversity components.
6.3. Conclusions
The aim of this study was to analyse and clarify the relationship between corporate sustainability
performance and financial performance in a new contextual setting, i.e. amongst Swedish firms.
That is, investigating the relationship in circumstances with different cultural traditions and
regulatory environment than has been previously covered in prior research. Furthermore, the
thesis contributes to the existing literature of corporate sustainability by creating a new
sustainability index as well as investigating the impact of board composition on the relationship
between sustainability performance and financial performance.

42
According to the first hypothesis, a positive relationship between corporate sustainability
performance and financial performance was predicted. Our findings confirm this hypothesis when
assuming a linear relationship. However, further tests indicated that the relationship is more
complex than originally hypothesised, i.e. there is only a positive relationship for low and
moderate sustainability performance and a slightly negative relationship for remarkably high
sustainability performances. Thus, according to the additional tests, the first hypothesis is
rejected.
The second hypothesis predicted a positive influence of board diversity on the relationship
between corporate sustainability and financial performance. Our findings suggest that educational
diversity among the board members enhances the relationship. Thus, the second hypothesis is
accepted for one of the four diversity components.
Although this thesis contributes in several aspects as mentioned above, there are also certain
limitations in need of reflection. Firstly, as with any study of disclosures, there is always a
potential risk of biased results due to subjective interpretations. These potential drawbacks, were
however, continuously considered during both the index construction and the data collection - for
instance by the use of a binary coding system and continuous dialogue between the authors during
the data collection. We acknowledge, however that despite our efforts, the problem might not be
entirely mitigated. Secondly, the assessment of corporate sustainability is complex. The index
used in this study might not capture all aspects of sustainability activities that companies can
engage in. Although stakeholder groups and indicators were carefully selected as the most
influential for firm performance, future research could be directed at developing the index of
sustainability performance even further and include more ‘fine tuned’ aspects of sustainability.
Furthermore, although some previous studies have used shorter time frames, the five-year-period
used in this thesis may be considered relatively limited. Therefore, long-term effects from
sustainability firm activities, may not be captured by the models used to test our hypotheses. By
investigating various time frames, these effects may be captured – especially regarding potential
time lags of the relationship. For instance, it can be speculated whether there is a need for a
greater time lag between corporate sustainability activities and financial performance to properly
capture the long-term effects of sustainability activities, for instance a ten-year lag. However,
there are limited sustainability data available, thus making long-term studies more difficult – at
least for SMEs. However, as shown previously, the amount of sustainability disclosure
continuously increases, which may be a result of increased stakeholder demands, for instance
stricter regulations on non-financial disclosure reporting. Thus, providing areas for further
research on the relationship between corporate sustainability performance and financial

43
performance, especially in a Swedish or Scandinavian setting – a setting in which studies are
currently lacking. The literature on corporate sustainability would gain from studies beyond the
Anglo-Saxon contexts, which at present dominate the research area.
Moreover, this thesis uses firm size (measured in total assets) and debt ratio as control variables as
well as tests for year and industry fixed effects. As the explanatory power of the model is
relatively low, it is possible that there are other variables that influence the relationship further.
We therefore suggest that future research focus on including more control variables to further test
the complex relationship. As innovation is usually associated with the creation of corporate
sustainability activities, for instance research in developing renewable energy sources. The level
of innovation, measured in research and development (R&D) expenditures may be included as a
control variable. Furthermore, advertising costs may also affect the relationship, as it takes into
consideration the visibility of the firm towards stakeholders.
Concerning the second hypothesis, another area for future research is to use other measurements
of board diversity. It is possible that other dimensions of board composition, than those covered in
this thesis, can impact the relationship between corporate sustainability and financial
performance. For instance, previous occupation (i.e. experience), tenure or ethnicity of the
director might be able to explain differences among directors’ capability of handling stakeholder
interests. Furthermore, the implications of having a sustainability committee on the board may be
added to the analyses, as this may influence both the focus on these activities as well as the
effectiveness of the monitoring thereof. Lastly, the ownership structure of the firm might
influence how the firm considers and values sustainability issues. For instance, the focus on short-
term and long-term performance may differ depending how the ownership is structured. Thus,
providing even further interesting avenues for future research.
In conclusion, does it pay to be good? Or, does an increased focus on corporate sustainability
practices results in financial disadvantages? As depicted by our results, this question may not have
a simple answer. Instead, it may be that some firms perform better in regards of corporate
sustainability than others. Thus, the question should not be whether the relationship is positive or
negative, but rather during what circumstances the relationship is one way or another.

44
REFERENCES
Adams, R.B. & Ferreira, D. 2009. “Women in the boardroom and their impact on governance and
performance”, Journal of Financial Economics, vol. 94, no. 2, pp. 291-309.
Aiken, L.S. & West, S.G. 1991. Multiple Regression: Testing and Interpreting Interactions.
Newbury Park: Sage Publications.
Ameer, R. & Othman, R. 2012. “Sustainability practices and corporate financial performance: A
study based on the top global corporations”, Journal of Business Ethics, vol. 108, no. 1, pp. 61-
79.
Allouche, J. & Laroche, P. 2005. “A meta-analytical investigation of the relationship between
corporate social and financial performance”, Revue de Gestion des Ressources Humaines, vol.
57, pp. 18-41.
Al-Tuwaijri, S.A., Christensen, T.E., & Hughes II, K.H. 2004. “The relations among
environmental disclosure, environmental performance, and economic performance: A
simultaneous equations approach”, Accounting, Organizations and Society, vol. 29, no. 25, pp.
447-471.
Ayuso, S., Rodríguez, M.A., García-Castro, R. & Ariño, M.A. 2014. “Maximizing stakeholders'
interests: An empirical analysis of the stakeholder approach to corporate governance”, Business
and Society, vol. 53, no. 3, pp. 414-439.
Bansal, P. 2005. “Evolving sustainably: A longitudinal study of corporate sustainable
development”, Strategic Management Journal, vol. 26, no. 3, pp. 197-218.
Bansal, P. & DesJardine, M. R. 2014. “Business sustainability: It is about time”, Strategic
Organization, vol. 12, no. 1, pp. 70-78.
Barnett, M.L. & Salomon, R.M. 2006. “Beyond dichotomy: The curvilinear relationship between
social responsibility and financial performance”, Strategic Management Journal, vol. 27, no. 11,
pp. 1101-1122.
Barnett, M.L. & Salomon, R.M. 2012. “Does it pay to be really good?: Addressing the shape of
the relationship between social and financial performance”, Strategic Management Journal, vol.
33, no. 11, pp. 1304-1320.
Baumgartner, R.J. & Ebner, D. 2010. “Corporate sustainability strategies: Sustainability profiles
and maturity levels”, Sustainable Development, vol. 18, pp. 76-89.
Bear, S., Rahman, N. & Post, C. 2010. “The impact of board diversity and gender composition on
corporate social responsibility and firm reputation”, Journal of Business Ethics, vol. 97, no. 2,
pp. 207-221.
45
Benson, B.W., Davidson, W.N., Wang, H. & Worrell, D.L. 2011. “Deviations from expected
stakeholder management, firm value, and corporate governance”, Financial Management, vol.
40, no. 1, pp. 39-81.
Berthon, B, Abood, D.J. & Lacy, P. 2010. Can business do well by doing good? Outlook, no. 3.
Retrieved December 7, 2014, from
http://www.accenture.com/SiteCollectionDocuments/PDF/Accenture_Outlook_Can_Business_
Do_Well_by_Doing_Good_Sustainability.pdf
van Beurden, P. & Gössling, T. 2008. “The worth of values: A literature review on the relation
between corporate social and financial performance”, Journal of Business Ethics, vol. 82, no. 2,
pp. 407-424.
Blau, P.M. 1977. Inequality and Heterogeneity: A Primitive Theory of Social Structure. New
York: The Free Press.
Brammer, S., Brooks, C., & Pavelin, S. 2006. “Corporate social performance and stock returns:
UK evidence from disaggregate measures”, Financial Management, vol. 35, no. 3, pp. 997-116.
Brammer, S. & Millington, A. 2008. “Does it pay to be different: An analysis of the relationship
between corporate social and financial performance”, Strategic Management Journal, vol. 7, no.
29, pp. 1325-1343.
Brooks, C. 2002. Introductory Econometrics for Finance. New York: Cambridge University
Press.
Callan, S.J. & Thomas, J.M. 2009. “Corporate financial performance and corporate social
performance: An update and reinvestigation”, Corporate Social Responsibility and
Environmental Management, vol. 16, no. 2, pp. 61-78.
Chatterji. A. & Levine, D. 2006. “Breaking down the wall of codes: Evaluating non-financial
performance measurement”, California Management Review, vol. 48, no. 2, pp. 29-51.
Clarkson, M.B.E. 1995. “A stakeholder framework for analyzing and evaluating corporate social
performance”, The Academy of Management Review, vol. 20, no. 1, pp. 92-117.
Clarkson, P.M., Li, Y., Richardson, G.D. & Vasvari, F.P. 2008. “Revisiting the relation between
environmental performance and environmental disclosure: An empirical analysis”, Accounting,
Organizations and Society, vol. 33, no. ⅘, pp. 303-327.
Cochran, P.L. & Wood, R.A. 1984. “Corporate social responsibility and financial performance”,
The Academy of Management Journal, vol. 27, no. 1, pp. 42-56.
Cornell, B. & Alan C. Shapiro, A.C. 1987. “Corporate stakeholders and corporate finance”,
Financial Management, vol. 16, no. 1, pp. 5-14.
Donaldson, T. & Preston, L.E. 1995. “The stakeholder theory of the corporation: Concepts,
evidence, and implications”, The Academy of Management Review, vol. 20, no. 1, pp. 65-91.
46
Elkington, J. 1998. Cannibals with Forks: The Triple Bottom Line of 21st Century Business.
Stony Creek: New Society Publishers.
Erhardt, N. L., Werbel, J. D., & Shrader, C. B. 2003. “Board director diversity and firm financial
performance”, Corporate Governance: An International Review, vol. 11, no. 2, pp. 102-111.
European Commission. 2014. Non-financial reporting. Retrieved February 4, 2015, from
http://ec.europa.eu/finance/accounting/non-financial_reporting/index_en.htm
Fischer, T.M. & Sawczyn, A.A. 2013. “The relationship between corporate social performance
and corporate financial performance and the role of innovation: Evidence from German listed
firms”, Journal of Management Control, vol. 24, no. 1, pp. 27-52.
Fombrun, C.J., Gardberg, N.A. & Barnett, M.L. 2000. “Opportunity platforms and safety nets:
Corporate citizenship and reputational risk”, Business and Society Review, vol. 105, no. 1, pp.
85-106.
Freeman, R. E. 1984. Strategic Management: A Stakeholder Approach. Boston: Pitman.
Friedman, M. 1970. “The social responsibility of business is to increase its profits”, New York
Times Magazine, September 13, pp. 122-126.
Gjølberg, M. 2009. “Measuring the Immeasurable? Constructing an index of CSR practices and
CSR performance in 20 countries”, Scandinavian Journal of Management, vol. 25, no. 1, pp.
10-22.
Greene, W. H. 2012. Econometric Analysis. Harlow: Pearson Education Limited.
Griffin JJ. & Mahon JF. 1997. “The corporate social performance and corporate financial
performance debate: Twenty-five years of incomparable research”, Business and Society, vol.,
36, no. 1, pp. 5-31.
Harjoto, M., Laksmana, I. & Lee, R. 2014. “Board diversity and corporate social responsibility”,
Journal of Business Ethics, vol. 8, pp. 1-20.
Hart, S.L., Milstein, M.B., & Caggiano, J. 2003. “Creating sustainable value”, The Academy of
Management Executive (1993-2005), vol. 17, no. 2, pp. 56-69.
Herbohn, K., Walker, J. & Loo, H.Y.M. 2014. “Corporate social responsibility: The link between
sustainability disclosure and sustainability performance”, Abacus, vol. 50, no. 4, pp. 422-459.
Hill, C. W. L. & Jones, T. M. 1992. “Stakeholder-agency theory”, Journal of Management
Studies, vol. 29, no. 2, pp. 131-154.
Hillman, A.J. & Keim, G.D. 2001. “Shareholder value, stakeholder management, and social
issues: What's the bottom line?”, Strategic Management Journal, vol. 22, no. 2, pp. 125-139.
Hillman, A.J. & Keim, G.D. 2003. “Boards of directors and firm performance: Integrating agency
and resource dependence perspectives”, The Academy of Management Review, vol. 28, no. 3,
pp. 383-396.

47
Hillman, A.J., Cannella, A.A. & Harris, I.C. 2002. “Women and racial minorities in the
boardroom: how do directors differ?”, Journal of Management, vol. 28, no. 6, pp. 747-763.
Jensen, M.C. 2001. “Value maximization, stakeholder theory, and the corporate objective
function”, Journal of Applied Corporate Finance, vol. 14, no. 3, pp. 8-21.
Jensen, M.C. & Meckling, W. H. 1976. “Theory of the firm: Managerial behavior, agency costs
and ownership structure”, Journal of Financial Economics, vol. 3, no. 4, pp. 305-360.
Johnson, R.A. & Greening, D.W. 1999. “The effects of corporate governance and institutional
ownership types on corporate social performance”, The Academy of Management Journal, vol.
42, no. 5, pp. 564-576.
Johnson, S.G., Schnatterly, K. & Hill, A.D. 2013. “Board composition beyond independence:
Social capital, human capital, and demographics”, Journal of Management, vol. 39, no. 1, pp.
232-262.
Jones, T.M. 1995. “Instrumental stakeholder theory: A synthesis of ethics and economics”, The
Academy of Management Review, vol. 20, no. 2, pp. 404-437.
Kabongo, J.D., Chang, K. & Li, Y. 2013. “The impact of operational diversity on corporate
philanthropy: An empirical study of U.S. companies”, Journal of Business Ethics, vol. 116, no.
1, pp. 49-65.
Kassinis, G. & Vafeas, N. 2002. “Corporate boards and outside stakeholders as determinants of
environmental litigation”, Strategic Management Journal, vol. 23, no. 5, pp. 399-415.
Kim, H. & Lim, C. 2010. “Diversity, outside directors and firm valuation: Korean evidence”,
Journal of Business Research, vol. 63, no. 3, pp. 284-291.
KPMG. 2013. The KPMG Survey of corporate responsibility reporting 2013. Retrieved February
8, 2015, from
http://www.kpmg.com/Global/en/IssuesAndInsights/ArticlesPublications/corporate-
responsibility/Documents/corporate-responsibility-reporting-survey-2013-v2.pdf
Laplume, A.O., Sonpar, K., & Litz, R.A. 2008. “Stakeholder theory: Reviewing a theory that
moves us”, Journal of Management, vol. 34, no. 6, pp. 1152-1189.
Laverty, K.J. 1996. “Economic ‘short-termism’: The debate, the unresolved issues, and the
implications for management practice and research”, The Academy of Management Review, vol.
21, no. 3, pp. 825-860.
Leone, A. J., Minutti-Meza, M & Wasley, C.E. 2014. “Influential observations and inference in
accounting research. Simon Business School Working Paper No. FR 14-06.
Letza, S., Sun, X. & Kirkbride, J. 2004. “Shareholding versus stakeholding: A critical review of
corporate governance”, Corporate Governance: An International Review, vol. 12, no. 3, pp. 242-
262.

48
Lev, B, Petrovits, C. & Radhakrishnan, S. 2010. “Is doing good good for you? How corporate
charitable contributions enhance revenue growth”, Strategic Management Journal, vol. 31, no.
2, pp. 182-200.
Lopez, V. M., Garcia, A., & Rodriguez, L. 2007. “Sustainable development and corporate
performance: A study based on the Dow Jones Sustainability Index”, Journal of Business
Ethics, vol. 75, no. 3, pp. 285-300.
Ludema, J.D, Laszlo, C. & Lynch, D.L. 2012. “Embedding sustainability: How the field of
organization development and change can help companies harness the next big competitive
advantage”, Research in Organizational Change and Development, vol. 20, pp. 265-299.
Makni, R., Francoeur, C. & Bellavance, F. 2009. “Causality between corporate social
performance and financial performance: evidence from Canadian firms”, Journal of Business
Ethics, vol. 89, no. 3, pp. 409-422.
Margolis, J.D. & Walsh, J.P. 2003. “Misery loves companies: rethinking social initiatives by
business”, Administrative Science Quarterly, vol. 48, no. 2, pp. 268-305.
Margolis, J.D. & Walsh, J.P. 2007. “Does it pay to be good? A meta-analysis and redirection of
research on the relationship between corporate social and financial performance”, Working
paper.
Mattingly, J.E. & Berman, S.L. 2006. “Measurement of corporate social action discovering
taxonomy in the Kinder Lydenberg Domini ratings data”, Business & Society, vol. 45, no. 1, pp.
20-46.
McWilliams A, Siegel D. 1997. “The role of money managers in assessing corporate social
responsibility research”, Journal of Investing, vol. 6, no. 4, pp. 98-107.
McWilliams, A. & Siegel, D. 2001. “Corporate social responsibility: A theory of the firm
perspective”, The Academy of Management Review, vol. 26, no. 1, pp. 117-127.
Montiel, I. & Delgado-Ceballos, J. 2014. “Defining and measuring corporate sustainability: Are
we there yet?”, Organization & Environment, vol. 27, no. 2, pp. 113-139.
Nelling, E., & Webb, E. 2009. “Corporate social responsibility and financial performance: The
“virtuous circle” revisited”, Review of Quantitative Finance and Accounting, vol. 32, no. 2,
pp. 197-209.
Nielsen, S., & Huse, M. 2010. “The contribution of women on boards of directors: Going beyond
the surface”, Corporate Governance: An International Review, vol. 18, no. 2, pp. 136-148.
Nunnally, J. C. 1978. Psychometric Theory. New York: McGraw-Hill.
O’Brien, R.M. 2007. “A caution regarding rules of thumb for variance inflation factors”, Quality
& Quantity, vol. 41, no. 5, pp. 673-690.

49
Orlitzky, M., Schmidt, F.L & Rynes S.L. 2003. “Corporate social and financial performance: A
meta-analysis”, Organization Studies, vol. 24, no. 3, pp. 403-441.
Pfeffer, J. 1972. “Size and composition of corporate boards of directors: The organization and its
environment”, Administrative Science Quarterly, vol. 17, no. 2, pp. 218-228.
Porter, M. & van der Linde, C. 1995. “Green and competitive”, Harvard Business Review, vol.
73, no. 5, pp. 121-134.
Porter, M.E. & Kramer, M.K. 2006. “Strategy & society: The link between competitive advantage
and corporate social responsibility”, Harvard Business Review, vol. 12, pp. 78-92.
Preston, L.E. & O’Bannon D.P. 1997. “The corporate social-financial performance relationship: A
typology and analysis”, Business and Society, vol. 36, no. 4, pp. 419-429.
van der Ploeg, L. & Vanclay, F. 2013. “Credible claim or corporate spin?: A checklist to evaluate
corporate sustainability reports”, Journal of Environmental Assessment Policy and
Management, vol. 15, no. 3, pp. 1-21.
Reich, R. 2008. “The case against corporate social responsibility”, Goldman School of Public
Policy Working Paper No.GSPP08-003.
Ribando, J. & Bonne, G. 2010. A new quality factor: Finding alpha with ASSET4 ESG data.
Retrieved February 5, 2015,
http://thomsonreuters.com/products/financial-risk/content/07_008/starmine-quant-research-
note-on-asset4-data.pdf.
Rose, C. 2007. “Does female board representation influence firm performance? The Danish
evidence”, Corporate Governance: An International Review, vol. 15, no. 2, pp. 404-413.
Rowley, T. & Berman, S. 2000. “A brand new brand of corporate social performance”, Business
and Society, vol. 39, no. 4, pp. 397-418.
Salzmann, O., Ionescu-Somers, A., & Steger, U. 2005. “The business case for corporate
sustainability”, European Management Journal, vol. 23, no. 1, pp. 27-36.
Saunders, M., Lewis, P. & Thornhill, A. 2012. Research Methods for Business Students. 6th edn.,
Harlow: Pearson Education Limited.
Scholtens, B. 2008. “A note on the interaction between corporate social responsibility and
financial performance”, Ecological Economics, vol. 68, no. 1/2, pp. 46-55.
Singh, R.K., Murty, H.R., Gupta, S.K. & Dikshit, A.K. 2009, “An overview of sustainability
assessment methodologies”, Ecological Indicators, vol. 9, no. 2, pp. 189-212.
Soana, M. 2011. “The relationship between corporate social performance and corporate financial
performance in the banking sector”, Journal of Business Ethics, vol. 104, no. 1, pp. 133-148.
Surroca, J, Tribó, J, & Waddock, S. 2010. “Corporate responsibility and financial performance:
The role of intangible resources”, Strategic Management Journal, vol. 31, no. 5, pp. 463-490.
50
Stine, R.A. 1995. “Graphical interpretation of variance inflation factors”, The American
Statistician, vol. 49, no. 1, pp. 53-56.
Thomson Reuters ASSET4, 2015. “Environmental, Social & Governance (ESG) Data”. Retrieved
February 5, 2015, from http://extranet.datastream.com/data/ASSET4%20ESG/Index.htm
Trumpp, C., Endrikat, J., Zopf, C. & Guenther, E. 2015. “Definition, conceptualization, and
measurement of corporate environmental performance: A critical examination of a
multidimensional construct”, Journal of Business Ethics, vol. 126, no. 2, pp. 185-204.
Turban, D.B. & Greening, D.W. 1997. “Corporate social performance and organizational
attractiveness to prospective employees”, The Academy of Management Journal, vol. 40, no. 3,
pp. 658-672.
Waddock, S.A. & Graves, S.B. 1997. “The corporate social performance-financial performance
link”, Strategic Management Journal, vol. 18, no. 4, pp. 303-319.
Walls, J.L., Berrone, P. & Phan, P.H. 2012. “Corporate governance and environmental
performance: Is there really a link?”, Strategic Management Journal, vol. 33, no. 8, pp. 885-
913.
Westphal, J.D. & Fredrickson, J.W. 2001. “Who directs strategic change? Director experience, the
selection of new CEOs, and change in corporate strategy”, Strategic Management Journal, vol.
22, no. 12, pp. 1113-1137.
White, M.A. 2013. “Sustainability: I know it when I see it”, Ecological Economics, vol. 86, pp.
213–217.
Williams, R.J. 2003. “Women on corporate boards of directors and their influence on corporate
philanthropy”, Journal of Business Ethics, vol. 42, no. 1, pp. 1-10.
Wood, D. & Jones, R. 1995. “Stakeholder mismatching: A theoretical problem in empirical
research on corporate social performance”, International Journal of Organizational Analysis,
vol. 3, no. 3, pp. 229-267.
World Commission on Environment and Development (WCED). 1987. Our Common Future.
New York: Oxford University Press.
Wright, P. & Ferris, S.P. 1997. “Agency conflict and corporate strategy: the effect of divestment
on corporate value”. Strategic Management Journal, vol. 18, no. 1, pp. 77-83.
Zhang, J.Q., Zhu, H. & Ding, H. 2013. “Board composition and corporate social responsibility:
An empirical investigation in the post Sarbanes-Oxley era”, Journal of Business Ethics, vol. 114,
no. 3, pp. 381-392.

51
APPENDIX I
Table 1. Corporate Sustainability Performance (CSP) index
Annual report (AR); Sustainability report (SR)
CG CORPORATE GOVERNANCE SCORE (Max 7 p.) EXAMPLES CG1
Top management sustainability focus
CG1A Does the CEO statement (or equivalent) mention sustainability (i.e. regarding environmental, social, and/or governance) in the Annual Report?
No: 0, yes: 1 “Sustainability work is an integrated part of JM’s strategy. It establishes that our corporate culture is to be characterized by sound values, responsibility, a long-‐term approach, sustainability and respect for individuals.” (JM, AR, 2013, p. 2) +1p.
CG2 Sustainability Reporting
CG2A Does the company have a
Sustainability Report or (if integrated) a separate section for sustainability reporting in the Annual Report?
No: 0, yes: 1
CG2B Is the company's Sustainability reporting issued in accordance with the GRI guidelines? And if so, which level of GRI-‐reporting?
No: GRI-‐reporting: 0 C-‐level: 1 B-‐level: 2 A-‐level/G4: 3
”Fabege reports its sustainability work yearly and the sustainability reporting is integrated in Fabege’s Annual report for 2012 […] Fabege reports in accordance with level C, GRI version 3.0. (Fabege, AR, 2012, p. 56) +1p.
CG2C Is the Sustainability reporting externally audited?
No: 0; yes: 1 “Tyréns (the Reviewer) has reviewed Byggmax’s sustainability report for the 2013 fiscal year. The review was based on GRI version 3.0. The Reviewer can affirm that the work was conducted in a goal-‐oriented and ambitious manner and that the information that is presented in the final sustainability report is factual and traceable. Byggmax has responded appropriately to the reviewer’s questions and provided supplementary documentation upon request.” (Byggmax, AR, 2013, p. 90) +1p.
CG3 Member/supporter of Global compact
CG3A Does the company support or is the company a signatory of the Global Compact13?
No: 0, yes: 1 “During 2011, Mekonomen decided to support the UN’s Global Compact and introduced a Code of Conduct, which is attached to all agreements. (Mekonomen, AR, 2011, p. 5) + 1p.
13 “The UN Global Compact is a strategic policy initiative for businesses that are committed to aligning their operations and strategies with ten universally accepted principles in the areas of human rights, labour, environment and anti-corruption. By doing so, business, as a primary driver of globalization, can help ensure that markets, commerce, technology and finance advance in ways that benefit economies and societies everywhere.” (UN Global Compact, 2013, https://www.unglobalcompact.org/AboutTheGC/TheTenPrinciples/index.html)

52
ES EMPLOYEES & SUPPLIERS SCORE (Max 12 p.) EXAMPLES ES1
Health & safety
ESA Does the company report on how to improve employee health & safety?
No: 0 Qualitative reporting: 1 Proactive quantitative target setting: 2 Quantitative achieved progress: 3
“The Group has the ambition to reduce workplace accidents towards zero in all facilities. In 2013, there were 0 (0) fatalities and the lost workday accident rate (per million hours worked) was reduced from 5.1 to 4.5.” (Husqvarna, SR, 2013, p. 16) +1+2+3p.
ES2 Diversity
ES2A Does the company report on
diversity (e.g. gender, minorities) and equality for employees?
No: 0 Qualitative reporting: 2
“ASSA ABLOY’s ambition is to achieve a better gender balance at all levels in the organization. In 2011, the Group set a target of 30 percent women in management positions at levels 2 to 5 by 2020.” (Assa Abloy, AR, 2013, p. 60) +1+2p.
ES3 Suppliers and/or sourcing partners
ES3A Does the company use criteria (governance, environmental, and/or social) in the selection process of its suppliers and/or partners?
No: 0, yes: 1
“Doro requires also that suppliers sign, in conjunction with the supplier score-‐card, a special declaration regarding good corporate social responsibility” (Doro, AR, 2011, p. 26) +1p.
ES3B Does the company monitor its suppliers and/or partners?
No: 0, yes: 1
“These strategic suppliers are continually evaluated in terms of environmental certification, environmental performance and related policies, work environment and code of conduct.” (HMS, AR, 2012, p. 25) +1p.
ES3C Does the company report on being prepared to propose an action plan or being willing to end a relationship with a supplier/partner, if the criteria are not fulfilled?
No: 0, yes: 1
“Should a supplier fail to comply with the Company’s recommendations, Swedish Match shall strive to resolve the situation through cooperation and information or, if deemed necessary, terminate the relationship.” (Swedish Match, SR, 2013, p. 28) +1 p.
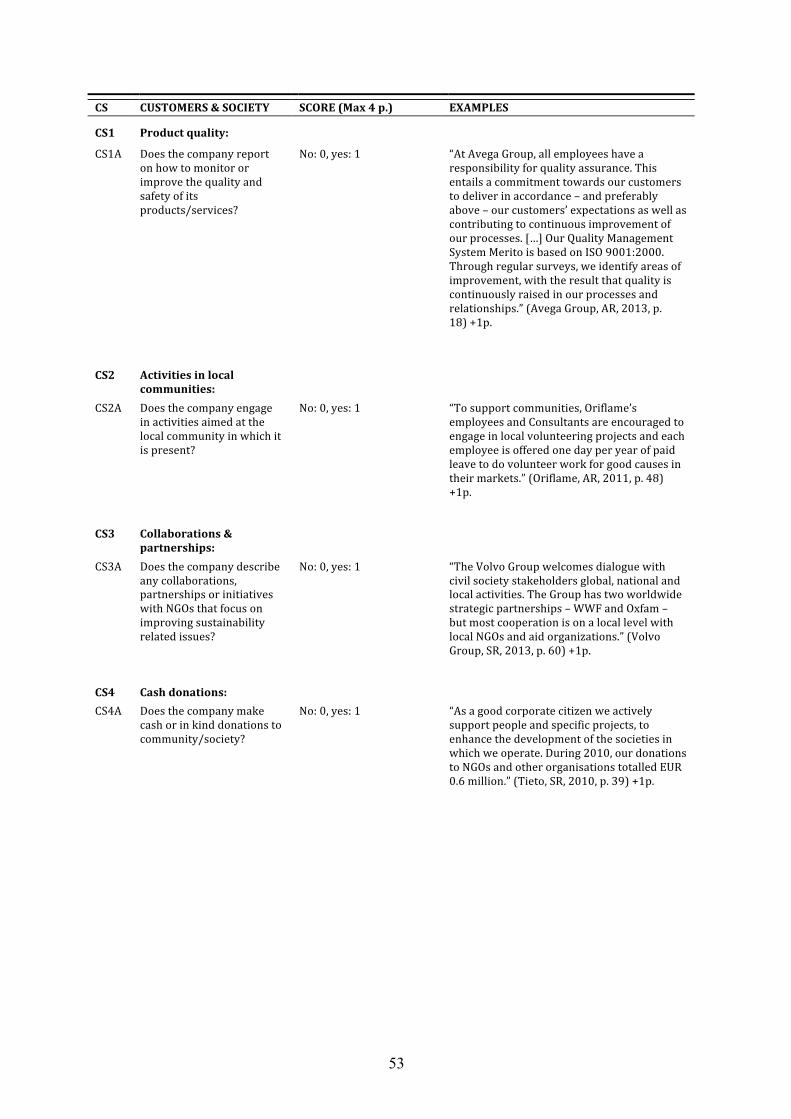
53
CS CUSTOMERS & SOCIETY SCORE (Max 4 p.) EXAMPLES CS1
Product quality:
CS1A Does the company report on how to monitor or improve the quality and safety of its products/services?
No: 0, yes: 1
“At Avega Group, all employees have a responsibility for quality assurance. This entails a commitment towards our customers to deliver in accordance – and preferably above – our customers’ expectations as well as contributing to continuous improvement of our processes. […] Our Quality Management System Merito is based on ISO 9001:2000. Through regular surveys, we identify areas of improvement, with the result that quality is continuously raised in our processes and relationships.” (Avega Group, AR, 2013, p. 18) +1p.
CS2 Activities in local communities:
CS2A Does the company engage in activities aimed at the local community in which it is present?
No: 0, yes: 1
“To support communities, Oriflame’s employees and Consultants are encouraged to engage in local volunteering projects and each employee is offered one day per year of paid leave to do volunteer work for good causes in their markets.” (Oriflame, AR, 2011, p. 48) +1p.
CS3 Collaborations & partnerships:
CS3A Does the company describe any collaborations, partnerships or initiatives with NGOs that focus on improving sustainability related issues?
No: 0, yes: 1
“The Volvo Group welcomes dialogue with civil society stakeholders global, national and local activities. The Group has two worldwide strategic partnerships – WWF and Oxfam – but most cooperation is on a local level with local NGOs and aid organizations.” (Volvo Group, SR, 2013, p. 60) +1p.
CS4 Cash donations:
CS4A Does the company make
cash or in kind donations to community/society?
No: 0, yes: 1
“As a good corporate citizen we actively support people and specific projects, to enhance the development of the societies in which we operate. During 2010, our donations to NGOs and other organisations totalled EUR 0.6 million.” (Tieto, SR, 2010, p. 39) +1p.

54
E ENVIRONMENTAL SCORE (Max 24 p.) EXAMPLES
E1
Transportation
E1A Does the company report on initiatives to reduce the environmental impact of transportation of its products and/or its staff?
No: 0 Qualitative reporting: 1 Proactive quantitative target setting: 2 Quantitative achieved progress: 3
“Proffice prioritises renewable fuels for travel and energy use in offices. Proffice also works actively to reduce the need for travel by replacing physical meetings with voice, video, and web conferencing.” (Proffice, AR, 2012, p. 16) +1p. “Air travel accounts for the largest share of Cybercom’s carbon dioxide emissions and we therefore wish to reduce emissions from air travel per revenue krona by at least five percent between 2011 and 2015.” (Cybercom, AR, 2013, p. 24) +1+2p “Average CO2 emissions reduced by 2.6 percent for cars and 0.5 percent for minivans. Total reduction was 3.2 percent” (Securitas, AR, 2013, p. 21) +1+3p.
E2 Resource efficiency & recycling
E2A Does the company report on initiatives on resource efficiency (e.g. raw materials)? Or does the company report on initiatives to recycle, etc.?
No: 0 Qualitative reporting: 1 Proactive quantitative target setting: 2 Quantitative achieved progress: 3
“Peab’s goal concerning waste is that the least possible amount ends up at the waste disposal site. This is achieved through optimal resource use, maximum reuse, sorting waste better to recycle as much material […] the sorting level rose from 63 percent in 2010 to 68 percent in 2011 in Peab’s Swedish construction operations. Our goal is to recycle 70 percent.” (Peab, AR, 2011, p. 31) +1+2+3 p.
E3 Renewable energy and energy reduction
E3A Does the company report on initiatives to use renewable energy sources (e.g. wind, solar)? Or does the company report on reducing energy consumption in general?
No: 0 Qualitative reporting: 1 Proactive quantitative target setting: 2 Quantitative achieved progress: 3
“An energy saving project was launched in 2009 to cut energy consumption at Saab’s properties in Sweden in half by 2015. So far, a 20 per cent reduction has been achieved.” Saab, AR, 2013, p. 40) +1+2 p. “Between 2011 and 2012, the energy consumption was reduced in stores by 2,437 MWh, which equals 8 percent of the total energy usage in stores.” (Kappahl, SR, 2013, p. 13) +1+3 p.
E4 Emissions
E4A Does the company report
on carbon dioxide (CO2) emissions (greenhouse gas emissions)?
No: 0 Qualitative reporting: 1 Proactive quantitative target setting: 2 Quantitative achieved progress: 3
“Energy consumption per workstation, through the usage of PC, laptops, computer screens, and thin clients, has been identified as an area, in which potential improvements are continuously initiated and evaluated. Within Betsson, the workstations consumed 151 tonnes carbon dioxide, which in 2013 corresponded to 0.15 tonnes carbon dioxide per average employee […] The goal for 2014 is to save more than 1.4 tonnes carbon dioxide though the use of thin clients.” (Betsson, AR, 2013, p. 10) +1+2 p.
“Between 2012 and 2012, the total greenhouse gases were reduced by 18 percent to 188 tonnes CO2. In relation to net sales, the emission were reduced by 31 percent to 416 kg CO2/mkr” (DGC, AR, 2013, p. 40) +1+3 p.
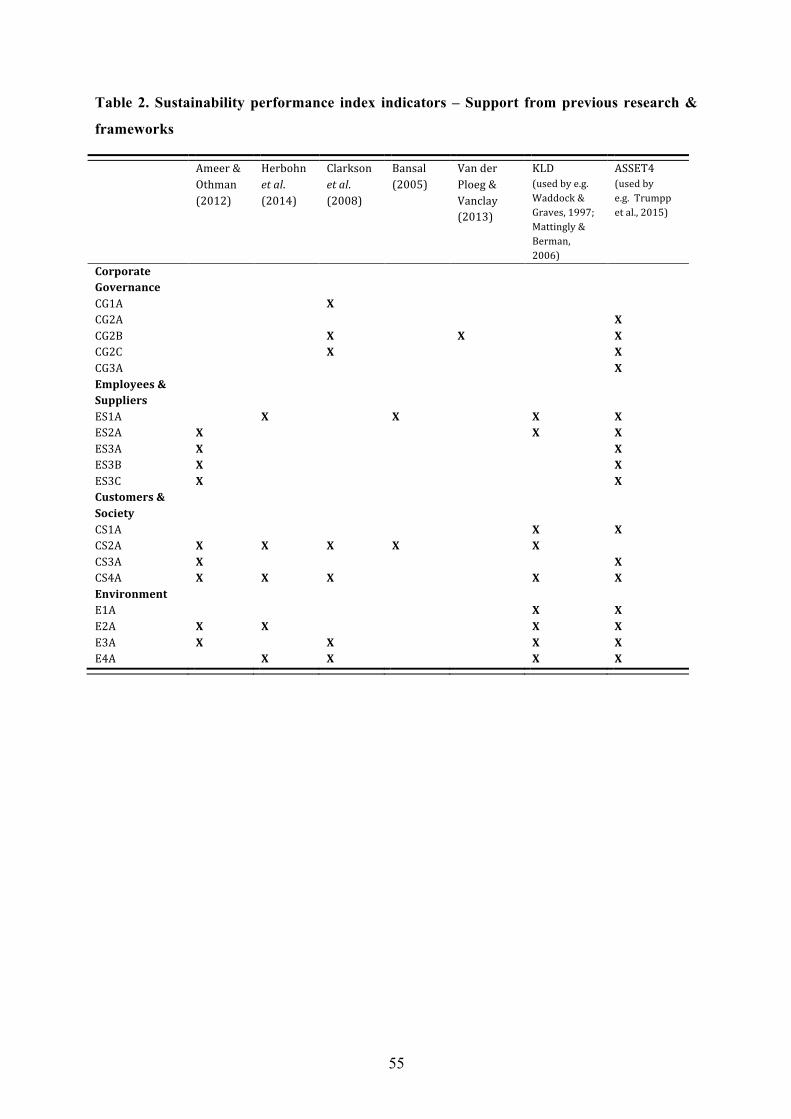
55
Table 2. Sustainability performance index indicators – Support from previous research &
frameworks
Ameer & Othman (2012)
Herbohn et al. (2014)
Clarkson et al. (2008)
Bansal (2005)
Van der Ploeg & Vanclay (2013)
KLD (used by e.g. Waddock & Graves, 1997; Mattingly & Berman, 2006)
ASSET4 (used by e.g. Trumpp et al., 2015)
Corporate Governance
CG1A X CG2A X CG2B X X X CG2C X X CG3A X Employees & Suppliers
ES1A X X X X ES2A X X X ES3A X X ES3B X X ES3C X X Customers & Society
CS1A X X CS2A X X X X X CS3A X X CS4A X X X X X Environment E1A X X E2A X X X X E3A X X X X E4A X X X X

56
APPENDIX II
Table 3. Descriptive statistics – Including transformed variables and skewness/kurtosis
N Minimum Maximum Mean Std. dev. Skewness Kurtosis ROA
1015
-‐0.74
0.26
0.02
0.15
-‐2.74
9.90
ROA SQ.T. 1015 0.00 1.03 0.61 0.17 -‐1.20 2.94 CSP 1015 0.04 3.83 1.10 0.81 0.86 -‐0.06 CG 1015 0.00 1.00 0.26 0.26 1.06 0.47 ES 1015 0.00 1.00 0.26 0.22 1.07 0.88 CS 1015 0.00 1.00 0.35 0.28 0.57 -‐0.44 E 1015 0.00 1.00 0.22 0.23 1.23 0.73 FIRM SIZE 1015 24.27 396,110.50 16,955.80 47,291.69 5.31 31.57 FIRM SIZE LG 1015 1.39 5.60 3.41 0.86 0.27 -‐0.51 DEBT RATIO 1015 0.01 1.41 0.52 0.19 -‐0.23 0.58
SQ.T. -‐ Square transformation LG -‐ Logarithm Table 4. Univariate regression model – ROA & CSP
Model I CSP 0.05*** (8.02) Constant 0.55*** (61.71) N 1,015 F 64.34 Adj. R2 0.059
*p < 0.10; ** p < 0.05; *** p < 0.01 (2-‐tailed). (T-‐statistics in parentheses) Table 5. Multivariate regression - Without CSP as independent variable Model II Model 3 CSP 0.02** (2.31) FIRM SIZE 0.08*** 0.06*** (11.72) (7.24) DEBT RATIO -‐0.04*** -‐0.20*** (-‐6.80) (-‐6.80) Constant 0.44*** 0.46*** (17.79) (17.45) Year FIXED FIXED Industry FIXED FIXED N 1,015 1,015 F 21.77 20.21 Adj. R2 0.156 0.159
Model 3 repeats data from Table VI to facilitate referencing. *p < 0.10; ** p < 0.05; *** p < 0.01 (2-‐tailed). (T-‐statistics in parentheses)
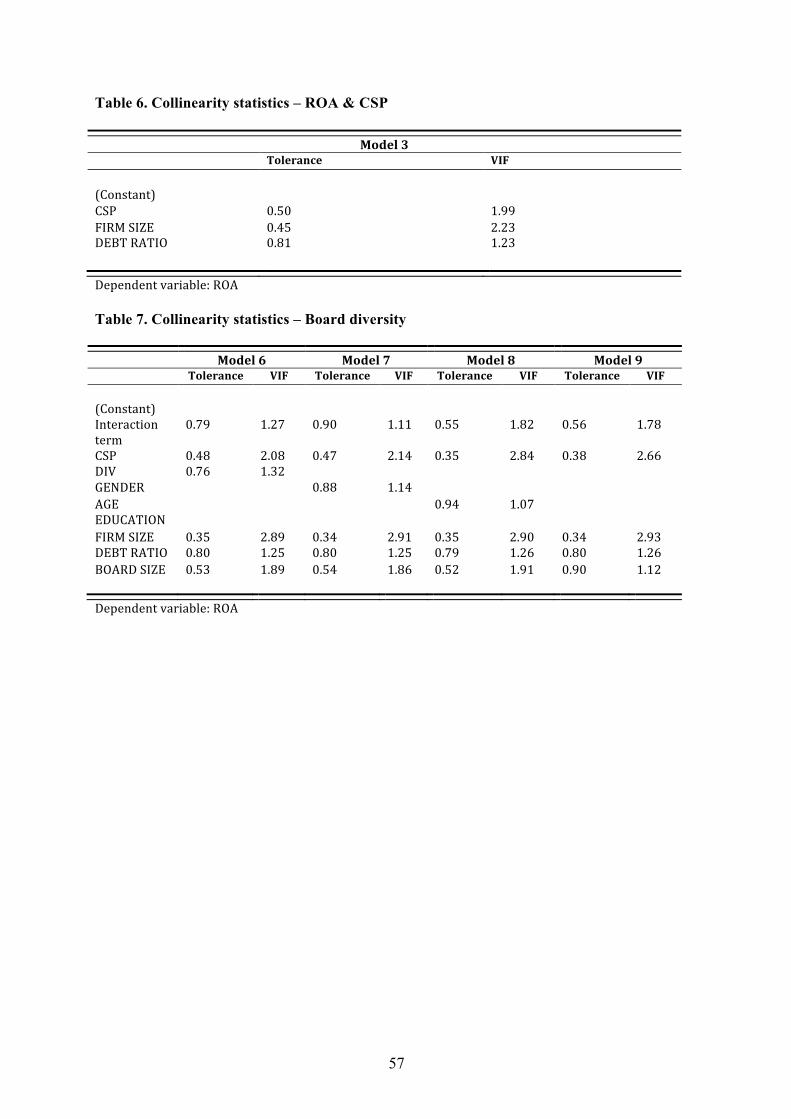
57
Table 6. Collinearity statistics – ROA & CSP
Model 3 Tolerance VIF (Constant) CSP 0.50 1.99 FIRM SIZE 0.45 2.23 DEBT RATIO 0.81 1.23
Dependent variable: ROA Table 7. Collinearity statistics – Board diversity Model 6 Model 7 Model 8 Model 9 Tolerance VIF Tolerance VIF Tolerance VIF Tolerance VIF (Constant) Interaction term
0.79 1.27 0.90 1.11 0.55 1.82 0.56 1.78
CSP 0.48 2.08 0.47 2.14 0.35 2.84 0.38 2.66 DIV 0.76 1.32 GENDER 0.88 1.14 AGE 0.94 1.07 EDUCATION FIRM SIZE 0.35 2.89 0.34 2.91 0.35 2.90 0.34 2.93 DEBT RATIO 0.80 1.25 0.80 1.25 0.79 1.26 0.80 1.26 BOARD SIZE 0.53 1.89 0.54 1.86 0.52 1.91 0.90 1.12
Dependent variable: ROA

58
Table 8. Multivariate regression analysis – Index & Control variables Model 4 Model
a Model a1
Model a2
Model b
Model b1
Model b2
Model c
Model c1
Model c2
Model d
Model d1
Model d2
CG 0.04 0.05** 0.18***
(1.55) (1.88) (8.39)
ES 0.00 0.00 0.16***
(0.91) (0.13) (6.10)
CS 0.07*** 0.07*** 0.16***
(3.52) (3.17) (8.15)
E 0.02 0.03 0.17***
(0.88) (0.96) (6.99)
FIRM SIZE
0.07*** 0.05*** 0.08*** 0.06*** 0.06*** 0.05*** 0.07*** 0.06***
(8.08) (6.13) (9.83) (7.94) (8.93) (6.95) (9.23) (7.32)
DEBT RATIO
-‐0.20***
-‐0.12***
-‐0.20***
-‐0.11***
-‐0.21***
-‐0.13***
-‐0.20***
-‐0.12***
(-‐6.71) (-‐4.23) (-‐6.80) (-‐3.75) (-‐6.97) (-‐4.26) (-‐6.79) (-‐3.94)
Constant 0.46*** 0.42*** 0.61 0.44*** 0.40*** 0.61*** 0.46*** 0.41*** 0.61*** 0.45*** 0.40*** 0.62***
(17.09) (15.65) (32.16) (17.31) (15.76) (31.37) (18.24) (16.60) (31.74) (17.15) (15.62) (32.36)
Year FIXED FIXED FIXED FIXED FIXED FIXED FIXED FIXED FIXED FIXED FIXED FIXED
Industry FIXED FIXED FIXED FIXED FIXED FIXED FIXED FIXED FIXED FIXED FIXED FIXED
N 1,015 1,015 1,015 1,015 1,015 1,015 1,015 1,015 1,015 1,015 1,015 1,015
F-‐stat. 19.86 16.35 13.93 19.57 15.90 10.06 21.05 17.17 13.48 19.67 16.02 11.43
Adj. R2 0.157 0.120 0.103 0.155 0.117 0.074 0.165 0.126 0.100 0.155
0.118 0.085
*p < 0.10; ** p < 0.05; *** p < 0.01 (2-‐tailed). (T-‐statistics in parentheses)