Embed Size (px)
Citation preview
ABSTRACT
The recent corporate trends show a shift towards responsible performance and increased responsibility disclosures. The reporting of environmental, social and governance (ESG) factors by a firm has been found to have positive market valuations. This study empirically analyses the association of ESG disclosures and market valuations in an emerging market, India. This study is original as it examines the association between responsibility disclosure and firm value of family firms with non-family business firms. This study was conducted with a sample of 245 Indian companies over 5 years and the results show that ESG disclosures do not significantly explain firm value (measured as Tobin’s q). A significant difference between the ESG disclosure practices of family and non-family firms was found. The family firms make higher ESG disclosures. These results document another advantage of family-ownership in today’s era of responsible investing. The study has implications for investors in investment decision making and screening of investments.
Keywords: corporate sustainability, environmental, social and governance disclosure, family-ownership, market value
CORPORATE SUSTAINABILITY AND FAIR MARKET VALUE: A STUDY OF INDIAN FAMILY
VERSUS NON-FAMILY FIRMSMeena Sharma1, Raj Kumar2 and Rajbir Kaur3
1University Business School, Panjab University, Chandigarh, India E-mail: [email protected]
2Institute of Management Studies, Banaras Hindu University (BHU), Varanasi, India E-mail: [email protected]
E-mail: [email protected]
ARTICLE INFO
Article History: Received: 29 February 2020Accepted: 26 June 2020Published: 31 August 2020
3University Business School, India
94
Asia-Pacific Management Accounting Journal, Volume 15 Issue 2
INTRODUCTION
Corporate strategies have started incorporating corporate social responsibility (CSR) and environmental responsibility in order to align corporate governance with sustainable development. This change in corporate strategies has increased investor preference towards investments that consider environmental, social and governance (ESG) criteria in investment decision making. Regulators, managers and investors are making efforts to improve public transparency on economic, social and corporate governance issues in order to increase the value of a company (Aguilera, Rupp, Williams, & Ganapathi, 2007).
Many businesses understand that corporations play a key role in tackling urgent issues that may affect the stakeholders of the business in the long term. Owners of companies can exert pressure on the management to conform to the moral expectations of the stakeholders of a business. Many businesses resist the adoption of a sustainability agenda fearing loss in value of the firm but sustainable investments focus on environmental and social performance without compromising their economic results. The existing literature empirically supports the positive effect of ESG disclosures on firm value. However, ESG disclosures of family-controlled businesses and non- family businesses have not been researched convincingly.
Family controlled businesses are different from non-family business in many ways. Such controlling families often hold large shareholdings and for the most part have representation at the top management level as well as on the board. Family businesses are featured by higher commitment to business, higher trust levels among the owners and management and more certain succession planning. Theoretically the Stewardship Theory should hold well in family-owned firms. However, in practice, family-owned firms also have serious corporate governance problems like succession issues and family feuds. Thus, family and non-family business might show differences in terms of ESG disclosures and its effects.
Like many emerging countries, the family-centred style of management is one of the unique features of India’s ESG scenario. Most of the large corporations in India are controlled by family groups (Du, Bhattacharya, & Sen, 2010). This paper empirically examines the level of ESG disclosures
95
Corporate Sustainability and Fair Market Value
made by Indian firms and impact of ESG disclosure on the market value of the firms. The present study extends the literature on the association of ESG disclosures and firm value by empirically testing for a significant difference in family and non-family businesses in Indian capital markets.
This study examined whether the family status of companies is important to voluntary ESG disclosure. The rest of the paper will be structured as follows: the next section discusses the relevant literature on the subject. The third section explains the methodology of analysis implemented in the study, including the data used, and the methods and tests applied. In the fifth section results are analyzed and discussed. The results are concluded in the last section.
LITERATURE REVIEW
The large number of the ESG disclosures (ESGD) literature shows the importance of the theory worldwide. The ties of ESGD as defined by financial features (size, productivity and firm leverage) have been widely studied and reported through the management and social science literature in developing countries (Hillman & Keim, 2001; Amran & Devi, 2008; Mahadeo, Hanuman, & Oogarah-Soobaroyen, 2011; Crisóstomo, Freire, & Vasconcellos, 2011).
ESG disclosure is important for an organization. Companies provide stakeholders with ESG information across a wide range of channels. These include quarterly reports, corporate blogs, press releases and CSR ads on an economic, ecological and green basis (Amran & Devi, 2008, Perks, 2015). Such platforms provide ESG documents as the primary resources to meet investors’ environmental and social information needs (Unerman, O’Dwyer, Gray, Bebbington, & Collison, 2006; Abu Bakar & Ameer, 2011). ESG reporting is defined as the “communication process for specific groups within society and for society as a whole of the social and environmental impacts of economic activities of organizations” (Panwar, Paul, Nybakk, Hansen, & Thompson, 2014). ESG is a strategic investment for a company that aims not only to benefit from its participation in activities of social responsibility but also its communication with external players concerning such participation (Arvidsson, 2010; Du et al., 2010; Othman, Darus, & Arshad, 2011).
96
Asia-Pacific Management Accounting Journal, Volume 15 Issue 2
Research has found that higher ESG output could help businesses develop a credible and honest image and thus gain the support of investors (Azim, Pruneri, Cocorocchio, Cinieri, Raviele, Bassi, & Peccatori, 2009; Rim, Yang, & Lee, 2016). The implementation of ESG activities helps promote stakeholders ‘ confidence in the company and enables the company to maintain a favorable relationship with its key stakeholders (Menassa, 2010; Park & Levy, 2014). The communication of environmental and social initiatives by family companies can thus be perceived as impartial and therefore reduces uncertainty among stakeholders.
The Challenges of ESG Disclosure
Organizations face increasing social responsibility pressure from investors and are expected to communicate their ESG activities (Perks, Farache, Shukla, & Berry, 2013; Grougiou, Dedoulis, & Leventis, 2016). The yearly report may be used to enhance the perception of the community about the response of the organization to certain ESG problems or to divert attention from unfavorable situations (Deegan, 2002). Such reports are limited, and provide specific information which is to help shape the image of the company by shareholders (Kalkanci, Ang, & Plambeck, 2016).
Several studies have shown that the degree of confidentiality of ESG information provided by firms in their annual reports is controversial. The lack of ESG reporting standards, particularly with regard to the amount and type of data reported to investors in the company’s annual reports makes it extremely difficult and inimitable to report ESG (Cerin, 2002; Saleh, Zulkifli, & Muhamad, 2010). The fact that the ESG projects have not reached agreement on what to include (or exclude) leads to confusion in understanding for the contents of the documents (Margolis & Walsh, 2003).
Some observers who believe that such firms’ motives are less than sincere, raising the spectre of ‘green washing’ where firms improve social performance for purely presentational reasons and not to improve underlying sustainability, thus doing the right thing for the wrong reason (Burritt & Schaltegger, 2010). Companies may be deliberately advertising good performance on some aspects of CSR while burying poor performance on others (Owen, 2005). The company reports generally positive, valuable information related to ESG (Tagiuri & Davis, 1996). There are thus very few
97
Corporate Sustainability and Fair Market Value
opportunities to make ESG reports accessible in places in which the business is weak in record (Cormier & Gordon, 2001; Rahman, 2011; Aerts, Cormier, & Magnan, 2008). Most businesses that report on ESG are expanding CSR investments in print management data volumes and over-reports. ESG’s coverage is a tactic to affect a company’s public perception and shape the way certain players perceive the company (Murthy & Abeysekera, 2008; Perks et al., 2013). Many companies see ESG reporting as a platform for public relations to build a good image and gain strong market reputation. (Siregar & Bachtiar, 2010). Companies may use CSR reporting to enhance stakeholders’ perceptions of the suitability of their companies’ pro-social and environmental activities (Deegan, 2002; Guidry & Patten, 2010), and selectively report on positive ESG behavior, which will lead to misleading and biased reporting.
ESG Disclosure and Market Value
Prior studies have attempted to demonstrate empirically the positive consequences of ESG disclosure on the market value of a company (Hidayat, 2011; Thorne, Mahoney, Gregory, & Convery, 2017). Many studies examine the relationship between the reporting level of ESG and cost of equity capital. Dhaliwal, Radhakrishnan, Tsang, and Yang (2011) showed that the company’s cost of equity capital decreases with more voluntary environmental disclosure, but (Guidry & Patten, 2010) and (Richardson & Welker, 2001) noted that the higher voluntary ESG disclosures raise cost of capital.
Recent empirical evidence offers mixed results on the association between market value and ESG coverage, as assessed by its stock price or market reaction. Although some studies reported a positive association between the reporting of ESG and the assessment of business (Ferns, Emelianova, & Sethi, 2008; Wang & Li, 2015; Cahan, De Villiers, Jeter, Naiker, & Van Staden, 2016), the correlation between the two mechanisms was not significant (Aerts et al., 2008; Granata & Chirico, 2010). In comparison, some studies (Melo & Garrido-Morgado, 2011; Jones, Frost, Loftus, & Laan, 2007) argue that ESG is negatively associated with firm quality. Such contradictory results raise doubts about the information provided in volunteer CSR data in the annual reports of companies or in separate sustainable studies.
98
Asia-Pacific Management Accounting Journal, Volume 15 Issue 2
Studies have found different associations between different types of disclosures and market value. Hillman and Keim (2001) prove that strategic management issues (relevant to primary stakeholders) add to the market value of a firm whereas the social issue participations (relevant to secondary stakeholders) are value destroying. Chang, Kim, and Li (2014) follow the framework suggested by (Margolis & Walsh, 2003) to find ‘Technical CSR’ (targeting primary stakeholders) is positively associated with both market-based and accounting-based measures of financial performance.
Jones et al. (2007) recognise that different stakeholders have different economic significance for firms and CSR can increase firm market value mainly via improved employee welfare and environmental performance. Thus, previous literature reviews (Margolis & Walsh, 2003; Malik, 2015) and meta-analyses (Margolis et al., 2009; Orlitzky, 2013; Friede, Busch, & Bassen, 2015; Lu & Taylor, 2016) document that the majority of studies show evidence of this positive link, a sizeable number of papers are not able to find an association and only a very small minority (6-8%) of empirical work have found a negative relationship between CSR and market value (Brooks & Oikonomou, 2018).
The Role of Family Involvement
Family businesses possess several outstanding and unique characteristics that distinguish themselves from non-family businesses as external stakeholders. Such characteristics can be an important factor in the evaluation and response to ESG reporting by stakeholders. We also provide information that shapes the expectations of the companies and the disclosure of ESG by stakeholders. As far as ESG is concerned, family firms behave differently from firms without family involvement. The influence of family involvement generates a range of attitudes that can lead to the socially responsible behavior of these specific types of companies and to the adoption of ESG policies. The effect of families and management on social efficiency, ethics and business has been explored by empirical studies (Dyer & Whetten 2006; Berrone, Cruz, Gomez-Mejia, & Larraza-Kintana 2010; Othman et al., 2011).
Family members are altruistic towards each other as a result of kinship obligations that are part of the axiomatically binding normative
99
Corporate Sustainability and Fair Market Value
moral order in most cultures (Salvato & Melin, 2008). Strong commitment towards business in family-controlled business is regarded as an advantage as compared to non-family firms. Family companies can capitalize on the positive perception of their stakeholders compared to non-family companies, since these companies are seen as trustworthy and highly credible (Stanley & McDowell, 2014).
Family involvement in business has been studied with firm’s financial performance. Gill and Kaur (2016) found that family involvement in business is associated with superior financial performance. Furthermore, financial performance is higher for family companies as compared to non-family companies. Based on the market performance measure, family companies appear to be better performers with higher outside board representations. Family companies had a diverse background and expertise. The impact of firm size and unaffiliated block-holdings on financial performance was found to be significantly negative.
Family controlled firms may not face agency problems as management and owners are strongly connected (Ang, Cole, & Lin, 2000). Theoretically the Stewardship Theory should hold well in family-owned firms. However, in practice, family-owned firms also have serious corporate governance problems like succession issues and family feuds. They are more vigilant with external investors and less willing to act in ways that breach the confidence of their business partners (Cennamo, Berrone, Cruz, & Gomez–Mejia, 2012).
RESEARCH METHODOLOGY
Sample Selection and Variables Measurement
The study is based on the data of top 500 listed Indian companies included in S&P BSE 500 index from 2013 to 2018. S&P BSE 500 index represents nearly 93% of the total market capitalization on BSE (formally Bombay Stock Exchange), a leading stock exchange of India that was established in 1875. S&P BSE 500 covers all 20 major industries of the Indian economy. This study further restricts its final sample to all non-financial firms subject to the availability of data required to estimate the
100
Asia-Pacific Management Accounting Journal, Volume 15 Issue 2
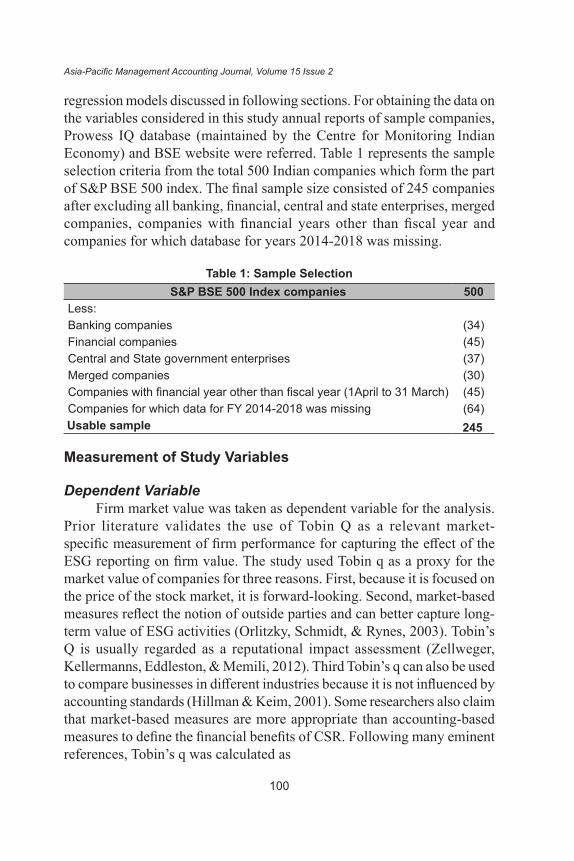
regression models discussed in following sections. For obtaining the data on the variables considered in this study annual reports of sample companies, Prowess IQ database (maintained by the Centre for Monitoring Indian Economy) and BSE website were referred. Table 1 represents the sample selection criteria from the total 500 Indian companies which form the part of S&P BSE 500 index. The final sample size consisted of 245 companies after excluding all banking, financial, central and state enterprises, merged companies, companies with financial years other than fiscal year and companies for which database for years 2014-2018 was missing.
Table 1: Sample SelectionS&P BSE 500 Index companies 500
Less:Banking companies (34)Financial companies (45)Central and State government enterprises (37)Merged companies (30)Companies with financial year other than fiscal year (1April to 31 March) (45)Companies for which data for FY 2014-2018 was missing (64)
Measurement of Study Variables
Dependent VariableFirm market value was taken as dependent variable for the analysis.
Prior literature validates the use of Tobin Q as a relevant market-specific measurement of firm performance for capturing the effect of the ESG reporting on firm value. The study used Tobin q as a proxy for the market value of companies for three reasons. First, because it is focused on the price of the stock market, it is forward-looking. Second, market-based measures reflect the notion of outside parties and can better capture long-term value of ESG activities (Orlitzky, Schmidt, & Rynes, 2003). Tobin’s Q is usually regarded as a reputational impact assessment (Zellweger, Kellermanns, Eddleston, & Memili, 2012). Third Tobin’s q can also be used to compare businesses in different industries because it is not influenced by accounting standards (Hillman & Keim, 2001). Some researchers also claim that market-based measures are more appropriate than accounting-based measures to define the financial benefits of CSR. Following many eminent references, Tobin’s q was calculated as
245Usable sample
101
Corporate Sustainability and Fair Market Value
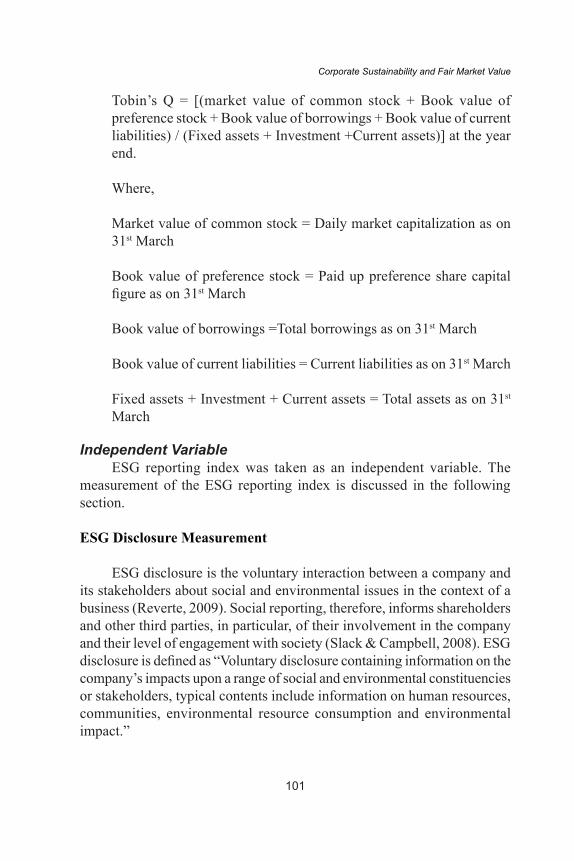
Tobin’s Q = [(market value of common stock + Book value of preference stock + Book value of borrowings + Book value of current liabilities) / (Fixed assets + Investment +Current assets)] at the year end.
Where,
Market value of common stock = Daily market capitalization as on 31st March
Book value of preference stock = Paid up preference share capital figure as on 31st March
Book value of borrowings =Total borrowings as on 31st March
Book value of current liabilities = Current liabilities as on 31st March
Fixed assets + Investment + Current assets = Total assets as on 31st March
Independent Variable ESG reporting index was taken as an independent variable. The
measurement of the ESG reporting index is discussed in the following section.
ESG Disclosure Measurement
ESG disclosure is the voluntary interaction between a company and its stakeholders about social and environmental issues in the context of a business (Reverte, 2009). Social reporting, therefore, informs shareholders and other third parties, in particular, of their involvement in the company and their level of engagement with society (Slack & Campbell, 2008). ESG disclosure is defined as “Voluntary disclosure containing information on the company’s impacts upon a range of social and environmental constituencies or stakeholders, typical contents include information on human resources, communities, environmental resource consumption and environmental impact.”
102
Asia-Pacific Management Accounting Journal, Volume 15 Issue 2
In order to measure the richness of the information presented in annual reports, the content analysis approach was used. The analysis of the content was defined by Holder-Webb, Cohen, Nath, and Wood (2009) as “a way to codify text and information in written narratives into classes or categories that can be done in various ways, in varying complexity”. The content score represents both the quality and quantity of the disclosure in contrast to the paragraph, or word count, which only shows how much information, is provided, whereas the quality of the disclosure is more important (Hasseldine, Salama, & Toms, 2005).
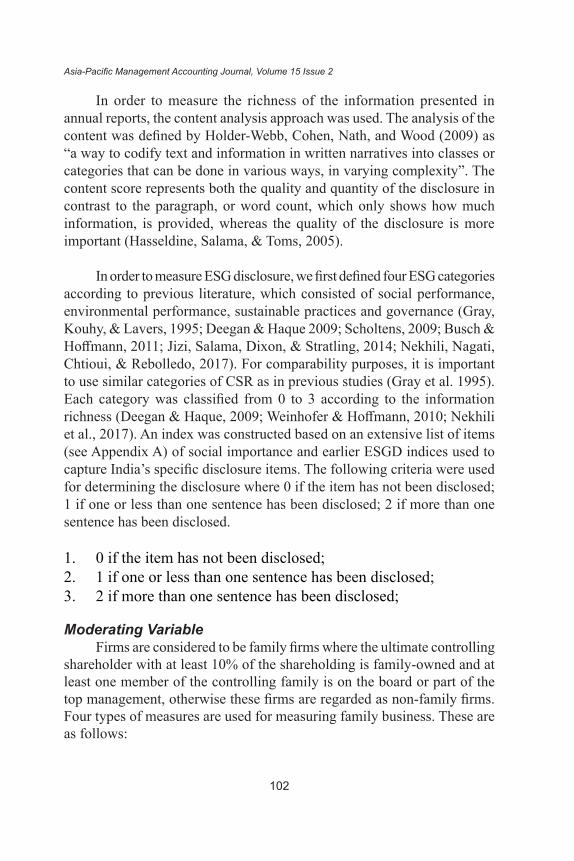
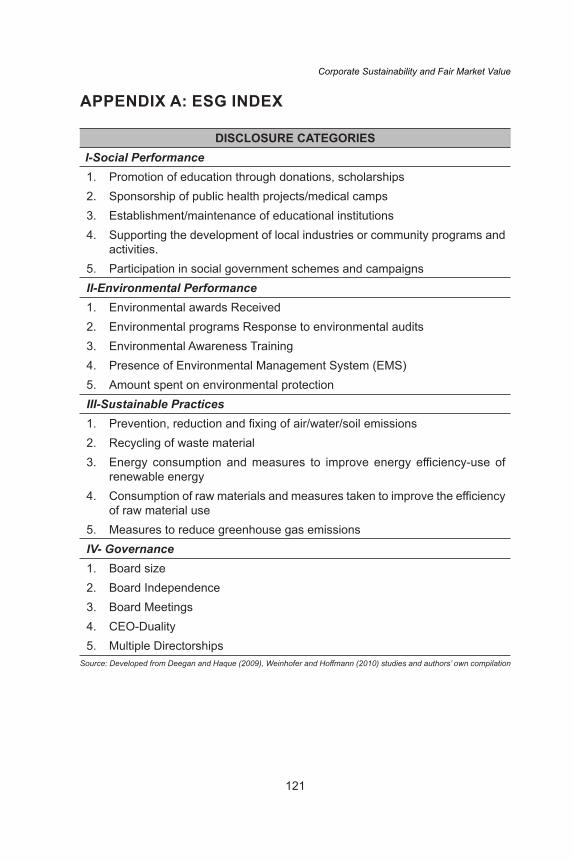
In order to measure ESG disclosure, we first defined four ESG categories according to previous literature, which consisted of social performance, environmental performance, sustainable practices and governance (Gray, Kouhy, & Lavers, 1995; Deegan & Haque 2009; Scholtens, 2009; Busch & Hoffmann, 2011; Jizi, Salama, Dixon, & Stratling, 2014; Nekhili, Nagati, Chtioui, & Rebolledo, 2017). For comparability purposes, it is important to use similar categories of CSR as in previous studies (Gray et al. 1995). Each category was classified from 0 to 3 according to the information richness (Deegan & Haque, 2009; Weinhofer & Hoffmann, 2010; Nekhili et al., 2017). An index was constructed based on an extensive list of items (see Appendix A) of social importance and earlier ESGD indices used to capture India’s specific disclosure items. The following criteria were used for determining the disclosure where 0 if the item has not been disclosed; 1 if one or less than one sentence has been disclosed; 2 if more than one sentence has been disclosed.
1. 0 if the item has not been disclosed;2. 1 if one or less than one sentence has been disclosed;3. 2 if more than one sentence has been disclosed;
Moderating VariableFirms are considered to be family firms where the ultimate controlling
shareholder with at least 10% of the shareholding is family-owned and at least one member of the controlling family is on the board or part of the top management, otherwise these firms are regarded as non-family firms. Four types of measures are used for measuring family business. These are as follows:
103
Corporate Sustainability and Fair Market Value
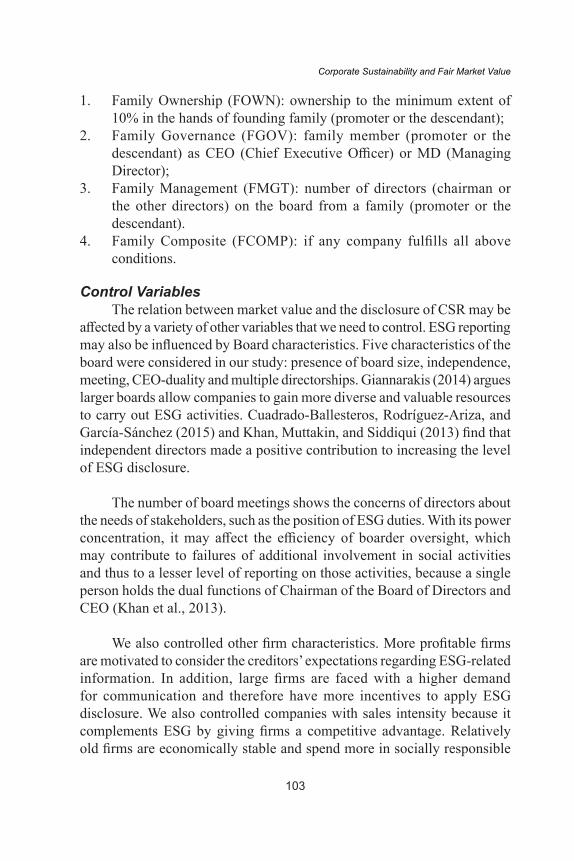
1. Family Ownership (FOWN): ownership to the minimum extent of 10% in the hands of founding family (promoter or the descendant);
2. Family Governance (FGOV): family member (promoter or the descendant) as CEO (Chief Executive Officer) or MD (Managing Director);
3. Family Management (FMGT): number of directors (chairman or the other directors) on the board from a family (promoter or the descendant).
4. Family Composite (FCOMP): if any company fulfills all above conditions.
Control VariablesThe relation between market value and the disclosure of CSR may be
affected by a variety of other variables that we need to control. ESG reporting may also be influenced by Board characteristics. Five characteristics of the board were considered in our study: presence of board size, independence, meeting, CEO-duality and multiple directorships. Giannarakis (2014) argues larger boards allow companies to gain more diverse and valuable resources to carry out ESG activities. Cuadrado-Ballesteros, Rodríguez-Ariza, and García-Sánchez (2015) and Khan, Muttakin, and Siddiqui (2013) find that independent directors made a positive contribution to increasing the level of ESG disclosure.
The number of board meetings shows the concerns of directors about the needs of stakeholders, such as the position of ESG duties. With its power concentration, it may affect the efficiency of boarder oversight, which may contribute to failures of additional involvement in social activities and thus to a lesser level of reporting on those activities, because a single person holds the dual functions of Chairman of the Board of Directors and CEO (Khan et al., 2013).
We also controlled other firm characteristics. More profitable firms are motivated to consider the creditors’ expectations regarding ESG-related information. In addition, large firms are faced with a higher demand for communication and therefore have more incentives to apply ESG disclosure. We also controlled companies with sales intensity because it complements ESG by giving firms a competitive advantage. Relatively old firms are economically stable and spend more in socially responsible
104
Asia-Pacific Management Accounting Journal, Volume 15 Issue 2
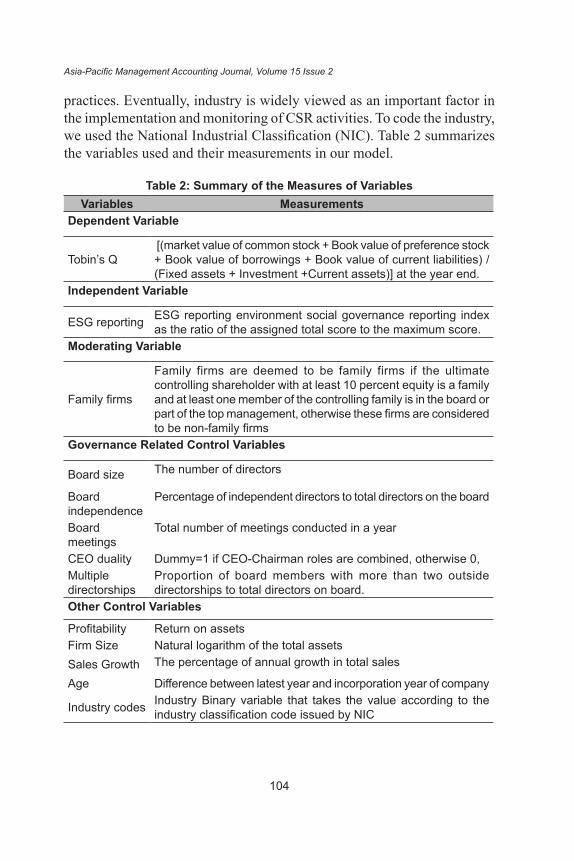
practices. Eventually, industry is widely viewed as an important factor in the implementation and monitoring of CSR activities. To code the industry, we used the National Industrial Classification (NIC). Table 2 summarizes the variables used and their measurements in our model.
Table 2: Summary of the Measures of VariablesVariables Measurements
Dependent Variable
Tobin’s Q [(market value of common stock + Book value of preference stock + Book value of borrowings + Book value of current liabilities) / (Fixed assets + Investment +Current assets)] at the year end.
Independent Variable
ESG reporting ESG reporting environment social governance reporting index as the ratio of the assigned total score to the maximum score.
Moderating Variable
Family firms
Family firms are deemed to be family firms if the ultimate controlling shareholder with at least 10 percent equity is a family and at least one member of the controlling family is in the board or part of the top management, otherwise these firms are considered to be non-family firms
Governance Related Control Variables
Board size The number of directors
Board independence
Percentage of independent directors to total directors on the board
Board meetings
Total number of meetings conducted in a year
CEO duality Dummy=1 if CEO-Chairman roles are combined, otherwise 0, Multiple directorships
Proportion of board members with more than two outside directorships to total directors on board.
Other Control Variables
Profitability Return on assetsFirm Size Natural logarithm of the total assetsSales Growth The percentage of annual growth in total sales
Age Difference between latest year and incorporation year of company
Industry codes Industry Binary variable that takes the value according to the industry classification code issued by NIC
105
Corporate Sustainability and Fair Market Value
EMPIRICAL ANALYSIS AND DISCUSSION
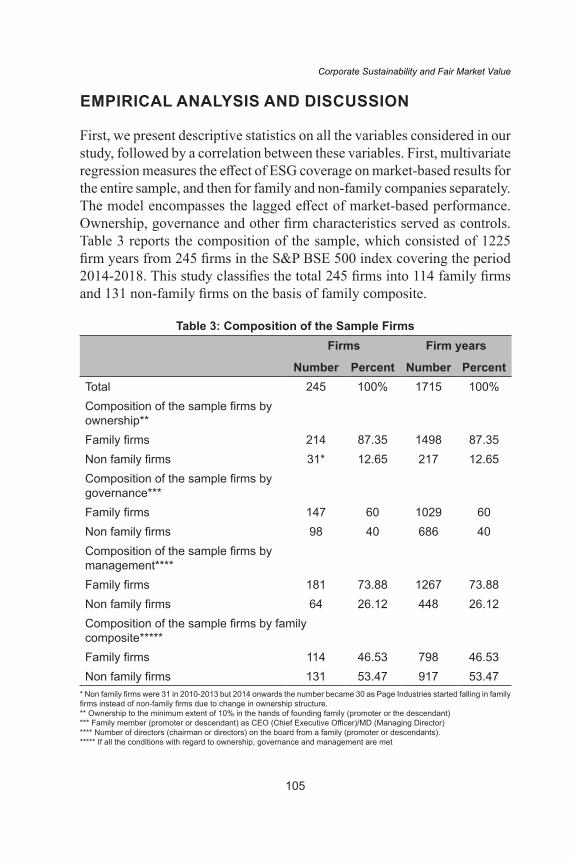
First, we present descriptive statistics on all the variables considered in our study, followed by a correlation between these variables. First, multivariate regression measures the effect of ESG coverage on market-based results for the entire sample, and then for family and non-family companies separately. The model encompasses the lagged effect of market-based performance. Ownership, governance and other firm characteristics served as controls. Table 3 reports the composition of the sample, which consisted of 1225 firm years from 245 firms in the S&P BSE 500 index covering the period 2014-2018. This study classifies the total 245 firms into 114 family firms and 131 non-family firms on the basis of family composite.
Table 3: Composition of the Sample FirmsFirms Firm years
Number Percent Number PercentTotal 245 100% 1715 100%Composition of the sample firms by ownership**Family firms 214 87.35 1498 87.35Non family firms 31* 12.65 217 12.65Composition of the sample firms by governance***Family firms 147 60 1029 60Non family firms 98 40 686 40Composition of the sample firms by management****Family firms 181 73.88 1267 73.88Non family firms 64 26.12 448 26.12Composition of the sample firms by family composite*****Family firms 114 46.53 798 46.53Non family firms 131 53.47 917 53.47
* Non family firms were 31 in 2010-2013 but 2014 onwards the number became 30 as Page Industries started falling in family firms instead of non-family firms due to change in ownership structure.** Ownership to the minimum extent of 10% in the hands of founding family (promoter or the descendant)*** Family member (promoter or descendant) as CEO (Chief Executive Officer)/MD (Managing Director) **** Number of directors (chairman or directors) on the board from a family (promoter or descendants). ***** If all the conditions with regard to ownership, governance and management are met
106
Asia-Pacific Management Accounting Journal, Volume 15 Issue 2
Univariate Analysis
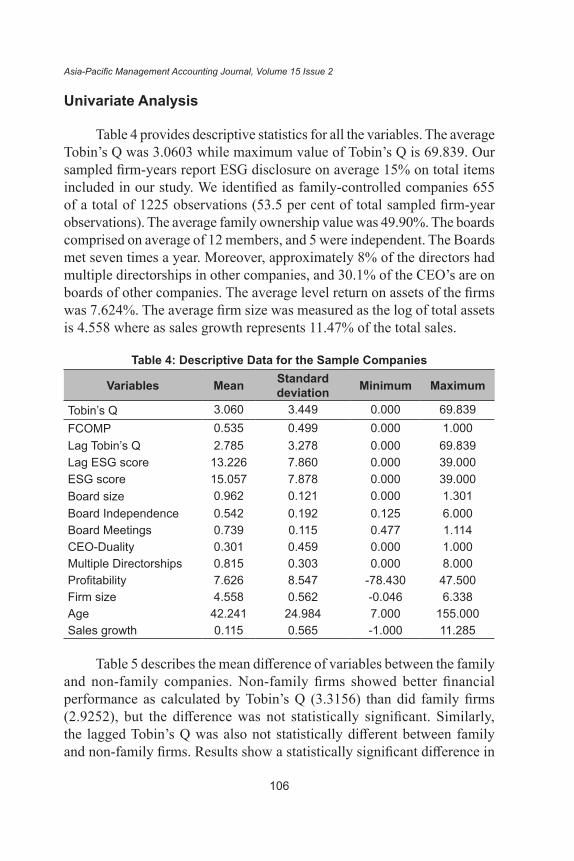
Table 4 provides descriptive statistics for all the variables. The average Tobin’s Q was 3.0603 while maximum value of Tobin’s Q is 69.839. Our sampled firm-years report ESG disclosure on average 15% on total items included in our study. We identified as family-controlled companies 655 of a total of 1225 observations (53.5 per cent of total sampled firm-year observations). The average family ownership value was 49.90%. The boards comprised on average of 12 members, and 5 were independent. The Boards met seven times a year. Moreover, approximately 8% of the directors had multiple directorships in other companies, and 30.1% of the CEO’s are on boards of other companies. The average level return on assets of the firms was 7.624%. The average firm size was measured as the log of total assets is 4.558 where as sales growth represents 11.47% of the total sales.
Table 4: Descriptive Data for the Sample Companies
Variables Mean Standard deviation Minimum Maximum
Tobin’s Q 3.060 3.449 0.000 69.839FCOMP 0.535 0.499 0.000 1.000Lag Tobin’s Q 2.785 3.278 0.000 69.839Lag ESG score 13.226 7.860 0.000 39.000ESG score 15.057 7.878 0.000 39.000Board size 0.962 0.121 0.000 1.301Board Independence 0.542 0.192 0.125 6.000Board Meetings 0.739 0.115 0.477 1.114CEO-Duality 0.301 0.459 0.000 1.000Multiple Directorships 0.815 0.303 0.000 8.000Profitability 7.626 8.547 -78.430 47.500Firm size 4.558 0.562 -0.046 6.338Age 42.241 24.984 7.000 155.000Sales growth 0.115 0.565 -1.000 11.285
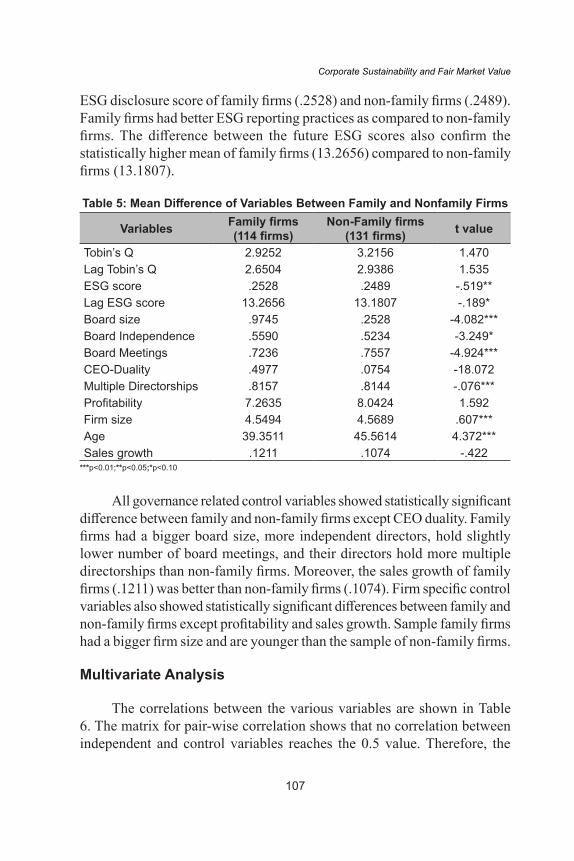
Table 5 describes the mean difference of variables between the family and non-family companies. Non-family firms showed better financial performance as calculated by Tobin’s Q (3.3156) than did family firms (2.9252), but the difference was not statistically significant. Similarly, the lagged Tobin’s Q was also not statistically different between family and non-family firms. Results show a statistically significant difference in
107
Corporate Sustainability and Fair Market Value
ESG disclosure score of family firms (.2528) and non-family firms (.2489). Family firms had better ESG reporting practices as compared to non-family firms. The difference between the future ESG scores also confirm the statistically higher mean of family firms (13.2656) compared to non-family firms (13.1807).
Table 5: Mean Difference of Variables Between Family and Nonfamily Firms
Variables Family firms(114 firms)
Non-Family firms(131 firms) t value
Tobin’s Q 2.9252 3.2156 1.470Lag Tobin’s Q 2.6504 2.9386 1.535ESG score .2528 .2489 -.519**Lag ESG score 13.2656 13.1807 -.189*Board size .9745 .2528 -4.082***Board Independence .5590 .5234 -3.249*Board Meetings .7236 .7557 -4.924***CEO-Duality .4977 .0754 -18.072Multiple Directorships .8157 .8144 -.076***Profitability 7.2635 8.0424 1.592Firm size 4.5494 4.5689 .607***Age 39.3511 45.5614 4.372***Sales growth .1211 .1074 -.422
***p<0.01;**p<0.05;*p<0.10
All governance related control variables showed statistically significant difference between family and non-family firms except CEO duality. Family firms had a bigger board size, more independent directors, hold slightly lower number of board meetings, and their directors hold more multiple directorships than non-family firms. Moreover, the sales growth of family firms (.1211) was better than non-family firms (.1074). Firm specific control variables also showed statistically significant differences between family and non-family firms except profitability and sales growth. Sample family firms had a bigger firm size and are younger than the sample of non-family firms.
Multivariate Analysis
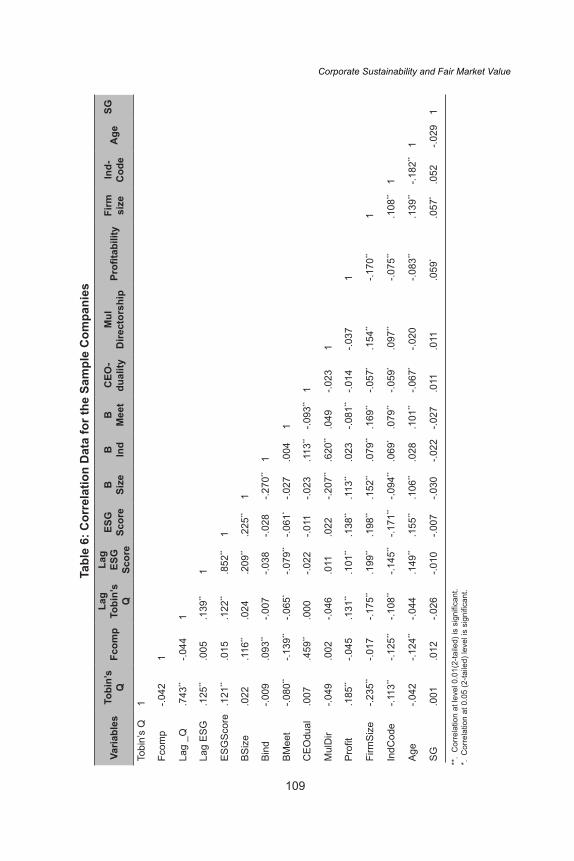
The correlations between the various variables are shown in Table 6. The matrix for pair-wise correlation shows that no correlation between independent and control variables reaches the 0.5 value. Therefore, the
108
Asia-Pacific Management Accounting Journal, Volume 15 Issue 2
statistical characteristics of the numerical variables indicate that our multivariate analysis did not contain significant multicollinearity problems. A multivariate regression analysis was used to examine the relationship between ESG disclosure and market value of the firms and to analyze whether this relationship is affected by the family and non-family context of business. To check for fixed-effects in the model, the likelihood ratio test was used. The statistical p-values firmly rejected the null hypothesis that the fixed effects represented strong cross-sectional and period effects. Therefore, for the current evaluation, the pooled OLS model was found to be inappropriate. The Hausman specification test was implemented to determine whether the fixed-effect or random-effect model is appropriate. The chi-square was significant (p = 0.000), therefore, the fixed-effect model was estimated for analysis.
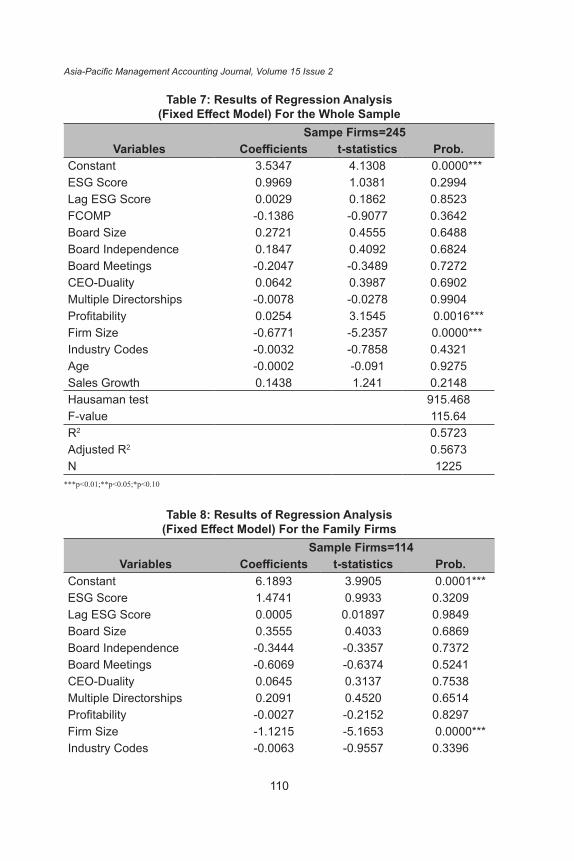
Table 7 presents the results of regression analysis for the whole sample (1225 firm-year observations). The results indicated that ESG reporting has insignificant impact on firm performance based on Tobin’s Q. The value of adjusted R square of total sample was equal to 56.73%. The model was a good fit as the independent variables explains approximately 56% variation in firm market value (Tobin’s Q). Neither family composite nor lagged ESG scores had a significant association with firm market value.
On splitting the sample into family and non-family firms on the basis of ownership and governance, the regression results for family as well as non-family firms did not document a significant association between firm market value and ESG disclosures.
Table 8 presents the results of ordinary least squares (OLS) regression estimating the effects of ESG disclosure of family firms on the firm market value, where ESG disclosure is exogenously determined. The regression model was a moderate fit as it explains 56% variation in the firm market value (dependent variable). The regression coefficient of lagged ESG disclosure score was positive but not statistically significant.
109
Corporate Sustainability and Fair Market ValueTa
ble
6: C
orre
latio
n D
ata
for t
he S
ampl
e C
ompa
nies
Varia
bles
Tobi
n’s
QFc
omp
Lag
Tobi
n’s
Q
Lag
ESG
Sc
ore
ESG
Sc
ore
B Size
B Ind
BM
eet
CEO
-du
ality
Mul
Dire
ctor
ship
Profi
tabi
lity
Firm
si
zeIn
d-C
ode
Age
SG
Tobi
n’s
Q1
Fcom
p-.0
421
Lag
_Q.7
43**
-.044
1
Lag
ESG
.125
**.0
05.1
39**
1
ESG
Scor
e.1
21**
.015
.122
**.8
52**
1
BSiz
e.0
22.1
16**
.024
.209
**.2
25**
1
Bind
-.009
.093
**-.0
07-.0
38-.0
28-.2
70**
1
BMee
t-.0
80**
-.139
**-.0
65*
-.079
**-.0
61*
-.027
.004
1
CEO
dual
.007
.459
**.0
00-.0
22-.0
11-.0
23.1
13**
-.093
**1
Mul
Dir
-.049
.002
-.046
.011
.022
-.207
**.6
20**
.049
-.023
1
Profi
t.1
85**
-.045
.131
**.1
01**
.138
**.1
13**
.023
-.081
**-.0
14-.0
371
Firm
Size
-.235
**-.0
17-.1
75**
.199
**.1
98**
.152
**.0
79**
.169
**-.0
57*
.154
**-.1
70**
1
IndC
ode
-.113
**-.1
25**
-.108
**-.1
45**
-.171
**-.0
94**
.069
*.0
79**
-.059
*.0
97**
-.075
**.1
08**
1
Age
-.042
-.124
**-.0
44.1
49**
.155
**.1
06**
.028
.101
**-.0
67*
-.020
-.083
**.1
39**
-.182
**1
SG.0
01.0
12-.0
26-.0
10-.0
07-.0
30-.0
22-.0
27.0
11.0
11.0
59*
.057
*.0
52-.0
291
**.
Cor
rela
tion
at le
vel 0
.01(
2-ta
iled)
is s
igni
fican
t.*.
Cor
rela
tion
at 0
.05
(2-ta
iled)
leve
l is
sign
ifica
nt.
110
Asia-Pacific Management Accounting Journal, Volume 15 Issue 2
Table 7: Results of Regression Analysis (Fixed Effect Model) For the Whole Sample
Sampe Firms=245Variables Coefficients t-statistics Prob.
Constant 3.5347 4.1308 0.0000***ESG Score 0.9969 1.0381 0.2994Lag ESG Score 0.0029 0.1862 0.8523FCOMP -0.1386 -0.9077 0.3642Board Size 0.2721 0.4555 0.6488Board Independence 0.1847 0.4092 0.6824Board Meetings -0.2047 -0.3489 0.7272CEO-Duality 0.0642 0.3987 0.6902Multiple Directorships -0.0078 -0.0278 0.9904Profitability 0.0254 3.1545 0.0016***Firm Size -0.6771 -5.2357 0.0000***Industry Codes -0.0032 -0.7858 0.4321Age -0.0002 -0.091 0.9275Sales Growth 0.1438 1.241 0.2148Hausaman test 915.468F-value 115.64R2 0.5723Adjusted R2 0.5673N 1225
***p<0.01;**p<0.05;*p<0.10
Table 8: Results of Regression Analysis (Fixed Effect Model) For the Family Firms
Sample Firms=114Variables Coefficients t-statistics Prob.
Constant 6.1893 3.9905 0.0001***ESG Score 1.4741 0.9933 0.3209Lag ESG Score 0.0005 0.01897 0.9849Board Size 0.3555 0.4033 0.6869Board Independence -0.3444 -0.3357 0.7372Board Meetings -0.6069 -0.6374 0.5241CEO-Duality 0.0645 0.3137 0.7538Multiple Directorships 0.2091 0.4520 0.6514Profitability -0.0027 -0.2152 0.8297Firm Size -1.1215 -5.1653 0.0000***Industry Codes -0.0063 -0.9557 0.3396
111
Corporate Sustainability and Fair Market Value
Sample Firms=114Variables Coefficients t-statistics Prob.
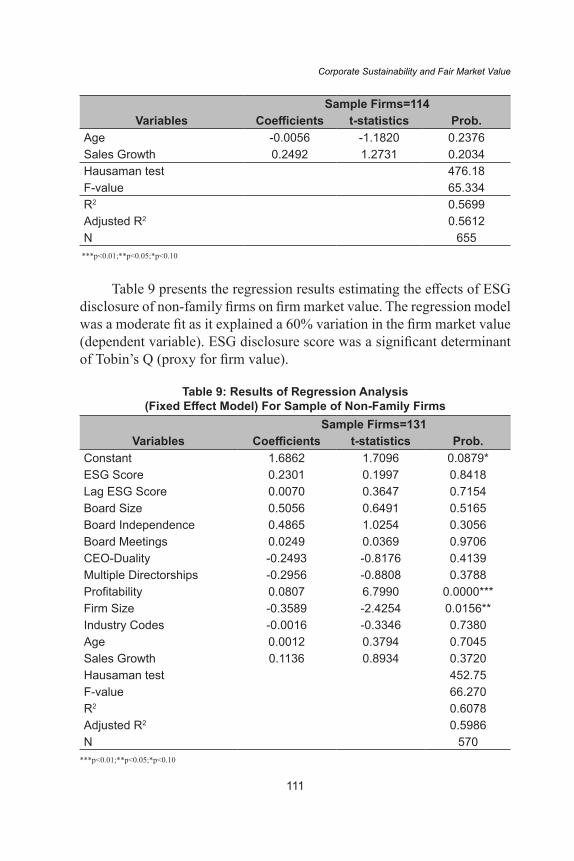
Age -0.0056 -1.1820 0.2376Sales Growth 0.2492 1.2731 0.2034Hausaman test 476.18F-value 65.334R2 0.5699Adjusted R2 0.5612N 655
***p<0.01;**p<0.05;*p<0.10
Table 9 presents the regression results estimating the effects of ESG disclosure of non-family firms on firm market value. The regression model was a moderate fit as it explained a 60% variation in the firm market value (dependent variable). ESG disclosure score was a significant determinant of Tobin’s Q (proxy for firm value).
Table 9: Results of Regression Analysis (Fixed Effect Model) For Sample of Non-Family Firms
Sample Firms=131Variables Coefficients t-statistics Prob.
Constant 1.6862 1.7096 0.0879*ESG Score 0.2301 0.1997 0.8418Lag ESG Score 0.0070 0.3647 0.7154Board Size 0.5056 0.6491 0.5165Board Independence 0.4865 1.0254 0.3056Board Meetings 0.0249 0.0369 0.9706CEO-Duality -0.2493 -0.8176 0.4139Multiple Directorships -0.2956 -0.8808 0.3788Profitability 0.0807 6.7990 0.0000***Firm Size -0.3589 -2.4254 0.0156**Industry Codes -0.0016 -0.3346 0.7380Age 0.0012 0.3794 0.7045Sales Growth 0.1136 0.8934 0.3720Hausaman test 452.75F-value 66.270R2 0.6078Adjusted R2 0.5986N 570
***p<0.01;**p<0.05;*p<0.10
112
Asia-Pacific Management Accounting Journal, Volume 15 Issue 2
CONCLUSION
The impact of ESG reporting on a company’s market value was examined in this paper for a sample of family and non-family firms. The study was based on a sample on 245 Indian firms included in the S&P BSE 500 index from 2014 to 2018 (1225 firm-year observations). The results demonstrated that family firms published more information on ESG reporting than non-family firms. These results are contrary to the results of Nekhili et al. (2017). Indian family firms are responsible investments.
Unlike Anderson and Reeb (2003) and Villalonga and Amit (2006) the Tobin’s Q was not found to be significantly different in case of family firms and nonfamily firms. This implies that market participants in India do not consider family status in their investment decisions.
Contrary to the results of related prior studies, this study did not find a significant association between firm value and ESG disclosure practices. Nekhili et al. (2017) conducted a study in France and found that Tobin’s q was positively related to ESG reporting in family companies and negatively related ESG disclosure in non-family companies. The results of this study for the total sample, family firms and non- family firms confirm unrelatedness between ESG disclosure index and firm market value (measured as Tobin’s Q). The family status of a firm does not affect the relationship between firm value and ESG disclosure practices. This implies that market participants in India do not consider sustainability disclosures while making investment decisions. Indian capital markets are unique in many ways and informational inefficiency is an important distinguishing feature.
This research also has some significant implications for management, theory, researchers, policymakers and users of financial statements. The findings of this study will redound to the benefit of the investors and managers considering that ESG plays an important role to corporations today. It would also be a promising path of research to compare ESG commitment of companies to the different stakeholders, including regulatory bodies, NGOs, community and employees. Companies disclose their ESG activities to different groups of stakeholders, which do not require the same information level (Aguilera et al., 2007; Aerts et al., 2008).
113
Corporate Sustainability and Fair Market Value
This study has several limitations. The influence of family participation may differ from one dimension to another (employee relations, climate, consumer aspects, public relationships, etc.). In some ESG ways, family businesses may be socially responsible but, in others, socially irresponsible. Future research should address this issue by creating a disclosure index that not only adds score for each ESG disclosure item but also reduces score by considering non-responsible actions reported by the firms.
REFERENCES
Abu Bakar, A. S., & Ameer, R. (2011). Readability of corporate social responsibility communication in Malaysia. Corporate Social Responsibility and Environmental Management, 18(1), 50-60.
Aerts, W., Cormier, D., & Magnan, M. (2008). Corporate environmental disclosure, financial markets and the media: An international perspective. Ecological Economics, 64(3), 643–659.
Aguilera, R. V., Rupp, D. E., Williams, C. A., & Ganapathi, J. (2007). Putting the S back in corporate social responsibility: A multilevel theory of social change in organizations. Academy of Management Review, 32(3), 836-863.
Amran, A., & Devi, S. S. (2008). The impact of government and foreign affiliate influence on corporate social reporting: The case of Malaysia. Managerial Auditing Journal, 23(4), 386-404.
Anderson, R. C., & Reeb, D. M. (2003). Founding-family ownership and firm performance: Evidence from the S&P 500. Journal of Finance, 58(3), 1301–1328.
Ang, J. S., Cole, R. A., & Lin, J. W. (2000). Agency costs and ownership structure. The Journal of Finance, 55(1), 81-106.
Arvidsson, S. (2010). Communication of corporate social responsibility: A study of the views of management teams in large companies. Journal of Business Ethics, 96(3), 339-354.
114
Asia-Pacific Management Accounting Journal, Volume 15 Issue 2
Azim Jr, H. A., Pruneri, G., Cocorocchio, E., Cinieri, S., Raviele, P. R., Bassi, S., & Peccatori, F. A. (2009). Rituximab in lymphocyte-predominant Hodgkin disease. Oncology, 76(1), 26-29.
Berrone, P., Cruz, C., Gomez-Mejia, L. R., & Larraza-Kintana, M. (2010). Socioemotional wealth and corporate responses to institutional pressures: Do family-controlled firms pollute less?. Administrative Science Quarterly, 55(1), 82-113.
Brooks, C., & Oikonomou, I. (2018). The effects of environmental, social and governance disclosures and performance on firm value: A review of the literature in accounting and finance. The British Accounting Review, 50(1), 1-15.
Burritt, R. L., & Schaltegger, S. (2010). Sustainability accounting and reporting: Fad or trend?. Accounting, Auditing & Accountability Journal, 23(7), 829-846.
Busch, T., & Hoffmann, V. H. (2011). How hot is your bottom-line? Linking carbon and financial performance. Business & Society, 50, 233-265.
Cahan, S. F., De Villiers, C., Jeter, D. C., Naiker, V., & Van Staden, C. J. (2016). Are CSR disclosures value relevant? Cross-country evidence. European Accounting Review, 25(3), 579-611.
Campbell, D., & Slack, R. (2008). Social and environmental narrative reporting: Analysts’ perceptions. Retrieved from https://research-repository.st-andrews.ac.uk/bitstream/handle/10023/3801/ACCA-2008-Social-Environmental.pdf?sequence=1&isAllowed=y
Cennamo, C., Berrone, P., Cruz, C., & Gomez–Mejia, L. R. (2012). Socioemotional wealth and proactive stakeholder engagement: Why family–controlled firms care more about their stakeholders. Entrepreneurship Theory and Practice, 36(6), 1153-1173.
Cerin, P. (2002). Communication in corporate environmental reports. Corporate Social Responsibility and Environmental Management, 9(1), 46–66.
115
Corporate Sustainability and Fair Market Value
Chang, K., Kim, I., & Li, Y. (2014). The heterogeneous impact of corporate social responsibility activities that target different stakeholders. Journal of Business Ethics, 125(2), 211-234.
Cormier, D., & Gordon, I. (2001). An examination of social and environmental reporting strategies. Accounting, Auditing & Accountability Journal, 14(5), 587–616.
Crisóstomo, V. L., de Souza Freire, F., & de Vasconcellos, F. C. (2011). Corporate social responsibility, firm value and financial performance in Brazil. Social Responsibility Journal, 7(2), 295-309.
Cuadrado-Ballesteros, B., Rodríguez-Ariza, L., & García-Sánchez, I. M. (2015). The role of independent directors at family firms in relation to corporate social responsibility disclosures. International Business Review, 24(5), 890-901.
Deegan, C. (2002). The legitimising effect of social and environmental disclosures – A theoretical foundation. Accounting, Auditing & Accountability Journal, 15(3), 282-311.
Deegan, C., & Haque, S. (2009). An exploration of corporate climate change-related governance practices and related disclosures: Evidence from Australia. The Accounting and Finance Association of Australia and New Zealand, pp. 1-30.
Dhaliwal, D. S., Radhakrishnan, S., Tsang, A., & Yang, Y. G. (2012). Nonfinancial disclosure and analyst forecast accuracy: International evidence on corporate social responsibility disclosure. The Accounting Review, 87(3), 723-759.
Du, S., Bhattacharya, C. B., & Sen, S. (2010). Maximizing business returns to corporate social responsibility (CSR): The role of CSR communication. International Journal of Management Reviews, 12(1), 8-19.
Dyer Jr, W. G., & Whetten, D. A. (2006). Family firms and social responsibility: Preliminary evidence from the S&P 500. Entrepreneurship Theory and Practice, 30(6), 785-802.
116
Asia-Pacific Management Accounting Journal, Volume 15 Issue 2
Ferns, B., Emelianova, O., & Sethi, S. P. (2008). In his own words: The effectiveness of CEO as spokesperson on CSR-sustainability issues–Analysis of data from the Sethi CSR Monitor©. Corporate Reputation Review, 11(2), 116-129.
Friede, G., Busch, T., & Bassen, A. (2015). ESG and financial performance: aggregated evidence from more than 2000 empirical studies. Journal of Sustainable Finance & Investment, 5(4), 210-233.
Giannarakis, G. (2014). The determinants influencing the extent of CSR disclosure. International Journal of Law and Management, 56(5), 393-416.
Gill, S., & Kaur, P. (2015). Family involvement in business and financial performance: A panel data analysis. Vikalpa, 40(4), 395-420.
Granata, D., & Chirico, F. (2010). Measures of value in acquisitions: Family versus nonfamily firms. Family Business Review, 23(4), 341–354.
Gray, R., Kouhy, R., & Lavers, S. (1995). Corporate social and environmental reporting: A review of the literature and a longitudinal study of UK disclosure. Accounting, Auditing and Accountability Journal, 8(2), 47-77.
Grougiou, V., Dedoulis, E., & Leventis, S. (2016). Corporate social responsibility reporting and organizational stigma: The case of “sin” industries. Journal of Business Research, 69(2), 905-914.
Guidry, R., & Patten, D. (2010). Market reactions to the first-time issuance of corporate sustainability reports: Evidence that quality matters. Sustainability Accounting and Policy Journal, 1(1), 33–50.
Hasseldine, J., Salama, A. I., & Toms, J. S. (2005). Quantity versus quality: The impact of environmental disclosures on the reputations of UK PLCs. The British Accounting Review, 37(2), 231-248.
Hidayat, W. W. (2011). The influence of size, return on equity, and leverage on the disclosure of the corporate social responsibility (CSR) in
117
Corporate Sustainability and Fair Market Value
manufacturing companies. International Journal of Education and Research, 5(8), 57-66.
Hillman, A., & Keim, G. (2001). Shareholder value, stakeholder management, and social issues: What’s the bottom line? Strategic Management Journal, 22(2), 125–140.
Holder-Webb, L., Cohen, J. R., Nath, L., & Wood, D. (2009). The supply of corporate social responsibility disclosures among US firms. Journal of Business Ethics, 84(4), 497-527.
Jizi, M. I., Salama, A., Dixon, R., & Stratling, R. (2014). Corporate governance and corporate social responsibility disclosure: Evidence from the US banking sector. Journal of Business Ethics, 125, 601–615.
Jones, S., Frost, G., Loftus, J., & van der Laan, S. (2007). An empirical examination of the market returns and financial performance of entities engaged in sustainability reporting. Australian Accounting Review, 17(41), 78-87.
Kalkanci, B., Ang, E., & Plambeck, E. L. (2016). Strategic disclosure of social and environmental impacts in a supply chain. In A. Atasu (Ed.), Environmentally responsible supply chains (pp. 223–239). Cham: Springer International Publishing.
Khan, A., Muttakin, M. B., & Siddiqui, J. (2013). Corporate governance and corporate social responsibility disclosures: Evidence from an emerging economy. Journal of Business Ethics, 114(2), 207-223.
Lu, W., & Taylor, M. E. (2016). Which factors moderate the relationship between sustainability performance and financial performance? A meta-analysis study. Journal of International Accounting Research, 15(1), 1-15.
Mahadeo, J., Hanuman, V., & Oogarah-Soobaroyen, T. (2011). A longitudinal study of corporate social disclosures in a developing economy. Journal of Business Ethics, 8(2), 47–77.
118
Asia-Pacific Management Accounting Journal, Volume 15 Issue 2
Malik, M. (2015). Value-enhancing capabilities of CSR: A brief review of contemporary literature. Journal of Business Ethics, 127(2), 419-438.
Margolis, J. D., & Walsh, J. P. (2003). Misery loves companies: Rethinking social initiatives by business. Administrative Science Quarterly, 48(2), 268-305.
Melo, T., & Garrido‐Morgado, A. (2012). Corporate reputation: A combination of social responsibility and industry. Corporate Social Responsibility and Environmental Management, 19(1), 11-31.
Menassa, E. (2010). Corporate social responsibility. Journal of Applied Accounting Research, 11(1), 4-23.
Murthy, V., & Abeysekera, I. (2008). Corporate social reporting practices of top Indian software firms. Australasian Accounting, Business and Finance Journal, 2(1), 36-59.
Nekhili, M., Nagati, H., Chtioui, T., & Rebolledo, C. (2017). Corporate social responsibility disclosure and market value: Family versus nonfamily firms. Journal of Business Research, 77, 41-52.
Orlitzky, M. (2013). Corporate social responsibility, noise, and stock market volatility. Academy of Management Perspectives, 27(3), 238-254.
Orlitzky, M., Schmidt, F. L., & Rynes, S. L. (2003). Corporate social and financial performance: A meta-analysis. Organization Studies, 24(3), 403-441.
Othman, S., Darus, F., & Arshad, R. (2011). The influence of coercive isomorphism on corporate social responsibility reporting and reputation. Social Responsibility Journal, 7(1), 118-135.
Owen, D. (2005). CSR after Enron: A role for the academic accounting profession?. European Accounting Review, 14(2), 395-404.
Panwar, R., Paul, K., Nybakk, E., Hansen, E., & Thompson, D. (2014). The legitimacy of CSR actions of publicly traded companies versus family-owned companies. Journal of Business Ethics, 125(3), 481–496.
119
Corporate Sustainability and Fair Market Value
Park, S. Y., & Levy, S. E. (2014). Corporate social responsibility: Perspectives of hotel frontline employees. International Journal of Contemporary Hospitality Management, 26(3), 332-348.
Perks, K. J. (2015). The influence of interactive, non-interactive, implicit and explicit CSR communication on young adults’ perception of UK supermarkets’ corporate brand image and reputation. Corporate Communications: An International Journal, 20(2), 178-195.
Perks, K. J., Farache, F., Shukla, P., & Berry, A. (2013). Communicating responsibility-practicing irresponsibility in CSR advertisements. Journal of Business Research, 66(10), 1881-1888.
Rahman, S. (2011). Evaluation of definitions: Ten dimensions of corporate social responsibility. World Review of Business Research, 1(1), 166-176.
Reverte, C. (2009). Determinants of corporate social responsibility disclosure ratings by Spanish listed firms. Journal of Business Ethics, 88(2), 351-366.
Richardson, A. J., & Welker, M. (2001). Social disclosure, financial disclosure and the cost of equity capital. Accounting, Organizations and Society, 26(7-8), 597-616.
Rim, H., Yang, S. U., & Lee, J. (2016). Strategic partnerships with nonprofits in corporate social responsibility (CSR): The mediating role of perceived altruism and organizational identification. Journal of Business Research, 69(9), 3213-3219.
Saleh, M., Zulkifli, N., & Muhamad, R. (2010). Corporate social responsibility disclosure and its relation on institutional ownership. Managerial Auditing Journal, 25(6), 591 – 613.
Salvato, C., & Melin, L. (2008). Creating value across generations in family-controlled businesses: The role of family social capital. Family Business Review, 21(3), 259–276.
Scholtens, B. (2009). Corporate social responsibility in the international banking industry. Journal of Business Ethics, 86(2), 159-175.
120
Asia-Pacific Management Accounting Journal, Volume 15 Issue 2
Siregar, S. V., & Bachtiar, Y. (2010). Corporate social reporting: Empirical evidence from Indonesia Stock Exchange. International Journal of Islamic and Middle Eastern Finance and Management, 3(3), 241-252.
Stanley, L. J., & McDowell, W. (2014). The role of interorganizational trust and organizational efficacy in family and nonfamily firms. Journal of Family Business Strategy, 5(3), 264-275.
Tagiuri, R., & Davis, J. (1996). Bivalent attributes of the family firm. Family Business Review, 9(2), 199-208.
Thorne, L., Mahoney, L. S., Gregory, K., & Convery, S. (2017). A comparison of Canadian and US CSR strategic alliances, CSR reporting, and CSR performance: Insights into implicit–explicit CSR. Journal of Business Ethics, 143(1), 85-98.
Unerman, J., O’Dwyer, B., Gray, R., Bebbington, J., & Collison, D. (2006). NGOs, civil society and accountability: Making the people accountable to capital. Accounting, Auditing & Accountability Journal, 19(3), 319-348.
Villalonga, B., & Amit, R. (2006). How do family ownership, control and management affect firm value? Journal of Financial Economics, 80(2), 385–417.
Wang, K. T., & Li, D. (2015). Market reactions to the first-time disclosure of corporate social responsibility reports: Evidence from China. Journal of Business Ethics, 138(4), 661–682.
Weinhofer, G., & Hoffmann, V. H. (2010). Mitigating climate change–how do corporate strategies differ?. Business Strategy and the Environment, 19(2), 77-89.
Zellweger, T. M., Kellermanns, F. W., Eddleston, K. A., & Memili, E. (2012). Building a family image: How family firms capitalize on their family ties. Journal of Family Business Strategy, 3(4), 239–250.
121
Corporate Sustainability and Fair Market Value
APPENDIX A: ESG INDEX
DISCLOSURE CATEGORIESI-Social Performance1. Promotion of education through donations, scholarships2. Sponsorship of public health projects/medical camps3. Establishment/maintenance of educational institutions4. Supporting the development of local industries or community programs and
activities.5. Participation in social government schemes and campaignsII-Environmental Performance1. Environmental awards Received2. Environmental programs Response to environmental audits3. Environmental Awareness Training4. Presence of Environmental Management System (EMS)5. Amount spent on environmental protectionIII-Sustainable Practices 1. Prevention, reduction and fixing of air/water/soil emissions 2. Recycling of waste material3. Energy consumption and measures to improve energy efficiency-use of
renewable energy4. Consumption of raw materials and measures taken to improve the efficiency
of raw material use5. Measures to reduce greenhouse gas emissionsIV- Governance1. Board size2. Board Independence3. Board Meetings4. CEO-Duality5. Multiple Directorships
Source: Developed from Deegan and Haque (2009), Weinhofer and Hoffmann (2010) studies and authors’ own compilation