Embed Size (px)
Citation preview

1
CORPORATE SOFTWARE RISK REDUCTION
IN A FORTUNE 500 COMPANY
Version 7.0 May 4, 2013
Abstract
As a result of several major software failures the chairman of a Fortune 500
manufacturing company decided to embark on a corporate-wide software risk reduction
program. To lead this effort a national talent search was performed and top software
executives from companies such as IBM and General Electric were brought on board to
lead the program.
The risk reduction activities took place over a four-year period and can serve as a model
for other large corporations that are dissatisfied with canceled software projects, schedule
delays, cost overruns, litigation from disgruntled clients, and other endemic software
problems.
Capers Jones, Vice President and CTO
Namcook Analytics LLC
Email: [email protected]
Web: www.Namcook.com
Copyright © 2011-2013 by Capers Jones.
All rights reserved.
2
EXECUTIVE SUMMARY
Due to schedule delays, cost overruns, and several canceled software projects the
Chairman of a Fortune 500 company decided to bring in outside experts to identify major
software risks and develop solutions for those risks.
Initially the new risk abatement team reported directly to the Chairman, which is unusual
but effective. The team visited more than 20 software locations in a dozen countries and
met with many software managers and technical personnel.
As the risk abatement program moved into implementation, the head of the team became
a corporate vice president and reported to the corporate chief technology officer (CTO).
The Chairman remained an active participant and received frequent updates about
progress of the risk abatement program.
The corporation was a conglomerate that had grown by acquisition. The major software
groups did not know much about other groups elsewhere in the company. Many of the
individual units were sophisticated in dealing with local projects. However large and
complex applications that required multi-site coordination and cooperation were not
usually successful.
The risk team identified a number of areas where improvements would be beneficial both
for the individual units and for large multi-unit applications. Among the proposed
solutions were establishing corporate licenses for tools and methods; standardized quality
measurements; and the introduction of pre-test quality control such as inspections and
static analysis.
The risk abatement program operated for four years and achieved significant
improvements in quality, productivity, and elimination of cost and schedule overruns.
This report describes the method and operation of the risk abatement program and
summarizes the results. The final section of this report provides quantified data on the
economic value of corporate software process improvement programs.

3
INTRODUCTION
Some years ago the chairman of a large manufacturing conglomerate was troubled by
several major software failures of projects that were terminated without being completed.
He was also troubled by the dissatisfaction expressed by customers in the quality of the
software the corporation produced. He was further dissatisfied by the inability of
software executives to explain why the problems occurred, and what might be done to
eliminate them.
At the time the corporation was about to embark on a very innovative new product line
that would include sophisticated hardware components that were significantly ahead of
competitive offerings and contained many unique and patented features. But in order to
be effective in the market, the software that operated the products needed to be at state of
the art levels in terms of quality, reliability, and security.
The chairman had serious doubts as to whether the software components would be able to
meet the same quality and reliability criteria as the hardware components. Without top-
quality software the product lines could not be successful and might not operate well
enough to even be marketed.
Given the track record of the company over the past five years, the chairman was also
concerned that even if the software could be built well enough to operate effectively, it
might be several years late and well over budget.
The chairman was both energetic and far sighted, and he recognized that software
throughout the corporation needed to be converted from a liability into an asset.
Following are discussions of the features of the corporate risk reduction program.
A National Talent Search
For a variety of reasons the chairman felt that solving the corporation’s software
problems required expertise greater than what was available internally. To that end he
commissioned a national talent search for software executives who had been able to bring
large and complex software products successfully to market.
An executive from IBM was selected to lead the corporate risk reduction program, but
executives from other groups such as General Electric, the Air Force, and other
enterprises were soon recruited.

4
Fact Finding and Software Assessments
At the time the risk reduction program started, the corporation had about 250,000
employees working in more than 20 countries. But no one knew how many software
employees the corporation had.
In part this was due to the use of ambiguous job titles such as “member of the technical
staff” in the more technical units. In part it was due to the fact that while financial
reports from all units were consolidated, human resource data was largely local.
One of the first tasks of the risk-reduction team was to quickly visit all corporate
locations that built software and carry out a census of software personnel, methodologies,
tools, and other relevant information.
All of the findings were useful and some were surprising to the chairman and other
officers. Here are a few typical data points.
Corporate software employment was about 10,000 total personnel:
Development 3,000
Maintenance 4,000
Support 2,000
Management 1,000
TOTAL 10,000
These workers were divided among 50 locations in 20 countries. The top location had
about 1,200 software personnel. Several locations had about 500 software personnel, and
the remainder of the locations had smaller groups of 100 or more, with the very smallest
location having only 10 software personnel.
The corporate portfolio of software applications contained about 5,400 applications:
Internal Applications
IT 1,500
Systems 900
Embedded 600
Support 400
Manufacturing 400
SUB TOTAL 3,800
COTS Applications 1,300
Open source 100
User developed 200
SUBTOTAL 1,600
5
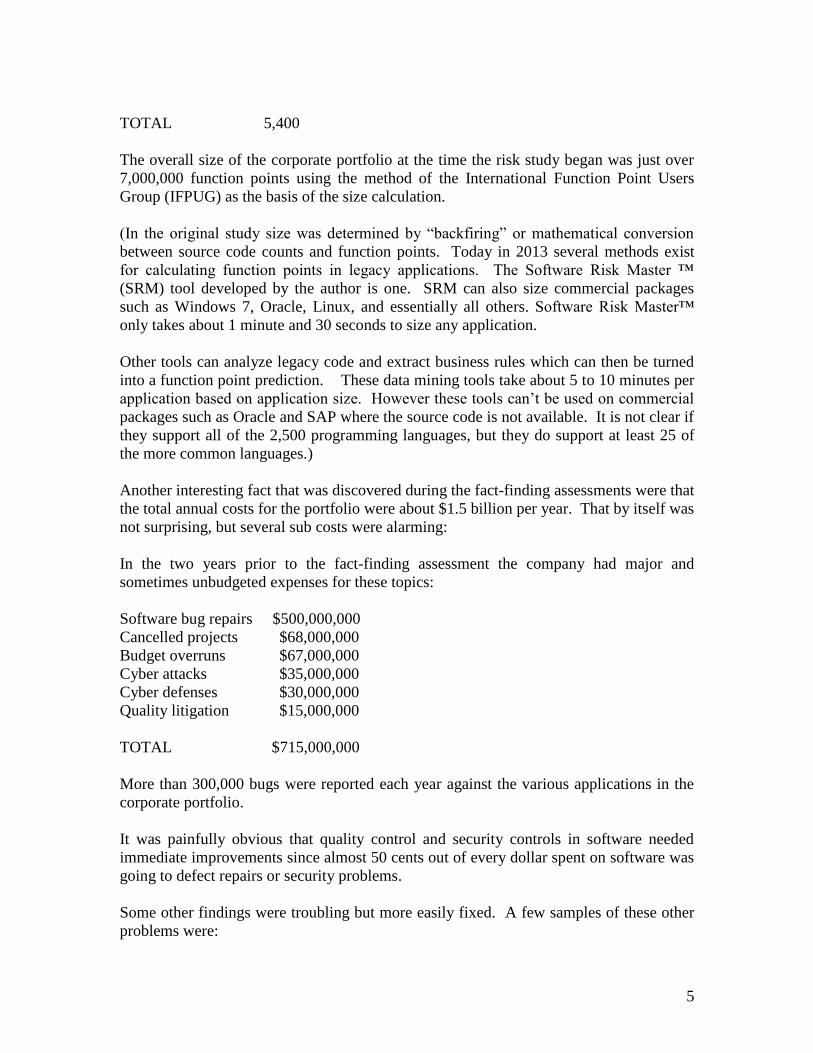
TOTAL 5,400
The overall size of the corporate portfolio at the time the risk study began was just over
7,000,000 function points using the method of the International Function Point Users
Group (IFPUG) as the basis of the size calculation.
(In the original study size was determined by “backfiring” or mathematical conversion
between source code counts and function points. Today in 2013 several methods exist
for calculating function points in legacy applications. The Software Risk Master ™
(SRM) tool developed by the author is one. SRM can also size commercial packages
such as Windows 7, Oracle, Linux, and essentially all others. Software Risk Master™
only takes about 1 minute and 30 seconds to size any application.
Other tools can analyze legacy code and extract business rules which can then be turned
into a function point prediction. These data mining tools take about 5 to 10 minutes per
application based on application size. However these tools can’t be used on commercial
packages such as Oracle and SAP where the source code is not available. It is not clear if
they support all of the 2,500 programming languages, but they do support at least 25 of
the more common languages.)
Another interesting fact that was discovered during the fact-finding assessments were that
the total annual costs for the portfolio were about $1.5 billion per year. That by itself was
not surprising, but several sub costs were alarming:
In the two years prior to the fact-finding assessment the company had major and
sometimes unbudgeted expenses for these topics:
Software bug repairs $500,000,000
Cancelled projects $68,000,000
Budget overruns $67,000,000
Cyber attacks $35,000,000
Cyber defenses $30,000,000
Quality litigation $15,000,000
TOTAL $715,000,000
More than 300,000 bugs were reported each year against the various applications in the
corporate portfolio.
It was painfully obvious that quality control and security controls in software needed
immediate improvements since almost 50 cents out of every dollar spent on software was
going to defect repairs or security problems.
Some other findings were troubling but more easily fixed. A few samples of these other
problems were:

6
There were no corporate licenses or purchase agreements with vendors of tools or
methods. Each location or business unit negotiated their own contracts, so no one
was gaining benefits from economies of scale.
There was no corporate and very few unit measurement programs for either
quality or productivity. No one at the corporate level had any idea of how the
corporation compared to other similar corporations, or even how the operating
units inside the corporation compared to each other.
More than 75 different programming languages were in use throughout the
corporation in random patterns.
More than 25 different development methodologies were in use throughout the
corporation in random patterns.
More than 600 tools from more than 75 vendors were in use in random patterns.
IBM was the largest single vendor because of the numbers of mainframes, but
dozens of other companies also had contracts and provided products and services
including SAP, Oracle, PeopleSoft, Computer Associates, Computer Sciences
Corporation, MicroFocus, Mercury, and many others. Each unit had their own
contracts rather than having a corporate contract that would provide economies of
scale.
The number of days of training provided to software personnel and software
managers ranged from 0 to 3 days per year per person.
Software personnel number had been increasing at 5% per year for the past five
years, with no sign of any planned reductions in the future.
After the risk reduction team finished with the fact finding assessments, the next step was
to prepare a presentation for the chairman, the board, and senior executives to discuss the
logistics of risk reduction and process improvement.

7
The Initial Report to the Chairman
Since the chairman had a strong financial and accounting background he understood and
demanded accurate quantified data. One of the reasons he brought in outside executives
to help in the risk reduction program was because there was a shortage of accurate
quantified data about software in every aspect: personnel, quality, schedules, costs,
occupation groups, and every other measurable topic either had no data at all or no
reliable data.
The basic message to the chairman and the other corporate executives was essentially
this:
“You have a current software headcount of about 10,000 people. The headcount has
been growing at 5% per year and will continue to grow at that rate for at least five more
years unless you intervene.
In round numbers about 50 cents out of every dollar you spend on software goes to defect
removal, canceled projects, or recovering from cyber attacks. Your quality control
methods lag the state of the art, as do your security methods.
If the company continues on the current path in nine years you will have 15,000 software
people and in 15 years you will have 20,000 software people. You will still be spending
50 cents out of every dollar on defect repairs and security problems.
If you fix quality now by using inspections, static analysis, quality measurements, and
better test methods and some additional tools you can free up about 40% of your current
software work force for other tasks. These personnel can either reduce the corporate
backlog to zero or they can assist on critical projects that might be short handed.
If you fix your quality and security problems you can stop increasing software personnel
and reach a steady state at about 9,000 people, which is all the corporation really needs
to support its overall population and growth plans.
If you fix your quality and security problems you will not have to worry that the software
side of the company is less competent than the hardware side. They will both be at state
of the art levels. This means that future hybrid products will not be held back by software
problems.
It will cost about $15,000,000 the first year to improve quality, but you will get a positive
return by the end of the second year. Quality can be improved by more than 25% per
calendar year for at least five years in a row, and it is the only effective place to start
because defect repairs are your major cost driver at the corporate level.”
8
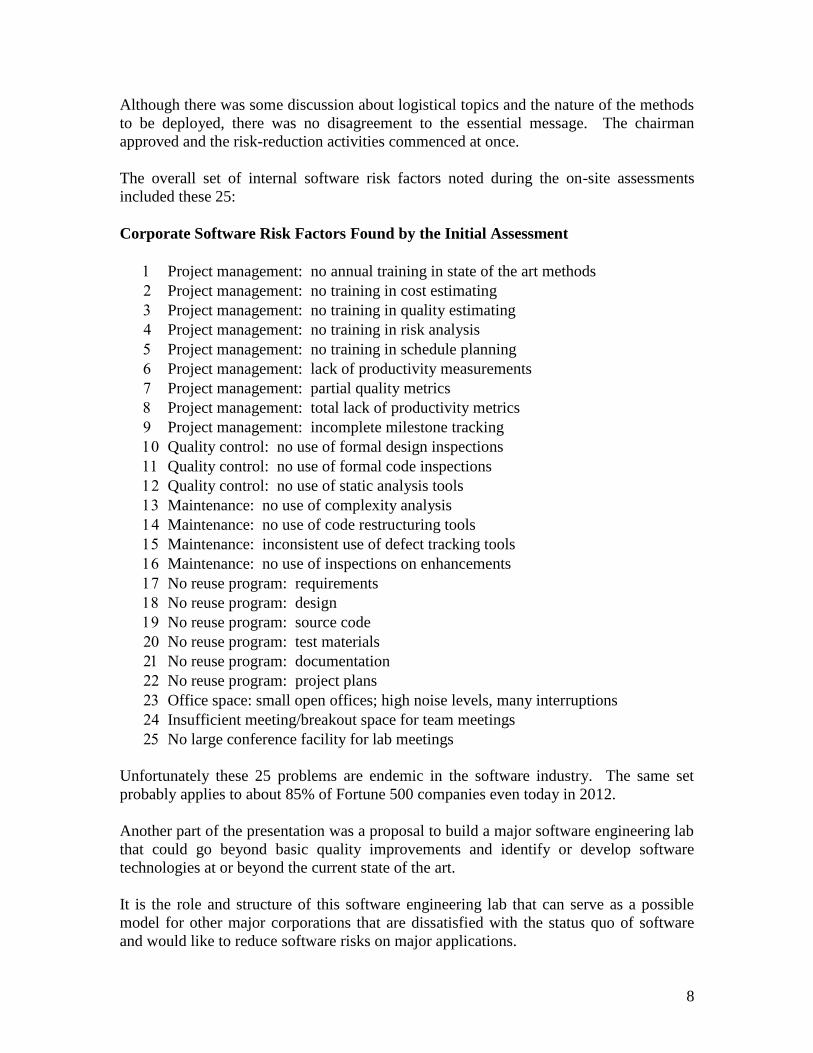
Although there was some discussion about logistical topics and the nature of the methods
to be deployed, there was no disagreement to the essential message. The chairman
approved and the risk-reduction activities commenced at once.
The overall set of internal software risk factors noted during the on-site assessments
included these 25:
Corporate Software Risk Factors Found by the Initial Assessment
Project management: no annual training in state of the art methods
Project management: no training in cost estimating
Project management: no training in quality estimating
Project management: no training in risk analysis
Project management: no training in schedule planning
Project management: lack of productivity measurements
Project management: partial quality metrics
Project management: total lack of productivity metrics
Project management: incomplete milestone tracking
Quality control: no use of formal design inspections
Quality control: no use of formal code inspections
Quality control: no use of static analysis tools
Maintenance: no use of complexity analysis
Maintenance: no use of code restructuring tools
Maintenance: inconsistent use of defect tracking tools
Maintenance: no use of inspections on enhancements
No reuse program: requirements
No reuse program: design
No reuse program: source code
No reuse program: test materials
No reuse program: documentation
No reuse program: project plans
Office space: small open offices; high noise levels, many interruptions
Insufficient meeting/breakout space for team meetings
No large conference facility for lab meetings
Unfortunately these 25 problems are endemic in the software industry. The same set
probably applies to about 85% of Fortune 500 companies even today in 2012.
Another part of the presentation was a proposal to build a major software engineering lab
that could go beyond basic quality improvements and identify or develop software
technologies at or beyond the current state of the art.
It is the role and structure of this software engineering lab that can serve as a possible
model for other major corporations that are dissatisfied with the status quo of software
and would like to reduce software risks on major applications.

9
The Corporate Risk Reduction Strategy: Fix Quality First
Because quality control and security control were visible weaknesses they needed to be
fixed first. That brings up an interesting question: how do you get a disparate corporate
organization of 10,000 people scattered among some 50 locations to adopt better quality
methods and also start quality measurements?
One of the first steps was to send out several pathfinders to the major software locations.
These pathfinders gave presentations to senior management at the units which mirrored
the corporate message:
“You have X number of people and they are increasing at 5% per year. You are spending
half of your budget on bug repairs and that will continue forever unless we can introduce
better quality methods.
We are not trying to force inspections, static analysis, and other new quality methods on
your teams against their wills. We would like you to try the methods on an experimental
basis and let the teams decide if the results are useful
If your teams do like the methods we can then provide local training for everyone. We
also have corporate licensing agreements that will give you a substantial discount
compared to your local license agreements for a number of tools and some methods as
well.
If your teams don’t like the methods they don’t have to use them, but you will be
responsible for your total unit achieving the same quality levels as the units that do use
them.”
One of the best ways of introducing new methodologies, and especially methods such as
inspections that require training, is to treat them as experiments with the understanding
that if the teams don’t like the results they won’t be forced to continue. As it happens
inspections are so effective that the teams almost always do want to continue.
If a few teams reject the idea at first, they soon notice that everyone is using the new
methods and getting great results, so resistance does not last for long.
Measurement is a more difficult problem. Companies are very political and operating
units often have rivalries with other operating units. A consolidated measurement
program that tracked every unit using the same metrics is an alarming idea. The local
managers are all afraid that they won’t look as good as their rivals, so they will resist any
attempt to measure performance. Their usual argument runs along these lines:
“Measurement is very important and of course I support it. But our work is so different
and so complex that I don’t think it will work for us….”

10
Since the risk-reduction team had no direct authority over unit managers we had no way
of insisting that measures take place at the individual units. However the chairman had a
personal interest in measurements and he made several calls to reluctant unit managers
that convinced them to participate in the new corporate measurement program.
A final task for the pathfinders was to ask that each unit with a software group appoint a
local software technology interface point that would communicate with the new software
research group that was being formed. The reason for this is to have a firm contact point
for mutual exchanges of technical and logistical information.
The corporate team would pass on new information about corporate licenses for tools and
methodologies, and the unit reps would let the corporate group know about tools and
methods that they might like to have evaluated for possible corporate licensing.
The overall targets for the corporate risk reduction program included these 20 topics that
spanned a four-year risk reduction time span:
Four-Year Software Risk Reduction Targets
Set aside 12 days a year for training in software management topics
Set aside 10 days a year for training in software process improvement topics
Establish local software “centers for excellence” in major software units
Budget $10,000 per capita for improved tools and training
Achieve Level 3 status on the SEI CMM maturity scale
No more than 5% difference between estimated schedules and real delivery dates
No more than 5% difference between estimated costs and actual costs
Raise defect removal efficiency above 97% as the corporate average
Reduce defect potentials below 3.0 per function point as the corporate average
Reduce development schedules or intervals by 50% from requirements until delivery
Raise development productivity rates by more than 50%
Reduce development costs by more than 40%
Reduce maintenance costs by 50% for first two years of deployment
Achieve more than 50% reusability by volume for design, code, and test artifacts
Establish an in-house measurement department in every major software unit
Publish monthly reports on software quality and defect removal
Publish overall results in an annual “state of the art” report for group executives
Change the office layouts to provide more small meeting rooms
Attempt to improve the soundproofing of development office space
Experiment with large-scale in-house webinars in place of lab meetings
As can be seen the corporate risk reduction strategy covered a wide range of software
issues. However since software engineering is not very sophisticated in 2012, it is
necessary to deal with a wide variety of endemic problems.
11
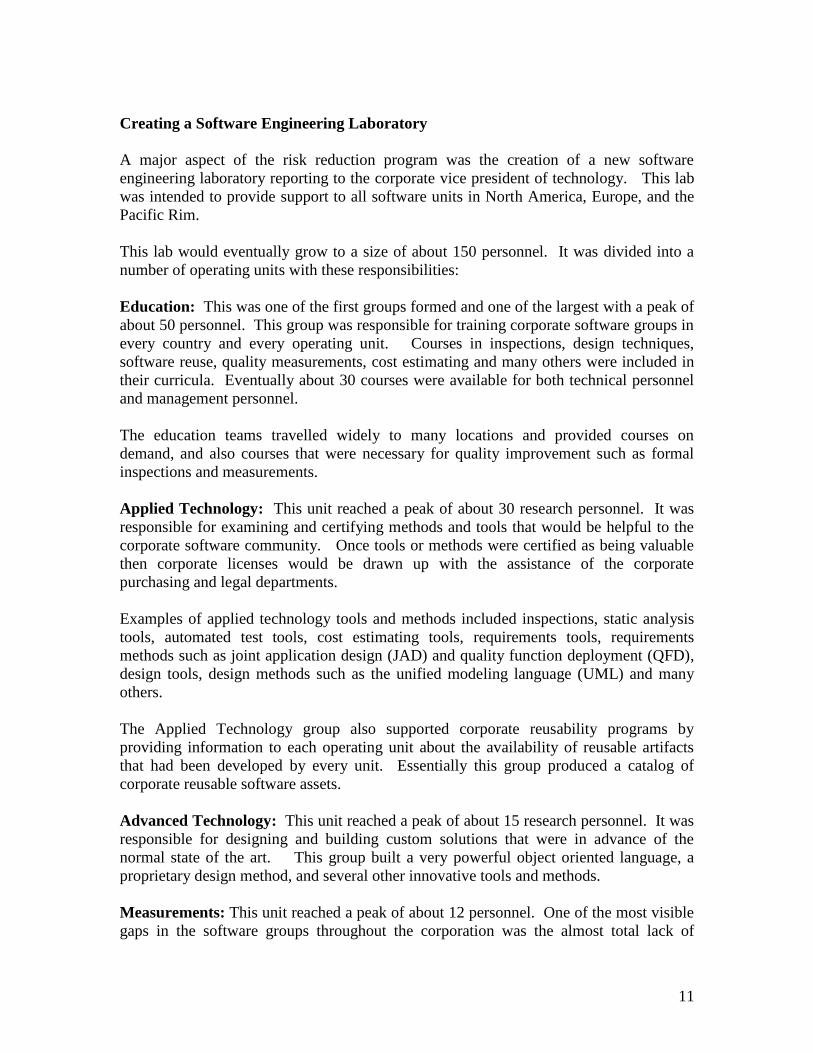
Creating a Software Engineering Laboratory
A major aspect of the risk reduction program was the creation of a new software
engineering laboratory reporting to the corporate vice president of technology. This lab
was intended to provide support to all software units in North America, Europe, and the
Pacific Rim.
This lab would eventually grow to a size of about 150 personnel. It was divided into a
number of operating units with these responsibilities:
Education: This was one of the first groups formed and one of the largest with a peak of
about 50 personnel. This group was responsible for training corporate software groups in
every country and every operating unit. Courses in inspections, design techniques,
software reuse, quality measurements, cost estimating and many others were included in
their curricula. Eventually about 30 courses were available for both technical personnel
and management personnel.
The education teams travelled widely to many locations and provided courses on
demand, and also courses that were necessary for quality improvement such as formal
inspections and measurements.
Applied Technology: This unit reached a peak of about 30 research personnel. It was
responsible for examining and certifying methods and tools that would be helpful to the
corporate software community. Once tools or methods were certified as being valuable
then corporate licenses would be drawn up with the assistance of the corporate
purchasing and legal departments.
Examples of applied technology tools and methods included inspections, static analysis
tools, automated test tools, cost estimating tools, requirements tools, requirements
methods such as joint application design (JAD) and quality function deployment (QFD),
design tools, design methods such as the unified modeling language (UML) and many
others.
The Applied Technology group also supported corporate reusability programs by
providing information to each operating unit about the availability of reusable artifacts
that had been developed by every unit. Essentially this group produced a catalog of
corporate reusable software assets.
Advanced Technology: This unit reached a peak of about 15 research personnel. It was
responsible for designing and building custom solutions that were in advance of the
normal state of the art. This group built a very powerful object oriented language, a
proprietary design method, and several other innovative tools and methods.
Measurements: This unit reached a peak of about 12 personnel. One of the most visible
gaps in the software groups throughout the corporation was the almost total lack of

12
effective productivity and quality measurements. The most unique production of the
measurement group was an annual report which was created at the same calendar time as
the corporate annual report for shareholders; i.e. in the first quarter after the end of a
fiscal year.
The annual software report summarized progress for every major operating unit;
compared current year results to prior year results; and discussed plans for the next year.
The annual report was distributed to the CEO, chairman, operating unit presidents, and all
C level executives at the CIO, CTO level and above. This report was a showcase for
progress and demonstrated that investment in better software methods paid valuable
dividends.
Because this annual report was a critical part of the corporate software risk reduction
program, here are some of the topics it contained:
Demographic data of software employment in every operating unit
Benchmark results for annual productivity by operating unit and type of software
Benchmark results for annual quality by operating unit and type of software
Annual volumes of customer-reported defects sorted by several categories
Annual volumes of identified security flaws and security attacks
Annual expenses for defect repairs
Annual expenses for security problems
Comparisons of current year results to prior year results
Predictions of future year results compared to current year results
Every company should produce such an annual report for executives. Although much of
the data is proprietary and confidential, these annual reports are among the most effective
tools for long-range risk reductions.
Communications: This unit reached a peak of about 20 people and fulfilled a variety of
functions. They sponsored two large conferences per year. One conference was
technical in nature and only open to corporate software personnel. This conference
discussed proprietary technologies. The second conference was more public and selected
customers, distinguished academics, and even some competitors were invited. This
second conference was intended to be a showcase that illustrated the corporate
commitment to state of the art software engineering practices.
In addition to conferences the communications group published monthly newsletters;
initiated a series of technical reports by software unit authors, and created a very
sophisticated software journal that was modeled after Scientific American Magazine.
This magazine had a two-fold purpose: 1) To provide a suitable venue for innovative
information created by top researchers within the company; 2) To impress both clients
and competitors with the software engineering expertise of the corporation.
This two-fold purpose attracted new clients and also made it easy to attract top-gun
software engineers away from competitors.

13
To encourage employees in various operating units to publish, a corporate policy was put
in place that all royalties for technical books and articles published by corporate
employees went to the employees. If the company tried to keep royalties under the
Draconian terms of many employment agreements, no one would be motivated to write.
Allowing authors to keep royalties is the policy adopted by most of the really innovative
high technology companies.
In addition, the communications group could help with technical production issues such
as graphics production which not all authors are comfortable doing.
Administration: Like every operating unit the software engineering laboratory needed
financial personnel, human resource personnel, secretarial support, and other standard
logistical topic. This group fluctuated in size as demands increased.

14
Results of the Corporate Risk Reduction Program
Although there was some resistance to change at the beginning of the program, it soon
began to be accepted because the quality improvements occurred within the first few
months and continued to get better for four years.
Since quality improvements were the initial and primary target of the risk reduction
program, here are the approximate results for the program over a four-year period:
Table 1: Four Year Improvement from Inspections and Testing Upgrades
Defect Defect Delivered Percent
Baseline Potential Removal Defects Improvement
Month 0 5.25 83% 0.89 0.00%
Month 12 5.15 87% 0.67 75.01%
Month 24 4.65 92% 0.37 55.56%
Month 36 4.30 96% 0.17 46.24%
Month 48 3.60 98% 0.07 41.86%
(Note that table 1 expresses data using IFPUG function points.)
There were also improvements in development productivity, maintenance productivity,
customer satisfaction, and team morale.
After four years of progress with the corporate risk reduction and process improvement
program there was a major corporate change. The corporation sold all of the high-
technology business and their operating units and laboratories to another company.
About 50% of total corporate personnel were part of this divestiture.
The acquiring company decided to keep only the manufacturing facilities and close the
research labs since they already had similar research labs of their own. As a result the
software engineering research lab and several other technical labs in both the U.S. and
Europe were closed.
However informal contacts with the operating units showed continued success from the
risk reduction program.
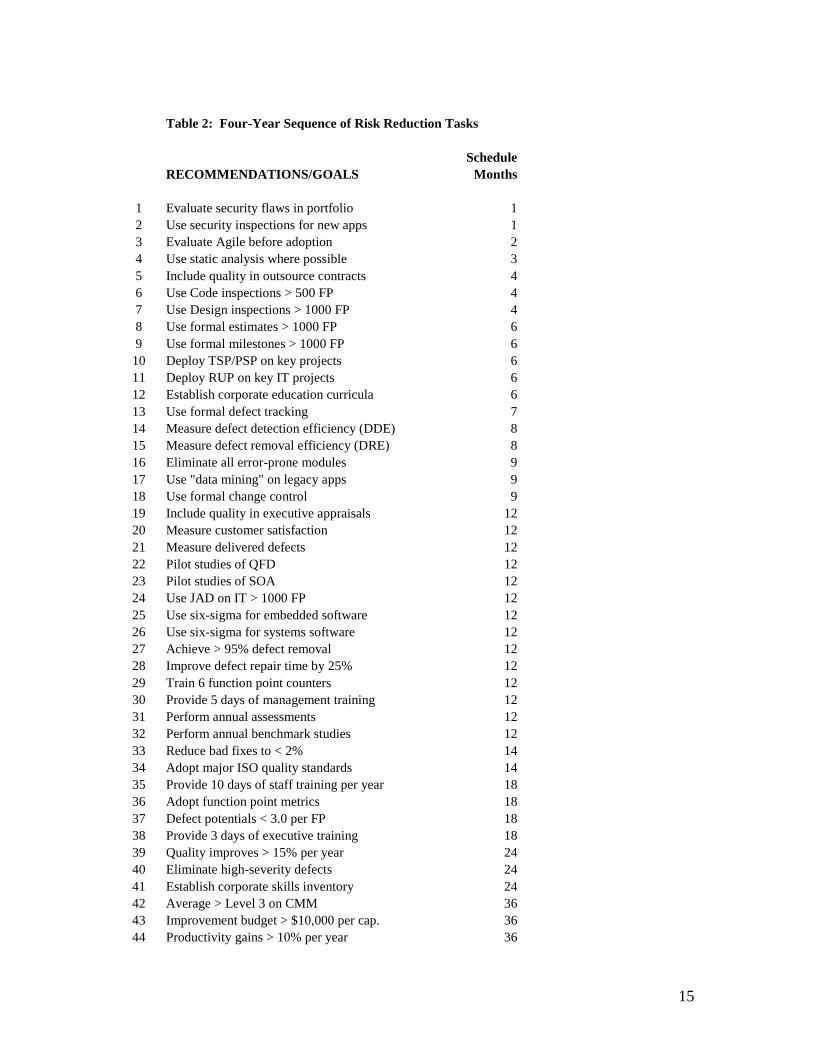
The corporate risk reduction team established some 50 goals that were targeted over a
four-year period:
15
Table 2: Four-Year Sequence of Risk Reduction Tasks
Schedule
RECOMMENDATIONS/GOALS Months
1 Evaluate security flaws in portfolio 1
2 Use security inspections for new apps 1
3 Evaluate Agile before adoption 2
4 Use static analysis where possible 3
5 Include quality in outsource contracts 4
6 Use Code inspections > 500 FP 4
7 Use Design inspections > 1000 FP 4
8 Use formal estimates > 1000 FP 6
9 Use formal milestones > 1000 FP 6
10 Deploy TSP/PSP on key projects 6
11 Deploy RUP on key IT projects 6
12 Establish corporate education curricula 6
13 Use formal defect tracking 7
14 Measure defect detection efficiency (DDE) 8
15 Measure defect removal efficiency (DRE) 8
16 Eliminate all error-prone modules 9
17 Use "data mining" on legacy apps 9
18 Use formal change control 9
19 Include quality in executive appraisals 12
20 Measure customer satisfaction 12
21 Measure delivered defects 12
22 Pilot studies of QFD 12
23 Pilot studies of SOA 12
24 Use JAD on IT > 1000 FP 12
25 Use six-sigma for embedded software 12
26 Use six-sigma for systems software 12
27 Achieve > 95% defect removal 12
28 Improve defect repair time by 25% 12
29 Train 6 function point counters 12
30 Provide 5 days of management training 12
31 Perform annual assessments 12
32 Perform annual benchmark studies 12
33 Reduce bad fixes to < 2% 14
34 Adopt major ISO quality standards 14
35 Provide 10 days of staff training per year 18
36 Adopt function point metrics 18
37 Defect potentials < 3.0 per FP 18
38 Provide 3 days of executive training 18
39 Quality improves > 15% per year 24
40 Eliminate high-severity defects 24
41 Establish corporate skills inventory 24
42 Average > Level 3 on CMM 36
43 Improvement budget > $10,000 per cap. 36
44 Productivity gains > 10% per year 36

16
45 Reduce Cost overruns < 5% 36
46 Reduce Schedule slippage < 5% 36
47 Requirements creep < 0.5% 36
48 Cancelled projects = 0 48
49 Renovate critical applications 48
50 Achieve CMMI 5 in key units 48
These goals and their schedule timelines were shown and approved by the chairman and
top officers as well as by unit executives.
Cost Justifying a Corporate Risk Reduction Program
A major corporate-wide risk reduction and process improvement program is of necessity
an expensive proposition. It requires funding approval at the highest level. It must also
generate a positive return on investment by the end of the second year, and the ROI
should continue to go up in future years. A well-planned corporate risk reduction
program in an “average” Fortune 500 company should return at least $10.00 for every
$1.00 spent over a four-year time window.
The most obvious value for a risk reduction program will be reduction in costs for
software defect repairs, security attacks, and other negative cost elements.
However a successful risk reduction program will have subtle and less obvious benefits.
For example in this case study the program would free up about 1,000 personnel from
defect repair tasks and make them available for more productive work such as reducing
the corporate backlog of applications.
Since a successful risk reduction program will lead to shorter schedules, this means
quicker revenue streams for commercial products with software components as key
features.
The total direct costs of the software risk reduction program for the software engineering
lab was about $18,000,000 per year. This is a major expense and therefore needs to
demonstrate a positive return on investment.
The operating unit costs across the 50 units with software were about $25,000.000 per
year or roughly $2,500 per capita. These costs were for training and the deployment of
selected tools and methods.

17
Table 3: Annual Costs for the Risk Reduction Program
Annual
Costs
Software Research Lab costs $18,000,000
Unit annual costs $25,000,000
TOTAL $43,000,000
As pointed out earlier risk reduction and software process improvement are not
inexpensive. In this case study a total of $10,000 per capita was set aside for risk and
process improvement expenses such as training, tool acquisition, consulting fees, etc.
Since the software personnel in the case study were stated to comprise 10,000 workers
and managers, this implies that the total expenses for software process improvement
activities amounted to $100,000,000 over a four-year period.
A cost of $100,000,000 over fours years is a large number. That brings up the question
of what kinds of savings will be generated? This question can be answered but it is a
complex question because the savings will change every year.
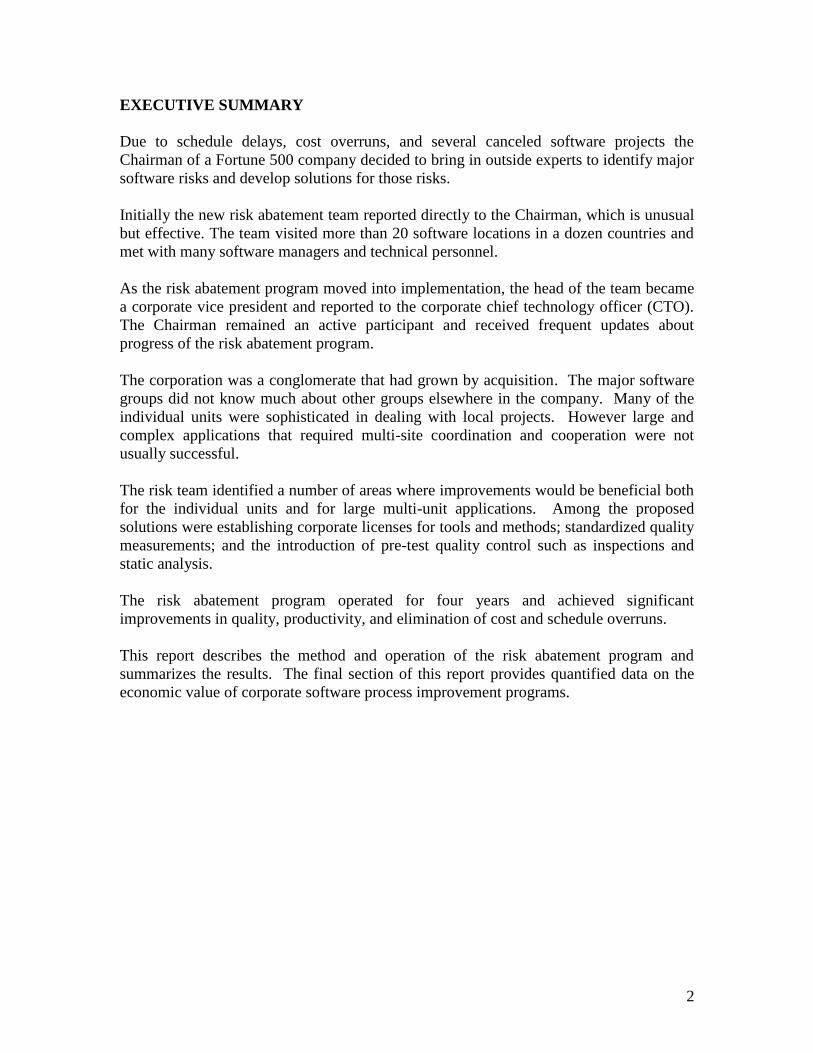
Table 4 shows the current costs for various risk-related work activities and the projected
savings from the risk reduction program:
Table 4: Target Cost Reductions from the Corporate Risk Program
Major Software Risks Annual Target Savings
Costs Amount
Excessive bug repairs $500,000,000 $75,000,000 $425,000,000
Cost overruns $68,000,000 $10,000,000 $58,000,000
Schedule overruns $67,000,000 $5,000,000 $62,000,000
Canceled projects $50,000,000 $5,000,000 $45,000,000
Loss of customers $25,000,000 $2,000,000 $23,000,000
Litigation: breach of contract $15,000,000 $0 $15,000,000
Security attacks $30,000,000 $3,000,000 $27,000,000
TOTAL $755,000,000 $100,000,000 $655,000,000
As can be seen from tables 3 and 4 the corporate risk reduction program was expected to
yield direct savings of about $655,000,000 per year for a cost of $43,000,000 per year.
This is an ROI of about $15 for every $ 1 expended. However there are additional and
more subtle benefits that can also be calculated.
A software group with a total employment of 10,000 personnel will normally be able to
18
develop about 420,000 function points per year and maintain about 1,250,000 function
points per year. Although the situation is more complex in real life, let us assume that
50% of personnel are on the development side and 50% of the personnel are on the
maintenance side. To further simplify, let us assume that half of the $100,000,000 for
process improvements will go to the development side and half will go to the
maintenance side.
Cost Recovery on the Development Side. Assume that the original baseline average
productivity was 7 function points per staff month for development, which amounts to 84
function points per year per person. Assuming 5,000 development personnel and 84
function points per year, the annual rate of new work is 420,000 function points.
Since 5,000 personnel with fully burdened compensation rates of $120,000 per year have
annual expenses of $600,000,000 it can be seen that the development cost per function
point for the organization amounts to roughly $1,429 per function point for new function
points added to the corporate inventory.
Without the process improvement program, the development group would have created
1,680,000 new function points over the four-year period shown in the case study.
However, as a result of the improvement program, assume the average rate went from 7
to about 10 function points per month over the four-year improvement program.
Thus instead of creating 1,680,000 function points in four years the same group of 5,000
development personnel would be able to create 600,000 function per year or 2,400,000
function points in the same four year period.
Using only the principles of cost recovery, the 720,000 additional function points at a
value of $1,429 per function point means additional corporate software assets worth
$1,028,880,000 were created as a byproduct of an investment of $43,000,000 per year.
These are not cost reductions but actual assets that might be added to the corporate books.
Because inspections and static analysis tools make significant improvements in software
quality before testing begins, a major focus of improved performance will be in the test
and quality control areas. It can be expected that fewer bugs will be found during testing,
which can lead to fewer builds and fewer test runs, and hence fewer test personnel
combined with much quicker test schedules.
Indeed improving quality exerts the greatest overall impact from process improvements.
As a result of process improvements that include inspections and static analysis, probably
25% of test personnel will become available for other assignments.
Cost Recovery on the Maintenance Side. An even more significant aspect of cost
recovery can be achieved on the maintenance side of the case study. Of the 5,000
personnel on the maintenance side about 2,500 will be working on enhancements.
Obviously these personnel will be more productive too, so value will be associated with
their higher output.
19
The other 2,500 maintenance personnel spend much of their time on software defect
repairs. Now fixing bugs has been a necessary and expensive activity for software
groups ever since the industry began. Although bug repairs are needed to stay in
business, every dollar spent on fixing bugs after a product is released is really a
subtraction from the bottom line and should be viewed as a liability.
The greatly improved quality levels associated with the risk reduction and process
improvement program will probably cut down the number of full-time staff working on
bug repairs from 2,500 down to about 1,500 and hence free up 1,000 personnel for other
assignments.
This means that the software risk reduction and process improvement program will
unexpectedly free up about 10% of the total software employment, or a set of 1,000
experienced personnel, who are no longer going to be locked into heavy-duty bug repairs
and customer support tasks.
(This is the basis of the earlier statement that the corporation only needed 9,000 software
people to support the operating units.)
Assuming the $120,000 a year for burdened compensation that was stated, this means a
possible savings of $120,000,000 a year. There are several options, which the corporate
operating unit executives can consider as to how to best utilize the windfall of 1,000
spare personnel:
1. They can be reassigned to development and thereby raise software production by
about 120,000 function points per year. At the assumed cost of $1,429 per
function point this would supply added value at a rate of $171,480,000 per year.
2. They could be assigned to maintenance projects not discussed in this report such
as projects which have been put on hold due to lack of resources. Many
companies have projects that are more or less frozen, and these include many
enhancements to legacy applications. Thus the windfall of extra maintenance
staffing could be used to modernize many aging applications that might otherwise
continue in some disrepair.
3. They can be “downsized” or transferred to other labs and locations within the
company and removed from local payrolls. However since most locations have a
shortage of software personnel, this is unlikely to occur.
Empirical observations indicate that restructuring of aging applications and removal of
error-prone modules can reduce overall maintenance costs by more than 50%. Expressed
in terms of function point metrics, changes to existing applications can increase from
about 15 function points per staff month to more than 30 function points per staff month.
The number of customer-reported defects repaired per staff month can increase from
about 8 to more than 12. The maintenance assignment scope, or amount of software
20
maintained by one specialist, can increase from less than 1000 to more than 3000
function points.
In any case, the significant increase in software quality and resulting decrease in software
defect repairs is one of the most valuable aspects of the process improvement program.
Here too, returns in the vicinity of $15.00 can be projected for every $1.00 expended,
although the exact ROI must be calculated for each company and each specific situation.
Asset Value of a Library of Reusable Artifacts. A typical Fortune 500 corporation
owns a software portfolio or library that totals somewhere between 250,000 function
points to more than 7,500,000 function points of software applications. The corporate
portfolio for this case study totaled to about 7,000,000 function points.
Prior to the commencement of the formal risk reduction and process improvement
program, about 15% of this volume was derived from reusable materials. However much
of the normal day to day reuse is in the form of “private” reuse by individual technical
personnel. Private reuse may be valuable to individual programmers, but much of the
value is invisible in the sense of having any tangible value on corporate books.
As a result of the emphasis on formal reuse as part of the planned risk reduction and
process improvement program, the total volume of reusable artifacts owned by the
enterprise may total to 500,000 function points after four years.
A library of certified reusable artifacts is a valuable corporate asset. However, the value
of a library of reusable software assets may have tax consequences in the United States,
so companies are advised to seek legal counsel about the implications of Internal
Revenue Service Code Rule 482.
The essence of Rule 482 is that when one division or affiliate in a controlled group of
related corporations such as a conglomerate or multinational company provides goods or
services to another division, these goods or services may be treated by the IRS as though
they were taxable income to the receiving division. This is potentially a “stake through
the heart” of a formal corporate reuse program in multi-national corporations.
For example, if Division A of Mega Company in San Jose supplies 1000 function points
of reusable artifacts to Division B in Boston, then the transfer may be treated as a taxable
transaction by the IRS.
Of course, if the enterprise is not a U.S. corporation or if the transfers are made abroad,
such as transferring reusable assets between London and Paris, then Rule 482 may not
apply.
In any case, a formal library of reusable artifacts is a valuable corporate asset and that
raises questions of how to determine the value. Since reusable artifacts are more difficult
to develop than normal software, their costs are often about 30% to 50% higher than
“normal” artifacts of the same nature.

21
Let us assume that the case study company has developed a library of 100,000 function
points of reusable materials at an average cost of $2,000 per function point. Thus the
replacement value of these artifacts would amount to $200,000,000.
However, if each of these reusable artifacts is reused an average of 10 times, and each
instance of reuse saves 70% of normal development costs, then the effective value of the
library of reusable artifacts would amount to about $980,000,000. This value assumes a
“normal” development cost of about $1,400 per function point where each reused
function point saves 70% or $980.
As can be seen, calculating the real value of a library of reusable artifacts is a fairly
complex situation. The replacement costs of the reusable assets themselves can be
calculated fairly easily. However the true business value of the library of reusable
artifacts is more complex, and requires analysis of normal development costs, the
effectiveness of the reusable materials in reducing those costs, and the number of times
each artifact is reused during its life expectancy.
These calculations assume reusable artifacts that are of zero-defect status. If any of the
reusable artifacts contain serious flaws or bugs (say a latent year 2000 bug embedded in a
reusable module) then the value of the reusable artifact will be degraded by the recall and
repair costs.
Adding Value through Shorter Development Schedules. One of the primary benefits
of a software risk reduction and process improvement program is the ability to shorten
typical software development schedules by 50% to 70% compared to the initial baseline.
The main technology for achieving shorter schedules is of course having significant
volumes of reusable artifacts available.
The direct beneficiaries of the shorter development schedules are the clients and users of
the software applications that result. There may well be substantial financial benefits
accruing from these shorter schedules, but the quantification of such values must be
derived from the nature of the business activities that can commence earlier, or from the
business improvements that result from more rapid turnaround times.
For example, if a company can bring out a new product 50% faster than their main
competitors as a result of their software process improvement activities, then no doubt
significant business value and revenues will result. However, quantifying this value
requires specific knowledge about the revenue stream of the product in question, and
does not lend itself to abstract generalization.
Adding Value through Higher Revenues. Thus far we have discussed value only in the
form of cost recovery to recoup the $100,000,000 investment in risk reduction and
process improvement by lowering in-house development costs and raising internal
productivity rates.

22
However if some of the software is part of marketed products, or is itself commercially
marketed, then the software process improvement program can also generate value by
raising revenues.
Three aspects of the process improvement program can benefit software-related revenue
streams:
1. The shorter development schedules will get products to the market faster.
2. The higher quality levels will increase market shares.
3. The higher quality levels will reduce maintenance and warranty costs
These three phenomena are both known to occur when software processes are improved,
but their value is too specific to individual products and to focused markets to allow
general rules of thumb to be developed.
Adding Value from Disaster Avoidance. Because many large software projects are
cancelled or fail to perform when installed, an additional value of process improvement is
that of avoiding the consequences of software disasters. Unfortunately, this kind of value
is hard to quantify. When disasters do occur their costs are highly visible. But if no
disasters occur, then there is no way of being sure how many might have occurred under
less stringent development practices.
For the U.S. as a whole cancelled projects cost about 10% more than successfully
completed projects of the same, but obviously provide zero value combined with massive
losses. For large corporations that are building software applications > 10,000 function
points in size, one of the greatest value topics from process improvement is that of
reduced risks of outright failure. For the company cited in this case study, cancelled
projects would accrue costs of more than $1,600 per function point as opposed to only
$1,400 per function point for successful projects.
Adding Value from Reduced Litigation Risk. The author often works as an expert
witness in software lawsuits where applications either did not get finished, or worked so
poorly when deployed as to be unusable. Litigation costs can be enormous, and litigation
can absorb hundreds of staff and executive hours for several years. Here too the value of
litigation avoidance is hard to quantify.
Adding Value from Improved Staff and Management Morale. No one likes to work
on poorly planned and carelessly executed projects. Everyone likes to work on projects
that are successful and yield good customer satisfaction. Therefore another form of value
from process excellence is very high morale levels on the part of both managers and staff.
This in turn yields very low voluntary attrition rates, and a very good “team spirit” among
the software community. If voluntary employment declines from 3% per year to less
than 1% per year, it is possible to quantify the savings in recruitment and training costs.
However, collecting the data for this kind of value analysis is outside the scope of normal

23
quality and productivity measurements.
Adding Value from Recruiting and Keeping Top-Ranked Personnel. One interesting
phenomenon was first noted in the 1970’s and remains true in 2011. Technical personnel
who quit a company voluntarily are often the best qualified and have the highest appraisal
scores. There are two reasons for this: 1) Top technical personnel are the most frustrated
with poor performance and bad management; 2) Top technical personnel are the ones
most likely to be sought by other companies and professional recruiters. Therefore once
a company gets a reputation in the industry as being a high-performance organization,
they can attract the best people in the industry. Of course this means that companies with
excellent technological prowess must also have good compensation and benefits plans.
Adding Value from Customer Loyalty. Customers quickly learn to avoid vendors with
shoddy goods. Conversely, customers tend to buy multiple products from vendors with
excellent manufacturing and customer support quality levels. Therefore an investment in
achieving software excellence will yield returns through customer loyalty. Here too the
data for this kind of value analysis is outside the scope of normal quality and productivity
measurements.
Overall Value from Effective Process Improvements. At the start of the four-year
process improvement program the corporation had 10,000 personnel and an annual
budget of $1,200,000,000. After a few years 1,000 maintenance personnel became
available for other work due to better quality. (This is the basis for the earlier assertion
that the company only needed 9,000 software personnel.)
The tangible values of the improvement program were to increase annual function point
production from 126,000 function points over a three-year period to 180,000 function
points. The additional function points have a replacement value of more than
$77,000,000.
The maintenance savings due to better quality freed up 100 maintenance personnel which
indicate savings of $12,000,000 per year or about $28,000,000 for the three-year period
(no savings occur for the first six months).
The asset value of a library of 100,000 reusable function points is about $200,000,000.
Of course each reusable function point generates savings of about $980 each time it is
utilized. Assuming an average of 10 reuses and reusable function points the savings
would be about $98,000,000.
Not all risk reduction and process improvement programs are as successful as the one
discussed in this paper. Indeed some are abandoned or have only minimal value. But a
well-planned process improvement program can generate a wide array of both significant
cost savings and also recurring revenues.

24
SUMMARY AND CONCLUSIONS
The phrase “software risk reduction” covers a very wide spectrum of methodologies,
tools, quality control methods, project management functions, and enhanced volumes of
reusable artifacts.
Although the literature on software risk reduction and process improvement is quite large
and growing larger, much of the information is subjective and deals with qualitative
factors. If the concept of risk reduction and software process improvement is going to
become a permanent fixture of the software engineering world, then it must begin to
augment subjective observations with quantitative information based on empirical
baseline and benchmark studies.
This report covers some of the highlights of the economics of risk reduction software
process improvement using a case study approach. But this report is intended simply to
illustrate the basic structure of software process risk reduction economics. There is a
continuing need for more extensive coverage in the software literature using both case
studies and statistical analysis of software risk reduction and process improvement
results.
Qualitative information is useful but not sufficient. Software risk reduction process
improvements need to be firmly based on solid empirical findings.
25
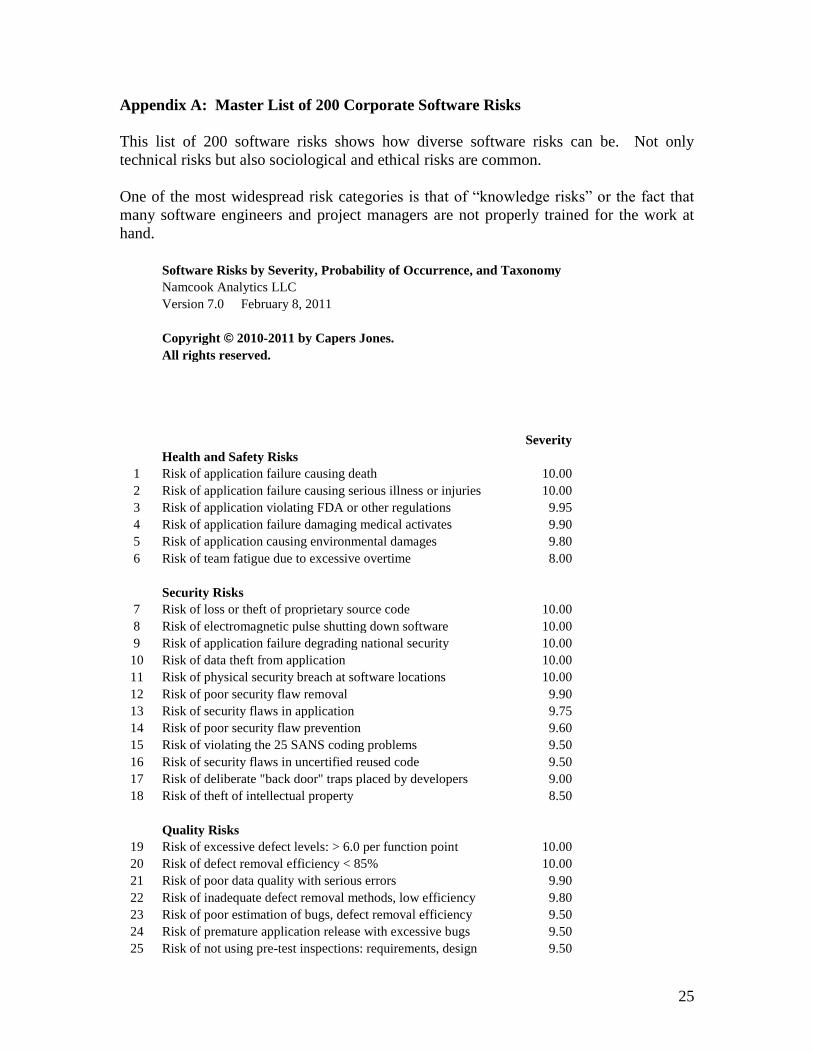
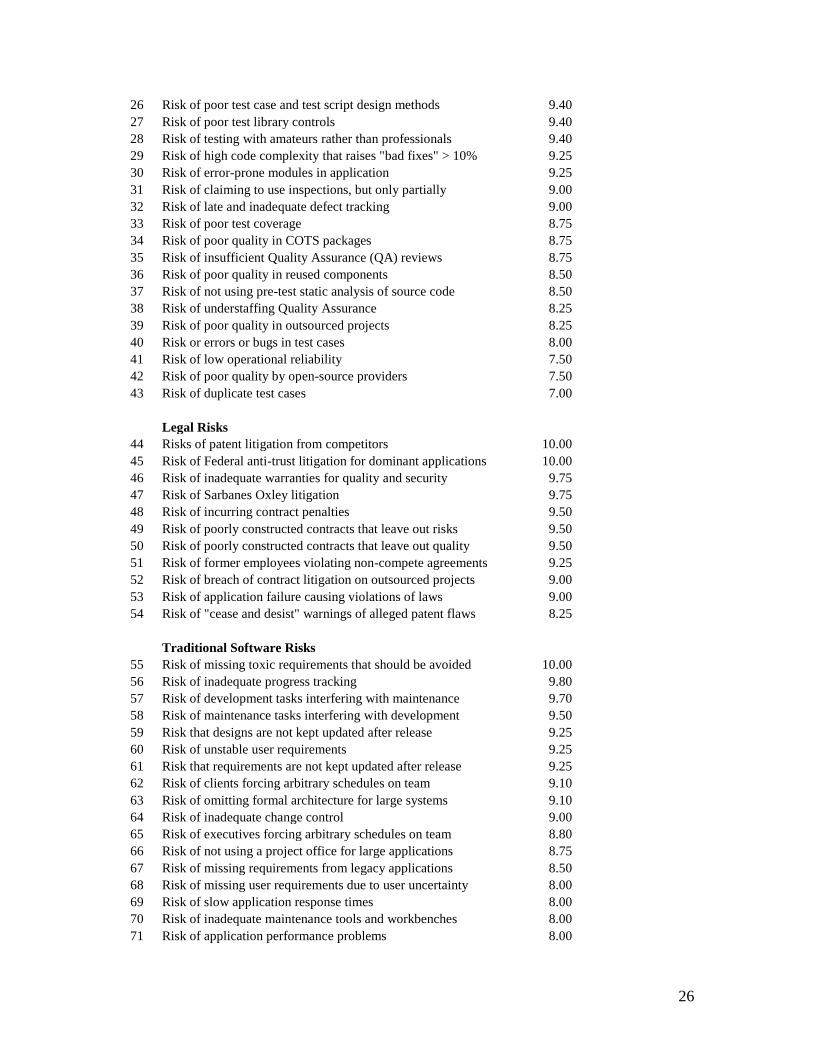
Appendix A: Master List of 200 Corporate Software Risks
This list of 200 software risks shows how diverse software risks can be. Not only
technical risks but also sociological and ethical risks are common.
One of the most widespread risk categories is that of “knowledge risks” or the fact that
many software engineers and project managers are not properly trained for the work at
hand.
Software Risks by Severity, Probability of Occurrence, and Taxonomy
Namcook Analytics LLC
Version 7.0 February 8, 2011
Copyright © 2010-2011 by Capers Jones.
All rights reserved.
Severity
Health and Safety Risks
1 Risk of application failure causing death 10.00
2 Risk of application failure causing serious illness or injuries 10.00
3 Risk of application violating FDA or other regulations 9.95
4 Risk of application failure damaging medical activates 9.90
5 Risk of application causing environmental damages 9.80
6 Risk of team fatigue due to excessive overtime 8.00
Security Risks
7 Risk of loss or theft of proprietary source code 10.00
8 Risk of electromagnetic pulse shutting down software 10.00
9 Risk of application failure degrading national security 10.00
10 Risk of data theft from application 10.00
11 Risk of physical security breach at software locations 10.00
12 Risk of poor security flaw removal 9.90
13 Risk of security flaws in application 9.75
14 Risk of poor security flaw prevention 9.60
15 Risk of violating the 25 SANS coding problems 9.50
16 Risk of security flaws in uncertified reused code 9.50
17 Risk of deliberate "back door" traps placed by developers 9.00
18 Risk of theft of intellectual property 8.50
Quality Risks
19 Risk of excessive defect levels: > 6.0 per function point 10.00
20 Risk of defect removal efficiency < 85% 10.00
21 Risk of poor data quality with serious errors 9.90
22 Risk of inadequate defect removal methods, low efficiency 9.80
23 Risk of poor estimation of bugs, defect removal efficiency 9.50
24 Risk of premature application release with excessive bugs 9.50
25 Risk of not using pre-test inspections: requirements, design 9.50
26
26 Risk of poor test case and test script design methods 9.40
27 Risk of poor test library controls 9.40
28 Risk of testing with amateurs rather than professionals 9.40
29 Risk of high code complexity that raises "bad fixes" > 10% 9.25
30 Risk of error-prone modules in application 9.25
31 Risk of claiming to use inspections, but only partially 9.00
32 Risk of late and inadequate defect tracking 9.00
33 Risk of poor test coverage 8.75
34 Risk of poor quality in COTS packages 8.75
35 Risk of insufficient Quality Assurance (QA) reviews 8.75
36 Risk of poor quality in reused components 8.50
37 Risk of not using pre-test static analysis of source code 8.50
38 Risk of understaffing Quality Assurance 8.25
39 Risk of poor quality in outsourced projects 8.25
40 Risk or errors or bugs in test cases 8.00
41 Risk of low operational reliability 7.50
42 Risk of poor quality by open-source providers 7.50
43 Risk of duplicate test cases 7.00
Legal Risks
44 Risks of patent litigation from competitors 10.00
45 Risk of Federal anti-trust litigation for dominant applications 10.00
46 Risk of inadequate warranties for quality and security 9.75
47 Risk of Sarbanes Oxley litigation 9.75
48 Risk of incurring contract penalties 9.50
49 Risk of poorly constructed contracts that leave out risks 9.50
50 Risk of poorly constructed contracts that leave out quality 9.50
51 Risk of former employees violating non-compete agreements 9.25
52 Risk of breach of contract litigation on outsourced projects 9.00
53 Risk of application failure causing violations of laws 9.00
54 Risk of "cease and desist" warnings of alleged patent flaws 8.25
Traditional Software Risks
55 Risk of missing toxic requirements that should be avoided 10.00
56 Risk of inadequate progress tracking 9.80
57 Risk of development tasks interfering with maintenance 9.70
58 Risk of maintenance tasks interfering with development 9.50
59 Risk that designs are not kept updated after release 9.25
60 Risk of unstable user requirements 9.25
61 Risk that requirements are not kept updated after release 9.25
62 Risk of clients forcing arbitrary schedules on team 9.10
63 Risk of omitting formal architecture for large systems 9.10
64 Risk of inadequate change control 9.00
65 Risk of executives forcing arbitrary schedules on team 8.80
66 Risk of not using a project office for large applications 8.75
67 Risk of missing requirements from legacy applications 8.50
68 Risk of missing user requirements due to user uncertainty 8.00
69 Risk of slow application response times 8.00
70 Risk of inadequate maintenance tools and workbenches 8.00
71 Risk of application performance problems 8.00

27
72 Risk of poor support by open-source providers 7.75
73 Risk of reusing code without test cases or related materials 7.00
74 Risk of excessive feature "bloat" 7.00
75 Risk of inadequate development tools 6.50
76 Risk of poor help screens and poor user manuals 6.00
77 Risk of slow customer support 6.00
78 Risk of inadequate functionality 6.00
Financial Risks
79 Risk of application failure causing major financial loss 10.00
80 Risk of consequential damages > $1,000,000,000 10.00
81 Risk of project termination due to poor quality, overruns 10.00
82 Risk of features slipping from planned release 9.60
83 Risk of significant project cost overruns 9.50
84 Risk of project value dipping below project costs 9.50
85 Risk of "leakage" from software cost and historical data 9.00
86 Risk of bankruptcy by vendor 9.00
87 Risk of negative earned value for project 9.00
88 Risk of significant project schedule overruns 8.90
89 Risk of application failure causing moderate financial loss 8.75
90 Risk of cost overruns on outsourced projects 8.50
91 Risk of schedule delays on outsourced projects 8.50
92 Risk of inadequate cost accounting 8.00
93 Risk of bankruptcy by client 8.00
94 Risk of application violating standard accounting practices 7.00
Business Risks
95 Risk of missing critical market window 10.00
96 Risk of losing clients due to faulty software 9.95
97 Risk of application failure damaging business data 9.90
98 Risk of application failure damaging distribution 9.85
99 Risk of application failure damaging transportation 9.80
100 Risk of application failure affecting operation of equipment 9.80
101 Risk of application failure damaging retail activities 9.75
102 Risk of competitive applications with better features 9.75
103 Risk of application obsolescence before completion 9.70
104 Risk of application failure damaging law enforcement 9.70
105 Risk of application failure damaging government activities 9.60
106 Risk of application failure damaging communications 9.50
107 Risk of poor governance by executives 9.50
108 Risk of application failure damaging manufacturing 9.50
109 Risk of application failure damaging stock values 9.50
110 Risk of application failure shutting down vital equipment 9.25
111 Risk of rubber-stamp phase reviews without real oversight 9.20
112 Risk of poor or missing project historical data 8.50
113 Risk of executive and client dissatisfaction with project 8.50
114 Risk of poor support by COTS vendors 8.25
Social Risks
115 Risk of significant layoffs of project team 10.00

28
116 Risk of poor managers driving out top technical staff 10.00
117 Risk of termination for cause of key technical personnel 10.00
118 Risk of ignoring learning curve for new methodologies 10.00
118 Risk of voluntary attrition of key technical personnel 9.00
119 Risk of poorly planned organization structures 9.00
120 Risk of team sizes too small for application 9.00
121 Risk of too few personnel per manager (< 5) 9.00
122 Risk of too many personnel per manager (> 15) 9.00
123 Risk of poor organization structures 8.80
124 Risk of low team morale from excessive schedule pressure 8.00
125 Risk of poor communication among supply chain members 8.00
126 Risk of stakeholder disputes that change requirements 7.75
127 Risk of poor communications among team members 7.70
128 Risk of team size too large for application 7.00
129 Risk of low user satisfaction levels 7.00
130 Risk of poor communications with stakeholders 7.00
131 Risk of major management disagreements 6.50
132 Risk of strikes by unionized personnel 8.00
External Risks
133 Risk of natural disaster affecting projects 8.00
134 Risk of loss of stakeholders or clients during development 7.00
135 Risk of accidental loss of key personnel during development 5.75
Ethical Risks
136 Risk of fraudulent progress/status reports 10.00
137 Risk of project managers ignoring risks 9.50
138 Risk of project managers concealing risks from clients 9.50
139 Risk of non-compete violations by former employees 9.50
140 Risk of false claims by methodology enthusiasts 9.15
141 Risk of false claims of high CMMI levels 9.00
142 Risk of claiming to use a methodology, but not really doing so 8.50
143 Risk of false claims by outsource vendors 8.00
144 Risk of false claims by COTS vendors 8.00
Knowledge Risks
145 Risk of users not fully understanding their own requirements 10.00
146 Risk of inadequate requirements analysis for large systems 10.00
147 Risk of effective solutions not being known by managers 9.75
148 Risk of effective solutions not being known by team 9.75
149 Risk of inadequate sizing prior to funding project 9.70
150 Risk of inadequate schedule planning 9.60
151 Risk of late start in deploying risk solutions 9.50
152 Risk of manual estimates for large applications 9.50
153 Risk of excessive optimism in initial plans, estimates 9.50
154 Risk of estimates being rejected due to lack of benchmarks 9.45
155 Risk of using unsuitable development methodology 9.40
156 Risk of poor project oversight by clients 9.25
157 Risk of "good enough" fallacy applied to application 9.00
158 Risk of insufficient project management skills 9.00

29
159 Risk of poorly trained management personnel 9.00
160 Risk of inadequate user-error prevention 9.00
161 Risk of team skills not matching project needs 9.00
162 Risk of poorly trained maintenance personnel 8.60
163 Risk of inadequate defect prevention 8.50
164 Risk of poorly trained development personnel 8.50
165 Risk of poorly trained support personnel 8.40
166 Risk of poorly trained test personnel 8.25
167 Risk of application architectural flaws 8.25
168 Risk of inadequate user guides and HELP screens 8.00
169 Risk of poor usability and poor interfaces 8.00
170 Risk of poorly trained QA personnel 8.00
171 Risk of international misunderstandings for global projects 8.00
172 Risk of inadequate programming languages 7.75
173 Risk of insufficient technical skills 7.25
174 Risk of application violating international standards 5.50
Enterprise Risks
175 Risks of obsolete or cumbersome enterprise architecture 10.00
176 Risks of difficult data migration from legacy applications 10.00
177 Risk of merger or takeover causing layoffs and cancellations 10.00
178 Risks from disconnected "stove pipe" applications 9.00
179 Risks of fragmented software ownership in enterprise 9.00
180 Risks of uncoordinated redundant applications and data 8.00
Merger, Acquisition, and Venture Capital Risks
181 Risk of dilution of ownership due to multiple funding rounds 10.00
182 Risk of cutting R&D after mergers or venture investment 9.50
183 Risk of losing key personnel after mergers. 9.50
184 Risk of bankruptcy within three years of venture funding 9.50
185 Risk of inadequate due diligence prior to completion 9.00
186 Risk of eventual competition by dissatisfied personnel 9.00
187 Risk of poor integration of teams after mergers 9.00
188 Risk of venture-backed boards eliminating key technical staff 8.75
189 Risk of venture-backed boards damaging business prospects 8.50
190 Risk of bankruptcy within three years of mergers 7.50
Technology Risks
191 Risk of hardware changes making application obsolete 9.00
192 Risk of hardware changes requiring extensive rework 8.50
193 Risk of related software changes requiring rework 8.00
194 Risk of supply chain changes requiring rework 7.00
195 Risk of standards changes requiring rework 7.00
Embedded Software Risks
196 Risk of software problems raising hardware liabilities 10.00
197 Risk of software problems causing un-repairable failures 10.00
198 Risk of software problems causing patent violations 10.00
199 Risk of software problems delaying hardware products 9.00
200 Risk of software raising hardware warranty costs 9.00
30
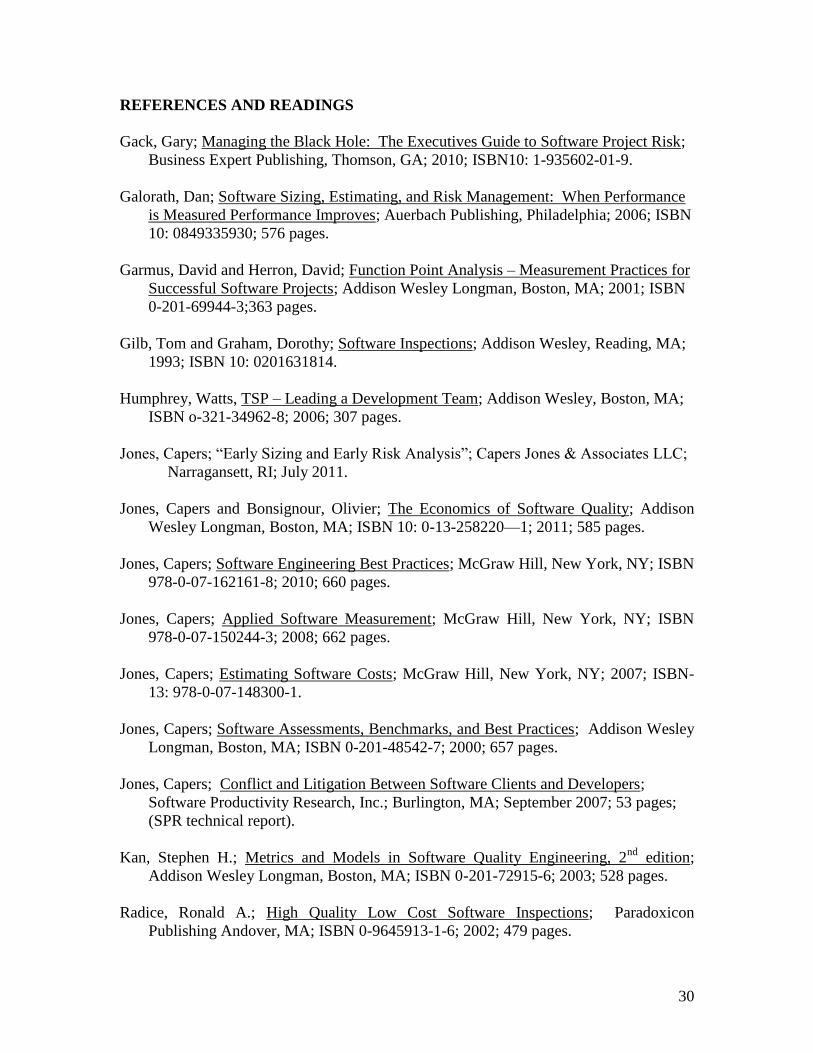
REFERENCES AND READINGS
Gack, Gary; Managing the Black Hole: The Executives Guide to Software Project Risk;
Business Expert Publishing, Thomson, GA; 2010; ISBN10: 1-935602-01-9.
Galorath, Dan; Software Sizing, Estimating, and Risk Management: When Performance
is Measured Performance Improves; Auerbach Publishing, Philadelphia; 2006; ISBN
10: 0849335930; 576 pages.
Garmus, David and Herron, David; Function Point Analysis – Measurement Practices for
Successful Software Projects; Addison Wesley Longman, Boston, MA; 2001; ISBN
0-201-69944-3;363 pages.
Gilb, Tom and Graham, Dorothy; Software Inspections; Addison Wesley, Reading, MA;
1993; ISBN 10: 0201631814.
Humphrey, Watts, TSP – Leading a Development Team; Addison Wesley, Boston, MA;
ISBN o-321-34962-8; 2006; 307 pages.
Jones, Capers; “Early Sizing and Early Risk Analysis”; Capers Jones & Associates LLC;
Narragansett, RI; July 2011.
Jones, Capers and Bonsignour, Olivier; The Economics of Software Quality; Addison
Wesley Longman, Boston, MA; ISBN 10: 0-13-258220—1; 2011; 585 pages.
Jones, Capers; Software Engineering Best Practices; McGraw Hill, New York, NY; ISBN
978-0-07-162161-8; 2010; 660 pages.
Jones, Capers; Applied Software Measurement; McGraw Hill, New York, NY; ISBN
978-0-07-150244-3; 2008; 662 pages.
Jones, Capers; Estimating Software Costs; McGraw Hill, New York, NY; 2007; ISBN-
13: 978-0-07-148300-1.
Jones, Capers; Software Assessments, Benchmarks, and Best Practices; Addison Wesley
Longman, Boston, MA; ISBN 0-201-48542-7; 2000; 657 pages.
Jones, Capers; Conflict and Litigation Between Software Clients and Developers;
Software Productivity Research, Inc.; Burlington, MA; September 2007; 53 pages;
(SPR technical report).
Kan, Stephen H.; Metrics and Models in Software Quality Engineering, 2nd
edition;
Addison Wesley Longman, Boston, MA; ISBN 0-201-72915-6; 2003; 528 pages.
Radice, Ronald A.; High Quality Low Cost Software Inspections; Paradoxicon
Publishing Andover, MA; ISBN 0-9645913-1-6; 2002; 479 pages.

31
Royce, Walker; Software Project Management – A Unified Framework; Addison Wesley,
Boston, MA; ISBN 0-201-30958-0; 1999; 406 pages.
Wiegers, Karl E.; Peer Reviews in Software – A Practical Guide; Addison Wesley
Longman, Boston, MA; ISBN 0-201-73485-0; 2002; 232 pages.