Embed Size (px)
Citation preview
Corporate Responsibility Fact Book 2018Supplementary information about corporate responsibility(Unaudited)
2
For further information, please contact
Disclaimer
This publication has been prepared by Danske Bank for information purposes only. It is not an offer or solicitation of any offers to purchase or sell any securities, currency or financial instruments. Whilst reasonable care has been taken to ensure that the content of this publication is not untrue or misleading, no representation is made as to its accuracy or completeness, and no liability is accepted for any loss arising from reliance on it. Danske Bank, its affiliates or staff may perform business services, hold, establish, change or cease to hold positions in any securities, currency or financial instrument mentioned in this publication. Danske Bank Group’s research analysts are not permitted to invest in securities under coverage in their research sector. This publication is not intended for private customers in the UK or any person in the US. Danske Bank is authorised by the Danish Financial Supervisory Authority (Finanstilsynet) and subject to limited regulation by the Financial Conduct Authority and the Prudential Regulation Authority for the conduct of business in the UK. Details on the extent of our regulation by the Financial Conduct Authority and the Prudential Regulation Authority are available from us on request. Member of the London Stock Exchange. Copyright © 2019 Danske Bank A/S. All rights reserved. This publication is protected by copyright and may not be reproduced in whole or in part without permission.
Contact us
Societal Impact & SustainabilityDK-1092 Copenhagen KDenmarkE-mail —[email protected]
Kristina Øgaard
Head of Sustainability Strategy & Governance

3
Table of contents
3.3. Responsible employer 19
3.3.1. Number of full-time employees and employee turnover 19
3.3.2. Staff diversity 20
3.3.3. Gender diversity 21
3.3.4. Opinion survey 22
3.3.5. Work-life balance 23
3.3.6. Health and safety 24
3.4. Environmental footprint 25
3.4.1. Resource consumption of Danske Bank Group 25
3.4.2. Breakdown of energy consumption – country level 26
3.4.2. Breakdown of road, air, paper and water consumption – country level 27
3.4.3. Carbon neutrality 28
3.4.4. Direct and indirect CO2 emissions of Danske Bank Group 29
3.4.5. Breakdown of direct and indirect CO2 emissions – country level 30
3.5.6. Scope 2 specification – Group level 30
3.4.7. Waste 31
3.4.8. Carbon Disclosure Project (CDP) 32
1. Introduction
1.1. About this report 5
1.1.1. Introduction to Corporate Responsibility Fact Book 2018 5
1.1.2. Reporting principles 5
1.2. Our business in brief 6
1.3. Business units 7
1.4. Governance and organisation 8
2. Strategic themes
2.1. Building financial confidence 10
2.1.1. Our educational programmes for schools 10
2.1.2. Helping start-ups to scale 10
2.2. Accessible finance 11
2.2.1. Online banking and MobilePay 11
2.2.2. Number of branches 11
3. Core business
3.1. Contributing to society 13
3.1.1. Value creation 13
3.1.2. Charity 13
3.1.3. Green bonds 14
3.2. Responsible customer relationships 15
3.2.1. Responsible investments under Dansk Invest 15
3.2.2. Active ownership activities in investment products 16
3.2.3. Engagement; the most frequently discussed ESG topics 18
1. Introduction
5
1. Introduction
1.1. About this report
1.1.1. Introduction to Corporate Responsibility Fact Book 2018
• The Corporate Responsibility Fact Book 2018 covers business information and corporate responsibility activities of Danske Bank Group. It is a supplement to Corporate Responsibility Report 2018, which can be downloaded from the Danske Bank Group website at www.danskebank.com/societal-impact.
1.1.2. Reporting principles
• To ensure data consistency and completeness, data has been defined and described in business procedures. Internal control procedures have been established to ensure that data is reported according to the definitions.
• A full description of the reporting principles covering environmental and employee data is included in the Corporate Responsibility Report 2018 pp. 38-39 available at www.danskebank.com/societal-impact.
• Environmental data included on the Group’s Statement of Carbon Neutrality have been verified by Deloitte. The statement is available at www.danskebank.com/societal-impact.

6
1.2. Our business in brief
1. Introduction
Danske Bank Group is a Nordic universal bank with bridges to the rest of the world. Since our foundation in Denmark in 1871, we have been providing banking services for retail and commercial customers, and today our home market has expanded to cover the entire Nordic region.
Danske Bank in numbers1 2018
Countries 16
Branches 237
Customers, end-2018 (million)2 3.3
Full-time employees 20,683
Loans issued (DKK billion) 1,769
Assets under management (DKK billion) 1,575
Total income (DKK billion) 44.4
Profit before tax (DKK billion) 19.7
Tax on profit (DKK billion) 4.7
Return on equity (%) 9.8
1 For more information see Danske Bank Annual Report 2018 at www.danskebank.com.2 Customers in Banking DK, Banking Nordic, Corporates & Institutions, Wealth Management (Private Banking customers only), and Northern Ireland.

7
1. Introduction
1.3. Business units
Serving our customers through five business units1Customers Employees Profit before tax
Banking DK
serves retail and commercial customers in Denmark. The unit offers personal customers advice tailored to their financial needs and is a leading provider of daily banking, home financing, investment and retirement planning solutions. For business customers, the unit provides targeted advice and solutions based on the size and situation of the customers’ business.
1,700,000 3,341 DKK 7.3 billion
Banking Nordic
serves retail and commercial customers in Sweden, Norway and Finland, providing customer offerings similar to those of Banking DK. In addition, the unit includes the Group’s global asset finance activities, such as lease activities.
1,135,000 2,442 DKK 5.6 billion
Corporates & Institutions
is the wholesale banking division of the Group, serving the largest corporate and institutional customers. We offer our expertise in debt and equity raising, corporate finance advisory services, risk facilitation, daily banking, trade finance and investment services.
1,815 1,858 DKK 4.3 billion
Wealth Management
serves the Group’s entire customer base through a range of products and services within wealth and asset management, investments, pension savings and insurance. This unit consists of Danica Pension, Danske Invest, Asset Management and Private Banking.
64,000 2,201 DKK 3.2 billion
Northern Ireland
is one of the leading financial institutions in its market serving personal and business customers through leading digital channels and a network of branches and business centres.
437,000 1,322 DKK 0.7 billion
The current business unit structure was implemented during 2018. In addition to these business units, Danske Bank Group offers mortgage financing through Realkredit Danmark, real estate brokerage through home, and leasing through Nordania Leasing.
1 For more information see Danske Bank Annual Report 2018 at www.danskebank.com.

8
1. Introduction
1.4. Governance and organisation
• Danske Bank’s governance setup within Societal Impact and Sustainability enhances transparency and accountability and includes the Business Integrity Committee, which was established by the Executive Board in 2014.
• The Business Integrity Committee is chaired by the Danske Bank CEO and consists of the Executive Board, the CEO of Danica and the Head of Societal Impact and Sustainability.
• The purpose of the Business Integrity Committee is to enhance and grow Danske Bank’s positive societal impact by setting the direction, developing and overseeing the implementation of the Societal Impact and Sustainability Strategy and related Policies of the Danske Bank Group.
• The Societal Impact and Sustainability function coordinates the implementation of decisions made by the Business Integrity Committee, tracks progress on the Societal Impact and Sustainability Strategy and is responsible for the annual corporate responsibility reporting.

Use this layout page when you have a picture that is light. The logo is different when the picture is dark.
2. Strategic themes

10
2. Strategic themes
2.1. Building financial confidence
2.1.1. Our educational programmes for schools
2.1.2. Helping start-ups to scale
Children’s understanding of the value of money has changed fundamentally with the digitalization of the financial infrastructure. This poses a societal challenge, and we consider it as part of our role to help enhance the next generation’s financial confidence and ability to navigate in a cashless society.
The Hub is our free, digital community platform tailored to the needs of growth start-ups. As well as receiving assistance with their recruitment of talent and connecting with investors, these start-ups also gain access to best-practice tools such as employment contract and pitch deck.
2016 2017 2018
Pupils participating in our educational programs for schools
7,400+ 13,500+ 16,200+
Moneyville (users since launch) 7 million+ 7 million+ 8 million+
2016 2017 2018
Jobs posted on The Hub 1,650 4,974 13,194
Job applications on The Hub 15,276 74,917 171,379
Visits to The Hub 396,709 1,346,826 1,710,831
11
2. Strategic themes
2.2. Accessible finance
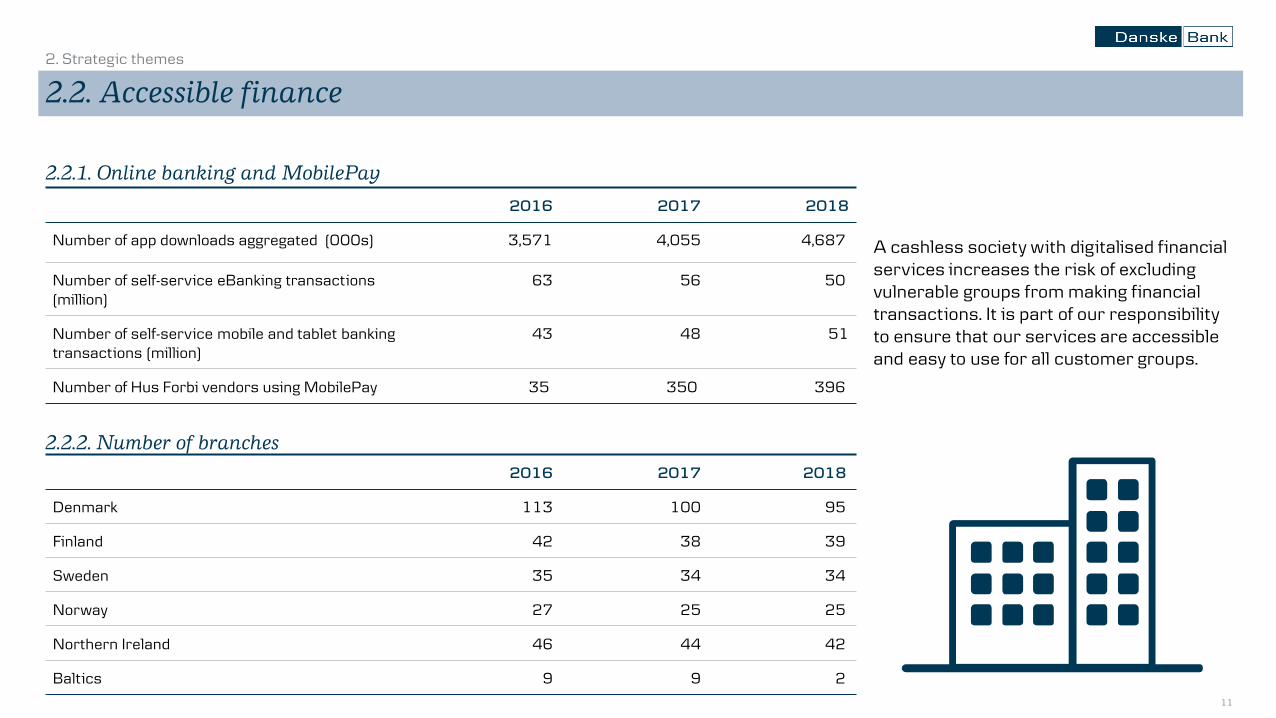
2.2.1. Online banking and MobilePay
2.2.2. Number of branches
2016 2017 2018
Number of app downloads aggregated (000s) 3,571 4,055 4,687
Number of self-service eBanking transactions (million)
63 56 50
Number of self-service mobile and tablet bankingtransactions (million)
43 48 51
Number of Hus Forbi vendors using MobilePay 35 350 396
2016 2017 2018
Denmark 113 100 95
Finland 42 38 39
Sweden 35 34 34
Norway 27 25 25
Northern Ireland 46 44 42
Baltics 9 9 2
A cashless society with digitalised financial services increases the risk of excluding vulnerable groups from making financial transactions. It is part of our responsibility to ensure that our services are accessible and easy to use for all customer groups.
Use this layout page when you have a picture that is light. The logo is different when the picture is dark.
3. Core business

13
3. Core business
3.1. Contributing to society
2016 2017 2018
Loans issued to banking customers (DKK billion) 1,689 1,723 1,769
Assets under management (DKK billion)1 1,420 1,530 1,575
Distribution to shareholders (DKK billion) 16.2 18.9 17.1
Payments for products and services by our suppliers(DKK billion)
7.4 7.6 8.9
Salaries, bonuses and social security costs paid(DKK billion)
13.8 13.7 14.3
Tax on profit (DKK billion) 5.5 5.4 4.7
2016 2017 2018
Danske Bank Fund donations; million DKK 1.7 1.5 1.3
3.1.1. Value creation
3.1.2. Charity
1 Assets under management consists of our conventional life insurance business, asset management and assets under advice (the investment decision is taken by the customer) from personal and business customers.
14
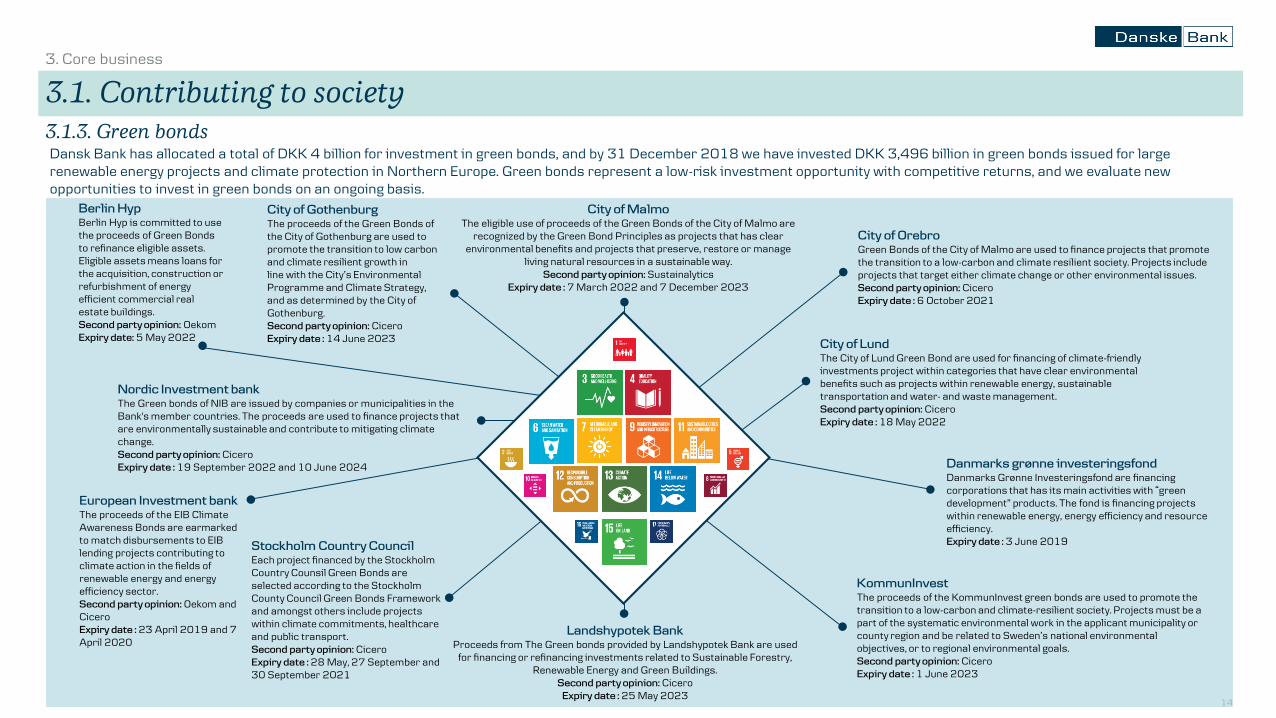
Berlin Hyp
Berlin Hyp is committed to use the proceeds of Green Bonds to refinance eligible assets. Eligible assets means loans for the acquisition, construction or refurbishment of energy efficient commercial real estate buildings.Second party opinion: OekomExpiry date: 5 May 2022
Nordic Investment bank
The Green bonds of NIB are issued by companies or municipalities in the Bank's member countries. The proceeds are used to finance projects that are environmentally sustainable and contribute to mitigating climate change.Second party opinion: CiceroExpiry date : 19 September 2022 and 10 June 2024
European Investment bank
The proceeds of the EIB Climate Awareness Bonds are earmarked to match disbursements to EIB lending projects contributing to climate action in the fields of renewable energy and energy efficiency sector.Second party opinion: Oekom and CiceroExpiry date : 23 April 2019 and 7 April 2020
Stockholm Country Council
Each project financed by the Stockholm Country Counsil Green Bonds are selected according to the Stockholm County Council Green Bonds Framework and amongst others include projects within climate commitments, healthcare and public transport. Second party opinion: CiceroExpiry date : 28 May, 27 September and 30 September 2021
City of Gothenburg
The proceeds of the Green Bonds of the City of Gothenburg are used to promote the transition to low carbon and climate resilient growth in line with the City’s Environmental Programme and Climate Strategy, and as determined by the City of Gothenburg. Second party opinion: CiceroExpiry date : 14 June 2023
City of Malmo
The eligible use of proceeds of the Green Bonds of the City of Malmo are recognized by the Green Bond Principles as projects that has clear
environmental benefits and projects that preserve, restore or manage living natural resources in a sustainable way.
Second party opinion: SustainalyticsExpiry date : 7 March 2022 and 7 December 2023
Landshypotek Bank
Proceeds from The Green bonds provided by Landshypotek Bank are used for financing or refinancing investments related to Sustainable Forestry,
Renewable Energy and Green Buildings.Second party opinion: Cicero
Expiry date : 25 May 2023
City of Orebro
Green Bonds of the City of Malmo are used to finance projects that promote the transition to a low-carbon and climate resilient society. Projects include projects that target either climate change or other environmental issues.Second party opinion: CiceroExpiry date : 6 October 2021
City of Lund
The City of Lund Green Bond are used for financing of climate-friendly investments project within categories that have clear environmental benefits such as projects within renewable energy, sustainable transportation and water- and waste management.Second party opinion: CiceroExpiry date : 18 May 2022
KommunInvest
The proceeds of the KommunInvest green bonds are used to promote the transition to a low-carbon and climate-resilient society. Projects must be a part of the systematic environmental work in the applicant municipality or county region and be related to Sweden’s national environmental objectives, or to regional environmental goals.Second party opinion: CiceroExpiry date : 1 June 2023
Danmarks grønne investeringsfond
Danmarks Grønne Investeringsfond are financing corporations that has its main activities with “green development” products. The fond is financing projects within renewable energy, energy efficiency and resource efficiency.Expiry date : 3 June 2019
3. Core business
3.1. Contributing to society
Dansk Bank has allocated a total of DKK 4 billion for investment in green bonds, and by 31 December 2018 we have invested DKK 3,496 billion in green bonds issued for large renewable energy projects and climate protection in Northern Europe. Green bonds represent a low-risk investment opportunity with competitive returns, and we evaluate new opportunities to invest in green bonds on an ongoing basis.
3.1.3. Green bonds
15
3. Core business
3.2. Responsible customer relationships
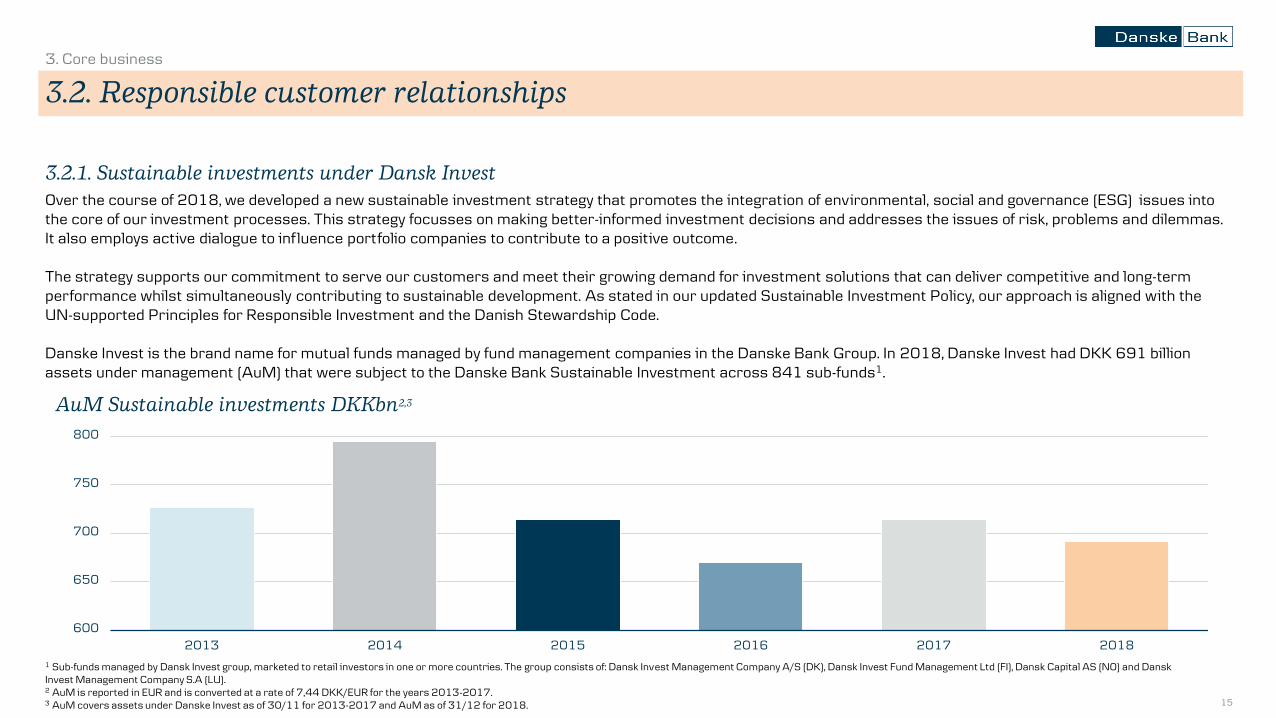
3.2.1. Sustainable investments under Dansk Invest
Over the course of 2018, we developed a new sustainable investment strategy that promotes the integration of environmental, social and governance (ESG) issues into the core of our investment processes. This strategy focusses on making better-informed investment decisions and addresses the issues of risk, problems and dilemmas. It also employs active dialogue to influence portfolio companies to contribute to a positive outcome.
The strategy supports our commitment to serve our customers and meet their growing demand for investment solutions that can deliver competitive and long-term performance whilst simultaneously contributing to sustainable development. As stated in our updated Sustainable Investment Policy, our approach is aligned with the UN-supported Principles for Responsible Investment and the Danish Stewardship Code.
Danske Invest is the brand name for mutual funds managed by fund management companies in the Danske Bank Group. In 2018, Danske Invest had DKK 691 billionassets under management (AuM) that were subject to the Danske Bank Sustainable Investment across 841 sub-funds1.
2013 2014 2015 2016 2017 2018600
650
700
750
800
AuM Sustainable investments DKKbn2,3
1 Sub-funds managed by Dansk Invest group, marketed to retail investors in one or more countries. The group consists of: Dansk Invest Management Company A/S (DK), Dansk Invest Fund Management Ltd (FI), Dansk Capital AS (NO) and Dansk Invest Management Company S.A (LU).2 AuM is reported in EUR and is converted at a rate of 7,44 DKK/EUR for the years 2013-2017. 3 AuM covers assets under Danske Invest as of 30/11 for 2013-2017 and AuM as of 31/12 for 2018.

16
3. Core business
3.2. Responsible customer relationships
3.2.2. Active ownership activities in investment products
Companies
422
Country domiciles
34
Interactions
643
We believe that fund-manager-driven dialogue with portfolio companies is the most effective way to engage with companies on ESG-related matters as the investment teams are the experts of their respective strategies and portfolios, and tasked with the buy/sell decision.
Our investment teams engage on a regular basis with portfolio companies on material ESG matters to understand their risks andopportunities, and to support their growth and development.
We log and monitor company dialogue and progress to ensure a structured engagement process.
In 2018, we have had the following engagement activities:
For more information see Danske Bank Asset Management’s Active Ownership report at www.danskebank.com.

17
Meetings
313
Proposals
4,597
Country domiciles
22
The annual general meeting of a portfolio company is an opportunity to voice our opinion, vote on issues of key importance to the running of a company, and contribute to the good governance of the company.
We exercise the right to vote at annual general meetings of Nordic and European companies where we represent relevant holdings. Unless required by special circumstances, holdings in passively managed funds are not subject to voting activities.
We vote either by ourselves or through a service provider.
We log and publish our voting records.
In 2018, we have had the voting activities:
3.2.2. Active ownership activities in investment products
3. Core business
3.2. Responsible customer relationships
For more information see Danske Bank Asset Management’s Active Ownership report at www.danskebank.com.
18
3. Core business
3.2. Responsible customer relationships
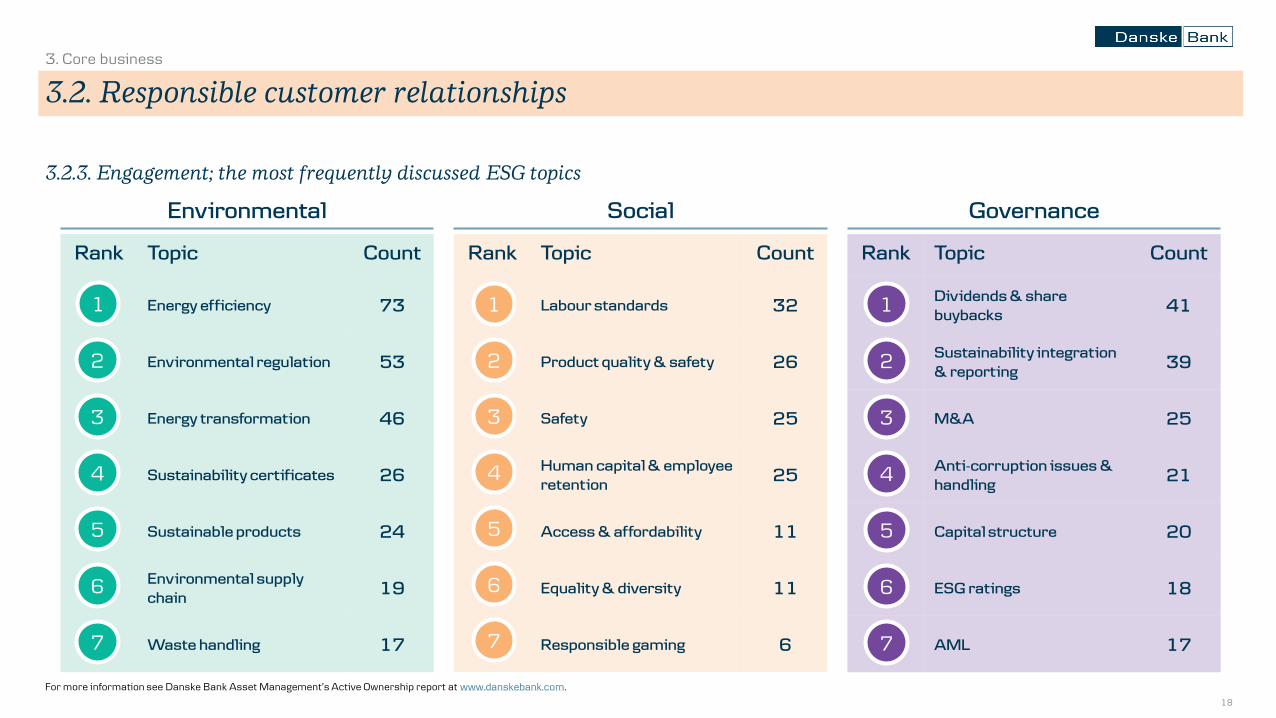
3.2.3. Engagement; the most frequently discussed ESG topics
Environmental Social Governance
Rank Topic Count
1 Energy efficiency 73
2 Environmental regulation 53
3 Energy transformation 46
4 Sustainability certificates 26
5 Sustainable products 24
6Environmental supply
chain19
7 Waste handling 17
Rank Topic Count
1 Labour standards 32
2 Product quality & safety 26
3 Safety 25
Human capital & employee
retention25
Access & affordability 11
Equality & diversity 11
Responsible gaming 6
Rank Topic Count
1Dividends & share
buybacks41
2Sustainability integration
& reporting39
3 M&A 25
4Anti-corruption issues &
handling21
5 Capital structure 20
6 ESG ratings 18
7 AML 17
1
4
5
6
7
2
3
1
2
3
1
4
5
6
7
2
3
4
5
6
7
For more information see Danske Bank Asset Management’s Active Ownership report at www.danskebank.com.
19
3. Core business
3.3. Responsible employer
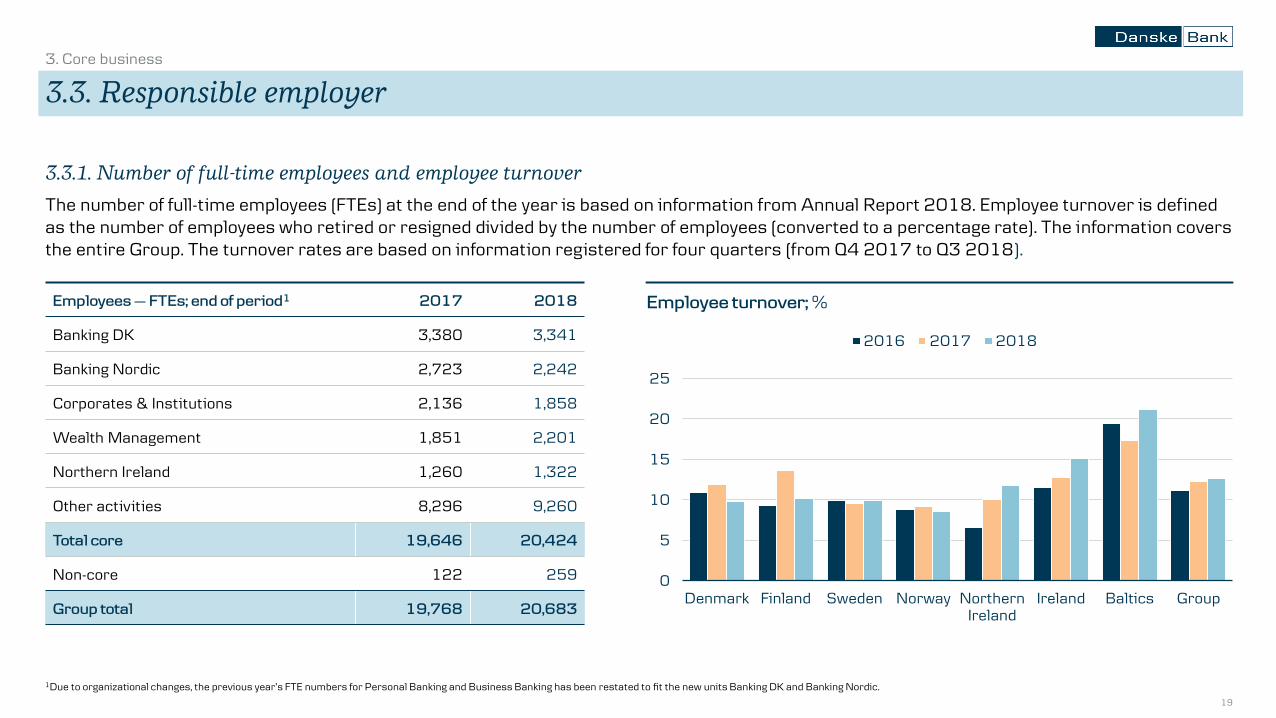
The number of full-time employees (FTEs) at the end of the year is based on information from Annual Report 2018. Employee turnover is defined as the number of employees who retired or resigned divided by the number of employees (converted to a percentage rate). The information covers the entire Group. The turnover rates are based on information registered for four quarters (from Q4 2017 to Q3 2018).
Denmark Finland Sweden Norway NorthernIreland
Ireland Baltics Group
2016 2017 2018
0
5
10
15
20
25
3.3.1. Number of full-time employees and employee turnover
Employees — FTEs; end of period1 2017 2018
Banking DK 3,380 3,341
Banking Nordic 2,723 2,242
Corporates & Institutions 2,136 1,858
Wealth Management 1,851 2,201
Northern Ireland 1,260 1,322
Other activities 8,296 9,260
Total core 19,646 20,424
Non-core 122 259
Group total 19,768 20,683
Employee turnover; %
1Due to organizational changes, the previous year’s FTE numbers for Personal Banking and Business Banking has been restated to fit the new units Banking DK and Banking Nordic.
20
3. Core business
3.3. Responsible employer
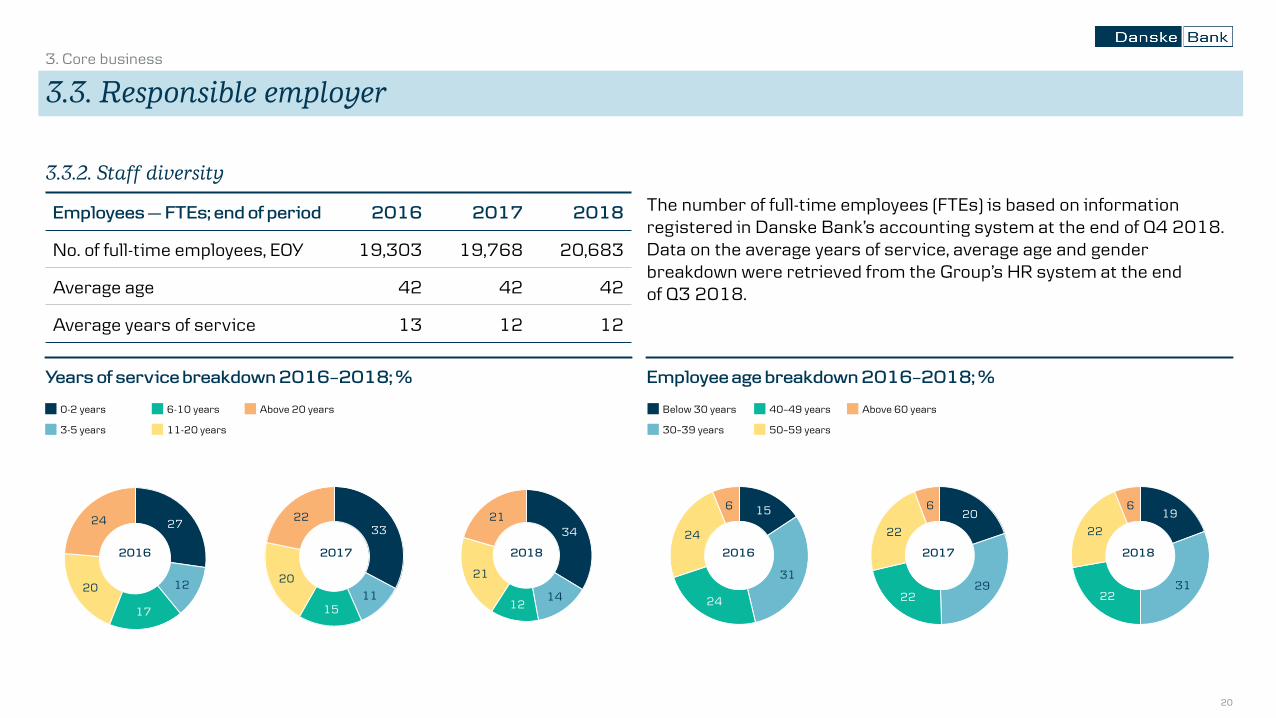
The number of full-time employees (FTEs) is based on information registered in Danske Bank’s accounting system at the end of Q4 2018. Data on the average years of service, average age and gender breakdown were retrieved from the Group’s HR system at the endof Q3 2018.
27
12
17
20
2433
1115
20
2215
31
24
24
620
2922
22
6
2016 2017
34
1412
21
21
2018
19
3122
22
6
3.3.2. Staff diversity
Employees — FTEs; end of period 2016 2017 2018
No. of full-time employees, EOY 19,303 19,768 20,683
Average age 42 42 42
Average years of service 13 12 12
Employee age breakdown 2016–2018; %Years of service breakdown 2016–2018; %
2016 2017 2018
Above 60 years40–49 years
50–59 years
Below 30 years
30–39 years
Above 20 years6-10 years
11-20 years
0-2 years
3-5 years

21
3. Core business
3.3. Responsible employer
Denmark Finland Sweden Norway NorthernIreland
Ireland Baltics
Male managers Female managers
6959 55 62
50
3141 45 38
50
83
52
17
48
Denmark Finland Sweden Norway NorthernIreland
Ireland Baltics
Male employees Female emplyees
5437
49 5337
4663
51 4763
5845
4255
3.3.3. Gender diversity
Employees — FTEs; end of period 2016 2017 2018
No. of full-time employees, EOY 19,303 19,768 20,683
% of women in workforce (%) 50 49 50
% of women in management (%)1 35 35 37
Gender target and performance Performance
2018
Targets
2020
Share of AMG-elected Board of Directors being women
38% 38%
Share of women on the Executive Board 10% 25%
Share of women in management positions 37% 38-40%
Gender breakdown 2018; managers; %Gender breakdown 2018; employees; %
1 Managers is defined as persons with staff responsibility.

22
3. Core business
3.3. Responsible employer
• In 2017, we introduced two new employeeengagement tools: ‒ A Team Talk tool, which engages managers and
employees in dialogue at a local level‒ A monthly PULSE survey, which provides management
insights on themes such as empowerment, collaboration and our core values
• This year we achieved an employee engagement index of 84%. The Group aims for increasing the employee engagement index to 90% in 2020.
Hit-the-wall
10%
Activated
66%
Truly engaged
19%
Stuck
4%
Tied-up
2%
Low High
Enablement
Hig
hLo
w
En
cou
rag
em
en
t
3.3.4. Opinion survey

23
3. Core business
3.3. Responsible employer
1 The figures cover the entire Group except for the Baltics.2 A flex job is a Danish work arrangement for people with reduced ability to work.
3.3.5. Work-life balance
• The number of part-time employees covers the entire Group and is reported as registered at the end of Q3 2018. Part-time employees are defined as persons with working hours equivalent to less than 100% of the standard working hours determined by collectivewage agreement.
• The number of f lex jobs covers activities in Denmark only and are based on information registered at the endof Q3 2018.
2016 2017 2018
Women working part-time 1,864 1,778 1,278
Men working part-time 341 389 303
Leaves of absence granted for other reasons (No. of employees granted leave of absence during the year)1
376 333 384
Part-time schemes 2,205 2,171 1,871
No. of employees on leave during the year1 1,402 1,241 1,521
No. of f lex jobs2 38 33 38

24
3. Core business
3.3. Responsible employer
3.3.6. Health and safety
• Absence due to illness is defined as time lost due to the employee’s own illness, including pregnancy-related sick leave, occupational accidents and diseases. The rate of absence is calculated as the average number of registered days of absence per employee. Data on absence in 2018 cover Denmark, Norway and Sweden in the period Q1 2018 to Q4 2018. The data may be underreported if employees do not register their illness.
• The number of injuries or incidents of potentialpost-traumatic stress related to robberies is defined as the number of injuries or employees reported to the authorities where an employee has been involved in a robbery, a violent situation or received a threat.
• The number of other physical or mental injuries is defined as the number of injuries reported to the authorities that is not related to a robbery or other criminal activity.
• The number of employees who filed claims under their medical expense policies is defined as the number of claims related to the Group’s agreement on medical insurance. Only employees in Denmark are covered by medical insurance.
2016 2017 2018
Absence due to illness (avg. no. of days lost through illness per employee)1 5.3 5.4 5.4
Injuries or post-traumatic stress related to robberies
71 250 110
Other physical or mental injuries 73 86 90
Employees who filed claims under medical insurance
4,030 4,346 3,393
1 Due to missing data for Finland, 2018 data only covers Denmark, Sweden and Norway and cannot be directly compared to previous years.
25
3. Core business
3.4. Environmental footprint
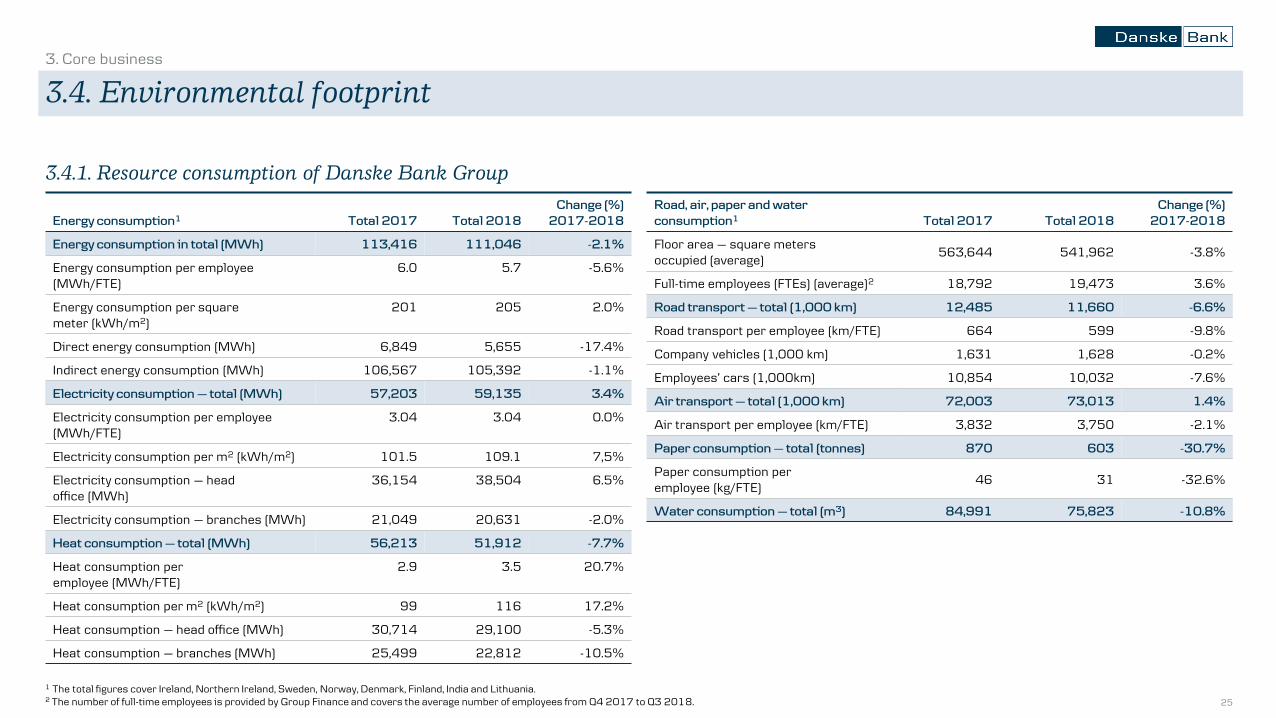
1 The total figures cover Ireland, Northern Ireland, Sweden, Norway, Denmark, Finland, India and Lithuania.2 The number of full-time employees is provided by Group Finance and covers the average number of employees from Q4 2017 to Q3 2018.
3.4.1. Resource consumption of Danske Bank Group
Energy consumption1 Total 2017 Total 2018
Change (%)
2017-2018
Energy consumption in total (MWh) 113,416 111,046 -2.1%
Energy consumption per employee (MWh/FTE)
6.0 5.7 -5.6%
Energy consumption per squaremeter (kWh/m2)
201 205 2.0%
Direct energy consumption (MWh) 6,849 5,655 -17.4%
Indirect energy consumption (MWh) 106,567 105,392 -1.1%
Electricity consumption — total (MWh) 57,203 59,135 3.4%
Electricity consumption per employee (MWh/FTE)
3.04 3.04 0.0%
Electricity consumption per m2 (kWh/m2) 101.5 109.1 7,5%
Electricity consumption — headoffice (MWh)
36,154 38,504 6.5%
Electricity consumption — branches (MWh) 21,049 20,631 -2.0%
Heat consumption — total (MWh) 56,213 51,912 -7.7%
Heat consumption peremployee (MWh/FTE)
2.9 3.5 20.7%
Heat consumption per m2 (kWh/m2) 99 116 17.2%
Heat consumption — head office (MWh) 30,714 29,100 -5.3%
Heat consumption — branches (MWh) 25,499 22,812 -10.5%
Road, air, paper and water
consumption1 Total 2017 Total 2018
Change (%)
2017-2018
Floor area — square metersoccupied (average)
563,644 541,962 -3.8%
Full-time employees (FTEs) (average)2 18,792 19,473 3.6%
Road transport — total (1,000 km) 12,485 11,660 -6.6%
Road transport per employee (km/FTE) 664 599 -9.8%
Company vehicles (1,000 km) 1,631 1,628 -0.2%
Employees’ cars (1,000km) 10,854 10,032 -7.6%
Air transport — total (1,000 km) 72,003 73,013 1.4%
Air transport per employee (km/FTE) 3,832 3,750 -2.1%
Paper consumption — total (tonnes) 870 603 -30.7%
Paper consumption peremployee (kg/FTE)
46 31 -32.6%
Water consumption — total (m3) 84,991 75,823 -10.8%

26
3. Core business
3.4. Environmental footprint
3.4.2. Breakdown of energy consumption – country level
Resource consumption in 2018 Denmark Finland Sweden Norway
Northern
Ireland Ireland Lithuania India
Energy consumption in total (MWh) 69,233 11,313 6,316 6,107 6,368 173 10,017 1,520
Energy consumption peremployee (MWh/FTE)
6.8 6.4 4.6 5.4 4.6 3.2 3.9 1.6
Energy consumption per squaremeter (kWh/m2)
224 152 154 172 215 165 271 103
Direct energy consumption (MWh) 3,351 - - - 2,304 - - -
Indirect energy consumption (MWh) 65,882 11,313 6,316 6,107 4,064 173 10,017 1,520
Electricity consumption — total (MWh) 33,352 5,384 3,247 4,304 4,064 173 7,091 1,520
Electricity consumption peremployee (MWh/FTE)
3.3 3.1 2.3 3.8 2.9 3.2 2.7 1.6
Electricity consumption per m2 (kWh/m2) 108 73 79 121 137 165 192 103
Electricity consumption — head office (MWh) 21,690 2,573 1,880 1,695 1,953 173 7,020 1,520
Electricity consumption — branches (MWh) 11,662 2,811 1,367 2,609 2,111 - 71 -
Heat consumption — total (MWh) 35,881 5,929 3,069 1,803 2,304 - 2,926 -
Heat consumption per employee (MWh/FTE) 3.5 3.4 2.2 1.6 1.7 - 1.1 -
Heat consumption per m2 (kWh/m2) 116 80 75 51 78 - 79 -
Heat consumption — head office (MWh) 19,401 3,079 1,302 1,382 1,052 - 2,885 -
Heat consumption — branches (MWh) 16,480 2,850 1,767 422 1,252 - 41 -
27
3. Core business
3.4. Environmental footprint
1The number of full-time employees is provided by Group Finance and covers the average number of employees from Q4 2017 to Q3 2018.
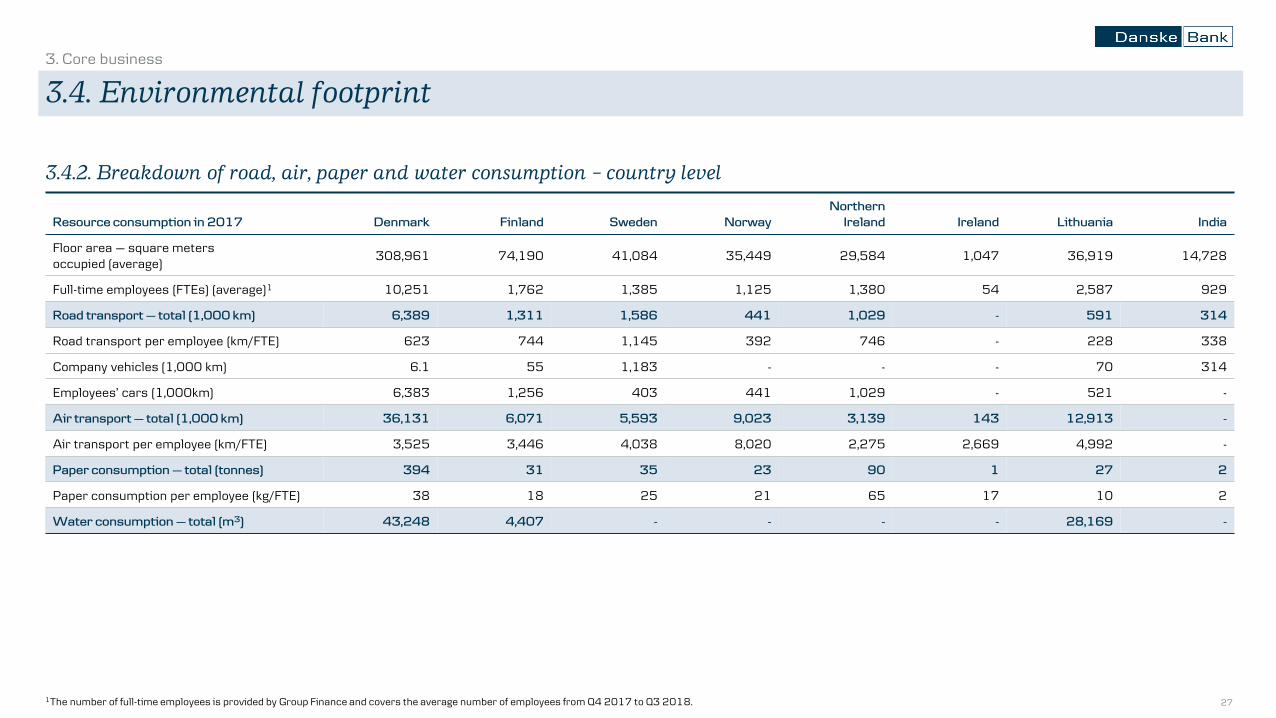
3.4.2. Breakdown of road, air, paper and water consumption – country level
Resource consumption in 2017 Denmark Finland Sweden Norway
Northern
Ireland Ireland Lithuania India
Floor area — square metersoccupied (average)
308,961 74,190 41,084 35,449 29,584 1,047 36,919 14,728
Full-time employees (FTEs) (average)1 10,251 1,762 1,385 1,125 1,380 54 2,587 929
Road transport — total (1,000 km) 6,389 1,311 1,586 441 1,029 - 591 314
Road transport per employee (km/FTE) 623 744 1,145 392 746 - 228 338
Company vehicles (1,000 km) 6.1 55 1,183 - - - 70 314
Employees’ cars (1,000km) 6,383 1,256 403 441 1,029 - 521 -
Air transport — total (1,000 km) 36,131 6,071 5,593 9,023 3,139 143 12,913 -
Air transport per employee (km/FTE) 3,525 3,446 4,038 8,020 2,275 2,669 4,992 -
Paper consumption — total (tonnes) 394 31 35 23 90 1 27 2
Paper consumption per employee (kg/FTE) 38 18 25 21 65 17 10 2
Water consumption — total (m3) 43,248 4,407 - - - - 28,169 -
28
3. Core business
3.4. Environmental footprint
1 We neutralise emissions by investing in certified carbon credit projects. Read more about the projects at www.danskebank.com/societal-impact.
Breakdown of CO2
emissions across Danske Bank Group’s marketsTotal CO2
emissions by the Danske Bank Group
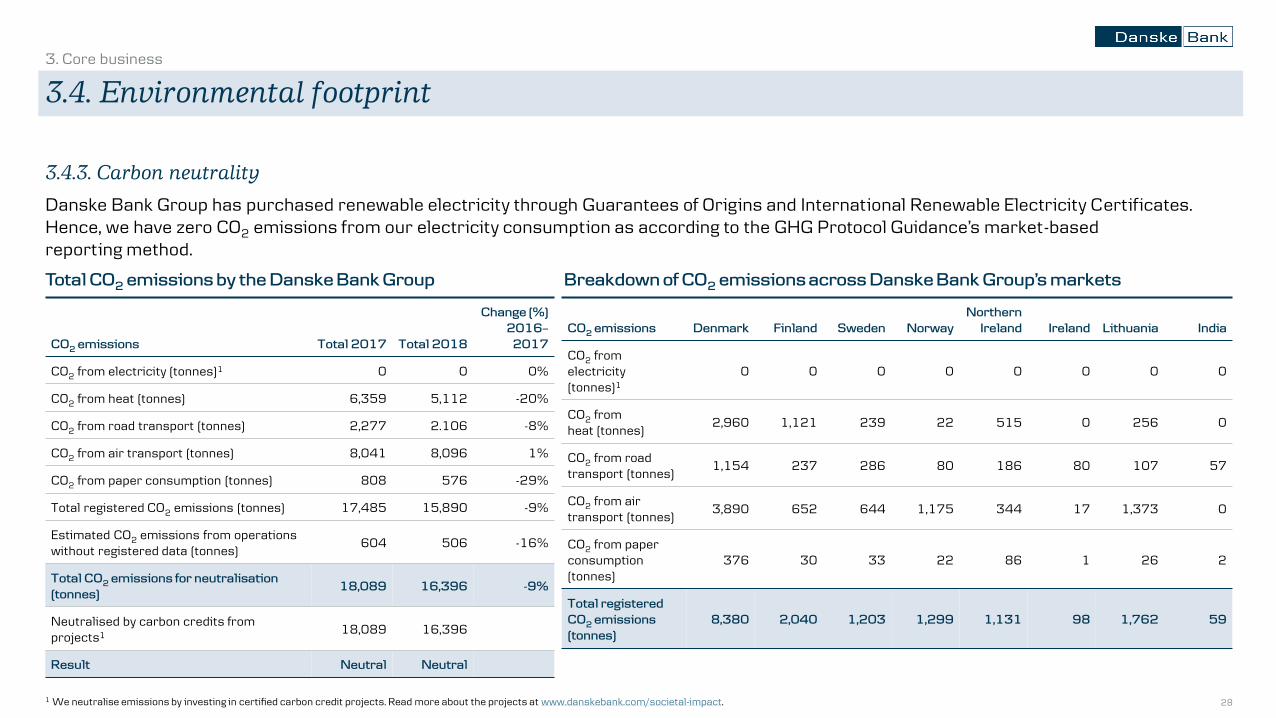
3.4.3. Carbon neutrality
Danske Bank Group has purchased renewable electricity through Guarantees of Origins and International Renewable Electricity Certificates. Hence, we have zero CO2 emissions from our electricity consumption as according to the GHG Protocol Guidance’s market-basedreporting method.
CO2
emissions Total 2017 Total 2018
Change (%)
2016–
2017
CO2 from electricity (tonnes)1 0 0 0%
CO2 from heat (tonnes) 6,359 5,112 -20%
CO2 from road transport (tonnes) 2,277 2.106 -8%
CO2 from air transport (tonnes) 8,041 8,096 1%
CO2 from paper consumption (tonnes) 808 576 -29%
Total registered CO2 emissions (tonnes) 17,485 15,890 -9%
Estimated CO2 emissions from operations without registered data (tonnes)
604 506 -16%
Total CO2
emissions for neutralisation
(tonnes)18,089 16,396 -9%
Neutralised by carbon credits from projects1 18,089 16,396
Result Neutral Neutral
CO2
emissions Denmark Finland Sweden Norway
Northern
Ireland Ireland Lithuania India
CO2 from electricity(tonnes)1
0 0 0 0 0 0 0 0
CO2 from heat (tonnes)
2,960 1,121 239 22 515 0 256 0
CO2 from road transport (tonnes)
1,154 237 286 80 186 80 107 57
CO2 from air transport (tonnes)
3,890 652 644 1,175 344 17 1,373 0
CO2 from paper consumption(tonnes)
376 30 33 22 86 1 26 2
Total registered
CO2
emissions
(tonnes)
8,380 2,040 1,203 1,299 1,131 98 1,762 59

29
3. Core business
3.4. Environmental footprint
Breakdown of CO2
emissions by scope; %
8
30
62
8
31
61
Scope 1 (direct CO2 emissions)
Scope 2 (indirect CO2 emissions)
Scope 3 (other indirect CO2 emissions)
2016 2017 2018
3.4.4. Direct and indirect CO2 emissions of Danske Bank Group
Direct CO2 emissions (scope 1) comprise emissions from electricity, heat and steam generated by the organisation (within the organisational boundaries). The Group uses fuels such as oil and gas for heating to only a very limited extent. Indirect CO2 emissions (scope 2) comprise emissions from electricity, heat and steam consumed by the organisation (energy supplied from outside the organisational boundaries). Other indirect CO2 emissions (scope 3) include emissions from purchased goods and services, paper and business travel by air and car.
Direct and indirect emissions Total 2016 Total 2017 Total 2018
Scope 1 – CO2 direct (tonnes) 1,448 1,472 1,231
Heating from consumption of oil andgas (tonnes)
1,121 1,175 937
Use of company vehicles (tonnes) 327 298 294
Scope 2 – CO2
indirect (tonnes) 5,581 5,184 4,175
Electricity from external suppliers (tonnes) 0 0 0
Heating from external suppliers (tonnes) 5,581 5,184 4,175
Scope 3 – Other CO2
indirect (tonnes) 10,963 10,829 10,484
Air transport (tonnes) 7,605 8,041 8,095
Paper consumption (tonnes) 1,090 808 576
Use of employees’ cars (tonnes) 2,268 1,980 1,812
Estimated CO2
emissions, direct and
indirect, from operations without registered
data (tonnes)
671 604 506
Total CO2
emissions (tonnes) 18,664 18,089 16,396
8
25
64
30
3. Core business
3.4. Environmental footprint
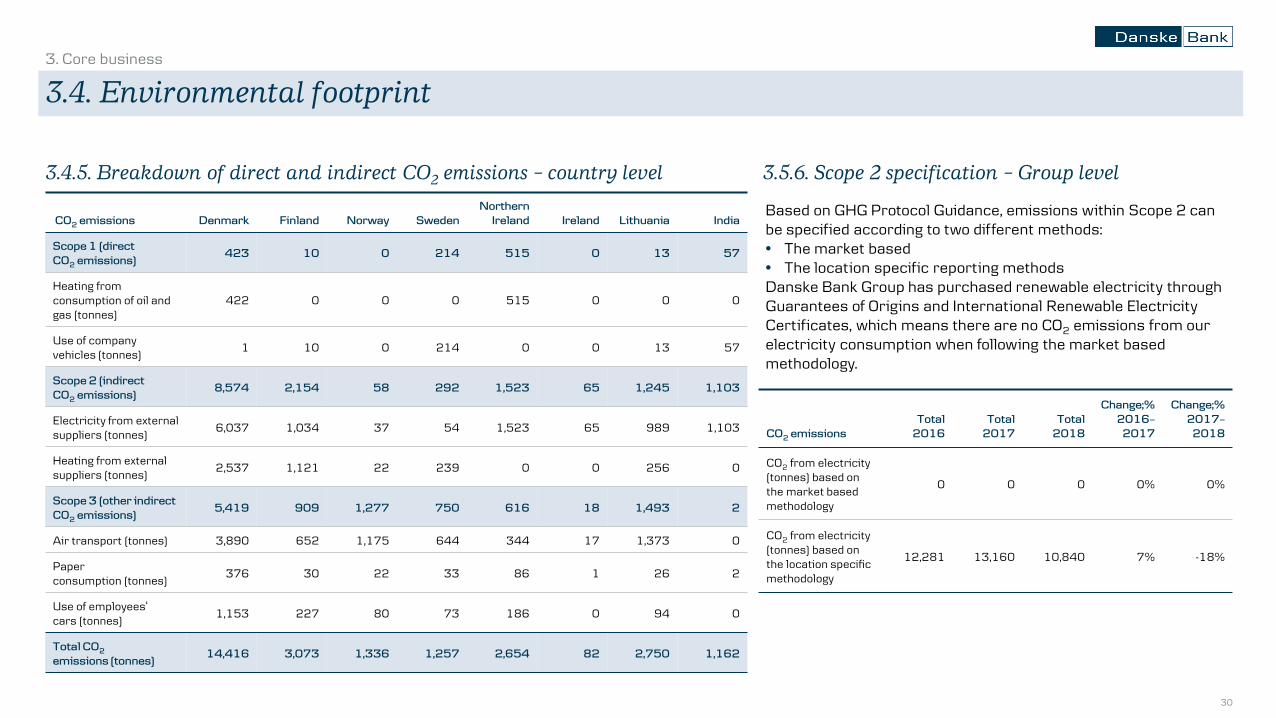
Based on GHG Protocol Guidance, emissions within Scope 2 can be specified according to two different methods:• The market based • The location specific reporting methods Danske Bank Group has purchased renewable electricity through Guarantees of Origins and International Renewable Electricity Certificates, which means there are no CO2 emissions from our electricity consumption when following the market based methodology.
CO2
emissions Denmark Finland Norway Sweden
Northern
Ireland Ireland Lithuania India
Scope 1 (direct
CO2
emissions)423 10 0 214 515 0 13 57
Heating from consumption of oil and gas (tonnes)
422 0 0 0 515 0 0 0
Use of companyvehicles (tonnes)
1 10 0 214 0 0 13 57
Scope 2 (indirect
CO2
emissions)8,574 2,154 58 292 1,523 65 1,245 1,103
Electricity from external suppliers (tonnes)
6,037 1,034 37 54 1,523 65 989 1,103
Heating from external suppliers (tonnes)
2,537 1,121 22 239 0 0 256 0
Scope 3 (other indirect
CO2
emissions)5,419 909 1,277 750 616 18 1,493 2
Air transport (tonnes) 3,890 652 1,175 644 344 17 1,373 0
Paperconsumption (tonnes)
376 30 22 33 86 1 26 2
Use of employees‘cars (tonnes)
1,153 227 80 73 186 0 94 0
Total CO2
emissions (tonnes)14,416 3,073 1,336 1,257 2,654 82 2,750 1,162
3.4.5. Breakdown of direct and indirect CO2 emissions – country level 3.5.6. Scope 2 specification – Group level
CO2
emissions
Total
2016
Total
2017
Total
2018
Change;%
2016–
2017
Change;%
2017–
2018
CO2 from electricity (tonnes) based on the market based methodology
0 0 0 0% 0%
CO2 from electricity (tonnes) based on the location specific methodology
12,281 13,160 10,840 7% -18%
31
3. Core business
3.4. Environmental footprint
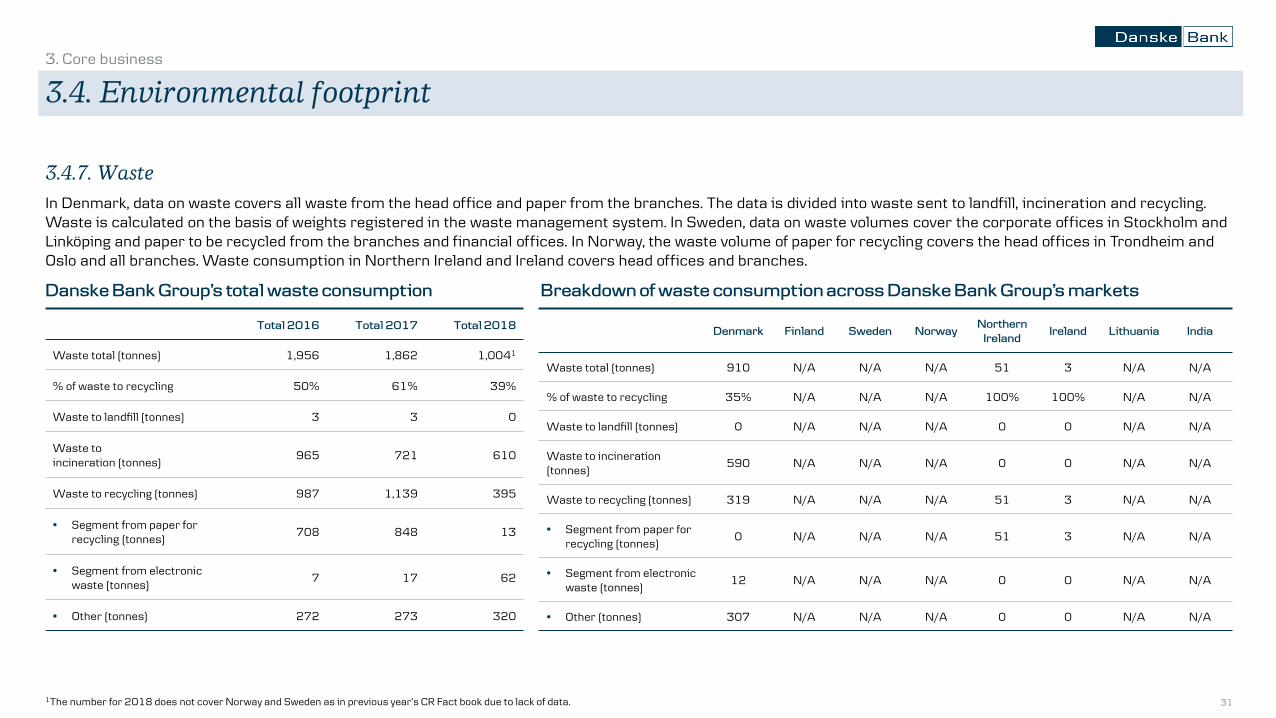
3.4.7. Waste
In Denmark, data on waste covers all waste from the head office and paper from the branches. The data is divided into waste sent to landfill, incineration and recycling. Waste is calculated on the basis of weights registered in the waste management system. In Sweden, data on waste volumes cover the corporate offices in Stockholm and Linköping and paper to be recycled from the branches and financial offices. In Norway, the waste volume of paper for recycling covers the head offices in Trondheim and Oslo and all branches. Waste consumption in Northern Ireland and Ireland covers head offices and branches.
Danske Bank Group’s total waste consumption Breakdown of waste consumption across Danske Bank Group’s markets
Denmark Finland Sweden Norway Northern
Ireland Ireland Lithuania India
Waste total (tonnes) 910 N/A N/A N/A 51 3 N/A N/A
% of waste to recycling 35% N/A N/A N/A 100% 100% N/A N/A
Waste to landfill (tonnes) 0 N/A N/A N/A 0 0 N/A N/A
Waste to incineration (tonnes)
590 N/A N/A N/A 0 0 N/A N/A
Waste to recycling (tonnes) 319 N/A N/A N/A 51 3 N/A N/A
• Segment from paper for recycling (tonnes)
0 N/A N/A N/A 51 3 N/A N/A
• Segment from electronic waste (tonnes)
12 N/A N/A N/A 0 0 N/A N/A
• Other (tonnes) 307 N/A N/A N/A 0 0 N/A N/A
Total 2016 Total 2017 Total 2018
Waste total (tonnes) 1,956 1,862 1,0041
% of waste to recycling 50% 61% 39%
Waste to landfill (tonnes) 3 3 0
Waste toincineration (tonnes)
965 721 610
Waste to recycling (tonnes) 987 1,139 395
• Segment from paper for recycling (tonnes)
708 848 13
• Segment from electronic waste (tonnes)
7 17 62
• Other (tonnes) 272 273 320
1The number for 2018 does not cover Norway and Sweden as in previous year’s CR Fact book due to lack of data.
32
3. Core business
3.4. Environmental footprint
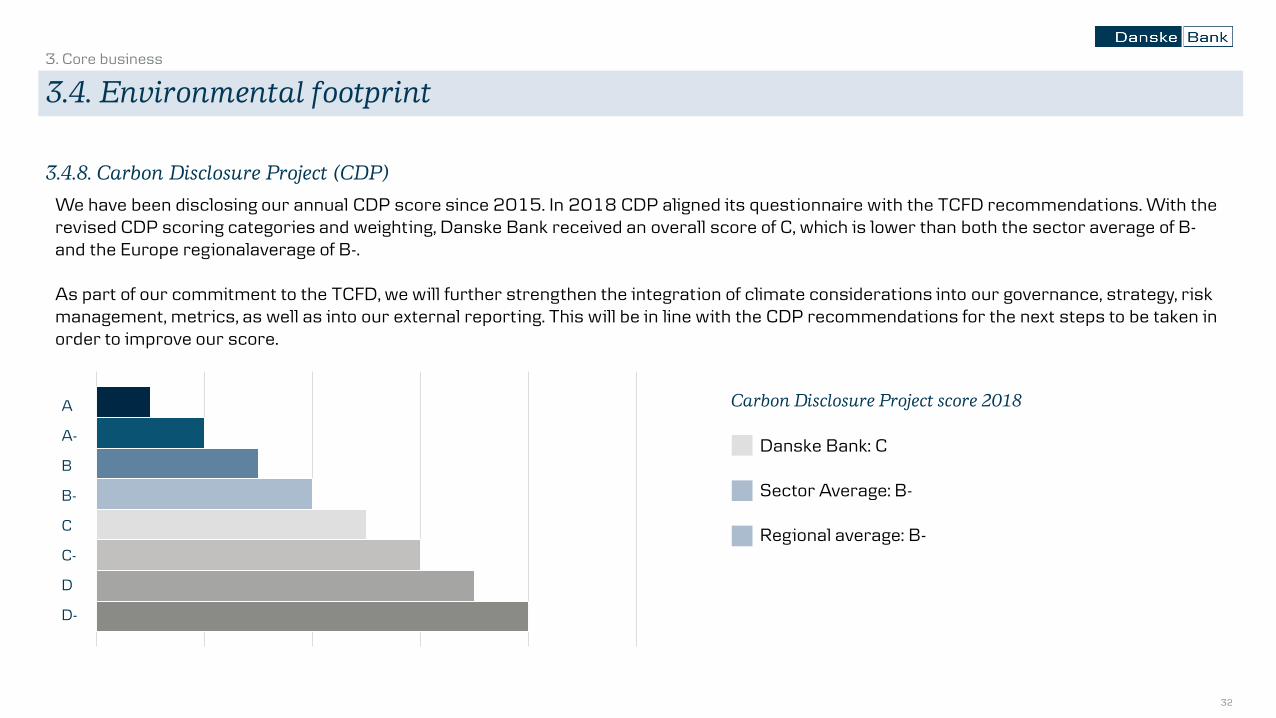
3.4.8. Carbon Disclosure Project (CDP)
We have been disclosing our annual CDP score since 2015. In 2018 CDP aligned its questionnaire with the TCFD recommendations. With the revised CDP scoring categories and weighting, Danske Bank received an overall score of C, which is lower than both the sector average of B-and the Europe regionalaverage of B-.
As part of our commitment to the TCFD, we will further strengthen the integration of climate considerations into our governance, strategy, risk management, metrics, as well as into our external reporting. This will be in line with the CDP recommendations for the next steps to be taken in order to improve our score.
Carbon Disclosure Project score 2018
Danske Bank: C
Sector Average: B-
Regional average: B-
A
A-
B
B-
C
C-
D
D-