Embed Size (px)
Citation preview

Corporate PresentationMarch 2018
2
Disclaimer
The material that follows comprises information about Avianca Holdings S.A. (the “Company”) and its subsidiaries, as of the date of the presentation. It has been prepared solely for informational purposes and is not
to be construed as a solicitation or an offer to buy or sell any securities and should not be treated as giving legal, tax, investment or other advice to potential investors. The information presented or contained herein
is in summary form and does not purport to be complete.
No representations or warranties, express or implied, are made as to, and no reliance should be placed on, the accuracy, fairness, or completeness of this information. Neither the Company nor any of its affiliates,
advisers or representatives accepts any responsibility whatsoever for any loss or damage arising from any information presented or contained in this presentation. The information presented or contained in this
presentation is current as of the date hereof and is subject to change without notice, and its accuracy is not guaranteed. Neither the Company nor any of its affiliates, advisers or representatives makes any
undertaking to update any such information subsequent to the date hereof.
This presentation contains forward-looking statements, which are based upon the Company and/or its management’s current expectations and projections about future events. When used in this presentation, the
words “believe,” “anticipate,” “intend,” “estimate,” “expect,” “should,” “may” and similar expressions, or the negative of such words and expressions, are intended to identify forward-looking statements, although
not all forward-looking statements contain such words or expressions. Additionally, all information, other than historical facts included in this presentation is forward-looking information. Such statements and
information are subject to a number of risks, uncertainties and assumptions. Forward-looking statements are not guarantees of future performance and actual results may differ materially from those anticipated due
to many factors. As for forward-looking statements that relate to future financial results and other projections, actual results may be different due to the inherent uncertainty of estimates, forecasts and projections.
Because of these uncertainties, potential investors should not rely on these forward-looking statements. Neither the Company nor any of its affiliates, directors, officers, agents or employees, nor any of the
shareholders or initial purchasers shall be liable, in any event, before any third party (including investors) for any investment or business decision made or action taken in reliance on the information and statements
contained in this presentation or for any consequential, special or similar damages.
Certain data in this presentation was obtained from various external sources, and neither the Company nor its affiliates, advisers or representatives has verified such data with independent sources. Accordingly,
neither the Company nor any of its affiliates, advisers or representatives makes any representations as to the accuracy or completeness of that data, and such data involves risks and uncertainties and is subject to
change based on various factors.
In addition to IFRS financials, this presentation includes certain non-IFRS financial measures, including Adjusted EBITDAR, which is commonly used in the airline industry to view operating results before depreciation,
amortization and aircraft operating lease charges, as these costs can vary significantly among airlines due to differences in the way airlines finance their aircraft and other asset acquisitions. However, Adjusted
EBITDAR should not be considered as an alternative measure to operating profit, as an indicator of operating performance, as an alternative to operating cash flows or as a measure of the Company’s liquidity.
Adjusted EBITDAR as calculated by the Company and as presented in this document may differ materially from similarly titled measures reported by other companies due to differences in the way these measures are
calculated. Adjusted EBITDAR has important limitations as an analytical tool and should not be considered in isolation from, or as a substitute for an analysis of, the Company’s operating results as reported under
IFRS.
The trademarks included herein are the property of the owners thereof and are used for reference purposes only. Such use should not be construed as an endorsement of the products or services of the Company or
this proposed offering.

3
Agenda
Company Overview and Track Record
Leading Airline in Latin America focused on
service excellence
Strong Operational and Financial Performance
1
2
3
Strategic Projects and Full Year Outlook5
Diversified Sources of Revenue with Growing
Non-Passenger Businesses4
Company Overview and Track Record
6.0% -8.0%6.2%
5
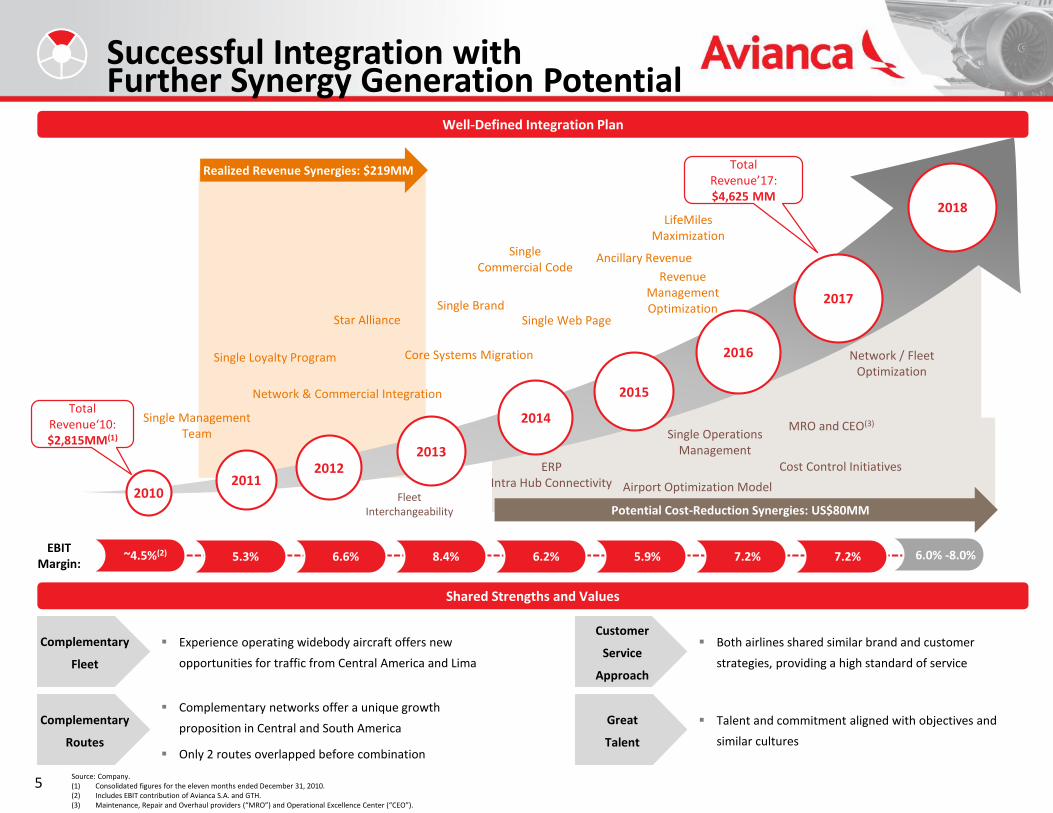
Successful Integration with Further Synergy Generation Potential
Source: Company.(1) Consolidated figures for the eleven months ended December 31, 2010.(2) Includes EBIT contribution of Avianca S.A. and GTH.(3) Maintenance, Repair and Overhaul providers (“MRO”) and Operational Excellence Center (“CEO”).
Well-Defined Integration Plan
▪ Experience operating widebody aircraft offers new
opportunities for traffic from Central America and Lima
▪ Complementary networks offer a unique growth
proposition in Central and South America
▪ Only 2 routes overlapped before combination
Complementary
Routes
Complementary
Fleet
▪ Both airlines shared similar brand and customer
strategies, providing a high standard of service
▪ Talent and commitment aligned with objectives and
similar cultures
Customer
Service
Approach
Great
Talent
Shared Strengths and Values
Total Revenue’17: $4,625 MM
Total Revenue‘10: $2,815MM(1)
Single Management Team
Single Loyalty Program
Network & Commercial Integration
Star Alliance
LifeMiles Maximization
Realized Revenue Synergies: $219MM
6.6% 8.4%5.3% 5.9% 7.2%~4.5%(2)EBITMargin:
20112012
Core Systems Migration
Single Brand
Single Commercial Code
Revenue ManagementOptimization
Ancillary Revenue
ERPIntra Hub Connectivity Airport Optimization Model
Single Operations Management
Fleet Interchangeability
Cost Control Initiatives
Potential Cost-Reduction Synergies: US$80MM
2015
2016
2014
2017
Network / Fleet Optimization
MRO and CEO(3)
Single Web Page
2013
2010
7.2%
2018
Colombia Domestic
#1
54.5% Market Share(3)
Intra-Home Markets(4)
#1
65.8% Market Share(3)
Home Markets to Spain
#1
28.1% Market Share(3)
6
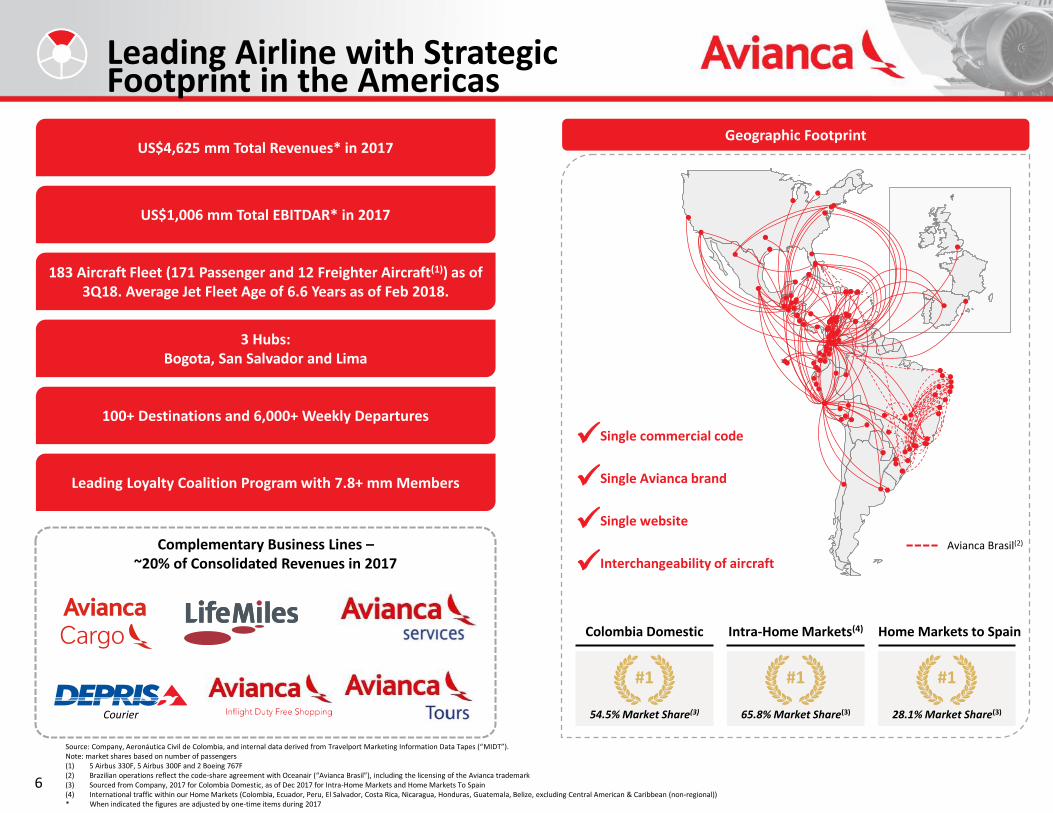
Leading Airline with Strategic Footprint in the Americas
US$4,625 mm Total Revenues* in 2017
100+ Destinations and 6,000+ Weekly Departures
US$1,006 mm Total EBITDAR* in 2017
183 Aircraft Fleet (171 Passenger and 12 Freighter Aircraft(1)) as of 3Q18. Average Jet Fleet Age of 6.6 Years as of Feb 2018.
3 Hubs:Bogota, San Salvador and Lima
Source: Company, Aeronáutica Civil de Colombia, and internal data derived from Travelport Marketing Information Data Tapes (“MIDT”). Note: market shares based on number of passengers(1) 5 Airbus 330F, 5 Airbus 300F and 2 Boeing 767F(2) Brazilian operations reflect the code-share agreement with Oceanair (“Avianca Brasil”), including the licensing of the Avianca trademark(3) Sourced from Company, 2017 for Colombia Domestic, as of Dec 2017 for Intra-Home Markets and Home Markets To Spain(4) International traffic within our Home Markets (Colombia, Ecuador, Peru, El Salvador, Costa Rica, Nicaragua, Honduras, Guatemala, Belize, excluding Central American & Caribbean (non-regional))* When indicated the figures are adjusted by one-time items during 2017
Complementary Business Lines –~20% of Consolidated Revenues in 2017
Single commercial code✓
Single Avianca brand✓
Single website✓
Interchangeability of aircraft✓
Leading Loyalty Coalition Program with 7.8+ mm Members
Geographic Footprint
(NY008B8R) 684268_1.wor(NY008B8R) 684268_1.wor(NY008B8R) 684268_1.wor(NY008B8R) 684268_1.wor(NY008B8R) 684268_1.wor(NY008B8R) 684268_1.wor(NY008B8R) 684268_1.wor(NY008B8R) 684268_1.wor(NY008B8R) 684268_1.wor(NY008B8R) 684268_1.wor(NY008B8R) 684268_1.wor(NY008B8R) 684268_1.wor(NY008B8R) 684268_1.wor(NY008B8R) 684268_1.wor(NY008B8R) 684268_1.wor(NY008B8R) 684268_1.wor(NY008B8R) 684268_1.wor(NY008B8R) 684268_1.wor(NY008B8R) 684268_1.wor(NY008B8R) 684268_1.wor(NY008B8R) 684268_1.wor(NY008B8R) 684268_1.wor(NY008B8R) 684268_1.wor(NY008B8R) 684268_1.wor(NY008B8R) 684268_1.wor(NY008B8R) 684268_1.wor(NY008B8R) 684268_1.wor(NY008B8R) 684268_1.wor(NY008B8R) 684268_1.wor(NY008B8R) 684268_1.wor(NY008B8R) 684268_1.wor(NY008B8R) 684268_1.wor(NY008B8R) 684268_1.wor(NY008B8R) 684268_1.wor(NY008B8R) 684268_1.wor(NY008B8R) 684268_1.wor(NY008B8R) 684268_1.wor(NY008B8R) 684268_1.wor(NY008B8R) 684268_1.wor(NY008B8R) 684268_1.wor(NY008B8R) 684268_1.wor(NY008B8R) 684268_1.wor(NY008B8R) 684268_1.wor(NY008B8R) 684268_1.wor(NY008B8R) 684268_1.wor(NY008B8R) 684268_1.wor(NY008B8R) 684268_1.wor(NY008B8R) 684268_1.wor(NY008B8R) 684268_1.wor
Avianca Brasil(2)
Courier

Leading Airline in Latin America focused on service excellence

Leading Airline with Strategic Footprint in the Americas(5)
Peru(4)
8
Leading Airline in Latin America…
Source: Company and local regulators.(1) Market share based on number of passengers. Colombia: 2017, Perú: 2017, Ecuador: 2017(2) Brazilian operations reflect the code-share agreement with Oceanair (“Avianca Brasil”), including the licensing of the Avianca trademark to 2016(3) Reflects market share in the routes it operates as of April 2017.(4) Based on domestic and international passengers. Colombia and Peru, as of 2017(5) Market shares sourced from Company.(6) International traffic within our Home Markets (Colombia, Ecuador, Peru, El Salvador, Costa Rica, Nicaragua, Honduras, Guatemala, Belize, excluding Central American & Caribbean (non-regional)).
Significant Market Share Gains in Key Markets – Passenger Evolution (MM)
Colombia(4)
Domestic Operations
Avianca Brasil(2)
#1
Colombia Domestic54.5% Market Share
#3
Peru Domestic11.5% Market Share
#4
Brazil Domestic(2)
11.8% Market Share
24.0% Market Share in Core Network(3)
Leading Position in Latin American Markets(1)
#2
Ecuador Domestic24.3% Market Share
▪ Unparalleled route network connecting the Americas
▪ Leadership position in the markets served:
~54.5% domestic market share in Colombia
~65.8% market share in Intra-Home Markets(6)
~28.1% market share in Home Markets to Spain routes
Undisputed leadership connecting passengers across our home markets
with one another and with North America, Europe and South America
54.5%
19.9%
14.0%
4.7%4.4% 1.6%
1
59.1%
14.6%11.5%
Others 11.4%
3.4%
3
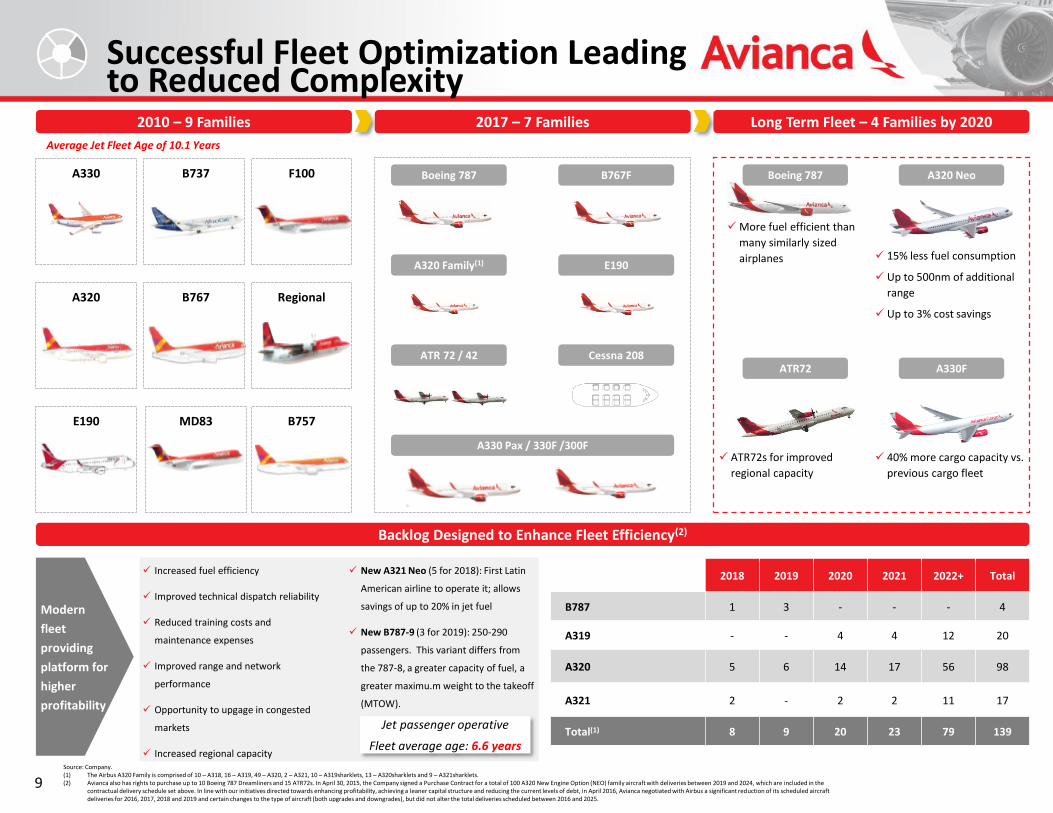
Long Term Fleet – 4 Families by 2020 2010 – 9 Families
E190 MD83 B757
ATR72
✓ ATR72s for improved
regional capacity
A330F
Boeing 787
✓ More fuel efficient than
many similarly sized
airplanes
A320 Neo
✓ 15% less fuel consumption
✓ Up to 500nm of additional
range
✓ Up to 3% cost savings
✓ 40% more cargo capacity vs.
previous cargo fleet
A320 B767 Regional
A330 B737 F100
✓ Increased fuel efficiency
✓ Improved technical dispatch reliability
✓ Reduced training costs and
maintenance expenses
✓ Improved range and network
performance
✓ Opportunity to upgage in congested
markets
✓ Increased regional capacity
✓ New A321 Neo (5 for 2018): First Latin
American airline to operate it; allows
savings of up to 20% in jet fuel
✓ New B787-9 (3 for 2019): 250-290
passengers. This variant differs from
the 787-8, a greater capacity of fuel, a
greater maximu.m weight to the takeoff
(MTOW).
Jet passenger operative
Fleet average age: 6.6 years
9
Successful Fleet Optimization Leadingto Reduced Complexity
Source: Company.(1) The Airbus A320 Family is comprised of 10 – A318, 16 – A319, 49 – A320, 2 – A321, 10 – A319sharklets, 13 – A320sharklets and 9 – A321sharklets.(2) Avianca also has rights to purchase up to 10 Boeing 787 Dreamliners and 15 ATR72s. In April 30, 2015, the Company signed a Purchase Contract for a total of 100 A320 New Engine Option (NEO) family aircraft with deliveries between 2019 and 2024, which are included in the
contractual delivery schedule set above. In line with our initiatives directed towards enhancing profitability, achieving a leaner capital structure and reducing the current levels of debt, in April 2016, Avianca negotiated with Airbus a significant reduction of its scheduled aircraft deliveries for 2016, 2017, 2018 and 2019 and certain changes to the type of aircraft (both upgrades and downgrades), but did not alter the total deliveries scheduled between 2016 and 2025.
Modern
fleet
providing
platform for
higher
profitability
2018 2019 2020 2021 2022+ Total
B787 1 3 - - - 4
A319 - - 4 4 12 20
A320 5 6 14 17 56 98
A321 2 - 2 2 11 17
Total(1) 8 9 20 23 79 139
Backlog Designed to Enhance Fleet Efficiency(2)
2017 – 7 Families
Boeing 787
A320 Family(1)
ATR 72 / 42
A330 Pax / 330F /300F
B767F
E190
Cessna 208
Average Jet Fleet Age of 10.1 Years

Strong Operational and Financial Performance
11
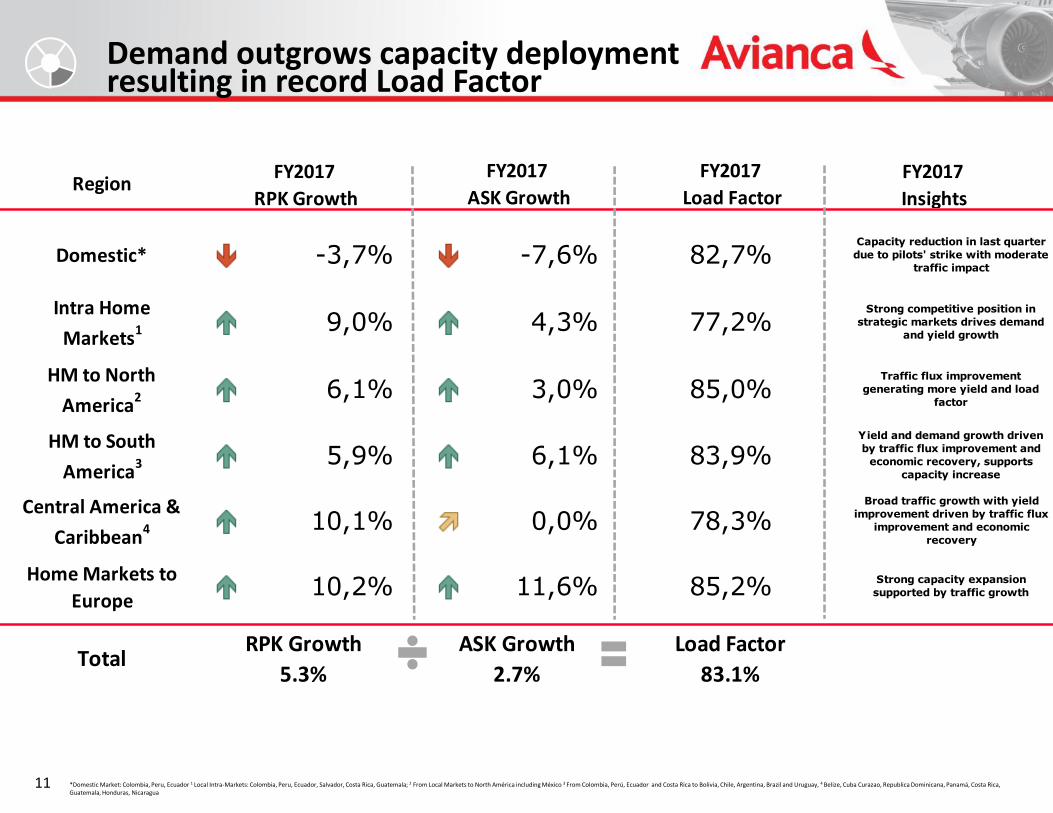
Demand outgrows capacity deployment resulting in record Load Factor
*Domestic Market: Colombia, Peru, Ecuador 1 Local Intra-Markets: Colombia, Peru, Ecuador, Salvador, Costa Rica, Guatemala; 2 From Local Markets to North América including México 3 From Colombia, Perú, Ecuador and Costa Rica to Bolivia, Chile, Argentina, Brazil and Uruguay, 4 Belize, Cuba Curazao, Republica Dominicana, Panamá, Costa Rica, Guatemala, Honduras, Nicaragua
Strong capacity expansion
supported by traffic growth
ASK Growth
2.7%
6,1%
0,0%
82,7%
77,2%
85,0%
83,9%
-7,6%
Home Markets to
Europe11,6%10,2%
6,1%
5,9%
10,1% 78,3%
85,2%
HM to North
America2
Central America &
Caribbean4
HM to South
America3
TotalRPK Growth
5.3%
Load Factor
83.1%
FY2017
Load Factor
FY2017
Insights
FY2017
RPK Growth
-3,7%
9,0%Intra Home
Markets1
Domestic*
Region
Capacity reduction in last quarter
due to pilots' strike with moderate
traffic impact
Strong competitive position in
strategic markets drives demand
and yield growth
FY2017
ASK Growth
4,3%
Traffic flux improvement
generating more yield and load
factor
Yield and demand growth driven
by traffic flux improvement and
economic recovery, supports
capacity increase
Broad traffic growth with yield
improvement driven by traffic flux
improvement and economic
recovery
3,0%

9,1 8,6
9,3
11,6
10,9
4Q14 4Q15 4Q16 4Q17
8,6 8,8
9,3
FY 2016 FY 2017
12 Source: Company InformationBp: Basics points
Demand recovery in core markets drive yield improvement
Load Factor: 4Q17 has the strongest LF in company history Yield - US¢: Continued yield recovery
RPKs – Millions: Strong demand growth outpaces Aviancas’… ASKs – Millions: capacity deployment across the network…
Quarterly RPK Full Year RPK RPK ex-Strike Quarterly ASK Full Year ASK ASK ex-Strike
Quarterly Load Factor Full Year Load Factor Load Factor, ex-Strike Quarterly Yield Full Year Yield Yield, ex-Strike
11,156
8,4229,216
10,138
9,443
4Q14 4Q15 4Q16 4Q17
42,327
38,233
40,243
FY 2016 FY 2017
-6.9%
+10.0%
+5.3%
+10.7%
13,467
10,585
11,56612,093
11,211
4Q14 4Q15 4Q16 4Q17
51.002
47,145
48,401
FY 2016 FY 2017
-7.3%
+11.4%
+2.7%
+8.2%
83.0%
81.1%
83.1%
FY 2016 FY 2017
82.2%
79.6% 79.7%
83.8%84.2%
4Q14 4Q15 4Q16 4Q17
-104 bp
+39 bp
+205 bp
+189 bp
+8.0%+27.2%
+ 8.5%
+ 2.7%
8,8 9,2
13
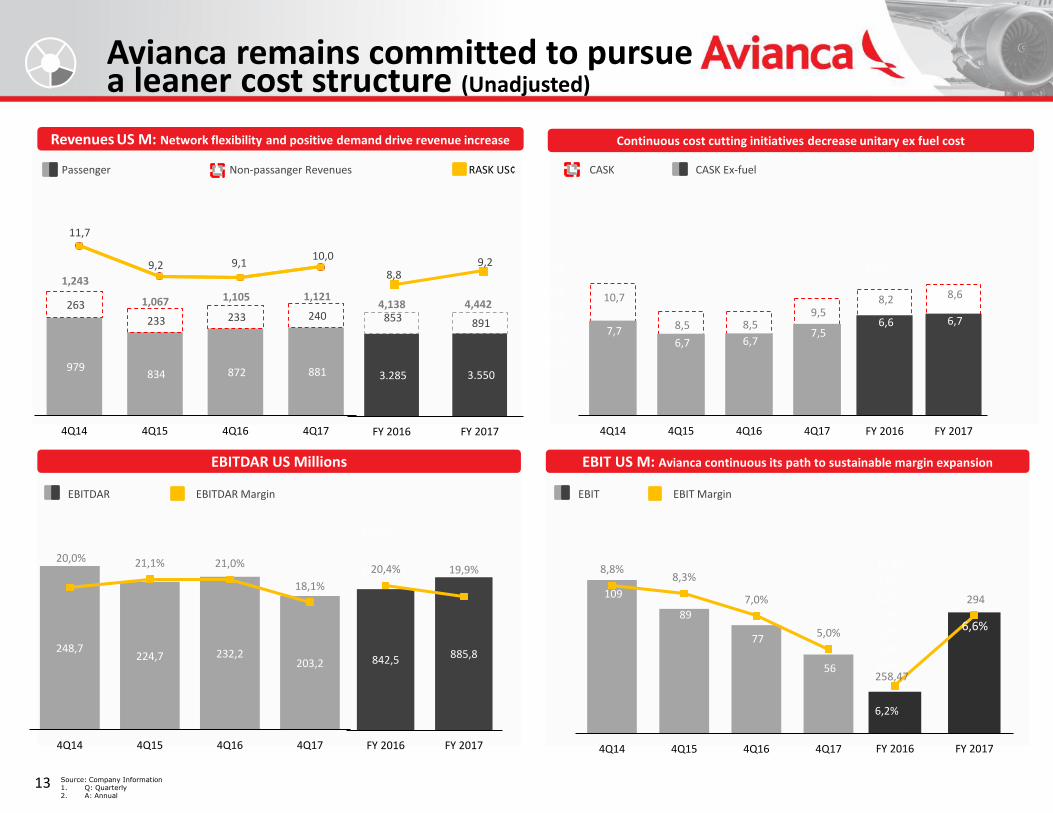
Avianca remains committed to pursuea leaner cost structure (Unadjusted)
Revenues US M: Network flexibility and positive demand drive revenue increase
EBITDAR US Millions EBIT US M: Avianca continuous its path to sustainable margin expansion
Continuous cost cutting initiatives decrease unitary ex fuel cost
Source: Company Information1. Q: Quarterly2. A: Annual
EBITDAR MarginEBITDAR EBIT MarginEBIT
CASK CASK Ex-fuel Passenger RASK US¢Non-passanger Revenues
3.285 3.550
853 891
FY 2016 FY 2017
11,7
9,2 9,1 10,0
979 834 872 881
263
233 233 240
4Q14 4Q15 4Q16 4Q17
4,1381,1211,1051,067
1,243
4,442
109
89
77
56
8,8%8,3%
7,0%
5,0%
4Q14 4Q15 4Q16 4Q17
0,0%
1,0%
2,0%
3,0%
4,0%
5,0%
6,0%
7,0%
8,0%
9,0%
10,0%
258,47
294
6,2%
6,6%
FY 2016 FY 2017
248,7224,7 232,2
203,2
20,0% 21,1% 21,0%
18,1%
4Q14 4Q15 4Q16 4Q17
2,0%
7,0%
12,0%
17,0%
22,0%
27,0%
842,5 885,8
20,4% 19,9%
FY 2016 FY 2017
10,7
8,5 8,5 9,5
7,7 6,7 6,7
7,5
-
2,0
4,0
6,0
8,0
10,0
12,0
4Q14 4Q15 4Q16 4Q17
-
2,0
4,0
6,0
8,0
10,0
12,0
8,2 8,6
6,6 6,7
FY 2016 FY 2017
14
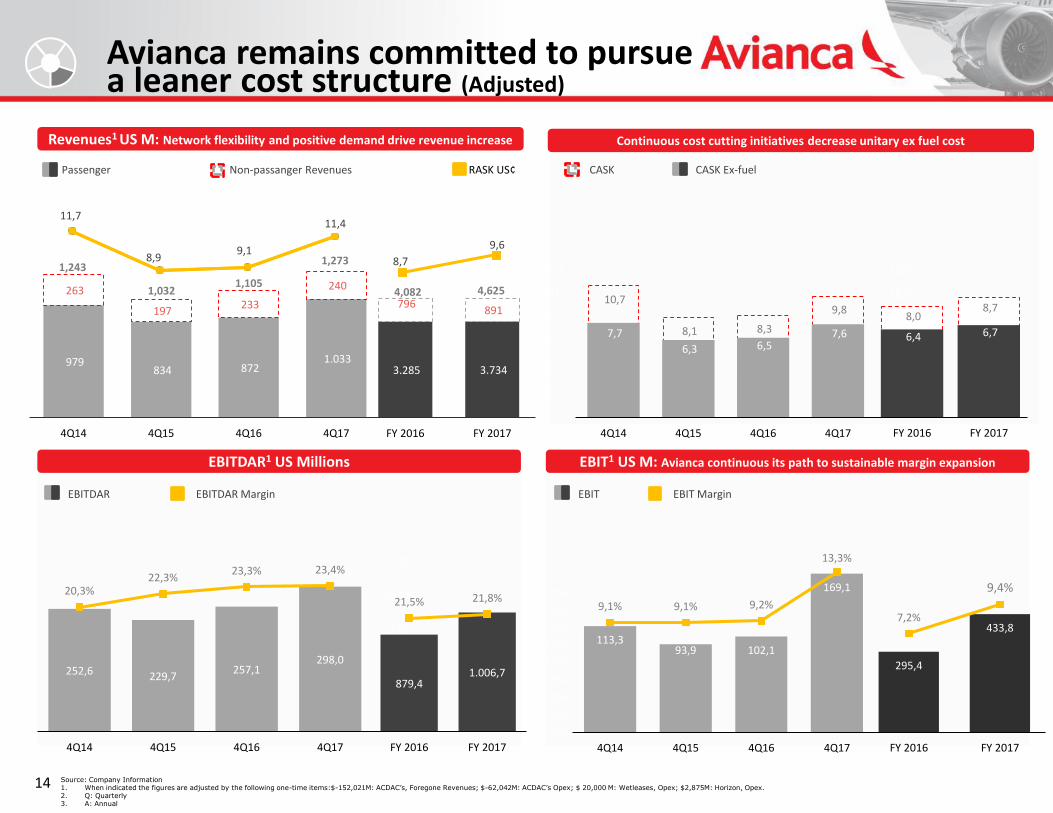
Avianca remains committed to pursuea leaner cost structure (Adjusted)
Revenues1 US M: Network flexibility and positive demand drive revenue increase
EBITDAR1 US Millions EBIT1 US M: Avianca continuous its path to sustainable margin expansion
Continuous cost cutting initiatives decrease unitary ex fuel cost
Source: Company Information1. When indicated the figures are adjusted by the following one-time items:$-152,021M: ACDAC’s, Foregone Revenues; $-62,042M: ACDAC’s Opex; $ 20,000 M: Wetleases, Opex; $2,875M: Horizon, Opex.2. Q: Quarterly3. A: Annual
CASK CASK Ex-fuel Passenger RASK US¢Non-passanger Revenues
EBITDAR MarginEBITDAR EBIT MarginEBIT
10,7
8,1 8,3
9,8
7,7
6,3 6,5 7,6
-
2,0
4,0
6,0
8,0
10,0
12,0
4Q14 4Q15 4Q16 4Q17
-
2,0
4,0
6,0
8,0
10,0
12,0
8,0 8,7
6,4 6,7
FY 2016 FY 2017
11,7
8,9 9,1
11,4
979 834 872
1.033
263
197 233
240
4Q14 4Q15 4Q16 4Q17
1,273
1,1051,032
1,243 8,7
9,6
3.285 3.734
796 891
FY 2016 FY 2017
4,082 4,625
252,6 229,7257,1
298,0
20,3%22,3%
23,3% 23,4%
4Q14 4Q15 4Q16 4Q17
2,0%
7,0%
12,0%
17,0%
22,0%
27,0%
879,4 1.006,7
21,5% 21,8%
FY 2016 FY 2017
15,0%
16,0%
17,0%
18,0%
19,0%
20,0%
21,0%
22,0%
23,0%
113,393,9 102,1
169,1
9,1% 9,1% 9,2%
13,3%
4Q14 4Q15 4Q16 4Q17
295,4
433,87,2%
9,4%
FY 2016 FY 2017

368,8253,6 283,4 263,2
1.120
2930
550173,8
127,7
129,4
129,6
294,0
2018 2019 2020 2021 2022+
AIRCRAFT BONDS CORPORATE DEBT
59,70%
23,47%
1,65% 15,18%
By Currency
EurosColombianPesos
U.S.Dollars
Type(1) Currency Avg. Rate
Aircraft Debt U.S. Dollars 3.60%
BondsColombian
Pesos10.58%
Bonds U.S. Dollars 7.95%
CorporateDebt
U.S. Dollars 5.86%
Total 4.79%
15
Debt Overview and Deleveraging Plan
____________________Source: Company.(1) Excludes US$6.3 Millions of corporate debt in COP and US$128.2 Millions of aircraft debt in EUR.(2) Current installments of long term debt + long term debt – cash. Cash includes cash and cash equivalents + restricted cash + available for sale securities + short term certificates of bank deposits + long term restricted cash.(3) Current installments of long term debt + long term debt + (aircraft rentals 12M x 7) – cash. Cash includes cash and cash equivalents + restricted cash + available for sale securities + short term certificates of bank deposits + long term restricted cash.(4) Consolidated net profit for the period plus the sum of income tax expense, depreciation, amortization and impairment and aircraft rentals, minus interest expense, minus interest income, minus derivative instruments, minus foreign exchange.(5) EBITDAR coverage ratio calculated as EBITDAR divided by the sum of aircraft leases and interest expense.
4Q17 Debt Amortization Schedule (US$MM)
4Q17 Debt Profile
By Type(1)
USD Aircraft Debt
COPBonds
USD Bonds
USD CorporateDebt
572411
963
393
1.308
94,86%
1,72% 3,42%
Diversified Sources of Revenue with Growing Non-Passenger Businesses
17
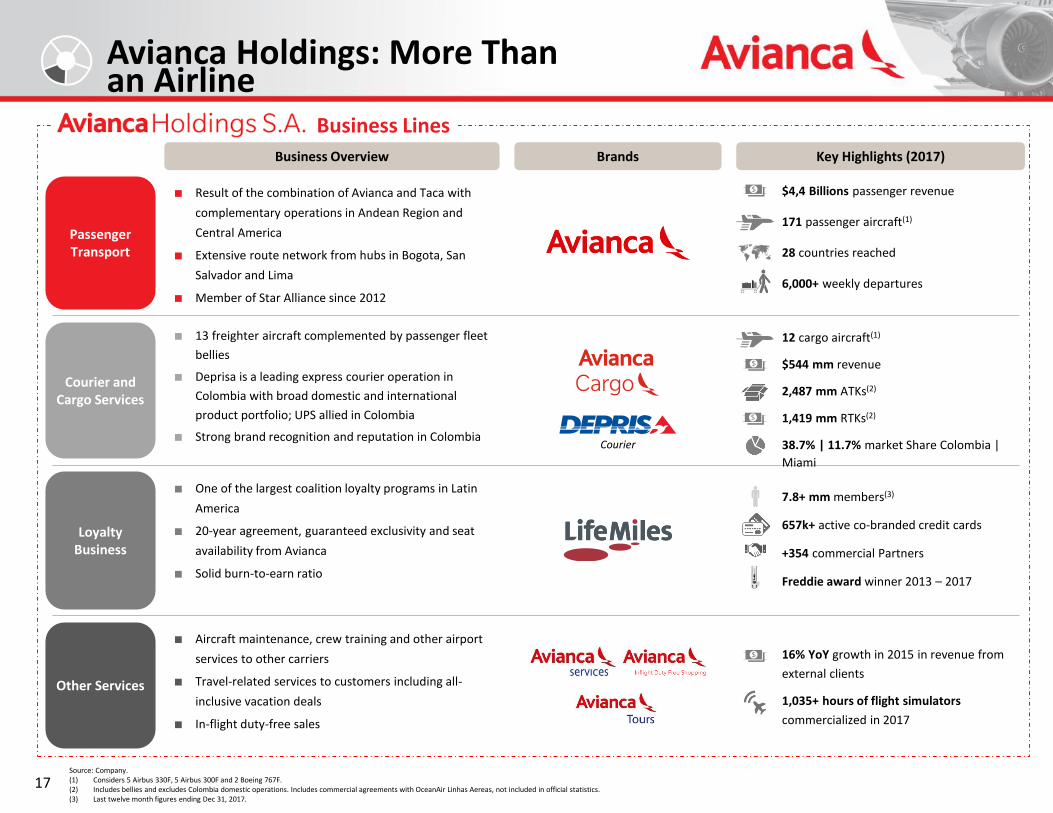
Avianca Holdings: More Thanan Airline
Source: Company.(1) Considers 5 Airbus 330F, 5 Airbus 300F and 2 Boeing 767F.(2) Includes bellies and excludes Colombia domestic operations. Includes commercial agreements with OceanAir Linhas Aereas, not included in official statistics.(3) Last twelve month figures ending Dec 31, 2017.
Business Lines
PassengerTransport
Loyalty Business
Other Services
Courier and Cargo Services
Business Overview Brands Key Highlights (2017)
■ Result of the combination of Avianca and Taca with
complementary operations in Andean Region and
Central America
■ Extensive route network from hubs in Bogota, San
Salvador and Lima
■ Member of Star Alliance since 2012
■ Aircraft maintenance, crew training and other airport
services to other carriers
■ Travel-related services to customers including all-
inclusive vacation deals
■ In-flight duty-free sales
■ 13 freighter aircraft complemented by passenger fleet
bellies
■ Deprisa is a leading express courier operation in
Colombia with broad domestic and international
product portfolio; UPS allied in Colombia
■ Strong brand recognition and reputation in Colombia
■ One of the largest coalition loyalty programs in Latin
America
■ 20-year agreement, guaranteed exclusivity and seat
availability from Avianca
■ Solid burn-to-earn ratio
■ $4,4 Billions passenger revenue
■ 171 passenger aircraft(1)
■ 28 countries reached
■ 6,000+ weekly departures
■ 16% YoY growth in 2015 in revenue from
external clients
■ 1,035+ hours of flight simulators
commercialized in 2017
■ 12 cargo aircraft(1)
■ $544 mm revenue
■ 2,487 mm ATKs(2)
■ 1,419 mm RTKs(2)
■ 38.7% | 11.7% market Share Colombia |
Miami
■ 7.8+ mm members(3)
■ 657k+ active co-branded credit cards
■ +354 commercial Partners
■ Freddie award winner 2013 – 2017
Courier

LifeMiles
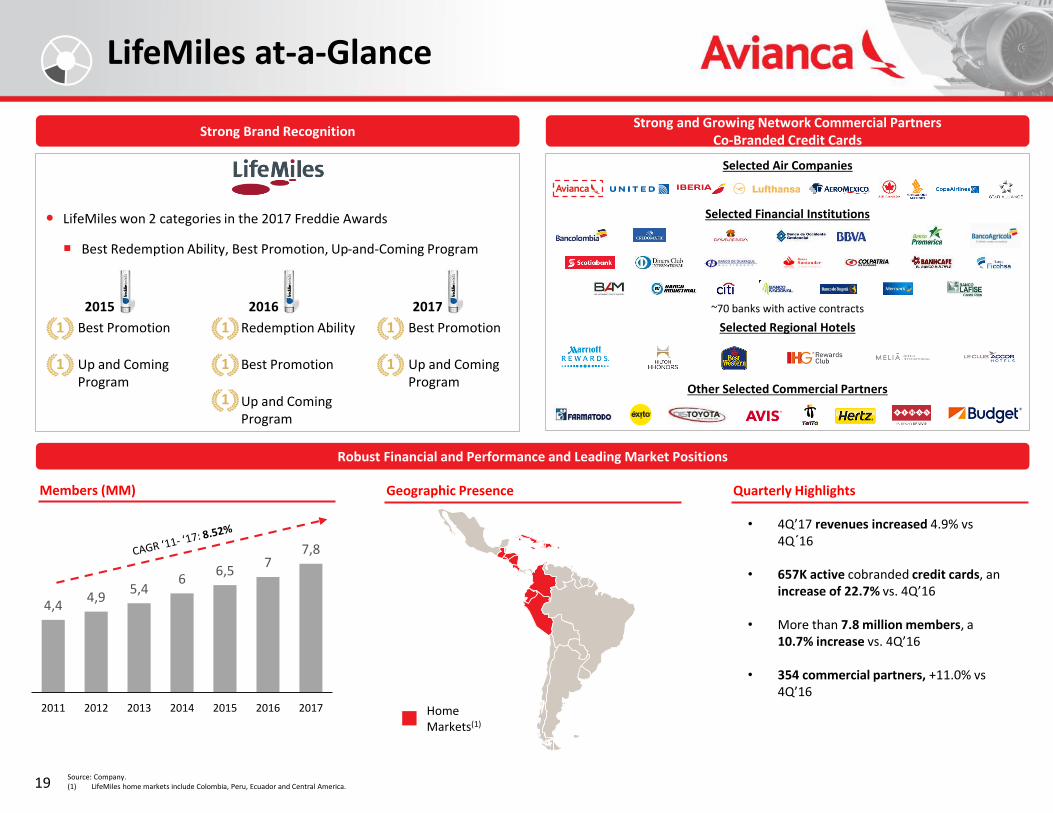
19
LifeMiles at-a-Glance
Source: Company.(1) LifeMiles home markets include Colombia, Peru, Ecuador and Central America.
LifeMiles won 2 categories in the 2017 Freddie Awards
Best Redemption Ability, Best Promotion, Up-and-Coming Program
Selected Air Companies
Selected Financial Institutions
~70 banks with active contracts
Selected Regional Hotels
Other Selected Commercial Partners
Strong Brand RecognitionStrong and Growing Network Commercial Partners
Co-Branded Credit Cards
Robust Financial and Performance and Leading Market Positions
HomeMarkets(1)
Members (MM) Quarterly Highlights Geographic Presence
2015
Best Promotion
Up and Coming Program
2016
Redemption Ability
Up and Coming Program
Best Promotion
2017
1
1
1
1
1
Best Promotion
Up and Coming Program
1
1
• 4Q’17 revenues increased 4.9% vs 4Q´16
• 657K active cobranded credit cards, an increase of 22.7% vs. 4Q’16
• More than 7.8 million members, a 10.7% increase vs. 4Q’16
• 354 commercial partners, +11.0% vs 4Q’16
4,44,9
5,46
6,57
7,8
2011 2012 2013 2014 2015 2016 2017
38.7%
9.0% 8.8% 8.4%6.6%
28.5%
AVH Atlas Latam UPS Skylease Others
21
Increasing Footprint in Latin AmericanMarkets
Source: Company.(1) On a per trip basis.(2) Includes consolidated revenues from the cargo operation in Mexico.(3) Includes bellies and excludes Colombia domestic operations. Includes commercial agreements with OceanAir Linhas Aereas, not included in official statistics.(4) International Cargo – Aeronáutica Civil de Colombia (as of December 2017) – (5) Miami-Dade Aviation Statistics, by airline group (as of December 2017)
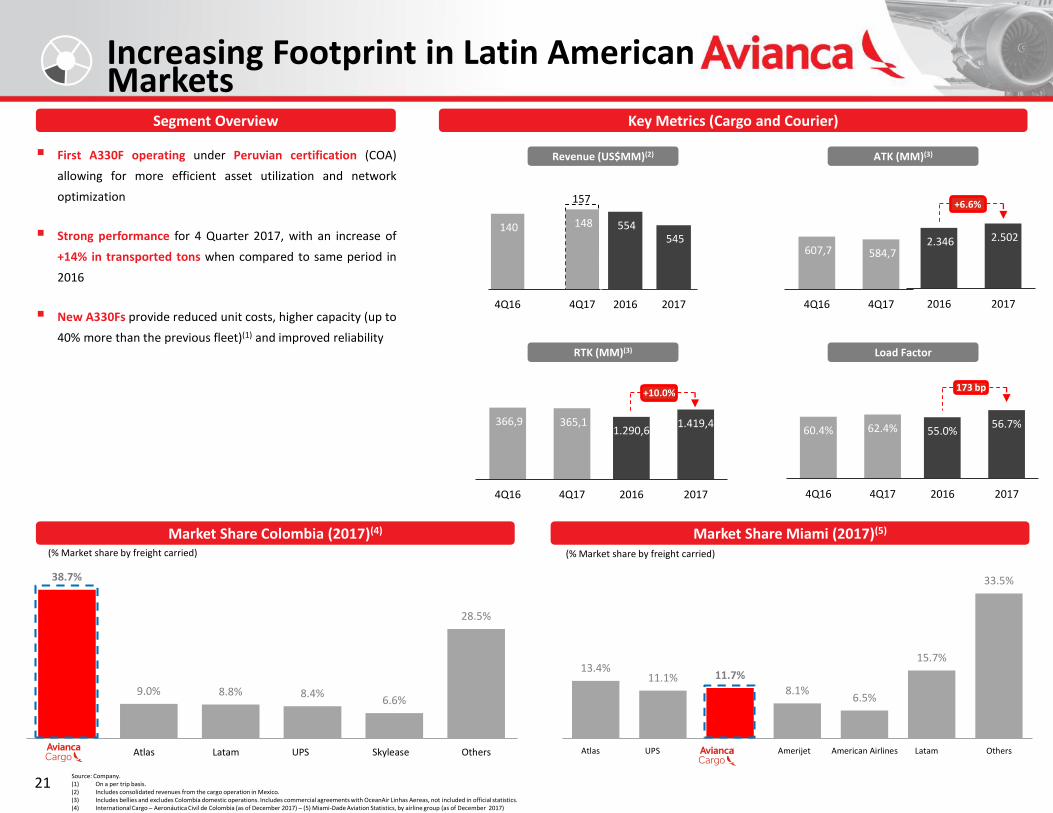
▪ First A330F operating under Peruvian certification (COA)
allowing for more efficient asset utilization and network
optimization
▪ Strong performance for 4 Quarter 2017, with an increase of
+14% in transported tons when compared to same period in
2016
▪ New A330Fs provide reduced unit costs, higher capacity (up to
40% more than the previous fleet)(1) and improved reliability
Market Share Colombia (2017)(4)
Segment Overview
Market Share Miami (2017)(5)
Key Metrics (Cargo and Courier)
(% Market share by freight carried) (% Market share by freight carried)
607,7 584,7
4Q16 4Q17
366,9 365,1
4Q16 4Q17
1.290,6 1.419,4
2016 2017
RTK (MM)(3)
+10.0%
Revenue (US$MM)(2) ATK (MM)(3)
Load Factor
173 bp
+6.6%
60.4% 62.4%
4Q16 4Q17
55.0%56.7%
2016 2017
2.346 2.502
2016 2017
13.4%11.1% 11.7%
8.1%6.5%
15.7%
33.5%
Atlas UPS AVH Amerijet American Airlines Latam Others
157
140 148
4Q16 4Q17
554 545
2016 2017

Full Year Outlook and Additional Information
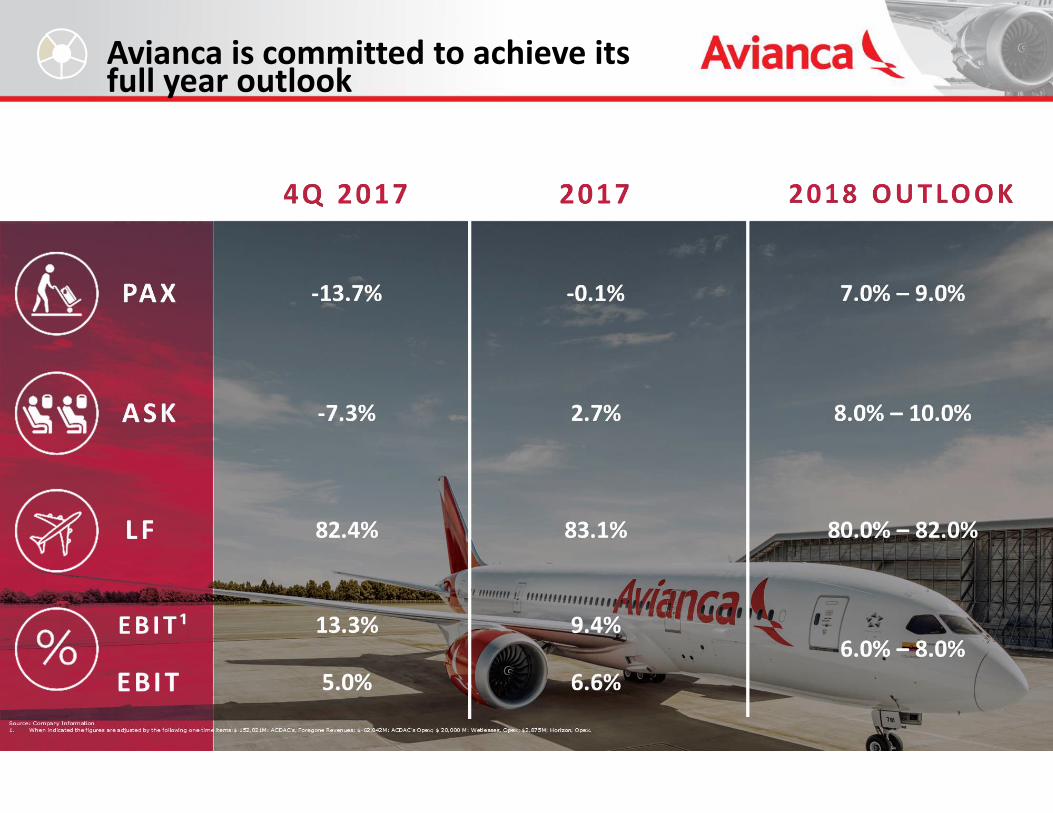
Avianca is committed to achieve its full year outlook
24
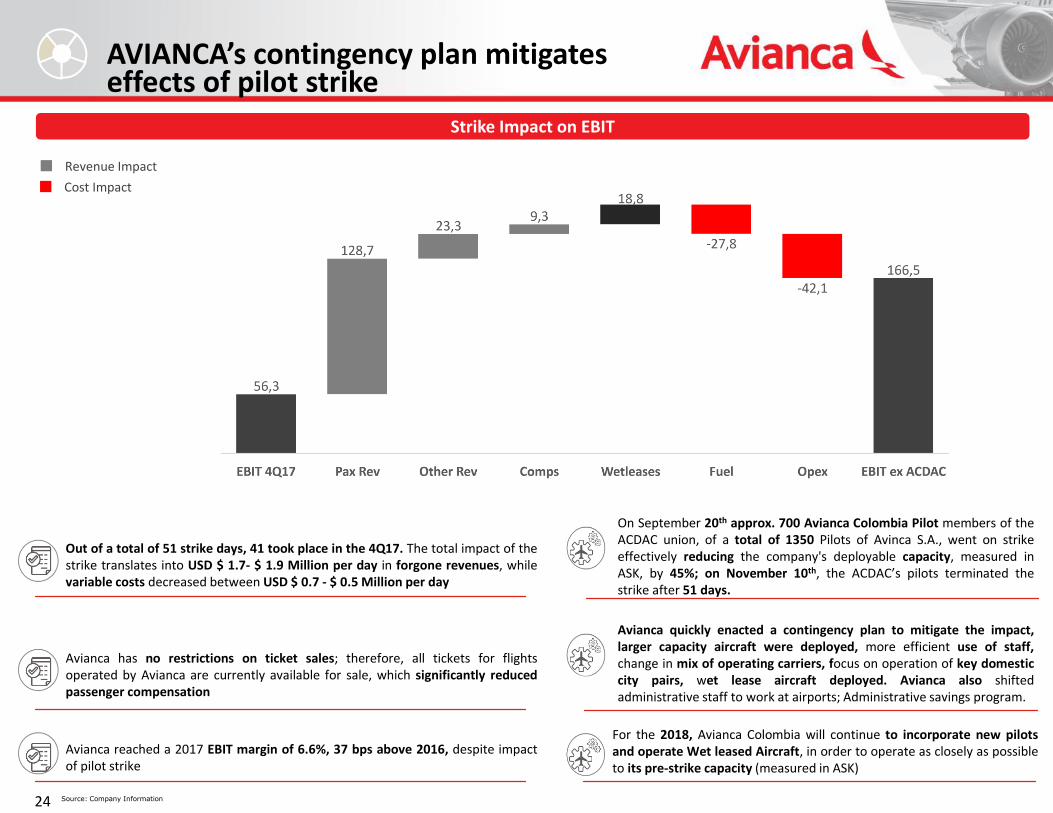
AVIANCA’s contingency plan mitigateseffects of pilot strike
Source: Company Information
Cost Impact
Revenue Impact
9,2%
Strike Impact on EBIT
Out of a total of 51 strike days, 41 took place in the 4Q17. The total impact of thestrike translates into USD $ 1.7- $ 1.9 Million per day in forgone revenues, whilevariable costs decreased between USD $ 0.7 - $ 0.5 Million per day
Avianca has no restrictions on ticket sales; therefore, all tickets for flightsoperated by Avianca are currently available for sale, which significantly reducedpassenger compensation
Avianca reached a 2017 EBIT margin of 6.6%, 37 bps above 2016, despite impactof pilot strike
On September 20th approx. 700 Avianca Colombia Pilot members of theACDAC union, of a total of 1350 Pilots of Avinca S.A., went on strikeeffectively reducing the company's deployable capacity, measured inASK, by 45%; on November 10th, the ACDAC’s pilots terminated thestrike after 51 days.
Avianca quickly enacted a contingency plan to mitigate the impact,larger capacity aircraft were deployed, more efficient use of staff,change in mix of operating carriers, focus on operation of key domesticcity pairs, wet lease aircraft deployed. Avianca also shiftedadministrative staff to work at airports; Administrative savings program.
For the 2018, Avianca Colombia will continue to incorporate new pilotsand operate Wet leased Aircraft, in order to operate as closely as possibleto its pre-strike capacity (measured in ASK)

Thank YouContact Information:Investor Relations [email protected]: (57) 1 – 5877700 www.aviancaholdings.com
26
Reconciliation of Adjusted EBITDAR
This presentation includes certain references to non-IFRS measures such as our Adjusted EBITDAR and Adjusted EBITDAR margin. Adjusted EBITDAR represents our consolidated net profit for the year plus the sum of
income tax expense, depreciation, amortization and impairment, aircraft rentals and interest expense, minus interest income, minus derivative instruments, minus foreign exchange. Adjusted EBITDAR is presented as
supplemental information, because we believe it is a useful indicator of our operating performance and is useful in comparing our operating performance with other companies in the airline industry. However,
Adjusted EBITDAR should not be considered in isolation, as a substitute for net profit determined in accordance with IFRS or as a measure of a company’s profitability. These supplemental financial measures are not
prepared in accordance with IFRS or Colombian GAAP. Accordingly, you are cautioned not to place undue reliance on this information and should note that Adjusted EBITDAR and Adjusted EBITDAR margin, as
calculated by us, may differ materially from similarly titled measures reported by other companies, including our competitors.
Adjusted EBITDAR is commonly used in the airline industry to view operating results before depreciation, amortization and aircraft operating lease charges, as these costs can vary significantly among airlines due to
differences in the way airlines finance their aircraft and other asset acquisitions. However, Adjusted EBITDAR should not be considered as an alternative measure to operating profit, as an indicator of operating
performance, as an alternative to operating cash flows or as a measure of our liquidity. Adjusted EBITDAR as calculated by us and as presented in this presentation may differ materially from similarly titled measures
reported by other companies due to differences in the way these measures are calculated. Adjusted EBITDAR has important limitations as an analytical tool and should not be considered in isolation from, or as a
substitute for an analysis of, our operating results as reported under IFRS or Colombian GAAP. Some of the limitations are:
Adjusted EBITDAR does not reflect cash expenditures or future requirements for capital expenditures or contractual commitments;
Adjusted EBITDAR does not reflect changes in, or cash requirements for, working capital needs;
Adjusted EBITDAR does not reflect the interest expense or the cash requirements necessary to service interest or principal payments on debt;
Although depreciation and amortization are non-cash charges, the assets being depreciated and amortized will often have to be replaced in the future, and Adjusted EBITDAR does not reflect any cash requirements
for such replacements;
Adjusted EBITDAR does not reflect expenses related to leases of flight equipment and other related expenses; and
other companies may calculate Adjusted EBITDAR or similarly titled measures differently, limiting its usefulness as a comparative measure.