Embed Size (px)
Citation preview

Brief Presentation September 2005 Page 1
Corporate PresentationPT Indosat TbkFirst Half 2005
Brief Presentation September 2005 Page 2
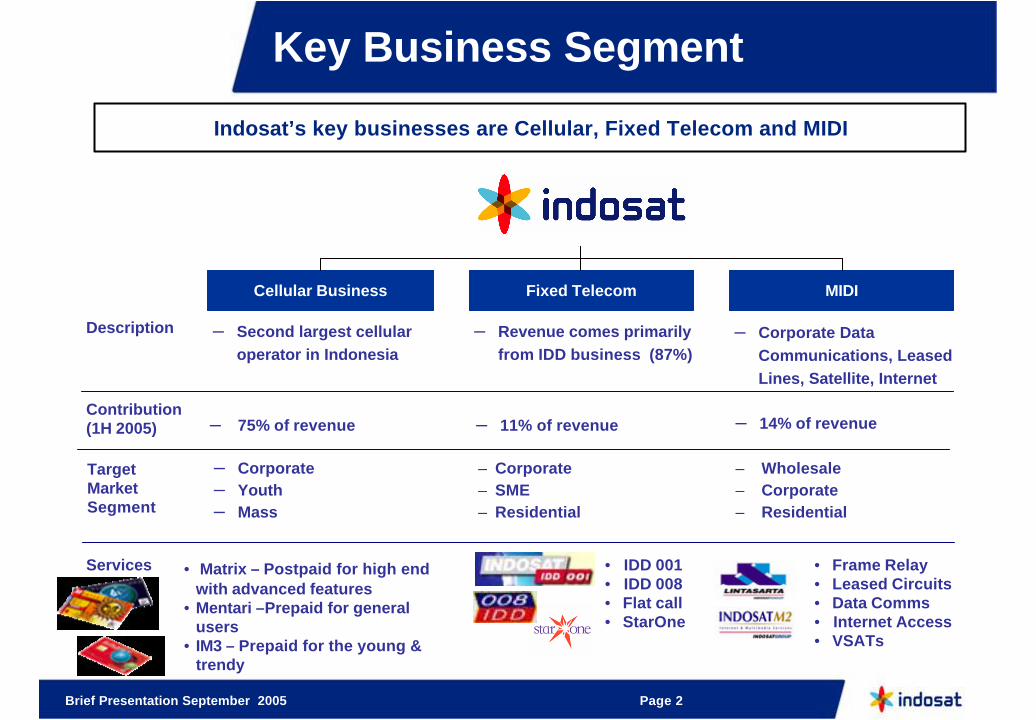
Key Business Segment
Cellular Business Fixed Telecom MIDI
Description – Second largest cellular operator in Indonesia
– Revenue comes primarily from IDD business (87%)
– Corporate Data Communications, Leased Lines, Satellite, Internet
Contribution(1H 2005) – 75% of revenue – 11% of revenue – 14% of revenue
Target Market Segment
– Corporate – Youth – Mass
Services • Matrix – Postpaid for high end with advanced features
• Mentari –Prepaid for general users
• IM3 – Prepaid for the young & trendy
• IDD 001• IDD 008• Flat call• StarOne
– Corporate– SME – Residential
– Wholesale – Corporate– Residential
• Frame Relay• Leased Circuits• Data Comms• Internet Access• VSATs
Indosat’s key businesses are Cellular, Fixed Telecom and MIDI

Brief Presentation September 2005 Page 3
Ownership Structure
Public
Listed on the JSX, SSX and NYSE with market cap of around Rp29.1 trilion(1)
Note:(1) Per 30 Juni 2005
Republic of Indonesia
41.0% 44.2% 14.7%
§ Indosat’s shares are majority owned by public investors (44.2%)
§ ST Telemedia through Indonesia Communications Limited owns (41.0%)
§ Indonesian Government owns 14.7% including Series A share
Brief Presentation September 2005 Page 4
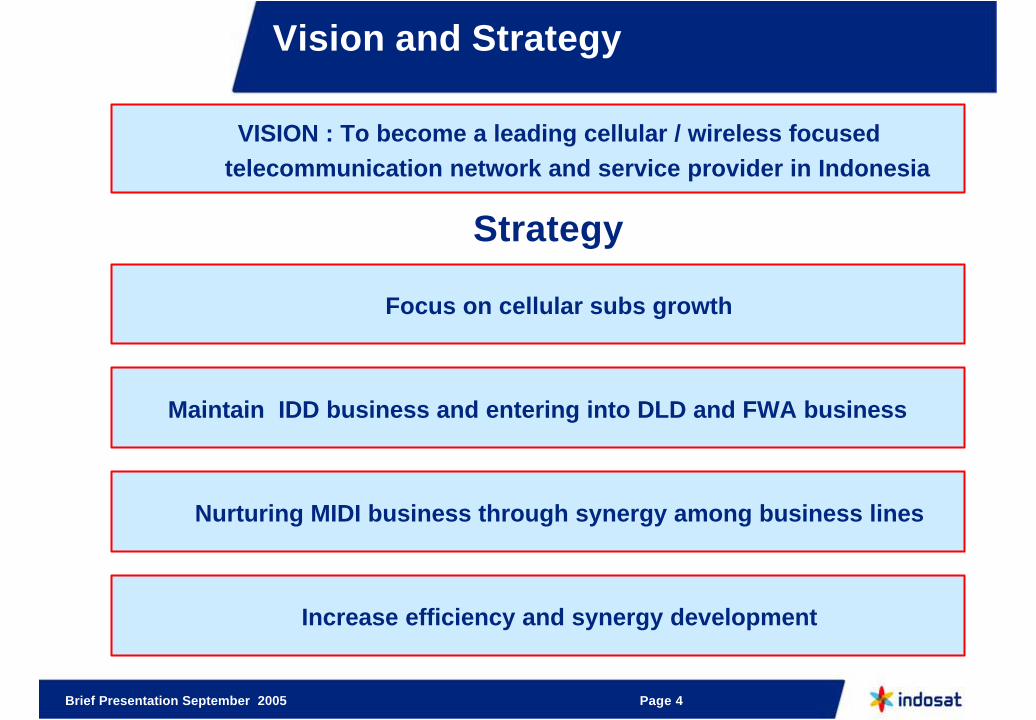
Vision and Strategy
Focus on cellular subs growth
Maintain IDD business and entering into DLD and FWA business
Nurturing MIDI business through synergy among business lines
Increase efficiency and synergy development
VISION : To become a leading cellular / wireless focused telecommunication network and service provider in Indonesia
Strategy
Brief Presentation September 2005 Page 5
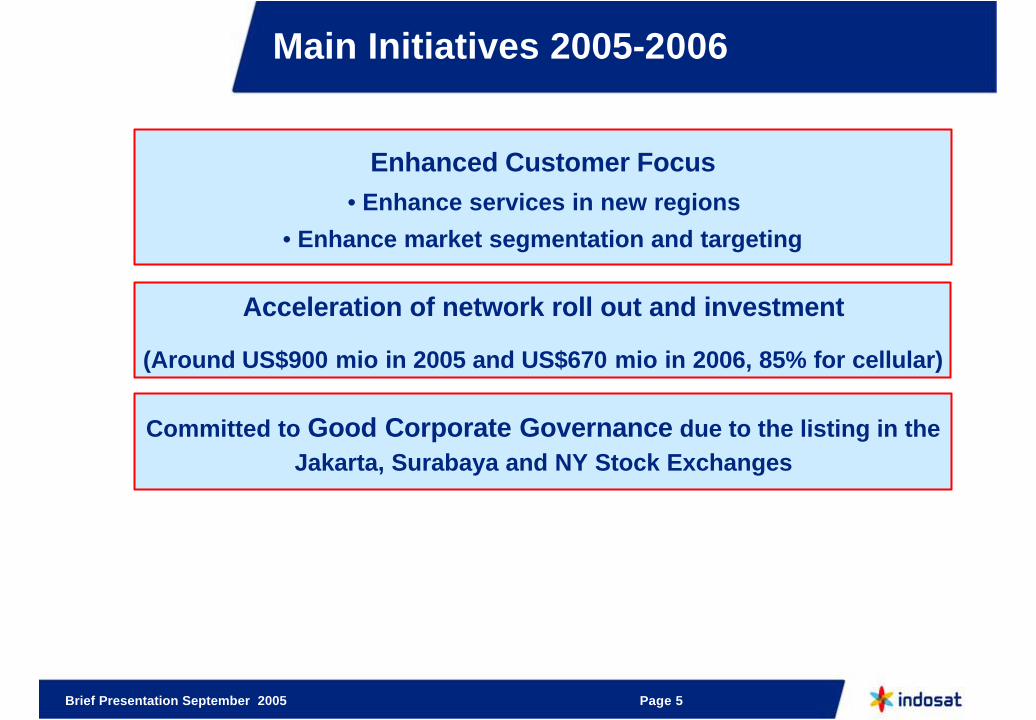
Main Initiatives 2005-2006
Enhanced Customer Focus• Enhance services in new regions
• Enhance market segmentation and targeting
Committed to Good Corporate Governance due to the listing in the Jakarta, Surabaya and NY Stock Exchanges
Acceleration of network roll out and investment
(Around US$900 mio in 2005 and US$670 mio in 2006, 85% for cellular)

Brief Presentation September 2005 Page 6
Major Achievements in First Half 2005
12.87 cellular subscribers with a cellular revenues growth of 31% (YoY)
IDD traffic increased 6% despite a decline in its revenues due to a tighter competition
The succesful financing program (US$ note and IDR bond) and decrease in cost of borrowing/debt
MIDI revenues increased 13% (YoY)
Realization of merger benefits (cost efficiencies)

Brief Presentation September 2005 Page 7
0.0
5,000.0
10,000.0
15,000.0
20,000.0
25,000.0
30,000.0
35,000.0
40,000.0
45,000.0
2002 2003 2004 Jun-05
Indosat Indonesia
Cellular Services
§ Recording a high subs growth in recent years (CAGR 65% 2002-2004)
§ In first half 2005 Indosat recorded net add of 3.1 mio subs, hence the cellular subs base on June 30, 2005 was 12.9 mio subscribers.
§ Indonesian cellular penetration is relatively lower compared to other countries.
4.5%
17.5%
26.0%
36.4%
41.9%
49.9%
91.0%
India
Indonesia
China
Phillippines
Thailand
Malaysia
Singapore
Cellular Penetration (GSM) 1(dalam ribu)
Cellular Subscriber Growth
2002 -2004
Indosat CAGR 65%
Indonesia CAGR 62%
Notes : (1) Penetration data as of end 2004, except Indonesia per 30 June 2005
Brief Presentation September 2005 Page 8
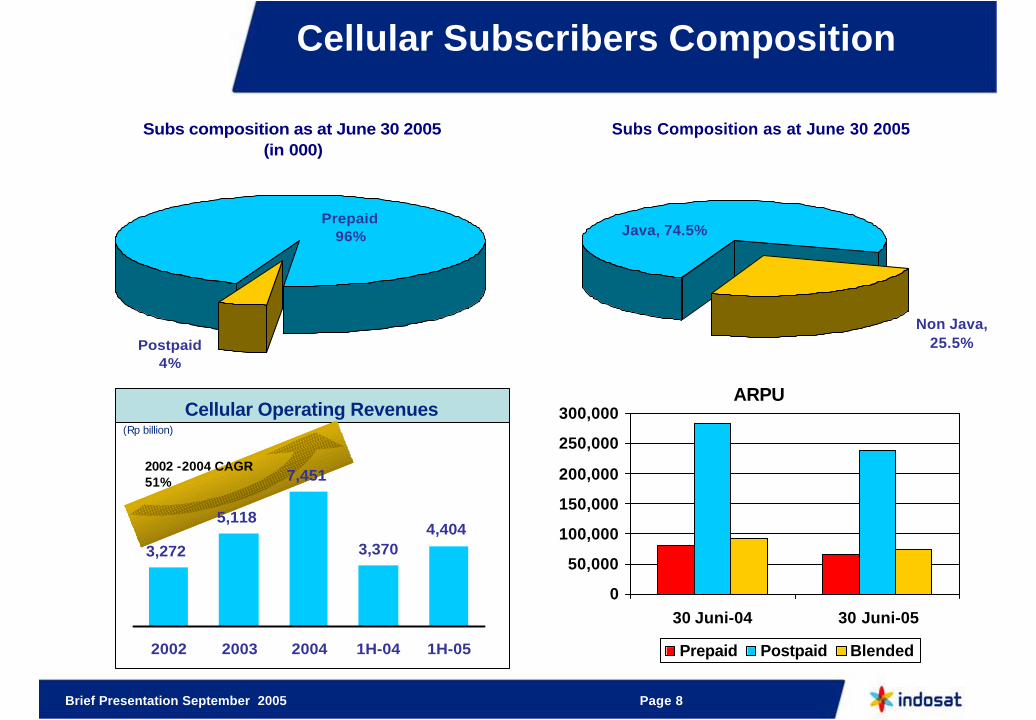
Cellular Subscribers Composition
Subs composition as at June 30 2005 (in 000)
Postpaid4%
Prepaid96%
ARPU
0
50,000
100,000
150,000
200,000
250,000
300,000
30 Juni-04 30 Juni-05
Prepaid Postpaid Blended
Subs Composition as at June 30 2005
Non Java, 25.5%
Java, 74.5%
Cellular Operating Revenues(Rp billion)
2002 -2004 CAGR 51%
3,272
5,118
7,451
3,3704,404
2002 2003 2004 1H-04 1H-05

Brief Presentation September 2005 Page 9
MIDI14%
Cellular75%
SLI11%
Revenues Composition (1H 2005)
§ Fixed telecommunication contributed 11% to operating revenues. IDD contributed 87% to fixed telecom revenues.
§ MIDI revenues increased 13.1% (YoY), mainly due to continued demand in the domestic wholesale market.
0
100,000
200,000
300,000
400,000
500,000
600,000
700,000
800,000
900,000
1,000,000
2002 2003 2004 1H-05Outgoing Incoming
Fixed Telecommunication and MIDI
Trend in IDD Traffic(in thousands minutes))
60% 78%
27%40%
73% 83%
22% 17%
Brief Presentation September 2005 Page 10
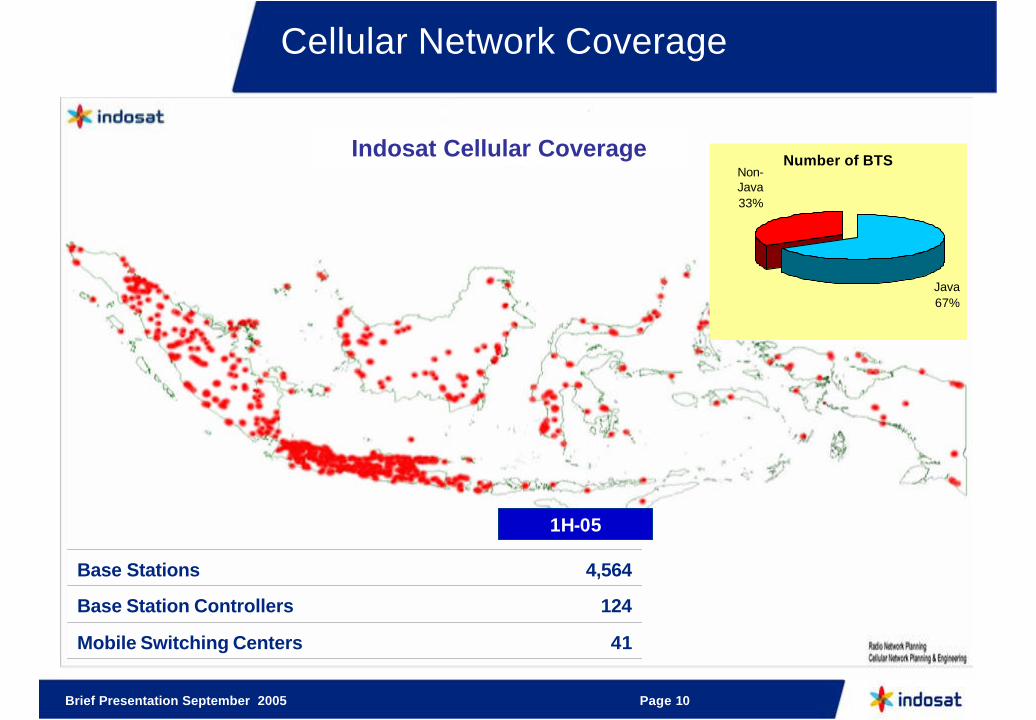
Cellular Network Coverage
124Base Station Controllers
41Mobile Switching Centers
4,564Base Stations
1H-05
Indosat Cellular CoverageNumber of BTS
Java67%
Non-Java33%
Brief Presentation September 2005 Page 11
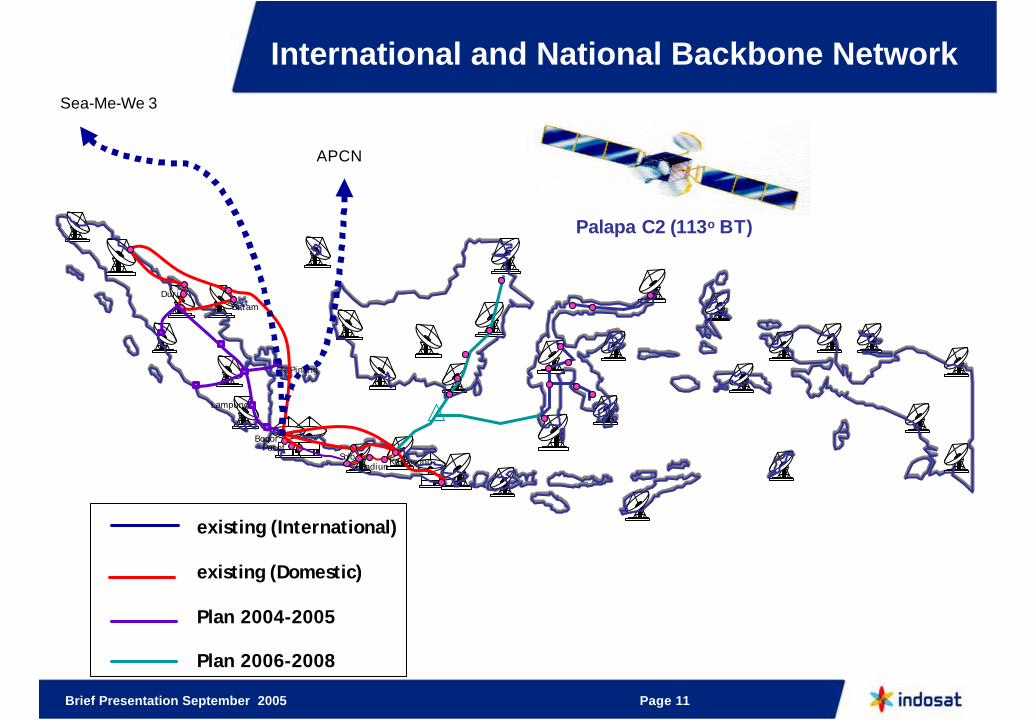
International and National Backbone Network
Duri
BogorPacet
SoloMadiunKertosono
Batam
Lampung
Pk.Pinang
existing (International)
existing (Domestic)
Plan 2004-2005
Plan 2006-2008
Palapa C2 (113o BT)
Sea-Me-We 3
APCN

Brief Presentation September 2005 Page 12
Organization Structure
Deputy President Director
Ng Eng Ho
Deputy President Director
Ng Eng Ho
Network Ops & Quality
MgmtDirector
Raymond Tan
Network Ops & Quality
MgmtDirector
Raymond Tan
Information Technology
Director
Joseph Chan
Information Technology
Director
Joseph Chan
Planning & Project Dev
Director
Wityasmoro S. H.
Planning & Project Dev
Director
Wityasmoro S. H.
Finance Director
Wong Heang Tuck
Finance Director
Wong Heang Tuck
Corporate ServicesDirector
S. Wimbo S. Hardjito
Corporate ServicesDirector
S. Wimbo S. Hardjito
Corporate Market
Director
Wahyu Wijayadi
Corporate Market
Director
Wahyu Wijayadi
Consumer Market
Director
Johnny S. Sjam
Consumer Market
Director
Johnny S. Sjam
President Director
Hasnul Suhaimi
President Director
Hasnul Suhaimi
Regional Jawa Timur &
Kalimantan
Regional Jawa Timur &
Kalimantan
Regional Sulawesi, Maluku &
Papua
Regional Sulawesi, Maluku &
Papua
Regional Jawa Barat
&JawaTengah
Regional Jawa Barat
&JawaTengah
Regional Sumatera
Regional Sumatera
RegionalJabotabek &
Banten
RegionalJabotabek &
BantenSenior Vice PresidentsSenior Vice Presidents

Brief Presentation September 2005 Page 13
Human Resources
Employees Composition (Total Headcount 7,931 per 30 June 2005)
Non-permanent
39%
Permanent61%
0
1,000
2,000
3,000
4,000
5,000
6,000
7,000
30/06/04 30/06/05
IndosatLintasartaIM2Sisindosat
Indosat employees comprise of permanent employees (61%) and non-permanent employees (39%).
Non-permanent employees are hired for support functions.
Brief Presentation September 2005 Page 14
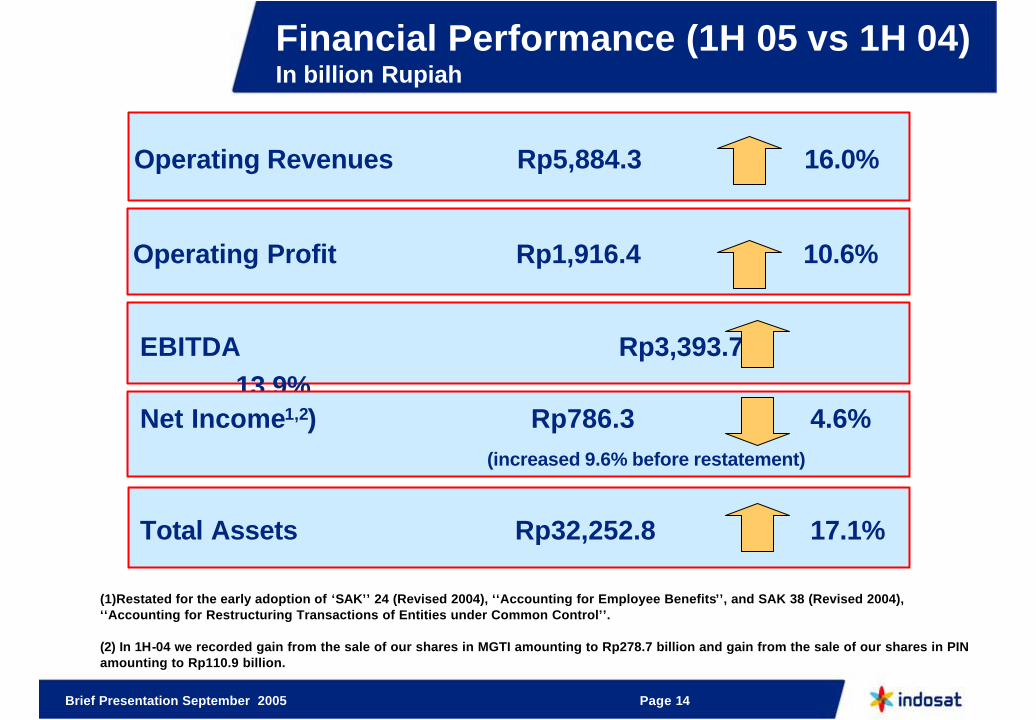
Financial Performance (1H 05 vs 1H 04) In billion Rupiah
Operating Revenues Rp5,884.3 16.0%
Operating Profit Rp1,916.4 10.6%
EBITDA Rp3,393.713.9%
Net Income1,2) Rp786.3 4.6% (increased 9.6% before restatement)
Total Assets Rp32,252.8 17.1%
(1)Restated for the early adoption of ‘SAK’’ 24 (Revised 2004), ‘‘Accounting for Employee Benefits’’, and SAK 38 (Revised 2004), ‘‘Accounting for Restructuring Transactions of Entities under Common Control’’.
(2) In 1H-04 we recorded gain from the sale of our shares in MGTI amounting to Rp278.7 billion and gain from the sale of our shares in PINamounting to Rp110.9 billion.

Brief Presentation September 2005 Page 15
3,6624,386
6,053
3,394
54.1%
57.7%57.4%
53.3%
2002 2003 2004 1H-05
EBITDA EBITDA Margin
Revenues and EBITDA growth
Indosat recorded strong revenues and EBITDA growth
(Rp billion)
Revenues EBITDA and EBITDA Margin(Rp billion)
2002 -2004 CAGR 25%2002 -2004 CAGR 29%
6,767
8,235
10,549
5,884
2002 2003 2004 1H-05
Brief Presentation September 2005 Page 16
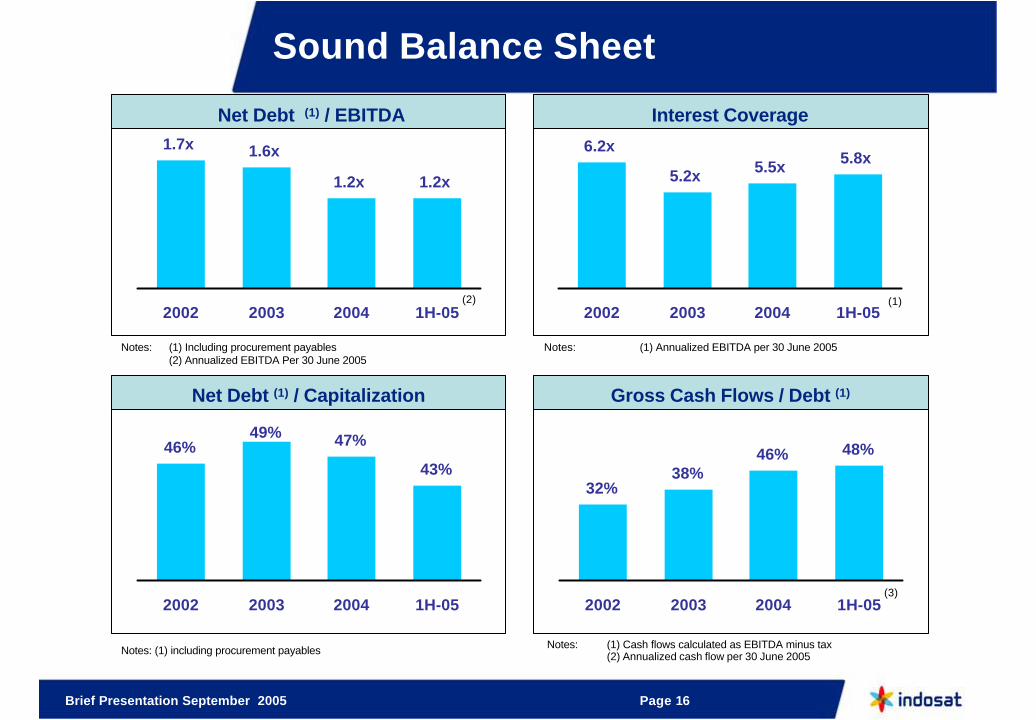
Sound Balance Sheet
1.7x 1.6x
1.2x 1.2x
2002 2003 2004 1H-05
Net Debt (1) / EBITDA Interest Coverage
Net Debt (1) / Capitalization Gross Cash Flows / Debt (1)
6.2x
5.2x 5.5x 5.8x
2002 2003 2004 1H-05
46%49% 47%
43%
2002 2003 2004 1H-05
32%38%
46% 48%
2002 2003 2004 1H-05
Notes: (1) Including procurement payables(2) Annualized EBITDA Per 30 June 2005
Notes: (1) Cash flows calculated as EBITDA minus tax (2) Annualized cash flow per 30 June 2005
(2)
Notes: (1) Annualized EBITDA per 30 June 2005
(1)
(3)
Notes: (1) including procurement payables
Brief Presentation September 2005 Page 17
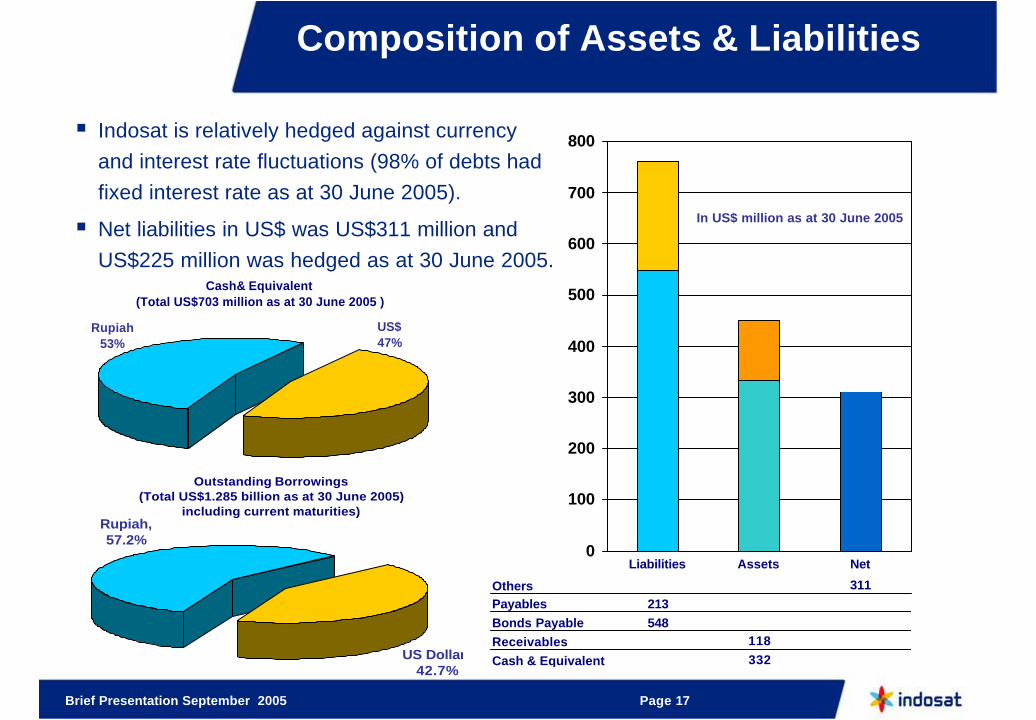
Composition of Assets & Liabilities
Cash& Equivalent(Total US$703 million as at 30 June 2005 )
Rupiah53%
US$47%
Outstanding Borrowings(Total US$1.285 billion as at 30 June 2005)
including current maturities)
US Dollar, 42.7%
Rupiah, 57.2%
0
100
200
300
400
500
600
700
800
Others 311Payables 213Bonds Payable 548Receivables 118
Cash & Equivalent 332
Liabilities Assets Net
In US$ million as at 30 June 2005
§ Indosat is relatively hedged against currency and interest rate fluctuations (98% of debts had fixed interest rate as at 30 June 2005).
§ Net liabilities in US$ was US$311 million and US$225 million was hedged as at 30 June 2005.

Brief Presentation September 2005 Page 18
Recent Development
§ Trial until end of the year with 5MHz in Jakarta and 10 MHz in Surabaya.
§ DG Postel announced plan to tender 2 x 5 MHz of 3G spectrum this year and 25 MHz in 2007.
§ DG Postel will evaluate the existing spectrum allocation and utilization.
§ Government Regulation No 28/2005 issued on 5 July 2005 regulates, among others, the USO contribution.
§ USO Contribution defined as 0.75% of operating revenues.
§ Sale of investment in Camintel amounted to US$1.5 million and in Patrakomindo amounted to Rp3.5 billion, both at around carrying book value.
§ Closing will be subject to fulfillment of conditions.
3G Trial
USO
Divestment of non-core subsidiaries

Brief Presentation September 2005 Page 19
Thank You