Embed Size (px)
Citation preview

Corporate presentation
June 2017

2
Forward looking statement Non-GAAP financial measures
The information in this presentation includes “forward-looking statements” within the meaning of Section 27A of the Securities Act of 1933, as amended, and Securities Exchange Act of 1934, as amended. All statements other than statements of historical fact are forward-looking statements. The words “anticipate,” “assume,” “believe,” “budget,” “estimate,” “expect,” “forecast,” “initial,” “intend,” “may,” “plan,” “potential,” “project,” “should,” “will,” “would,” and similar expressions are intended to identify forward-looking statements. The forward-looking statements in this presentation relate to, among other things, our business and prospects, future costs, financial results, liquidity and financing, regulatory and permitting developments and future demand and supply affecting LNG and general energy markets.
Our forward-looking statements are based on assumptions and analyses made by us in light of our experience and our perception of historical trends, current conditions, expected future developments, and other factors that we believe are appropriate under the circumstances. These statements are subject to numerous known and unknown risks and uncertainties, which may cause actual results to be materially different from any future results or performance expressed or implied by the forward-looking statements. These risks and uncertainties include those described in the “Risk Factors” section of Exhibit 99.1 to our Current Report on Form 8-K/A filed with the Securities and Exchange Commission (the “SEC”) on March 15, 2017 and other filings with the SEC, which are incorporated by reference in this presentation. Many of the forward-looking statements in this presentation relate to events or developments anticipated to occur numerous years in the future, which increases the likelihood that actual results will differ materially from those indicated in such forward-looking statements.
The forward-looking statements made in or in connection with this presentation speak only as of the date hereof. Although we may from time to time voluntarily update our prior forward-looking statements, we disclaim any commitment to do so except as required by securities laws.
This presentation contains information about projected EBITDA of Tellurian. EBITDA is not a financial measure determined in accordance with U.S. generally accepted accounting principles (“GAAP”), should not be viewed as a substitute for any financial measure determined in accordance with GAAP and is not necessarily comparable to similarly titled measures reported by other companies. It would not be possible without unreasonable efforts to reconcile the projected GAAP information presented herein to net income, the most directly comparable GAAP financial measure. Similarly, projected future cash flows as set forth herein may differ from cash flows determined in accordance with GAAP.
Cautionary statement
3
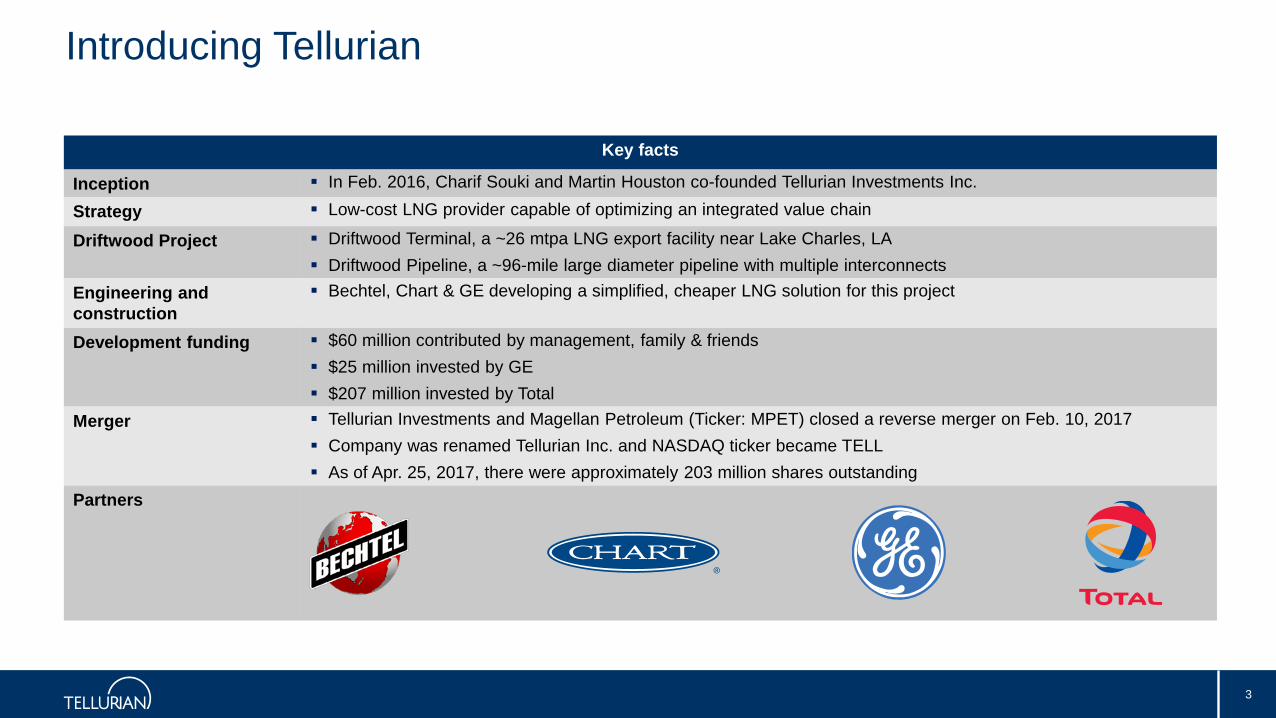
Introducing Tellurian
Key facts
Inception In Feb. 2016, Charif Souki and Martin Houston co-founded Tellurian Investments Inc.
Strategy Low-cost LNG provider capable of optimizing an integrated value chain
Driftwood Project Driftwood Terminal, a ~26 mtpa LNG export facility near Lake Charles, LA Driftwood Pipeline, a ~96-mile large diameter pipeline with multiple interconnects
Engineering and construction
Bechtel, Chart & GE developing a simplified, cheaper LNG solution for this project
Development funding $60 million contributed by management, family & friends $25 million invested by GE $207 million invested by Total
Merger Tellurian Investments and Magellan Petroleum (Ticker: MPET) closed a reverse merger on Feb. 10, 2017 Company was renamed Tellurian Inc. and NASDAQ ticker became TELL As of Apr. 25, 2017, there were approximately 203 million shares outstanding
Partners

4
-
500
1,000
1,500
2,000
2,500
3,000
3,500
4,000
1990 1995 2000 2005 2010 2015 2020 2025 2030 2035
mtpaequivalent
North America S&C America Europe CIS Middle East Africa Asia Pacific
2015-2030CAGR
1.7%
3.0%
3.2%
0.0%
0.9%
0.9%
1.3%
(1)
Actual Forecasts
Global gas demand growing by 7 Bcf/d per average yearExpecting steady growth
Incremental gas demand 2015-2030:105 Bcf/d (785 mtpa) Average annual gas demand growth:7 Bcf/d (50 mtpa)
Source: BP World Energy Outlook (2017 edition)Note: (1) conversion factor assumed at 1 million tonne equivalent to 48 bcf
Bcf/d
500
400
300
200
100
-
1.7%
3.0%
3.2%
0.0%
0.9%
0.9%
1.3%

5
LNG market: from surplus to shortfall
Source: WoodMackenzie (Q3 2016)Note: (1) Assumes liquefaction capacity utilization rate of 95%, 90% and 85% in 2021, 2022 and 2023, respectively, and 85%
thereafter
(2) Driftwood LNG assumed to have liquefaction capacity of ~26 mtpa(3) FID shortfall grossed up by 85% to account for the impact of capacity utilization rate and assuming a 4-year construction period
(1)
(200)
(100)
-
100
200
300
400
500
2015 2016 2017 2018 2019 2020 2021 2022 2023 2024 2025 2026 2027 2028 2029 2030
mtpa
Net liquefaction capacity Driftwood LNG FID shortfall LNG demand
Approximately a third of global gas demand could be supplied from new LNG sources
LNG demand forecasted to grow 4.8% per year 2015-2030Assuming no new FIDs are sanctioned soon, the global LNG market is expected to return to deficit by 2022+
New FIDs are necessary beginning 2018 to keep LNG market balanced 2021+
LNG projects under construction expected to come online next decade just as market enters balance
(2) (3)

6
~100 mtpa of additional liquefaction needed to meet LNG demand by 2025
Source: Wood Mackenzie (Q1 2017)Note: (1) Actual LNG consumption in 2016
(2) Actual LNG global liquefaction capacity in 2016(3) Estimate of liquefaction capacity of projects under construction
(4) Estimated reduction of liquefaction capacity(5) LNG demand estimate(6) Represents the liquefaction capacity required to meet LNG demand in 2025, assuming capacity utilization rate of 85%
258
428
121
18
98
44
76
302
504
-
100
200
300
400
500
2016 Newcapacity
Capacitydecline
Additionalcapacityrequired
2025
mtpa(liquefaction
capacity)
(2)
(6)
( )
(4)
(1)
(5)
(3)

7
Commodity prices
General improvement from early 2016 lows
Future LNG capacity shortfall could result in significantly higher JKM(2)
TTF and JKM are currently highly correlated
Source: ICE, Platts via GlobalviewNote: (1) Prices updated as of 5/1/2017
(2) JKM represents Platts JKMTM
(3) Brent prices based on forward curve
(4) Conversion of Transfer Title Facility (TTF) and translation from €/MWh based on MarketView(5) Based on Newcastle coal price index
(1)
Important price signal
$-
$2
$4
$6
$8
$10
1/2/2015 5/2/2015 9/2/2015 1/2/2016 5/2/2016 9/2/2016 1/2/2017 5/2/2017 9/2/2017 1/2/2018 5/2/2018 9/2/2018
$/mmBtu
JKM (2)11% Brent (3)14% Brent (3)TTF (4)Henry HubCoal (5)

8
$8.00 Asian price = $3.00 – $4.15 margin
Expecting to develop a portfolio of contracts, including (i) Henry Hub plus a fixed fee, (ii) fixed prices and (iii) floatingprices based on TTF(1)
Note: (1) Represents Transfer Title Facility located in the Netherlands(2) HH represents Henry Hub prices, assumed at $3.00/MMBtu(3) Based on Tellurian’s estimate of shipping costs assuming return voyage from U.S. Gulf of Mexico to Northeast Asia throughPanama Canal(4) Based on Tellurian’s estimates of operating costs of unconventional gas wells in various U.S. basins, excluding drilling and completion costs
(5) Based on Tellurian’s estimates of gathering, processing and transportation costs of gas sourced in the U.S. to the Driftwood Project(6) Represents operating costs of the Driftwood terminal, excluding feed gas costs and transportation costs, based on Tellurian’s estimates of Driftwood terminal’s average cash operating costs(7) Based on Tellurian’s proposal of potential LNG contracts at $8.00/MMBtu for 5 years. DES represents delivery ex-ship
$3.45
$6.50
$8.00
$0.90
$2.35
$8.00
$0.70
$1.50
$0.75 $0.70
$1.50
$2.35 $2.35
$1.80
$3.05
$-
$2.00
$4.00
$6.00
$8.00
HHx 115%
Liquefactionfee
FOB Shipping Realizedprice
Upstream Transport LNGterminal
FOB Shipping Margin -Liquefaction
Realizedprice -
DES Asia
$/mmbtu
$4.15
Old model – HH based Seeking cheaper sources of gas
Terminal opex already funded Provides return on capital of LNG terminal,
pipeline and upstream
Fund terminal opex Provides return on capital of LNG terminal
(2) (3) (3)(4) (5)(6)
(7)

9
Strategy
We will create value and help improve air quality by delivering clean, low-cost, flexible and reliable liquefied natural gas to growing markets(1)
We are building a natural gas business that includes ~26 mtpa of production from the Driftwood Project, trading of LNG cargoes and development of new markets globally(1)
Our strategy is to: Secure low-cost natural gas Design and construct low-cost liquefaction Deliver reliable and flexible LNG to a portfolio of customers globally Operate our business safely, efficiently and reliably
Note: (1) Assumes successful execution of our strategy and is subject to risks. Refer to Cautionary Statement on slide 2 of this presentation

10
Driftwood ProjectDriftwood Project
Notes: (1) Estimate, subject to further engineering evaluation (2) Excludes owners’ costs, financing costs and contingencies
Driftwood terminalLand ~1,000 acres near Lake Charles, LA
Nameplate capacity ~26 mtpa(1)
Trains Up to 20 trains of 1.3 mtpa each Chart heat exchangers GE LM6000-PF+ compressors
Storage 3 storage tanks 235,000 m3 each
Marine 3 marine berths
Capex ~$500 - 600/tonne ~$13 - $16 Bn(2)
Driftwood pipelineSize ~96 miles
Capacity ~4 Bcf/d avg. throughput Access ~35 Bcf/d flowing gas
Capex ~$1.6 - 2.0 Bn(2)

11
Driftwood LNG – cost competitive
Source: Wood Mackenzie (Q4 2016)Note: (1) Includes owners’ costs and contingencies and excludes financing and pipeline related costs
(2) Excludes development costs related to berths and storage tanks
-
5
10
15
20
25
30
$-
$500
$1,000
$1,500
$2,000
$2,500
Capacity mtpaCost $/tonne
New project Expansion
(1)
(2)

12
Fast mover through regulatory process
We employ many from the same team that executed Sabine Pass
Source: FERC regulatory filingsNote: (1) Duration of FERC review for Driftwood Project filing based on Tellurian estimates
22
43
37
45
38
43
26
21
- 12 24 36 48
Driftwood LNG
Golden Pass
Magnolia
Lake Charles
Corpus Christi
Freeport
Cameron
Sabine Pass
Months
Pre-filing FERC application
(1)(1)

13
2016June FERC Pre-
filing review process
2018Construction begins, pending regulatory
approval
2022First LNG plant
operational
2023Full pipeline operations
2017Q1 FERC
application filing
2025All LNG plants
operational
Engineering
Bechtel engaged to complete robust FEED Feb 2016
LSTK(1) EPC Contract expected mid-2017
Notice to Proceed with construction expected mid-2018
Regulatory
Pre-filing notice Jun 2016
Draft Resource Reports Dec 2016
Full FERC Application filed Mar 2017
FERC Order expected mid-2018
LNG Marketing
Offices established in London and Singapore Dec 2016
Launch of marketing effort in Tokyo at the Gastech Conference Apr 2017
LNG Sales and Purchase Agreements expected 1H 2018
Financing
Liquefaction development funding raised $60 MM Management, friends & family $25 MM GE $207 MM Total
Opportunistic capital raising 2017 & 2018
Engaged project financing advisor Mar 2017
Arrange project financing bank group expected by end 2017
Liquefaction project financial close expected mid-2018
Estimated project timeline
Note: (1) LSTK represents lump-sum turnkey

14
$2.5 - $3.0 Billion EBITDA by 2025
Construction & pipeline capex 20 Trains: ~$13 - 16 Bn(4)
96-mile pipeline: ~ $1.6 - 2.0 Bn(5)
Capital structure Debt-to-total capital− Liquefaction plant: ~70% − Pipeline: ~80%
Plan to raise capital at OpCo levelCash flow estimates Targeting ~80% of cash flows from
long-term fixed contracts with Investment Grade counterparties
EBITDA: ~$2.5 - $3.0 Bn(6) by 2025 Cash available for distribution to
common shares: >$1 Bn /year Cash flow/share: $6 - $7 by 2025(7)
Advisors Engaged Societe Generale to support structuring of debt financing
Ownership structure(1) Key assumptions
Note: (1) As of 04/25/2017(2) Includes holdings of Souki Family 2016 Trust(3) Removal of restriction is subject to Driftwood Project reaching a final investment decision (FID)(4) Based on construction costs of ~$500-$600/tonne, excluding owners’ costs, financing costs and contingencies
(5) Before owners’ costs, financing costs and contingencies(6) EBITDA calculated as total revenues less operating costs and transportation costs. EBITDA is a non-GAAP measure. Refer to Cautionary Statement on slide 2 of this presentation(7) Based on 202,602,261 shares outstanding
C. Souki27%
M. Houston12%
M. Gentle6%
Restricted6%
Total 23%
Free float26%
~203 mm
(2)
(3)

15
Conclusions
The U.S. is the lowest cost supplier of natural gas to the global market 100 mtpa liquefaction capacity needs to start construction to meet 2025 demand Tellurian focused on low cost across the value chain Keys to winning Low cost gas Low cost infrastructure Execution team Speed Flexibility
Note: (1) Assumes successful execution of our strategy and is subject to risks. Refer to Cautionary Statement on slide 2 of this presentation

16
Driftwood LNG facility illustration

17
Amit MarwahaDirector, Investor Relations & Finance+1 832 485 [email protected]
Joi LecznarSVP, Public Affairs & Communication+1 832 962 [email protected]
@TellurianLNG
Contact us

Appendix

19
Leadership team
Charif Souki, Chairman Founded Cheniere Energy, the first LNG export company in the U.S., growing it to a $9 Bn company while serving as CEO from 2002 to 2015 A lifelong entrepreneur, Charif has spent 20 years raising and investing capital in a range of industries globally
Martin Houston, Vice Chairman Spent three decades at BG Group plc, an FTSE 10 international integrated oil and gas company, retiring in November 2013 as COO and an executive director Conducted business in over 40 countries in an energy career spanning 35 years
Meg Gentle, CEO and President Former EVP of Marketing at Cheniere Energy, based in London, England Previously served as CFO of Cheniere Energy, negotiating $25 Bn of debt and equity financings
Keith Teague, Chief Operating Officer Former EVP, Asset Group at Cheniere Energy, based in Houston, Texas Responsible for development, construction and operation of Cheniere Energy’s natural gas terminal and pipeline assets
Antoine Lafargue, Chief Financial Officer Former President and CEO of Magellan Petroleum Corporation Prior roles in M&A, leverage finance and private equity both in Europe and the U.S.
Daniel Belhumeur, General Counsel Former VP, Tax and General Tax Counsel of Cheniere Energy Background includes corporate reorganizations, structuring debt and equity financings and state and local tax incentives
Page 1of 2

20
Leadership team
Howard Candelet, SVP Projects Joined Tellurian after 40 years at BG Group, where he held many senior management positions in General Operations, Project Management, Company Business
Operations and Business Development Deep operational experience includes stint as VP operations at BG Group’s Atlantic LNG
Pat Outtrim, SVP Government and Regulatory Affairs Responsible for government and regulatory activities, permitting, regulatory compliance and HSE groups Assisted in the site development, permitting and expansion of 7 US LNG import terminals Background includes management of LNG vehicle projects, hazard/risk, siting, cost analysis and code compliance
Mark Evans, SVP Gas Supply Spent 12 years at BG Group responsible for the North American natural gas trading and marketing business Previously employed by Duke Energy in various natural gas trading and marketing roles for over 10 years
Tarek Souki, SVP Marketing and Trading Former VP Finance and Business Development of Cheniere Marketing based in London where he built out and led the middle office, back office and finance
functions for its trading operations Previously spent 14 years working for various financial institutions, including most recently Credit Suisse
Joi Lecznar, SVP Public Affairs and Communication Responsible for external and internal communication activities, including marketing, public relations and media relations 30 years of communication experience in industries including oil and gas, banking and consulting, and has conducted business in 13 countries on six continents
John Howie, SVP Upstream Over three decades experience developing and investing in energy assets, deploying ~$2 Bn in upstream sector Most recently president of Impact Natural Resources, founder of Parallel Resource Partners and head of Goldman Sachs E&P Capital
Page 2 of 2

21
Driftwood terminal vs. traditional LNG plant – design
DWLNG layout: 5.2 mtpa Traditional layout: 4.5 mtpa
GE LM6000 PF+ (x4): cheapest dollar per installed horsepower = more LNG production per acre
Gas pre-treatment facility
Chart cold boxes (x4): IPSMR technology uses single mixed refrigerant; design scaled up from mid-scale design, rather than down from top
Cold boxes (x3): 3 cold boxes, one for each refrigerant gas loop
GE LM2500 (x6): smaller turbine means one needs 6 turbines and 3 circuits to produce 4.5 mtpa
Gas
pre
-trea
tmen
t
Single refrigerant loop (x4): requires less land, less pipe
Redundancy built-in: if 1 compressor is out of service, only that circuit is affected
Larger footprint: 3 cold boxes need more land, more pipe
Redundancy necessary: if 1 compressor is out of service, entire circuit is affected

22
Key project partners
Liquefaction technology World-class cold box manufacturer for all technologies – supplied more than 10,000 brazed aluminum heat
exchanger (BAHX) cores – more than 500 for LNG service Driftwood LNG to use the Integrated Pre-cooled Single Mixed Refrigerant (IPSMR®) liquefaction process
Turbines and compressors GE Oil & Gas has 25+ years of experience in LNG technology Delivered refrigerant compressors and turbines for some of the world’s largest projects Partnering to set new low-cost standard for installed horsepower Invested $25 million
Equity partners
Strategic investor Invested $207 million, 23% ownership in Tellurian Globally integrated portfolio and experienced LNG company
EPC World leader in the LNG industry, and has built 41 trains producing 120 mtpa to date Founders have deep relationship with Bechtel: 15 trains with Tellurian’s executive team Bechtel expected to wrap the Chart technology liquefaction interface
Project partners

23
Simple capital structure
Tellurian Inc.(NASDAQ:TELL)
Equityissuances
Project finance debt
Project equity / preferred equity
Project finance debt

24
FERC approval process
Authorization under Section 3 (terminal) and Section 7 (pipeline) of the Natural Gas Act
FERC designated as lead agency Oversee siting, construction and operation of LNG facilities by Energy Policy Act 2005 Provide National Environmental Policy Act (NEPA) analysis and develop Environmental Impact Statement (EIS) All other agencies are cooperating agencies
FERC process:Pre-filing (minimum of 6 months) May 2016Application March 2017 Draft Environmental Impact Statement Expected Q3-Q4 2017 Final Environmental Impact Statement Expected Q4 2017- Q1 2018 FERC Order Expected mid-2018

25
Forecasted LNG consumption
0
100
200
300
400
500
600
-
10
20
30
40
50
60
70
80
2000
2001
2002
2003
2004
2005
2006
2007
2008
2009
2010
2011
2012
2013
2014
2015
2016
2017
2018
2019
2020
2021
2022
2023
2024
2025
2026
2027
2028
2029
2030
2031
2032
2033
2034
2035
mtpaBcf/d
North America South America Europe Asia Pacific Middle East Africa

26
12% Growth in Asia / Middle East LNG demand in 2016
Source: IHS Markit WaterborneNote: (1) 2016 year-on-year change
(2) AME represents Asia and Middle East
189
212
7.3
4.8
4.4 0.9
1.9 1.3 0.8 0.2
2.3 0.3 0.7 0.6 0.2 1.0
185
200
215
LNGconsumption
(mtpa)
(1)

27
Expiration of existing contracts
Source: IHS EnergyNote: Based on executed Sale and Purchase Agreements and Liquefaction Tolling Agreements
mtpa

28
The U.S. offers the right product to customers
Source: © 2015 IHS Energy
02468
101214161820
PNG
LN
G T
1-2
LNG
Can
ada
T1-2
Paci
fic N
orth
wes
t LN
G T
1-2
Moz
ambi
que
LNG
(Are
a 1)
Pros
perid
ade-
Mam
ba L
NG
(Are
a 4)
Pros
perid
ade-
Mam
ba L
NG
(Are
a 1)
Sakh
alin
2 T
3
Tanz
ania
LN
G T
1-2
Aus
tral
ia P
acifi
c LN
G T
1-2
GLN
G T
1-2
Gor
gon
LNG
T1-
3
Icht
hys
LNG
T1-
2
Whe
atst
one
LNG
T1-
2
Ang
ola
LNG
T1
Sabi
ne P
ass
LNG
T1-
2
Yam
al L
NG
T1-
3
Cam
eron
LN
G T
1-3
Cor
pus
Chr
isti
LNG
T1-
2
Cov
e Po
int L
NG
Free
port
LN
G T
1
Free
port
LN
G T
2
Free
port
LN
G T
3
Sabi
ne P
ass
LNG
T3-
4
Upstream breakeven* Pipeline breakeven* Liquefaction breakeven*
$/M
MB
tu
Global: Breakeven FOB costs at $50/bbl
Lower 48/GOM Liquefaction Projects in Bottom Quartile of Cost Curve

29
$0
$500
$1,000
$1,500
$2,000
$2,500
$3,000
$3,500
1995
1996
1997
1998
1999
2000
2001
2002
2003
2004
2005
2006
2007
2008
2009
2010
2011
2012
2013
2014
2015
2016
2017
2018
2019
2020
2021
2022
2023
2024
2025
2026
$/tonne
Year of Commercial Start upAlaska Brunei Darussalam United Arab Emirates Malaysia Australia QatarTrinidad and Tobago Nigeria Oman Egypt Equatorial Guinea NorwayRussia East Yemen Peru Angola Papua New Guinea IndonesiaUS East Russia West Cameroon Canada West Mozambique Tanzania
Driftwood Project cost competitive
Source: IHS Energy
Driftwood Project
Awaiting Final Investment Decision (FID)
US Projects – Under construction


![Final LNG Presentation rev3 [Compatibility Mode]](https://img.pdfslide.us/doc/110x75/585c41931a28abed218c26f1/final-lng-presentation-rev3-compatibility-mode.jpg)