Embed Size (px)
DESCRIPTION
not sure of the info
Citation preview
Corporate Presentation December 2014

Forward-Looking Information In the interest of providing investors with information regarding Inter Pipeline, including management’s current expectations, estimates and projections about the future, certain statements and
graphs throughout this presentation contain forward-looking statements or information (collectively referred to as "forward-looking statements") within the meaning of applicable securities
legislation. When used in this presentation, the words "may", "would", "should", "could", "will", "intend", "plan", "anticipate", "believe", "estimate", "expect", "continue", "project", "forecast", "target"
and similar expressions, as they relate to Inter Pipeline or its management are intended to identify forward-looking statements. Forward-looking statements contained in this presentation relate to,
among other things, statements regarding business strategy, plans and other expectations, beliefs, goals, objectives, information and statements about possible future events. Specific forward-
looking statements that may be contained in this presentation include statements regarding the ability of Inter Pipeline to maintain its current level of dividends; changes in legislation relating to
Inter Pipeline and its structure, including income tax considerations and the treatment of security holders under tax laws; and the composition of the management and Board of Directors of Inter
Pipeline; in addition, this presentation may contain forward-looking statements attributed to third-party industry sources. Readers are cautioned not to place undue reliance on such forward-looking
statements. Such statements reflect the current views of Inter Pipeline with respect to future events and are subject to certain risks, uncertainties and assumptions that could cause the results of
Inter Pipeline to differ materially from those expressed in the forward-looking statements. Factors that could cause actual results to vary from forward-looking information or may affect the
operations, performance, development and results of Inter Pipeline's businesses include, among other things: risks and assumptions associated with operations, such as Inter Pipeline's ability to
successfully implement its strategic initiatives and achieve expected benefits, including the further development of its oil sands pipeline systems; assumptions concerning operational reliability; the
availability and price of labour and construction materials; the status, credit risk and continued existence of customers having contracts with Inter Pipeline and their respective affiliates; availability
of energy commodities; volatility of and assumptions regarding prices of energy commodities; competitive factors, pricing pressures and supply and demand in the natural gas and oil
transportation, ethane transportation and natural gas liquids (NGL) extraction and storage industries; assumptions based upon Inter Pipeline's current financial and operational guidance;
fluctuations in currency and interest rates; inflation; the ability to access sufficient capital from internal and external sources; risks and uncertainties associated with the ability to maintain Inter
Pipeline's current level of cash dividends; risks inherent in Inter Pipeline's Canadian and foreign operations; risks of war, hostilities, civil insurrection, instability and political and economic
conditions in or affecting countries in which Inter Pipeline and its affiliates operate; severe weather conditions; terrorist threats; risks associated with technology; Inter Pipeline's ability to generate
sufficient cash flow from operations to meet its current and future obligations; Inter Pipeline's ability to access external sources of debt and equity capital; general economic and business
conditions; the potential delays of and costs of overruns on construction projects, including, but not limited to Inter Pipeline's current oil sands projects and future expansions of Inter Pipeline's oil
sands pipeline systems; risks associated with the failure to finalize formal agreements with counterparties in circumstances where letters of intent or similar agreements have been executed and
announced by Inter Pipeline; Inter Pipeline's ability to make capital investments and the amounts of capital investments; changes in laws and regulations, including environmental, regulatory and
taxation laws, and the interpretation of such changes to laws and regulations; the risks associated with existing and potential future lawsuits and regulatory actions against Inter Pipeline and its
affiliates; increases in maintenance, operating or financing costs; availability of adequate levels of insurance; difficulty in obtaining necessary regulatory approvals and maintenance of support of
such approvals; the inability to meet or continue to meet listing requirements of the TSX; and such other risks and uncertainties described from time to time in Inter Pipeline's reports and filings with
the Canadian securities regulatory authorities. The impact of any one assumption, risk, uncertainty or other factor on a particular forward-looking statement is not determinable with certainty, as
these are interdependent and Inter Pipeline's future course of action depends on management's assessment of all information available at the relevant time. See "Risk Factors" in the
management's discussion and analysis of Inter Pipeline's operating results for the years ended December 31, 2013 and 2012 and other reports and filings available at www.sedar.com. Although
the forward-looking statements contained in this presentation are based upon what management believes to be reasonable assumptions, there can be no assurance that actual results will be
consistent with these forward-looking statements. The forward-looking statements contained, or incorporated by reference, herein are expressly qualified in their entirety by this cautionary
statement. The forward-looking statements included, or incorporated by reference, in this presentation are made as of the date hereof and Inter Pipeline undertakes no obligation to publicly update
such forward-looking statements to reflect new information, subsequent events or otherwise, except as required by applicable securities laws. You are further cautioned that the preparation of
financial statements in accordance with GAAP requires management to make certain judgments and estimates that affect the reported amounts of assets, liabilities, revenues and expenses. These
estimates may change, having either a negative or positive effect on net earnings as further information becomes available and as the economic environment changes. GAAP and Non-GAAP
Measures – In addition to providing measures prepared in accordance with GAAP this presentation may contain references to non-GAAP measures as identified herein. These measures do not
have any standardized meaning prescribed by GAAP and therefore may not be comparable to similar measures presented by other entities. Investors are cautioned that non-GAAP and additional
GAAP financial measures should not be construed as alternatives to other measures of financial performance calculated in accordance with GAAP. References to the term “EBITDA” used in this
presentation may include EBITDA or adjusted EBITDA. The most closely related GAAP and non-GAAP measures are defined in Inter Pipelines’ most recent Management Discussion and
Analysis available at www.interpipeline.com. Industry Data - Certain market, independent third party and industry data contained in this presentation is based upon information from government or
other independent industry publications and reports or based on estimates derived from such publications and reports. Government and industry publications and reports generally indicate that
they have obtained their information from sources believed to be reliable, but do not guarantee the accuracy or completeness of their information. This presentation also includes certain data,
including information on export and refining capacity, supply and demand for certain commodity types and total remaining established oil ands reserves, and other operational results, derived from
public filings made by independent third parties. While Inter Pipeline believes this data to be reliable, market and industry data is subject to variations and cannot be verified with complete certainty
due to limits on the availability and reliability of raw data, the voluntary nature of the data gathering process and other limitations and uncertainties inherent in any statistical survey. Inter Pipeline
has not independently verified any of the data from independent third party sources referred to in this presentation or ascertained the underlying assumptions relied upon by such sources.
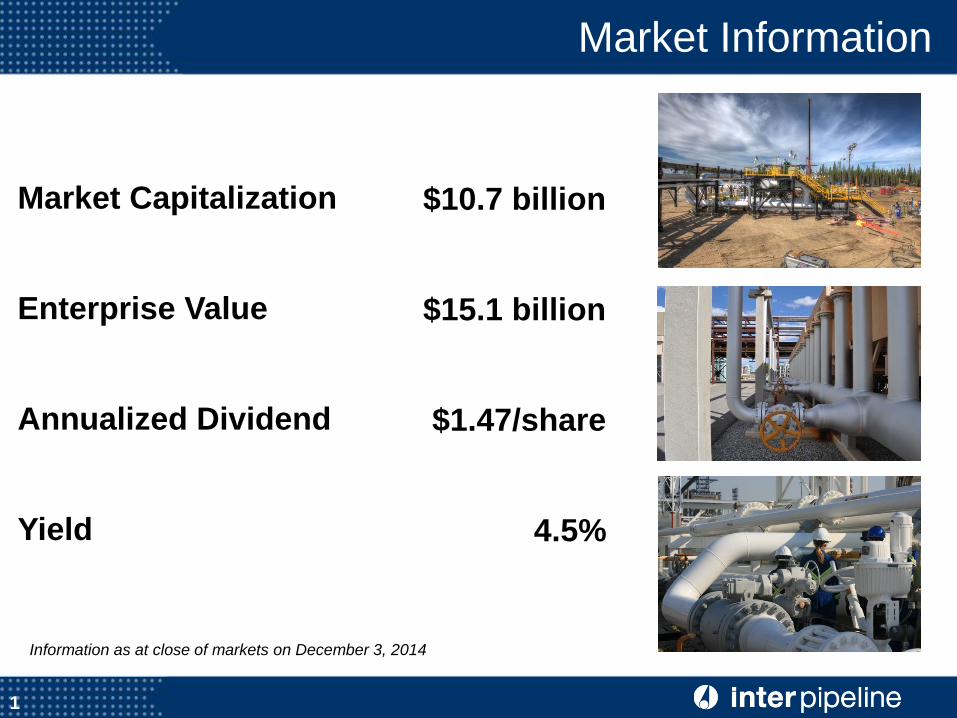
Market Information
1
Market Capitalization
Enterprise Value
Annualized Dividend
Yield
$10.7 billion
$15.1 billion
$1.47/share
4.5%
Information as at close of markets on December 3, 2014
2
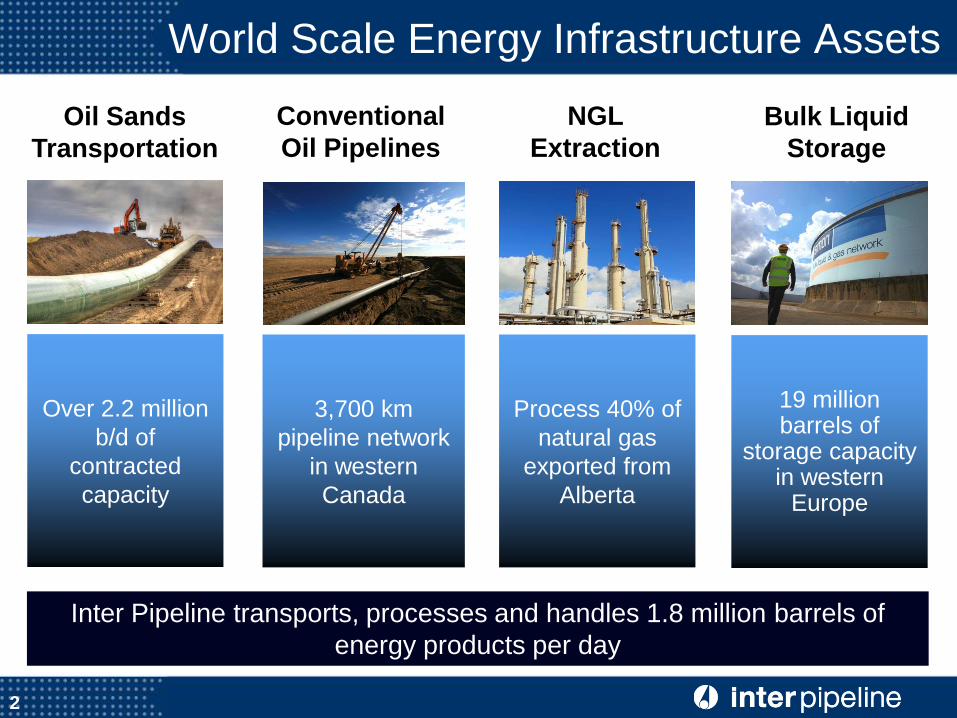
World Scale Energy Infrastructure Assets
Oil Sands
Transportation
NGL
Extraction
Conventional
Oil Pipelines
Bulk Liquid
Storage
Over 2.2 million
b/d of
contracted
capacity
3,700 km
pipeline network
in western
Canada
Process 40% of
natural gas
exported from
Alberta
19 million barrels of
storage capacity in western
Europe
Inter Pipeline transports, processes and handles 1.8 million barrels of
energy products per day
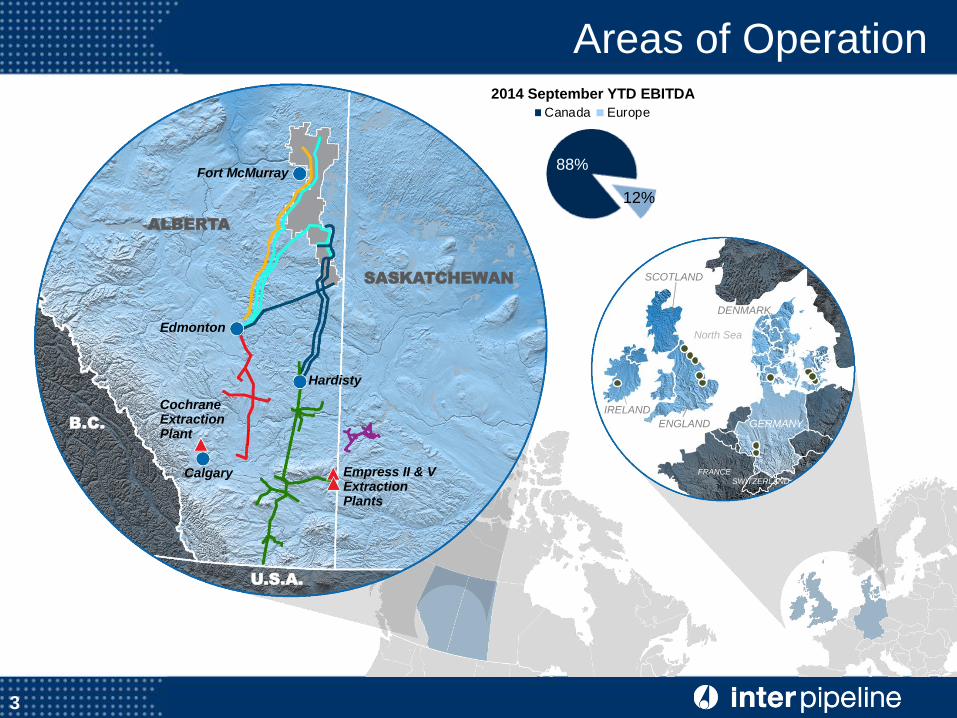
Areas of Operation
Fort McMurray
Edmonton
ALBERTA
SASKATCHEWAN
Hardisty
Calgary
Cochrane Extraction Plant
B.C.
U.S.A.
Empress II & V Extraction Plants
GERMANY
DENMARK
SCOTLAND
ENGLAND
IRELAND
FRANCE
SWITZERLAND
North Sea
2014 September YTD EBITDA
3
88%
12%
Canada Europe
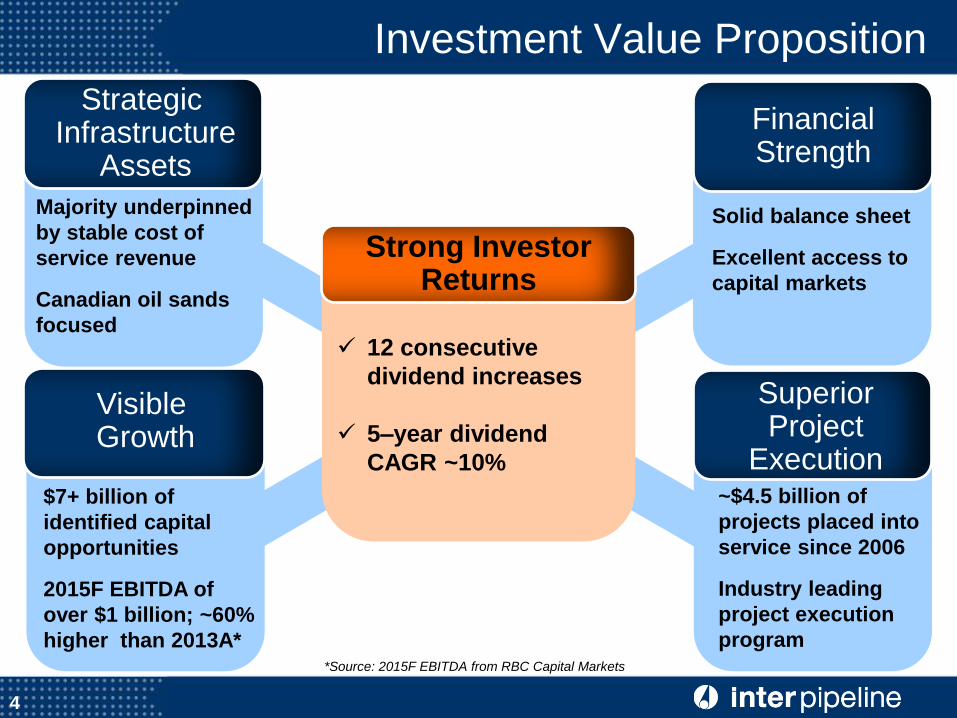
Strategic Infrastructure
Assets
Financial Strength
Investment Value Proposition
Majority underpinned
by stable cost of
service revenue
Canadian oil sands
focused
Solid balance sheet
Excellent access to
capital markets
*Source: 2015F EBITDA from RBC Capital Markets
Financial Strength
$7+ billion of
identified capital
opportunities
2015F EBITDA of
over $1 billion; ~60%
higher than 2013A*
Visible Growth
Superior Project
Execution ~$4.5 billion of
projects placed into
service since 2006
Industry leading
project execution
program
4
Strong Investor Returns
12 consecutive
dividend increases
5–year dividend
CAGR ~10%
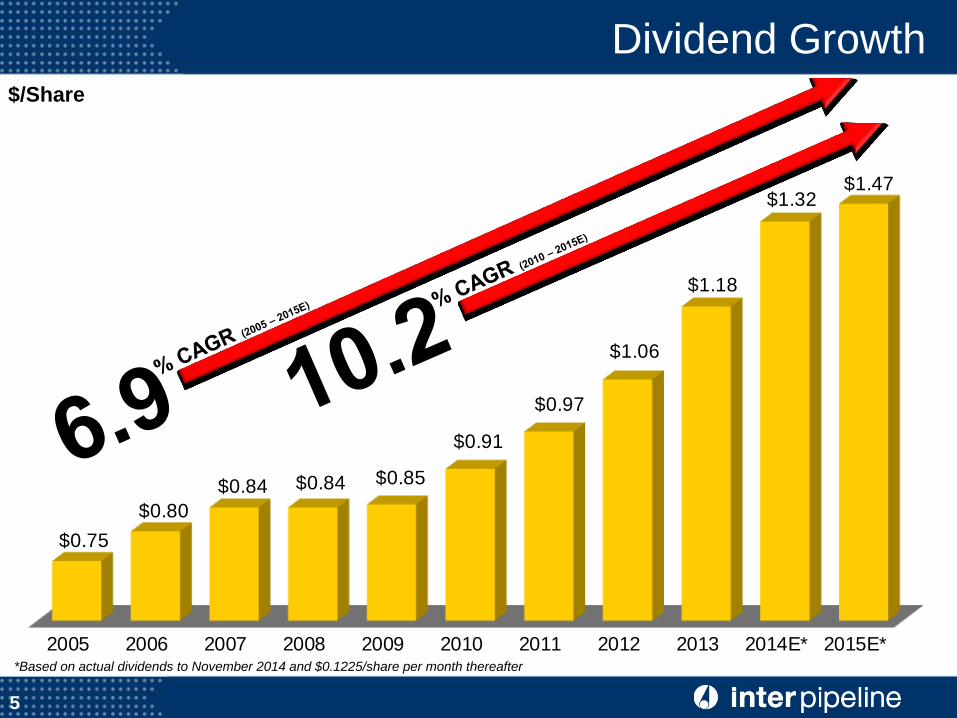
2005 2006 2007 2008 2009 2010 2011 2012 2013 2014E* 2015E*
$0.75
$0.80
$0.84 $0.84 $0.85
$0.91
$0.97
$1.06
$1.18
$1.32$1.47
Dividend Growth $/Share
*Based on actual dividends to November 2014 and $0.1225/share per month thereafter
5
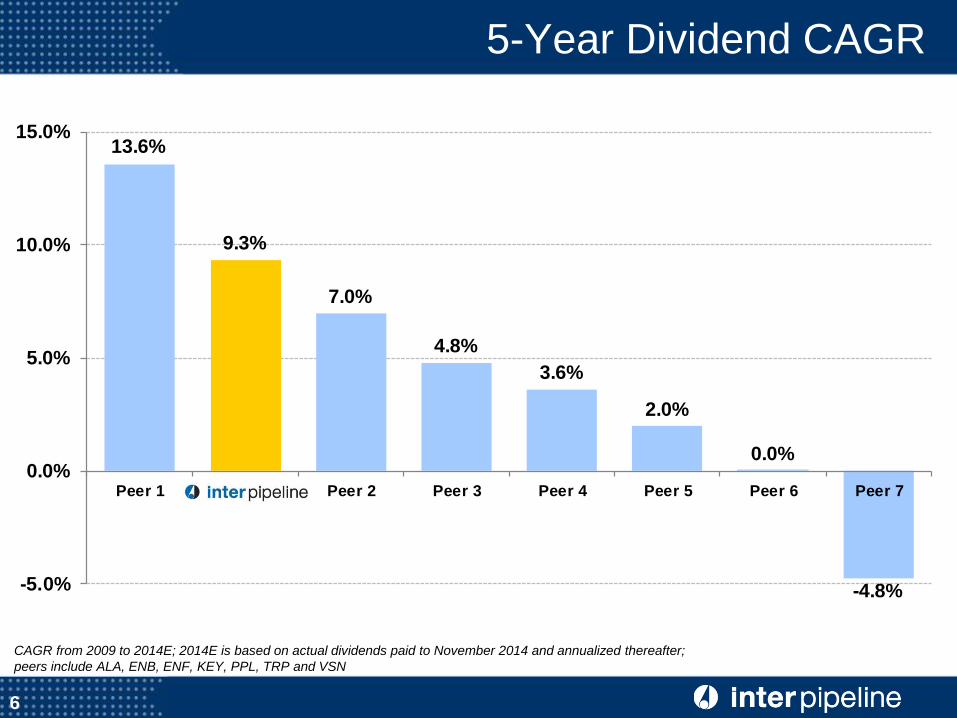
13.6%
9.3%
7.0%
4.8%
3.6%
2.0%
0.0%
-4.8%-5.0%
0.0%
5.0%
10.0%
15.0%
Peer 1 Inter Pipeline Peer 2 Peer 3 Peer 4 Peer 5 Peer 6 Peer 7
5-Year Dividend CAGR
CAGR from 2009 to 2014E; 2014E is based on actual dividends paid to November 2014 and annualized thereafter;
peers include ALA, ENB, ENF, KEY, PPL, TRP and VSN
6
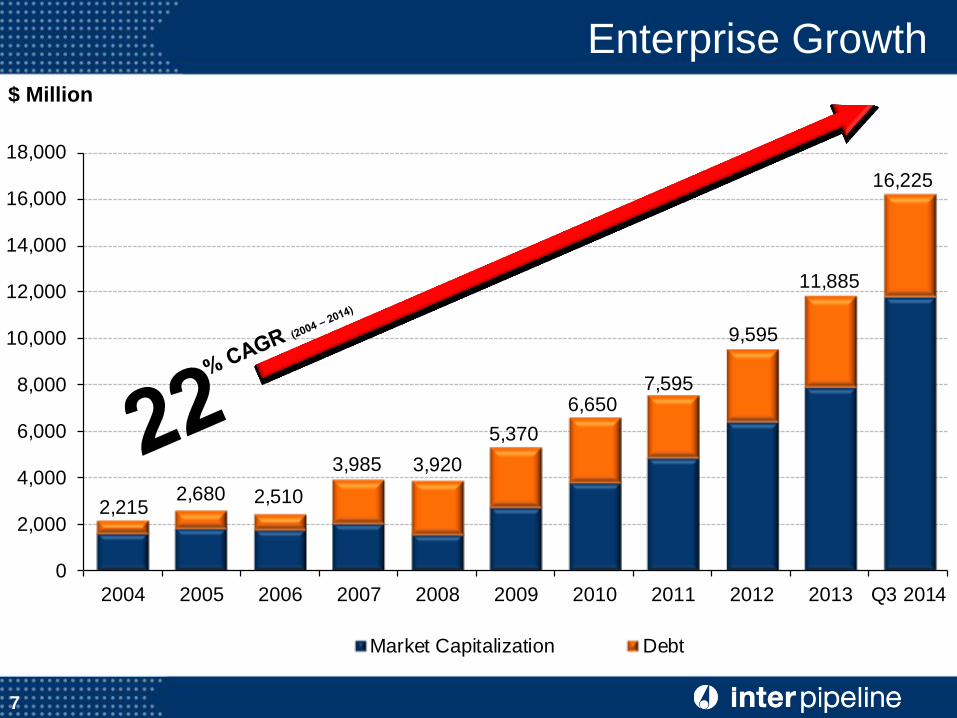
0
2,000
4,000
6,000
8,000
10,000
12,000
14,000
16,000
18,000
2004 2005 2006 2007 2008 2009 2010 2011 2012 2013 Q3 2014
Market Capitalization Debt
2,2152,680 2,510
3,985 3,920
5,370
7,595
9,595
11,885
6,650
16,225
Enterprise Growth $ Million
7
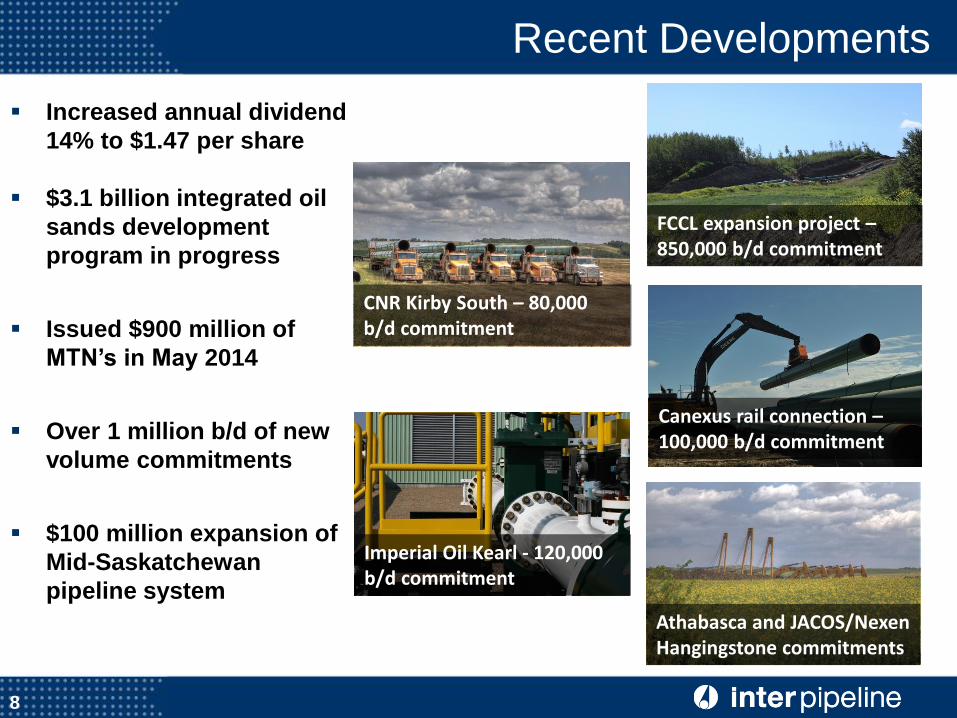
Recent Developments
Increased annual dividend
14% to $1.47 per share
$3.1 billion integrated oil
sands development
program in progress
Issued $900 million of
MTN’s in May 2014
Over 1 million b/d of new
volume commitments
$100 million expansion of
Mid-Saskatchewan
pipeline system
FCCL expansion project – 850,000 b/d commitment
CNR Kirby South – 80,000 b/d commitment
Canexus rail connection – 100,000 b/d commitment
Imperial Oil Kearl - 120,000 b/d commitment
8
Athabasca and JACOS/Nexen Hangingstone commitments
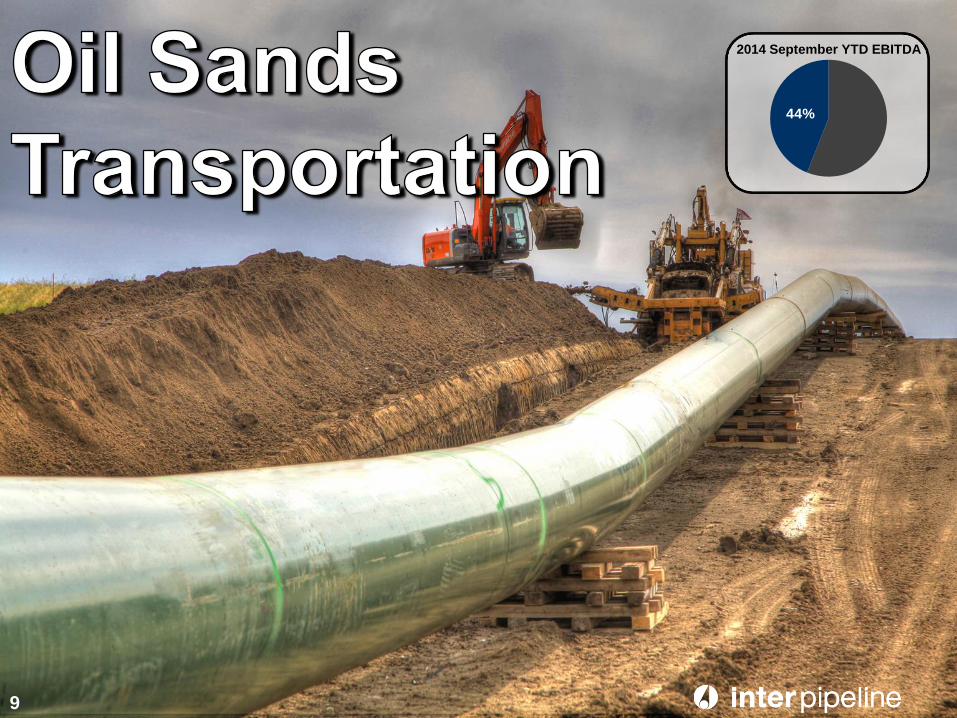
2014 September YTD EBITDA
9
44%
FCCL Christina Lake
Husky Sunrise
Imperial Kearl
Suncor
AOC Hangingstone
CNR Kirby South
Hardisty
Edmonton
Jacos/Nexen Hangingstone
Polaris Extension
Blend Line Expansion
FCCL Foster Creek
Fort McMurray
FCCL Narrows Lake
Canexus Facility
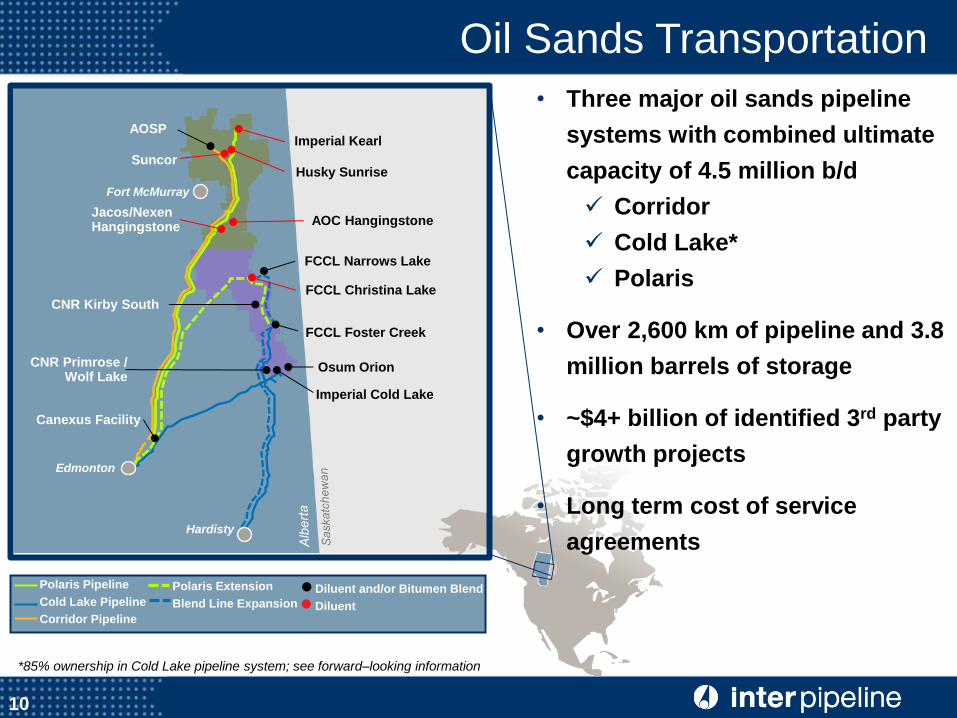
Oil Sands Transportation
• Three major oil sands pipeline
systems with combined ultimate
capacity of 4.5 million b/d
Corridor
Cold Lake*
Polaris
• Over 2,600 km of pipeline and 3.8
million barrels of storage
• ~$4+ billion of identified 3rd party
growth projects
• Long term cost of service
agreements
Polaris Extension
Blend Line Expansion
Polaris Pipeline
Cold Lake Pipeline
Corridor Pipeline
Diluent and/or Bitumen Blend
Diluent
10
AOSP
CNR Primrose / Wolf Lake
Imperial Cold Lake
Osum Orion
*85% ownership in Cold Lake pipeline system; see forward–looking information
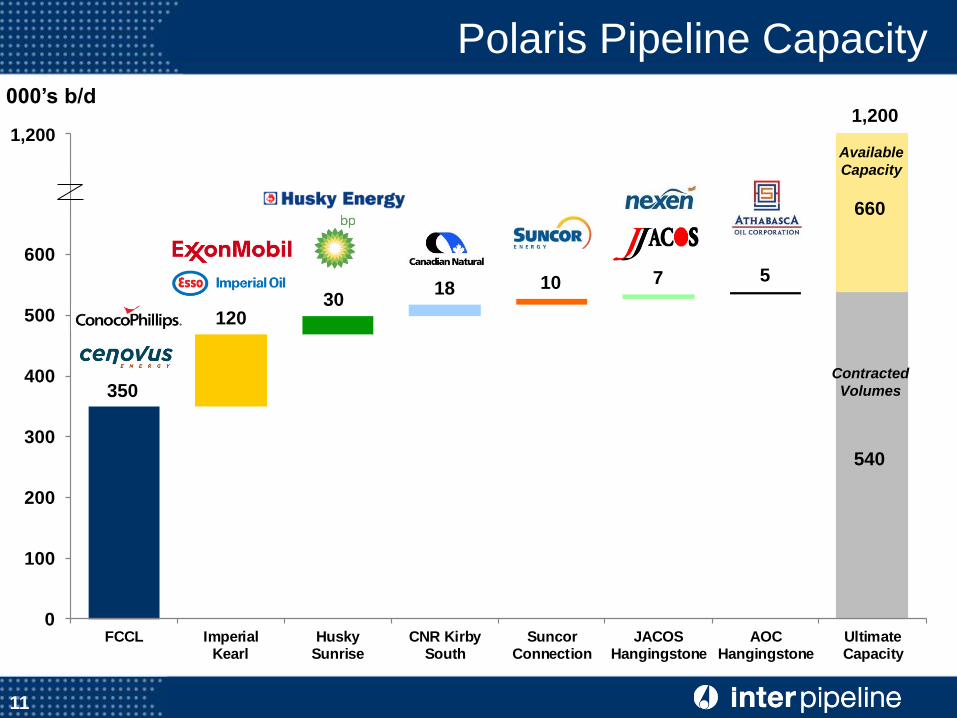
0
100
200
300
400
500
600
700
800
FCCL ImperialKearl
HuskySunrise
CNR KirbySouth
SuncorConnection
JACOSHangingstone
AOCHangingstone
UltimateCapacity
000’s b/d
1,200
350
120 30
18 10 7 5
1,200
540
660
Contracted
Volumes
Available
Capacity
11
Polaris Pipeline Capacity
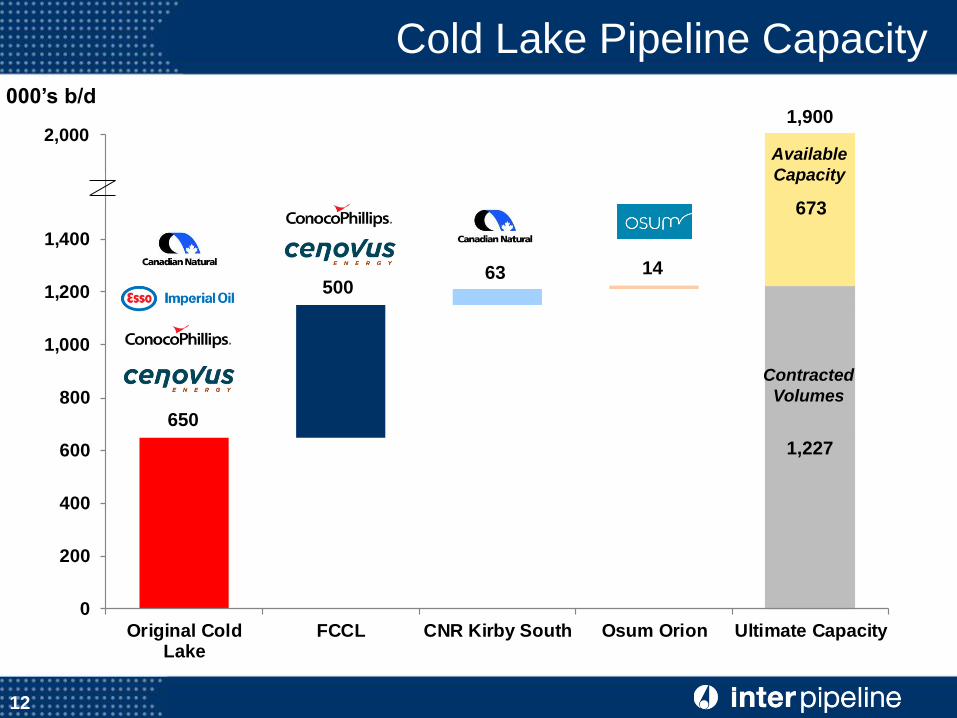
0
200
400
600
800
1,000
1,200
1,400
1,600
1,800
Original ColdLake
FCCL CNR Kirby South Osum Orion Ultimate Capacity
000’s b/d
2,000
650
500 63 14
1,900
Contracted
Volumes
Available
Capacity
1,227
673
12
Cold Lake Pipeline Capacity
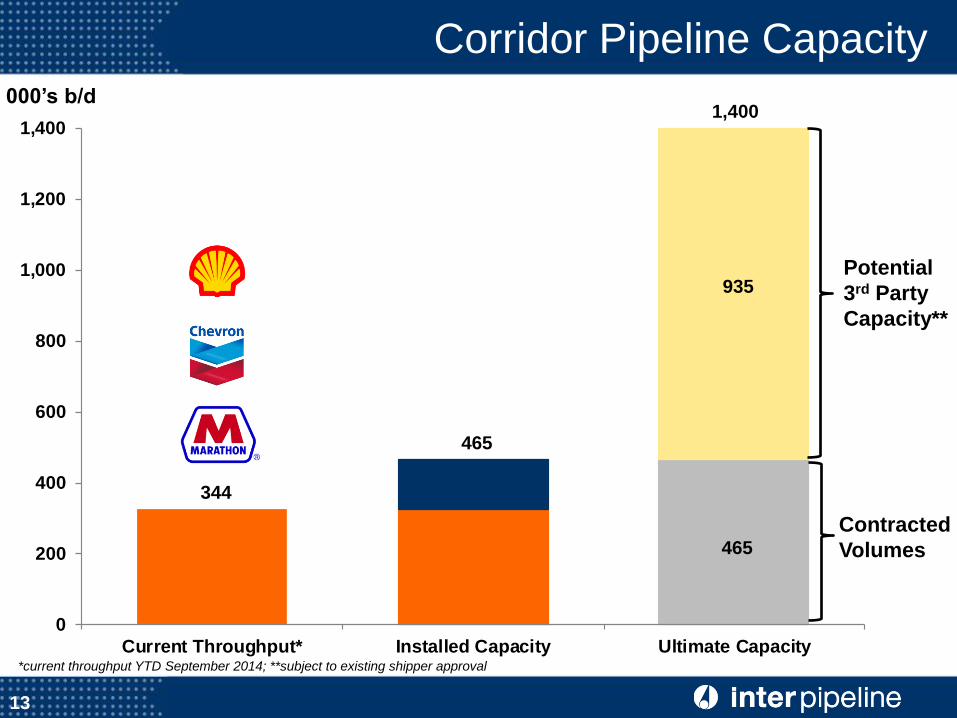
0
200
400
600
800
1,000
1,200
1,400
Current Throughput* Installed Capacity Ultimate Capacity
000’s b/d
344
465
1,400
*current throughput YTD September 2014; **subject to existing shipper approval
935
465
Potential
3rd Party
Capacity**
Contracted
Volumes
13
Corridor Pipeline Capacity
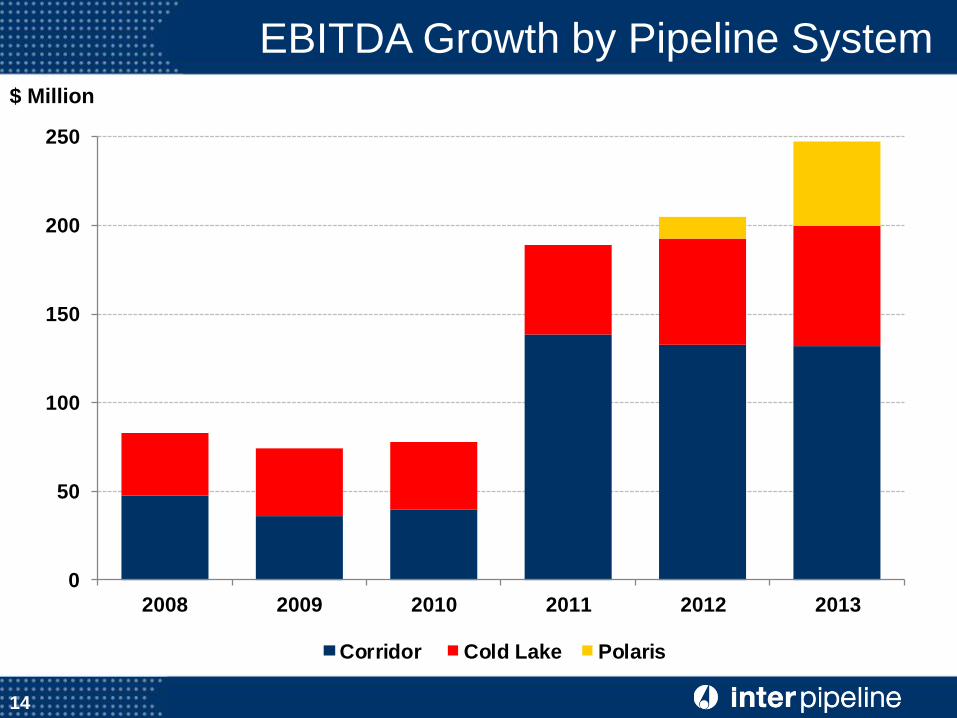
EBITDA Growth by Pipeline System
$ Million
0
50
100
150
200
250
2008 2009 2010 2011 2012 2013
Corridor Cold Lake Polaris
14
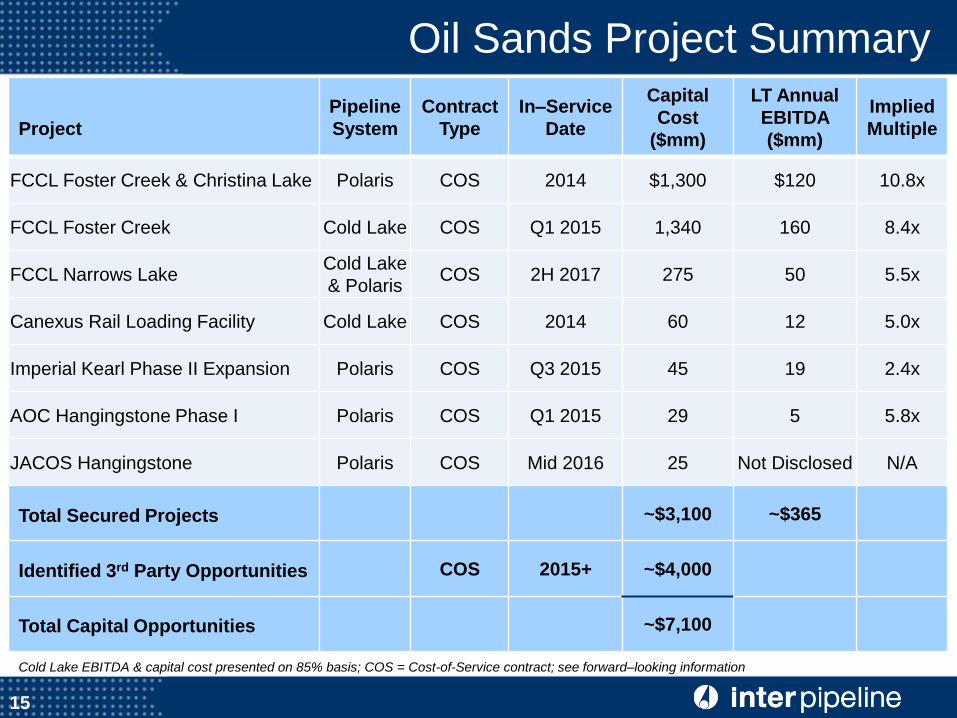
Oil Sands Project Summary
Project
Pipeline
System
Contract
Type
In–Service
Date
Capital
Cost
($mm)
LT Annual
EBITDA
($mm)
Implied
Multiple
FCCL Foster Creek & Christina Lake Polaris COS 2014 $1,300 $120 10.8x
FCCL Foster Creek Cold Lake COS Q1 2015 1,340 160 8.4x
FCCL Narrows Lake Cold Lake
& Polaris COS 2H 2017 275 50 5.5x
Canexus Rail Loading Facility Cold Lake COS 2014 60 12 5.0x
Imperial Kearl Phase II Expansion Polaris COS Q3 2015 45 19 2.4x
AOC Hangingstone Phase I Polaris COS Q1 2015 29 5 5.8x
JACOS Hangingstone Polaris COS Mid 2016 25 Not Disclosed N/A
Total Secured Projects ~$3,100 ~$365
Identified 3rd Party Opportunities COS 2015+ ~$4,000
Total Capital Opportunities ~$7,100
Cold Lake EBITDA & capital cost presented on 85% basis; COS = Cost-of-Service contract; see forward–looking information
15
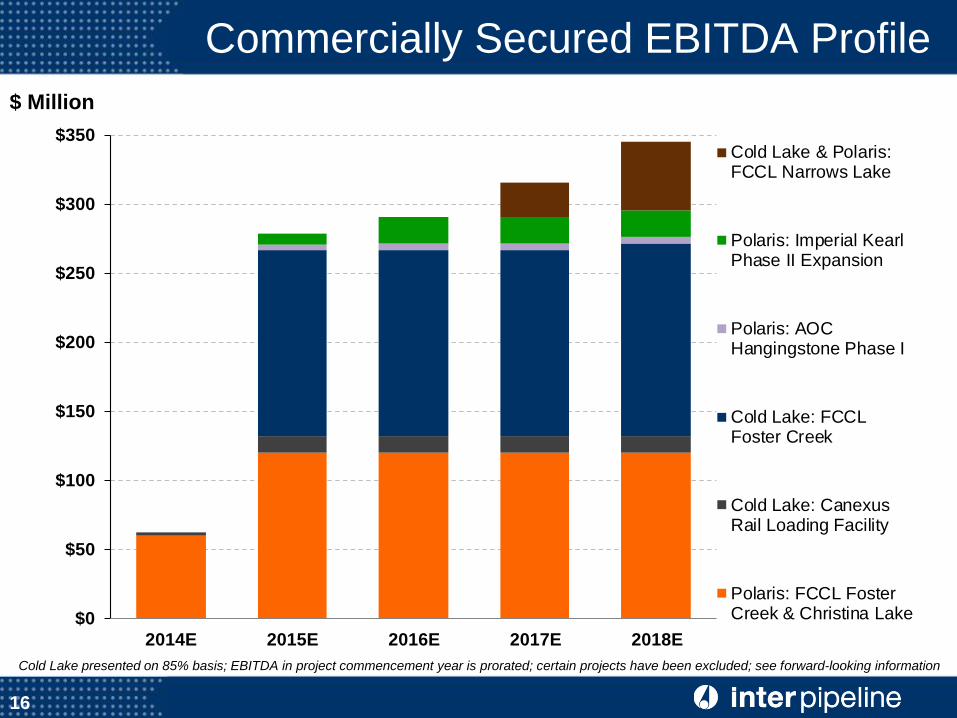
$0
$50
$100
$150
$200
$250
$300
$350
2014E 2015E 2016E 2017E 2018E
Cold Lake & Polaris:FCCL Narrows Lake
Polaris: Imperial KearlPhase II Expansion
Polaris: AOCHangingstone Phase I
Cold Lake: FCCLFoster Creek
Cold Lake: CanexusRail Loading Facility
Polaris: FCCL FosterCreek & Christina Lake
Commercially Secured EBITDA Profile
Cold Lake presented on 85% basis; EBITDA in project commencement year is prorated; certain projects have been excluded; see forward-looking information
$ Million
16
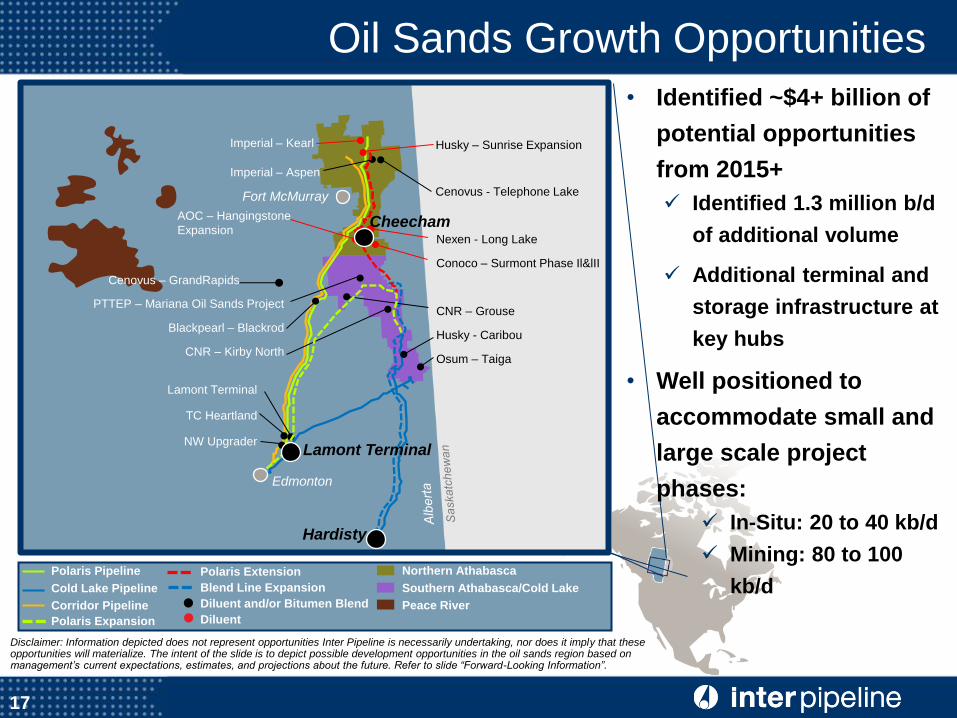
Oil Sands Growth Opportunities
Disclaimer: Information depicted does not represent opportunities Inter Pipeline is necessarily undertaking, nor does it imply that these opportunities will materialize. The intent of the slide is to depict possible development opportunities in the oil sands region based on management’s current expectations, estimates, and projections about the future. Refer to slide “Forward-Looking Information”.
Edmonton
Hardisty
Fort McMurray
• Identified ~$4+ billion of
potential opportunities
from 2015+
Identified 1.3 million b/d
of additional volume
Additional terminal and
storage infrastructure at
key hubs
• Well positioned to
accommodate small and
large scale project
phases:
In-Situ: 20 to 40 kb/d
Mining: 80 to 100
kb/d
Nexen - Long Lake
Conoco – Surmont Phase Il&lII
CNR – Grouse
Husky - Caribou
Osum – Taiga
AOC – Hangingstone
Expansion
PTTEP – Mariana Oil Sands Project
Blackpearl – Blackrod
CNR – Kirby North
Imperial – Kearl
Imperial – Aspen
Husky – Sunrise Expansion
Cenovus – GrandRapids
Lamont Terminal
TC Heartland
NW Upgrader Lamont Terminal
Cheecham
17
Cenovus - Telephone Lake
Polaris Pipeline
Cold Lake Pipeline
Corridor Pipeline
Polaris Expansion
Northern Athabasca
Southern Athabasca/Cold Lake
Peace River
Polaris Extension
Blend Line Expansion
Diluent and/or Bitumen Blend
Diluent
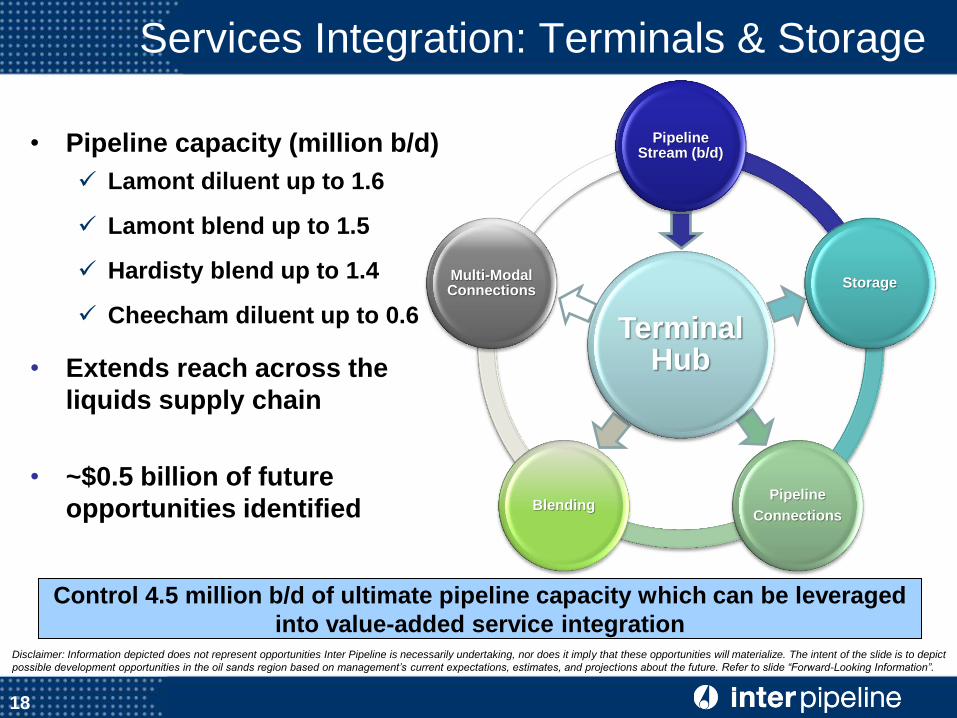
• Pipeline capacity (million b/d)
Lamont diluent up to 1.6
Lamont blend up to 1.5
Hardisty blend up to 1.4
Cheecham diluent up to 0.6
• Extends reach across the
liquids supply chain
• ~$0.5 billion of future
opportunities identified
18
/
Control 4.5 million b/d of ultimate pipeline capacity which can be leveraged
into value-added service integration
Services Integration: Terminals & Storage
Disclaimer: Information depicted does not represent opportunities Inter Pipeline is necessarily undertaking, nor does it imply that these opportunities will materialize. The intent of the slide is to depict
possible development opportunities in the oil sands region based on management’s current expectations, estimates, and project ions about the future. Refer to slide “Forward-Looking Information”.
Terminal Hub
Pipeline Stream (b/d)
Storage
Pipeline
Connections Blending
Multi-Modal Connections
0
300
600
900
1,200
1,500
0
1,000
2,000
3,000
4,000
5,000
2008 2010 2012 2014F 2016F 2018F 2020F 2022F 2024F 2026F 2028F 2030F
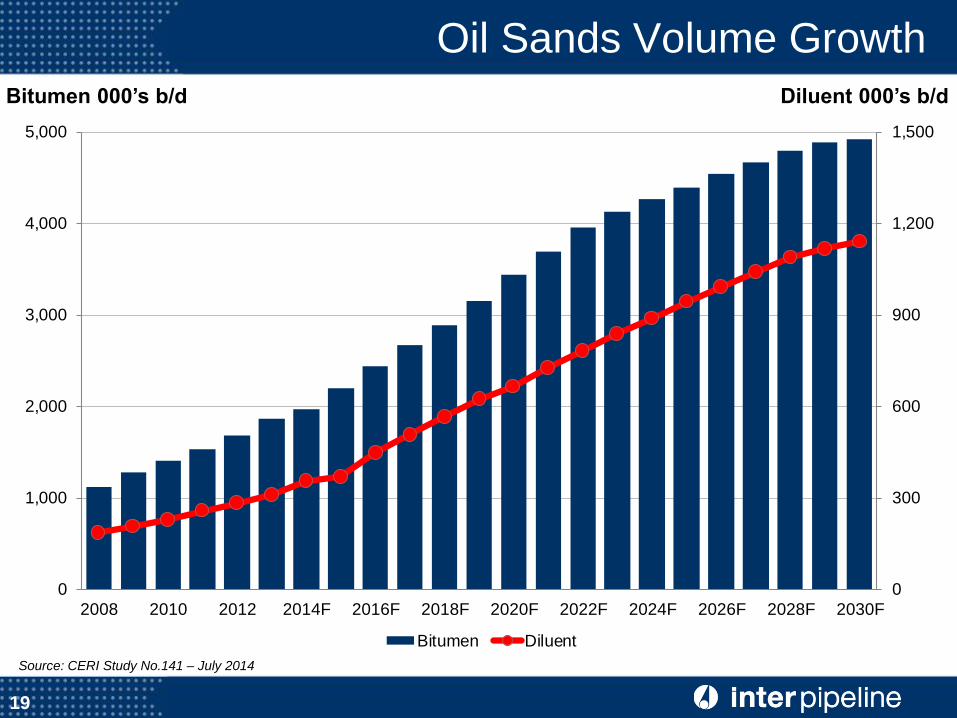
Bitumen Diluent
Oil Sands Volume Growth
Bitumen 000’s b/d
19
Source: CERI Study No.141 – July 2014
Diluent 000’s b/d
0.0
1.0
2.0
3.0
4.0
5.0
6.0
7.0
2010 2015 2020 2025 2030
Pro
du
cti
on
/ C
ap
ac
ity
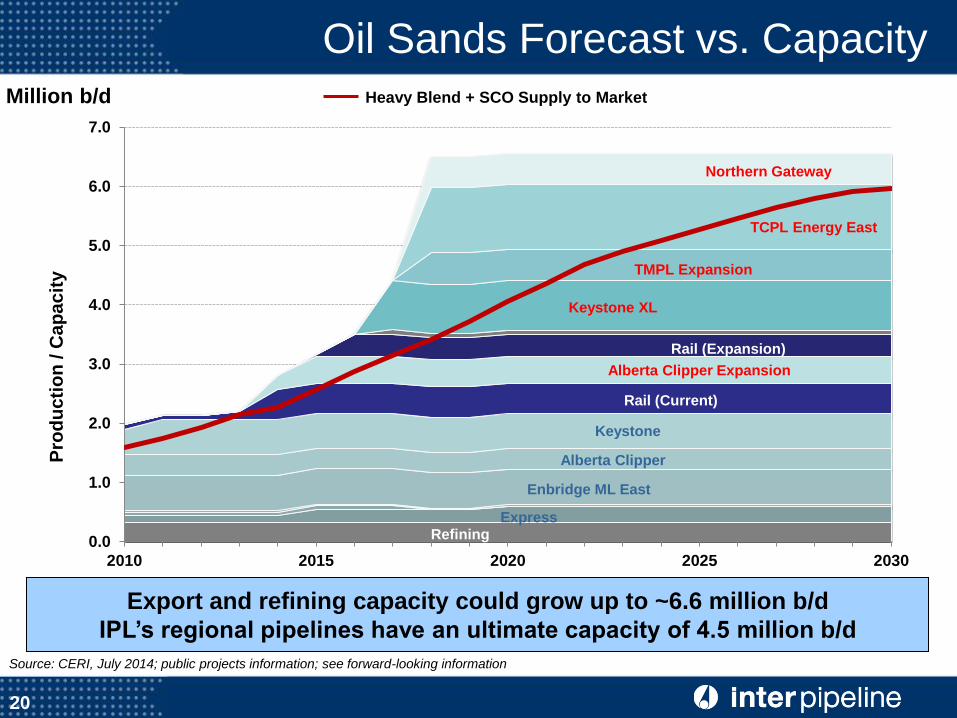
Refining Express
Enbridge ML East
Alberta Clipper
Keystone
Rail (Current)
Alberta Clipper Expansion
Rail (Expansion)
Keystone XL
TMPL Expansion
Northern Gateway
TCPL Energy East
20
Oil Sands Forecast vs. Capacity Heavy Blend + SCO Supply to Market
Source: CERI, July 2014; public projects information; see forward-looking information
Million b/d
Export and refining capacity could grow up to ~6.6 million b/d
IPL’s regional pipelines have an ultimate capacity of 4.5 million b/d
21
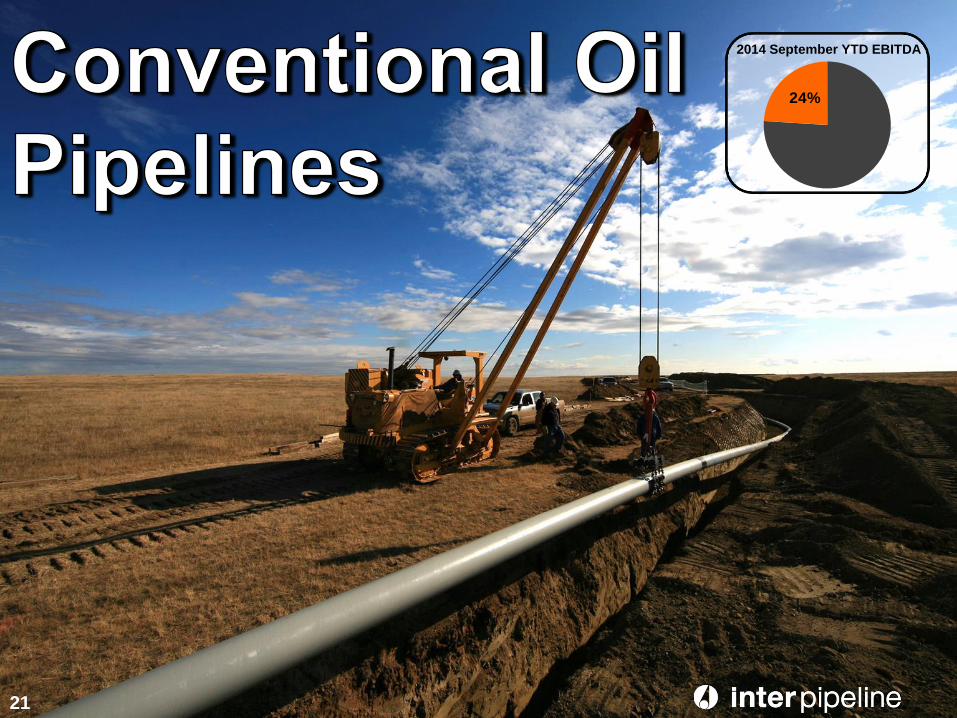
24%
2014 September YTD EBITDA
Calgary
ALBERTA
Edmonton
U.S.A.
Hardisty
Kerrobert
Milk River
SASK.
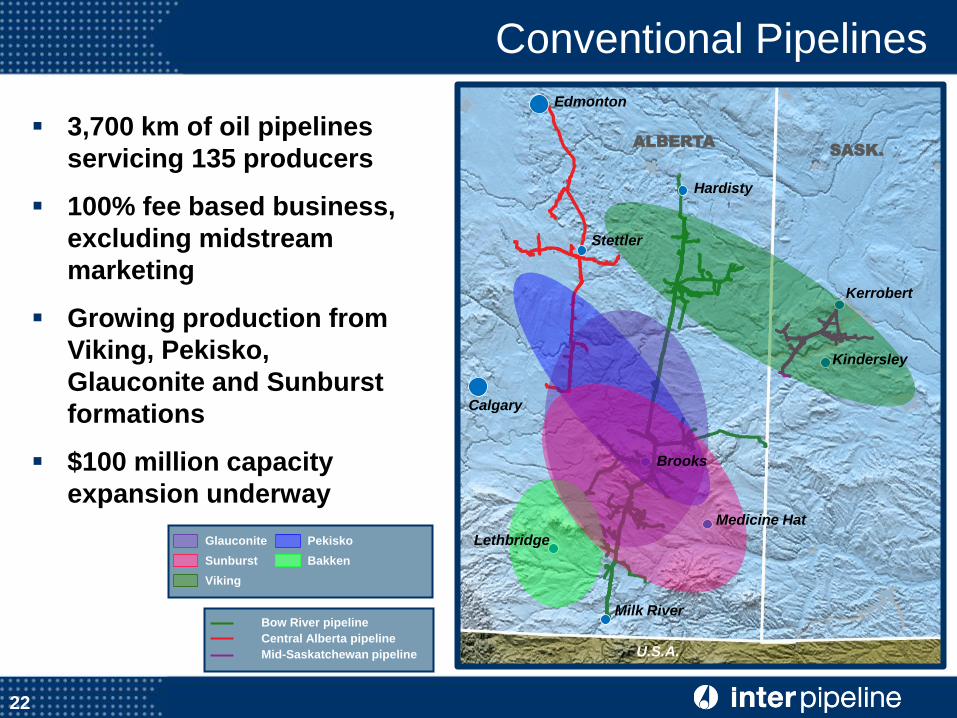
22
Conventional Pipelines
Bow River pipeline
Central Alberta pipeline
Mid-Saskatchewan pipeline
3,700 km of oil pipelines
servicing 135 producers
100% fee based business,
excluding midstream
marketing
Growing production from
Viking, Pekisko,
Glauconite and Sunburst
formations
$100 million capacity
expansion underway
Glauconite Pekisko
Sunburst Bakken
Viking
Brooks
Lethbridge
Medicine Hat
Kindersley
Stettler
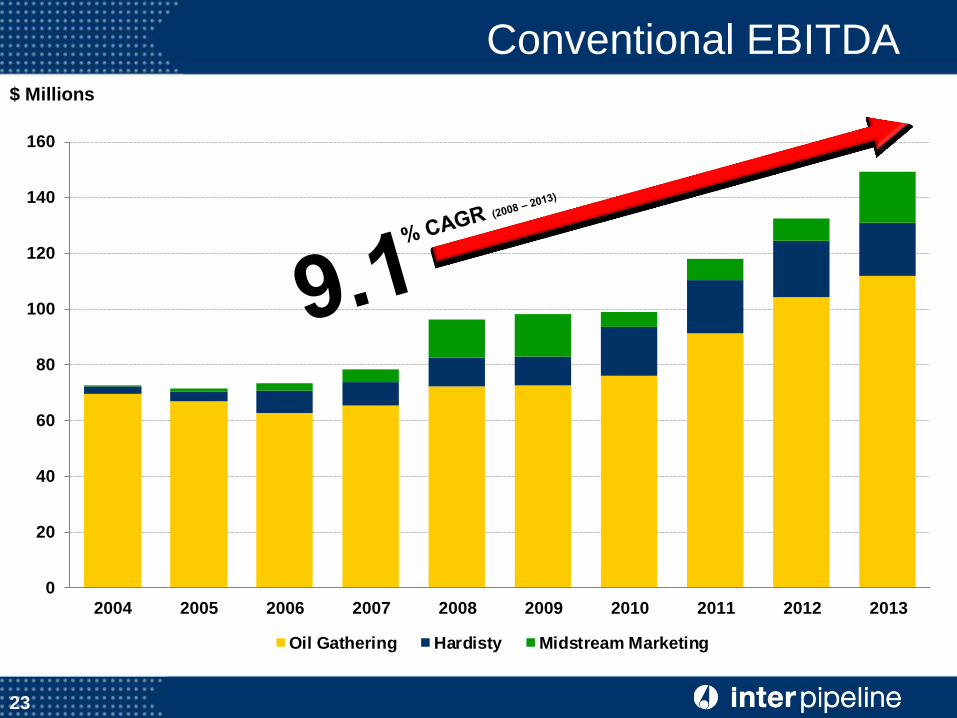
0
20
40
60
80
100
120
140
160
2004 2005 2006 2007 2008 2009 2010 2011 2012 2013
Oil Gathering Hardisty Midstream Marketing
Conventional EBITDA $ Millions
23
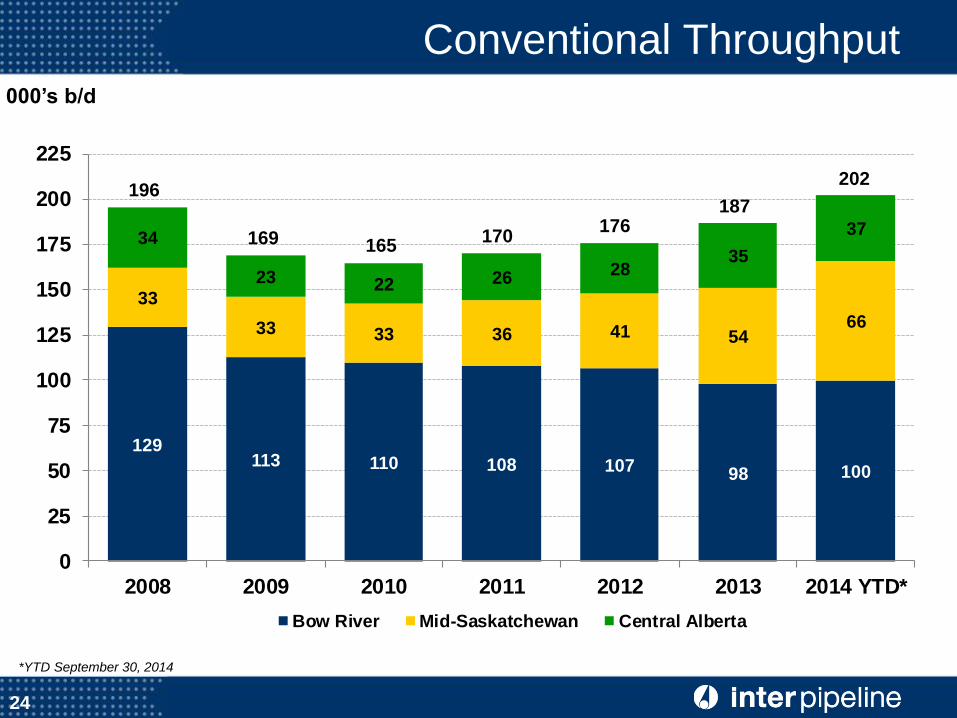
129113 110 108 107 98 100
33
33 33 36 41 5466
34
23 22 2628
35
37
0
25
50
75
100
125
150
175
200
225
2008 2009 2010 2011 2012 2013 2014 YTD*
Bow River Mid-Saskatchewan Central Alberta
Conventional Throughput
24
000’s b/d
*YTD September 30, 2014
202
187 176
170 165 169
196
Calgary
Medicine Hat
Lethbridge
ALBERTA
Edmonton
U.S.A.
Hardisty
Milk River
Stettler
SASK.
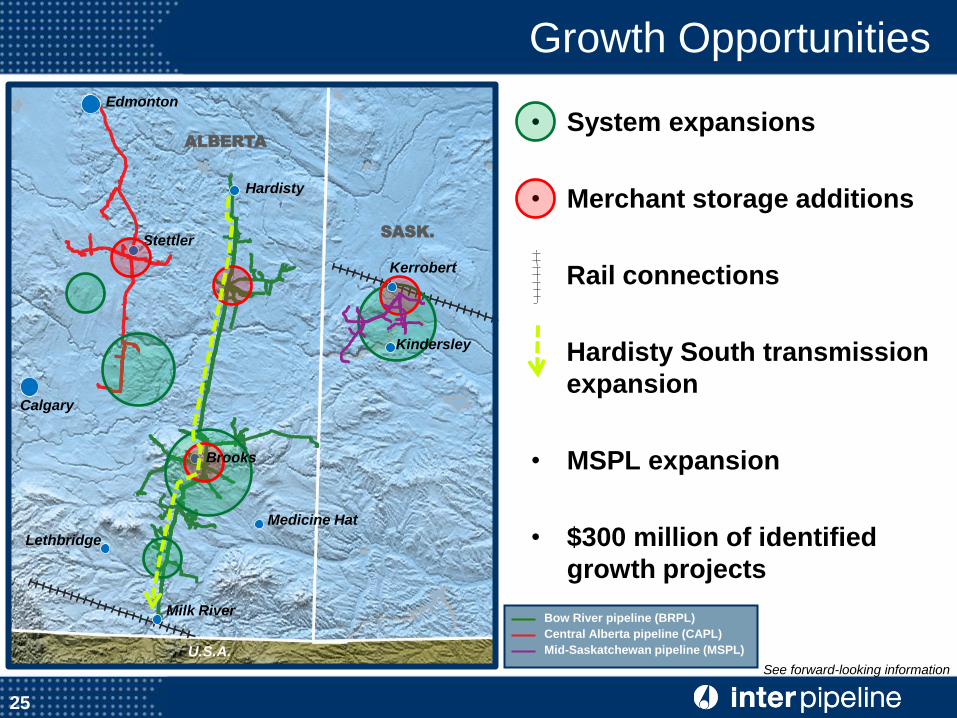
Growth Opportunities
• System expansions
• Merchant storage additions
Rail connections
Hardisty South transmission
expansion
• MSPL expansion
• $300 million of identified
growth projects
Kerrobert
Kindersley
25
Bow River pipeline (BRPL)
Central Alberta pipeline (CAPL)
Mid-Saskatchewan pipeline (MSPL)
See forward-looking information
Brooks
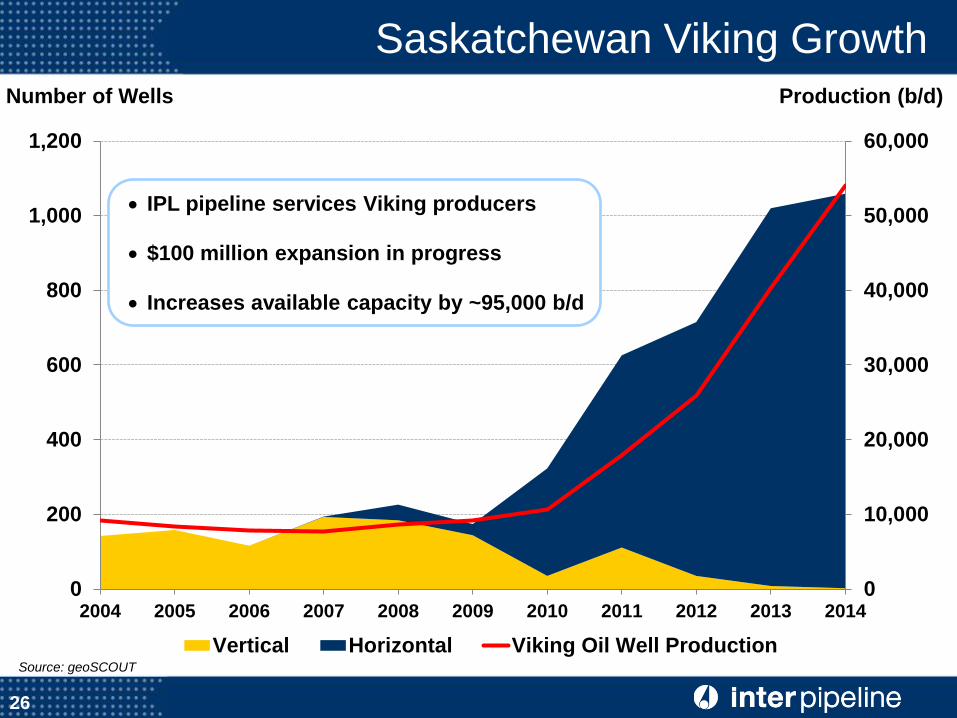
0
10,000
20,000
30,000
40,000
50,000
60,000
0
200
400
600
800
1,000
1,200
2004 2005 2006 2007 2008 2009 2010 2011 2012 2013 2014
Vertical Horizontal Viking Oil Well Production
26
Saskatchewan Viking Growth
Number of Wells Production (b/d)
Source: geoSCOUT
IPL pipeline services Viking producers
$100 million expansion in progress
Increases available capacity by ~95,000 b/d
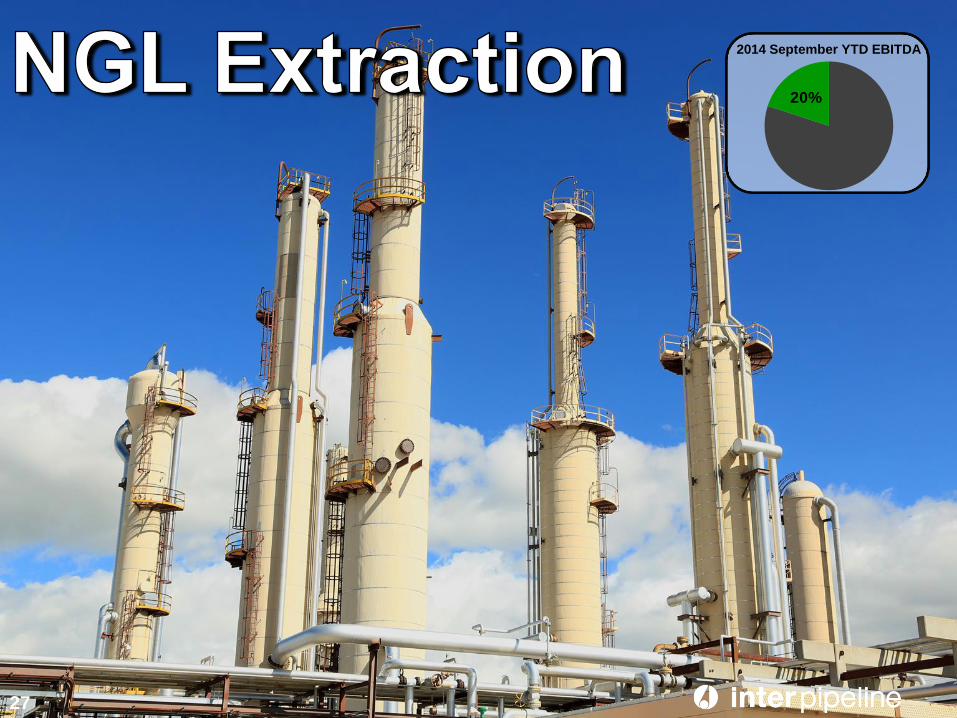
27
2014 September YTD EBITDA
20%
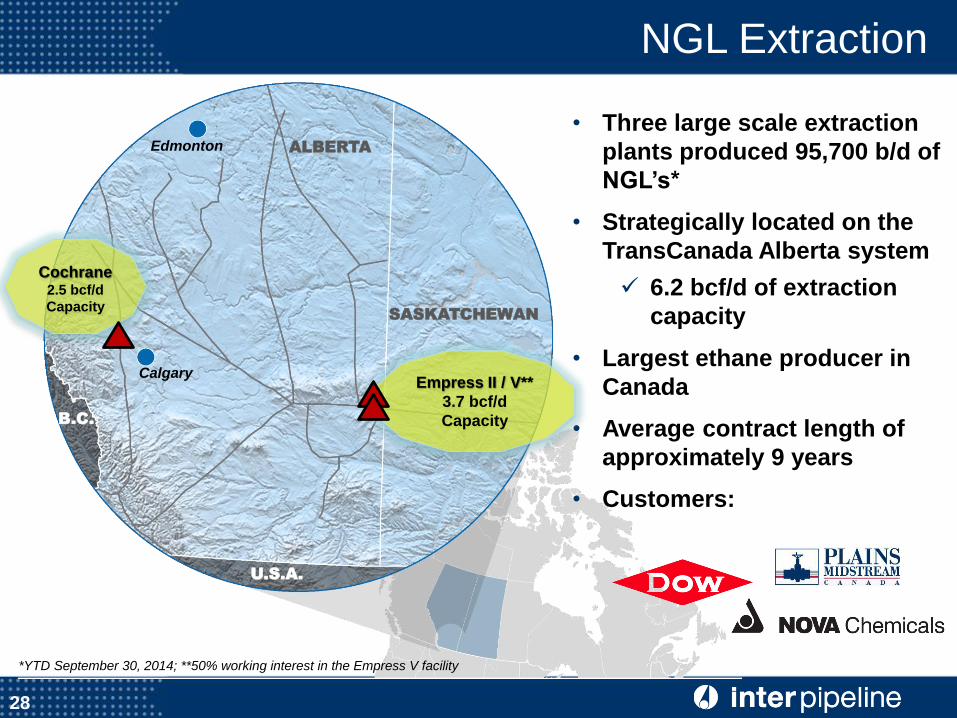
SASKATCHEWAN
Edmonton ALBERTA
U.S.A.
B.C.
Calgary
• Three large scale extraction
plants produced 95,700 b/d of
NGL’s*
• Strategically located on the
TransCanada Alberta system
6.2 bcf/d of extraction
capacity
• Largest ethane producer in
Canada
• Average contract length of
approximately 9 years
• Customers:
28
Cochrane 2.5 bcf/d
Capacity
Empress II / V**
3.7 bcf/d
Capacity
NGL Extraction
*YTD September 30, 2014; **50% working interest in the Empress V facility
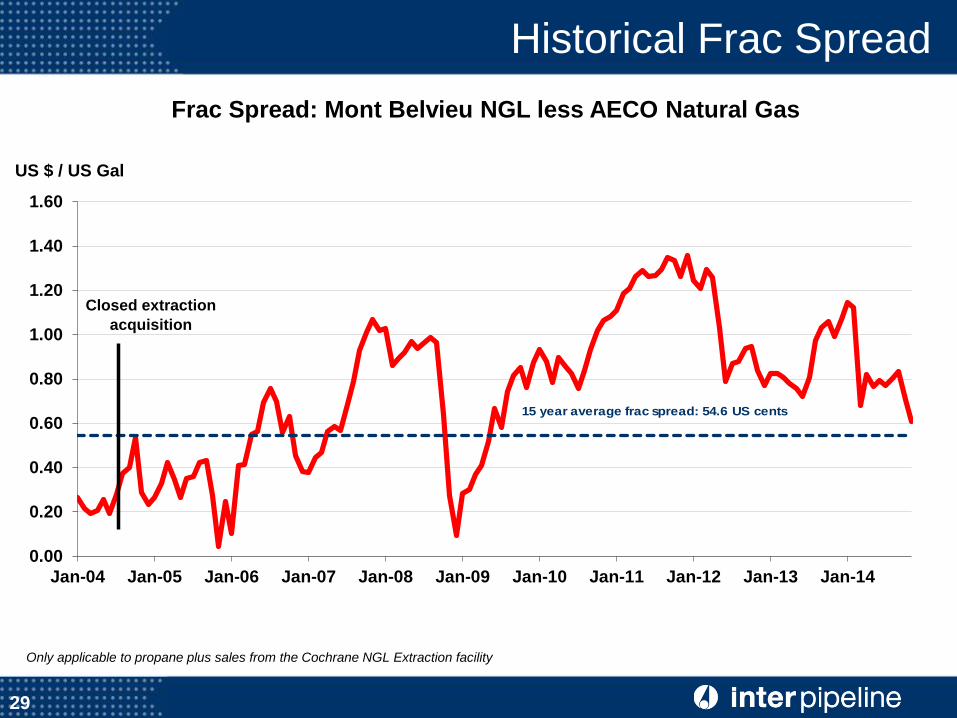
Historical Frac Spread
Frac Spread: Mont Belvieu NGL less AECO Natural Gas
Only applicable to propane plus sales from the Cochrane NGL Extraction facility
29
0.00
0.20
0.40
0.60
0.80
1.00
1.20
1.40
1.60
Jan-04 Jan-05 Jan-06 Jan-07 Jan-08 Jan-09 Jan-10 Jan-11 Jan-12 Jan-13 Jan-14
US $ / US Gal
Closed extraction
acquisition
15 year average frac spread: 54.6 US cents
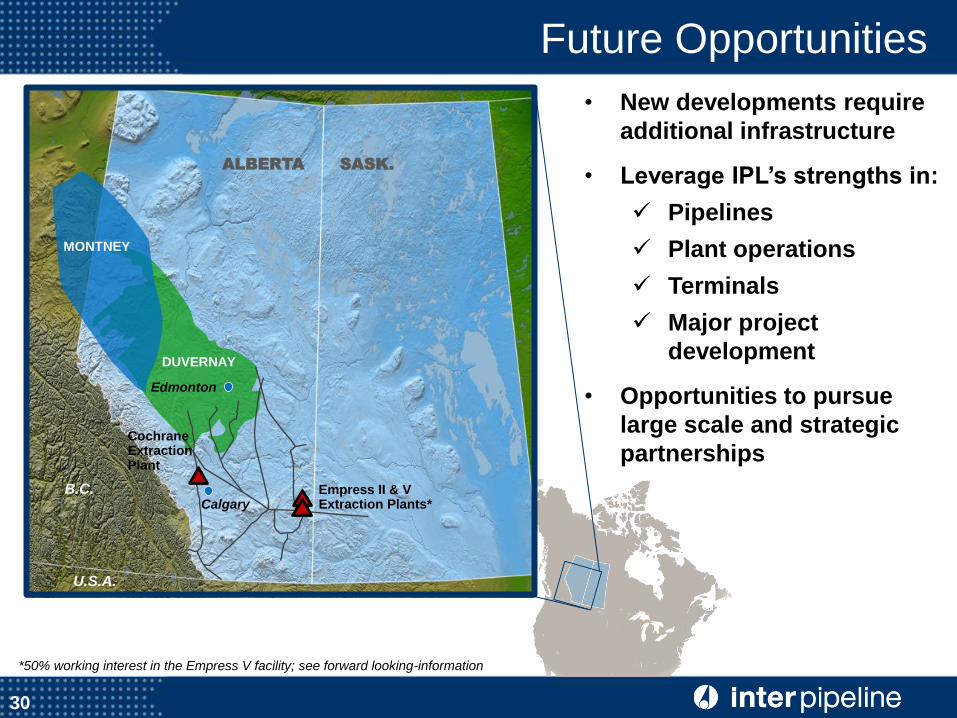
Future Opportunities
30
Calgary
SASK. ALBERTA
Edmonton
U.S.A.
B.C. Empress II & V Extraction Plants*
Cochrane Extraction Plant
DUVERNAY
• New developments require
additional infrastructure
• Leverage IPL’s strengths in:
Pipelines
Plant operations
Terminals
Major project
development
• Opportunities to pursue
large scale and strategic
partnerships
MONTNEY
*50% working interest in the Empress V facility; see forward looking-information
31
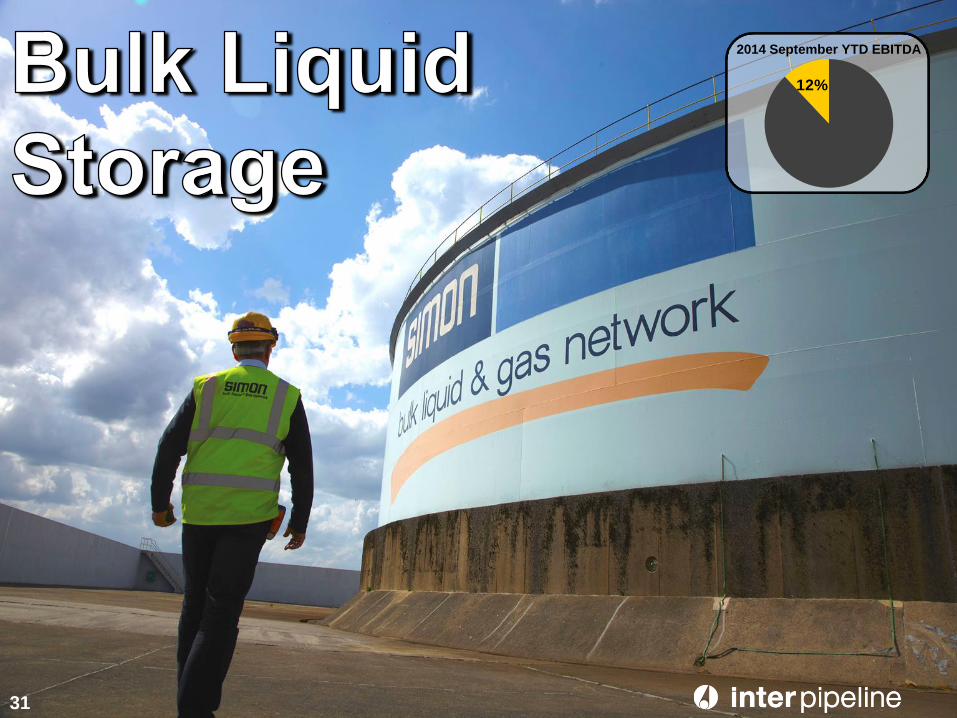
2014 September YTD EBITDA
12%
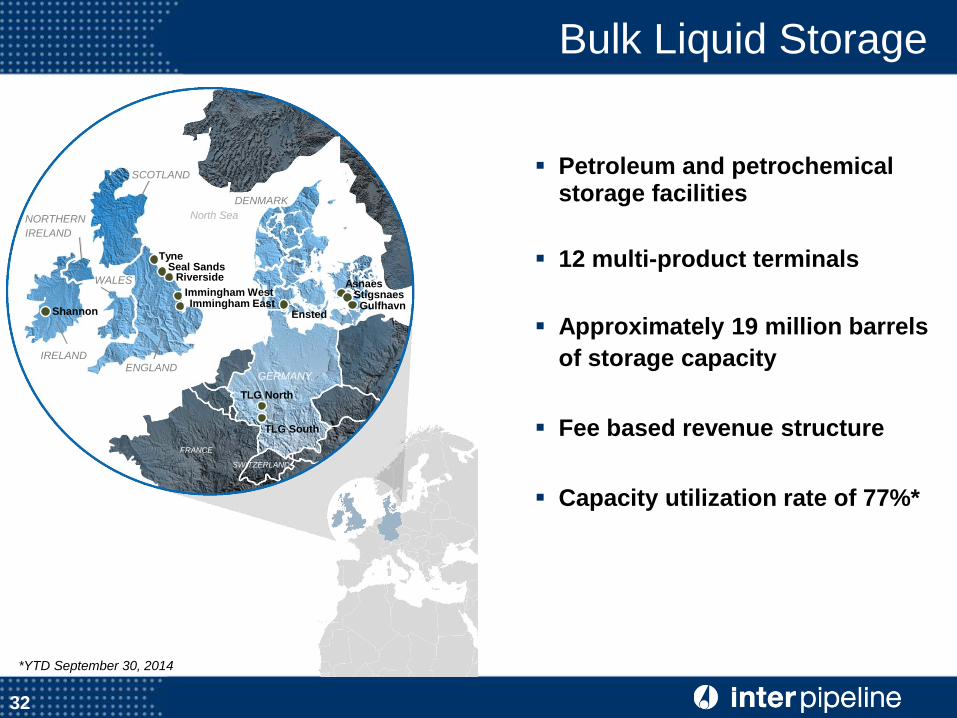
Bulk Liquid Storage
Petroleum and petrochemical storage facilities
12 multi-product terminals
Approximately 19 million barrels
of storage capacity
Fee based revenue structure
Capacity utilization rate of 77%*
32
ENGLAND
NORTHERN
IRELAND
SCOTLAND
IRELAND
WALES
GERMANY
Shannon
Immingham West
Tyne Seal Sands
Riverside
Immingham East
TLG North
TLG South
North Sea
FRANCE
SWITZERLAND
DENMARK
Ensted
Asnaes Stigsnaes Gulfhavn
*YTD September 30, 2014
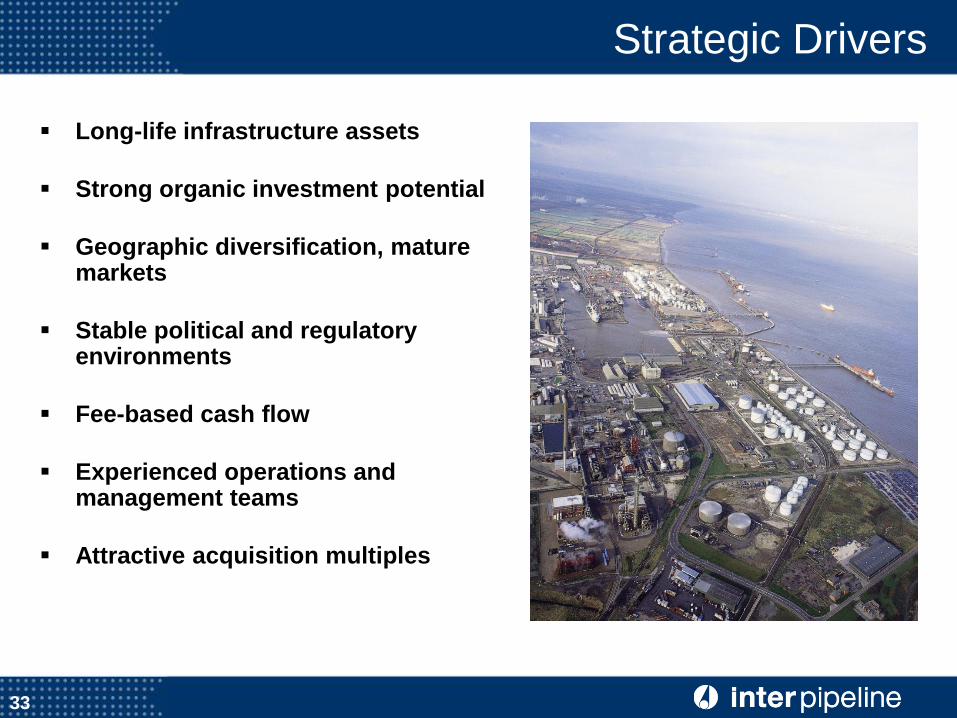
Strategic Drivers
Long-life infrastructure assets
Strong organic investment potential
Geographic diversification, mature markets
Stable political and regulatory environments
Fee-based cash flow
Experienced operations and management teams
Attractive acquisition multiples
33
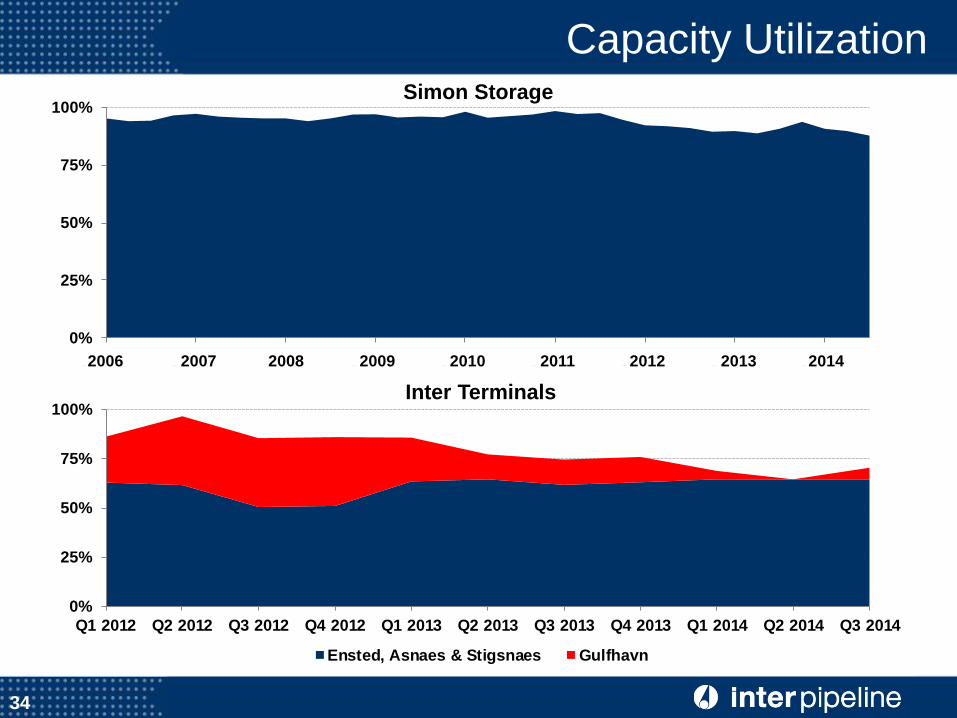
0%
25%
50%
75%
100%
Q1 2012 Q2 2012 Q3 2012 Q4 2012 Q1 2013 Q2 2013 Q3 2013 Q4 2013 Q1 2014 Q2 2014 Q3 2014
Ensted, Asnaes & Stigsnaes Gulfhavn
0%
25%
50%
75%
100%
Q1 2006 Q1 2007 Q1 2008 Q1 2009 Q1 2010 Q1 2011 Q1 2012 Q1 2013 Q1 2014
Capacity Utilization Simon Storage
Inter Terminals
2006 2007 2008 2009 2010 2011 2012 2013 2014
34
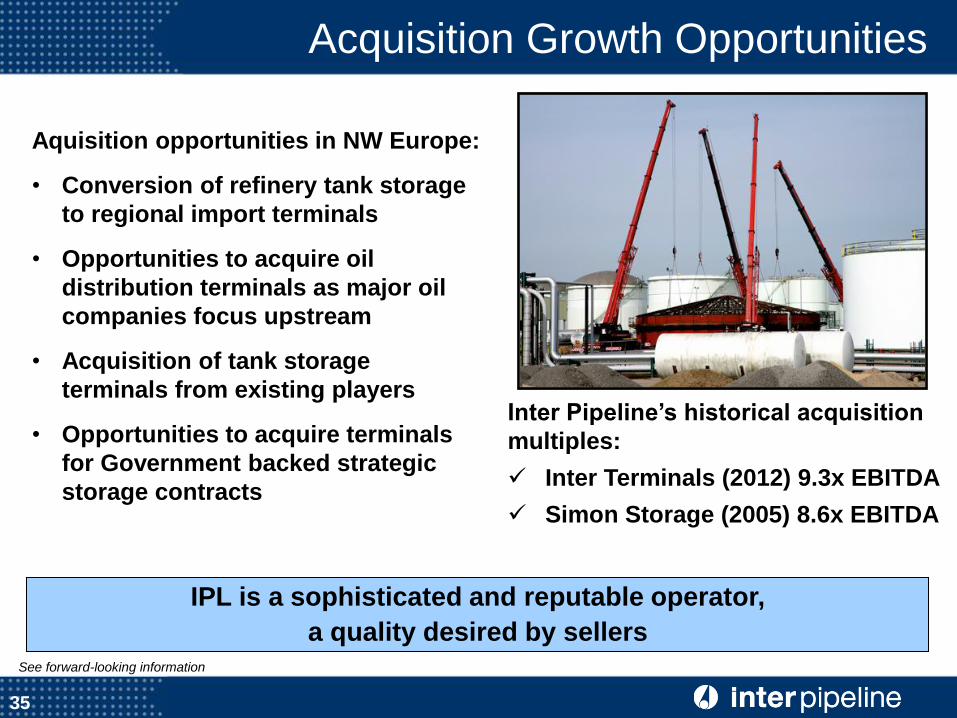
Aquisition opportunities in NW Europe:
• Conversion of refinery tank storage
to regional import terminals
• Opportunities to acquire oil
distribution terminals as major oil
companies focus upstream
• Acquisition of tank storage
terminals from existing players
• Opportunities to acquire terminals
for Government backed strategic
storage contracts
35
Acquisition Growth Opportunities
IPL is a sophisticated and reputable operator,
a quality desired by sellers
Inter Pipeline’s historical acquisition
multiples:
Inter Terminals (2012) 9.3x EBITDA
Simon Storage (2005) 8.6x EBITDA
See forward-looking information
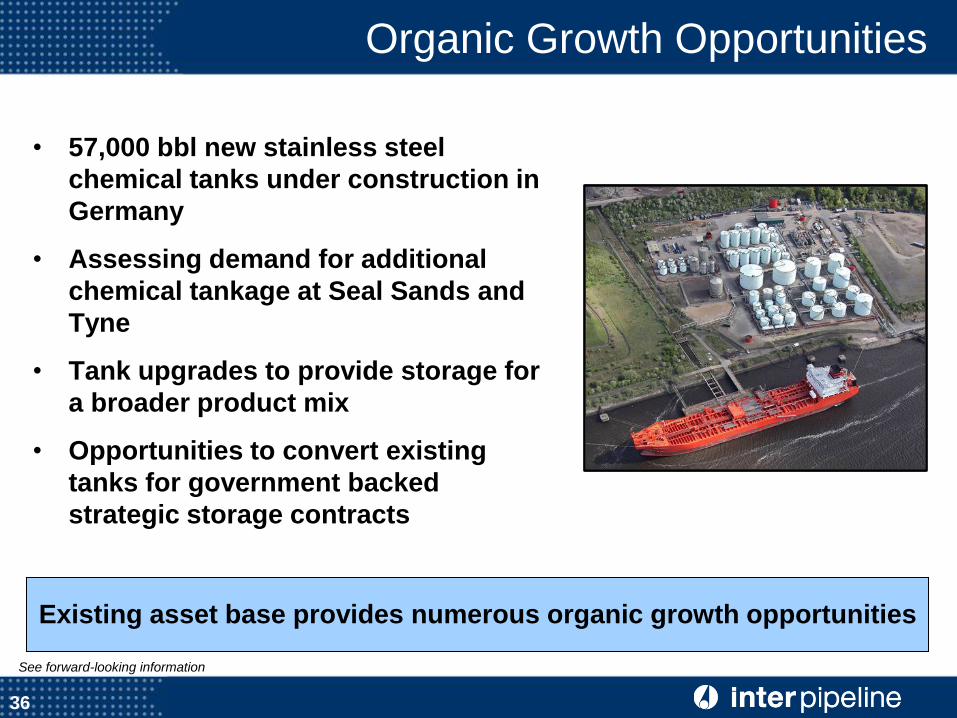
• 57,000 bbl new stainless steel
chemical tanks under construction in
Germany
• Assessing demand for additional
chemical tankage at Seal Sands and
Tyne
• Tank upgrades to provide storage for
a broader product mix
• Opportunities to convert existing
tanks for government backed
strategic storage contracts
36
Existing asset base provides numerous organic growth opportunities
Organic Growth Opportunities
See forward-looking information
37
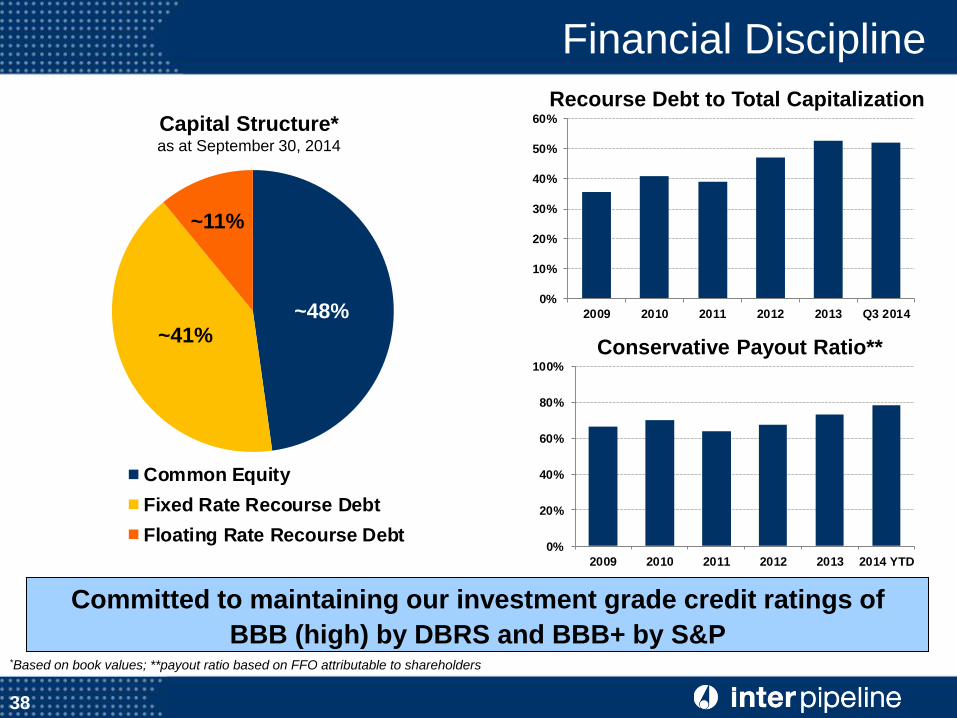
Common Equity
Fixed Rate Recourse Debt
Floating Rate Recourse Debt0%
20%
40%
60%
80%
100%
2009 2010 2011 2012 2013 2014 YTD
0%
10%
20%
30%
40%
50%
60%
2009 2010 2011 2012 2013 Q3 2014
*Based on book values; **payout ratio based on FFO attributable to shareholders
Capital Structure* as at September 30, 2014
~48% ~41%
Committed to maintaining our investment grade credit ratings of
BBB (high) by DBRS and BBB+ by S&P
Conservative Payout Ratio**
Recourse Debt to Total Capitalization
~11%
Financial Discipline
38
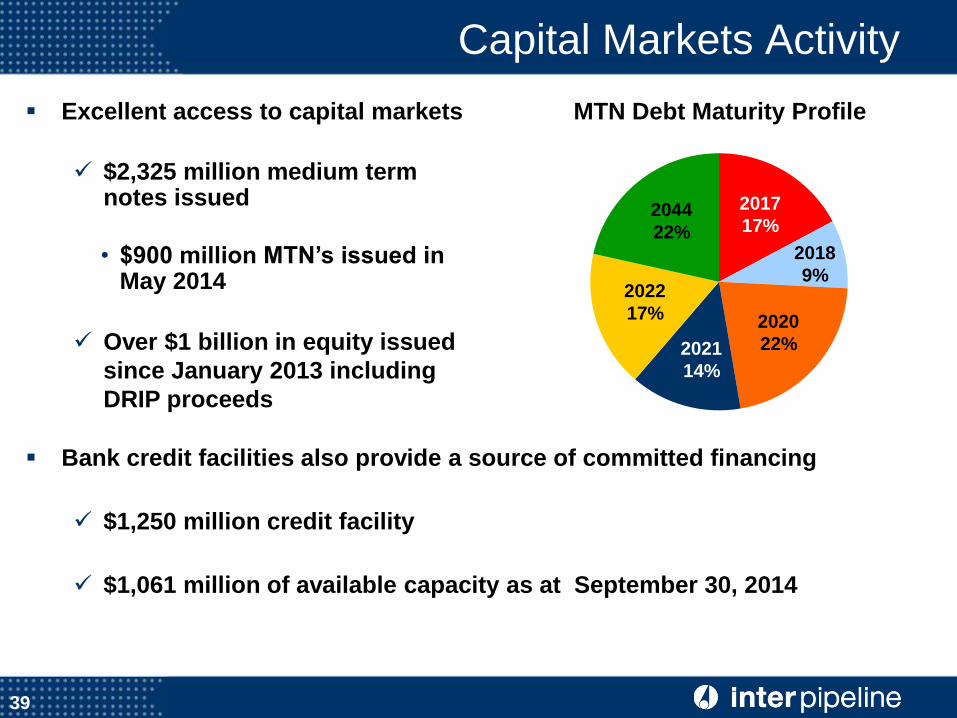
Capital Markets Activity
Excellent access to capital markets
$2,325 million medium term notes issued
• $900 million MTN’s issued in May 2014
Over $1 billion in equity issued
since January 2013 including
DRIP proceeds
39
Bank credit facilities also provide a source of committed financing
$1,250 million credit facility
$1,061 million of available capacity as at September 30, 2014
MTN Debt Maturity Profile
2044
22% 2018
9%
2017
17%
2021
14%
2020
22%
2022
17%
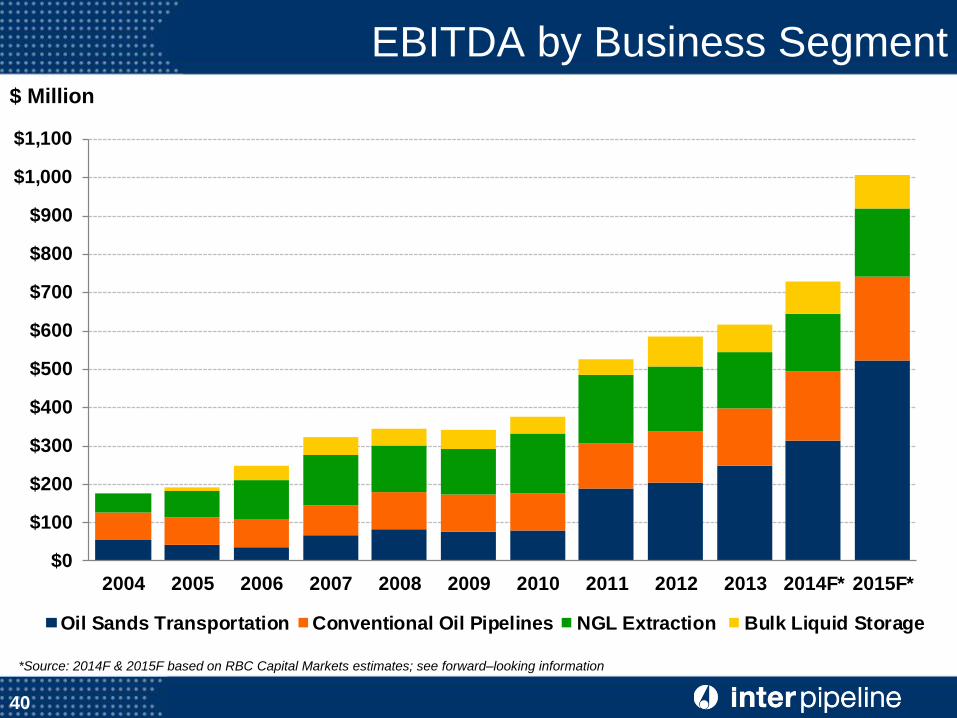
EBITDA by Business Segment $ Million
40
*Source: 2014F & 2015F based on RBC Capital Markets estimates; see forward–looking information
$0
$100
$200
$300
$400
$500
$600
$700
$800
$900
$1,000
$1,100
2004 2005 2006 2007 2008 2009 2010 2011 2012 2013 2014F* 2015F*
Oil Sands Transportation Conventional Oil Pipelines NGL Extraction Bulk Liquid Storage
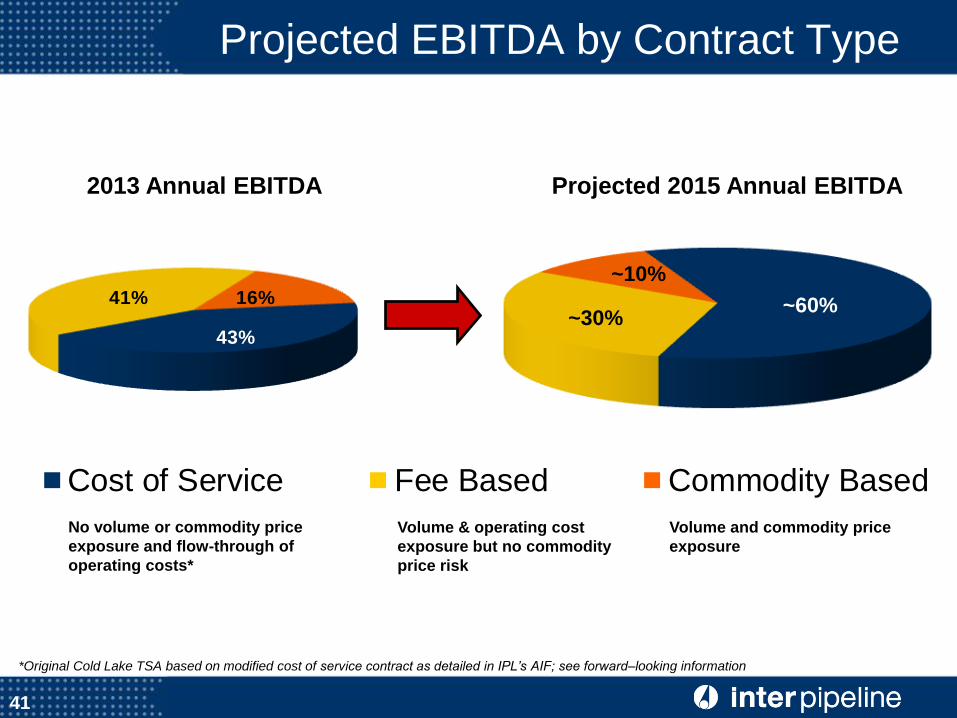
Projected EBITDA by Contract Type
Projected 2015 Annual EBITDA
37%
~10%
~60% 41%
~30%
41
43%
41% 16%
Cost of Service Fee Based Commodity Based
*Original Cold Lake TSA based on modified cost of service contract as detailed in IPL’s AIF; see forward–looking information
Cost of Service Fee Based Commodity Based
Volume and commodity price
exposure
Volume & operating cost
exposure but no commodity
price risk
No volume or commodity price
exposure and flow-through of
operating costs*
2013 Annual EBITDA
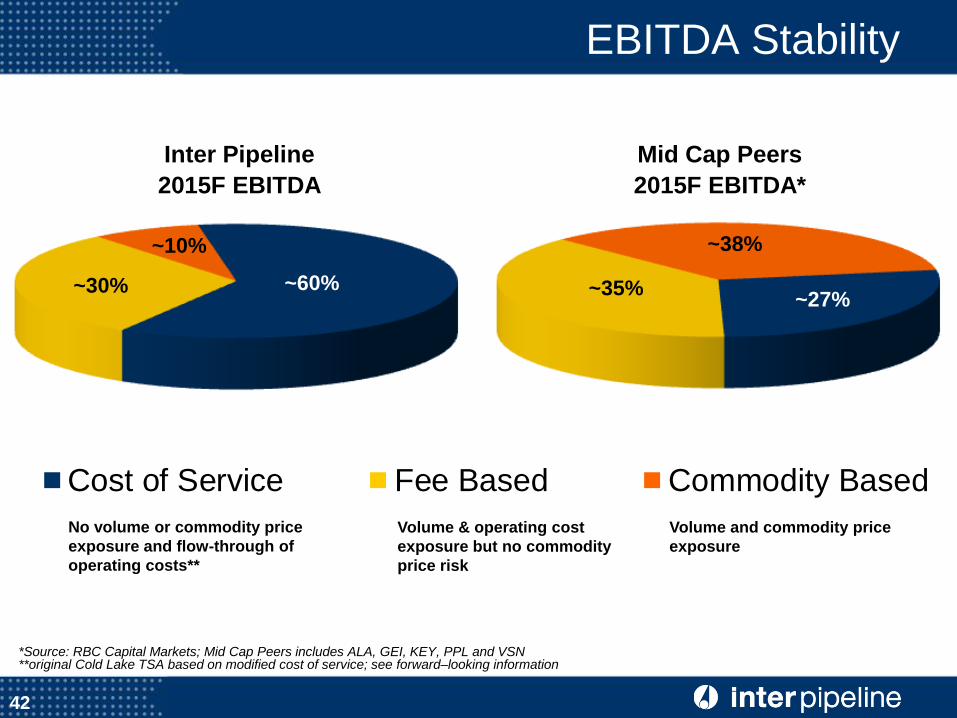
Inter Pipeline
2015F EBITDA
Mid Cap Peers
2015F EBITDA*
~27%
~10%
~60% ~30%
42
EBITDA Stability
~38%
~35%
Cost of Service Fee Based Commodity Based
*Source: RBC Capital Markets; Mid Cap Peers includes ALA, GEI, KEY, PPL and VSN **original Cold Lake TSA based on modified cost of service; see forward–looking information
No volume or commodity price
exposure and flow-through of
operating costs**
Volume & operating cost
exposure but no commodity
price risk
Volume and commodity price
exposure
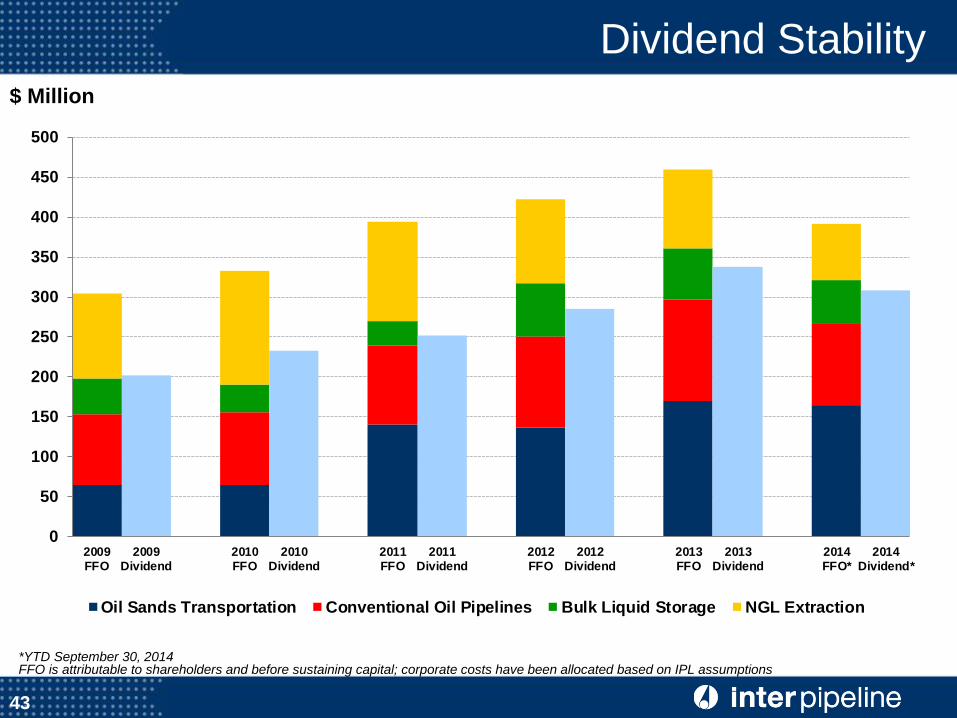
$ Million
Dividend Stability
43
*YTD September 30, 2014 FFO is attributable to shareholders and before sustaining capital; corporate costs have been allocated based on IPL assumptions
0
50
100
150
200
250
300
350
400
450
500
2009FFO
2009Dividend
2010FFO
2010Dividend
2011FFO
2011Dividend
2012FFO
2012Dividend
2013FFO
2013Dividend
2014FFO*
2014Dividend*
Oil Sands Transportation Conventional Oil Pipelines Bulk Liquid Storage NGL Extraction
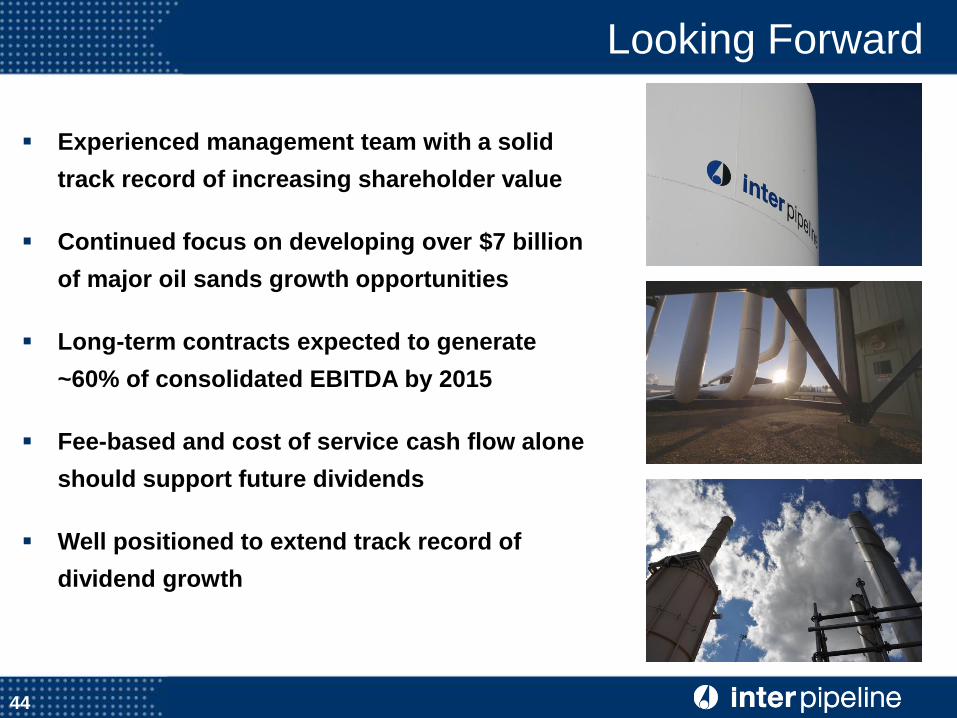
Looking Forward
Experienced management team with a solid
track record of increasing shareholder value
Continued focus on developing over $7 billion
of major oil sands growth opportunities
Long-term contracts expected to generate
~60% of consolidated EBITDA by 2015
Fee-based and cost of service cash flow alone
should support future dividends
Well positioned to extend track record of
dividend growth
44
Contact Information
45
Christian Bayle
President & CEO
Brent Heagy
Chief Financial Officer
Jeremy Roberge
Vice President, Capital Markets
Inter Pipeline Ltd.
Suite 2600, 237 – 4th Avenue SW
Calgary, Alberta T2P 4K3
Phone: 1 866 716 7473
Phone: (403) 290 6000
Fax: (403) 290 6090
Web: www.interpipeline.com