Embed Size (px)
Citation preview

The New Leader in Global Copper December 2013
TSX: FM; LSE: FQM
2
Cautionary Note Regarding Forward-Looking Statement
Some of the statements contained in the following material are forward looking statements and not statement of facts. Such statements are based on the current beliefs of management, as well as assumptions based on management information currently available. Forward-looking statements are subject to various risks, uncertainties and other factors that could cause actual results to differ materially from expected results. Readers must rely on their own evaluation of these uncertainties. Note: all dollar amounts in US dollars unless otherwise indicated

3
First Quantum Minerals - The New Leader in Global Copper
• Geographically diversified asset base
• 7 high-quality, stable operations; current total copper and nickel production capacities of 445 ktpa and 45 ktpa, respectively
• Low-cost producer: $1.37 - $1.45/lb copper; $5.20 - $5.60/lb nickel
• 6 major projects with completion targeted from mid-2014 to 2017
• Total production capacities for copper and nickel to rise to 1.3 Mtpa and 110 ktpa, respectively by 2018
• Proven track record of building projects efficiently and delivering superior shareholder returns
Africa 36%
Europe 9%
Americas 45%
Australia 10%
Africa 71%
Europe 10%
Australia 19%
Pre-Acquisition First Quantum
1.3 Mtpa1 1 Mtpa1
Post-Acquisition First Quantum
1 2018E Copper production
4
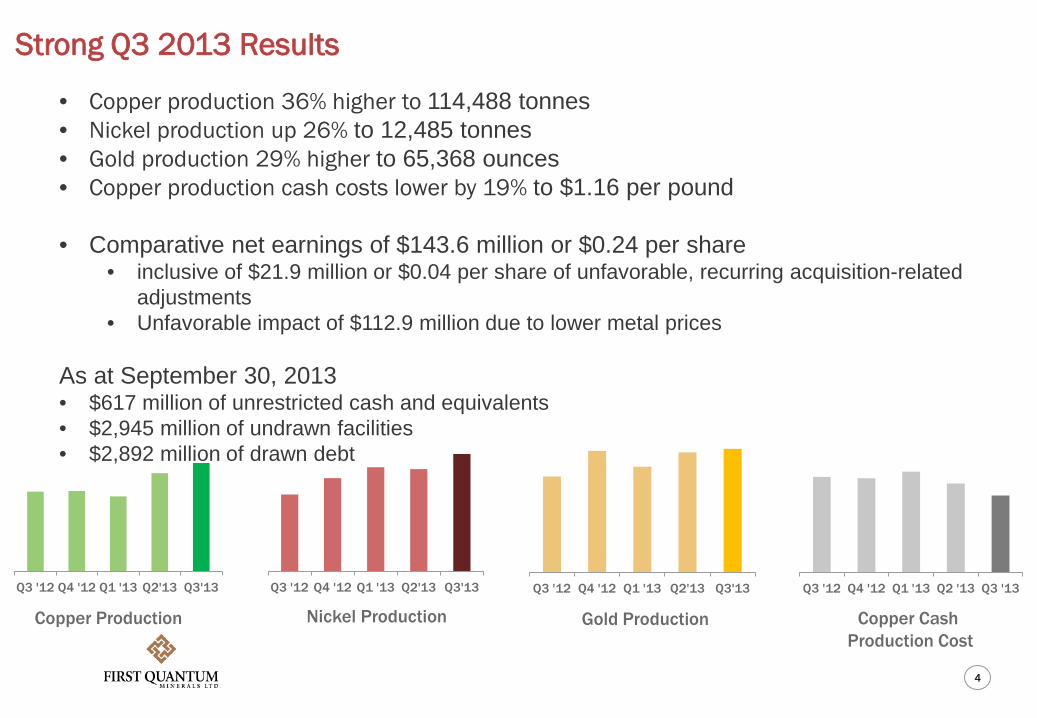
Strong Q3 2013 Results
• Copper production 36% higher to 114,488 tonnes • Nickel production up 26% to 12,485 tonnes • Gold production 29% higher to 65,368 ounces • Copper production cash costs lower by 19% to $1.16 per pound
• Comparative net earnings of $143.6 million or $0.24 per share
• inclusive of $21.9 million or $0.04 per share of unfavorable, recurring acquisition-related adjustments
• Unfavorable impact of $112.9 million due to lower metal prices
As at September 30, 2013 • $617 million of unrestricted cash and equivalents • $2,945 million of undrawn facilities • $2,892 million of drawn debt
Copper Production Nickel Production Gold Production Copper Cash
Production Cost
Q3 '12 Q4 '12 Q1 '13 Q2'13 Q3'13 Q3 '12 Q4 '12 Q1 '13 Q2'13 Q3'13 Q3 '12 Q4 '12 Q1 '13 Q2'13 Q3'13 Q3 '12 Q4 '12 Q1 '13 Q2 '13 Q3 '13
5
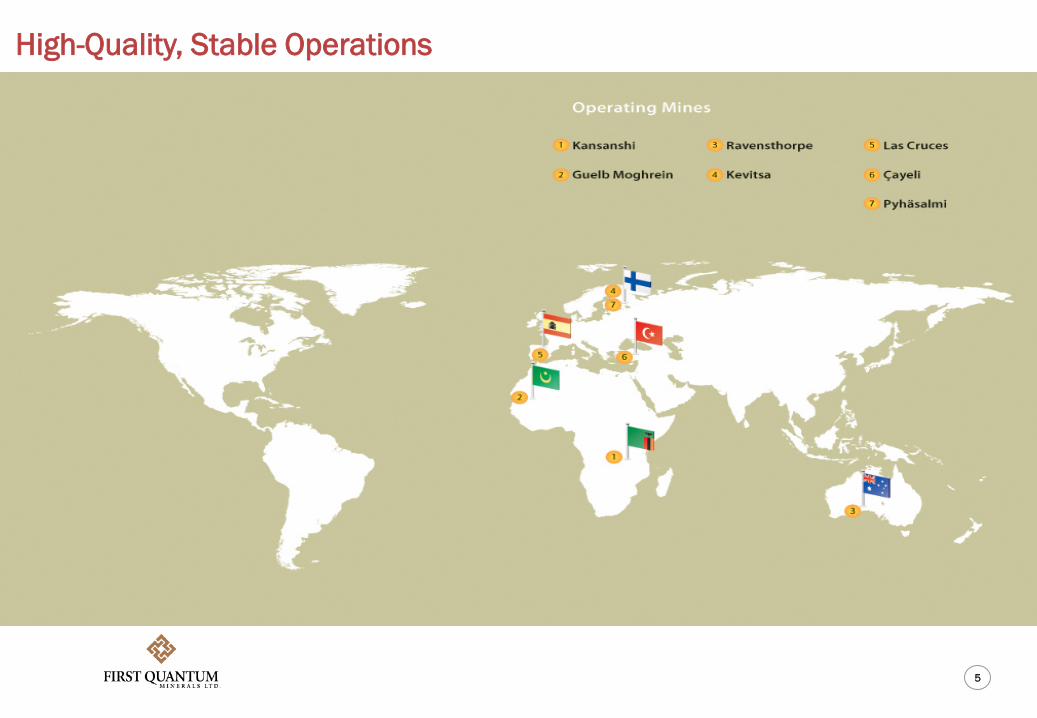
High-Quality, Stable Operations
6
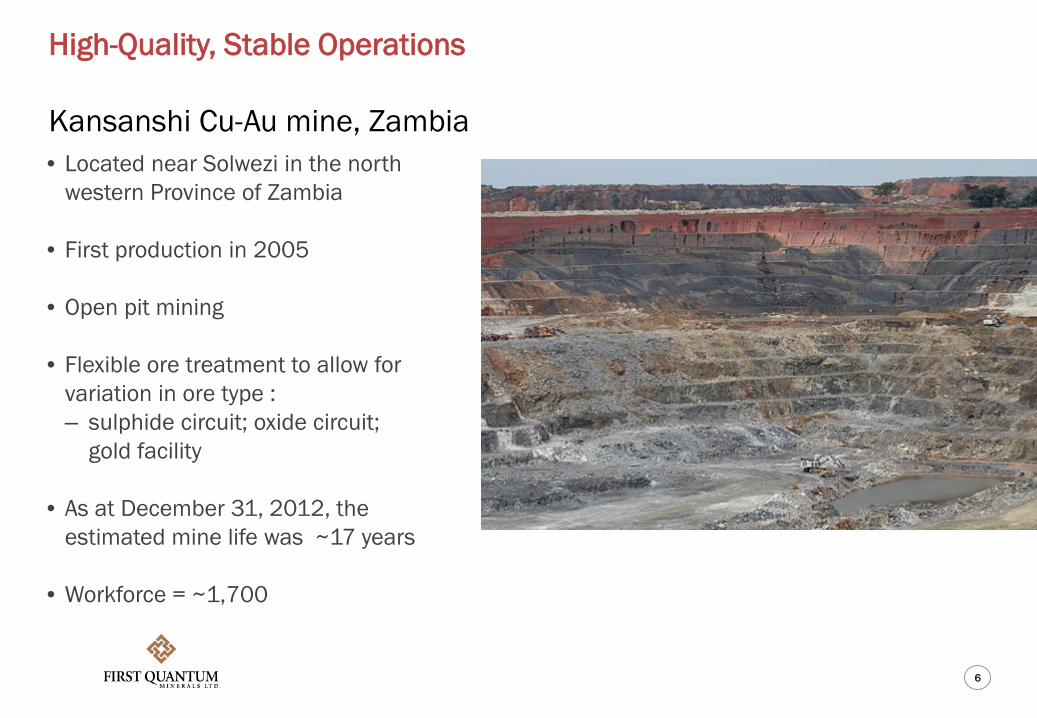
High-Quality, Stable Operations Kansanshi Cu-Au mine, Zambia • Located near Solwezi in the north
western Province of Zambia
• First production in 2005
• Open pit mining
• Flexible ore treatment to allow for variation in ore type : – sulphide circuit; oxide circuit;
gold facility
• As at December 31, 2012, the estimated mine life was ~17 years
• Workforce = ~1,700
7
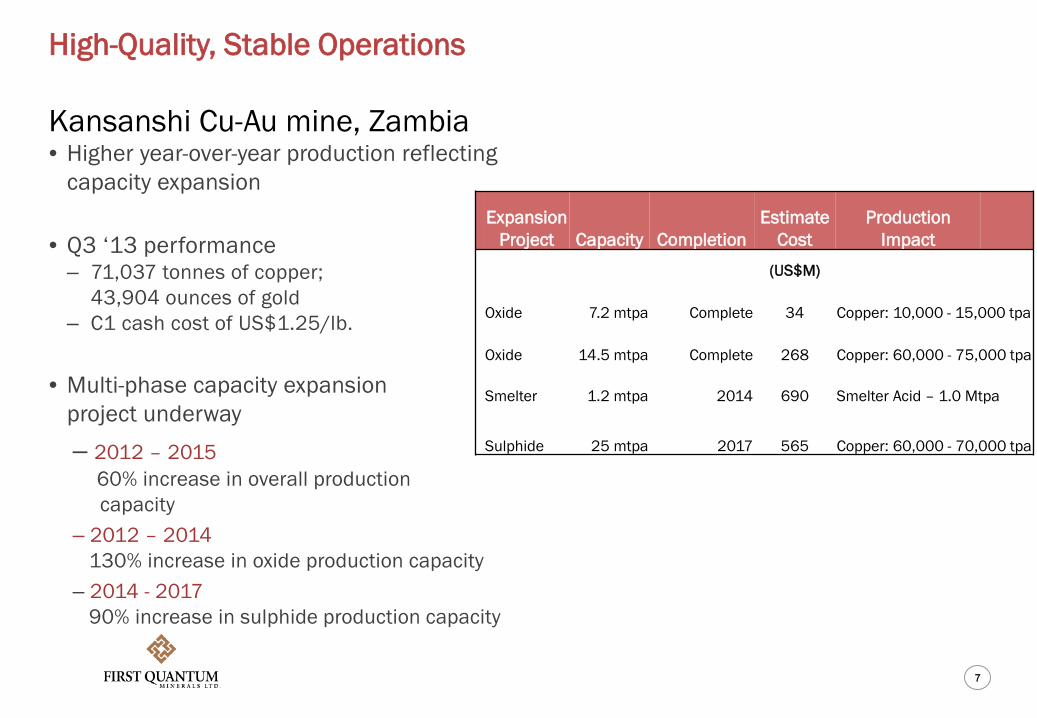
High-Quality, Stable Operations Kansanshi Cu-Au mine, Zambia • Higher year-over-year production reflecting
capacity expansion
• Q3 ‘13 performance – 71,037 tonnes of copper;
43,904 ounces of gold – C1 cash cost of US$1.25/lb.
• Multi-phase capacity expansion
project underway – 2012 – 2015 60% increase in overall production capacity – 2012 – 2014 130% increase in oxide production capacity – 2014 - 2017 90% increase in sulphide production capacity
Expansion
Project Capacity Completion Estimate
Cost Production
Impact (US$M)
Oxide 7.2 mtpa Complete 34 Copper: 10,000 - 15,000 tpa
Oxide 14.5 mtpa Complete 268 Copper: 60,000 - 75,000 tpa
Smelter 1.2 mtpa 2014 690 Smelter Acid – 1.0 Mtpa
Sulphide 25 mtpa 2017 565 Copper: 60,000 - 70,000 tpa

8
High-Quality, Stable Operations Guelb Moghrein Cu-Au mine, Mauritania • 100% ownership
• Located 250 kilometres northeast of
the nation’s capital, Nouakchott
• As at December 31, 2012, the estimated mine life was ~ 9 years (including stockpiles) based on current operations
• First production in 2006
• Workforce = ~1,470

9
High-Quality, Stable Operations Guelb Moghrein Cu-Au mine, Mauritania • Stronger, more sustained performance
over the past 12 months
• Focused on improving plant availability
• IOCG type deposit - structure and mineralogy has common features with other IOCG deposits elsewhere in the world
• Magnetite plant project: – In detailed design stage – Estimated capex of $50M – Expected annual production of 1M - 2M tonnes
of 69% Fe magnetite concentrate – Expected start up in mid 2014 – Expected to extend mine life through retreatment of
tailings dam

10
High-Quality, Stable Operations Ravensthorpe Ni mine, Australia • Acquired as a decommissioned plant
in 2010
• First production within 20 months of purchase
• Estimated mine life of 32 years
• Commercial production declared Dec 28 2011
• Workforce = ~405
• Q3 ‘13 performance – 9.917 tonnes of contained nickel – C1 cash cost of US$4.85/payable lb.
11
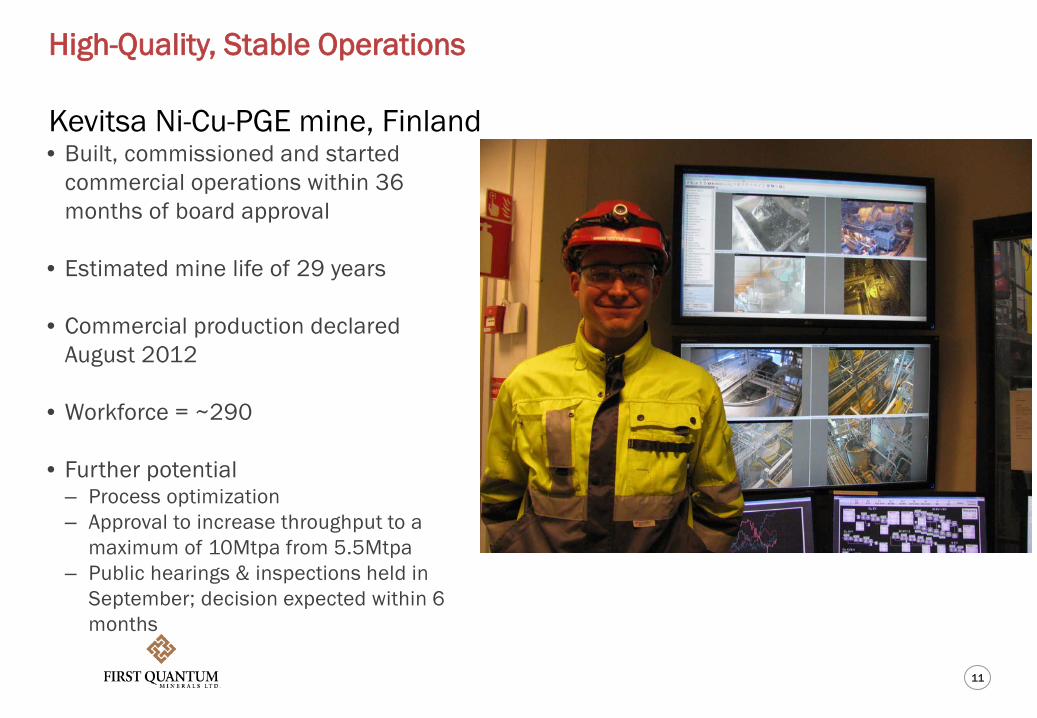
High-Quality, Stable Operations Kevitsa Ni-Cu-PGE mine, Finland • Built, commissioned and started
commercial operations within 36 months of board approval
• Estimated mine life of 29 years
• Commercial production declared August 2012
• Workforce = ~290
• Further potential – Process optimization – Approval to increase throughput to a
maximum of 10Mtpa from 5.5Mtpa – Public hearings & inspections held in
September; decision expected within 6 months
12
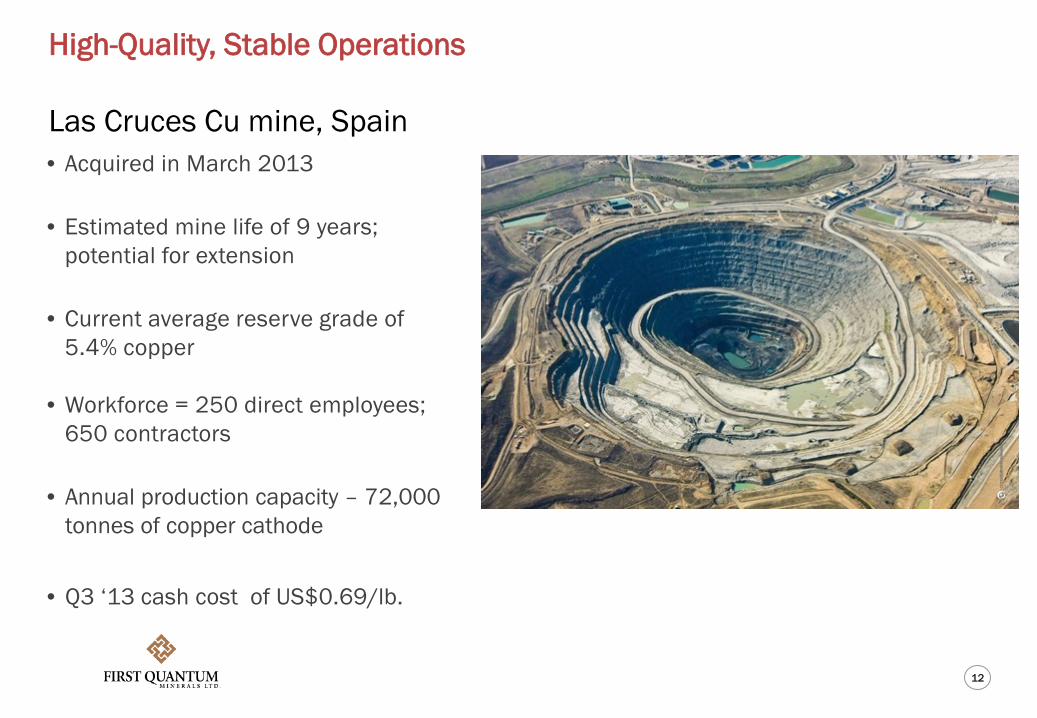
High-Quality, Stable Operations Las Cruces Cu mine, Spain • Acquired in March 2013
• Estimated mine life of 9 years;
potential for extension • Current average reserve grade of
5.4% copper
• Workforce = 250 direct employees; 650 contractors
• Annual production capacity – 72,000 tonnes of copper cathode
• Q3 ‘13 cash cost of US$0.69/lb.
13
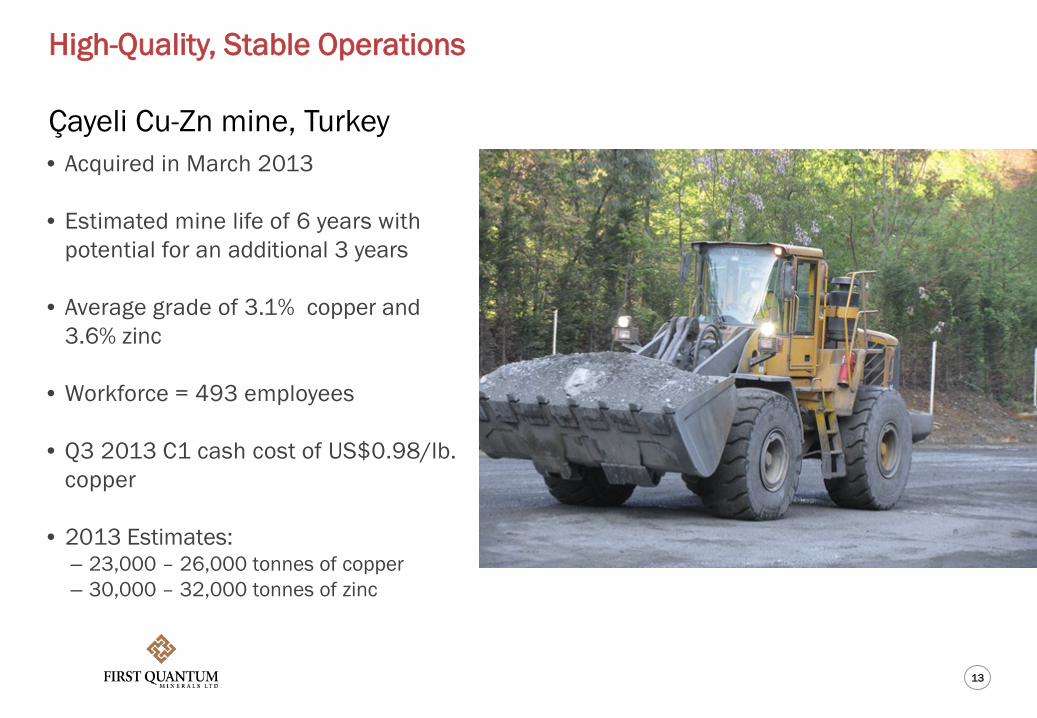
High-Quality, Stable Operations Çayeli Cu-Zn mine, Turkey • Acquired in March 2013
• Estimated mine life of 6 years with
potential for an additional 3 years • Average grade of 3.1% copper and
3.6% zinc
• Workforce = 493 employees
• Q3 2013 C1 cash cost of US$0.98/lb. copper
• 2013 Estimates: – 23,000 – 26,000 tonnes of copper – 30,000 – 32,000 tonnes of zinc
14
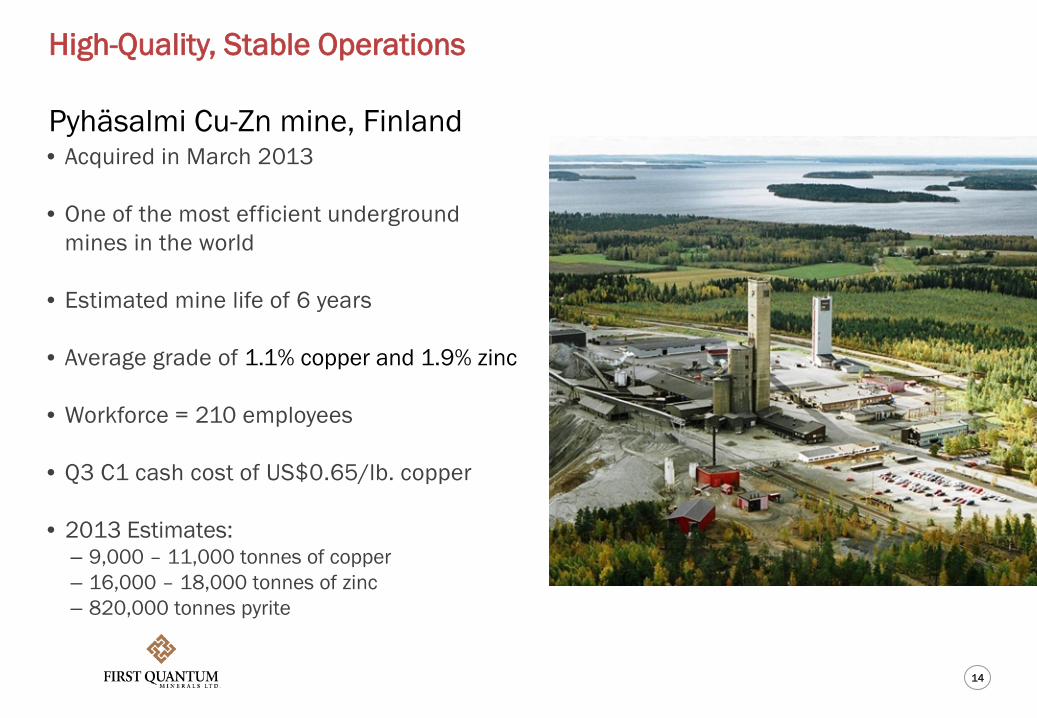
High-Quality, Stable Operations Pyhäsalmi Cu-Zn mine, Finland • Acquired in March 2013
• One of the most efficient underground
mines in the world
• Estimated mine life of 6 years • Average grade of 1.1% copper and 1.9% zinc
• Workforce = 210 employees
• Q3 C1 cash cost of US$0.65/lb. copper • 2013 Estimates:
– 9,000 – 11,000 tonnes of copper – 16,000 – 18,000 tonnes of zinc – 820,000 tonnes pyrite
15
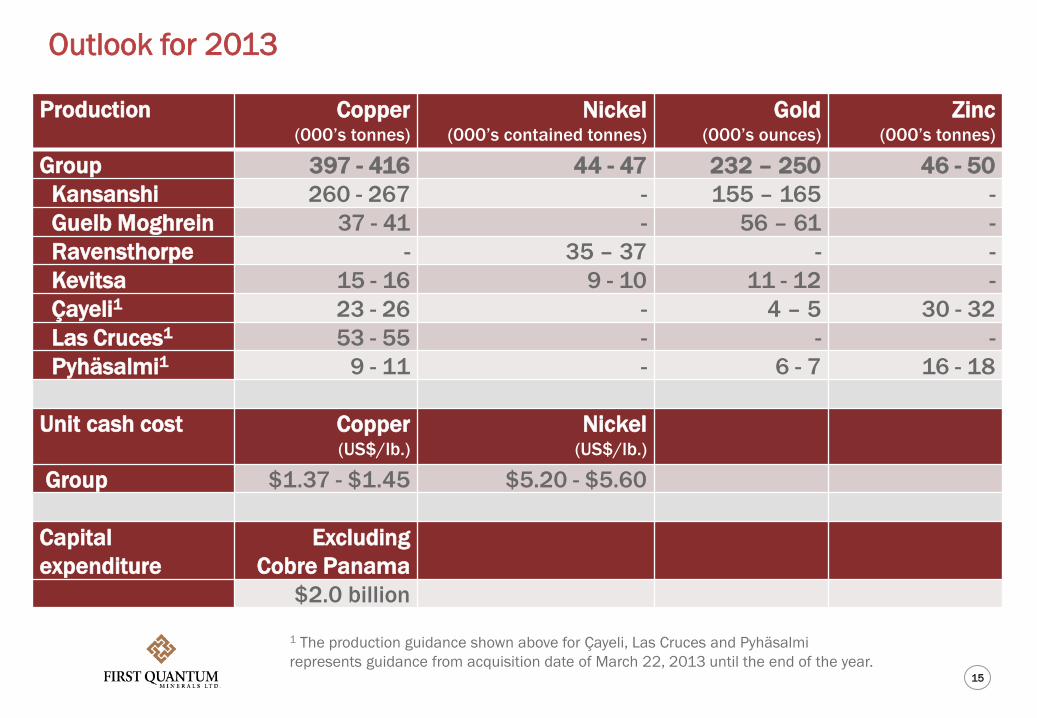
Outlook for 2013 Production Copper
(000’s tonnes) Nickel
(000’s contained tonnes) Gold
(000’s ounces) Zinc
(000’s tonnes)
Group 397 - 416 44 - 47 232 – 250 46 - 50 Kansanshi 260 - 267 - 155 – 165 - Guelb Moghrein 37 - 41 - 56 – 61 - Ravensthorpe - 35 – 37 - - Kevitsa 15 - 16 9 - 10 11 - 12 - Çayeli1 23 - 26 - 4 – 5 30 - 32 Las Cruces1 53 - 55 - - - Pyhäsalmi1 9 - 11 - 6 - 7 16 - 18 Unit cash cost Copper
(US$/lb.) Nickel
(US$/lb.)
Group $1.37 - $1.45 $5.20 - $5.60 Capital expenditure
Excluding Cobre Panama
$2.0 billion
1 The production guidance shown above for Çayeli, Las Cruces and Pyhäsalmi represents guidance from acquisition date of March 22, 2013 until the end of the year.

16
Our Development Project Pipeline

17
Our Project Pipeline Copper Smelter, Zambia • Processing capacity of 1.2 Mtpa
—Combination of concentrate from Kansanshi & Sentinel
—Average copper grade 26%
• Copper production 300,000 tpa; acid production 1.0 Mtpa
• Estimates: − Capital cost of US$690M − Commissioning from mid 2014
• Estimated savings:
− US$340M - US$510M/year
• Expansion being planned to increase processing capacity to 2 Mtpa in 2017

18
Our Project Pipeline Sentinel Cu project, Zambia • Located ~ 140 km northwest of
Solwezi, northern Zambia
• M&I resource of 1,027 Mt at 0.51% Cu grade, containing 5.2 Mt Cu
• Estimates: – 2.2:1 LOM strip ratio – >15 years mine life – Annual production up to 300,000
tonnes – US$2.0 billion capex (incl. Enterprise
nickel project) – Completion targeted for mid-2014
• Includes 4 Mtpa nickel facility; flexibility
to augment copper capacity

19
Our Project Pipeline Cobre Panama Cu project, Panama • Acquired March 2013
• Large open pit copper project; Larger
project than the Panama Canal
• Est. mine life of 40 years
• Est. average annual production of 260,000 tonnes copper
• Progress since acquisition: – Several contracts modified or cancelled – Transformed to complete self-perform arrangement – All key aspects fully functional allowing activities to advance efficiently – Access to site improved – Biodiversity, environmental and social programs continuing
20
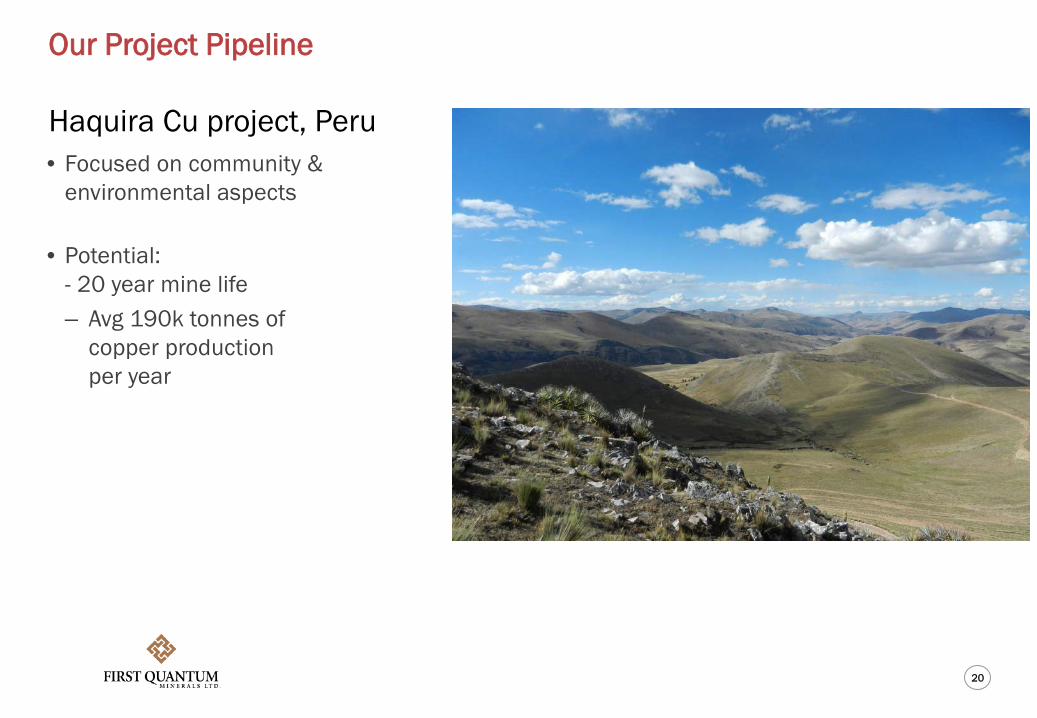
Our Project Pipeline Haquira Cu project, Peru • Focused on community &
environmental aspects
• Potential: - 20 year mine life – Avg 190k tonnes of
copper production per year
One of the Few Mining Companies Investing in Building Capacity
22
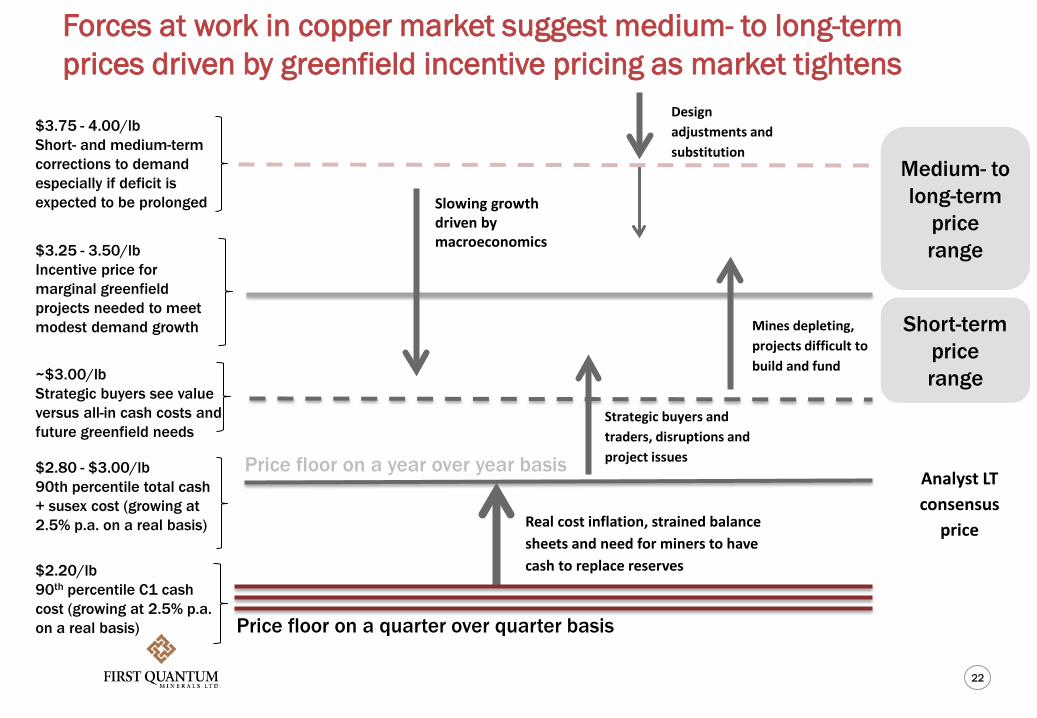
Forces at work in copper market suggest medium- to long-term prices driven by greenfield incentive pricing as market tightens
Slowing growth driven by macroeconomics
Design adjustments and substitution
Strategic buyers and traders, disruptions and project issues
$2.20/lb 90th percentile C1 cash cost (growing at 2.5% p.a. on a real basis) Price floor on a quarter over quarter basis
$2.80 - $3.00/lb 90th percentile total cash + susex cost (growing at 2.5% p.a. on a real basis)
Price floor on a year over year basis
~$3.00/lb Strategic buyers see value versus all-in cash costs and future greenfield needs
$3.25 - 3.50/lb Incentive price for marginal greenfield projects needed to meet modest demand growth
Real cost inflation, strained balance sheets and need for miners to have cash to replace reserves
Mines depleting, projects difficult to build and fund
$3.75 - 4.00/lb Short- and medium-term corrections to demand especially if deficit is expected to be prolonged
Medium- to long-term
price range
Analyst LT consensus
price
Short-term price range

23
The New Global Copper Leader
• The New Go-To Copper Producer
• Attractive Diverse Geographic Exposure
• A Long-Standing Commitment to Social and Environmental Excellence
• Creating Value with Our Project Development Expertise
Source: BrookHunt
1.8 1.5 1.5
1.3 1.2
0.9 0.8 0.8 0.6
0.5 0.5 0.5 0.4 0.4 0.3
Free
port-
McM
oRan
Gle
ncor
eXs
trata
Cod
elco
Firs
t Qua
ntum
BHP
Billi
ton
Sout
hern
Cop
per
Rio
Tin
to
Angl
o Am
eric
an
KGH
M
Kaza
khm
ys
Teck
Res
ourc
es
Vale
Anto
faga
sta
Nor
ilsk
Firs
t Qua
ntum
2012
2018E Copper Production, Mt

The New Leader in Global Copper December 2013