Embed Size (px)
Citation preview

CORPORATE PRESENTATION
3Q13 RESULTS
November 2013
Lima

The information contained in this presentation concerning projections may be deemed to include
statements which constitute forward-looking statements within the meaning of Section 27A of the Securities Act
of 1933, as amended, Section 21E of the Securities Exchange Act of 1934, as amended, and the safe harbor
provisions of the U.S. Private Securities Litigation Reform Act of 1995. Such forward-looking statements involve a
certain degree of risk and uncertainty with respect to business, financial, trend, strategy and other projections,
and are based on assumptions, data or methods which although considered reasonable by Milpo at the time may
turn out to be incorrect or imprecise, or may not be possible to realize, or may differ materially from actual
results, due to a variety of factors. Milpo can not guarantee that expectations disclosed in this presentation will
prove to be correct and does not undertake, and specifically disclaims any obligation to update any forward-
looking statements, which speak only for the date they are made.
The market and competitive position data used throughout this presentation were obtained from
internal surveys, market research, publicly available information and industry publications. Although Milpo has no
reason to believe that any of this information or these reports are inaccurate in any material respect, Milpo has
not independently verified the competitive position, market share, market size, or other data provided by third
parties or by industry or other publications and therefore do not make any representation as to the accuracy of
such information.
This presentation and its contents are proprietary information and may not be reproduced or
otherwise disseminated in whole or in part without Milpo´s prior written consent.
Disclaimer

3
Agenda
Financial Highlights 2
Closing Remarks 3
Business and Operational Performance 1
Mr. Víctor Gobitz - CEO
Mr. Persio Morassutti - CFO
Mr. Persio Morassutti - CFO

4
Milpo’s corporate strategy is based on four main pillars:
Mining Operations
The focus is increasing productivity:
• Integration of the underground mines located in
the Pasco Region, El Porvenir and Atacocha, in
just one operational overhead.
• Elimination of the main bottlenecks of Cerro
Lindo: backfill and ventilation processes.
Copper Operations on hold Greenfield Projects
Corporate Office
Continued brownfield exploration campaigns
focused on identifying alternative mining plans,
looking for free cash flow generation.
The focus is to reduce the risks associated with its
development through increased exploration and
new development approaches, reducing capex
and accelerating payback.
Focus on providing strategic services to the whole
organization and reinforce tactical and operative
capabilities on site.

5
521
2012 2011
3Q13 3Q12
577
175
150
3Q13 3Q12
2,351
1,745
9M13 9M12
6,503
5,172 429
9M13 9M12
505
35% 17%
Milpo´s consolidated operational performance
Concentrates production (thousand of tonnes)
Ore Treated
(thousand of tonnes)
Zinc Lead Copper
2012 2011
7,149
6,428
2010
5,864
2010
498
18% 26%
6
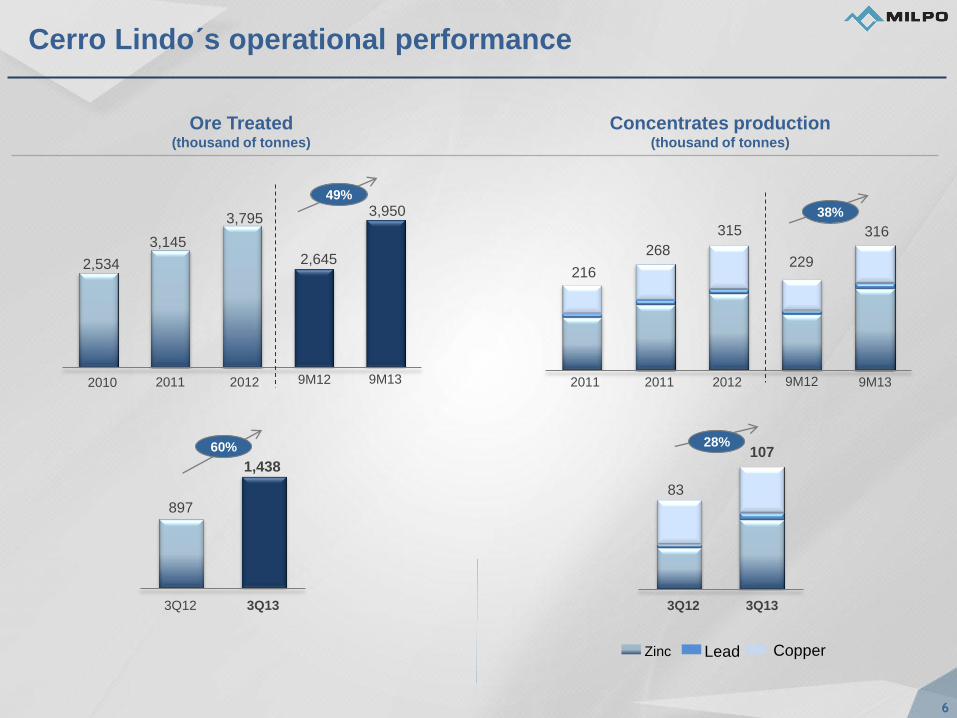
Concentrates production (thousand of tonnes)
268
2012 2011
3Q13 3Q12
315
Zinc Lead Copper
107
83
3Q13 3Q12
Ore Treated (thousand of tonnes)
1,438
897
9M13 9M12
3,950
2,645 229
9M13 9M12
316
60% 28%
Cerro Lindo´s operational performance
3,795
3,145
2012 2011 2011
216
2010
2,534
49%
38%

7
144
2012 2011
158
40 42
3Q13 3Q12
523 495
9M13 9M12
1,445 1,429
120
9M13 9M12
108
6%
4%
El Porvenir´s operational performance
Concentrates production (thousand of tonnes)
Ore Treated
(thousand of tonnes)
3Q13 3Q12
Zinc Lead Copper
2012 2011
1,742 1,899
2010
1,792
150
1%
10%
2010

8
109
2012 2011
3Q13 3Q12
104
29 25
3Q13 3Q12
390 353
9M13 9M12
1,108 1,098
79
9M13 9M12
80
10% 16%
Atacocha´s operational performance
Concentrates production (thousand of tonnes)
Ore Treated
(thousand of tonnes)
Zinc Lead Copper
1,455 1,541
2012 2011 2010
1,537
132
2010
1%
1%

9
As a part of its strategy, Milpo is continuing the exploration
campaigns at the sites of its copper operations …
Technical and geological studies have been performed
at Chapi mine to evaluate the underground exploitation
of the deepest high-grade copper mineralization (40Mt
@ >1%Cu)
Exploration of nearby prospects with proven additional
copper resources which can be processed at the Chapi
plant (San José)
Oxide copper mineralization at Sierra Medina has been
intensively explored during the 3Q13
Drilling results delineated a critical mass of Cu oxides
(6.7Mt @ 1.35%Cu) which could be mined also by
underground methods.
The project conceptual study considers the location of
the crushing and heap leaching infrastructure at the
mine site.
ANTOFAGASTA
AREQUIPA
PACIFIC OCEAN
SAN JOSÉ PROSPECT
CHAPI MINE
JUSTICIA PROSPECT
CHILE
PERU
SIERRA VALENZUELA
SIERRA MEDINA
IVÁN MINE
CHAPI MINE BROWNFIELD EXPLORATION
IVAN MINE – EXPLORATION AT SIERRA MEDINA

10
…and analyzing different options to execute its greenfield projects.
LIMA
AREQUIPA
TRUJILLO
PACIFIC OCEAN
CHILE
PERU
MAGISTRAL PROJECT
HILARION PROJECT
PUKAQAQA PROJECT
ATACOCHA MINE
EL PORVENIR MINE
CERRO LINDO MINE
Our greenfield portfolio includes the Magistral, Hilarion and
Pukaqaqa projects.
During the 3Q13, Milpo continued to carry out an extensive
technical and geological evaluation of all project aspects in
order to improve Magistral, Hilarion and Pukaqaqa
economics.
The plan contemplates an initial open-pit mining
phase of the near surface high-grade ore.
Exploration drilling carried out during Q313 resulted
in the identification of more mineralization in the
westernmost part of the Magistral ore body.
Infill drilling completed at the northern part of the
Hilarion ore body indicates continuity of high-grade
mineralization, particularly, in the wider part of the ore
bodies.
The mineralization remains opened to the north and
this area will be the focus of 2014 drilling campaign.
Milpo is evaluating an internal review of the key
aspects of the project.
MAGISTRAL
HILARION
PUKAQAQA

11
Agenda
Financial Highlights 2
Closing Remarks 3
Business and Operational Performance 1
Mr. Persio Morassutti - CFO
Mr. Persio Morassutti - CFO
Mr. Víctor Gobitz - CEO

12
EBITDA (US$ million) Revenues (US$ million)
2012 2011 2012 2011
287
204
29%
2010 2010
319
Margin (%)
20%
691 738
586
2009
401
43% 49% 40%
2009
162
8%
During 3Q13 Milpo improved its consolidated financial
position.
Highlights 3Q13 vs. 3Q12
3Q13 3Q12 3Q13 3Q12
32% 35% Margin (%)
173 182 64
55
15%
CAGR CAGR Revenues increased by 5% to US$ 182
million in 3Q13, due to the increase in
metal production and in spite of the
decrease in metal prices.
Cost of sales reached US$ 87 million in
3Q13, similar to that of 3Q12, sustained
by decreased per unit cash cost.
EBITDA increased by 15% to US$ 64
million in 3Q13 due to higher revenues
and lower consolidated cash costs.
Consolidated Net Profit increased by
38% to US$ 18 million in 3Q13 due to
the higher EBITDA.
As of September, Milpo also shows
better financial results in comparison to
those of the same period 2012:
Revenues: US$ 535 million (5%
increase); EBITDA: US$ 189 million
(21% increase); Cost of sales: US$
248 million (7% decrease); Net
profit: US$ 46 million (66%
increase)
13
18
38%
3Q13 3Q12
Net profit (US$ million) Cost of sales (US$ million)
87 87
3Q13 3Q12
0%
5%

13
EBITDA (US$ millions)
2012 2011
3Q13 3Q12
Revenues (US$ millions)
369 336
9M13 9M12
118
98
21%
2012 2011
351
265
Marg
in
(%
)
223 216
9M13 9M12
198
152
58% 56% 67% 58%
3Q13 3Q12
65 57
58% 55%
14%
Marg
in
(%
)
Revenues increased by US$ 20 million in 3Q13 due to
higher production .
EBITDA increased by US$ 8 million, due to higher
revenues.
Cerro Lindo´s financial performance (65% of Milpo’s revenues)
243
2010
116
2010
68%
32% 30%

14
EBITDA (US$ millions)
2012 2011
3Q13 3Q12
Revenues (US$ millions)
152 157
9M13 9M12
33
40
2012 2011
103 113
Marg
in
(%
)
79
61
9M13 9M12
30 44
39% 29% 50% 40%
3Q13 3Q12
6
17
43% 20% Marg
in
(%
)
19% 65%
Revenues decreased by 19% in 3Q13 from 3Q12
mainly because of lower metal prices
EBITDA decreased by 65% due to lower revenues.
However as of September 2013, the EBITDA was of
US$ 30 million, a 31% decrease explained in lower
metal prices.
El Porvenir´s financial performance (18% of Milpo’s revenues)
140
2010 2010
72
52%
9%
31%

15
EBITDA (US$ millions)
2012 2011
3Q13 3Q12
Revenues (US$ millions)
111
135
9M13 9M12
29
24
2012 2011
72 83
Marg
in
(%
)
56
24
9M13 9M12
11 18
21% 16% 41% 22%
3Q13 3Q12
10
1
5% 33% Marg
in
(%
)
23% 722%
Atacocha´s financial performance (16% of Milpo’s revenues)
Revenues increased by 23% to US$ 29 million in 3Q13. EBITDA increased to US$ 10 million in 3Q13 from US$
1 million in 3Q12, positively impacted by higher
revenues and lower cash cost (-20%).
123
2010
57
2010
46%
13%
36%

16
El Porvenir 9%
Cerro Lindo 46%
Atacocha 15%
Greenfields and others
30%
2012 2011
79
195 221
13%
Investments in 2013 are focused on sustaining the operations
Capex (US$ million)
17
72
76%
3Q13 Capex breakdown per unit
3Q12 3Q13
2013 Forecast US$
(MM)
Cerro Lindo brownfield project 15k
(culmination)
34
Greenfield projects studies 16
Mobile equipment acquisition 9
Shaft deepening (AT) 5
Tailing dam elevation (EP) 3
2013 Capex forecast is US$ 110 million and includes:
US$ 17MM
61%
9M12 9M13
69
179
2010
17
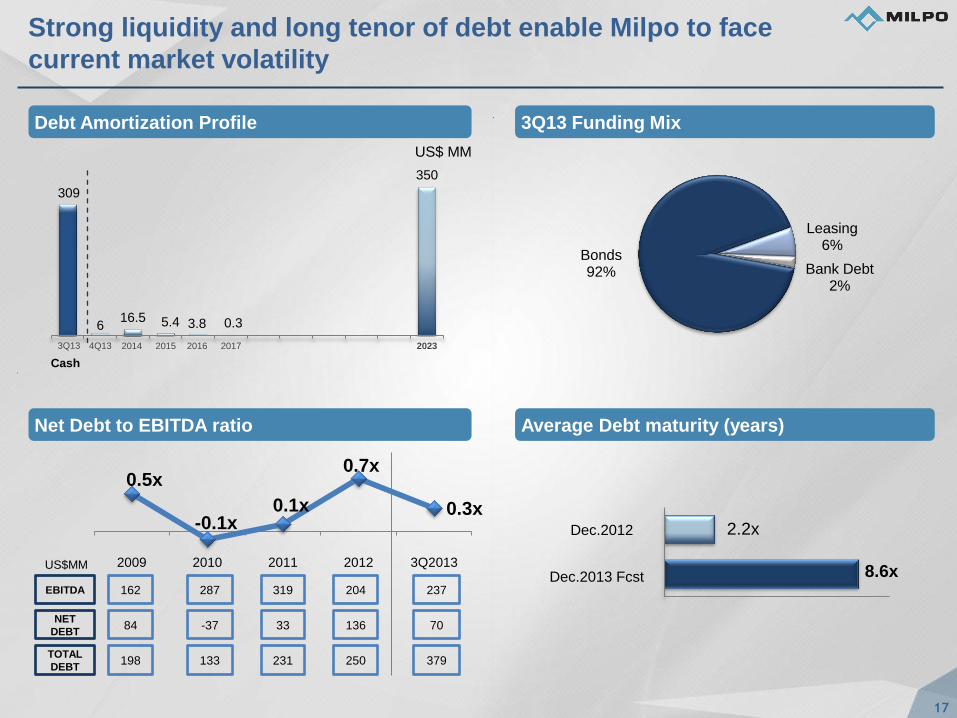
Cash
Strong liquidity and long tenor of debt enable Milpo to face
current market volatility
Average Debt maturity (years)
3Q13 Funding Mix
Net Debt to EBITDA ratio
Debt Amortization Profile
2.2x
8.6x
Dec.2012
Dec.2013 Fcst
US$ MM
162 287 319 204 237
84 -37 33 136 70
198 133 231 250 379
EBITDA
NET
DEBT
TOTAL
DEBT
US$MM
Bank Debt 2%
Bonds 92%
Leasing 6%
309
6 16.5 5.4 3.8 0.3
350
2014 4Q13 3Q13 2015 2016 2017 2023
0.5x
-0.1x 0.1x
0.7x
0.3x
2009 2010 2011 2012 3Q2013

18 (1) Source: Bloomberg. Current price: LME cash prices 2013 Fcst Milpo: Average 2013:
* As of october 30th, 2013
Price Evolution (Quarter Average)
3Q12 CURRENT
PRICE *
2013
FCST 4Q12 1Q13 2Q13 2Q12
HIGHLIGHTS
ZIN
C
1,928 1,889 1,951 2,033 1,840 1,860 1,939 1,902
US$/ton
SIL
VE
R
US$/oz (1)
30 30 33 30 23 21 22 24
CO
PP
ER
US$/ton (1)
7,863 7,714 7,825 7,928 7,146 7,079 7,216 7,312
Outlook 2013
3Q13
Zinc: Demand showing positive
signs in China, reflecting a more
constructive perspective in housing
and auto sectors.
Copper: Market will have a smaller
surplus this year than expected due
to an improvement on demand,
especially in China.
Silver: Market is in surplus and
therefore there is pressure on prices.
Investor activity has not changed
significantly since the price went
down in April. Federal Reserve QE
exit strategy will be the main driver
for the metal price
19
Agenda
Financial Highlights 2
Closing Remarks 3
Business and Operational Performance 1
Mr. Víctor Gobitz - CEO
Mr. Persio Morassutti - CFO
Mr. Persio Morassutti - CFO

20
Closing Remarks
Continuous efforts to optimize investments, operating costs and
administrative expenses, suited to market conditions.
Increased EBITDA margins in 2013 due to higher production and
profitability of operating units.
Strong liquidity position and disciplined financial management allowing
the company to respond to LME prices variations and market volatility.
Current corporate strategy based on the four pillars to support
enhanced productivity and business growth.
Intensive exploration at Chapi and Ivan mines, and review of Greenfield
project approach looking forward to reduce operational and financial
risks.

Q & A