Embed Size (px)
Citation preview
Corporate Plan
2014-17
11 November 2014
NBN Co Limited 11 November 2014
Corporate Plan 2014-17 Page 2 of 60
Contents 1 Legal Notice ............................................................................................................................................... 4
2 About this Plan .......................................................................................................................................... 5
3 Policy Developments since the 2012-15 Corporate Plan ...................................................................... 7
3.1 Summary Timeline ............................................................................................................................ 7
3.2 The April 2014 Statement of Expectations ....................................................................................... 8
4 Broadband Trends .................................................................................................................................. 10
4.1 Broadband Market .......................................................................................................................... 10
4.2 Data Usage and Bandwidth Demand ............................................................................................. 10
5 NBN Co’s Strategic Direction ................................................................................................................ 11
6 Implementing the Strategic Direction ................................................................................................... 13
6.1 Multi-Technology Mix ...................................................................................................................... 13
6.2 Next Steps in Implementing the MTM ............................................................................................ 14
6.3 Transformation Initiatives ............................................................................................................... 15
6.4 Implementing the MTM Access Technologies ................................................................................ 15
6.4.1 FTTP and Fixed Wireless Rollouts in FY2015 .................................................................. 16
6.4.2 The FTTN Pilot .................................................................................................................. 17
6.4.3 The FTTB Pilot .................................................................................................................. 17
6.4.4 Prioritisation of Underserved Areas .................................................................................. 17
6.4.5 NBN Co’s Rollout to High Value End-Users ...................................................................... 18
6.4.6 Further Policy Decisions under Consideration .................................................................. 18
6.5 Products Roadmap ......................................................................................................................... 19
7 Business Overview ................................................................................................................................. 20
7.1 NBN Co’s Organisation .................................................................................................................. 20
7.1.1 NBN Co Board and Leadership ......................................................................................... 20
7.1.2 Market, Sales and Service Organisation ........................................................................... 20
7.1.3 Network and IT Organisational Review ............................................................................. 21
7.2 NBN Co’s Organisation .................................................................................................................. 21
7.2.1 Governance ....................................................................................................................... 21
7.2.2 People and Policies ........................................................................................................... 21
7.2.3 Health and Safety .............................................................................................................. 22
7.2.4 Human Resources and Industrial Relations ...................................................................... 23
7.2.5 Reconciliation Action Plan ................................................................................................. 23
7.3 Information Technology and Operating the NBN ........................................................................... 24
7.3.1 Information Technology ..................................................................................................... 24
NBN Co Limited 11 November 2014
Corporate Plan 2014-17 Page 3 of 60
7.3.2 Operating the NBN ............................................................................................................ 24
8 Operational Overview ............................................................................................................................. 25
8.1 Operational Highlights .................................................................................................................... 25
8.2 Connecting Premises to the FTTP Network ................................................................................... 26
8.3 FTTP Access Network .................................................................................................................... 28
8.4 FTTP Greenfields ........................................................................................................................... 30
8.5 Fixed Wireless and Satellite ........................................................................................................... 32
8.6 Transit Network ............................................................................................................................... 34
8.7 Customers and End-Users ............................................................................................................. 36
8.7.1 Customer Experience and Engagement ........................................................................... 36
8.7.2 End-User Product Scorecard ............................................................................................ 36
8.7.3 Disconnection and Migration Process ............................................................................... 37
8.7.4 Serviceability Improvement Programme for FTTP Access Network (Brownfields
Premises) ........................................................................................................................ 39
8.7.5 Service Levels for End-User Connections ........................................................................ 40
8.7.6 End-User Trends and Average Revenue per User (ARPU) .............................................. 41
9 Financials ................................................................................................................................................ 44
9.1 Financial Highlights......................................................................................................................... 44
9.2 Major Corporate Plan Assumptions ................................................................................................ 45
9.3 Financial Estimates for FY2015 ...................................................................................................... 47
9.4 Financial Assumptions for FY2016 and FY2017 ............................................................................ 49
9.5 Funding ........................................................................................................................................... 50
9.5.1 The Amended Agreement Equity Funding Agreement ..................................................... 50
9.5.2 Indicative Equity Funding Profile ....................................................................................... 50
9.5.3 NBN Co’s Ability to Raise Debt ......................................................................................... 51
10 Risks ......................................................................................................................................................... 52
10.1 NBN Co’s Risk Management Framework ....................................................................................... 52
10.2 Strategic Risks ................................................................................................................................ 53
11 Appendix .................................................................................................................................................. 54
11.1 Glossary of Terms .......................................................................................................................... 54
11.2 Table of Exhibits ............................................................................................................................. 60
NBN Co Limited 11 November 2014
Corporate Plan 2014-17 Page 4 of 60
1 Legal Notice Introduction
This Corporate Plan has been prepared by NBN Co Limited (NBN Co or the Company) for its shareholder
ministers, the Hon Malcolm Turnbull MP and Senator the Hon Mathias Cormann (Shareholder Ministers) as
required by the Commonwealth Authorities and Companies Act 1997 (Cth) (CAC Act), the Commonwealth
Authorities and Companies Regulations 1997 (Cth) (CAC Regulations), the Commonwealth Government
Business Enterprise Governance and Oversight Guidelines (October 2011) (GBE Guidelines) and
Australian Government policy as communicated to NBN Co by the Commonwealth from time to time
(together, Reporting Obligations).
Forecasts
The Corporate Plan has been prepared for the consideration of the Shareholder Ministers only, and contains
various long-range plans, projections, high level estimates and other forward looking information for FY2015
only (together, FY2015 Estimates). The FY2015 Estimates are based on NBN Co’s best considered
professional assessment of present economic and operating conditions, present Australian Government
policy, and a number of assumptions regarding future events and actions which, at the date of this Corporate
Plan, are expected to take place. The FY2015 Estimates involve known and unknown risks, uncertainties
and other factors outside of NBN Co’s control that may cause NBN Co’s actual results, performance or
achievements to be materially different from any future results, performance or achievements expressed or
implied by the FY2015 Estimates.
While the FY2015 Estimates are based on NBN Co’s best considered professional assessment, NBN Co’s
officers (as defined in the Corporations Act) do not give any guarantee or assurance to any third party that
the results, performance or achievements expressed or implied by the FY2015 Estimates will actually occur,
and such FY2015 Estimates should not be relied on or considered to be a representation of what will happen
by any third party.
NBN Co is not yet in a position to generate projections with a reasonable level of confidence for FY2016 and
FY2017. In relation to these periods, NBN Co has used the December 2013 Strategic Review and the May
2014 Fixed Wireless and Satellite Strategic Review Scenario 6 - Multi-Technology Mix assumptions, pending
further confirmation of the assumptions in that scenario (together, the FY2016-FY2017 Assumptions).
Other than as required by NBN Co's Reporting Obligations, NBN Co and its officers have no obligation to
update the FY2015 Estimates or FY2016-FY2017 Assumptions based on circumstances, developments or
events occurring after the publication date of this 2014-17 Corporate Plan (Corporate Plan).
Copyright
Copyright NBN Co Limited 2014.
Copyright subsists in this Corporate Plan. NBN Co Limited owns that copyright. Other than as permitted
under the Copyright Act 1968 (Cth), this Corporate Plan (in part or as a whole) cannot be reproduced,
published, communicated or adapted without the prior written consent of NBN Co Limited. Any request or
inquiry to so use the Corporate Plan should be addressed to:
The Chief Strategy Officer NBN Co Limited Level 11, 100 Arthur Street North Sydney NSW 2060 Australia
Date
This Corporate Plan is dated 11 November 2014.
NBN Co Limited 11 November 2014
Corporate Plan 2014-17 Page 5 of 60
2 About this Plan NBN Co’s Corporate Plan is an important tool to guide the organisation towards achieving the goals
identified as being critical to its success in the context of a changing Strategic Direction and a new set of
policies and objectives since the September 2013 Australian Federal election. In particular, the Corporate
Plan details the approach NBN Co intends to take to implement a Multi-Technology Mix (MTM) NBN.
There has been a significant amount of change at NBN Co in the time between the approved 2012-15
Corporate Plan (August 2012)1 and this Corporate Plan. This includes a new Government Statement of
Expectations (SoE) (its most recent version was issued in April 2014),2 the appointment of a new Chairman
(Dr Ziggy Switkowski, effective October 2013), and the appointment of a new Chief Executive Officer and
Managing Director (Bill Morrow, effective April 2014).
The December 2013 Strategic Review3 and the May 2014 Fixed Wireless and Satellite Strategic Review
4
(described together as Strategic Reviews) identified and recommended a series of changes to the
technology mix, deployment and operation of the NBN.
The implementation of the Strategic Reviews recommendations and the Government Statement of
Expectations (including further guidance from the Shareholder Ministers) requires making assumptions about
future outcomes that carry high levels of uncertainty at the time of publishing the 2014-17 Corporate Plan,
including:5
� The recommendations, subsequent policy decisions, and industry reaction to the Vertigan Cost-Benefit
Review and the Scales Public Policy Review.
� The outcomes from the renegotiation of the Telstra Definitive Agreements (Telstra DAs) and the Optus
Agreement (Optus HFC Agreement), including commercial and operational access to the copper
network (Copper Network) and the existing cable access networks (Hybrid Fibre Coaxial or HFC
Cable Networks). It is anticipated that the execution of these revised agreements will be subject to a
number of conditions precedent, including necessary regulatory approvals, which will be relevant to the
timing of the rollout.
� The ability to quickly ramp up the level of deployment, serviceable premises and activations activities in
the Fibre-to-the-Premises (FTTP) and Fixed Wireless footprints, with an expected significant increase in
activations volumes during the course of FY2015, whilst proceeding to deploy the other MTM
technologies at scale, and in particular Fibre-to-the-Node (FTTN) and HFC Cable Networks. This will be
dependent on the outcomes from commercial negotiations with NBN Co’s contractors (Delivery
Partners) and suppliers, as well as the Delivery Partners significantly uplifting the industry’s skilled
labour workforce and productivity levels.
� The ability of NBN Co to rapidly deliver on the new Strategic Direction, including the challenge to its
operations, staff / culture, IT systems, processes, planning tools and delivery models, so as to ensure an
effective rollout of the Multi-Technology Mix approach. In order to achieve the Strategic Reviews
envisaged timelines, NBN Co will have to continue undertaking a very large number of activities and
make strategic decision points over the next 12 to 18 months, including:
1 2012-15 Corporate Plan – August 2012. http://www.nbnco.com.au/assets/documents/nbn-co-corporate-plan-6-aug-2012.pdf 2 Statement of Expectations (April 2014 Statement of Expectations) – April 2014.
http://www.communications.gov.au/__data/assets/pdf_file/0014/221162/SOE_Shareholder_Minister_letter.pdf 3 Strategic Review – December 2013. http://www.nbnco.com.au/content/dam/nbnco/documents/NBN-Co-Strategic-Review-Report.pdf 4 Fixed Wireless and Satellite Review – May 2014. http://www.nbnco.com.au/content/dam/nbnco/documents/NBNCo_Fixed_Wireless_and_Satellite_Review_07052014.pdf 5 Refer Major Corporate Plan Assumptions at Section 9.2 below.
NBN Co Limited 11 November 2014
Corporate Plan 2014-17 Page 6 of 60
o Engage with the Government / produce new Corporate Plan / engage with stakeholders in
relation to potential policy decisions and regulatory changes.
o Mobilise the transformation agenda / whole of business operating model.
o Implement the MTM construction delivery model, including ongoing operational improvements to
the FTTP construction delivery model.
o Implement multi-technology network architecture, planning approach and network design
principles.
o Commence and / or continue discussions and renegotiations with Telstra and / or Optus,
vendors, contractors (Delivery Partners) and Service Providers.
o Undertake a review of Fixed Wireless and Satellite. The Fixed Wireless and Satellite Review
(completed in May 2014) considered a number of next steps, including pursuing multiple
pathways to secure spectrum.
o Undertake MTM IT capability and network operations improvements.
o Focus on people and organisation / Implement ongoing organisation and culture change.
o Implement a revised governance approach.
o Engage and consult widely with stakeholders and regulatory authorities.
Given the above levels of uncertainty, the 2014-17 Corporate Plan,6 which covers the period 1 July 2014 to
30 June 2017, should be viewed as a transition plan for NBN Co.
Further progress on the implementation of the new Strategic Direction will help inform NBN Co’s operational
targets and financial projections. Until then:
� The FY2015 estimates and financial projections represent NBN Co’s best high-level estimate of the next
12 months (FY2015 Estimates).
� NBN Co is not in a position to generate forecasts with a reasonable level of confidence for FY2016 and
FY2017. Therefore, any operational and financial data for FY2016 and FY2017 are long range assumed
possible outcomes, not a forecast (or FY2016-FY2017 Assumptions). For the purpose of this Plan, the
FY2016-FY2017 Assumptions uses the Strategic Reviews Scenario 6 - Multi-Technology Mix
assumptions, pending further confirmation of the assumptions in that scenario.
In accordance with the Reporting Obligations, this Corporate Plan intends to inform the Shareholder
Ministers on:
� A summary of the policy and broadband environment in which the Company operates (see Sections 3
and 4 of this Corporate Plan).
� The objectives and business strategies of NBN Co, including its obligations to the community and
stakeholders (see Sections 5, 6 and 7 of this Corporate Plan).
� A review of performance against the 2012-15 Corporate Plan (see Section 8 of this Corporate Plan).
� A set of financial estimates, projections and assumptions; including funding requirements (see Section 9
of this Corporate Plan).
� An analysis of factors or financial risks likely to affect achievement of these financial estimates,
projections and assumptions, and NBN Co’s strategies to manage these risks (see Section 10 of this
Corporate Plan).
6 This Corporate Plan covers NBN Co and its subsidiaries.
NBN Co Limited 11 November 2014
Corporate Plan 2014-17 Page 7 of 60
3 Policy Developments since the 2012-15
Corporate Plan
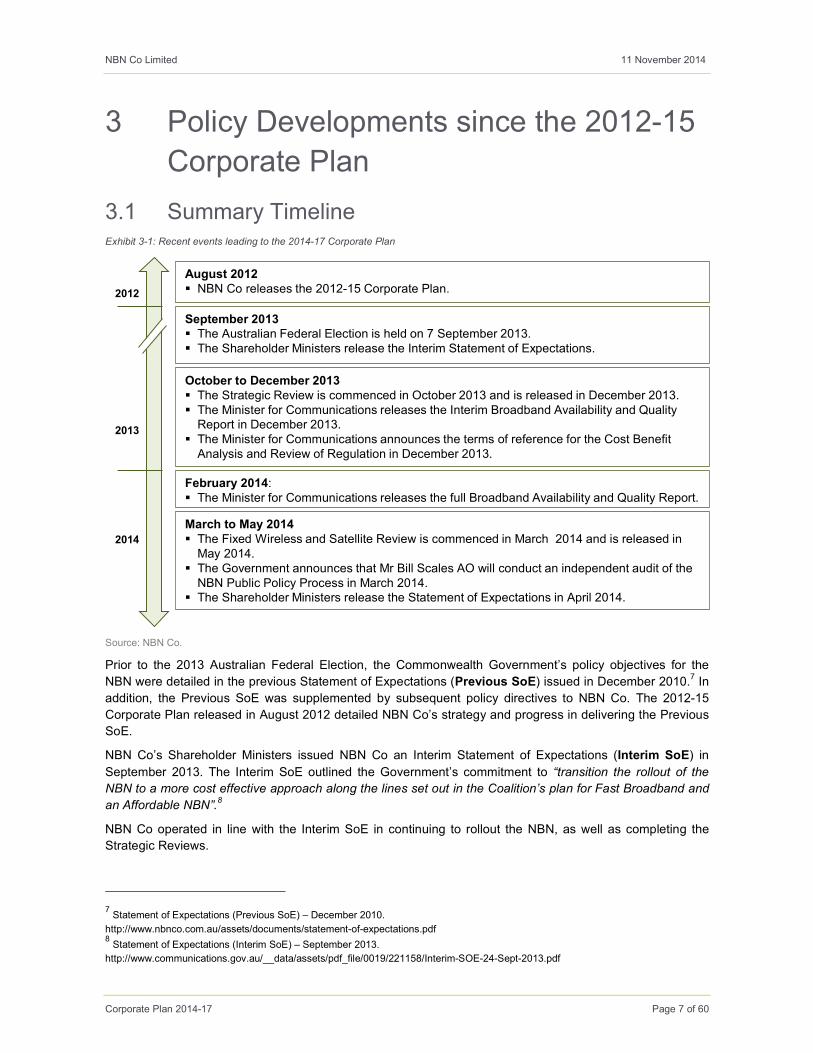
3.1 Summary Timeline Exhibit 3-1: Recent events leading to the 2014-17 Corporate Plan
Source: NBN Co.
Prior to the 2013 Australian Federal Election, the Commonwealth Government’s policy objectives for the
NBN were detailed in the previous Statement of Expectations (Previous SoE) issued in December 2010.7 In
addition, the Previous SoE was supplemented by subsequent policy directives to NBN Co. The 2012-15
Corporate Plan released in August 2012 detailed NBN Co’s strategy and progress in delivering the Previous
SoE.
NBN Co’s Shareholder Ministers issued NBN Co an Interim Statement of Expectations (Interim SoE) in
September 2013. The Interim SoE outlined the Government’s commitment to “transition the rollout of the
NBN to a more cost effective approach along the lines set out in the Coalition’s plan for Fast Broadband and
an Affordable NBN”.8
NBN Co operated in line with the Interim SoE in continuing to rollout the NBN, as well as completing the
Strategic Reviews.
7 Statement of Expectations (Previous SoE) – December 2010.
http://www.nbnco.com.au/assets/documents/statement-of-expectations.pdf 8 Statement of Expectations (Interim SoE) – September 2013.
http://www.communications.gov.au/__data/assets/pdf_file/0019/221158/Interim-SOE-24-Sept-2013.pdf
August 2012� NBN Co releases the 2012-15 Corporate Plan.2012
September 2013� The Australian Federal Election is held on 7 September 2013.� The Shareholder Ministers release the Interim Statement of Expectations.
October to December 2013� The Strategic Review is commenced in October 2013 and is released in December 2013.� The Minister for Communications releases the Interim Broadband Availability and Quality Report in December 2013.
� The Minister for Communications announces the terms of reference for the Cost Benefit Analysis and Review of Regulation in December 2013.
February 2014:� The Minister for Communications releases the full Broadband Availability and Quality Report.
2013
2014
March to May 2014� The Fixed Wireless and Satellite Review is commenced in March 2014 and is released in May 2014.
� The Government announces that Mr Bill Scales AO will conduct an independent audit of the NBN Public Policy Process in March 2014.
� The Shareholder Ministers release the Statement of Expectations in April 2014.
NBN Co Limited 11 November 2014
Corporate Plan 2014-17 Page 8 of 60
In line with the policy objectives of prioritising communities who do not have access to adequate broadband,
the Department of Communications released a summary version of The Broadband Availability and Quality
Report on 23 December 2013, followed by the full report on 20 February 2014.9
In addition, NBN Co’s Shareholder Ministers announced two additional independent reviews in line with the
Coalition’s policy that will potentially impact NBN Co:
� The Vertigan Cost-Benefit Review, which Terms of Reference included analysing the economic and
social costs and benefits arising from the availability of broadband of differing properties via various
technologies, and making recommendations on the role of Government support and a number of other
long-term industry matters. This review was announced on 12 December 2013. The first of the three
reports, the Statutory Review, was released by Government on 16 July 2014;10 the second report, the
Independent Cost Benefit Analysis of Broadband, was released by Government on 27 August 2014;11
and, the third report, the National Broadband Network Market and Regulation Report, was released by
Government on 1 October 2014.12 At the date of this Corporate Plan, the Government is continuing to
examine these reports and their recommendations.
� The Scales Public Policy Review, which Terms of Reference included auditing the public policy process
that led to the NBN and NBN Co’s governance and making recommendations on what future actions
should be taken by the Government when considering major projects such as the NBN. This review was
announced on 7 March 2014 and the report was tabled in Parliament on 4 August 2014.13
3.2 The April 2014 Statement of Expectations
On 8 April 2014, NBN Co’s Shareholder Ministers issued a new Statement of Expectations (April 2014
Statement of Expectations) to NBN Co which replaces the Previous SoE and Interim SoE.14 The April 2014
Statement of Expectations outlines the Government’s commitment to the NBN in delivering “very fast
broadband as soon as possible, at affordable prices, and at least cost to taxpayers”. To achieve this
objective, the NBN should be built in a cost-effective way utilising the access technology (Access
Technology) most appropriate in each area of Australia. That is, the April 2014 Statement of Expectations
provides NBN Co:
“With flexibility and discretion in operational, technology and network design decisions, within the
constraints of a public equity capital limit of $29.5 billion specified in its funding agreement with the
Commonwealth, and the Government’s broadband policy objectives.”
In addition, the April 2014 Statement of Expectations specifies that the NBN will operate as a wholesale-only
access network available on equivalent terms to all Service Providers, operating in the lowest practical level
in the network stack. The Government states its expectation that the completion of the NBN will result in the
structural separation of Telstra, and a competitive market for retail broadband and telephony services.
The April 2014 Statement of Expectations reiterates NBN Co’s transition goals to avoid service disruptions,
minimise the impacts and uncertainty for contractors, and achieve the rollout objectives as cost effectively
and seamlessly as possible.
9 Broadband Availability and Quality Report – February 2014.
https://www.mybroadband.communications.gov.au/upload/documents/Final_report.pdf 10 http://www.communications.gov.au/broadband/national_broadband_network/cost-
benefit_analysis_and_review_of_regulation/panel_reports_to_government 11 http://www.communications.gov.au/broadband/national_broadband_network/cost-
benefit_analysis_and_review_of_regulation/independent_cba_of_broadband 12 http://www.communications.gov.au/broadband/national_broadband_network/cost-
benefit_analysis_and_review_of_regulation/nbn_market_and_regulation_report 13 http://www.aph.gov.au/~/media/02%20Parliamentary%20Business/22%20Chamber%20Documents/223%20Tabled%20Papers/
Documents%20Presented/Out%20of%20session/040814_audit_report 14 Refer footnote 2 above.
NBN Co Limited 11 November 2014
Corporate Plan 2014-17 Page 9 of 60
The April 2014 Statement of Expectations specifies the Government’s decision to transition the NBN from a
primarily Fibre-To-The-Premises model to the Multi-Technology Mix model, having due regard to the
following outstanding policy and commercial issues:
� NBN Co will determine which technologies are utilised on an area-by-area basis so as to minimise peak
funding, optimise economic returns and enhance NBN Co’s viability.
� The design of an MTM will be guided by the Government’s policy objectives of providing download data
rates (and proportionate upload rates) of at least 25 Megabits per second (Mbps) to all Premises and at
least 50 Megabits per second to 90% of Fixed Line (FL) Premises as soon as possible.15
� NBN Co will ensure upgrade paths are available as required.
� NBN Co will prioritise areas identified as poorly served by the ‘Broadband Availability and Quality Report’
published by the Department of Communications in February 2014 (including any subsequent
refinements arising from additional data) to the extent commercially and operationally feasible.
� NBN Co will ensure that the business rules it establishes to determine which technology is utilised in
each locality are transparent to the community and periodically updated to reflect technological and
commercial developments.
� As proposed by the Strategic Review, NBN Co will integrate existing HFC Cable Networks into the rollout
where this is feasible and economically beneficial, and provide for wholesale-only, open access
operation of these networks.
� NBN Co will trial Fibre-to-the-x (FTTx) network architectures to inform the Company’s planning and
decisions.
� NBN Co will take proportionate responsibility for the quality, consistency and continuity of service
experienced by the Retail Service Providers and their End-Users.
� The Government expects NBN Co will contribute leadership and resources to the industry-wide
challenge of migrating services to the NBN.
� NBN Co’s Board and Management will monitor the capabilities required to implement a Multi-Technology
Mix NBN, and ensure alignment between these capabilities and NBN Co’s personnel.
The April 2014 Statement of Expectations also outlines the Government’s expectations in terms of the high
level of transparency in NBN Co’s communication with the public and Parliament, including: weekly online
reporting of network deployment and active services, monthly reports to Shareholder Ministers, quarterly
financial and operational reports to Parliament, and quarterly management briefings to stakeholders and the
media.
15 NBN Co is designing the MTM part of the NBN to be capable of delivering these speeds to NBN Co’s RSPs and WSPs via Fixed
Line. Speeds actually achieved by End-Users will depend on a number of factors including the quality of their equipment and in-
premises connection, the broadband plans offered by their Service Provider and how their Service Provider designs its network to cater
for multiple End-Users.
NBN Co Limited 11 November 2014
Corporate Plan 2014-17 Page 10 of 60
4 Broadband Trends
4.1 Broadband Market The Australian Fixed Line broadband market grew 6% to 6.2 million subscribers in the financial year to 30
June 2014.16 Fixed broadband penetration has reached an estimated 61% of occupied Premises in 2014
(2013: 58%).17
The majority of Australians receive their Fixed Line broadband services through copper-based Asymmetric
Digital Subscriber Line (ADSL) services, which accounted for approximately 82% of subscribers in June
2014. HFC Cable Networks accounted for a further 15%, with Fibre-based services accounting for about
3%.16
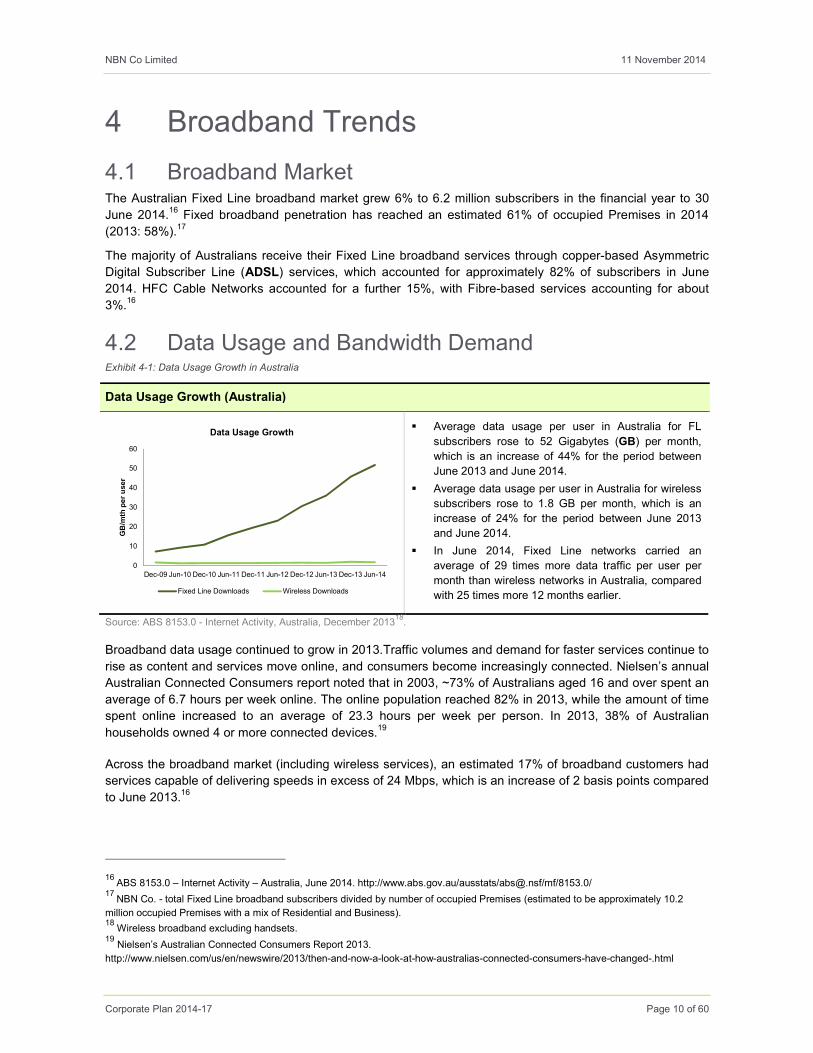
4.2 Data Usage and Bandwidth Demand Exhibit 4-1: Data Usage Growth in Australia
Data Usage Growth (Australia)
� Average data usage per user in Australia for FL
subscribers rose to 52 Gigabytes (GB) per month,
which is an increase of 44% for the period between
June 2013 and June 2014.
� Average data usage per user in Australia for wireless
subscribers rose to 1.8 GB per month, which is an
increase of 24% for the period between June 2013
and June 2014.
� In June 2014, Fixed Line networks carried an
average of 29 times more data traffic per user per
month than wireless networks in Australia, compared
with 25 times more 12 months earlier.
Source: ABS 8153.0 - Internet Activity, Australia, December 201318.
Broadband data usage continued to grow in 2013.Traffic volumes and demand for faster services continue to
rise as content and services move online, and consumers become increasingly connected. Nielsen’s annual
Australian Connected Consumers report noted that in 2003, ~73% of Australians aged 16 and over spent an
average of 6.7 hours per week online. The online population reached 82% in 2013, while the amount of time
spent online increased to an average of 23.3 hours per week per person. In 2013, 38% of Australian
households owned 4 or more connected devices.19
Across the broadband market (including wireless services), an estimated 17% of broadband customers had
services capable of delivering speeds in excess of 24 Mbps, which is an increase of 2 basis points compared
to June 2013.16
16 ABS 8153.0 – Internet Activity – Australia, June 2014. http://www.abs.gov.au/ausstats/[email protected]/mf/8153.0/
17 NBN Co. - total Fixed Line broadband subscribers divided by number of occupied Premises (estimated to be approximately 10.2
million occupied Premises with a mix of Residential and Business). 18 Wireless broadband excluding handsets.
19 Nielsen’s Australian Connected Consumers Report 2013.
http://www.nielsen.com/us/en/newswire/2013/then-and-now-a-look-at-how-australias-connected-consumers-have-changed-.html
0
10
20
30
40
50
60
Dec-09 Jun-10 Dec-10 Jun-11 Dec-11 Jun-12 Dec-12 Jun-13 Dec-13 Jun-14
GB/mth per user
Data Usage Growth
Fixed Line Downloads Wireless Downloads
NBN Co Limited 11 November 2014
Corporate Plan 2014-17 Page 11 of 60
5 NBN Co’s Strategic Direction The April 2014 Statement of Expectations provides NBN Co with the flexibility and discretion to make
technology and network design decisions with an overall aim to constrain costs and accelerate the rollout of
the NBN.
This is in line with the Strategic Reviews, which recommended delivering the Government’s policy through
the rollout of a ‘network of networks’ interconnecting Fibre to the Premises (FTTP), Fibre to the Node
(FTTN), Hybrid Fibre Coaxial (HFC), Fibre to the Distribution Point (FTTdp), Fibre to the Basement (FTTB),
as well as Satellite and Fixed Wireless Networks (described altogether as the Multi-Technology Mix or MTM).
Implementing the MTM has a number of organisational challenges including network planning and design,
product development, IT systems and processes, procurement of new equipment and negotiating new
commercial arrangements.
In order to meet these challenges, NBN Co has developed a new Strategic Direction that is progressively
being embedded in the organisation.
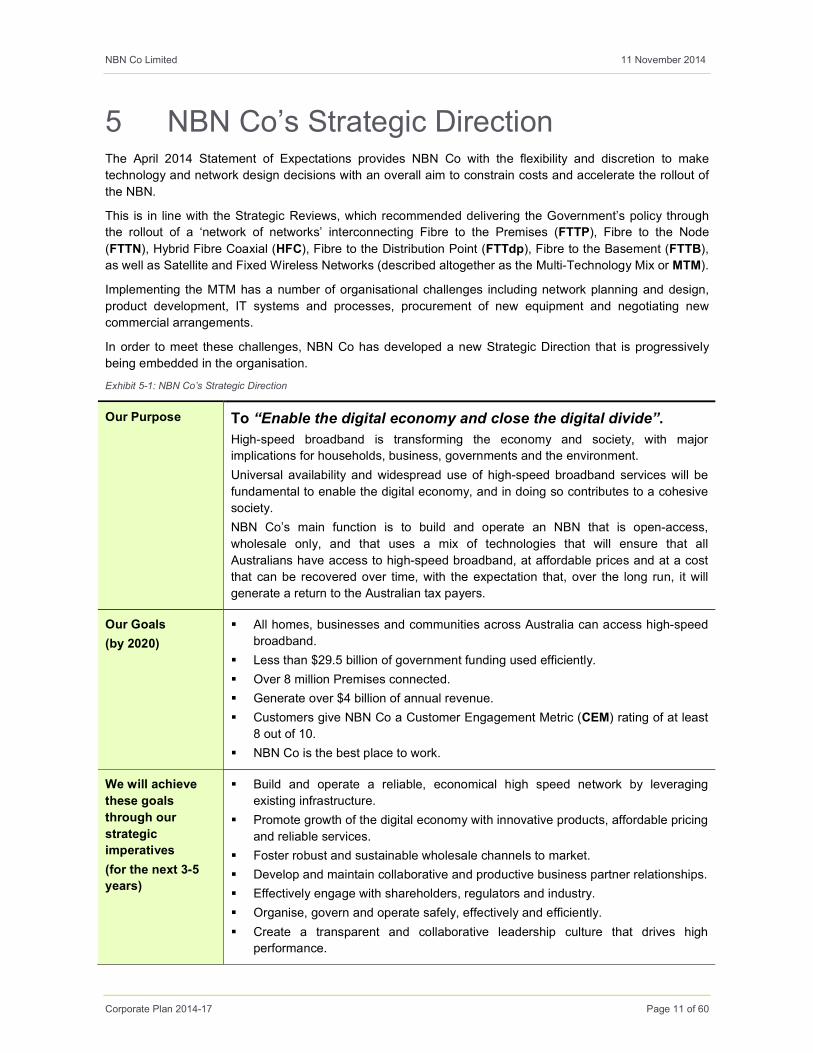
Exhibit 5-1: NBN Co’s Strategic Direction
Our Purpose
To “Enable the digital economy and close the digital divide”.
High-speed broadband is transforming the economy and society, with major
implications for households, business, governments and the environment.
Universal availability and widespread use of high-speed broadband services will be
fundamental to enable the digital economy, and in doing so contributes to a cohesive
society.
NBN Co’s main function is to build and operate an NBN that is open-access,
wholesale only, and that uses a mix of technologies that will ensure that all
Australians have access to high-speed broadband, at affordable prices and at a cost
that can be recovered over time, with the expectation that, over the long run, it will
generate a return to the Australian tax payers.
Our Goals
(by 2020)
� All homes, businesses and communities across Australia can access high-speed
broadband.
� Less than $29.5 billion of government funding used efficiently.
� Over 8 million Premises connected.
� Generate over $4 billion of annual revenue.
� Customers give NBN Co a Customer Engagement Metric (CEM) rating of at least
8 out of 10.
� NBN Co is the best place to work.
We will achieve
these goals
through our
strategic
imperatives
(for the next 3-5
years)
� Build and operate a reliable, economical high speed network by leveraging
existing infrastructure.
� Promote growth of the digital economy with innovative products, affordable pricing
and reliable services.
� Foster robust and sustainable wholesale channels to market.
� Develop and maintain collaborative and productive business partner relationships.
� Effectively engage with shareholders, regulators and industry.
� Organise, govern and operate safely, effectively and efficiently.
� Create a transparent and collaborative leadership culture that drives high
performance.

NBN Co Limited 11 November 2014
Corporate Plan 2014-17 Page 12 of 60
Our values will be
central to our
success
� We are Safe, Disciplined and Reliable and meet our commitments.
� We engender Trust and Integrity and are known for this.
� We are Authentic, speak-up and involve both ourselves and others.
� We are Collaborative - one team focused on outcomes.
� We are Flexible to fit our circumstances.
Source: NBN Co.
NBN Co Limited 11 November 2014
Corporate Plan 2014-17 Page 13 of 60
6 Implementing the Strategic Direction
6.1 Multi-Technology Mix
The December 2013 Strategic Review considered a number of scenarios and recommended Scenario 6 –
Multi-Technology Mix as the preferred option to achieve NBN Co’s goals.
Scenario 6 (MTM) identified a potential technology mix with the objective to minimise peak funding, while
delivering a 50 Mbps download data rate to a high proportion of the Fixed Line footprint (~90% by 2019). For
the remaining ~10% of Premises not served with a 50 Mbps download data rate by 2019, it will be served
with 25 Mbps download data rate.20 The MTM scenario allocates technology in order to meet these criteria.
In addition, the May 2014 Fixed Wireless and Satellite Strategic Review outlined a deployment in the non-
Fixed Line footprint that is based on the potential use of FTTN and seeks to optimise the mix of Fixed
Wireless and Satellite technologies, such that the risk of congestion in oversubscribed beams is relieved,
cost is minimised and the average product available is maximised to all potential End-Users.
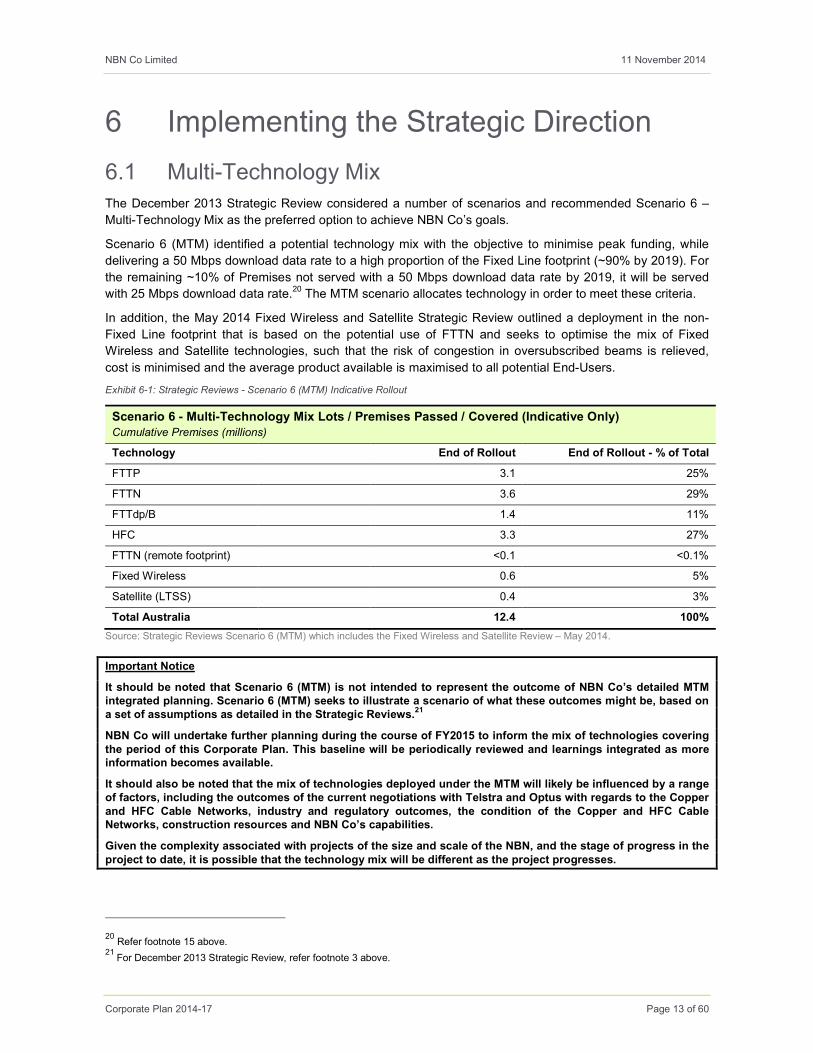
Exhibit 6-1: Strategic Reviews - Scenario 6 (MTM) Indicative Rollout
Scenario 6 - Multi-Technology Mix Lots / Premises Passed / Covered (Indicative Only) Cumulative Premises (millions)
Technology End of Rollout End of Rollout - % of Total
FTTP 3.1 25%
FTTN 3.6 29%
FTTdp/B 1.4 11%
HFC 3.3 27%
FTTN (remote footprint) <0.1 <0.1%
Fixed Wireless 0.6 5%
Satellite (LTSS) 0.4 3%
Total Australia 12.4 100%
Source: Strategic Reviews Scenario 6 (MTM) which includes the Fixed Wireless and Satellite Review – May 2014.
Important Notice
It should be noted that Scenario 6 (MTM) is not intended to represent the outcome of NBN Co’s detailed MTM integrated planning. Scenario 6 (MTM) seeks to illustrate a scenario of what these outcomes might be, based on a set of assumptions as detailed in the Strategic Reviews.
21
NBN Co will undertake further planning during the course of FY2015 to inform the mix of technologies covering the period of this Corporate Plan. This baseline will be periodically reviewed and learnings integrated as more information becomes available.
It should also be noted that the mix of technologies deployed under the MTM will likely be influenced by a range of factors, including the outcomes of the current negotiations with Telstra and Optus with regards to the Copper and HFC Cable Networks, industry and regulatory outcomes, the condition of the Copper and HFC Cable Networks, construction resources and NBN Co’s capabilities.
Given the complexity associated with projects of the size and scale of the NBN, and the stage of progress in the project to date, it is possible that the technology mix will be different as the project progresses.
20 Refer footnote 15 above.
21 For December 2013 Strategic Review, refer footnote 3 above.
NBN Co Limited 11 November 2014
Corporate Plan 2014-17 Page 14 of 60
6.2 Next Steps in Implementing the MTM
NBN Co has commenced a number of next steps, and will need to undertake major activities, transformation
and decision points in the next 12 to 18 months in implementing the MTM, including:
� Engage with the Government / produce new Corporate Plan / engage with stakeholders in relation to
potential policy decisions and regulatory changes.
� Mobilise the transformation agenda / whole of business operating model.
� Implement the MTM construction delivery model, including ongoing operational improvements to the
FTTP construction delivery model.
� Implement multi-technology network architecture, planning approach and network design principles.
� Commence and / or continue discussions and renegotiations with Telstra and / or Optus, vendors,
contractors (Delivery Partners) and Service Providers.
� Undertake a review of Fixed Wireless and Satellite. The Fixed Wireless and Satellite Review (completed
in May 2014) considered a number of next steps, including pursuing multiple pathways to secure
spectrum.
� Undertake MTM IT capability and network operations improvements.
� Focus on people and organisation / Implement ongoing organisation and culture change.
� Implement a revised governance approach.
� Engage and consult widely with stakeholders and regulatory authorities.
All of these next steps, activities, and decision points have significant dependencies. Most of these are a
combination of activities and decisions from NBN Co but they are also highly dependent on processes,
consultations, negotiations, and external approvals external to NBN Co. All of these, due to their strategic
and operational importance, will be highly influential to achieving the MTM objectives and timelines as
envisaged in Scenario 6 of the Strategic Reviews.
The Government announced the Vertigan Cost-Benefit Review on 12 December 2013. The Terms of
Reference of this review includes a requirement of recommendations on the way NBN Co’s activities should
be constrained given its mandate to efficiently build, operate and maintain a wholesale-only access network.
In particular, “this should include consideration of the issues associated with infrastructure based competition
and the economic benefit of alternatives; [and] recommendations should be made on the structure of the
Australian wholesale broadband market, including regulatory arrangements.”22
The Government’s policy decisions from the recommendations of the review may impact the announced
plans of market participants in rolling out alternative broadband infrastructure, such as FTTB infrastructure to
Multi-Dwelling Units.
NBN Co has engaged proactively with the review process, including making a number of submissions.23
NBN Co’s objective is to ensure that Government decisions in relation to the review’s recommendations are
made on an appropriately informed basis as to the implications of those recommendations for NBN Co’s
ability to implement the April 2014 Statement of Expectations.
22 Independent Cost-Benefit Analysis and Review of Regulation Terms of Reference.
http://www.communications.gov.au/__data/assets/pdf_file/0019/207046/NBN_Panel_of_Experts_-_Terms_of_Reference.pdf 23 Independent Cost-Benefit Analysis and Review of Regulation, Supplementary submission of NBN Co to Expert Panel in response to
the Regulatory Issues Framing Paper issued 13 February 2014.
http://www.communications.gov.au/__data/assets/pdf_file/0011/224201/NBN_Co_-_Supplementary_Submission.pdf
Independent Cost-Benefit Analysis and Review of Regulation, Submission of NBN Co to Expert Panel in response to the Consultative
Paper for the Purposes of Section 152EOA of the Competition and Consumer Act 2010.
http://www.communications.gov.au/__data/assets/pdf_file/0010/224110/NBN_Co_Submission_combined.pdf
NBN Co Limited 11 November 2014
Corporate Plan 2014-17 Page 15 of 60
6.3 Transformation Initiatives
NBN Co’s Strategic Direction identified the major initiatives that need to be delivered in the next 12-18
months to drive forward NBN Co’s strategic imperatives. NBN Co has established a number of governance
bodies to focus and deliver on these initiatives.
Initially, the Company reviewed all major projects to assess their alignment with the new Strategic Direction
and to map the existing set of functional relationships and governance structures. Based on this work and in
collaboration with NBN Co’s functional areas, a high level Transformation Roadmap was developed. This
roadmap included the definition and implementation of a governance and decision-making structure to guide
future work on transformation. Subsequently, the major initiatives needed to drive the transformation agenda
have been developed and are listed below:
� Build a Great Place to Work.
� Process Performance.
� Negotiate and Secure the Telstra Deal.
� Negotiate and Secure the Optus Deal.
� Optimise our Operating Expenses.
� Implement Multi-Technology Mix Planning.
� Implement Recommendations for Long Term Satellite Services (LTSS) Deployment.
� Deliver on the Service Forecast Commitments to NBN Co’s Customers.
� Strategic Contracting Model (Industry Management).
� Service Class Matters.
� Business Model.
The above initiatives are being tracked through milestones and regular updates within the Company’s new
governance structure. Significant progress is expected to be made over the next 12-18 months; some of the
initiatives are dependent on outcomes of commercial negotiations and / or external dependencies, which are
detailed in Section 9.2, Major Corporate Plan Assumptions, below.
6.4 Implementing the MTM Access Technologies
Beginning in FY2015, NBN Co is considering the best way to implement the design of an MTM guided by the
Government’s policy objectives of providing download data rates (and proportionate upload rates) of at least
25 Mbps to all Premises and at least 50 Mbps to 90% of Fixed Lined Premises as soon as possible.24 NBN
Co will determine which technologies are utilised on an area-by-area basis with an objective to rollout at
scale in the shortest timeframe possible, minimise peak funding and optimise economic returns.
Subject to the Corporate Plan assumptions detailed in Section 9.2, Major Corporate Plan Assumptions, NBN
Co expects to deliver on the April 2014 Statement of Expectations requirements in FY2015 by:
� Conducting all the activities necessary to stabilise the FTTP and Fixed Wireless rollouts, including the
ramp in connections and activations in the context of upcoming Disconnection Dates. These activities
will continue to absorb significant management attention, require major Delivery Partner engagement,
and it will remain a major challenge to ramp up construction, connections and activations as per the
FY2015 Estimates.
� Conducting trials and build pilots for FTTN, FTTB and HFC Cable Networks.
24 Refer footnote 15 above.
NBN Co Limited 11 November 2014
Corporate Plan 2014-17 Page 16 of 60
� Implementing the MTM product and pricing reviews.
� Preparing for rolling out the MTM NBN at scale. This represents a major construction delivery and
migration / cutover challenge that will require significant Delivery Partner engagement and is dependent
on the implementation of a number of prerequisites (such as network architecture, integrated planning,
operational delivery model, and IT systems).
In addition, NBN Co will focus on the following objectives in order to meet the April 2014 Statement of
Expectations requirements:
� Prioritise areas identified as poorly served by the Broadband Availability and Quality Report25 to the
extent commercially and operationally feasible.
� Ensure the business rules established to determine which technology is utilised in each locality are
transparent to the community, and periodically updated to reflect technological and commercial
developments.
� Anticipating integration of existing HFC Cable Networks into the rollout where this is feasible and
economically beneficial, and provide for wholesale-only, open access operation of these.
� Take proportionate responsibility for the quality, consistency and continuity of service experienced by the
Retail Service Providers and their End-Users.
� Seek to meet Government expectations that NBN Co will contribute leadership and resources to the
industry-wide challenge of migrating services to the NBN.
� Monitor the capabilities required to implement the MTM and ensure alignment between these and the
Company’s personnel.
6.4.1 FTTP and Fixed Wireless Rollouts in FY2015
For the FTTP rollout, NBN Co plans to continue the progressive ramp up in construction activities. One major
area of focus will be to significantly increase the serviceability levels of Premises in the existing FTTP
footprint as well as for the release of new FTTP footprint. This strategic imperative is further detailed in
Section 8.7.4, Serviceability Improvement Programme for FTTP Access Network (Brownfields Premises).
In addition, starting in FY2015 and on a continuing basis, NBN Co plans to continue to make changes to the
construction delivery model, including continued simplification and standardisation of the deployment
process with clear design rules, standardised specifications and processes, an industry-standard design
environment and a relevant construction methodology and operating manual for contractors on the ground.
NBN Co is currently working through the potential implementation of redesigned FTTP model as outlined in
the Strategic Reviews. Currently, the main potential elements of the redesign are:
� Architecture and materials including reducing the number of allocated fibres per Premises, increased
use of aerial deployment, removal of Passive Optical Network (PON) protection, using smaller diameter
fibre cables, use of gel-free cables and optional battery back-up for the Network Termination Device
(NTD) where the End-User must provide their informed consent in order to opt-out.
� Construction techniques including equipment for testing duct congestion, aerial extension methods
and alternative customer drop implementation techniques optimising fibre testing at multiport and usage
of direct bury cable.
In terms of the Fixed Wireless deployment, the focus in FY2015 is intended to progress the Fixed Wireless
build program to realise cost reductions, and to pursue multiple pathways to secure spectrum for outer metro
areas.
25 For February 2014 Broadband Availability and Quality Report, refer footnote 9 above.
NBN Co Limited 11 November 2014
Corporate Plan 2014-17 Page 17 of 60
6.4.2 The FTTN Pilot
NBN Co is employing a two phased approach to piloting FTTN as part of implementing the MTM. The focus
of the pilots is to develop the necessary capability and competency to transition to an FTTN rollout at scale.
Phase one of the pilot consists of an FTTN build component and a product development component to
develop the systems, processes and capabilities for a scale rollout. In March 2014, NBN Co completed the
first fully powered node in a Copper Service Area Modules (CSAM) in Umina on NSW’s Central Coast, which
was integrated into the NBN in April 2014. At present there are 11 nodes that are active as part of the Phase
one trial, with a final aim of 20 nodes and the use of spare copper pairs connecting End-User Premises. The
first in-Premises test (un-vectored) delivered a raw download speed of 105 Mbps and a raw upload speed of
45 Mbps.26
The second component (under phase one) is aimed at product development. It involves NBN Co inviting
Service Providers to participate in the development of the NBN Co FTTN wholesale product. In parallel with
the pilot program, NBN Co has released The FTTN/B Initial Product Consultation Paper on 4 April 2014 to
solicit feedback regarding the proposed constructs via the members of the Product Development Forum.
Phase two is aimed at constructing approximately 1,000 FTTN nodes to develop robust and scalable
construction methods and procedures to further refine the delivery model for mass rollout.
Following completion of Phase two, it is anticipated that End-User connections and activations will take place
during the course of CY2015.
6.4.3 The FTTB Pilot
The objective of the FTTB Pilot will be to develop a technologically and commercially sustainable service for
Multi-Dwelling Units (MDUs), predominantly in the FTTN footprint.
FTTB involves deploying fibre to MDUs connected to the NBN, using Very-High-Bit-Rate Digital Subscriber
Line (VDSL) technology in the basement (or communications room) to provide high-speed broadband. The
existing in-building wiring is used as the final connection to the End-User Premises from the equipment in the
MDU basement.
NBN Co commenced the FTTB Pilot in January 2014 and is currently working with three Service Providers
(Telstra, iiNet, and M2) to trial pilot services in Carlton, Parkville and Brunswick in Victoria. The aim is to pilot
services in residential MDUs and commercial Premises where NBN Co Digital Subscriber Line Access
Multiplexer (DSLAMs) are deployed in buildings. The FTTB Pilot will include approximately 50 End-Users
with a focus on residential End-Users (although the aim is to connect some small businesses if possible) that
have no critical or special services (e.g. personal medical alarms, EFTPOS, lifts or fire panels).
As part of the FTTB Pilot, NBN Co is making a range of wholesale speed tiers available to Retail Service
Providers: 12/1, 25/5, 25/10, up to 50/20 and up to 100/40 Mbps.27 The actual speeds achieved by End-
Users will depend on a number of factors including the quality of in-building and copper cabling and will be
tracked as part of the pilot to help refine product offerings.
6.4.4 Prioritisation of Underserved Areas
The April 2014 Statement of Expectations directs NBN Co to “prioritise areas identified as poorly served by
the “Broadband Availability and Quality Report” published by the Department of Communications in February
2014 [...] to the extent commercially, and operationally feasible.”
The Department of Communications’ report presents the analysis of broadband quality and availability in all
areas of Australia. Department of Communications’ analysis found that there are approximately 1.6 million
26 Technology trial conducted in Umina, near Woy Woy, NSW – node cabinet approximately 100 metres from connected shopfront.
27 Refer footnote 15 above.
NBN Co Limited 11 November 2014
Corporate Plan 2014-17 Page 18 of 60
Premises in areas which can be categorised as not having access to adequate broadband services - NBN
Co may designate these areas as underserved. The Premises in this category are mostly located in regional
or remote areas of Australia, or in small pockets of poor service in metropolitan and outer metropolitan areas.
In accordance with the April 2014 Statement of Expectations, NBN Co’s rollout of the MTM will prioritise
underserved areas to the extent commercially and operationally feasible. It is estimated that, overall, the
FTTP construction planned to commence in FY2015 will pass more than the proportionate amount of
underserved Premises in these areas.
6.4.5 NBN Co’s Rollout to High Value End-Users
The Government’s policy decisions from the recommendations of the Vertigan Cost-Benefit Review may
impact the announced plans of market participants in rolling out FTTB infrastructure to Multi-Dwelling Units.
NBN Co has announced its intention to serve high-value End-Users in inner city apartments and office
buildings by bringing forward the rollout of the NBN in these areas, to the extent commercially and
operationally feasible.
NBN Co’s accelerated rollout in these areas is intended to attract high value End-Users who will also benefit
from the competitive market the NBN enables when they purchase broadband, telephone or other services
from the Service Provider of their choice. NBN Co is in the process of planning the rollout of the NBN for
these areas.
6.4.6 Further Policy Decisions under Consideration
NBN Co will continue to work closely with the Government and the Shareholder Minister Departments with
regards to the implementation of the Multi-Technology Mix NBN. NBN Co will implement the Multi-
Technology Mix NBN in light of the April 2014 Statement of Expectations and subsequent Shareholder
Ministers’ correspondence and instructions.
A number of policy issues were already identified by the Shareholder Ministers in the April 2014 Statement of
Expectations and further correspondence from the Shareholder Ministers; these include:
� Pricing and implications for take up.
� Rollout scheduling and prioritisation of poorly served areas.
� Qualification, financing, installation and maintenance of customer premises equipment.
� Battery backup.
� Delivery of voice services.
� Customer migration and decommissioning of infrastructure.
� Migration of services.
� Future upgrade paths.
� Opportunities for co-funded network investment in the NBN.
The timeline to assess how these policy issues will influence the cost, delivery and performance of a Multi-
Technology Mix NBN will be developed in close cooperation with NBN Co’s Shareholder Minister
Departments and will factor in NBN Co’s operational priorities to achieve the Strategic Direction and the
other activities undertaken by NBN Co to implement the MTM.
NBN Co will continue to engage with its Shareholder Ministers, regulators, major stakeholders, and the
industry, in relation to these issues. Outcomes will be factored into future Corporate Plans.

NBN Co Limited 11 November 2014
Corporate Plan 2014-17 Page 19 of 60
6.5 Products Roadmap
As part of the MTM approach, NBN Co will build, deploy and operate products across multiple technologies,
which now also include FTTN, FTTB and HFC Access Technologies. NBN Co is in the process of developing
these new FTTN/B and HFC-based products in consultation with industry. In April 2014, NBN Co released a
FTTN/B product industry consultation paper, which proposed a product construct and sought feedback on
issues such as speed tiers, voice services, migration models and in home equipment. A similar paper will be
circulated to the industry on HFC in the third quarter of CY2014.
NBN Co releases a quarterly ‘Integrated Product Roadmap’28 to inform providers of when future products
and features are scheduled to be launched. The roadmap expands on NBN Co’s Initial Roadmap, and sets
out the scope and targeted timelines in relation to NBN Co’s currently planned products, product components
and product feature releases. The aim of the Integrated Product Roadmap is to provide a co-ordinated view
of customer experience, IT enhancements and on-boarding developments with the details of the product
feature releases.
During FY2015, NBN Co plans to release and on-board customers for the following developments and
features:
1) MTM Trials and Product Launches: Pilots / Trials of the FTTN/B and HFC product variants, as well as
the initial releases of these products. The exact launch timings for the FTTN/B and HFC products are still
being decided and will be presented to the industry as soon as possible. The launch timings will be
dependent upon concluding negotiations with a number of third parties and executing a number of
agreements.
2) Long-Term Satellite Product Launch: The Satellite programme, which consists of several elements; the
augmentation of capacity of the Interim Satellite Service (ISS); a proposed new subsidy scheme for new
End-Users prior to the launch of the Long-Term Satellite offering; and the completion of the Long Term
Satellite Service product build.
3) Additional Product Features: CY2015 will also see NBN Co’s optional battery backup feature becoming
mandatory on the FTTP platform (from 1 October 2014), the development of an automated process for FTTP
transfers between customers to assist the retail churn process, as well as additional product improvements
around reporting, Connectivity Virtual Circuit (CVC) speed tiers and features on the UNI-V.
4) Cell Site Access Service: NBN Co is also currently conducting a trial where the FTTP network is being
used to connect the cell-sites of existing mobile network providers. This trial is being used to inform a future
‘Cell Site Access Service’ product variant. The trial is seeking to understand what modifications will need to
be made to the existing FTTP offering to cater to the needs of mobile networks.
5) Pricing Review: NBN Co has commenced a detailed pricing review on the existing products of Access
Virtual Circuit (AVC) and CVC construct. The review is focused on seeking to maintain a consistent pricing
construct across the different MTM Fixed Line technologies. In addition, the Fixed Wireless and Satellite
Review made recommendations on the product and pricing constructs of these Access Technologies. NBN
Co will be considering the best ways to implement those recommendations in early FY2015.
For each product release and pricing review, NBN Co conducts consultation with customers, prospective
customers and relevant consumer advocacy groups via the Product Development Forum. The Product
Development Forum will be used to inform product requirements and understand provider and End-User
needs.
28 NBN Co Integrated Product Roadmap – July 2014.
http://www.nbnco.com.au/content/dam/nbnco/documents/Integrated-Product-Roadmap.pdf
NBN Co Limited 11 November 2014
Corporate Plan 2014-17 Page 20 of 60
7 Business Overview
7.1 NBN Co’s Organisation
7.1.1 NBN Co Board and Leadership
Major changes have taken place to the composition of NBN Co’s Board and the Executive team. This
process began with the appointment of Dr Ziggy Switkowski as Executive Chairman29 in October 2013 with
NBN Co’s founding Chief Executive Officer and Executive Director Mike Quigley leaving NBN Co following a
transition period.30
Bill Morrow was appointed Chief Executive Officer of NBN Co in December 2013 and Managing Director in
March 2014. Both appointments took effect on 2 April 2014. Following Bill Morrow taking up his role as CEO,
Dr Switkowski’s role as Executive Chairman reverted to that of Non-Executive Chairman.
Following the resignation and the departure of a number of Board members, three new non-Executive
directors were appointed by the Shareholder Ministers on 11 November 2013. The NBN Co Board of
Directors and Executive team are detailed below.
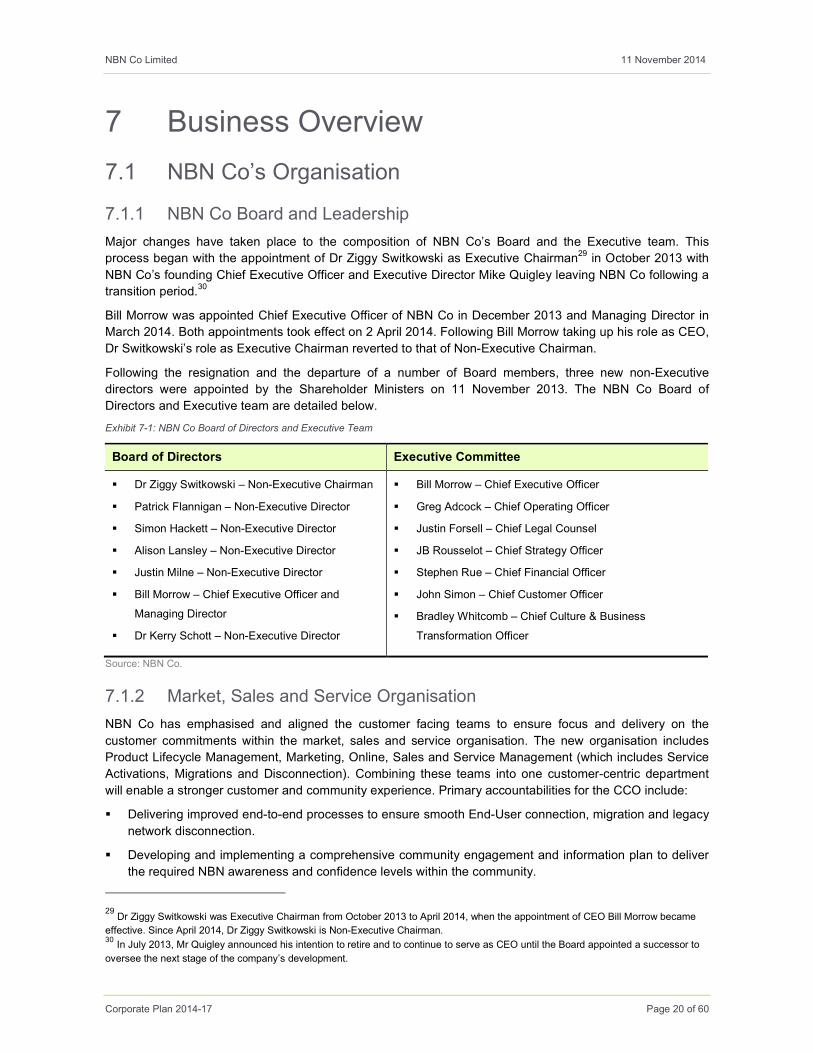
Exhibit 7-1: NBN Co Board of Directors and Executive Team
Board of Directors Executive Committee
� Dr Ziggy Switkowski – Non-Executive Chairman
� Patrick Flannigan – Non-Executive Director
� Simon Hackett – Non-Executive Director
� Alison Lansley – Non-Executive Director
� Justin Milne – Non-Executive Director
� Bill Morrow – Chief Executive Officer and
Managing Director
� Dr Kerry Schott – Non-Executive Director
� Bill Morrow – Chief Executive Officer
� Greg Adcock – Chief Operating Officer
� Justin Forsell – Chief Legal Counsel
� JB Rousselot – Chief Strategy Officer
� Stephen Rue – Chief Financial Officer
� John Simon – Chief Customer Officer
� Bradley Whitcomb – Chief Culture & Business
Transformation Officer
Source: NBN Co.
7.1.2 Market, Sales and Service Organisation
NBN Co has emphasised and aligned the customer facing teams to ensure focus and delivery on the
customer commitments within the market, sales and service organisation. The new organisation includes
Product Lifecycle Management, Marketing, Online, Sales and Service Management (which includes Service
Activations, Migrations and Disconnection). Combining these teams into one customer-centric department
will enable a stronger customer and community experience. Primary accountabilities for the CCO include:
� Delivering improved end-to-end processes to ensure smooth End-User connection, migration and legacy
network disconnection.
� Developing and implementing a comprehensive community engagement and information plan to deliver
the required NBN awareness and confidence levels within the community.
29 Dr Ziggy Switkowski was Executive Chairman from October 2013 to April 2014, when the appointment of CEO Bill Morrow became
effective. Since April 2014, Dr Ziggy Switkowski is Non-Executive Chairman. 30 In July 2013, Mr Quigley announced his intention to retire and to continue to serve as CEO until the Board appointed a successor to
oversee the next stage of the company’s development.

NBN Co Limited 11 November 2014
Corporate Plan 2014-17 Page 21 of 60
� Delivering the products and services across the MTM technologies according to the industry roadmap
agreed with NBN Co’s customers and representative industry bodies.
� Developing and implementing a holistic service and operation program that will enable NBN Co to
achieve a Customer Engagement Metric of 8 and above.
7.1.3 Network and IT Organisational Review
A review of the network and IT functions was initiated in the first quarter of CY2014 and provided
recommendations about organisational changes. It covered all aspects of the function’s operating model,
organisational structure, internal capability and interaction with internal and external stakeholders, including
Delivery Partners.
The new network operating model is designed to deliver:
� An integrated end-to-end delivery model with standardised work practices, processes and increased
automation to ensure efficient and effective delivery.
� Clear accountabilities, decision rights and core capabilities necessary to ensure effective delivery at all
levels.
� Flexibility to scale deployment as required and new technologies over time.
� An integrated end-to-end plan with appropriate metrics to manage performance.
The first step of the implementation was to appoint the leadership team under the new network and IT
structure. The focus over the next few months is to ensure that the new functions are integrated into the
organisation, the full organisational structure is finalised, and to start to operationalise major elements of the
delivery model.
7.2 NBN Co’s Organisation
7.2.1 Governance
The Board of Directors has ultimate responsibility for the performance of NBN Co and is accountable to the
Shareholder Ministers. The Board currently comprises six Non-Executive Directors and one Managing
Director appointed to provide a mix of skills and experience essential to guide NBN Co to successful delivery
of the NBN.
7.2.2 People and Policies
As at end of June 2014, NBN Co had a headcount of 2,932 employees31 (consisting of 2,875 employees, 8
contractors and 49 labour hires), which is an increase of 114 employees compared to FY2013. NBN Co
employs people in all states and territories of Australia. Permanent office locations include Sydney,
Melbourne, Hobart, Canberra, Brisbane, Townsville, Adelaide, Perth and Darwin.
NBN Co’s major human resource challenge has been to manage the rapid growth in the workforce required
to meet NBN Co’s needs. NBN Co has developed a suite of integrated policies, processes and systems to
support its staff and works closely with its employees and their representatives.
31 This is equivalent to approx. 2,918 Full Time Employees as at 30 June 2014.
NBN Co Limited 11 November 2014
Corporate Plan 2014-17 Page 22 of 60
NBN Co has developed a diversity framework encompassing NBN Co’s commitment to support all
employees, regardless of gender, physical, mental and intellectual abilities, race, ethnicity, age, sexual
orientation, socio-economic status, religious beliefs or professional background. NBN Co is committed to a
diverse workforce reflective of the wider communities in which NBN Co operates. This is an inclusive
environment that unifies NBN Co and recognises employees’ unique needs to utilise diverse talents, utilising
various business partners, and engaging the community.
NBN Co has recently conducted its first company-wide Employment Engagement Survey. The overall
measure of engagement behaviours has decreased from a score of 68% (based on the December 2012
pilot) to 44% (May 2014 results). The best employers are seeing scores around 80%. NBN Co is committed
to improving engagement levels and five main areas of focus have been identified: work practices; people
and their relationships; personal performance levels and career opportunities; organisational practices; and,
the overall reward system.
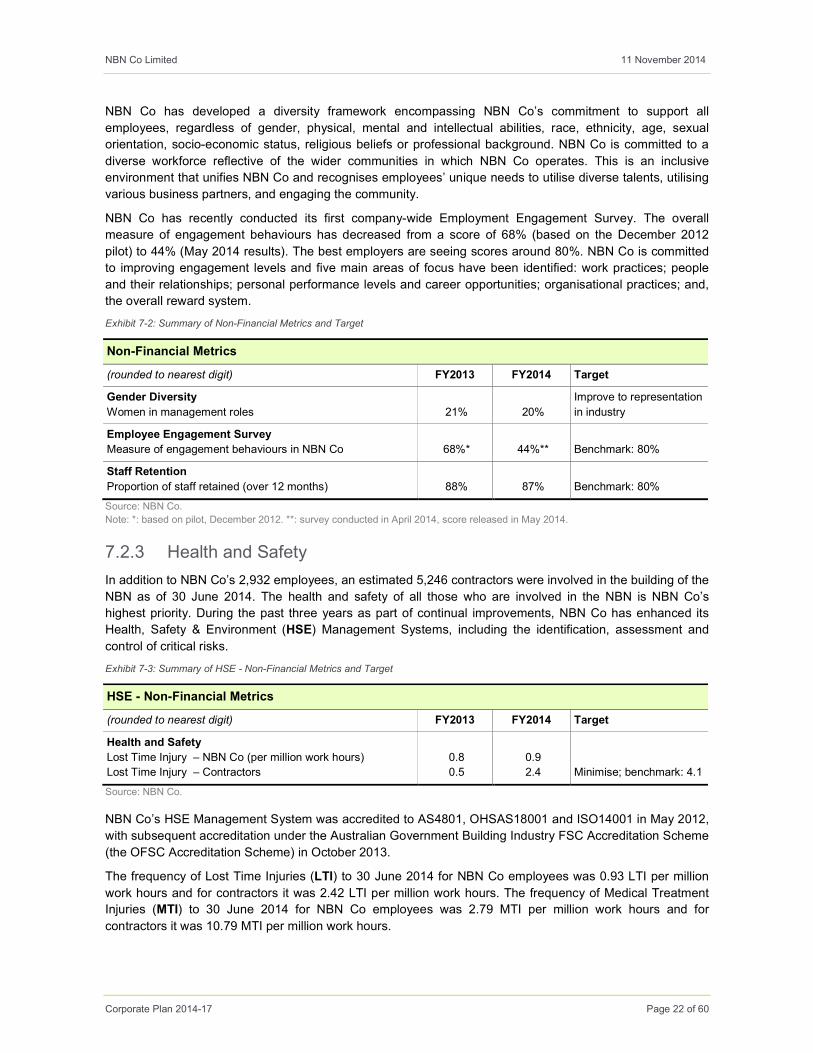
Exhibit 7-2: Summary of Non-Financial Metrics and Target
Non-Financial Metrics
(rounded to nearest digit) FY2013 FY2014 Target
Gender Diversity
Women in management roles
21%
20%
Improve to representation
in industry
Employee Engagement Survey
Measure of engagement behaviours in NBN Co
68%*
44%**
Benchmark: 80%
Staff Retention
Proportion of staff retained (over 12 months)
88%
87%
Benchmark: 80%
Source: NBN Co.
Note: *: based on pilot, December 2012. **: survey conducted in April 2014, score released in May 2014.
7.2.3 Health and Safety
In addition to NBN Co’s 2,932 employees, an estimated 5,246 contractors were involved in the building of the
NBN as of 30 June 2014. The health and safety of all those who are involved in the NBN is NBN Co’s
highest priority. During the past three years as part of continual improvements, NBN Co has enhanced its
Health, Safety & Environment (HSE) Management Systems, including the identification, assessment and
control of critical risks.
Exhibit 7-3: Summary of HSE - Non-Financial Metrics and Target
HSE - Non-Financial Metrics
(rounded to nearest digit) FY2013 FY2014 Target
Health and Safety
Lost Time Injury – NBN Co (per million work hours)
Lost Time Injury – Contractors
0.8
0.5
0.9
2.4
Minimise; benchmark: 4.1
Source: NBN Co.
NBN Co’s HSE Management System was accredited to AS4801, OHSAS18001 and ISO14001 in May 2012,
with subsequent accreditation under the Australian Government Building Industry FSC Accreditation Scheme
(the OFSC Accreditation Scheme) in October 2013.
The frequency of Lost Time Injuries (LTI) to 30 June 2014 for NBN Co employees was 0.93 LTI per million
work hours and for contractors it was 2.42 LTI per million work hours. The frequency of Medical Treatment
Injuries (MTI) to 30 June 2014 for NBN Co employees was 2.79 MTI per million work hours and for
contractors it was 10.79 MTI per million work hours.

NBN Co Limited 11 November 2014
Corporate Plan 2014-17 Page 23 of 60
NBN Co is particularly aware of asbestos hazards in the remediation of Telstra’s ageing pit and pipe
infrastructure that is being carried out by Telstra under the terms of the Telstra DAs. Under NBN Co’s
construction contracts it is a requirement that work be undertaken in accordance with all relevant Work
Health and Safety laws and Codes of Practice, including for example the Codes of Practice on managing,
controlling and safely removing asbestos.
7.2.4 Human Resources and Industrial Relations
NBN Co adheres to the Fair Work Principles and has four Enterprise Bargaining Agreements (EBAs), which
cover classifications of employees in the technical, professional, clerical / administration and contact centre
areas. These EBAs are in place and provide competitive terms and conditions for NBN Co employees
covered by the agreements. The EBAs are set to expire in CY2014, with the renewal process having
commenced.
NBN Co requires its contractors to be responsible employers who provide safe work environments and
efficient work practices taking into account legal requirements, all relevant market factors and business
operating conditions. NBN Co requires contractors engaged in the construction of the NBN to demonstrate
where applicable, ability to effectively manage employee relations matters including compliance with the Fair
Work Principles and National Code of Practice for the Construction Industry and the associated version of
the implementation guidelines.
NBN Co is taking a major role in scoping the labour pool required for the construction of the NBN and intends
to generate a range of programmes that will build NBN Co’s workforce in close cooperation with Delivery
Partners. NBN Co has identified the main qualifications required for this workforce and is developing a range
of training programmes including an NBN Co Safety and Awareness course that is currently undertaken by
applicable NBN Co construction workers. Externally, contracted NBN Co construction workers are intended
to be dispersed across the country providing opportunities for local employment.
NBN Co encourages its principal contracting partners to have in place management plans for local industry
engagement and indigenous participation. NBN Co plans to work with its partners to encourage
implementation and compliance with these plans.
7.2.5 Reconciliation Action Plan
NBN Co registered its first Reconciliation Action Plan with Reconciliation Australia in 2013. NBN Co’s vision
is to see a ‘connected community’ where Aboriginal and Torres Strait Islander people share equally in the
benefits of the NBN no matter where they live. The NBN technology is expected to positively impact
Aboriginal and Torres Strait Islander health and wellbeing through enhanced medical practices and
outcomes and increased access to education and training – especially in remote locations. The
Reconciliation Action Plan recognises there is much to learn and to do to close the gap between Aboriginal
and Torres Strait Islander people and the wider Australian community.
NBN Co’s plan outlines the actions to enhance relationships, respect and opportunities for Aboriginal and
Torres Strait Islander people over the next three years and includes the following aims:
� We will build respectful and sustainable relationships that enhance the participation of Aboriginal and
Torres Strait Islander people with the NBN mission. We will listen to Aboriginal and Torres Strait Islander
people and recognise their history, culture, land and heritage and respond in ways that promote
community value and business value.
� Recognise and respect Aboriginal and Torres Strait Islander history, cultures and heritage and ensure
the work we do makes a positive contribution toward supporting Aboriginal and Torres Strait Islander
people and communities.
� To build a connected community where Aboriginal and Torres Strait Islander people have enhanced
opportunities and share equally with other Australians the benefits the NBN network brings.
NBN Co Limited 11 November 2014
Corporate Plan 2014-17 Page 24 of 60
7.3 Information Technology and Operating the NBN
7.3.1 Information Technology
NBN Co requires interlocked systems in order to simultaneously construct, operate and maintain the NBN.
The Operational Support Systems (OSS) and the Business Support Systems (BSS) provide critical
capabilities to ensure that NBN Co is able to build, operate and maintain the network and to activate, assure
and bill for services provided. NBN Co’s objective is to ensure a good customer and End-User experience by
enabling its wholesale customers to be able to perform these tasks in the most efficient and effective way
possible with the maximum use of automation and self-serve processes. This ‘virtualised’ network concept
depends on heavy automation of routine processes (such as ordering, provisioning, service management,
billing, and deactivation) that are transacted through Business-to-Business (B2B) operational interfaces.
Through the period 2012-2014, the focus has been on establishing the core platforms that are intended to
deliver this virtualised network concept for NBN Co’s Service Providers and also enable NBN Co’s staff and
partners to improve productivity and efficiency.
In preparing for the MTM approach, it will be necessary to upgrade or replace some of NBN Co’s foundation
IT capabilities and systems. For OSS/BSS, the new operating model will necessitate a more effective
governance and planning process to align construction, IT and business change and modifying existing
OSS/BSS systems and associated operational processes to support FTTx, Copper, HFC, Fixed Wireless
and Satellite services. For example, this might include provision of data from Telstra and Optus for HFC
Cable Networks to address master data, adding modules to configure and enable layer 2 integration,
modifying systems to handle change, fault and order management integration with Telstra and / or Optus and
finally in-sourcing HFC inventory, activations, design, network management and assurance services onto
NBN Co OSS/BSS (over time).
The focus over the next 24 months will be the integration of core platform capabilities deeply into the
business and Access Technologies, whilst also assessing and executing on the adjustments required to
deploy the MTM model.
7.3.2 Operating the NBN
The day-to-day network operation of the NBN is handled by the Network and Service Operations Centre
(NSOC), which has been operational since June 2011. The NSOC provides network monitoring of the NBN
and a physical control location to house operations and systems to assist with:
� Managing and operating the network.
� Maintaining the network including rectifying network disruptions to facilitate Service Providers’ delivery of
services to their customers.
Through NBN Co’s end-to-end process development, the OSS is being developed to allow Service Providers
to submit orders and trouble tickets directly from their own systems via a B2B gateway. This is intended to
enable Service Providers to automate a large volume of End-User activations and assurance processes. A
service portal will remain available for Service Providers to use should they not have the capability to submit
automated requests through the B2B gateway.
For ongoing maintenance of the NBN, automated event management and alarm systems notify NBN Co of
faults in the network. For routine faults and maintenance, tickets of work are intended to be automatically
issued to NBN Co’s contractors with automated responses back to Retail Service Providers as appropriate.
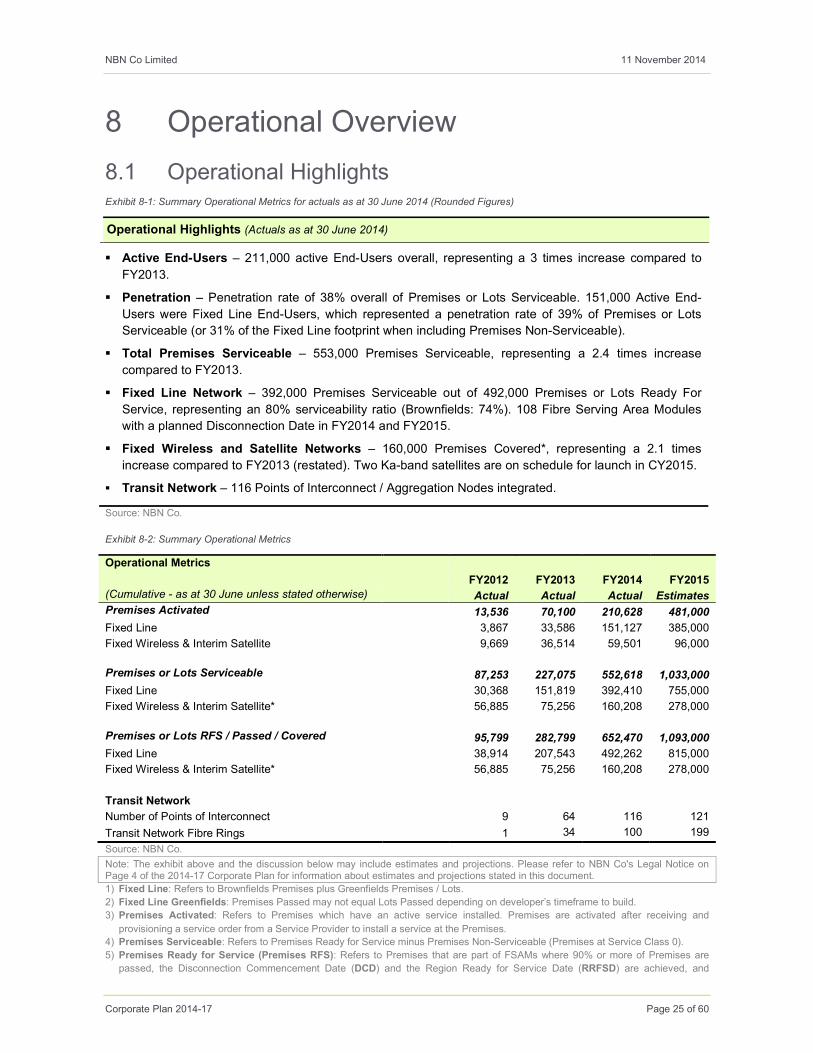
NBN Co Limited 11 November 2014
Corporate Plan 2014-17 Page 25 of 60
8 Operational Overview
8.1 Operational Highlights Exhibit 8-1: Summary Operational Metrics for actuals as at 30 June 2014 (Rounded Figures)
Operational Highlights (Actuals as at 30 June 2014)
� Active End-Users – 211,000 active End-Users overall, representing a 3 times increase compared to
FY2013.
� Penetration – Penetration rate of 38% overall of Premises or Lots Serviceable. 151,000 Active End-
Users were Fixed Line End-Users, which represented a penetration rate of 39% of Premises or Lots
Serviceable (or 31% of the Fixed Line footprint when including Premises Non-Serviceable).
� Total Premises Serviceable – 553,000 Premises Serviceable, representing a 2.4 times increase
compared to FY2013.
� Fixed Line Network – 392,000 Premises Serviceable out of 492,000 Premises or Lots Ready For
Service, representing an 80% serviceability ratio (Brownfields: 74%). 108 Fibre Serving Area Modules
with a planned Disconnection Date in FY2014 and FY2015.
� Fixed Wireless and Satellite Networks – 160,000 Premises Covered*, representing a 2.1 times
increase compared to FY2013 (restated). Two Ka-band satellites are on schedule for launch in CY2015.
� Transit Network – 116 Points of Interconnect / Aggregation Nodes integrated.
Source: NBN Co.
Exhibit 8-2: Summary Operational Metrics
Operational Metrics
FY2012 FY2013 FY2014 FY2015
(Cumulative - as at 30 June unless stated otherwise) Actual Actual Actual Estimates
Premises Activated 13,536 70,100 210,628 481,000
Fixed Line 3,867 33,586 151,127 385,000
Fixed Wireless & Interim Satellite 9,669 36,514 59,501 96,000 Premises or Lots Serviceable 87,253 227,075 552,618 1,033,000
Fixed Line 30,368 151,819 392,410 755,000
Fixed Wireless & Interim Satellite* 56,885 75,256 160,208 278,000 Premises or Lots RFS / Passed / Covered 95,799 282,799 652,470 1,093,000
Fixed Line 38,914 207,543 492,262 815,000
Fixed Wireless & Interim Satellite* 56,885 75,256 160,208 278,000
Transit Network
Number of Points of Interconnect 9 64 116 121
Transit Network Fibre Rings 1 34 100 199
Source: NBN Co.
Note: The exhibit above and the discussion below may include estimates and projections. Please refer to NBN Co's Legal Notice on Page 4 of the 2014-17 Corporate Plan for information about estimates and projections stated in this document.
1) Fixed Line: Refers to Brownfields Premises plus Greenfields Premises / Lots.
2) Fixed Line Greenfields: Premises Passed may not equal Lots Passed depending on developer’s timeframe to build.
3) Premises Activated: Refers to Premises which have an active service installed. Premises are activated after receiving and
provisioning a service order from a Service Provider to install a service at the Premises.
4) Premises Serviceable: Refers to Premises Ready for Service minus Premises Non-Serviceable (Premises at Service Class 0).
5) Premises Ready for Service (Premises RFS): Refers to Premises that are part of FSAMs where 90% or more of Premises are
passed, the Disconnection Commencement Date (DCD) and the Region Ready for Service Date (RRFSD) are achieved, and
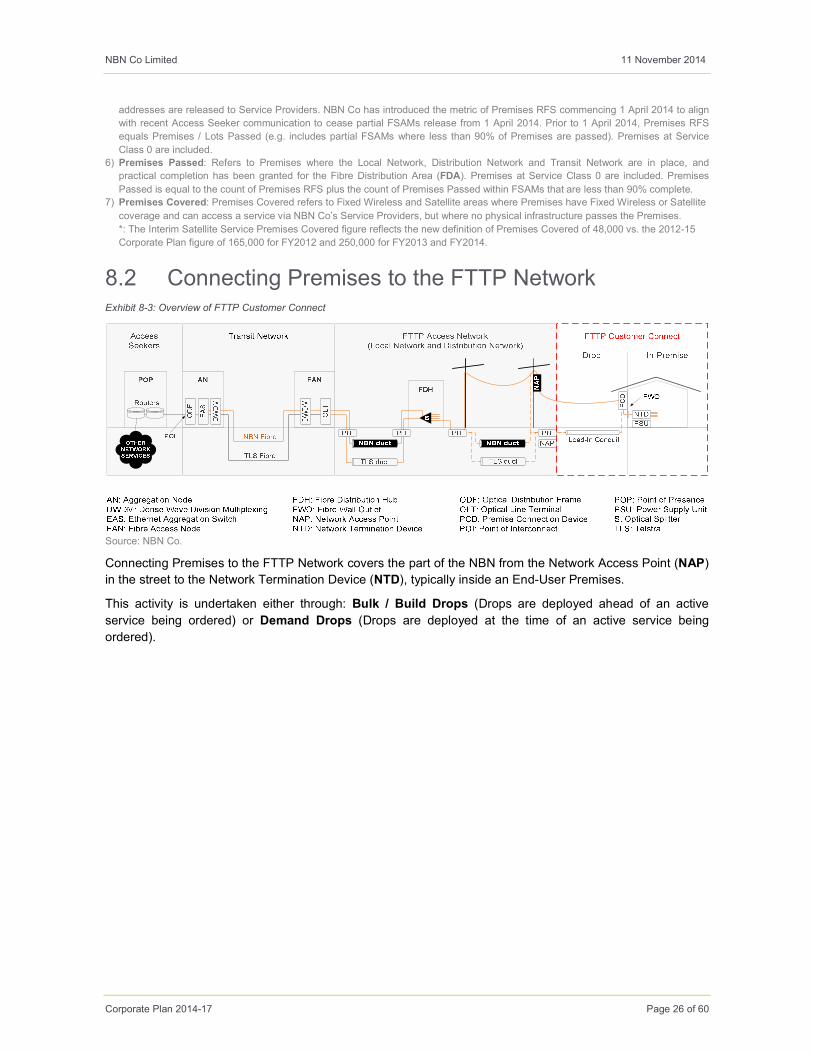
NBN Co Limited 11 November 2014
Corporate Plan 2014-17 Page 26 of 60
addresses are released to Service Providers. NBN Co has introduced the metric of Premises RFS commencing 1 April 2014 to align
with recent Access Seeker communication to cease partial FSAMs release from 1 April 2014. Prior to 1 April 2014, Premises RFS
equals Premises / Lots Passed (e.g. includes partial FSAMs where less than 90% of Premises are passed). Premises at Service
Class 0 are included.
6) Premises Passed: Refers to Premises where the Local Network, Distribution Network and Transit Network are in place, and
practical completion has been granted for the Fibre Distribution Area (FDA). Premises at Service Class 0 are included. Premises
Passed is equal to the count of Premises RFS plus the count of Premises Passed within FSAMs that are less than 90% complete.
7) Premises Covered: Premises Covered refers to Fixed Wireless and Satellite areas where Premises have Fixed Wireless or Satellite
coverage and can access a service via NBN Co’s Service Providers, but where no physical infrastructure passes the Premises.
*: The Interim Satellite Service Premises Covered figure reflects the new definition of Premises Covered of 48,000 vs. the 2012-15
Corporate Plan figure of 165,000 for FY2012 and 250,000 for FY2013 and FY2014.
8.2 Connecting Premises to the FTTP Network Exhibit 8-3: Overview of FTTP Customer Connect
Source: NBN Co.
Connecting Premises to the FTTP Network covers the part of the NBN from the Network Access Point (NAP)
in the street to the Network Termination Device (NTD), typically inside an End-User Premises.
This activity is undertaken either through: Bulk / Build Drops (Drops are deployed ahead of an active
service being ordered) or Demand Drops (Drops are deployed at the time of an active service being
ordered).

NBN Co Limited 11 November 2014
Corporate Plan 2014-17 Page 27 of 60
Exhibit 8-4: Customer Connect for FTTP Brownfields Operational Indicators
Operational Indicators (as at 30 June) Actual FY2015 Estimate
Source: NBN Co.
Note: The exhibit above and the discussion below may include estimates and projections. Please refer to NBN Co's Legal Notice on Page 4 of the 2014-17 Corporate Plan for information about estimates and projections stated in this document.
1) Take-up calculated as Premises Activated as Percentage of Premises Serviceable
2) Premises RFS: NBN Co has introduced the metric of Premises Ready for Service (Premises RFS) commencing 1 April 2014, refer
Glossary. Premises Passed used for FY2013, Premises RFS used for FY2014 and FY2015.
Exhibit 8-5: FTTP Customer Connect Operational Highlights (Rounded Figures)
Performance to date � 105,000 FTTP Brownfields Premises Activated at end of FY2014, representing
a 5 times increase compared to FY2013.
� Take-up32 percentage of 37%, compared to 19% in June 2013.
� 35,500 Single-Dwelling Unit / Multi-Dwelling Unit Drops were completed by the
Bulk / Build Drop programme at end of FY2014.
Serviceability � Ending FY2013, NBN Co had 108,000 FTTP Brownfields Premises
Serviceable, which represented 66% of FTTP Brownfields Premises Passed.
� Ending FY2014, NBN Co had 281,000 FTTP Brownfields Premises
Serviceable, which represented 74% of FTTP Brownfields Premises Ready for
Service (FTTP Brownfields Premises Passed: 66%).
Comparison to 2012-
15 Corporate Plan
� 20,400 FTTP Brownfields Premises Activated at end of FY2013 versus a
2012-15 Corporate Plan target of 44,000.
� 105,000 FTTP Brownfields Premises Activated at end of FY2014 versus a
32 Premises Activated as Percentage of Premises Serviceable.
0
100
200
300
400
FY2013 FY2014 FY2015
Premises Activated (Thousands)
FTTP Brownfields Premises Activated (Cumulative)
0%
20%
40%
60%
FY2013 FY2014 FY2015
Take-up (Percentage)
FTTP Brownfields Take-Up (Cumulative)
0
50
100
150
FY2013 FY2014 FY2015
Premises (Thousands)
FTTP Brownfields Premises at Service Class 0 (Cumulative)
0%
10%
20%
30%
40%
FY2013 FY2014 FY2015
Premises (Percentage)
FTTP Brownfields Premises at Service Class 0 as Percentage of Premises Passed / RFS
(Cumulative)
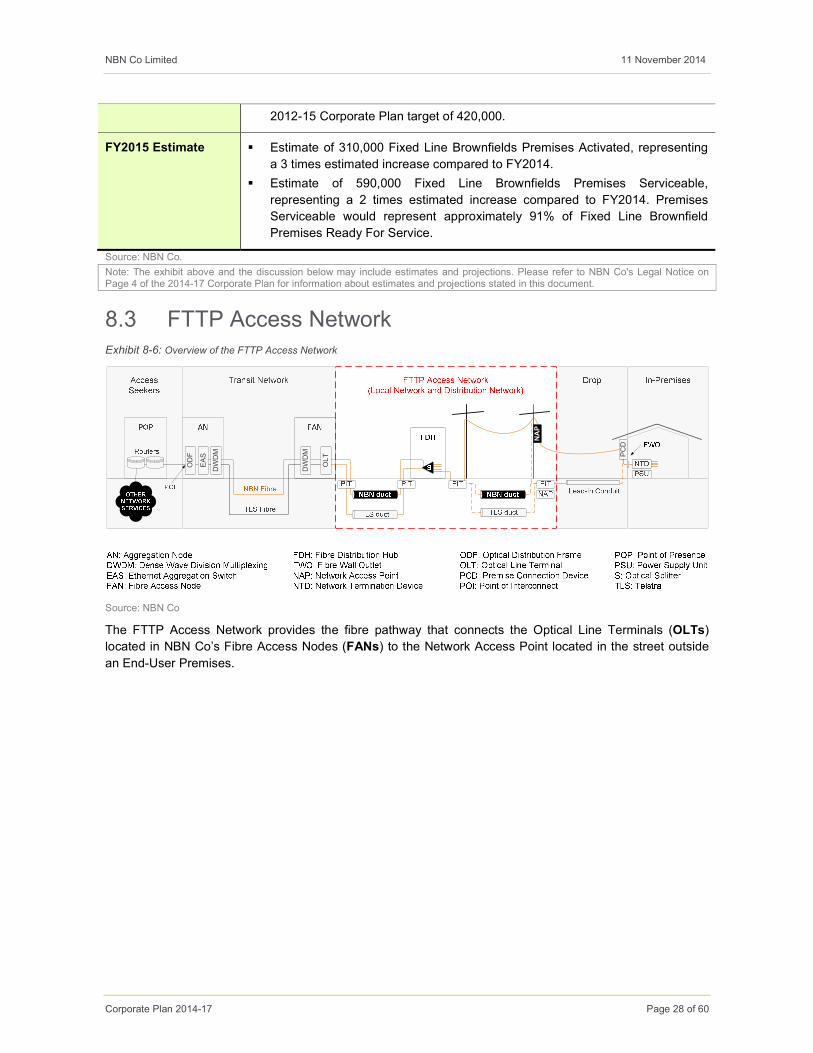
NBN Co Limited 11 November 2014
Corporate Plan 2014-17 Page 28 of 60
2012-15 Corporate Plan target of 420,000.
FY2015 Estimate � Estimate of 310,000 Fixed Line Brownfields Premises Activated, representing
a 3 times estimated increase compared to FY2014.
� Estimate of 590,000 Fixed Line Brownfields Premises Serviceable,
representing a 2 times estimated increase compared to FY2014. Premises
Serviceable would represent approximately 91% of Fixed Line Brownfield
Premises Ready For Service.
Source: NBN Co.
Note: The exhibit above and the discussion below may include estimates and projections. Please refer to NBN Co's Legal Notice on Page 4 of the 2014-17 Corporate Plan for information about estimates and projections stated in this document.
8.3 FTTP Access Network Exhibit 8-6: Overview of the FTTP Access Network
Source: NBN Co
The FTTP Access Network provides the fibre pathway that connects the Optical Line Terminals (OLTs)
located in NBN Co’s Fibre Access Nodes (FANs) to the Network Access Point located in the street outside
an End-User Premises.
PCD
NAP
ODF
OLT
EAS
DWDM
DWDM
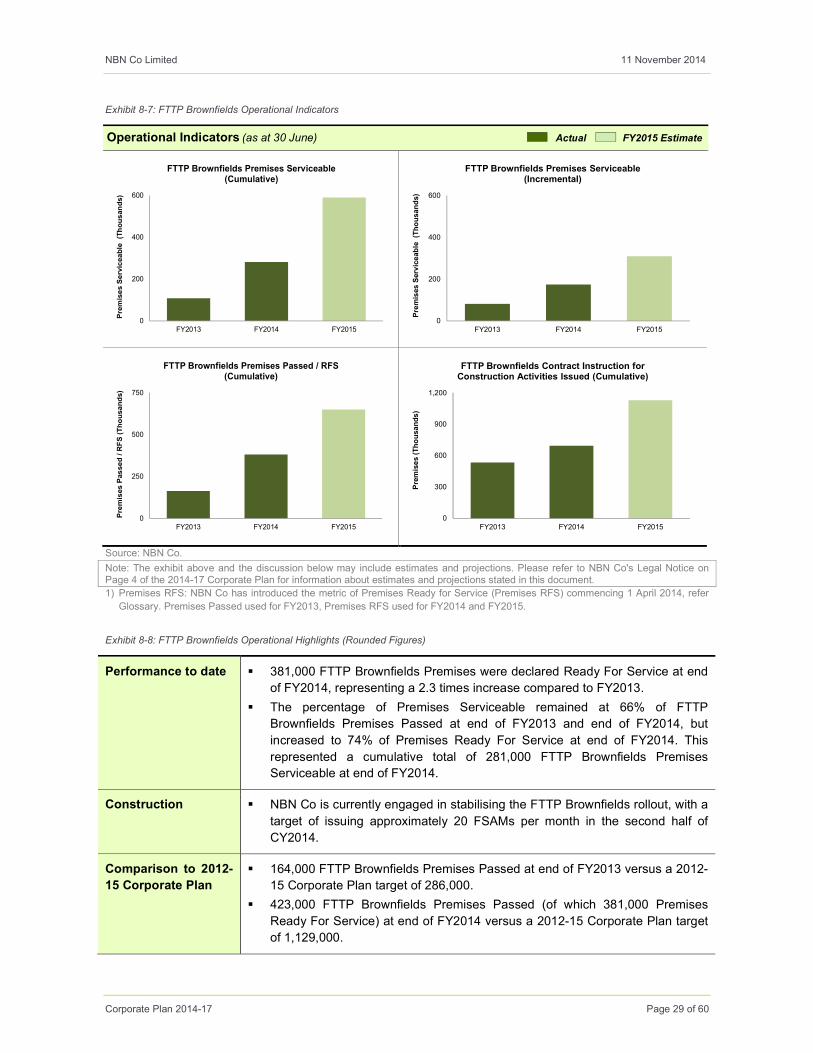
NBN Co Limited 11 November 2014
Corporate Plan 2014-17 Page 29 of 60
Exhibit 8-7: FTTP Brownfields Operational Indicators
Operational Indicators (as at 30 June) Actual FY2015 Estimate
Source: NBN Co.
Note: The exhibit above and the discussion below may include estimates and projections. Please refer to NBN Co's Legal Notice on Page 4 of the 2014-17 Corporate Plan for information about estimates and projections stated in this document.
1) Premises RFS: NBN Co has introduced the metric of Premises Ready for Service (Premises RFS) commencing 1 April 2014, refer
Glossary. Premises Passed used for FY2013, Premises RFS used for FY2014 and FY2015.
Exhibit 8-8: FTTP Brownfields Operational Highlights (Rounded Figures)
Performance to date � 381,000 FTTP Brownfields Premises were declared Ready For Service at end
of FY2014, representing a 2.3 times increase compared to FY2013.
� The percentage of Premises Serviceable remained at 66% of FTTP
Brownfields Premises Passed at end of FY2013 and end of FY2014, but
increased to 74% of Premises Ready For Service at end of FY2014. This
represented a cumulative total of 281,000 FTTP Brownfields Premises
Serviceable at end of FY2014.
Construction � NBN Co is currently engaged in stabilising the FTTP Brownfields rollout, with a
target of issuing approximately 20 FSAMs per month in the second half of
CY2014.
Comparison to 2012-
15 Corporate Plan
� 164,000 FTTP Brownfields Premises Passed at end of FY2013 versus a 2012-
15 Corporate Plan target of 286,000.
� 423,000 FTTP Brownfields Premises Passed (of which 381,000 Premises
Ready For Service) at end of FY2014 versus a 2012-15 Corporate Plan target
of 1,129,000.
0
200
400
600
FY2013 FY2014 FY2015
Premises Serviceable (Thousands)
FTTP Brownfields Premises Serviceable (Cumulative)
0
200
400
600
FY2013 FY2014 FY2015
Premises Serviceable (Thousands)
FTTP Brownfields Premises Serviceable (Incremental)
0
250
500
750
FY2013 FY2014 FY2015
Premises Passed / RFS (Thousands)
FTTP Brownfields Premises Passed / RFS (Cumulative)
0
300
600
900
1,200
FY2013 FY2014 FY2015
Premises (Thousands)
FTTP Brownfields Contract Instruction for Construction Activities Issued (Cumulative)
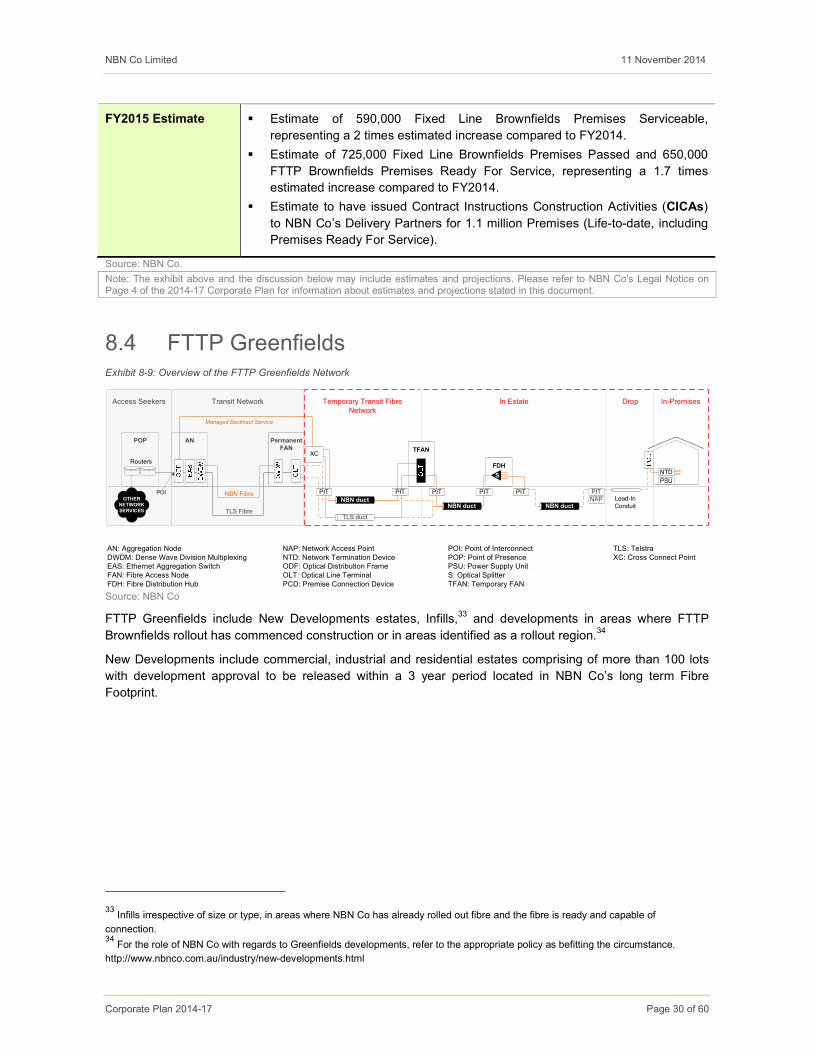
NBN Co Limited 11 November 2014
Corporate Plan 2014-17 Page 30 of 60
FY2015 Estimate � Estimate of 590,000 Fixed Line Brownfields Premises Serviceable,
representing a 2 times estimated increase compared to FY2014.
� Estimate of 725,000 Fixed Line Brownfields Premises Passed and 650,000
FTTP Brownfields Premises Ready For Service, representing a 1.7 times
estimated increase compared to FY2014.
� Estimate to have issued Contract Instructions Construction Activities (CICAs)
to NBN Co’s Delivery Partners for 1.1 million Premises (Life-to-date, including
Premises Ready For Service).
Source: NBN Co.
Note: The exhibit above and the discussion below may include estimates and projections. Please refer to NBN Co's Legal Notice on Page 4 of the 2014-17 Corporate Plan for information about estimates and projections stated in this document.
8.4 FTTP Greenfields Exhibit 8-9: Overview of the FTTP Greenfields Network
Source: NBN Co
FTTP Greenfields include New Developments estates, Infills,33 and developments in areas where FTTP
Brownfields rollout has commenced construction or in areas identified as a rollout region.34
New Developments include commercial, industrial and residential estates comprising of more than 100 lots
with development approval to be released within a 3 year period located in NBN Co’s long term Fibre
Footprint.
33 Infills irrespective of size or type, in areas where NBN Co has already rolled out fibre and the fibre is ready and capable of
connection. 34 For the role of NBN Co with regards to Greenfields developments, refer to the appropriate policy as befitting the circumstance.
http://www.nbnco.com.au/industry/new-developments.html
Access Seekers In EstateTransit Network
AN
Temporary Transit FibreNetwork
Drop In-Premises
Permanent FAN
OTHERNETWORKSERVICES
Lead-In Conduit
NTD
PSU
TLS Fibre
NBN Fibre
POP
Routers
POI
FDH
S
TFAN
Managed Backhaul Service
AN: Aggregation NodeDWDM: Dense Wave Division MultiplexingEAS: Ethernet Aggregation SwitchFAN: Fibre Access NodeFDH: Fibre Distribution Hub
NAP: Network Access PointNTD: Network Termination DeviceODF: Optical Distribution FrameOLT: Optical Line TerminalPCD: Premise Connection Device
POI: Point of InterconnectPOP: Point of PresencePSU: Power Supply UnitS: Optical SplitterTFAN: Temporary FAN
TLS: TelstraXC: Cross Connect Point
NBN duct
TLS duct
XC
NBN duct
PIT PIT PIT
NBN ductNAP
PITPIT PIT
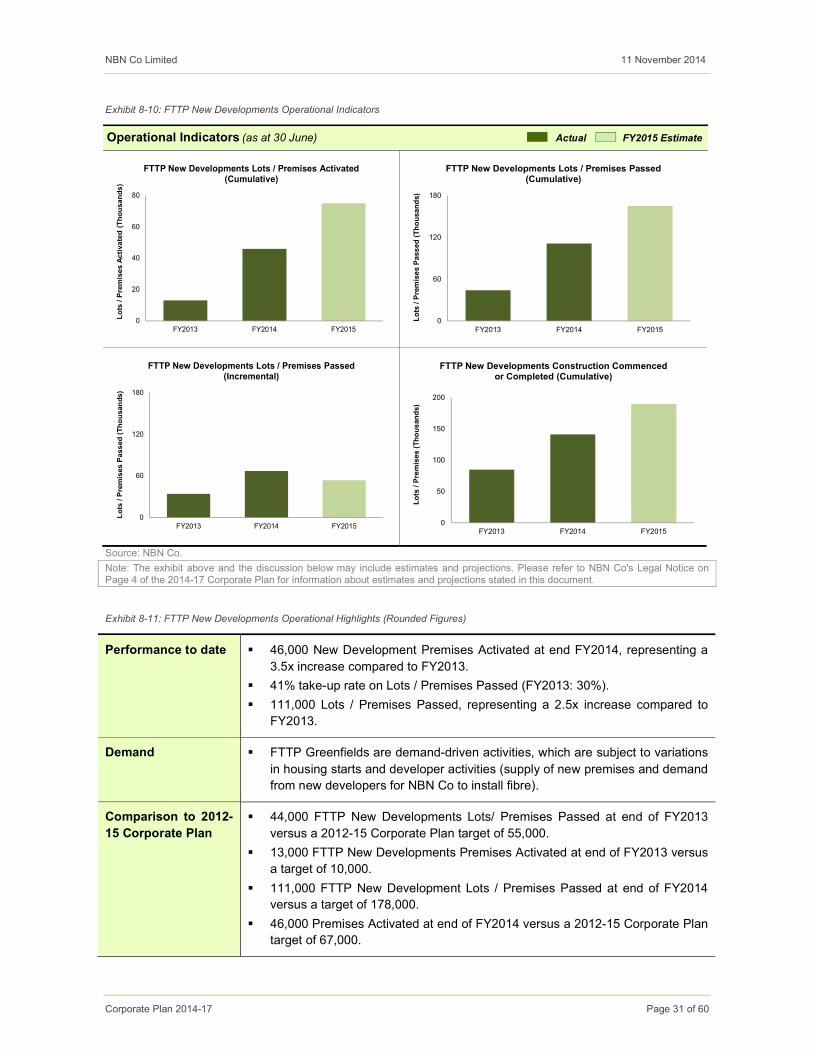
NBN Co Limited 11 November 2014
Corporate Plan 2014-17 Page 31 of 60
Exhibit 8-10: FTTP New Developments Operational Indicators
Operational Indicators (as at 30 June) Actual FY2015 Estimate
Source: NBN Co.
Note: The exhibit above and the discussion below may include estimates and projections. Please refer to NBN Co's Legal Notice on Page 4 of the 2014-17 Corporate Plan for information about estimates and projections stated in this document.
Exhibit 8-11: FTTP New Developments Operational Highlights (Rounded Figures)
Performance to date � 46,000 New Development Premises Activated at end FY2014, representing a
3.5x increase compared to FY2013.
� 41% take-up rate on Lots / Premises Passed (FY2013: 30%).
� 111,000 Lots / Premises Passed, representing a 2.5x increase compared to
FY2013.
Demand � FTTP Greenfields are demand-driven activities, which are subject to variations
in housing starts and developer activities (supply of new premises and demand
from new developers for NBN Co to install fibre).
Comparison to 2012-
15 Corporate Plan
� 44,000 FTTP New Developments Lots/ Premises Passed at end of FY2013
versus a 2012-15 Corporate Plan target of 55,000.
� 13,000 FTTP New Developments Premises Activated at end of FY2013 versus
a target of 10,000.
� 111,000 FTTP New Development Lots / Premises Passed at end of FY2014
versus a target of 178,000.
� 46,000 Premises Activated at end of FY2014 versus a 2012-15 Corporate Plan
target of 67,000.
0
20
40
60
80
FY2013 FY2014 FY2015
Lots / Premises Activated (Thousands)
FTTP New Developments Lots / Premises Activated (Cumulative)
0
60
120
180
FY2013 FY2014 FY2015
Lots / Premises Passed (Thousands)
FTTP New Developments Lots / Premises Passed (Cumulative)
0
60
120
180
FY2013 FY2014 FY2015
Lots / Premises Passed (Thousands)
FTTP New Developments Lots / Premises Passed (Incremental)
0
50
100
150
200
FY2013 FY2014 FY2015
Lots / Premises (Thousands)
FTTP New Developments Construction Commenced or Completed (Cumulative)
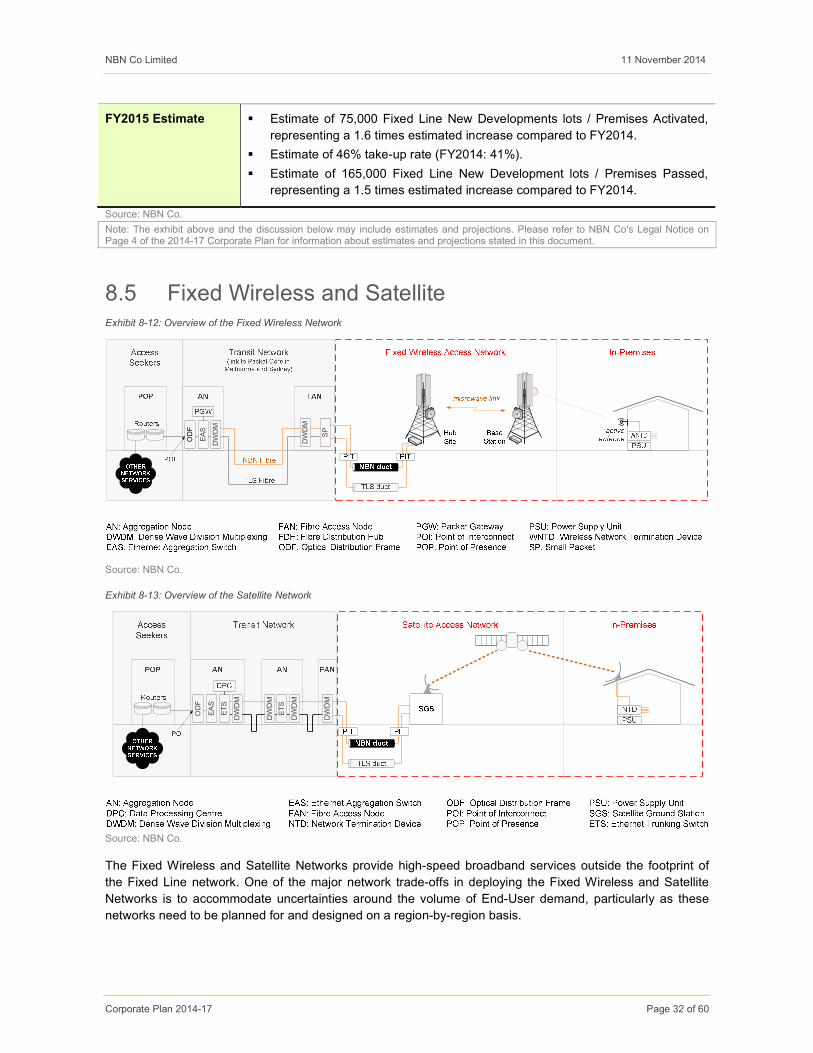
NBN Co Limited 11 November 2014
Corporate Plan 2014-17 Page 32 of 60
FY2015 Estimate � Estimate of 75,000 Fixed Line New Developments lots / Premises Activated,
representing a 1.6 times estimated increase compared to FY2014.
� Estimate of 46% take-up rate (FY2014: 41%).
� Estimate of 165,000 Fixed Line New Development lots / Premises Passed,
representing a 1.5 times estimated increase compared to FY2014.
Source: NBN Co.
Note: The exhibit above and the discussion below may include estimates and projections. Please refer to NBN Co's Legal Notice on Page 4 of the 2014-17 Corporate Plan for information about estimates and projections stated in this document.
8.5 Fixed Wireless and Satellite Exhibit 8-12: Overview of the Fixed Wireless Network
Source: NBN Co.
Exhibit 8-13: Overview of the Satellite Network
Source: NBN Co.
The Fixed Wireless and Satellite Networks provide high-speed broadband services outside the footprint of
the Fixed Line network. One of the major network trade-offs in deploying the Fixed Wireless and Satellite
Networks is to accommodate uncertainties around the volume of End-User demand, particularly as these
networks need to be planned for and designed on a region-by-region basis.
ODF
EAS
DWDM
DWDM
SP
DWDM
EAS
ODF
ETS
DWDM
DWDM
ETS
DWDM

NBN Co Limited 11 November 2014
Corporate Plan 2014-17 Page 33 of 60
Exhibit 8-14: Fixed Wireless and Satellite Operational Indicators*
Operational Indicators*(as at 30 June) Actual FY2015 Estimate
Source: NBN Co.
Note: The exhibit above and the discussion below may include estimates and projections. Please refer to NBN Co's Legal Notice on Page 4 of the 2014-17 Corporate Plan for information about estimates and projections stated in this document.
*: The Interim Satellite Service Premises Covered figure reflects the new definition of Premises Covered of 48,000 vs. the 2012-15
Corporate Plan figure of 165,000 for FY2012 and 250,000 for FY2013 and FY2014.
Exhibit 8-15: Fixed Wireless and Satellite Operational Highlights (Rounded Figures)
Performance to date � 60,000 Fixed Wireless and Interim Satellite Service Premises Activated at end
of FY2014, representing a 1.6x increase compared to FY2013.
� 160,000 Fixed Wireless and Interim Satellite Service Premises Covered at end
FY2014, representing a 2.1x increase compared to FY2013*.
Operational
highlights
� In March 2013, NBN Co contracted the launch of the two NBN Co Long Term
Satellite Service (LTSS) satellites with Arianespace, and secured insurance
arrangements of launch and in-orbit operations of the satellites.
� In February 2014, NBN Co announced the award of a five year contract to
Optus for the operation of the two NBN Co satellites. Under the contract Optus
will provide tracking, telemetry and control services in connection with the
LTSS. The two satellites currently under construction are scheduled to launch
in CY2015.
� In January 2013, NBN Co commenced the construction of the ten LTSS
ground stations with all now well progressed and two complete.
� In July 2012, NBN Co contracted with ViaSat for the supply of LTSS ground
systems and terminals. The ground systems have now been commissioned at
two of the ground stations including the RF antenna systems, with network
management, data processing systems and terminal development well
progressed.
� Capacity on the oversubscribed ISS has been extended through satellite
operators IPStar and Optus. NBN Co will spend more than $34 million to
provide End-Users with improved broadband speeds and new satellite
services for additional Premises. These services are expected to be available
from the middle of CY2014.
Comparison to 2012-
15 Corporate Plan
� 37,000 Fixed Wireless and Satellite Premises Activated at end of FY2013
versus a target of 38,000 Premises.
� 75,000 Fixed Wireless and Satellite Premises Covered* at end of FY2013
versus a 2012-15 Corporate Plan target of 320,000*. This target included
0
20
40
60
80
100
FY2013 FY2014 FY2015
Premises Activated (Thousands)
Fixed Wireless / Satellite Premises Activated (Cumulative)
0
100
200
300
FY2013 FY2014 FY2015
Premises Covered (Thousands)
Fixed Wireless / Satellite Premises Covered (Cumulative)
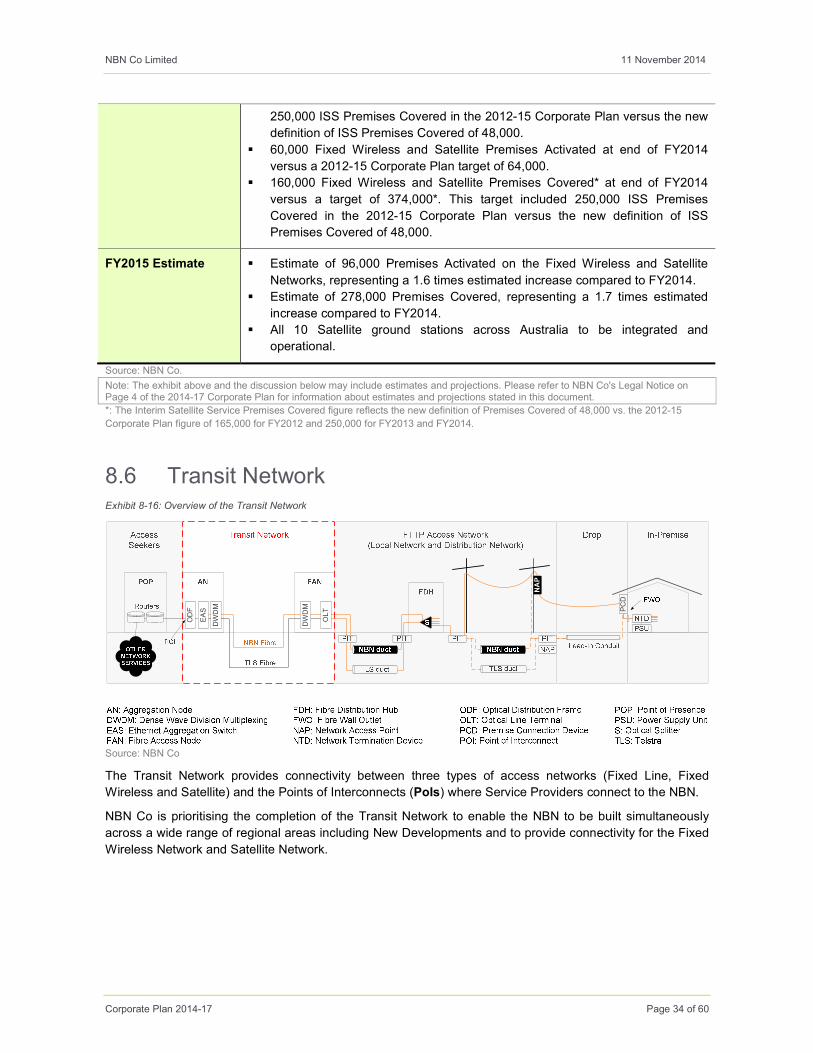
NBN Co Limited 11 November 2014
Corporate Plan 2014-17 Page 34 of 60
250,000 ISS Premises Covered in the 2012-15 Corporate Plan versus the new
definition of ISS Premises Covered of 48,000.
� 60,000 Fixed Wireless and Satellite Premises Activated at end of FY2014
versus a 2012-15 Corporate Plan target of 64,000.
� 160,000 Fixed Wireless and Satellite Premises Covered* at end of FY2014
versus a target of 374,000*. This target included 250,000 ISS Premises
Covered in the 2012-15 Corporate Plan versus the new definition of ISS
Premises Covered of 48,000.
FY2015 Estimate � Estimate of 96,000 Premises Activated on the Fixed Wireless and Satellite
Networks, representing a 1.6 times estimated increase compared to FY2014.
� Estimate of 278,000 Premises Covered, representing a 1.7 times estimated
increase compared to FY2014.
� All 10 Satellite ground stations across Australia to be integrated and
operational.
Source: NBN Co.
Note: The exhibit above and the discussion below may include estimates and projections. Please refer to NBN Co's Legal Notice on Page 4 of the 2014-17 Corporate Plan for information about estimates and projections stated in this document.
*: The Interim Satellite Service Premises Covered figure reflects the new definition of Premises Covered of 48,000 vs. the 2012-15
Corporate Plan figure of 165,000 for FY2012 and 250,000 for FY2013 and FY2014.
8.6 Transit Network Exhibit 8-16: Overview of the Transit Network
Source: NBN Co
The Transit Network provides connectivity between three types of access networks (Fixed Line, Fixed
Wireless and Satellite) and the Points of Interconnects (PoIs) where Service Providers connect to the NBN.
NBN Co is prioritising the completion of the Transit Network to enable the NBN to be built simultaneously
across a wide range of regional areas including New Developments and to provide connectivity for the Fixed
Wireless Network and Satellite Network.
PCD
NAP
ODF
OLT
EAS
DWDM
DWDM

NBN Co Limited 11 November 2014
Corporate Plan 2014-17 Page 35 of 60
Exhibit 8-17: Transit Network Operational Indicators
Operational Indicators (as at 30 June) Actual FY2015 Estimate
Source: NBN Co.
Note: The exhibit above and the discussion below may include estimates and projections. Please refer to NBN Co's Legal Notice on Page 4 of the 2014-17 Corporate Plan for information about estimates and projections stated in this document.
Note: Dark Fibre Links could be provided by Telstra, as part of the Regional Blackspot Broadband Programme or built by NBN Co.
Exhibit 8-18: Transit Network Operational Highlights
Performance to date � At the end of FY2014, the Transit Network had integrated 116 PoIs,
completed CNI builds for 888 PoIs / FANs, and integrated 100 Transit Rings.
Comparison to 2012-
15 Corporate Plan
The 2012-15 Corporate Plan forecast:
� 121 PoIs integrated in FY2013.
� Completed CNI builds for 497 PoIs / FANs in FY2013 and 771 PoIs /
FANs in FY2014.
� Integrated 104 Transit Rings in FY2013 and 200 Transit Rings in FY2014.
FY2015 Estimate � Estimate of 121 PoIs integrated, CNI builds for 1,214 PoIs / FANs and 199
Transit Rings.
Source: NBN Co.
Note: The exhibit above and the discussion below may include estimates and projections. Please refer to NBN Co's Legal Notice on Page 4 of the 2014-17 Corporate Plan for information about estimates and projections stated in this document.
0
250
500
750
1,000
1,250
FY2013 FY2014 FY2015
CNI Builds (#)
PoIs / FANs CNI Build Completed (Cumulative)
0
50
100
150
200
FY2013 FY2014 FY2015
Transit Rings (#)
Transit Rings Integrated (Cumulative)
0
25
50
75
100
125
FY2013 FY2014 FY2015
Aggregation Node / PoI (#)
Aggregation Nodes / PoIs Integrated (Cumulative)
0
25
50
75
FY2013 FY2014 FY2015
Kilometres (Thousands)
Fibre Connectivity - Dark Fibre Links (Cumulative)
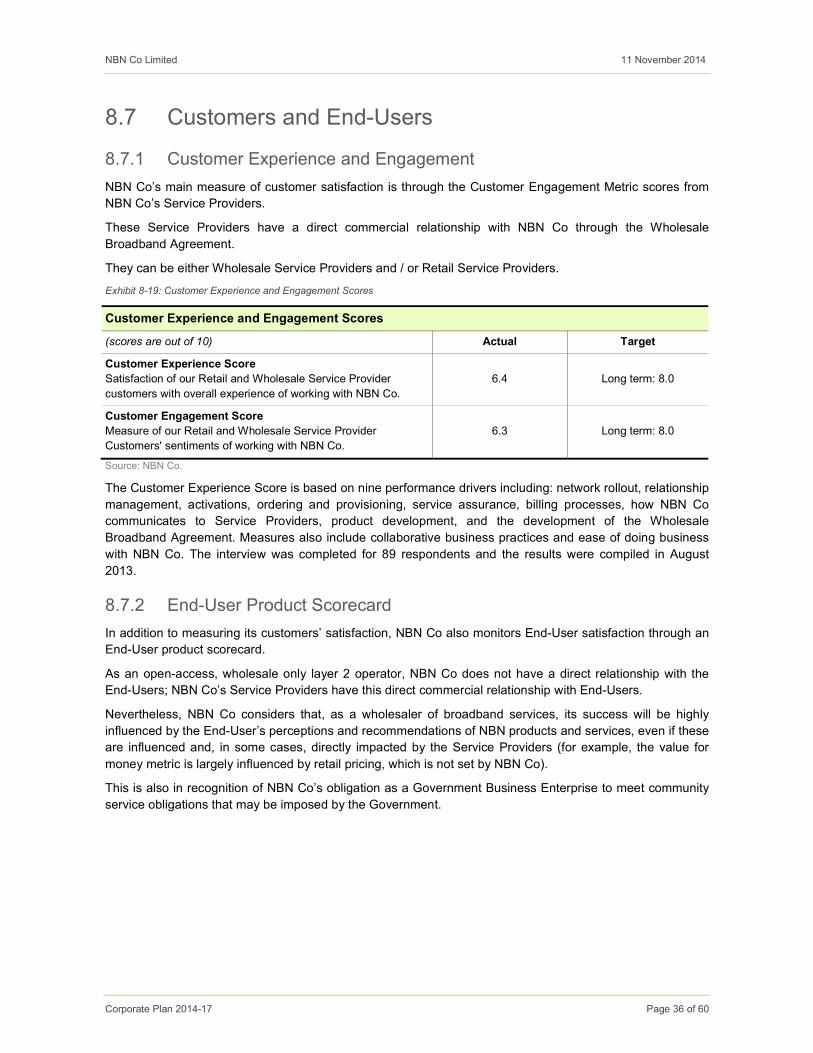
NBN Co Limited 11 November 2014
Corporate Plan 2014-17 Page 36 of 60
8.7 Customers and End-Users
8.7.1 Customer Experience and Engagement
NBN Co’s main measure of customer satisfaction is through the Customer Engagement Metric scores from
NBN Co’s Service Providers.
These Service Providers have a direct commercial relationship with NBN Co through the Wholesale
Broadband Agreement.
They can be either Wholesale Service Providers and / or Retail Service Providers.
Exhibit 8-19: Customer Experience and Engagement Scores
Customer Experience and Engagement Scores
(scores are out of 10) Actual Target
Customer Experience Score
Satisfaction of our Retail and Wholesale Service Provider
customers with overall experience of working with NBN Co.
6.4 Long term: 8.0
Customer Engagement Score
Measure of our Retail and Wholesale Service Provider
Customers' sentiments of working with NBN Co.
6.3 Long term: 8.0
Source: NBN Co.
The Customer Experience Score is based on nine performance drivers including: network rollout, relationship
management, activations, ordering and provisioning, service assurance, billing processes, how NBN Co
communicates to Service Providers, product development, and the development of the Wholesale
Broadband Agreement. Measures also include collaborative business practices and ease of doing business
with NBN Co. The interview was completed for 89 respondents and the results were compiled in August
2013.
8.7.2 End-User Product Scorecard
In addition to measuring its customers’ satisfaction, NBN Co also monitors End-User satisfaction through an
End-User product scorecard.
As an open-access, wholesale only layer 2 operator, NBN Co does not have a direct relationship with the
End-Users; NBN Co’s Service Providers have this direct commercial relationship with End-Users.
Nevertheless, NBN Co considers that, as a wholesaler of broadband services, its success will be highly
influenced by the End-User’s perceptions and recommendations of NBN products and services, even if these
are influenced and, in some cases, directly impacted by the Service Providers (for example, the value for
money metric is largely influenced by retail pricing, which is not set by NBN Co).
This is also in recognition of NBN Co’s obligation as a Government Business Enterprise to meet community
service obligations that may be imposed by the Government.
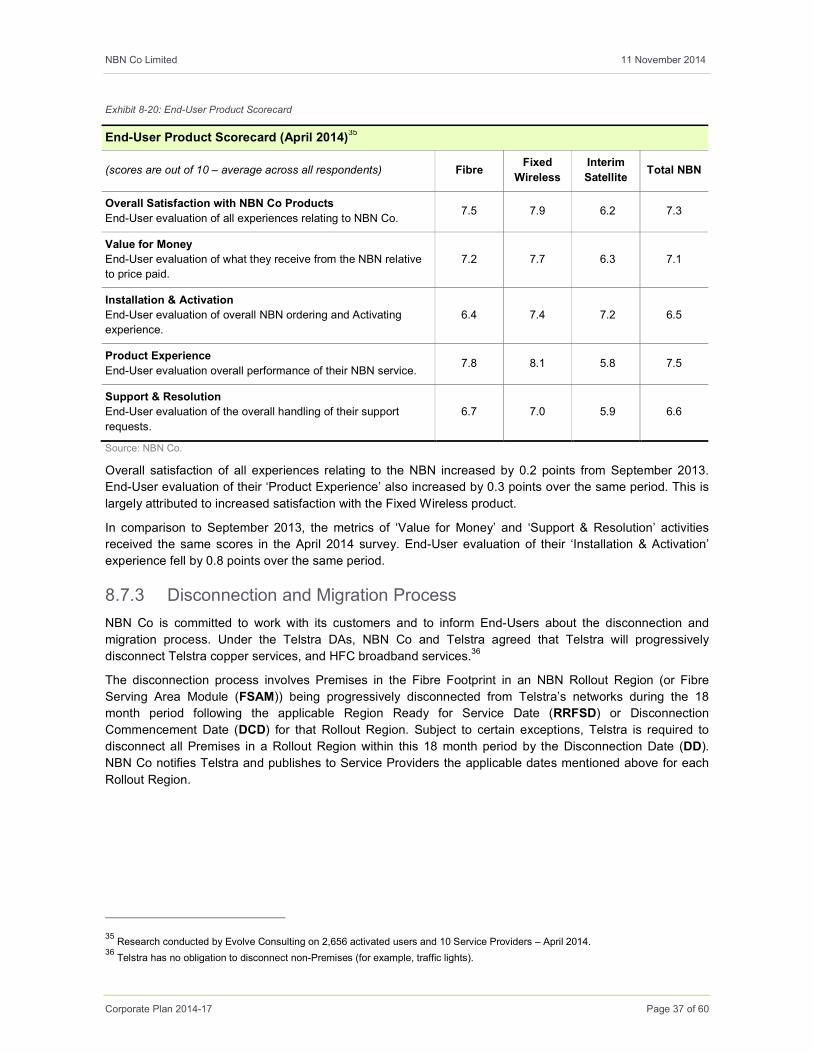
NBN Co Limited 11 November 2014
Corporate Plan 2014-17 Page 37 of 60
Exhibit 8-20: End-User Product Scorecard
End-User Product Scorecard (April 2014)35
(scores are out of 10 – average across all respondents) Fibre Fixed
Wireless
Interim
Satellite Total NBN
Overall Satisfaction with NBN Co Products
End-User evaluation of all experiences relating to NBN Co. 7.5 7.9 6.2 7.3
Value for Money
End-User evaluation of what they receive from the NBN relative
to price paid.
7.2 7.7 6.3 7.1
Installation & Activation
End-User evaluation of overall NBN ordering and Activating
experience.
6.4 7.4 7.2 6.5
Product Experience
End-User evaluation overall performance of their NBN service. 7.8 8.1 5.8 7.5
Support & Resolution
End-User evaluation of the overall handling of their support
requests.
6.7 7.0 5.9 6.6
Source: NBN Co.
Overall satisfaction of all experiences relating to the NBN increased by 0.2 points from September 2013.
End-User evaluation of their ‘Product Experience’ also increased by 0.3 points over the same period. This is
largely attributed to increased satisfaction with the Fixed Wireless product.
In comparison to September 2013, the metrics of ‘Value for Money’ and ‘Support & Resolution’ activities
received the same scores in the April 2014 survey. End-User evaluation of their ‘Installation & Activation’
experience fell by 0.8 points over the same period.
8.7.3 Disconnection and Migration Process
NBN Co is committed to work with its customers and to inform End-Users about the disconnection and
migration process. Under the Telstra DAs, NBN Co and Telstra agreed that Telstra will progressively
disconnect Telstra copper services, and HFC broadband services.36
The disconnection process involves Premises in the Fibre Footprint in an NBN Rollout Region (or Fibre
Serving Area Module (FSAM)) being progressively disconnected from Telstra’s networks during the 18
month period following the applicable Region Ready for Service Date (RRFSD) or Disconnection
Commencement Date (DCD) for that Rollout Region. Subject to certain exceptions, Telstra is required to
disconnect all Premises in a Rollout Region within this 18 month period by the Disconnection Date (DD).
NBN Co notifies Telstra and publishes to Service Providers the applicable dates mentioned above for each
Rollout Region.
35 Research conducted by Evolve Consulting on 2,656 activated users and 10 Service Providers – April 2014.
36 Telstra has no obligation to disconnect non-Premises (for example, traffic lights).

NBN Co Limited 11 November 2014
Corporate Plan 2014-17 Page 38 of 60
From the DD, Telstra is obliged to commence permanent disconnection of all remaining copper services and
HFC broadband services provided to Premises in the relevant Rollout Region that are passed by the NBN
Fibre Network (subject to certain limited exceptions)37. This applies on an equivalent basis to both Telstra
retail services and Telstra wholesale services, including Unconditional Local Loop Service (ULLS) and Line
Sharing Services (LSS). The permanent disconnection process must be completed within a specified period
after the DD.
On 23 May 2014, the Premises in the first 15 Rollout Regions (approximately 27,000 Premises Passed)
reached their DD. An additional 16 Rollout Regions, representing approximately 34,000 Premises, will also
reach their DD by end October 2014.
Whilst all parties are committed to the headline DD, as this is the first occasion on which mandatory
disconnection will commence, NBN Co and Telstra have agreed in consultation with the ACCC and the
Department of Communications to revise and closely monitor the disconnection process in the first 31
FSAMs. The objective is to assist End-Users, in particular vulnerable groups, in their migration to the NBN.
Under the revised process, certain End-Users will be allowed up to an additional 6 months from the DD to
assist in the migration to the NBN. Telstra (in conjunction with Service Providers), will implement a “Red” and
“Green” Premises categorisation approach to processing disconnections in the first 31 FSAMs. This will allow
special treatment for certain types of Premises and certain groups of End-Users. Examples within the Red
category include End-Users who may be in a ‘vulnerable’ situation due to the existence in their Premises of
known legacy services such as medical alarms, fire panels and lift phones.
Any End-User Premises in the first 31 FSAMs in a ‘vulnerable’ group which has not migrated to the NBN
within the additional DD plus 6 month period will be considered on an exceptions basis.
To support case management, NBN Co launched a medical alarm register in March 2014 to establish a
database of certain medical alarms users – this includes direct registrations from End-Users as well as
information from a range of medical alarm providers. A similar register has also been launched for fire alarms
and lift phones. It is expected that learnings from the first 31 Rollout Regions pilot with Telstra (and other
stakeholders) will inform future disconnection processes to ensure migration occurs successfully for all
parties and with minimum exposure to vulnerable groups.
Throughout FY2015, in addition to the first 31 Rollout Regions, a further 77 Rollout Regions are expected to
reach DD to make a total of 108 Rollout Regions.
In addition to the pilot, NBN Co has commenced work with the Department of Communications, Telstra and
other industry stakeholders and regulatory bodies to develop a Migration and Disconnection Service
Assurance Framework. This will formalise future migration and disconnection assurance processes for the
industry. An implementation plan is being developed by the Department of Communications for completion in
FY2015.
37 This includes the Copper Network lines connecting premises in a Rollout Region that are passed by the NBN Fibre Network which
can continue to be used to provide services after the Disconnection Date in the following limited circumstances: a) for a specified period,
for continued provision of pre-existing copper services and HFC broadband services where a connection order for the NBN Fibre
Network has been made for the relevant premises but has not been fulfilled as at the Disconnection Date; and, b) for a range of retail
and wholesale Special Services, which will be disconnected over a longer timeframe, depending on factors such as suitable fibre
alternative products becoming available on the NBN Fibre Network.
NBN Co Limited 11 November 2014
Corporate Plan 2014-17 Page 39 of 60
8.7.4 Serviceability Improvement Programme for FTTP Access Network
(Brownfields Premises)
A major area of focus for NBN Co in FY2015 will be to increase the number of Premises Passed that are
serviceable in the FTTP Access Network (Brownfields Premises) in order to meet the expected demand for
activations and the upcoming disconnection timeframes. Serviceability of the FTTP Access Network and the
Fixed Line Network involves connecting each Premises with a Drop (e.g. a lead-in to the Premises). This
involves for the:
� Existing footprint – Completing the construction activities to ensure that a high proportion of Premises
that are already Premises Passed by NBN Co are Premises Serviceable. Therefore, the focus will be on
reducing the stock of Premises Non-Serviceable to fulfil demand and upcoming disconnection
timeframes through significantly ramping up the existing Bulk Drop programme and existing MDU Drop
programme.
� New footprint – Ensuring that a higher proportion of Premises are Premises Serviceable when an area
is declared Ready for Service (e.g. when orders can be placed from Service Providers). The primary
objective will be to ramp up the volumes of drops (including for Multi-Dwelling Units) that are installed at
the time of the FSAMs being built and Premises being passed (the Build Drop programme). This aims
to minimise activation activities required at the time of an order being received from Service Providers,
including NBN Co’s ability to service demand from End-Users living in Multi-Dwelling Units. NBN Co is
intending to collaboratively review existing contractual arrangements with its Delivery Partners to ensure
the scope of their construction activities includes both the construction of the FTTP Access Network as
well as the construction of the Build Drops (from the Network Access Point (NAP) in the street to the
Premises Connection Device (PCD) located outside or nearby the End-User Premises).
NBN Co has begun a pilot programme to improve the serviceability of Premises within the existing FSAMs
and the upcoming footprint so as to increase NBN Co’s ability to efficiently process orders. As part of this
initiative, NBN Co will specifically target a reduction in the level of Premises that are currently outside the
standard lead time for a service activation (the Service Class 0 Premises) as well as seek to increase the
proportion of Premises where the lead-in will already be in place at the time of the activation order so as to
minimise the number of Demand Drops.
This programme will include:
� Completing planned Multi-Dwelling Units and Complex Premises activity to increase the level of
Premises Serviceable in the existing footprint of Premises Passed.
� Completing required outstanding work in the Premises Passed footprint, which may include testing,
addressing any network gaps, and completing current or expected held-orders.
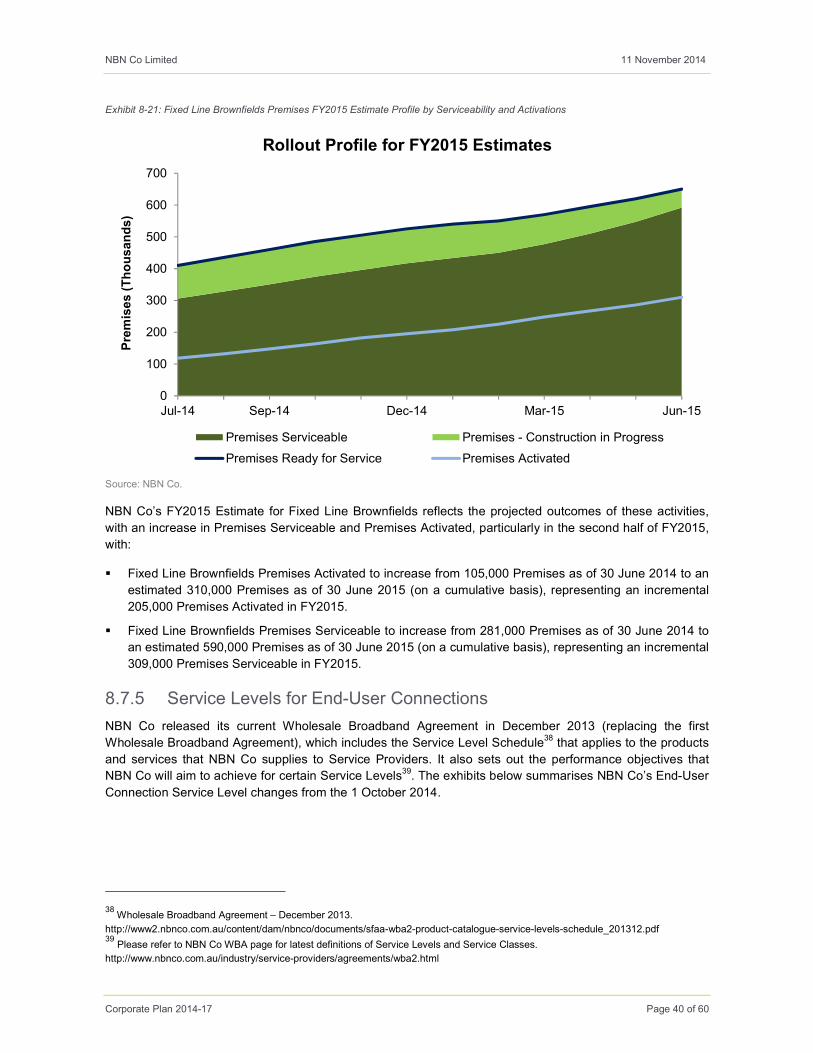
NBN Co Limited 11 November 2014
Corporate Plan 2014-17 Page 40 of 60
Exhibit 8-21: Fixed Line Brownfields Premises FY2015 Estimate Profile by Serviceability and Activations
Source: NBN Co.
NBN Co’s FY2015 Estimate for Fixed Line Brownfields reflects the projected outcomes of these activities,
with an increase in Premises Serviceable and Premises Activated, particularly in the second half of FY2015,
with:
� Fixed Line Brownfields Premises Activated to increase from 105,000 Premises as of 30 June 2014 to an
estimated 310,000 Premises as of 30 June 2015 (on a cumulative basis), representing an incremental
205,000 Premises Activated in FY2015.
� Fixed Line Brownfields Premises Serviceable to increase from 281,000 Premises as of 30 June 2014 to
an estimated 590,000 Premises as of 30 June 2015 (on a cumulative basis), representing an incremental
309,000 Premises Serviceable in FY2015.
8.7.5 Service Levels for End-User Connections
NBN Co released its current Wholesale Broadband Agreement in December 2013 (replacing the first
Wholesale Broadband Agreement), which includes the Service Level Schedule38 that applies to the products
and services that NBN Co supplies to Service Providers. It also sets out the performance objectives that
NBN Co will aim to achieve for certain Service Levels39. The exhibits below summarises NBN Co’s End-User
Connection Service Level changes from the 1 October 2014.
38 Wholesale Broadband Agreement – December 2013.
http://www2.nbnco.com.au/content/dam/nbnco/documents/sfaa-wba2-product-catalogue-service-levels-schedule_201312.pdf 39 Please refer to NBN Co WBA page for latest definitions of Service Levels and Service Classes.
http://www.nbnco.com.au/industry/service-providers/agreements/wba2.html
0
100
200
300
400
500
600
700
Jul-14 Sep-14 Dec-14 Mar-15 Jun-15
Premises (Thousands)
Rollout Profile for FY2015 Estimates
Premises Serviceable Premises - Construction in Progress
Premises Ready for Service Premises Activated
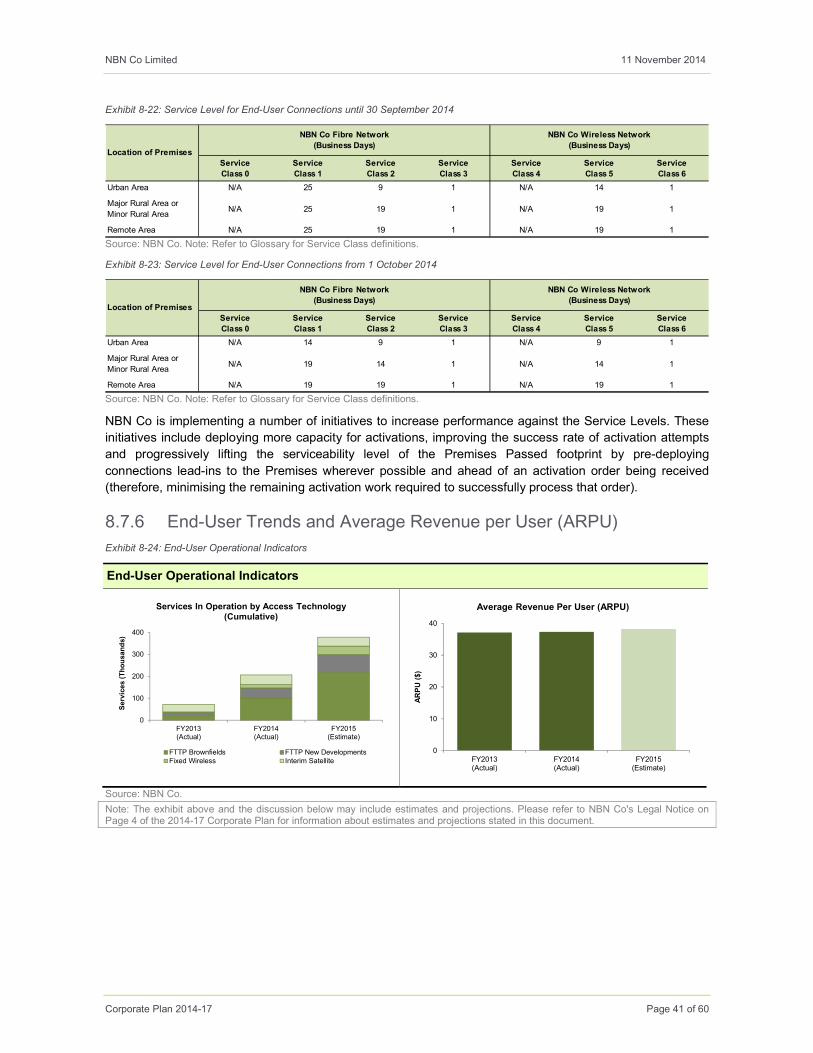
NBN Co Limited 11 November 2014
Corporate Plan 2014-17 Page 41 of 60
Exhibit 8-22: Service Level for End-User Connections until 30 September 2014
Source: NBN Co. Note: Refer to Glossary for Service Class definitions.
Exhibit 8-23: Service Level for End-User Connections from 1 October 2014
Source: NBN Co. Note: Refer to Glossary for Service Class definitions.
NBN Co is implementing a number of initiatives to increase performance against the Service Levels. These
initiatives include deploying more capacity for activations, improving the success rate of activation attempts
and progressively lifting the serviceability level of the Premises Passed footprint by pre-deploying
connections lead-ins to the Premises wherever possible and ahead of an activation order being received
(therefore, minimising the remaining activation work required to successfully process that order).
8.7.6 End-User Trends and Average Revenue per User (ARPU)
Exhibit 8-24: End-User Operational Indicators
End-User Operational Indicators
Source: NBN Co.
Note: The exhibit above and the discussion below may include estimates and projections. Please refer to NBN Co's Legal Notice on Page 4 of the 2014-17 Corporate Plan for information about estimates and projections stated in this document.
Service
Class 0
Service
Class 1
Service
Class 2
Service
Class 3
Service
Class 4
Service
Class 5
Service
Class 6
Urban Area N/A 25 9 1 N/A 14 1
Major Rural Area or
Minor Rural AreaN/A 25 19 1 N/A 19 1
Remote Area N/A 25 19 1 N/A 19 1
NBN Co Fibre Network
(Business Days)Location of Premises
NBN Co Wireless Network
(Business Days)
Service
Class 0
Service
Class 1
Service
Class 2
Service
Class 3
Service
Class 4
Service
Class 5
Service
Class 6
Urban Area N/A 14 9 1 N/A 9 1
Major Rural Area or
Minor Rural AreaN/A 19 14 1 N/A 14 1
Remote Area N/A 19 19 1 N/A 19 1
Location of Premises
NBN Co Fibre Network
(Business Days)
NBN Co Wireless Network
(Business Days)
0
100
200
300
400
FY2013(Actual)
FY2014(Actual)
FY2015(Estimate)
Services (Thousands)
Services In Operation by Access Technology (Cumulative)
FTTP Brownfields FTTP New DevelopmentsFixed Wireless Interim Satellite
0
10
20
30
40
FY2013(Actual)
FY2014(Actual)
FY2015(Estimate)
ARPU ($)
Average Revenue Per User (ARPU)
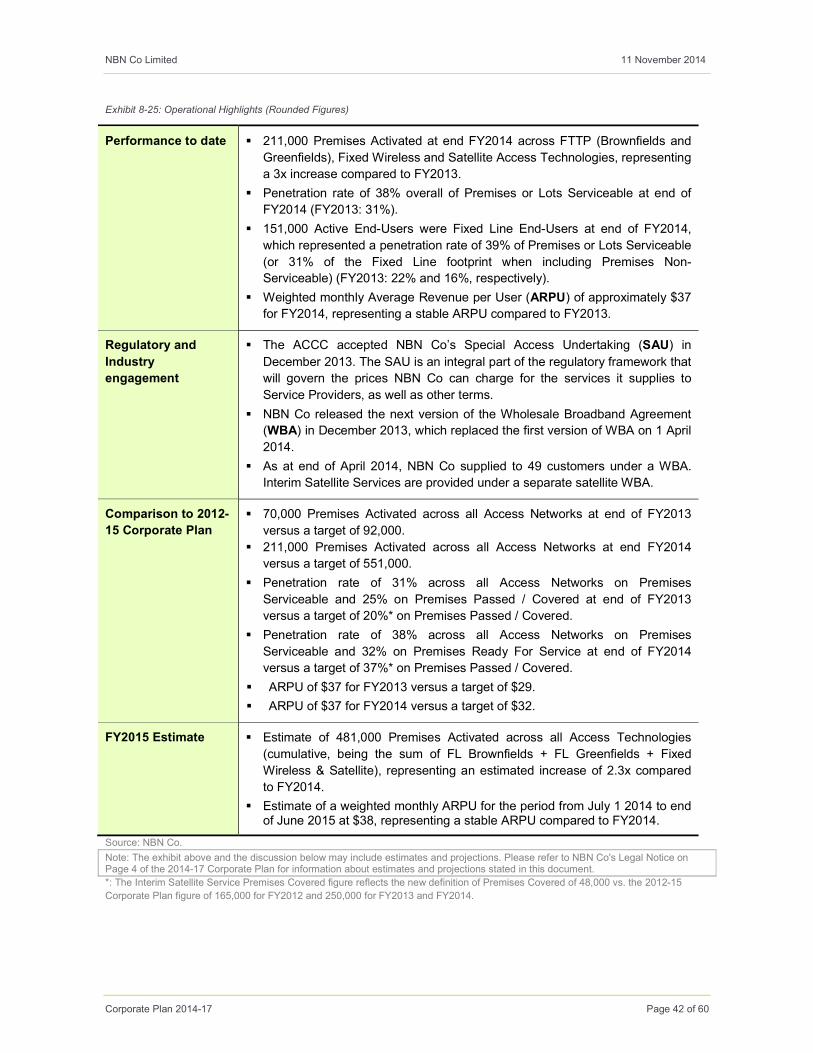
NBN Co Limited 11 November 2014
Corporate Plan 2014-17 Page 42 of 60
Exhibit 8-25: Operational Highlights (Rounded Figures)
Performance to date � 211,000 Premises Activated at end FY2014 across FTTP (Brownfields and
Greenfields), Fixed Wireless and Satellite Access Technologies, representing
a 3x increase compared to FY2013.
� Penetration rate of 38% overall of Premises or Lots Serviceable at end of
FY2014 (FY2013: 31%).
� 151,000 Active End-Users were Fixed Line End-Users at end of FY2014,
which represented a penetration rate of 39% of Premises or Lots Serviceable
(or 31% of the Fixed Line footprint when including Premises Non-
Serviceable) (FY2013: 22% and 16%, respectively).
� Weighted monthly Average Revenue per User (ARPU) of approximately $37
for FY2014, representing a stable ARPU compared to FY2013.
Regulatory and
Industry
engagement
� The ACCC accepted NBN Co’s Special Access Undertaking (SAU) in
December 2013. The SAU is an integral part of the regulatory framework that
will govern the prices NBN Co can charge for the services it supplies to
Service Providers, as well as other terms.
� NBN Co released the next version of the Wholesale Broadband Agreement
(WBA) in December 2013, which replaced the first version of WBA on 1 April
2014.
� As at end of April 2014, NBN Co supplied to 49 customers under a WBA.
Interim Satellite Services are provided under a separate satellite WBA.
Comparison to 2012-
15 Corporate Plan
� 70,000 Premises Activated across all Access Networks at end of FY2013
versus a target of 92,000.
� 211,000 Premises Activated across all Access Networks at end FY2014
versus a target of 551,000.
� Penetration rate of 31% across all Access Networks on Premises
Serviceable and 25% on Premises Passed / Covered at end of FY2013
versus a target of 20%* on Premises Passed / Covered.
� Penetration rate of 38% across all Access Networks on Premises
Serviceable and 32% on Premises Ready For Service at end of FY2014
versus a target of 37%* on Premises Passed / Covered.
� ARPU of $37 for FY2013 versus a target of $29.
� ARPU of $37 for FY2014 versus a target of $32.
FY2015 Estimate � Estimate of 481,000 Premises Activated across all Access Technologies
(cumulative, being the sum of FL Brownfields + FL Greenfields + Fixed
Wireless & Satellite), representing an estimated increase of 2.3x compared
to FY2014.
� Estimate of a weighted monthly ARPU for the period from July 1 2014 to end of June 2015 at $38, representing a stable ARPU compared to FY2014.
Source: NBN Co.
Note: The exhibit above and the discussion below may include estimates and projections. Please refer to NBN Co's Legal Notice on Page 4 of the 2014-17 Corporate Plan for information about estimates and projections stated in this document.
*: The Interim Satellite Service Premises Covered figure reflects the new definition of Premises Covered of 48,000 vs. the 2012-15
Corporate Plan figure of 165,000 for FY2012 and 250,000 for FY2013 and FY2014.
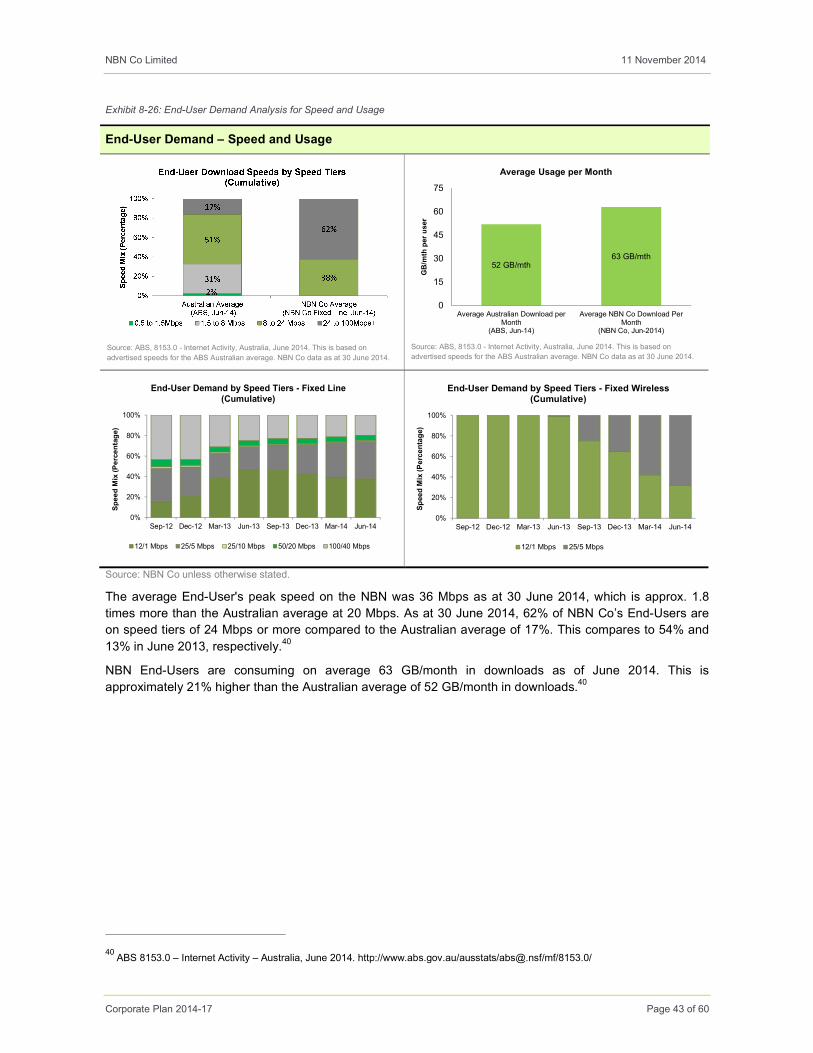
NBN Co Limited 11 November 2014
Corporate Plan 2014-17 Page 43 of 60
Exhibit 8-26: End-User Demand Analysis for Speed and Usage
End-User Demand – Speed and Usage
Source: ABS, 8153.0 - Internet Activity, Australia, June 2014. This is based on
advertised speeds for the ABS Australian average. NBN Co data as at 30 June 2014.
Source: ABS, 8153.0 - Internet Activity, Australia, June 2014. This is based on
advertised speeds for the ABS Australian average. NBN Co data as at 30 June 2014.
Source: NBN Co unless otherwise stated.
The average End-User's peak speed on the NBN was 36 Mbps as at 30 June 2014, which is approx. 1.8
times more than the Australian average at 20 Mbps. As at 30 June 2014, 62% of NBN Co’s End-Users are
on speed tiers of 24 Mbps or more compared to the Australian average of 17%. This compares to 54% and
13% in June 2013, respectively.40
NBN End-Users are consuming on average 63 GB/month in downloads as of June 2014. This is
approximately 21% higher than the Australian average of 52 GB/month in downloads.40
40 ABS 8153.0 – Internet Activity – Australia, June 2014. http://www.abs.gov.au/ausstats/[email protected]/mf/8153.0/
52 GB/mth63 GB/mth
0
15
30
45
60
75
Average Australian Download perMonth
(ABS, Jun-14)
Average NBN Co Download PerMonth
(NBN Co, Jun-2014)
GB/mth per user
Average Usage per Month
0%
20%
40%
60%
80%
100%
Sep-12 Dec-12 Mar-13 Jun-13 Sep-13 Dec-13 Mar-14 Jun-14
Speed Mix (Percentage)
End-User Demand by Speed Tiers - Fixed Line (Cumulative)
12/1 Mbps 25/5 Mbps 25/10 Mbps 50/20 Mbps 100/40 Mbps
0%
20%
40%
60%
80%
100%
Sep-12 Dec-12 Mar-13 Jun-13 Sep-13 Dec-13 Mar-14 Jun-14
Speed Mix (Percentage)
End-User Demand by Speed Tiers - Fixed Wireless (Cumulative)
12/1 Mbps 25/5 Mbps
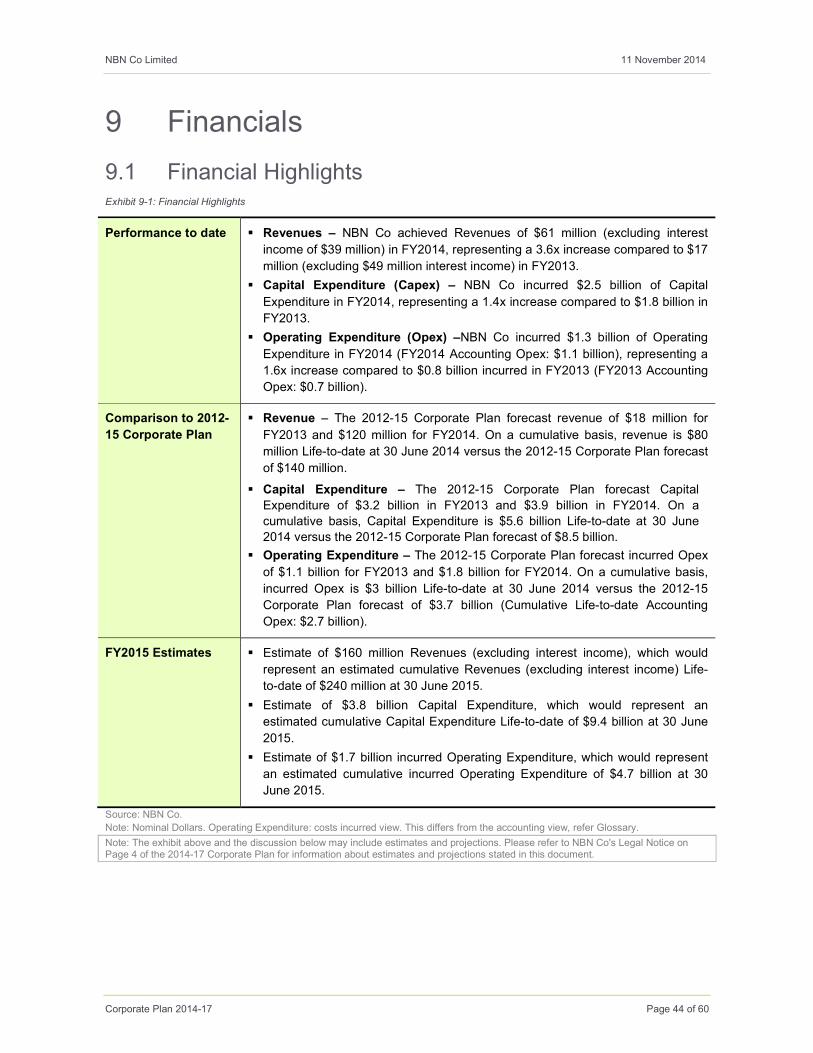
NBN Co Limited 11 November 2014
Corporate Plan 2014-17 Page 44 of 60
9 Financials
9.1 Financial Highlights Exhibit 9-1: Financial Highlights
Performance to date � Revenues – NBN Co achieved Revenues of $61 million (excluding interest
income of $39 million) in FY2014, representing a 3.6x increase compared to $17
million (excluding $49 million interest income) in FY2013.
� Capital Expenditure (Capex) – NBN Co incurred $2.5 billion of Capital
Expenditure in FY2014, representing a 1.4x increase compared to $1.8 billion in
FY2013.
� Operating Expenditure (Opex) –NBN Co incurred $1.3 billion of Operating
Expenditure in FY2014 (FY2014 Accounting Opex: $1.1 billion), representing a
1.6x increase compared to $0.8 billion incurred in FY2013 (FY2013 Accounting
Opex: $0.7 billion).
Comparison to 2012-
15 Corporate Plan
� Revenue – The 2012-15 Corporate Plan forecast revenue of $18 million for
FY2013 and $120 million for FY2014. On a cumulative basis, revenue is $80
million Life-to-date at 30 June 2014 versus the 2012-15 Corporate Plan forecast
of $140 million.
� Capital Expenditure – The 2012-15 Corporate Plan forecast Capital
Expenditure of $3.2 billion in FY2013 and $3.9 billion in FY2014. On a
cumulative basis, Capital Expenditure is $5.6 billion Life-to-date at 30 June
2014 versus the 2012-15 Corporate Plan forecast of $8.5 billion.
� Operating Expenditure – The 2012-15 Corporate Plan forecast incurred Opex
of $1.1 billion for FY2013 and $1.8 billion for FY2014. On a cumulative basis,
incurred Opex is $3 billion Life-to-date at 30 June 2014 versus the 2012-15
Corporate Plan forecast of $3.7 billion (Cumulative Life-to-date Accounting
Opex: $2.7 billion).
FY2015 Estimates � Estimate of $160 million Revenues (excluding interest income), which would
represent an estimated cumulative Revenues (excluding interest income) Life-
to-date of $240 million at 30 June 2015.
� Estimate of $3.8 billion Capital Expenditure, which would represent an
estimated cumulative Capital Expenditure Life-to-date of $9.4 billion at 30 June
2015.
� Estimate of $1.7 billion incurred Operating Expenditure, which would represent
an estimated cumulative incurred Operating Expenditure of $4.7 billion at 30
June 2015.
Source: NBN Co.
Note: Nominal Dollars. Operating Expenditure: costs incurred view. This differs from the accounting view, refer Glossary.
Note: The exhibit above and the discussion below may include estimates and projections. Please refer to NBN Co's Legal Notice on Page 4 of the 2014-17 Corporate Plan for information about estimates and projections stated in this document.
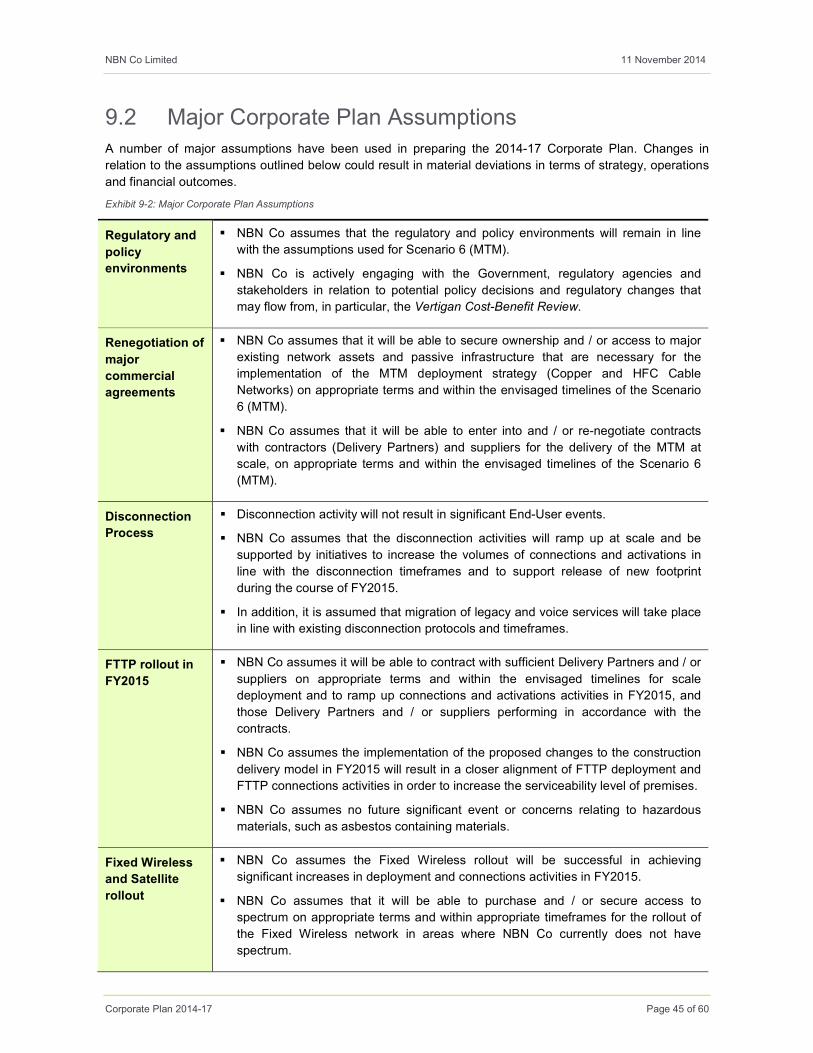
NBN Co Limited 11 November 2014
Corporate Plan 2014-17 Page 45 of 60
9.2 Major Corporate Plan Assumptions
A number of major assumptions have been used in preparing the 2014-17 Corporate Plan. Changes in
relation to the assumptions outlined below could result in material deviations in terms of strategy, operations
and financial outcomes.
Exhibit 9-2: Major Corporate Plan Assumptions
Regulatory and
policy
environments
� NBN Co assumes that the regulatory and policy environments will remain in line
with the assumptions used for Scenario 6 (MTM).
� NBN Co is actively engaging with the Government, regulatory agencies and
stakeholders in relation to potential policy decisions and regulatory changes that
may flow from, in particular, the Vertigan Cost-Benefit Review.
Renegotiation of
major
commercial
agreements
� NBN Co assumes that it will be able to secure ownership and / or access to major
existing network assets and passive infrastructure that are necessary for the
implementation of the MTM deployment strategy (Copper and HFC Cable
Networks) on appropriate terms and within the envisaged timelines of the Scenario
6 (MTM).
� NBN Co assumes that it will be able to enter into and / or re-negotiate contracts
with contractors (Delivery Partners) and suppliers for the delivery of the MTM at
scale, on appropriate terms and within the envisaged timelines of the Scenario 6
(MTM).
Disconnection
Process
� Disconnection activity will not result in significant End-User events.
� NBN Co assumes that the disconnection activities will ramp up at scale and be
supported by initiatives to increase the volumes of connections and activations in
line with the disconnection timeframes and to support release of new footprint
during the course of FY2015.
� In addition, it is assumed that migration of legacy and voice services will take place
in line with existing disconnection protocols and timeframes.
FTTP rollout in
FY2015
� NBN Co assumes it will be able to contract with sufficient Delivery Partners and / or
suppliers on appropriate terms and within the envisaged timelines for scale
deployment and to ramp up connections and activations activities in FY2015, and
those Delivery Partners and / or suppliers performing in accordance with the
contracts.
� NBN Co assumes the implementation of the proposed changes to the construction
delivery model in FY2015 will result in a closer alignment of FTTP deployment and
FTTP connections activities in order to increase the serviceability level of premises.
� NBN Co assumes no future significant event or concerns relating to hazardous
materials, such as asbestos containing materials.
Fixed Wireless
and Satellite
rollout
� NBN Co assumes the Fixed Wireless rollout will be successful in achieving
significant increases in deployment and connections activities in FY2015.
� NBN Co assumes that it will be able to purchase and / or secure access to
spectrum on appropriate terms and within appropriate timeframes for the rollout of
the Fixed Wireless network in areas where NBN Co currently does not have
spectrum.
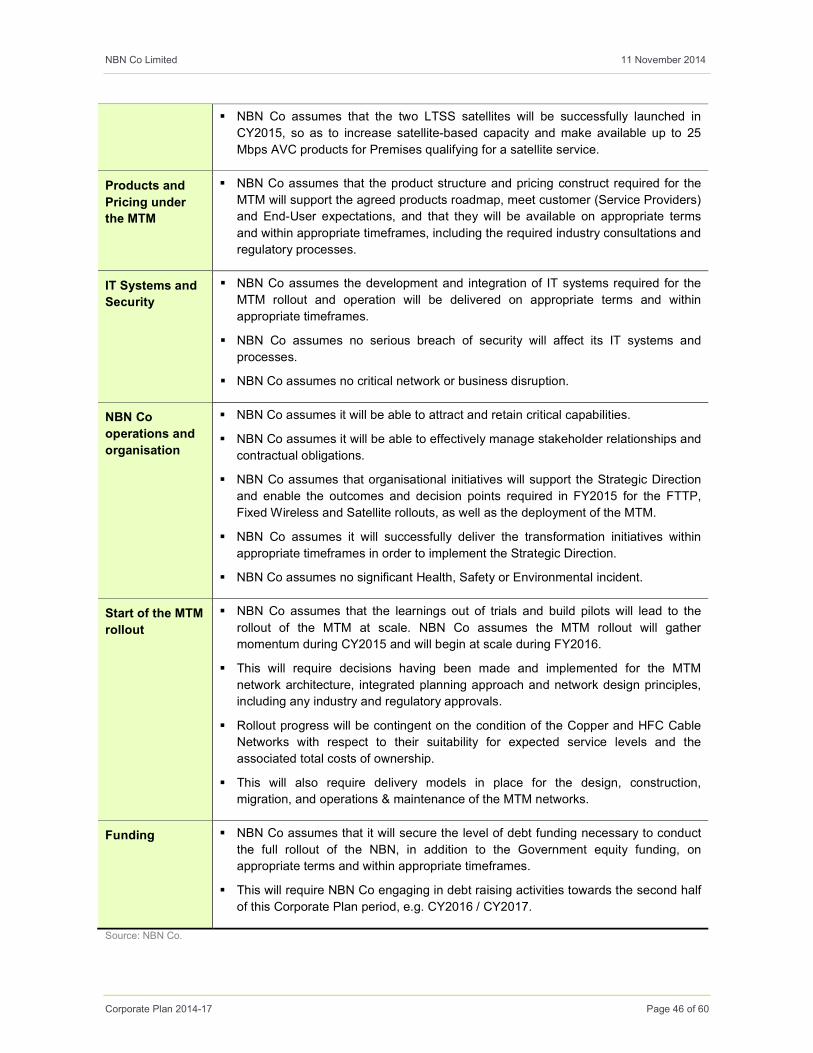
NBN Co Limited 11 November 2014
Corporate Plan 2014-17 Page 46 of 60
� NBN Co assumes that the two LTSS satellites will be successfully launched in
CY2015, so as to increase satellite-based capacity and make available up to 25
Mbps AVC products for Premises qualifying for a satellite service.
Products and
Pricing under
the MTM
� NBN Co assumes that the product structure and pricing construct required for the
MTM will support the agreed products roadmap, meet customer (Service Providers)
and End-User expectations, and that they will be available on appropriate terms
and within appropriate timeframes, including the required industry consultations and
regulatory processes.
IT Systems and
Security
� NBN Co assumes the development and integration of IT systems required for the
MTM rollout and operation will be delivered on appropriate terms and within
appropriate timeframes.
� NBN Co assumes no serious breach of security will affect its IT systems and
processes.
� NBN Co assumes no critical network or business disruption.
NBN Co
operations and
organisation
� NBN Co assumes it will be able to attract and retain critical capabilities.
� NBN Co assumes it will be able to effectively manage stakeholder relationships and
contractual obligations.
� NBN Co assumes that organisational initiatives will support the Strategic Direction
and enable the outcomes and decision points required in FY2015 for the FTTP,
Fixed Wireless and Satellite rollouts, as well as the deployment of the MTM.
� NBN Co assumes it will successfully deliver the transformation initiatives within
appropriate timeframes in order to implement the Strategic Direction.
� NBN Co assumes no significant Health, Safety or Environmental incident.
Start of the MTM
rollout
� NBN Co assumes that the learnings out of trials and build pilots will lead to the
rollout of the MTM at scale. NBN Co assumes the MTM rollout will gather
momentum during CY2015 and will begin at scale during FY2016.
� This will require decisions having been made and implemented for the MTM
network architecture, integrated planning approach and network design principles,
including any industry and regulatory approvals.
� Rollout progress will be contingent on the condition of the Copper and HFC Cable
Networks with respect to their suitability for expected service levels and the
associated total costs of ownership.
� This will also require delivery models in place for the design, construction,
migration, and operations & maintenance of the MTM networks.
Funding � NBN Co assumes that it will secure the level of debt funding necessary to conduct
the full rollout of the NBN, in addition to the Government equity funding, on
appropriate terms and within appropriate timeframes.
� This will require NBN Co engaging in debt raising activities towards the second half
of this Corporate Plan period, e.g. CY2016 / CY2017.
Source: NBN Co.

NBN Co Limited 11 November 2014
Corporate Plan 2014-17 Page 47 of 60
9.3 Financial Estimates for FY2015
NBN Co is currently transitioning into an MTM model as initiated by the Board and Management. There are a
number of external dependencies and outcomes, including the policy setting (outcomes of the Vertigan Cost-
Benefit Review and the Scales Public Policy Review), the negotiations with Telstra and Optus (including the
timely satisfaction of all regulatory approvals), the ability to ramp up volumes and activations, and NBN Co’s
operational and organisational challenges, which, together or individually, may materially affect the financials
for FY2015.
Further progress on the implementation of the new Strategic Direction will help inform NBN Co’s operational
targets and financial projections. Until then the FY2015 numbers represent NBN Co’s best high-level
estimates of the next 12 months.
Exhibit 9-3: Financial Indicators
Financial Indicators (as at 30 June) Actual FY2015 Estimate
Source: NBN Co.
Note: Yearly Incremental Amounts - Nominal Dollars. Operating Expenditure: costs incurred view. This differs from the accounting view,
refer Glossary.
Note: The exhibit above and the discussion below may include estimates and projections. Please refer to NBN Co's Legal Notice on Page 4 of the 2014-17 Corporate Plan for information about estimates and projections stated in this document.
0 40 80 120 160
FY2011
FY2012
FY2013
FY2014
FY2015
$ million
Total Yearly Revenue FY2011 to FY2015 (Nominal Dollars)
0 600 1,200 1,800
FY2011
FY2012
FY2013
FY2014
FY2015
$ million
Total Yearly Opex FY2011 to FY2015 (Nominal Dollars)
0 1,000 2,000 3,000 4,000
FY2011
FY2012
FY2013
FY2014
FY2015
$ million
Total Yearly Capex FY2011 to FY2015 (Nominal Dollars)
0 2,000 4,000 6,000
FY2011
FY2012
FY2013
FY2014
FY2015
$ million
Total Yearly Equity FY2011 to FY2015 (Nominal Dollars)
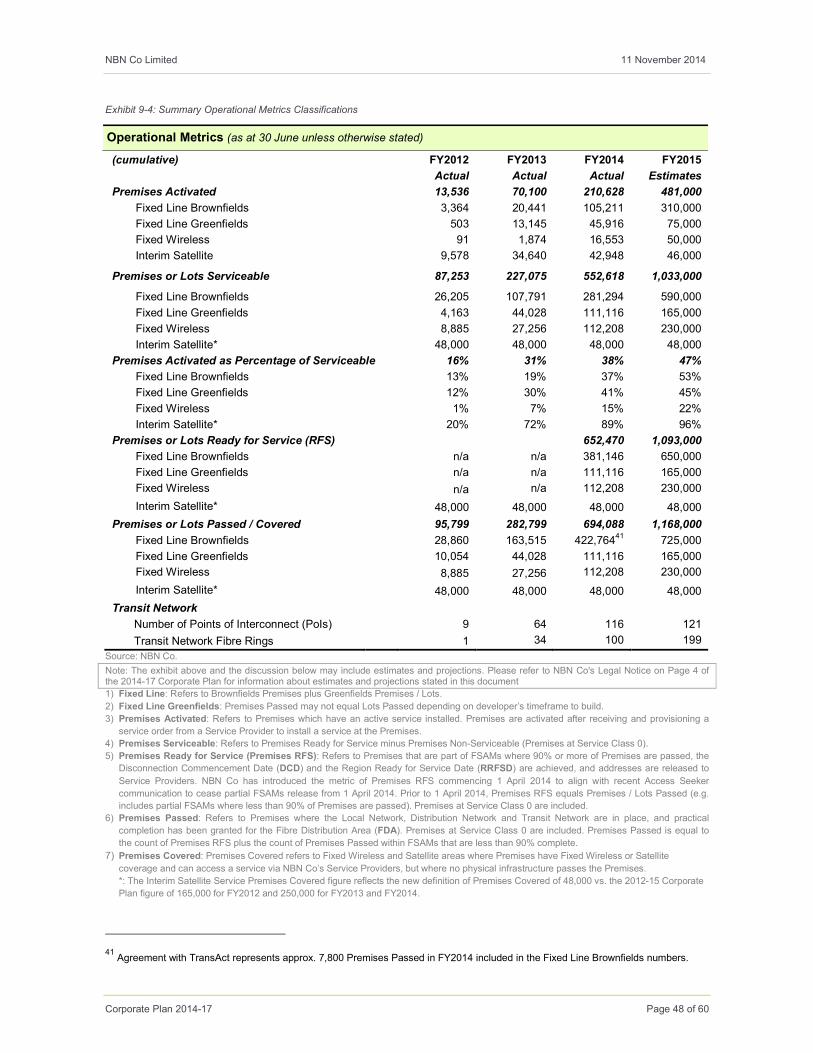
NBN Co Limited 11 November 2014
Corporate Plan 2014-17 Page 48 of 60
Exhibit 9-4: Summary Operational Metrics Classifications
Operational Metrics (as at 30 June unless otherwise stated)
Source: NBN Co.
Note: The exhibit above and the discussion below may include estimates and projections. Please refer to NBN Co's Legal Notice on Page 4 of the 2014-17 Corporate Plan for information about estimates and projections stated in this document
1) Fixed Line: Refers to Brownfields Premises plus Greenfields Premises / Lots.
2) Fixed Line Greenfields: Premises Passed may not equal Lots Passed depending on developer’s timeframe to build.
3) Premises Activated: Refers to Premises which have an active service installed. Premises are activated after receiving and provisioning a
service order from a Service Provider to install a service at the Premises.
4) Premises Serviceable: Refers to Premises Ready for Service minus Premises Non-Serviceable (Premises at Service Class 0).
5) Premises Ready for Service (Premises RFS): Refers to Premises that are part of FSAMs where 90% or more of Premises are passed, the
Disconnection Commencement Date (DCD) and the Region Ready for Service Date (RRFSD) are achieved, and addresses are released to
Service Providers. NBN Co has introduced the metric of Premises RFS commencing 1 April 2014 to align with recent Access Seeker
communication to cease partial FSAMs release from 1 April 2014. Prior to 1 April 2014, Premises RFS equals Premises / Lots Passed (e.g.
includes partial FSAMs where less than 90% of Premises are passed). Premises at Service Class 0 are included.
6) Premises Passed: Refers to Premises where the Local Network, Distribution Network and Transit Network are in place, and practical
completion has been granted for the Fibre Distribution Area (FDA). Premises at Service Class 0 are included. Premises Passed is equal to
the count of Premises RFS plus the count of Premises Passed within FSAMs that are less than 90% complete.
7) Premises Covered: Premises Covered refers to Fixed Wireless and Satellite areas where Premises have Fixed Wireless or Satellite
coverage and can access a service via NBN Co’s Service Providers, but where no physical infrastructure passes the Premises.
*: The Interim Satellite Service Premises Covered figure reflects the new definition of Premises Covered of 48,000 vs. the 2012-15 Corporate
Plan figure of 165,000 for FY2012 and 250,000 for FY2013 and FY2014.
41 Agreement with TransAct represents approx. 7,800 Premises Passed in FY2014 included in the Fixed Line Brownfields numbers.
(cumulative)
FY2012 FY2013 FY2014 FY2015
Actual Actual Actual Estimates
Premises Activated 13,536 70,100 210,628 481,000
Fixed Line Brownfields
3,364 20,441 105,211 310,000
Fixed Line Greenfields
503 13,145 45,916 75,000
Fixed Wireless
91 1,874 16,553 50,000
Interim Satellite
9,578 34,640 42,948 46,000
Premises or Lots Serviceable 87,253 227,075 552,618 1,033,000
Fixed Line Brownfields 26,205 107,791 281,294 590,000
Fixed Line Greenfields 4,163 44,028 111,116 165,000
Fixed Wireless 8,885 27,256 112,208 230,000
Interim Satellite* 48,000 48,000 48,000 48,000
Premises Activated as Percentage of Serviceable 16% 31% 38% 47%
Fixed Line Brownfields 13% 19% 37% 53%
Fixed Line Greenfields 12% 30% 41% 45%
Fixed Wireless 1% 7% 15% 22%
Interim Satellite* 20% 72% 89% 96%
Premises or Lots Ready for Service (RFS) 652,470 1,093,000
Fixed Line Brownfields n/a n/a 381,146 650,000
Fixed Line Greenfields n/a n/a 111,116 165,000
Fixed Wireless n/a n/a 112,208 230,000
Interim Satellite* 48,000 48,000 48,000 48,000
Premises or Lots Passed / Covered 95,799 282,799 694,088 1,168,000
Fixed Line Brownfields 28,860 163,515 422,76441 725,000
Fixed Line Greenfields 10,054 44,028 111,116 165,000
Fixed Wireless 8,885 27,256 112,208 230,000
Interim Satellite* 48,000 48,000 48,000 48,000
Transit Network
Number of Points of Interconnect (PoIs) 9 64 116 121
Transit Network Fibre Rings 1 34 100 199

NBN Co Limited 11 November 2014
Corporate Plan 2014-17 Page 49 of 60
9.4 Financial Assumptions for FY2016 and FY2017
NBN Co is not in a position to generate forecasts with a reasonable level of confidence for FY2016
and FY2017.
Any operational and financial data for FY2016 and FY2017 are referred to as assumptions on
possible outcomes, not as a forecast (FY2016-FY2017 Assumptions). For the purpose of this Plan,
the FY2016-FY2017 Assumptions use the Strategic Reviews Scenario 6 - Multi-Technology Mix
assumptions, pending further confirmation of these assumptions.
The MTM described in the Scenario 6 of the Strategic Reviews intends to minimise peak funding and
optimise long term economics through the rollout of the MTM solution that delivers 50 Mbps download data
rate to a high proportion of the Fixed Line footprint (~90% by 2019, both broadband-served and -
underserved). For the remaining ~10% of Premises not served with 50 Mbps download data rate by 2019, it
seeks to serve those with 25 Mbps download data rate. Exhibit 9-5 provides a financial summary of Scenario
6 (MTM). 42
Exhibit 9-5: Financial Assumptions from Strategic Reviews Scenario 6 (MTM)
Financial Assumptions - Scenario 6 (MTM)
($ bn - Nominal Dollars as at 30 June) FY2016
(Incremental) FY2017
(Incremental) FY2011 – FY2021
(Cumulative)
Revenue1 0.9 1.6 ~18
Opex 2.3 4.1 ~27
Capex 5.8 5.0 ~30
FY2011 – FY2021 ($ bn - Nominal Dollars) (Cumulative)
Equity Funding 29.5
Net Debt Funding ~12
Total Peak Funding2
(Debt and Equity)
~41
Total Peak Funding (All Equity)
~39
Internal Rate of Return3
Revenue Trajectory A 5.4%
Revenue Trajectory B 3.2%
Date of first positive free cashflows
4
FY2022
Source: Strategic Reviews Scenario 6 (MTM) which includes the Fixed Wireless and Satellite Review – May 2014.
Note: The exhibit above and the discussion below may include estimates and assumptions. Please refer to NBN Co's Legal Notice on Page 4 of the 2014-17 Corporate Plan for information about estimates and assumptions stated in this document.
Notes: The numbers above are the Scenario 6 (MTM) sourced from the Strategic Reviews including Fixed Wireless and Satellite Review
(May 2014) and are subject to finalisation of agreements with Telstra and Optus (including ACCC approval). The Scenario 6 (MTM)
financial modelling has assumed for both scenarios that FTTdp and FTTP are available, and used, in order to increase the fraction of
Premises attaining 25 Mbps or greater from 98% to ~100%.
The 2012-15 Corporate Plan included a 10% contingency on Capital Expenditure. The Scenario 6 (MTM) includes a 20% contingency.
1) Table 4-6 in the Strategic Review (December 2013) displayed the average range between the higher and lower case revenue
estimates is ~$300 million in cumulative revenues FY2011-FY2021. Revenue Trajectory A represents a telecommunications market
without significant change, and includes real wholesale residential ARPU decline to NBN Co of 0.3% per annum. Revenue Trajectory
B has lower NBN Co revenues even than Revenue Trajectory A. Revenue Trajectory B might result from a range of market changes.
It includes real wholesale residential ARPU decline to NBN Co of 2.5% per annum.
42 Refer footnote 15 above.
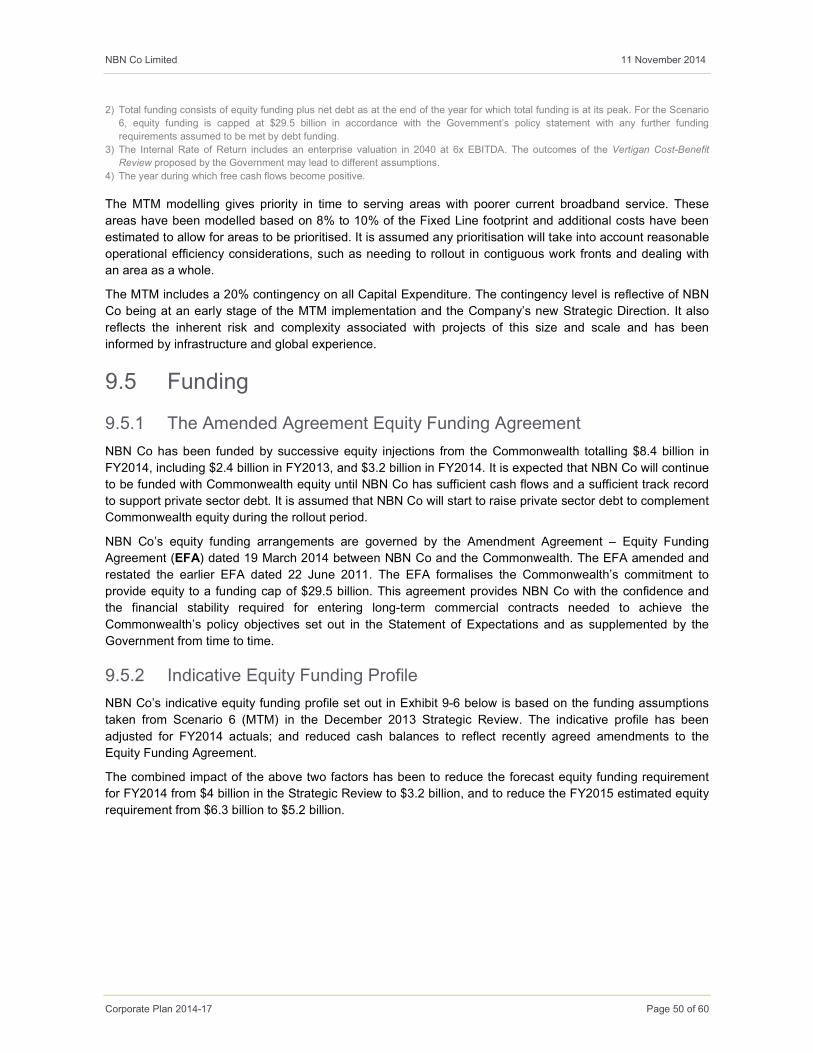
NBN Co Limited 11 November 2014
Corporate Plan 2014-17 Page 50 of 60
2) Total funding consists of equity funding plus net debt as at the end of the year for which total funding is at its peak. For the Scenario
6, equity funding is capped at $29.5 billion in accordance with the Government’s policy statement with any further funding
requirements assumed to be met by debt funding.
3) The Internal Rate of Return includes an enterprise valuation in 2040 at 6x EBITDA. The outcomes of the Vertigan Cost-Benefit
Review proposed by the Government may lead to different assumptions.
4) The year during which free cash flows become positive.
The MTM modelling gives priority in time to serving areas with poorer current broadband service. These
areas have been modelled based on 8% to 10% of the Fixed Line footprint and additional costs have been
estimated to allow for areas to be prioritised. It is assumed any prioritisation will take into account reasonable
operational efficiency considerations, such as needing to rollout in contiguous work fronts and dealing with
an area as a whole.
The MTM includes a 20% contingency on all Capital Expenditure. The contingency level is reflective of NBN
Co being at an early stage of the MTM implementation and the Company’s new Strategic Direction. It also
reflects the inherent risk and complexity associated with projects of this size and scale and has been
informed by infrastructure and global experience.
9.5 Funding
9.5.1 The Amended Agreement Equity Funding Agreement
NBN Co has been funded by successive equity injections from the Commonwealth totalling $8.4 billion in
FY2014, including $2.4 billion in FY2013, and $3.2 billion in FY2014. It is expected that NBN Co will continue
to be funded with Commonwealth equity until NBN Co has sufficient cash flows and a sufficient track record
to support private sector debt. It is assumed that NBN Co will start to raise private sector debt to complement
Commonwealth equity during the rollout period.
NBN Co’s equity funding arrangements are governed by the Amendment Agreement – Equity Funding
Agreement (EFA) dated 19 March 2014 between NBN Co and the Commonwealth. The EFA amended and
restated the earlier EFA dated 22 June 2011. The EFA formalises the Commonwealth’s commitment to
provide equity to a funding cap of $29.5 billion. This agreement provides NBN Co with the confidence and
the financial stability required for entering long-term commercial contracts needed to achieve the
Commonwealth’s policy objectives set out in the Statement of Expectations and as supplemented by the
Government from time to time.
9.5.2 Indicative Equity Funding Profile
NBN Co’s indicative equity funding profile set out in Exhibit 9-6 below is based on the funding assumptions
taken from Scenario 6 (MTM) in the December 2013 Strategic Review. The indicative profile has been
adjusted for FY2014 actuals; and reduced cash balances to reflect recently agreed amendments to the
Equity Funding Agreement.
The combined impact of the above two factors has been to reduce the forecast equity funding requirement
for FY2014 from $4 billion in the Strategic Review to $3.2 billion, and to reduce the FY2015 estimated equity
requirement from $6.3 billion to $5.2 billion.
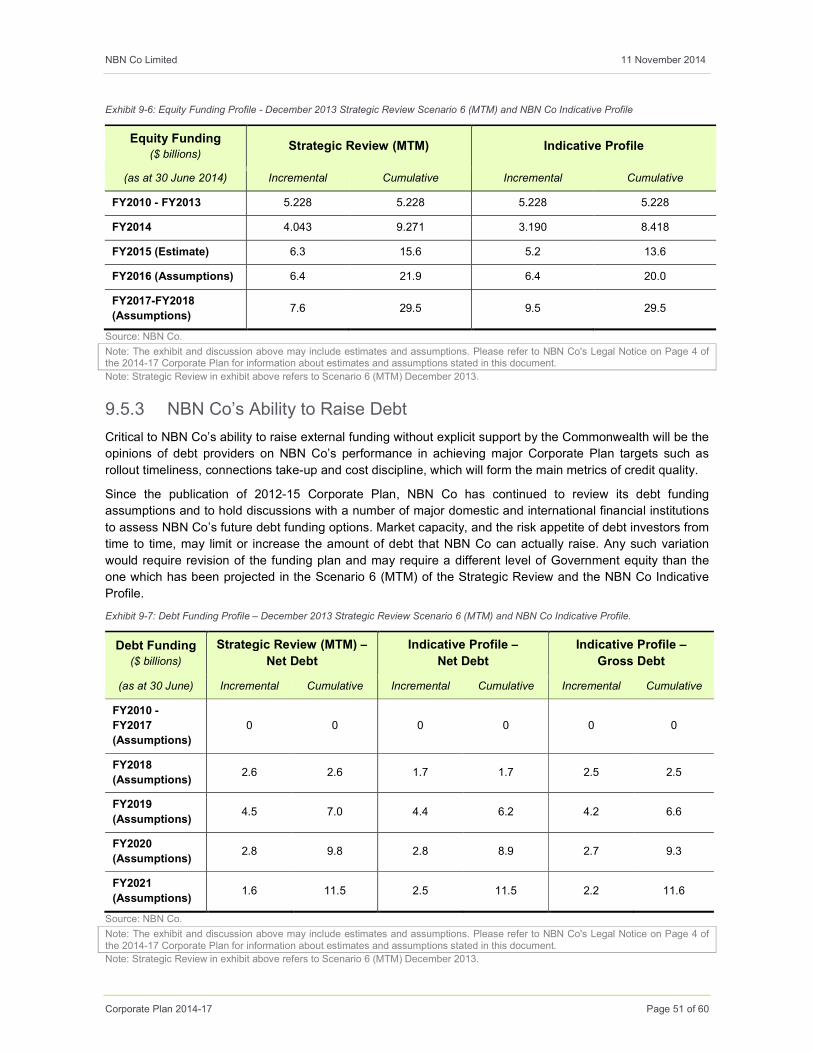
NBN Co Limited 11 November 2014
Corporate Plan 2014-17 Page 51 of 60
Exhibit 9-6: Equity Funding Profile - December 2013 Strategic Review Scenario 6 (MTM) and NBN Co Indicative Profile
Equity Funding ($ billions)
Strategic Review (MTM) Indicative Profile
(as at 30 June 2014) Incremental Cumulative Incremental Cumulative
FY2010 - FY2013 5.228 5.228 5.228 5.228
FY2014 4.043 9.271 3.190 8.418
FY2015 (Estimate) 6.3 15.6 5.2 13.6
FY2016 (Assumptions) 6.4 21.9 6.4 20.0
FY2017-FY2018
(Assumptions) 7.6 29.5 9.5 29.5
Source: NBN Co.
Note: The exhibit and discussion above may include estimates and assumptions. Please refer to NBN Co's Legal Notice on Page 4 of the 2014-17 Corporate Plan for information about estimates and assumptions stated in this document.
Note: Strategic Review in exhibit above refers to Scenario 6 (MTM) December 2013.
9.5.3 NBN Co’s Ability to Raise Debt
Critical to NBN Co’s ability to raise external funding without explicit support by the Commonwealth will be the
opinions of debt providers on NBN Co’s performance in achieving major Corporate Plan targets such as
rollout timeliness, connections take-up and cost discipline, which will form the main metrics of credit quality.
Since the publication of 2012-15 Corporate Plan, NBN Co has continued to review its debt funding
assumptions and to hold discussions with a number of major domestic and international financial institutions
to assess NBN Co’s future debt funding options. Market capacity, and the risk appetite of debt investors from
time to time, may limit or increase the amount of debt that NBN Co can actually raise. Any such variation
would require revision of the funding plan and may require a different level of Government equity than the
one which has been projected in the Scenario 6 (MTM) of the Strategic Review and the NBN Co Indicative
Profile.
Exhibit 9-7: Debt Funding Profile – December 2013 Strategic Review Scenario 6 (MTM) and NBN Co Indicative Profile.
Debt Funding ($ billions)
Strategic Review (MTM) –
Net Debt
Indicative Profile –
Net Debt
Indicative Profile –
Gross Debt
(as at 30 June) Incremental Cumulative Incremental Cumulative Incremental Cumulative
FY2010 -
FY2017
(Assumptions)
0 0 0 0 0 0
FY2018
(Assumptions) 2.6 2.6 1.7 1.7 2.5 2.5
FY2019
(Assumptions) 4.5 7.0 4.4 6.2 4.2 6.6
FY2020
(Assumptions) 2.8 9.8 2.8 8.9 2.7 9.3
FY2021
(Assumptions) 1.6 11.5 2.5 11.5 2.2 11.6
Source: NBN Co.
Note: The exhibit and discussion above may include estimates and assumptions. Please refer to NBN Co's Legal Notice on Page 4 of the 2014-17 Corporate Plan for information about estimates and assumptions stated in this document.
Note: Strategic Review in exhibit above refers to Scenario 6 (MTM) December 2013.
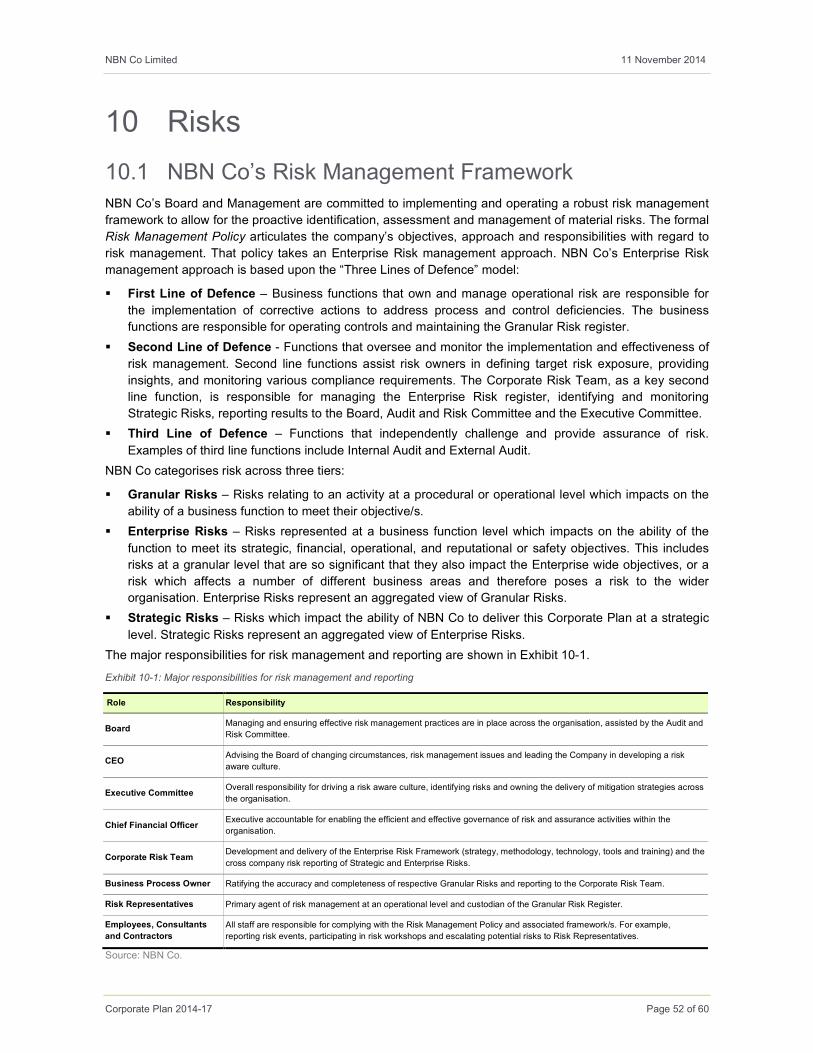
NBN Co Limited 11 November 2014
Corporate Plan 2014-17 Page 52 of 60
10 Risks
10.1 NBN Co’s Risk Management Framework
NBN Co’s Board and Management are committed to implementing and operating a robust risk management
framework to allow for the proactive identification, assessment and management of material risks. The formal
Risk Management Policy articulates the company’s objectives, approach and responsibilities with regard to
risk management. That policy takes an Enterprise Risk management approach. NBN Co’s Enterprise Risk
management approach is based upon the “Three Lines of Defence” model:
� First Line of Defence – Business functions that own and manage operational risk are responsible for
the implementation of corrective actions to address process and control deficiencies. The business
functions are responsible for operating controls and maintaining the Granular Risk register.
� Second Line of Defence - Functions that oversee and monitor the implementation and effectiveness of
risk management. Second line functions assist risk owners in defining target risk exposure, providing
insights, and monitoring various compliance requirements. The Corporate Risk Team, as a key second
line function, is responsible for managing the Enterprise Risk register, identifying and monitoring
Strategic Risks, reporting results to the Board, Audit and Risk Committee and the Executive Committee.
� Third Line of Defence – Functions that independently challenge and provide assurance of risk.
Examples of third line functions include Internal Audit and External Audit.
NBN Co categorises risk across three tiers:
� Granular Risks – Risks relating to an activity at a procedural or operational level which impacts on the
ability of a business function to meet their objective/s.
� Enterprise Risks – Risks represented at a business function level which impacts on the ability of the
function to meet its strategic, financial, operational, and reputational or safety objectives. This includes
risks at a granular level that are so significant that they also impact the Enterprise wide objectives, or a
risk which affects a number of different business areas and therefore poses a risk to the wider
organisation. Enterprise Risks represent an aggregated view of Granular Risks.
� Strategic Risks – Risks which impact the ability of NBN Co to deliver this Corporate Plan at a strategic
level. Strategic Risks represent an aggregated view of Enterprise Risks.
The major responsibilities for risk management and reporting are shown in Exhibit 10-1.
Exhibit 10-1: Major responsibilities for risk management and reporting
Role Responsibility
Board Managing and ensuring effective risk management practices are in place across the organisation, assisted by the Audit and
Risk Committee.
CEO Advising the Board of changing circumstances, risk management issues and leading the Company in developing a risk
aware culture.
Executive Committee Overall responsibility for driving a risk aware culture, identifying risks and owning the delivery of mitigation strategies across
the organisation.
Chief Financial Officer Executive accountable for enabling the efficient and effective governance of risk and assurance activities within the
organisation.
Corporate Risk Team Development and delivery of the Enterprise Risk Framework (strategy, methodology, technology, tools and training) and the
cross company risk reporting of Strategic and Enterprise Risks.
Business Process Owner Ratifying the accuracy and completeness of respective Granular Risks and reporting to the Corporate Risk Team.
Risk Representatives Primary agent of risk management at an operational level and custodian of the Granular Risk Register.
Employees, Consultants
and Contractors
All staff are responsible for complying with the Risk Management Policy and associated framework/s. For example,
reporting risk events, participating in risk workshops and escalating potential risks to Risk Representatives.
Source: NBN Co.
NBN Co Limited 11 November 2014
Corporate Plan 2014-17 Page 53 of 60
10.2 Strategic Risks
The NBN Co Board and Management have identified the following major Strategic Risks to achieving the
2014-17 Corporate Plan objectives:
� Unfavourable policy or regulatory environment in relation to the NBN.
� Ability to scale End-User connection processes to support product delivery.
� Significant Health, Safety or Environmental incident.
� Ability to scale systems and processes to meet anticipated increase in activity.
� Challenges in implementing the MTM model to achieve expected benefits.
� Failure to renegotiate Telstra and Optus deals on appropriate terms and within appropriate timeframes.

NBN Co Limited 11 November 2014
Corporate Plan 2014-17 Page 54 of 60
11 Appendix
11.1 Glossary of Terms
Abbreviation Definitions
ABS Australian Bureau of Statistics.
ACCC Australian Competition and Consumer Commission.
Access Aggregation Region
(AAR)
The area served by a Point of Interconnect (PoI) located in an Aggregation Node (AN) and connected via Transit
Fibre to regional Fibre Access Node (FAN) sites.
Access Seeker A customer acquiring NBN Co wholesale services with the intention to supply broadband services to Service
Providers or End-Users.
Access Technology The technology used by NBN Co to deliver the NBN from the exchange location to the network distribution point.
Access Virtual Circuit (AVC) The bandwidth allocated to the End-User Premises.
Activation works
The activities required to activate End-User Premises. For Fibre-to-the-Premises, this typically requires a truck roll
to install NBN Co’s active equipment (referred to as the Network Termination Device (NTD)). The NTD is typically
installed inside the Premises at the time of an order.
Aggregation Node (AN)
A facility that provides a Point of Interconnect (PoI) to RSPs / WSPs for an Access Aggregation Region (AAR),
comprising a number of regional Fibre Access Nodes (FANs) sites. Note that an AN will also typically have a co-
located FAN site for its local area.
April 2014 Statement of
Expectations
Letter to NBN Co from its Shareholder Ministers dated 08 April 2014. See:
http://www.communications.gov.au/__data/assets/pdf_file/0014/221162/SOE_Shareholder_Minister_letter.pdf
Asymmetric Digital Subscriber
Line (ADSL)
A technology for delivering high-speed data transmission over a copper phone line. Provides different downstream
(network to End-User) and upstream (End-User to network) bandwidth.
Average Revenue Per User
(ARPU) Calculations include all telecommunications revenue generated including AVC, CVC and NNI products.
Brownfields Pre-existing Premises.
Business Support System
(BSS)
The set of systems that will provide NBN Co with the capabilities to manage, take orders, process bills and collect
payments.
Business-to-Business (B2B) Commerce transactions between businesses.
Drop
(also commonly referred to as
a Lead-in)
The connection from the street to a termination point at the Premises. Typically for the Fibre-To-The-Premises
Access Technology, the Drop is from a Network Access Point (NAP) located inside a pit, manhole, or on a pole, to a
passive termination point located inside the property boundary and called the Premises Connection Device (PCD).
The PCD is typically located inside the property boundary of the Premises but outside of the Premises, e.g. on the
wall of the Premises or near the Premises.
Build Drop Where the connection from the street (typically from a Network Access Point (NAP) located inside a pit, manhole, or
on a pole) to the Premises (typically to a passive termination point located inside the property boundary and called
the Premises Connection Device (PCD)) is carried out when the Local Network and Distribution Network (LNDN) of
the Fibre Network are being built. The PCD is typically located inside the property boundary of the Premises but
outside of the Premises, e.g. on the wall of the Premises or near the Premises.
Build Drops are being installed ahead of a Service Provider asking for an End-User Connection so as to minimise
Activations works required at the time of the order and reduce the time it takes to process an Activation order.
Bulk Drop Where the connection from the street (from a pit, manhole, or pole) to the Premises is carried out after the Local
Network and Distribution Network of the Fibre Network are built but under a Build Drop approach, e.g. ahead of a
Service Provider request for an End-User Connection so as to minimise Activations works required at the time of
the order and reduce the time it takes to process an Activation order.
Capital Expenditure (Capex) The cost of purchasing tangible and intangible assets.
CCO Chief Customer Office.
Common Network
Infrastructure (CNI) Network infrastructure installed at NBN Co FAN, PoI and other Transit Network sites.
Complex Premises Premises categorised as requiring bespoke engagement, cabling or project management, these include Premises
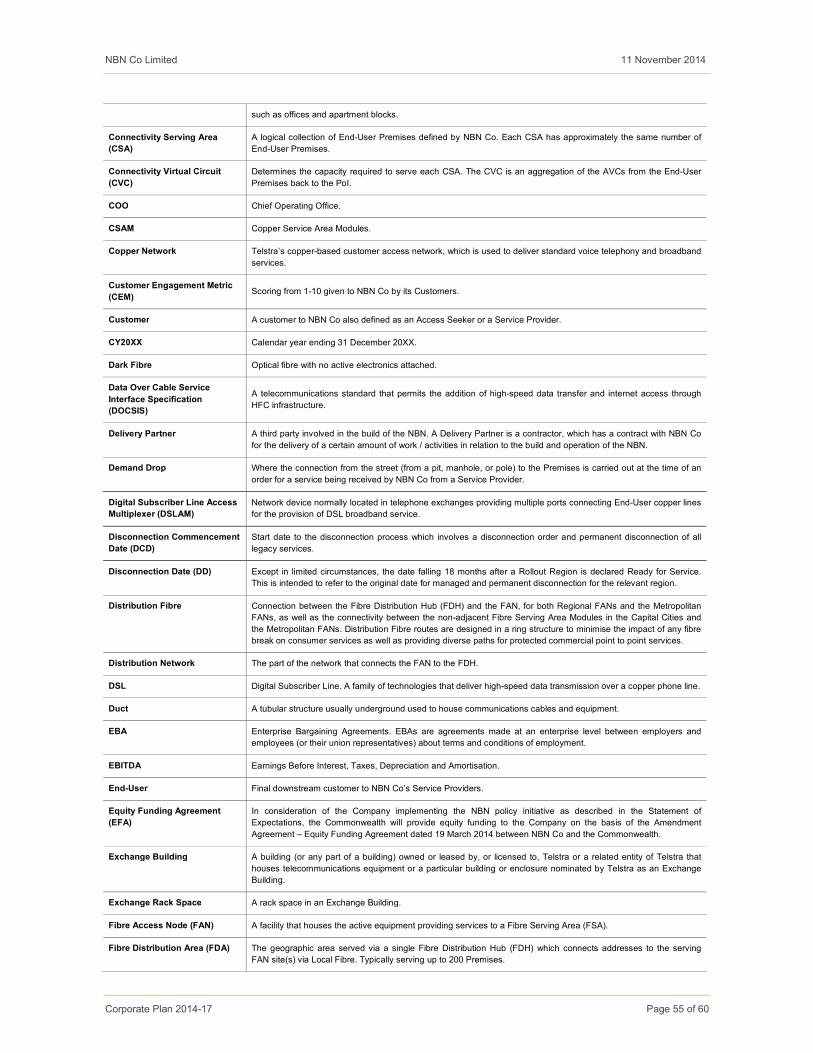
NBN Co Limited 11 November 2014
Corporate Plan 2014-17 Page 55 of 60
such as offices and apartment blocks.
Connectivity Serving Area
(CSA)
A logical collection of End-User Premises defined by NBN Co. Each CSA has approximately the same number of
End-User Premises.
Connectivity Virtual Circuit
(CVC)
Determines the capacity required to serve each CSA. The CVC is an aggregation of the AVCs from the End-User
Premises back to the PoI.
COO Chief Operating Office.
CSAM Copper Service Area Modules.
Copper Network Telstra’s copper-based customer access network, which is used to deliver standard voice telephony and broadband
services.
Customer Engagement Metric
(CEM) Scoring from 1-10 given to NBN Co by its Customers.
Customer A customer to NBN Co also defined as an Access Seeker or a Service Provider.
CY20XX Calendar year ending 31 December 20XX.
Dark Fibre Optical fibre with no active electronics attached.
Data Over Cable Service
Interface Specification
(DOCSIS)
A telecommunications standard that permits the addition of high-speed data transfer and internet access through
HFC infrastructure.
Delivery Partner A third party involved in the build of the NBN. A Delivery Partner is a contractor, which has a contract with NBN Co
for the delivery of a certain amount of work / activities in relation to the build and operation of the NBN.
Demand Drop Where the connection from the street (from a pit, manhole, or pole) to the Premises is carried out at the time of an
order for a service being received by NBN Co from a Service Provider.
Digital Subscriber Line Access
Multiplexer (DSLAM)
Network device normally located in telephone exchanges providing multiple ports connecting End-User copper lines
for the provision of DSL broadband service.
Disconnection Commencement
Date (DCD)
Start date to the disconnection process which involves a disconnection order and permanent disconnection of all
legacy services.
Disconnection Date (DD) Except in limited circumstances, the date falling 18 months after a Rollout Region is declared Ready for Service.
This is intended to refer to the original date for managed and permanent disconnection for the relevant region.
Distribution Fibre Connection between the Fibre Distribution Hub (FDH) and the FAN, for both Regional FANs and the Metropolitan
FANs, as well as the connectivity between the non-adjacent Fibre Serving Area Modules in the Capital Cities and
the Metropolitan FANs. Distribution Fibre routes are designed in a ring structure to minimise the impact of any fibre
break on consumer services as well as providing diverse paths for protected commercial point to point services.
Distribution Network The part of the network that connects the FAN to the FDH.
DSL Digital Subscriber Line. A family of technologies that deliver high-speed data transmission over a copper phone line.
Duct A tubular structure usually underground used to house communications cables and equipment.
EBA Enterprise Bargaining Agreements. EBAs are agreements made at an enterprise level between employers and
employees (or their union representatives) about terms and conditions of employment.
EBITDA Earnings Before Interest, Taxes, Depreciation and Amortisation.
End-User Final downstream customer to NBN Co’s Service Providers.
Equity Funding Agreement
(EFA)
In consideration of the Company implementing the NBN policy initiative as described in the Statement of
Expectations, the Commonwealth will provide equity funding to the Company on the basis of the Amendment
Agreement – Equity Funding Agreement dated 19 March 2014 between NBN Co and the Commonwealth.
Exchange Building A building (or any part of a building) owned or leased by, or licensed to, Telstra or a related entity of Telstra that
houses telecommunications equipment or a particular building or enclosure nominated by Telstra as an Exchange
Building.
Exchange Rack Space A rack space in an Exchange Building.
Fibre Access Node (FAN) A facility that houses the active equipment providing services to a Fibre Serving Area (FSA).
Fibre Distribution Area (FDA) The geographic area served via a single Fibre Distribution Hub (FDH) which connects addresses to the serving
FAN site(s) via Local Fibre. Typically serving up to 200 Premises.
NBN Co Limited 11 November 2014
Corporate Plan 2014-17 Page 56 of 60
Fibre Distribution Hub (FDH) The equipment located in a Fibre Distribution Area where Distribution Fibre is split to provide Local Fibre that runs
down each street.
Fibre Footprint The Premises that will be serviceable by NBN Co’s FTTP network by the end of the Rollout Period.
Fibre Network, also defined as
NBN Co Fibre Network or the
FTTP Network
NBN Co’s optical fibre telecommunications network that is owned or controlled by NBN Co and which has been
accepted into service, ready for the provision of commercial (non-trial) NBN services. NBN Co’s Fibre Network is
based on GPON architecture.
Fibre Serving Area (FSA) The area served by a FAN site, which for the regional areas will be a cluster of FDAs and for the 16 city
metropolitan locations will be a cluster of FSA Modules. The FDAs and FSA Modules will be connected via
Distribution Fibre.
Fibre Serving Area Module
(FSAM)
A series of up to 16 FDAs linked in a double loop configuration. Typically, a single fibre sheath will connect the
FSAM and its (up to 16) FDHs back to a nominated Fibre Access Node (FAN). An FSAM may be a small town or a
part suburb in the case of large cities. The number of Premises contained in an FSAM is typically between 2,000 –
3,000, depending on location and network planning / topology.
Fibre to the Premises (FTTP) Network design in which the Fibre Network is deployed to each Premises.
It involves connecting homes and businesses with an optical fibre cable which can be used to provide a range of
high speed broadband services and phone services.
Fibre-To-The-Basement (FTTB) Network design in which the Fibre Network is deployed to the basement of a building.
Fibre-To-The-Distribution Point
(FTTdp) Network design in which the Fibre Network is deployed to a distribution point near the Premises.
Fibre-To-The-Node (FTTN) Network design in which the Fibre Network is deployed to the node (i.e. a VDSL cabinet), while copper lines are
used for the connection between the node and the Premises.
Fibre-To-The-x (FTTx) Fibre to the x (FTTx) is a generic term for any broadband network architecture using optical fibre to replace all or
part of the usual metal local loop used for last mile telecommunications. The generic term was initially a
generalisation for several configurations of fibre deployment (FTTN, FTTC, FTTB, FTTH...), all starting with ‘FTT’
but differentiated by the last letter, which is substituted by an x in the generalisation.
Fixed Line (FL) Delivery of voice, data and broadband services over a physical line from the exchange location to the End-User
Premises (with termination at that Premises).
Fixed Line Brownfields NBN Co’s Fixed Line footprint of Brownfields Premises.
Fixed Line Greenfields NBN Co’s Fixed Line footprint of Greenfields Premises.
Fixed Wireless Network design in which network connections are provided through radio signals.
FSC Federal Safety Commissioner.
FY20XX The financial year ending 30 June 20XX.
Geocoded National Address
File (GNAF)
GNAF information is provided by PSMA Australia Limited (PSMA). GNAF lists all valid physical addresses in
Australia. It contains approximately 12.6 million physical addresses, each linked to its unique geocode (that is, the
specific latitude and longitude of the address). Data used to build GNAF comes from contributors that include the
Australian Electoral Commission, Australia Post, state, territory and Australian Government mapping agencies and
land registries. GNAF is provided by PSMA.
Gigabit-Capable Passive
Optical Network (GPON)
A point to multi-point Fibre-to-the-Premises Network architecture that uses combination of electronics network and
passive optical splitters to deliver speeds up to 1,000 Mbps to End-Users.
The GPON active layer technology uses electronics that are designed to be compatible with a fibre that is
subsequently split into multiple downstream fibres.
Government Reference to the Commonwealth or Cth is used interchangeably with Government.
Government Business
Enterprise (GBE)
Commonwealth authority or Commonwealth company as defined by the Commonwealth Authorities and Companies
Act 1997 (Cth) (CAC Act) and prescribed as a GBE under the Commonwealth Authorities and Companies
Regulations 1997 (Cth) (CAC Regulations).
Greenfields A new development that can be either New Developments or Infills. Greenfields developments represent the growth
of the Premises market.
Health, Safety & Environment
(HSE)
The activities responsible for establishing and maintaining policies regarding employee health, safety and
environment issues.
Hybrid Fibre Coaxial (HFC)
Cable Networks Networks utilising both optical fibre and coaxial cable for the delivery of Pay TV, internet and voice services.
Infills A type of Greenfields development where new Premises or a redevelopment (i.e. demolition and rebuild) are
NBN Co Limited 11 November 2014
Corporate Plan 2014-17 Page 57 of 60
planned to be built on currently developed land that is surrounded by established areas, where Telstra copper
services are currently available.
Interim Satellite Service
(ISS)
NBN Co’s Interim Satellite Service was launched on 1 July 2011 to provide access to broadband services to people
in homes, small businesses and indigenous communities in some of the most remote areas of Australia. The
Interim Satellite Service is a temporary measure until NBN Co launches its own Long Term Satellite Service
scheduled for 2015.
Internal Rate of Return (IRR) The average annual total return from an investment over a specified time period, used to measure and compare the
profitability of the investment.
Ka-band Satellite radio frequency spectrum from 27 – 40 GHz.
Key Performance Indicator
(KPI) A metric used to measure the progress or degree of fulfilment of a particular success criterion.
Kilobits per second (Kbps) A unit of measurement of transmission speed. One Kilobit Per Second is equal to 1,024 bits per second.
Layer 2 Network / Wholesale
Services
The transmission layer that encodes and decodes information bits across layer 1 infrastructure. Layer 2 is the active
layer of an optical fibre network.
Lead in Conduit (LIC) A lead-in conduit is the pipe or conduit carrying the lead-in cable between the End-User’s Premises and nearest pit,
manhole or pole.
Line Sharing Service (LSS) Enables telecom operators to use the high frequency part of the phone line to provide ADSL2+ using their own
equipment, while Telstra still provides the normal voice service.
Local Network The part of the network from the Fibre Distribution Hub down each street.
Long Term Satellite Service
(LTSS) NBN Co launched satellites which will provide broadband service to Australia in predominantly rural locations.
Lots Passed Premises Passed may not equal Lots Passed depending on developer’s timeframe to build.
In New Development estates, NBN Co may be deploying FTTP infrastructure and pass Lots ahead of the Premises
being built in that estate, depending on the developer’s timeframe to build.
LTI Lost Time Injuries.
Megabits Per Second (Mbps) A unit of measurement of transmission speeds. One Megabit Per Second is equal to 1,000 kbps. X / Y Mbps means
a maximum downstream speed of X Mbps and a maximum upstream speed of Y Mbps.
MTM Multi-Technology Mix.
Multiple-Dwelling Unit (MDU) Premises that contains more than one dwelling unit, which can range from duplexes to 200+ unit apartment blocks.
Each dwelling unit is assumed as equivalent to one GNAF (e.g. a 50 unit apartment block will have 50 GNAFs).
MDUs come in a variety of formats and may include vertical buildings, horizontal buildings, gated communities,
business parks, etc.
MDU Drop The activities required to connect an End-User Premises located in a Multi-Dwelling Unit. This typically requires a
drop from a pit, manhole or pole to the basement of the building and all the activities required to go from the
basement of the building to the termination point closest to the outside of the tenancy.
National Broadband Network
(NBN)
The nation-wide broadband network that will be deployed by NBN Co and third parties engaged on behalf of NBN
Co.
NBN Co NBN Co Limited.
Network Access Points (NAP) The point at which Drop Fibre is connected to Local Fibre.
Network and Service
Operations Centre (NSOC) Facility overseeing management and operation of the network infrastructure.
Network Termination Device
(NTD)
NBN Co’s termination point on each premise, for residential fibre services (typically) featuring 4 Ethernet and 2
telephone interfaces.
Network-to-Network Interface
(NNI)
The port at NBN Co’s Point of Interconnect (PoI) where Service Providers connect their internet transmission
backhaul.
New Developments
(Greenfields Estates)
A New Development is defined as an estate that complies with the New Development Policy statements released
by the Government.
New Developments includes commercial, industrial and residential estates comprising of more than 100 lots with
development approval to be released within a 3 year period located in NBN Co’s long term Fibre Footprint.
For the role of NBN Co with regards to Greenfields developments, refer to the appropriate policy as befitting the
circumstance. http://www.nbnco.com.au/industry/new-developments.html
NBN Co Limited 11 November 2014
Corporate Plan 2014-17 Page 58 of 60
Operating Expenditure (Opex) The ongoing cost of running a business, system or product, including payments under lease agreements.
For the purpose of the Corporate Plan, Operating Expenditure includes all nominal payments, such as nominal
payments under finance lease agreements. This nominal view of costs incurred may differ from the accounting
treatment under statutory accounting rules.
Operational Support Systems
(OSS)
The set of systems that will provide NBN Co with the capabilities to provision, configure, manage, and operate the
NBN.
Optical Line Terminal (OLT) The equipment to provide the GPON signals to each of the FDAs.
Optus HFC Agreement The agreement between NBN Co and Singtel Optus Pty Ltd and other Optus entities (Optus) which was executed
on 23 June 2011. The Optus HFC Agreement provides for the progressive migration of Optus HFC subscribers to
the NBN as it is rolled out. NBN Co has agreed to make progressive payments to Optus, based on the number of
Optus subscribers that migrate from its HFC Cable Network.
Point of Interconnect (PoI) The connection point that allows RSPs and WSPs to connect to the NBN Co access capability. In the field, this is
the physical port on the Ethernet Fanout Switch (EFS) switch located at NBN Co’s PoI, where an Access Seeker
connects to establish exchange of traffic with NBN Co’s network.
PON Please refer to Gigabit-Capable Passive Optical Network (GPON).
Premises Premises are defined as addressable locations which NBN Co is required to connect and are included at
Attachment A – Premises Definition, of the December 2010 Statement of Expectations. The Statement of
Expectations refers to this definition as the basis for measuring NBN Co's achievement of the Government's
coverage objectives.
Premises Activated Refers to Premises which have an active service installed.
Premises are activated after receiving and provisioning a service order from a Retail Service Provider (Service
Provider) to install a new service at the Premises.
Premises Connection Device
(PCD)
Typically the termination point of the Drop for the Fibre-To-The-Premises Access Technology.
Premises Covered Premises Covered refers to Fixed Wireless and Satellite areas where Premises have Fixed Wireless or Satellite
coverage and can access a service via NBN Co’s Service Providers, but where no physical infrastructure passes
the Premises.
Premises Passed Premises Passed count includes Premises where the Local Network, Distribution Network and Transit Network are
in place, and practical completion has been granted for the Fibre Distribution Area (FDA).
Premises at Service Class 0 are included.
Premises Passed is equal to the count of Premises RFS plus the count of Premises Passed within FSAMs that are
less than 90% complete.
Premises Ready for Service
(Premises RFS)
Premises included are part of FSAMs where 90% or more of Premises are Passed, and the Disconnection
Commencement Date (DCD) and the Region Ready for Commencement Date (RRFSD) are achieved with
addresses released to NBN Co’s Service Providers through NBN Co’s portal.
Premises at Service Class 0 are included.
Premises Serviceable Premises Passed by the NBN Fibre Network that NBN Co has determined are serviceable by the NBN Fibre
Network, as shown in the NBN Co Service Class qualification system.
For the purpose of the 2014-17 Corporate Plan this means Premises Ready for Service minus Premises Non-
Serviceable (Premises at Service Class 0).
Premises Non-Serviceable Premises Passed by the NBN Fibre Network that NBN Co has determined are non-serviceable by the NBN Fibre
Network, as shown in the NBN Co service qualification system.
For the purpose of the 2014-17 Corporate Plan this means Premises at Service Class 0.
Product Development Forum See http://www.nbnco.com.au/industry/service-providers/industry-consultation/product-development-forum.html
PSMA - Australia Public Sector Mapping Agencies – Australia.
Ready for Service (RFS) A Rollout Region is Ready for Service when NBN Co is ready to begin connecting Premises in that Rollout Region
to the NBN Fibre Network, which is when the NBN Fibre Network has passed at least 90% of the premises in the
NBN Fibre Footprint in that Rollout Region.
Region Ready for Service Date
(RRFSD) Date the entire region or FSAM is declared RFS.
Regional Backhaul Blackspots
Programme (RBBP) An initiative of Department of Broadband, Communications and the Digital Economy (now Department of
Communications), as part of the NBN, which is investing up to $250 million to immediately address areas where
existing backhaul does not provide broadband access throughout regional Australia.
Retail Service Provider (RSP) A third party provider of retail broadband services to End–Users.
Rollout Region A region served by the Fibre Network. A Rollout Region is typically, but not always, a Fibre Serving Area Module

NBN Co Limited 11 November 2014
Corporate Plan 2014-17 Page 59 of 60
(FSAM).
Scales Public Policy Review Means the independent audit of the NBN public policy process that resulted in the establishment of NBN Co.
Service Class (SC) Means the classification under the WBA (for the purposes of determining whether it is ready to be connected to the
NBN) of a Premises according to the status of the physical infrastructure applicable to that Premises, and consists
of the following types: Service Class 0 (SC0), Service Class 1 (SC1), Service Class (SC2), Service Class 3 (SC3),
Service Class 4 (SC4), Service Class (SC5) and Service Class 6 (SC6), which are each defined in the WBA
Dictionary at http://www.nbnco.com.au/content/dam/nbnco/documents/sfaa-wba2-dictionary_20140430.pdf
Service Class 0 Category given to a Premises that is in the NBN Co Fibre Network footprint but which cannot presently be provided
with an NBN fibre service and is further defined in the WBA Dictionary at:
http://www.nbnco.com.au/content/dam/nbnco/documents/sfaa-wba2-dictionary_20140430.pdf
Service Providers A third party provider of broadband services whether to End-Users and/or Retail Service Providers (See also Retail
Service Providers and Wholesale Service Providers).
Single Dwelling Unit (SDU) Premises that contain only one dwelling unit. One SDU is equivalent to one GNAF.
Special Access Undertaking
(SAU)
The part of the regulatory framework that governs the prices NBN Co, as a wholesale open access
telecommunications network, can charge for the services it supplies to retail telecommunications companies, as
well as other terms.
Special Services Particular types of services as defined in the Telstra DAs which are provided over the Copper Network and which
may not be disconnected on the Disconnection Date for a Rollout Region. A separate regime (with a different
timeframe for disconnection) applies to disconnection of special services provided over the Copper Network.
Disconnection protocols have been agreed to govern this.
Statement of Expectations
(SoE)
Letter to NBN Co from its Shareholder Ministers dated 08 April 2014. See:
http://www.communications.gov.au/__data/assets/pdf_file/0014/221162/SOE_Shareholder_Minister_letter.pdf
Strategic Reviews Includes the December 2013 Strategic Review and the May 2014 Fixed Wireless and Satellite Strategic Review.
Telstra Definitive Agreements
or Telstra DAs
The suite of agreements entered into between NBN Co and Telstra on 23 June 2011 and which are described in the
release issued by Telstra to the ASX on that day.
Transit Fibre Connection between PoIs where Service Providers connect to the NBN, and the regional based FANs. Transit Fibre
can also provide connectivity for the Metropolitan FANs to PoIs if required.
Transit Network The fibre rings which connect the regional FAN sites and the nearest PoI, served by Transit Fibre.
Transit Rings A grouping of Dark Fibre Links and Exchange Rack Spaces that are identified as being part of the same transit ring
in the Initial Rollout Plan or any subsequent rollout plan agreed under the Telstra Infrastructure Services
Agreement. This grouping is based on the design of NBN Co’s Transit Network, which typically involves a series of
related Dark Fibre Links and Equipment Rack Spaces forming all or part of a ring-like pattern.
Unconditional Local Loop
Service (ULLS)
Use of unconditioned communications wire between the boundaries of a telecommunications network at an End-
User’s Premises and a point on a telecommunications network that is a potential point of interconnection located at
or associated with a customer access module and located on the End-User side of the customer access module.
User Network Interface (UNI) The physical port on the NBN Co NTD at the End-User Premises which connects the End-User’s residential
gateway or Ethernet enabled device to the NBN which could be either a UNI-D (User Network Interface – Data) or
UNI-V (User Network Interface – Voice).
VDSL Very-High-Bit-Rate Digital Subscriber Line.
Vertigan Cost-Benefit Review Means the cost-benefit analysis and review of the regulatory arrangements for the NBN being conducted by the
panel comprising Dr Michael Vertigan AC, Ms Alison Deans, Professor Henry Ergas and Mr Tony Shaw PSM.
Wholesale Broadband
Agreement (WBA)
A document which sets out the terms and conditions of access to NBN Co’s services and products. The WBA
constitutes a standard form of access agreement for the purposes of the Division 6A of Part XIC of the Competition
and Consumer Act 2010 (Cth) (CCA).
Wholesale Service Provider
(WSP) A provider of wholesale services to Service Providers.
Work Health & Safety (WHS) A discipline concerned with protecting the safety, health and welfare of people engaged in work or employment.
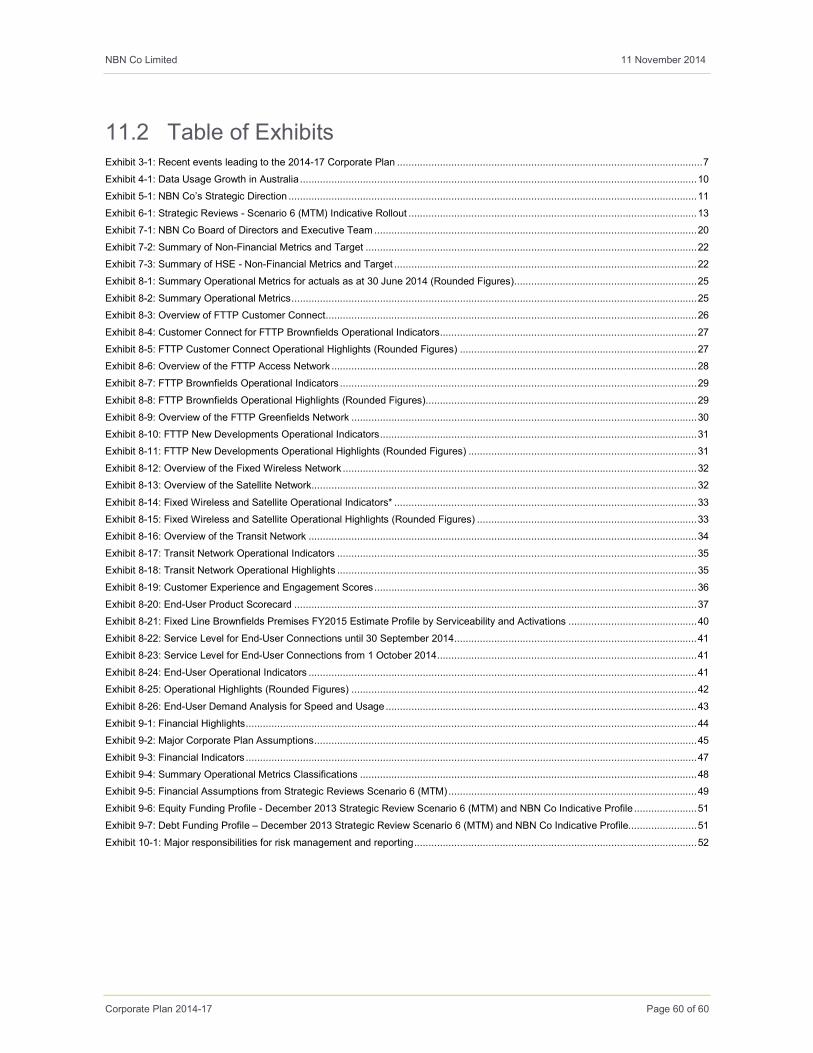
NBN Co Limited 11 November 2014
Corporate Plan 2014-17 Page 60 of 60
11.2 Table of Exhibits Exhibit 3-1: Recent events leading to the 2014-17 Corporate Plan ........................................................................................................... 7
Exhibit 4-1: Data Usage Growth in Australia ........................................................................................................................................... 10
Exhibit 5-1: NBN Co’s Strategic Direction ............................................................................................................................................... 11
Exhibit 6-1: Strategic Reviews - Scenario 6 (MTM) Indicative Rollout ..................................................................................................... 13
Exhibit 7-1: NBN Co Board of Directors and Executive Team ................................................................................................................. 20
Exhibit 7-2: Summary of Non-Financial Metrics and Target .................................................................................................................... 22
Exhibit 7-3: Summary of HSE - Non-Financial Metrics and Target .......................................................................................................... 22
Exhibit 8-1: Summary Operational Metrics for actuals as at 30 June 2014 (Rounded Figures)................................................................ 25
Exhibit 8-2: Summary Operational Metrics .............................................................................................................................................. 25
Exhibit 8-3: Overview of FTTP Customer Connect .................................................................................................................................. 26
Exhibit 8-4: Customer Connect for FTTP Brownfields Operational Indicators .......................................................................................... 27
Exhibit 8-5: FTTP Customer Connect Operational Highlights (Rounded Figures) ................................................................................... 27
Exhibit 8-6: Overview of the FTTP Access Network ................................................................................................................................ 28
Exhibit 8-7: FTTP Brownfields Operational Indicators ............................................................................................................................. 29
Exhibit 8-8: FTTP Brownfields Operational Highlights (Rounded Figures)............................................................................................... 29
Exhibit 8-9: Overview of the FTTP Greenfields Network ......................................................................................................................... 30
Exhibit 8-10: FTTP New Developments Operational Indicators ............................................................................................................... 31
Exhibit 8-11: FTTP New Developments Operational Highlights (Rounded Figures) ................................................................................ 31
Exhibit 8-12: Overview of the Fixed Wireless Network ............................................................................................................................ 32
Exhibit 8-13: Overview of the Satellite Network....................................................................................................................................... 32
Exhibit 8-14: Fixed Wireless and Satellite Operational Indicators* .......................................................................................................... 33
Exhibit 8-15: Fixed Wireless and Satellite Operational Highlights (Rounded Figures) ............................................................................. 33
Exhibit 8-16: Overview of the Transit Network ........................................................................................................................................ 34
Exhibit 8-17: Transit Network Operational Indicators .............................................................................................................................. 35
Exhibit 8-18: Transit Network Operational Highlights .............................................................................................................................. 35
Exhibit 8-19: Customer Experience and Engagement Scores ................................................................................................................. 36
Exhibit 8-20: End-User Product Scorecard ............................................................................................................................................. 37
Exhibit 8-21: Fixed Line Brownfields Premises FY2015 Estimate Profile by Serviceability and Activations ............................................. 40
Exhibit 8-22: Service Level for End-User Connections until 30 September 2014 ..................................................................................... 41
Exhibit 8-23: Service Level for End-User Connections from 1 October 2014 ........................................................................................... 41
Exhibit 8-24: End-User Operational Indicators ........................................................................................................................................ 41
Exhibit 8-25: Operational Highlights (Rounded Figures) ......................................................................................................................... 42
Exhibit 8-26: End-User Demand Analysis for Speed and Usage ............................................................................................................. 43
Exhibit 9-1: Financial Highlights .............................................................................................................................................................. 44
Exhibit 9-2: Major Corporate Plan Assumptions ...................................................................................................................................... 45
Exhibit 9-3: Financial Indicators .............................................................................................................................................................. 47
Exhibit 9-4: Summary Operational Metrics Classifications ...................................................................................................................... 48
Exhibit 9-5: Financial Assumptions from Strategic Reviews Scenario 6 (MTM) ....................................................................................... 49
Exhibit 9-6: Equity Funding Profile - December 2013 Strategic Review Scenario 6 (MTM) and NBN Co Indicative Profile ...................... 51
Exhibit 9-7: Debt Funding Profile – December 2013 Strategic Review Scenario 6 (MTM) and NBN Co Indicative Profile. ....................... 51
Exhibit 10-1: Major responsibilities for risk management and reporting ................................................................................................... 52