Embed Size (px)
Citation preview

NOT PROTECTIVELY MARKED
NOT PROTECTIVELY MARKED
Corporate Performance & Scrutiny Group
Meeting: Tuesday 22nd September
Reporting Period: 1st Apr 15 � 31st August 15
NB: Statistics remain provisional and subject to change

NOT PROTECTIVELY MARKED
NOT PROTECTIVELY MARKED
INTRODUCTION
Reporting Period: 01/04/2015 � 31/08/2015
Contents:• The Results: Current Performance levels
1. Headline overview statistics2. Crimes & ASB statistics (including stats by District council area) 3. Road Traffic Collision casualties
• The People: HR/headcount information • Finance: Included as an Appendix
Recommendations:• The Group notes the contents and current position
Actions arising from this meeting in response to scrutiny:•
Glossary of Terms• Please final page in document
Time Periods• Unless indicated otherwise statistics are presented by financial year
Performance Monitoring/Management and Operational Priorities• At a strategic level this meeting (The Corporate Performance & Scrutiny Group) and Executive Board consider performance in
the broader context of financial and people data and consider progress against the delivery of the Police and Crime Plan• The force runs its Tactical Tasking & Co-ordination Group (TTCG) meeting on a 3 month cycle rather than monthly. This
meeting looks predicted operational matters some 3 to 6 months in the future. Local TTCG meetings also run quarterly• The Performance Steering Group now sits with the Operational Delivery Board meeting which also monitors progress against
business plans and activity around HMIC inspections

NOT PROTECTIVELY MARKED
NOT PROTECTIVELY MARKED
Commentary on current position• Crime: NYP still has the lowest crime per 1000 population in England. • Demand remains higher than ‘normal’ range and this is linked to the volume rises in Criminal Damage & Violence. These
changes appear to be reflected nationally and in the MSF. – Criminal Damage remains higher than normal. April 2015 saw a step change in volume with around 500 crimes per month
being recorded when in previous years around 420 would be expected. It appears this change is reflected nationally and therefore it is important to consider the impact that the change from having to 72 hours to record a crime to 24hours will have on the figures.
– Violence both With and Without Injury crimes remain outside tolerance. National research conducted in Summer 2015 using data from 43 forces suggests better recording and increased victim confidence to report domestic abuse (and to some extent child abuse) as having an impact. Locally NYP can correlate increases in violent crime with changes in procedures or national inspections.
• ASB is down by 5% on last year. Demand in August was high but within normal expected levels. Movement within ASB categories likely linked to improved recording. Repeat victimisation linked to ongoing neighbour disputes – housing associationsaware and providing mediation.
• Ongoing major and serious crime investigation including the murder and attempt murder in York on 27th July (Op Overcast)
• Killed Seriously Injured (KSI) casualties: shows a reduction and the number recorded in July to be within normal range
• Satisfaction: Satisfaction remains high and trends for victims of Violence and Burglary are stable. A negative trend previously identified for victims of auto crime remains under scrutiny.
• This drop is linked to a change of deployment under the Thrive model (which has seen around 2000 officer hours freed up through crimes being dealt with over the phone) and appears to be linked to “management of expectations”. Advice/guidance has been disseminated in the Force Control Room.
• Public Confidence: in police & partners remains high based on latest national dataset.
EXECUTIVE SUMMARY
August 2015 Dashboard
2015/16 15912 2015/16 14233 2015/16 14081
v 14/15 7.0% v 14/15 8.7% v 14/15 -4.9%
v 13/14 7.6% v 13/14 7.2% v 13/14 -6.0%
2015 240 2015 83.5% 2015 67.3%
v 2014 -19.7% v 14/15 -4.6% v 14/15 -0.6%
v 2013 -19.2% v 13/14 -4.5% v 13/14 -0.4%
2015 81.2%
v 14/15 1.9%
v 13/14 3.4%

NOT PROTECTIVELY MARKED
NOT PROTECTIVELY MARKED
Slide Summary• This slide shows volume
change across the last 3 years.
• Victim Based Crime is up on previous years with volume increases in – Arson & Criminal
Damage– Violence– Shoplifting
• Despite these rises NYP remains having the lowest crime per 1000 population in England
• ASB is down on the previous year by almost 5%
• PSW volume trend is still rising year on year, and is by far the greatest inbound demand on NYP. The main volume of demand being Concern for Safety or reports of suspicious incidents
CRIME / ASB / PSW v PREVIOUS YEARS VOLUME CHANGE

NOT PROTECTIVELY MARKED
NOT PROTECTIVELY MARKED Slide Summary– When analysed by type most crimes were well within normal tolerance In August. The exceptions
are:– Violence & Criminal Damage - Both these crime groups are in exception meaning the current
monthly trends are higher than expected. These issues are reflected nationally and the causes are complex. Please see summarised commentary on the next slide
– Shoplifting – a spike in August rather than being part of a long running trend.
EXCEPTION BANDING: VICTIM BASED CRIME
�Represents Crime levels recorded in the last month , Data is normalised and presented as a statistic known as a Z score. The benefit of doing this
is to allow crime groups with different volumes (e.g. robbery and criminal damage) to be presented on same graph.
Crime levels can be described as normal if they fall between the light blue & dark blue lines as movement with this range is just random fluctuations in
the data.

NOT PROTECTIVELY MARKED
NOT PROTECTIVELY MARKED
Commentary• The increases in criminal damage and violence are reflected nationally and the causes are complex. The below
summarises commentary from previous reports.
• Violence both With and Without Injury crimes remain outside tolerance– National research conducted in Summer 2015 using data from 43 forces suggests better recording and
increased victim confidence to report domestic abuse (and to some extent child abuse) as having an impact.– When violent crime data is plotted on a month by month basis local initiatives (e.g. introduction of Harassment
Information Notice processes in October 2013), audits/corrective work and national inspections (such as Crime Date Integrity in February 2014) all correlate with increases in volume.
– NYP and partners continue to focus on Night Time Economy and Problem Solving Plans remain place.– As reported previously a shift in crime location has happened with a greater percentage being reported from
dwellings than in previous years whilst there have been reductions in “hospitality” locations and open spaces.– NYP and partners continue to work closely to tackle Domestic Abuse.– NYP has one of lowest rates per population in England & current trend is seen nationally and regionally
• Criminal Damage remains higher outside of tolerance. – April 2015 saw a step change in volume with around 500 crimes per month being recorded when in previous
years around 420 would be expected. – It appears this change is reflected nationally and therefore it is important to consider the impact that the
change from having to 72 hours to record a crime to 24hours will have on the figures. – Generally ‘series’ of crimes do not appear to be any more of an issue than in previous years however one
series of note from August is 28 x crimes of tyres being slashed in Richmond/Catterick area.– Low risk to victims and interms of repeat victimisation 10% of crimes can be linked to a victim suffering two
or more crimes in 12 months but this drops to 4% linked to a victim suffering 3 or more crimes and 1% based on 5 or more. This indicates broadly that issues are being dealt with by SNTs
– Nationally there appears to be a rise and in context NYP has lowest rate per 1000 in England
• Theft: Shoplifting ‘spiked’ in August above normal levels. Harrogate and Selby have been two areas with higher volumes of shoptheft this year. In Harrogate it is mainly focussed at the major supermarkets. Both areas have seen cross-border criminality , although Selby has a small number of persons managed through the IOM process who have committed a number of these offences. Days of action are planned and the respective Problem Solving Plans are being refreshed.
• Having held detailed performance conferences in City of York and Harrogate in August ACC Kennedy will be visiting Scarborough in September. The format is a presentation from the local command team followed by questions and discussion. The areas of focus include quality of service, community engagement and feedback, partnerships, deployment and tasking of resources.
CRIME COMMENTARY
NOT PROTECTIVELY MARKED
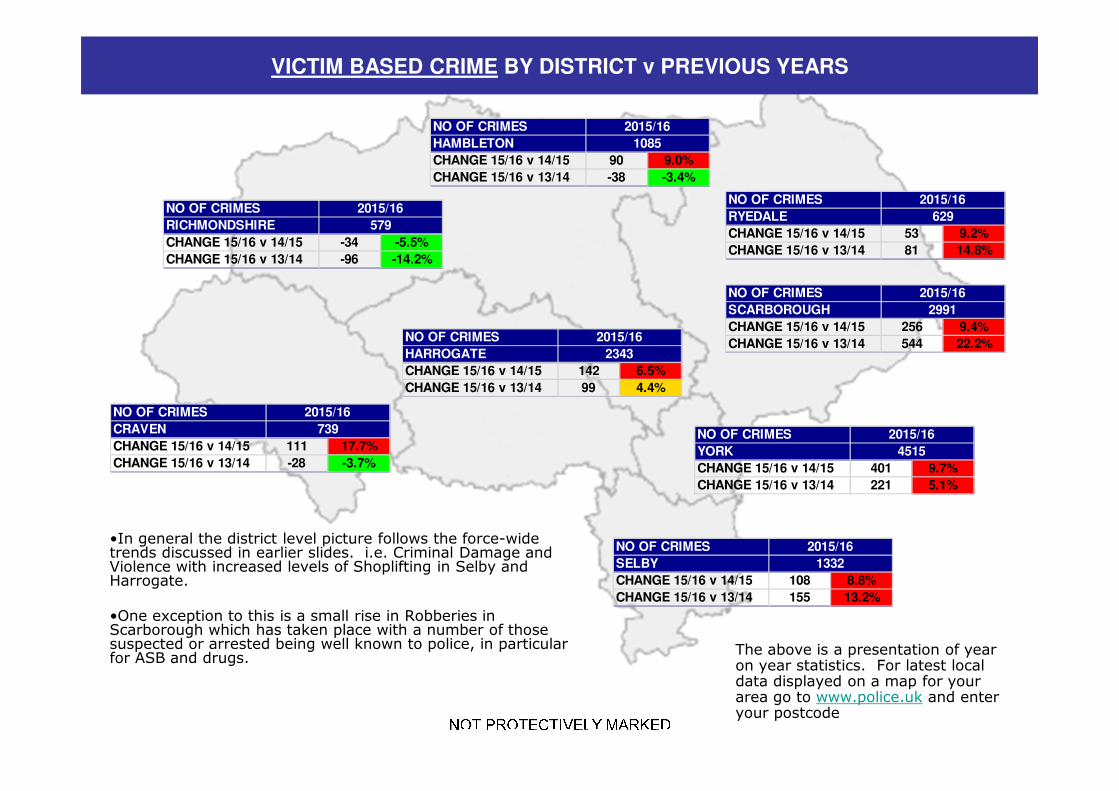
NOT PROTECTIVELY MARKED The above is a presentation of year on year statistics. For latest local data displayed on a map for your area go to www.police.uk and enter your postcode
•In general the district level picture follows the force-wide trends discussed in earlier slides. i.e. Criminal Damage and Violence with increased levels of Shoplifting in Selby and Harrogate.
•One exception to this is a small rise in Robberies in Scarborough which has taken place with a number of those suspected or arrested being well known to police, in particular for ASB and drugs.
VICTIM BASED CRIME BY DISTRICT v PREVIOUS YEARS
NO OF CRIMES
CRAVEN
CHANGE 15/16 v 14/15 111 17.7%
CHANGE 15/16 v 13/14 -28 -3.7%
2015/16
739
NO OF CRIMES
HAMBLETON
CHANGE 15/16 v 14/15 90 9.0%
CHANGE 15/16 v 13/14 -38 -3.4%
2015/16
1085
NO OF CRIMES
HARROGATE
CHANGE 15/16 v 14/15 142 6.5%
CHANGE 15/16 v 13/14 99 4.4%
2015/16
2343
NO OF CRIMES
RICHMONDSHIRE
CHANGE 15/16 v 14/15 -34 -5.5%
CHANGE 15/16 v 13/14 -96 -14.2%
2015/16
579
NO OF CRIMES
RYEDALE
CHANGE 15/16 v 14/15 53 9.2%
CHANGE 15/16 v 13/14 81 14.8%
2015/16
629
NO OF CRIMES
SCARBOROUGH
CHANGE 15/16 v 14/15 256 9.4%
CHANGE 15/16 v 13/14 544 22.2%
2015/16
2991
NO OF CRIMES
SELBY
CHANGE 15/16 v 14/15 108 8.8%
CHANGE 15/16 v 13/14 155 13.2%
1332
2015/16
NO OF CRIMES
YORK
CHANGE 15/16 v 14/15 401 9.7%
CHANGE 15/16 v 13/14 221 5.1%
2015/16
4515
NOT PROTECTIVELY MARKED
NOT PROTECTIVELY MARKED
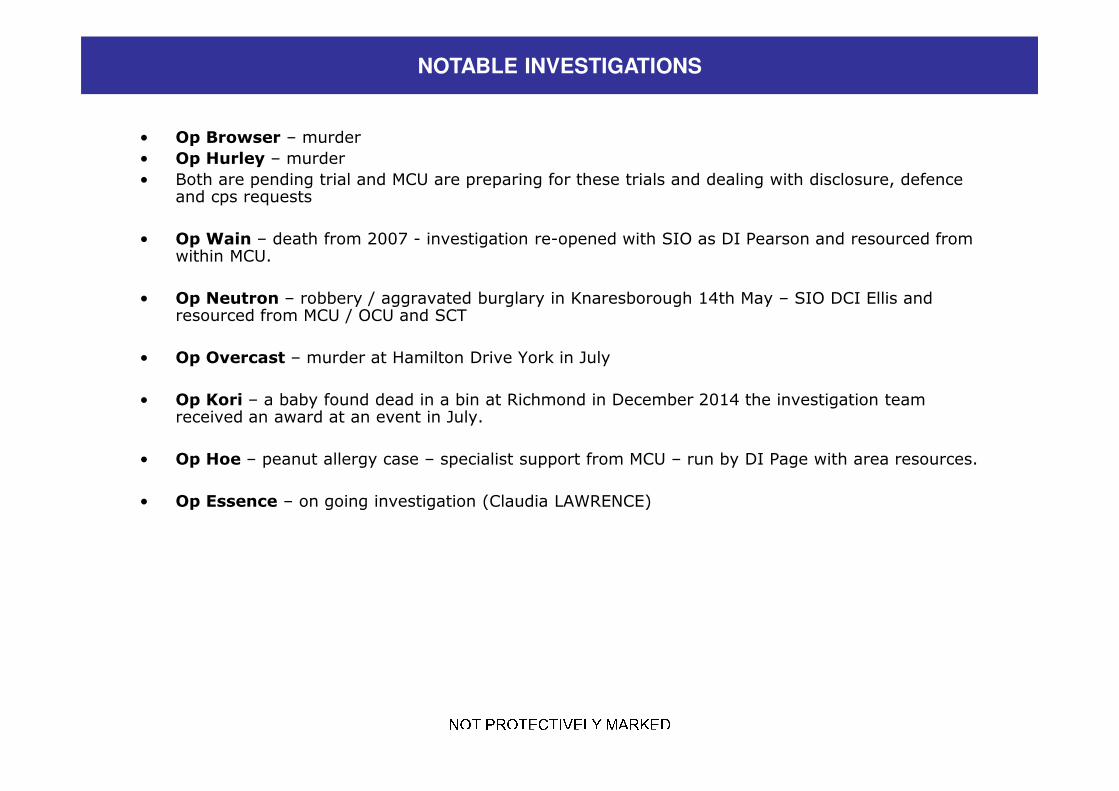
• Op Browser – murder
• Op Hurley – murder
• Both are pending trial and MCU are preparing for these trials and dealing with disclosure, defence and cps requests
• Op Wain – death from 2007 - investigation re-opened with SIO as DI Pearson and resourced from within MCU.
• Op Neutron – robbery / aggravated burglary in Knaresborough 14th May – SIO DCI Ellis and resourced from MCU / OCU and SCT
• Op Overcast – murder at Hamilton Drive York in July
• Op Kori – a baby found dead in a bin at Richmond in December 2014 the investigation team received an award at an event in July.
• Op Hoe – peanut allergy case – specialist support from MCU – run by DI Page with area resources.
• Op Essence – on going investigation (Claudia LAWRENCE)
NOTABLE INVESTIGATIONS

NOT PROTECTIVELY MARKED
NOT PROTECTIVELY MARKED • ASB is down on the previous year by almost 5%
• Current levels of ASB “Personal” are higher than usual however a significant amount of work has recently been done within the Force Control Room to ensure correct compliance with National Incident Standards (NSIR) and rises in Personal ASB are offset by falls within Nuisance ASB.
• Recent analysis of repeat ASB Personal victims with highest incident count reveals on going neighbour issues and in all cases the housing associations were aware and conducting or had conducted some form of mediation.
ASB BY DISTRICT v PREVIOUS YEARS
NO OF ASB
CRAVEN
CHANGE 15/16 v 14/15 -100 -16.8%
CHANGE 15/16 v 13/14 -242 -32.8%
2015/16
495
NO OF ASB
HAMBLETON
CHANGE 15/16 v 14/15 -23 -2.1%
CHANGE 15/16 v 13/14 -191 -15.1%
2015/16
1071
NO OF ASB
HARROGATE
CHANGE 15/16 v 14/15 -327 -12.7%
CHANGE 15/16 v 13/14 -181 -7.4%
2015/16
2257
NO OF ASB
RICHMONDSHIRE
CHANGE 15/16 v 14/15 1 0.2%
CHANGE 15/16 v 13/14 -50 -7.2%
2015/16
646
NO OF ASB
RYEDALE
CHANGE 15/16 v 14/15 -14 -2.6%
CHANGE 15/16 v 13/14 -119 -18.3%
2015/16
533
NO OF ASB
SCARBOROUGH
CHANGE 15/16 v 14/15 -212 -6.2%
CHANGE 15/16 v 13/14 23 0.7%
2015/16
3234
NO OF ASB
SELBY
CHANGE 15/16 v 14/15 80 6.3%
CHANGE 15/16 v 13/14 -16 -1.2%
2015/16
1355
NO OF ASB
YORK
CHANGE 15/16 v 14/15 -128 -2.8%
CHANGE 15/16 v 13/14 -121 -2.7%
2015/16
4440
NOT PROTECTIVELY MARKED
NOT PROTECTIVELY MARKED
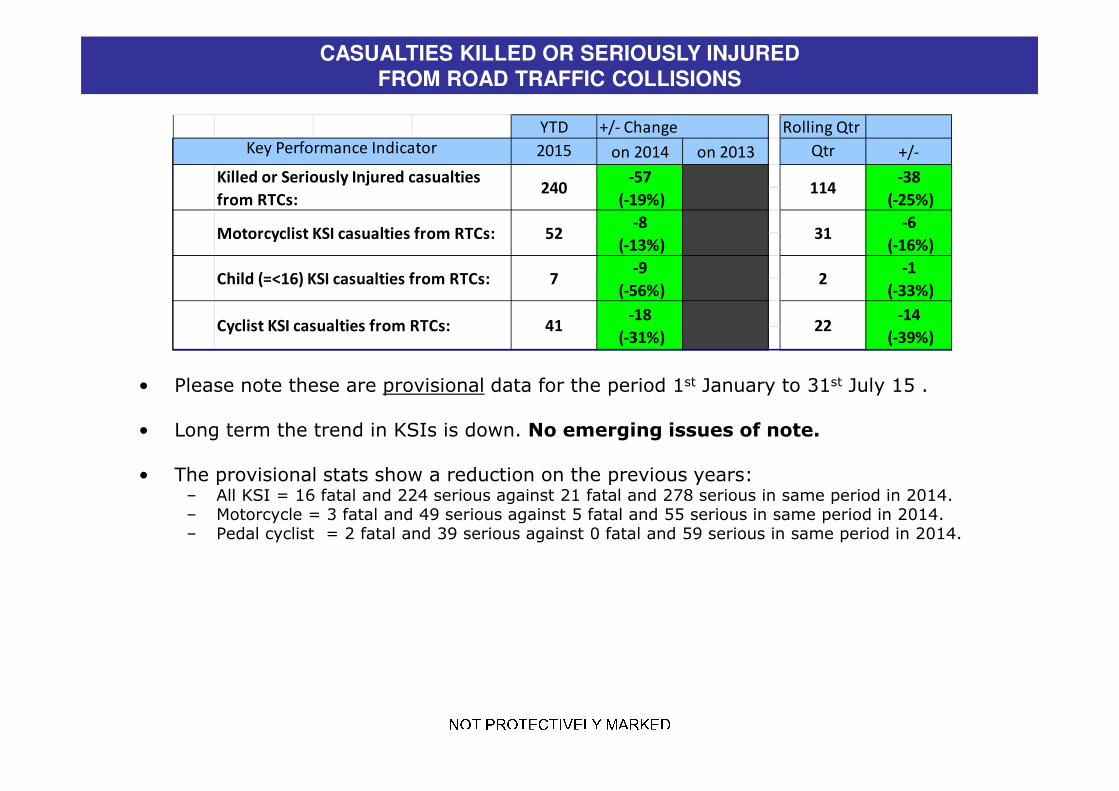
• Please note these are provisional data for the period 1st January to 31st July 15 .
• Long term the trend in KSIs is down. No emerging issues of note.
• The provisional stats show a reduction on the previous years:– All KSI = 16 fatal and 224 serious against 21 fatal and 278 serious in same period in 2014. – Motorcycle = 3 fatal and 49 serious against 5 fatal and 55 serious in same period in 2014. – Pedal cyclist = 2 fatal and 39 serious against 0 fatal and 59 serious in same period in 2014.
CASUALTIES KILLED OR SERIOUSLY INJURED
FROM ROAD TRAFFIC COLLISIONS
+/- Change Rolling Qtr
2015 on 2014 on 2013 Qtr +/-
7
Killed or Seriously Injured casualties
from RTCs:
Motorcyclist KSI casualties from RTCs:
YTD
Key Performance Indicator
240
2Child (=<16) KSI casualties from RTCs:
52 31
-38
(-25%)
-6
(-16%)
-1
(-33%)
-9
(-56%)
-8
(-13%)
-57
(-19%)114
Cyclist KSI casualties from RTCs: 2241-18
(-31%)
-14
(-39%)

NOT PROTECTIVELY MARKED
NOT PROTECTIVELY MARKED
Police Officers
The actual number of Officers has decreased in July 2015 by 8.34 FTE officers.
Police Cadet Scheme
The selection process for the Police Cadet scheme has recently been finalised, this pilot scheme will commence on 15th September and will see 40 new cadets start
in York. Depending on the success of this pilot there maybe potential to roll the scheme out across other force areas.
Apr 15 May 15 Jun 15 Jul 15 Aug 15 Sep 15 Oct 15 Nov 15 Dec 15 Jan 16 Feb 16 Mar 16 Apr 16
Officer Budget FTE Target 1393.0 1393.0 1393.0 1393.0 1393.0 1393.0 1393.0 1393.0 1393.0 1393.0 1393.0 1393.0 1393.0
Actual/ Projected Num inc recr’ment 1382.37 1387.02 1380.01 1374.27 1365.93
PCSO
Apr 15 May 15 Jun 15 Jul 15 Aug 15 Sep 15 Oct 15 Nov 15 Dec 15 Jan 16 Feb 16 Mar 16 Apr 16
PCSO Budget FTE 183.0 183.0 183.0 183.0 183.0 183.0 183.0 183.0 183.0 183.0 183.0 183.0 183.0
Actual/Projected Num inc recr’ment 197.98 197.52 197.52 195.52 194.46
The actual number of PCSO’s decreased in July by 0.74 FTE.
HR OVERVIEW

NOT PROTECTIVELY MARKED
NOT PROTECTIVELY MARKED
OP READINESS
Org
an
isati
on
Pro
jecti
ed
Targ
et
31.0
8.2
015 (
Vers
ion
7)
Actu
al
Nu
mb
er
of
Off
icers
FT
E
01.0
8.2
015
% V
ari
an
ce
Cu
rren
t S
ickn
ess
Ad
op
tio
n L
eave
Mate
rnit
y
Ad
justm
en
t
Mate
rnit
y L
eave
Recu
pera
tive D
uti
es
Restr
icte
d D
uti
es
Op
era
tio
nal
Read
iness o
f A
ctu
al
Off
icer
FT
E
Op
era
tio
nal
Read
iness o
f P
roje
cte
d T
arg
et
FT
E
NYP Local Policing
Total 905.00 862.08 -4.74 54.42 1.00 4.83 15.13 28.64 2.00 87.70 83.54
NYP Specialist Ops &
Logistics Total 246.00 242.77 -1.31 9.00 0.00 0.00 1.00 11.00 0.00 91.35 90.15
NYP Safeguarding
Total 43.00 42.49 -1.20 1.00 0.00 0.00 0.90 0.00 0.00 95.53 94.38
All Others Total 198.00 218.62 10.41 5.00 0.00 0.00 2.00 9.64 2.00 91.47 101.00 *
Grand Total 1392.00 1365.96 -1.87 69.42 1.00 4.83 19.03 49.28 4.00 89.20 87.53
* The Op Readiness figure for “All Others” at 101% is because the readiness % is taken as a proportion of the Target and in this case the actual number of officers (218.6 FTE) within this category is higher than the projected Target (198.00).
NOT PROTECTIVELY MARKED
NOT PROTECTIVELY MARKED
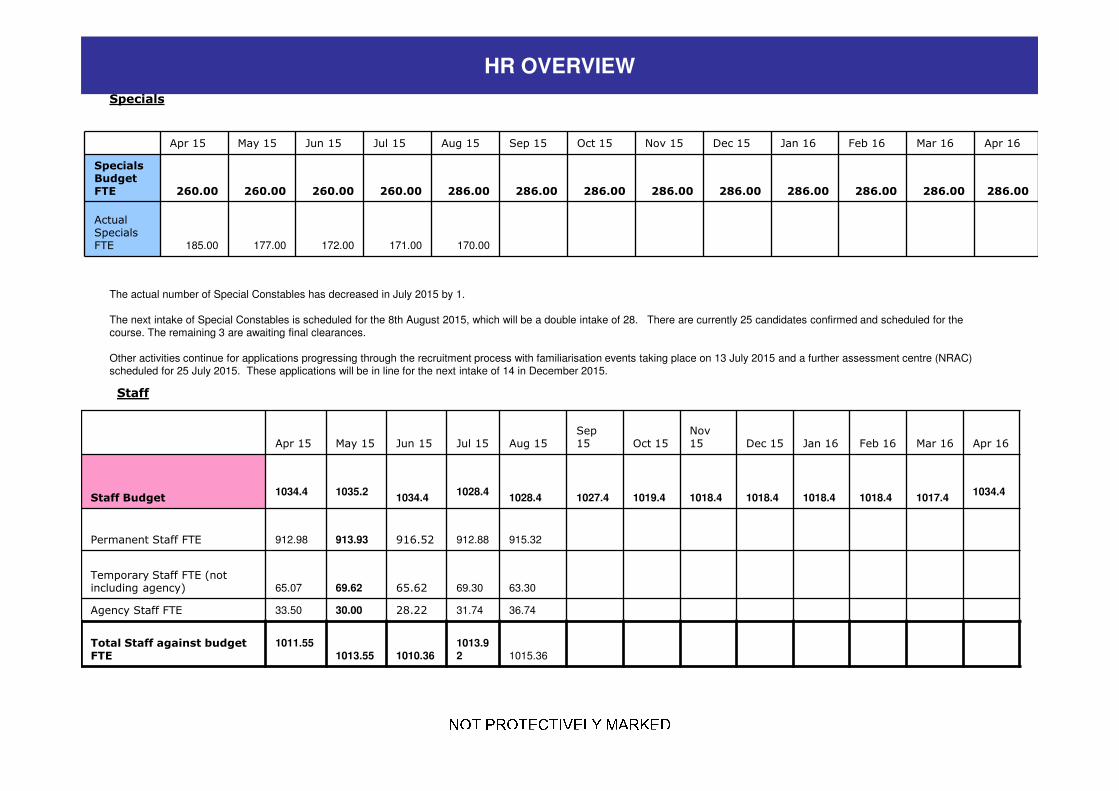
Staff
Specials
Apr 15 May 15 Jun 15 Jul 15 Aug 15 Sep 15 Oct 15 Nov 15 Dec 15 Jan 16 Feb 16 Mar 16 Apr 16
Specials Budget FTE 260.00 260.00 260.00 260.00 286.00 286.00 286.00 286.00 286.00 286.00 286.00 286.00 286.00
Actual Specials FTE 185.00 177.00 172.00 171.00 170.00
The actual number of Special Constables has decreased in July 2015 by 1.
The next intake of Special Constables is scheduled for the 8th August 2015, which will be a double intake of 28. There are currently 25 candidates confirmed and scheduled for the course. The remaining 3 are awaiting final clearances.
Other activities continue for applications progressing through the recruitment process with familiarisation events taking place on 13 July 2015 and a further assessment centre (NRAC) scheduled for 25 July 2015. These applications will be in line for the next intake of 14 in December 2015.
Apr 15 May 15 Jun 15 Jul 15 Aug 15Sep 15 Oct 15
Nov 15 Dec 15 Jan 16 Feb 16 Mar 16 Apr 16
Staff Budget 1034.4 1035.2
1034.41028.4
1028.4 1027.4 1019.4 1018.4 1018.4 1018.4 1018.4 1017.41034.4
Permanent Staff FTE 912.98 913.93 916.52 912.88 915.32
Temporary Staff FTE (not including agency) 65.07 69.62 65.62 69.30 63.30
Agency Staff FTE 33.50 30.00 28.22 31.74 36.74
Total Staff against budget FTE
1011.551013.55 1010.36
1013.92 1015.36
HR OVERVIEW

NOT PROTECTIVELY MARKED
NOT PROTECTIVELY MARKED Please note:
That the above figures include Secondments Out of Force but exclude Career Break Staff.
Volunteers
Apr 15 May 15 Jun 15 Jul 15 Aug 15 Sep 15 Oct 15 Nov 15 Dec 15 Jan 16 Feb 16 Mar 16 Apr 16
Volun-teers 176.00 177.00 178.00 179.00 177.00
The Staff Budget has been adjusted for 2015/ 2016. Police staff roles fluctuate in accordance with organisational priorities and requirements. The approach to
police staff workforce profiling is to explore opportunities where flexible resources can be utilised specifically to deliver key pieces of work.
The total number of actual Staff has increased by 1.44 FTE from the previous month.
The number of agency staff has decreased by 5 FTE since the previous month:
18 x agency staff are in supernumerary posts.
18.74 x agency staff are backfill or interim postings against established posts (includes part time agency staff).
The current number of Staff vacancies is 17.
HR OVERVIEW
Deployment of volunteers:-
The 177 volunteers are broken down into the following roles
1 Chief Officer – Citizens in Policing
1 - Head of Volunteering
1 - Deputy Head of Volunteering
6 - Volunteer Advisors’.
38 - Front Counter Support
130 - Volunteers are Safer Neighbourhood Support
It has been agreed that NYP will be running a recruitment campaigns for a number of
volunteer vacancies. A programme of activity will be drawn up over to develop a
recruitment and advertising strategy.

NOT PROTECTIVELY MARKED
NOT PROTECTIVELY MARKED
READING THE PERFORMANCE DATA• The numbers shows performance against the previous year• The dashboard graphic for operational crime, ASB and KSI data is an assessment of the latest month against
a normal month based on the 2014/15 reporting period. The position of the needle describes the month results relative to a linear average. This allows for factors such as seasonal trends or the impact of single one off events to be explained. As the desired direction of travel can be up or down (e.g. increasing crime is negative but an increasing resolution % positive) the graphics alternate the red/green colouring accordingly.
GLOSSARY• ASB = Anti-Social Behaviour• Crimes Against Society = These are crimes which do not have a “named victim” i.e.. the offence is against
The Crown. These are usually (but not always) are as the direct result of police intervention/proactivity e.g a drugs operation. In North Yorkshire & City of York approx 10% of crimes are “Against Society” therefore it is important to make the clear distinction from Victim Based Crime.
• Fraud Offences = These are not included in the crime statistics as they are not reported by forces to the Home Office. Instead these crimes are passed to Action Fraud and statistics are collated by that agency
• I Grade = priority assigned by control room for an incident requiring Immediate police response• KSI = A casualty Killed or Seriously Injured as a result of a Road Traffic Collision on a public road• MCU = Major Crime Unit• MO = Modus Operandi• OPL = Over Prescribed Limit typically the term used to describe failing a breath test• P&CP = Police & Crime Plan document setting out the Police & Crime Commissioner’s priorities• PCC = Police & Crime Commissioner• PCSO = Police Community Support Officer• PSG = Performance Steering Group is an internal meeting chaired by a Chief Officer monitoring statistics &
trends• Resolved Outcome = A crime where an offender has been dealt with through sanction or restorative justice. • Sanction Detection = A historical method of looking at how crimes were resolved. A sanction detection
includes where an offender is Charged, Cautioned, given a Penalty Notices for Disorder or Cannabis Warning or Fixed Penalty Notices, and where an offender has crimes Taken Into Consideration (TIC - see below).
• TIC = Taken Into Consideration is typically where an offender admits to further offences to avoid potentially being pursued for these at a later date.
• TTCG = Tactical Tasking & Co-ordination Group is an internal meeting which directs resources to tackle specific problems
GLOSSARY