Embed Size (px)
Citation preview
Annual Report 2011-2012 1
CORPORATE INFORMATION
BOARD OF DIRECTORS VANAJA ARVIND Executive Director
RAJIV KUCHHAL
Non-Executive and Independent Director
Dr. S RAJAGOPALAN Non-Executive and Independent Director
MOHAN PARVATIKAR Whole Time Director
K KUMAR Non-Executive and Independent Director
A V ASVINI KUMAR Chairman and Managing Director
COMPANY SECRETARY A THANIKAINATHAN
AUDITORS PKF Sridhar and Santhanam Chartered Accountants, Chennai-600004
INTERNAL AUDITORS A Murali & Associates Chartered Accountants, Chennai-600094
BANKERS The Lakshmi Vilas Bank Ltd. Cathedral Road, Chennai-600086
ICICI Bank Ltd T. Nagar, Chennai-600017
Citi Bank NA Club house Road, Chennai-600002
LEGAL ADVISORS SRS Associates, Chennai-600004
REGISTRAR AND SHARE TRANSFER AGENTS Karvy Computershare Private Limited Cyber Villa, Plot No. 17-24, Vittalrao Nagar, Madhapur, Hyderabad – 500081
FACILITATORS Madras Export Processing Zone (MEPZ) Tambaram, Chennai-600045
Software Technology Park (STPI) Chennai-600041
Tidel Park Limited Taramani, Chennai -600113
Velankani Tech Park Electronic City, Bengaluru-560100
REGISTERED OFFICE Type II, Unit-5, Dr. V.S.I Estate Thiruvanmiyur, Chennai-600041
WEBSITE www.thinksoftglobal.com
Annual Report 2011-20122
Contents
Letter to Shareholders ....................................... 3
Performance Highlights: Decade at a glance .... 4
Directors’ Report ................................................ 5
Management Discussion and Analysis ............ 15
Report on Corporate Governance ................... 17
Financial Statements - Standalone.................. 29
Financial Statements - Consolidated ............... 55
Annual Report 2011-2012 3
Letter to Shareholders
Dear Shareholders,
It gives me great pleasure to report the highlights of the Company’s performance and achievements for the year 2011-12 just gone by.
Our consolidated revenues, at INR 1,214 million, were up 46% over the previous year and Net profi t at INR 113 million, grew 508%
over the previous year. The performance was all the more creditable as it came against the backdrop of two years of fl at growth
primarily due to the general economic conditions. In view of this performance the Board of Directors decided to announce a fi nal
dividend of INR 3 / share, taking the total dividend to INR 5 / share.
To put things into perspective, it is pertinent to note that the company has demonstrated a 24.72 % CAGR of revenues over the past
10 years (2002-2012) and also maintained an unbroken dividend record. This has been achieved in the face of stiff competition from
the “scale“ players, buyer behavior biased towards favoring “mega“ vendors and periodic market unresponsiveness arising out of dot
com bust in the year 2000, the 9/11 attacks and the fi nancial crisis of 2008/09.
From all accounts the IT services market seems to be evolving in the direction of demanding increasing “quality” levels and also of
rewarding “value” delivered. This is taking many forms including independent testing services becoming part of the mainstream value
chain and by the fact that many specialist players are being invited to hitherto forbidden bidding tables. Our company will defi nitely
benefi t from this, as it plays into our conventional strengths. Anticipating this, we had triggered a number of initiatives in the past
one year and have expanded our specialist offering space (building testing expertise and Centre of Excellences in BFSI mobile
app testing, and for the much larger and complex payments processing area). The Company has also successfully completed pilot
projects in the area of mobile testing using the concept of working with “cloud platforms“ and using remote test centres.
It is not surprising therefore, that the Company has been selected by the Reserve Bank of India, through a rigorous selection process
to be its preferred testing partner for the countrywide rollout of one of its major transformational initiatives. We are also participating
in bidding for comprehensive testing of a strategic payment platform being undertaken by an apex body. The Specialist BFSI testing
space is growing at 30% annually and we are well positioned to be a signifi cant player with a good market share. We are cementing
sales partnerships with “domain” specialist fi rms to address mid tier clients and working on our new branding strategy to capitalize
on these trends.
We also view our investment in building functional expertise and associated technology skills as a key strategic differentiator in how
we deliver our services. With our constant focus on effi ciency and productivity, we have eliminated redundant steps from our business
processes, and thus maximized the effi ciency of our services which helps our clients derive cost savings.
The past year witnessed the uncovering of a number of mega scams and citizens discontent at the endemic corruption and poor
quality of governance in many spheres affecting daily life. The regulatory policy and environment has also been very ambiguous and
confusing for the business sector. While responding to these challenges, your company has been maintaining the highest standards
of corporate governance by implementing clear and transparent corporate policies and following all the norms and guidelines laid
down by RBI, SEBI, Stock Exchanges, CBDT and other regulatory bodies both in letter and in spirit. We are proud to be counted
among the companies which have this kind of track record.
The Company has also initiated the process of implementing an ERP system and is in the fi nal stage of cutting over to “live“ status
for the fi nance and associated functions. We have also increased our investment in our training and talent management processes,
adding to and improving our capabilities for imparting critical industry, product and process training.
Before I conclude, I would like to mention that our focus remains on sustaining the momentum we have achieved this year and
building on the traction that the business has seen from different quarters. We are confi dent that the investment in people, process
and technology would propel your Company to greater heights in the forthcoming years.
On behalf of the Board of Directors’, I take this opportunity to express our gratitude to all our stakeholders, who have reposed trust in
us and look forward to your continued support to help keep the company on the growth path in the coming years.
Yours Sincerely,
A V Asvini Kumar
June 15, 2012
Annual Report 2011-20124
Performance Highlights - Consolidated
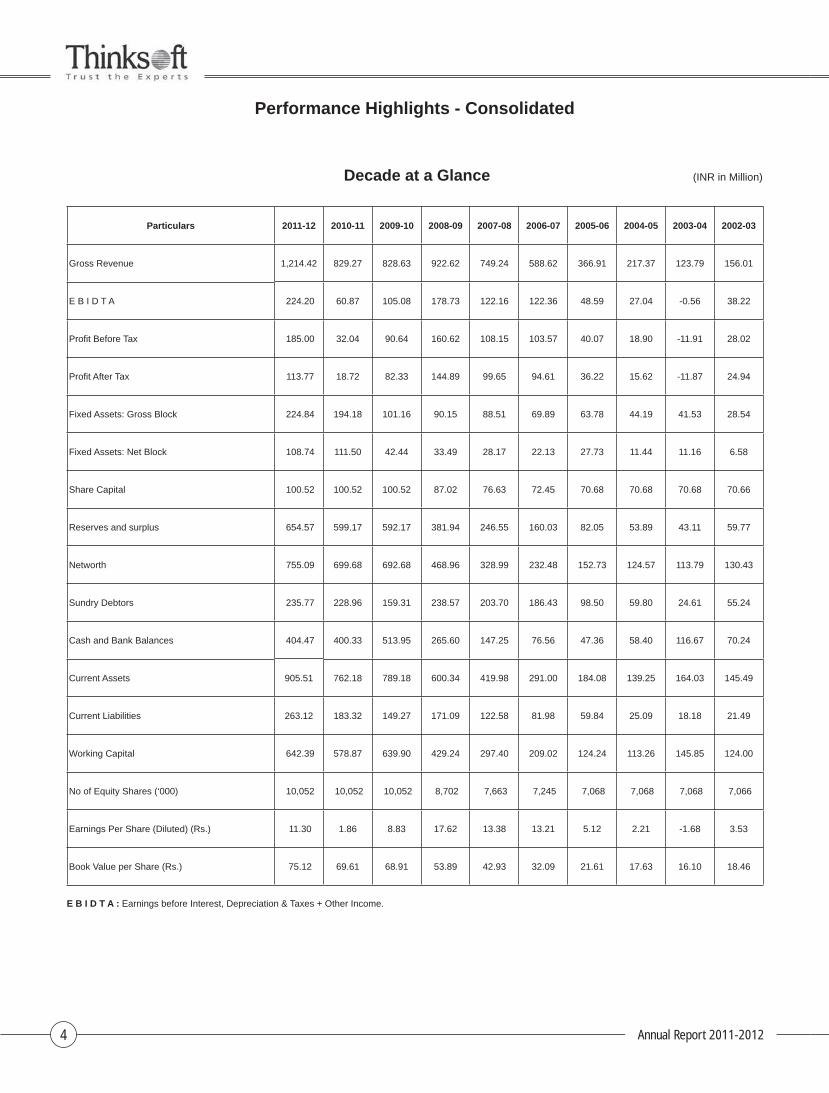
Decade at a Glance (INR in Million)
Particulars 2011-12 2010-11 2009-10 2008-09 2007-08 2006-07 2005-06 2004-05 2003-04 2002-03
Gross Revenue 1,214.42 829.27 828.63 922.62 749.24 588.62 366.91 217.37 123.79 156.01
E B I D T A 224.20 60.87 105.08 178.73 122.16 122.36 48.59 27.04 -0.56 38.22
Profi t Before Tax 185.00 32.04 90.64 160.62 108.15 103.57 40.07 18.90 -11.91 28.02
Profi t After Tax 113.77 18.72 82.33 144.89 99.65 94.61 36.22 15.62 -11.87 24.94
Fixed Assets: Gross Block 224.84 194.18 101.16 90.15 88.51 69.89 63.78 44.19 41.53 28.54
Fixed Assets: Net Block 108.74 111.50 42.44 33.49 28.17 22.13 27.73 11.44 11.16 6.58
Share Capital 100.52 100.52 100.52 87.02 76.63 72.45 70.68 70.68 70.68 70.66
Reserves and surplus 654.57 599.17 592.17 381.94 246.55 160.03 82.05 53.89 43.11 59.77
Networth 755.09 699.68 692.68 468.96 328.99 232.48 152.73 124.57 113.79 130.43
Sundry Debtors 235.77 228.96 159.31 238.57 203.70 186.43 98.50 59.80 24.61 55.24
Cash and Bank Balances 404.47 400.33 513.95 265.60 147.25 76.56 47.36 58.40 116.67 70.24
Current Assets 905.51 762.18 789.18 600.34 419.98 291.00 184.08 139.25 164.03 145.49
Current Liabilities 263.12 183.32 149.27 171.09 122.58 81.98 59.84 25.09 18.18 21.49
Working Capital 642.39 578.87 639.90 429.24 297.40 209.02 124.24 113.26 145.85 124.00
No of Equity Shares (‘000) 10,052 10,052 10,052 8,702 7,663 7,245 7,068 7,068 7,068 7,066
Earnings Per Share (Diluted) (Rs.) 11.30 1.86 8.83 17.62 13.38 13.21 5.12 2.21 -1.68 3.53
Book Value per Share (Rs.) 75.12 69.61 68.91 53.89 42.93 32.09 21.61 17.63 16.10 18.46
E B I D T A : Earnings before Interest, Depreciation & Taxes + Other Income.
Annual Report 2011-2012 5
Directors' ReportTo the Members,
We are presenting herewith, the report on our business and operations for the year ended March 31, 2012.
1) Financial Highlights for the year ended March 31, 2012
(INR In Million) Consolidated Stand Alone
Description2011-12
Current Year2010-11
Previous Year2011-12
Current Year2010-11
Previous YearExport Revenue 1,121.27 775.39 1,025.84 559.25Domestic Revenue 93.15 53.88 93.15 53.88Total Revenue 1,214.42 829.27 1,118.99 613.13Delivery expenses 813.28 557.10 852.74 432.50Funds from Operations 401.14 272.17 266.24 180.63Selling and Marketing expenses 147.81 119.16 51.06 44.31General and Administrative expenses 126.28 125.64 110.31 109.11Profi t before Interest, Depreciation & Taxes 127.05 27.37 104.87 27.21Less: Depreciation 37.40 27.88 37.17 27.56Less: Interest 0.26 - 0.26 -Operating Profi t Before Taxes 89.39 (0.51) 67.43 (0.35)Other Income 95.61 32.55 88.91 26.44Net profi t before taxes 185.00 32.04 156.34 26.09Provision for taxation (65.88) (12.30) (60.28) (7.62)Deferred Tax (5.35) (1.02) (5.35) (1.02)Net Profi t after tax 113.77 18.72 90.71 17.45Profi t brought forward from previous year 420.34 413.34 384.76 379.02Profi t available for appropriation 534.11 432.06 475.47 396.48Appropriations : Interim Dividend 20.10 - 20.10 -Transfer to General Reserve 9.10 - 9.10 -Proposed Final Dividend 30.16 10.05 30.16 10.05Tax on Dividend 8.11 1.67 8.11 1.67Profi t carried to Balance sheet 466.64 420.34 408.00 384.76EPS basic 11.32 1.86 9.03 1.74EPS diluted 11.30 1.86 9.01 1.74
2) Business and Operations Review
• Total revenues increased, in Rupee terms by 46%, to INR 1214.42 million during the current year, from INR 829.27 million in the previous year (In US dollar terms this amounts to an increase in revenues of 38%).
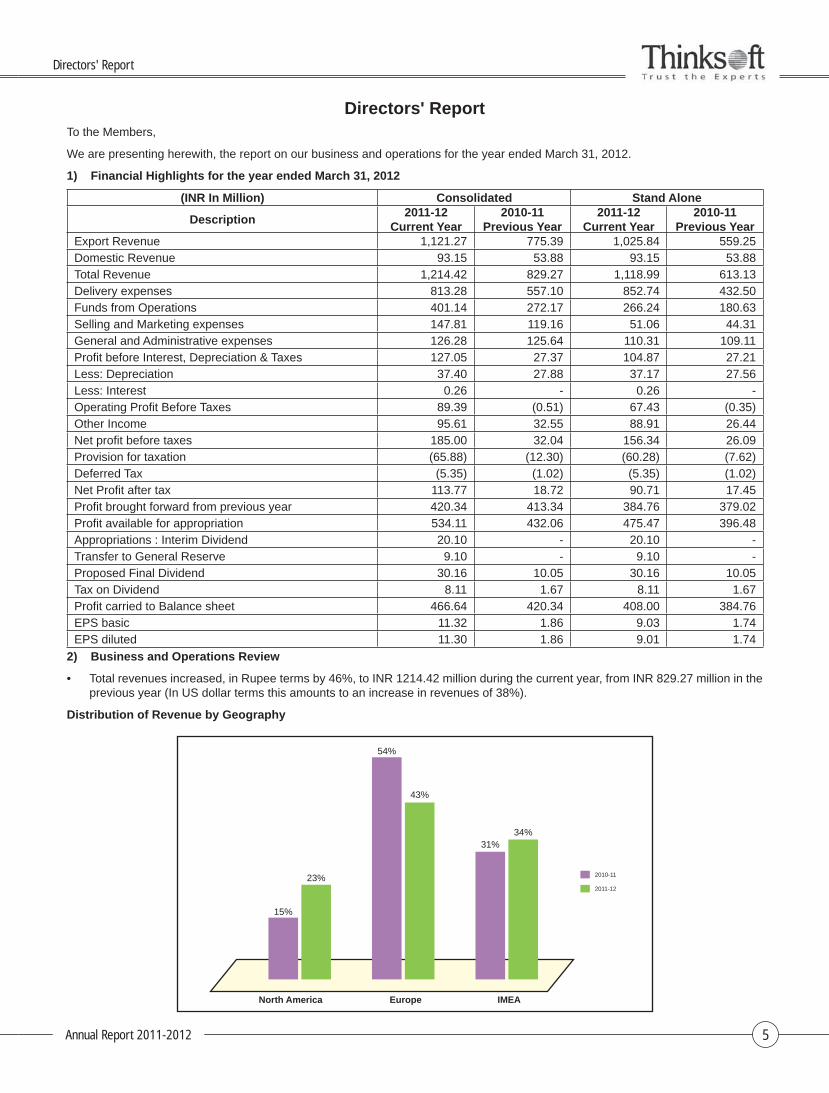
Distribution of Revenue by Geography
North America Europe IMEA
2010-11
2011-12
23%
15%
43%
54%
34%31%
Directors' Report
Annual Report 2011-20126
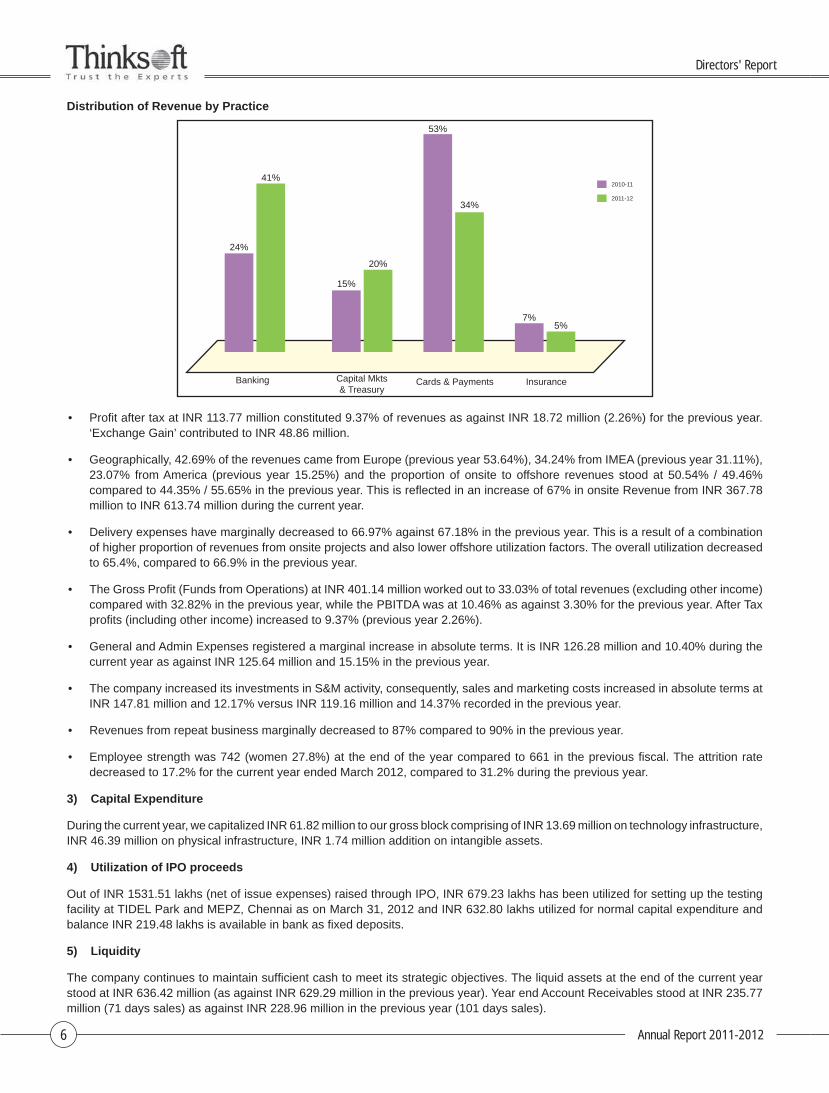
Distribution of Revenue by Practice
2010-11
2011-12
Banking Capital Mkts& Treasury
Cards & Payments Insurance
41%
24%
20%
15%
34%
5%7%
53%
• Profi t after tax at INR 113.77 million constituted 9.37% of revenues as against INR 18.72 million (2.26%) for the previous year. ‘Exchange Gain’ contributed to INR 48.86 million.
• Geographically, 42.69% of the revenues came from Europe (previous year 53.64%), 34.24% from IMEA (previous year 31.11%), 23.07% from America (previous year 15.25%) and the proportion of onsite to offshore revenues stood at 50.54% / 49.46% compared to 44.35% / 55.65% in the previous year. This is refl ected in an increase of 67% in onsite Revenue from INR 367.78 million to INR 613.74 million during the current year.
• Delivery expenses have marginally decreased to 66.97% against 67.18% in the previous year. This is a result of a combination of higher proportion of revenues from onsite projects and also lower offshore utilization factors. The overall utilization decreased to 65.4%, compared to 66.9% in the previous year.
• The Gross Profi t (Funds from Operations) at INR 401.14 million worked out to 33.03% of total revenues (excluding other income) compared with 32.82% in the previous year, while the PBITDA was at 10.46% as against 3.30% for the previous year. After Tax profi ts (including other income) increased to 9.37% (previous year 2.26%).
• General and Admin Expenses registered a marginal increase in absolute terms. It is INR 126.28 million and 10.40% during the current year as against INR 125.64 million and 15.15% in the previous year.
• The company increased its investments in S&M activity, consequently, sales and marketing costs increased in absolute terms at INR 147.81 million and 12.17% versus INR 119.16 million and 14.37% recorded in the previous year.
• Revenues from repeat business marginally decreased to 87% compared to 90% in the previous year.
• Employee strength was 742 (women 27.8%) at the end of the year compared to 661 in the previous fi scal. The attrition rate decreased to 17.2% for the current year ended March 2012, compared to 31.2% during the previous year.
3) Capital Expenditure
During the current year, we capitalized INR 61.82 million to our gross block comprising of INR 13.69 million on technology infrastructure, INR 46.39 million on physical infrastructure, INR 1.74 million addition on intangible assets.
4) Utilization of IPO proceeds
Out of INR 1531.51 lakhs (net of issue expenses) raised through IPO, INR 679.23 lakhs has been utilized for setting up the testing facility at TIDEL Park and MEPZ, Chennai as on March 31, 2012 and INR 632.80 lakhs utilized for normal capital expenditure and balance INR 219.48 lakhs is available in bank as fi xed deposits.
5) Liquidity
The company continues to maintain suffi cient cash to meet its strategic objectives. The liquid assets at the end of the current year stood at INR 636.42 million (as against INR 629.29 million in the previous year). Year end Account Receivables stood at INR 235.77 million (71 days sales) as against INR 228.96 million in the previous year (101 days sales).
Directors' Report
Annual Report 2011-2012 7
6) Share Capital
As at the end of the fi nancial year the Company’s Equity Share Capital stands at INR 100.52 million, consisting of 10,051,581 fully paid up Equity Shares of INR 10 each. During the year, the Company has granted 339,000 options under Thinksoft ESOP Scheme 2011. The disclosure in compliance with the Clause 12 of the SEBI (Employee Stock Option Scheme And Employee Stock Purchase Scheme) Guidelines 1999, as amended is attached to this report as Annexure 3.
7) Net Worth
The net worth of the Company rose to INR 755.09 million as at 31st March 2012 from INR 699.68 million at the end of the previous fi scal. This works out to a per share net worth of INR 75.12.
8) Dividend
For the fi nancial year ended 31st March 2012, your Board has recommended a fi nal dividend of Rs. 3/- per equity share (30% on face value of Rs.10/- each), subject to the approval of the Shareholders in the ensuing Annual General Meeting.
Your Board has also declared an interim dividend of Rs.2/- per equity share (20% on face value of Rs.10/- each) on 3rd November 2011. This would result in a total dividend of Rs.5/- per equity share (50% on face value of Rs.10/- each) for the fi nancial year ended 31st March 2012. (Previous year Rs.1/- per equity share of face value of Rs.10/- each).
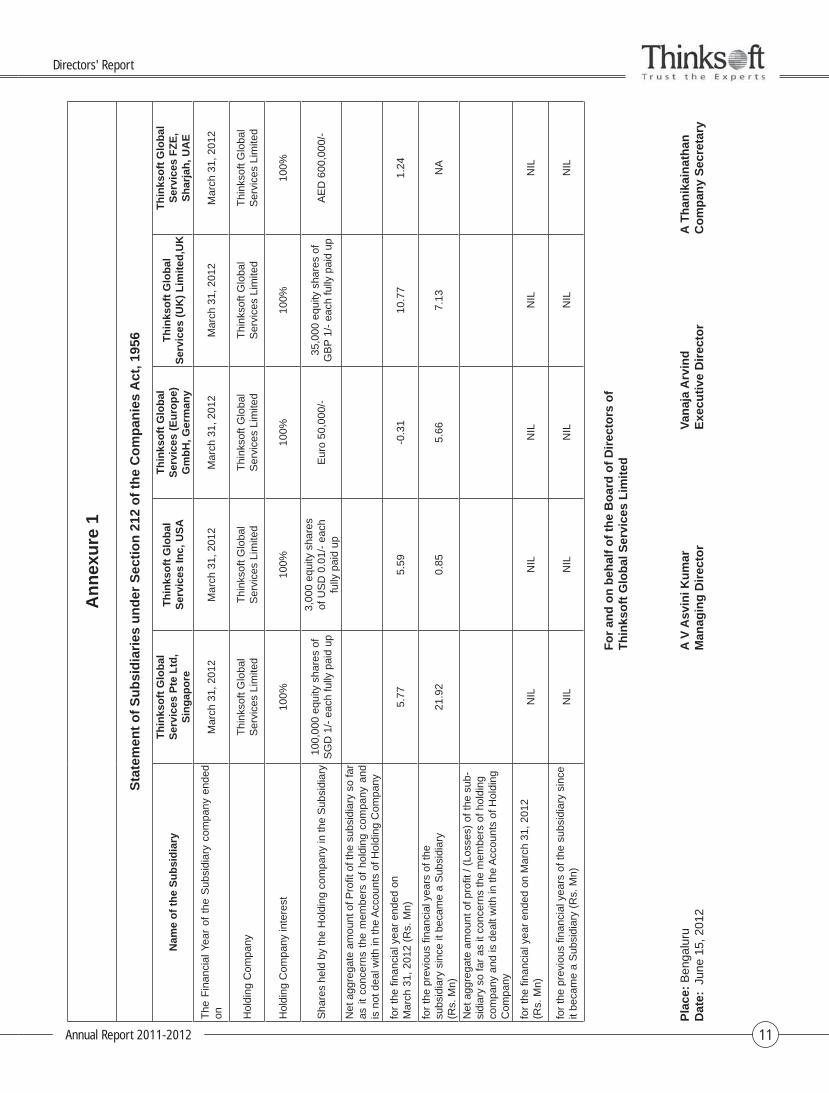
9) Subsidiaries
The company is having its global presence through its subsidiaries, branches and places of business.
The company has the following fi ve wholly owned subsidiaries
a) Thinksoft Global Services Pte. Ltd., Singapore
b) Thinksoft Global Services Inc., USA
c) Thinksoft Global Services (Europe) GmbH, Germany
d) Thinksoft Global Services UK Limited, UK
e) Thinksoft Global Services FZE, Sharjah, UAE
10) Financial Statement of Subsidiaries
As per Section 212 of the Companies Act, 1956, we are required to attach the Directors' Report, Balance Sheet, and Profi t and Loss account of our subsidiaries. Ministry of Corporate Affairs vide its General Circular no. 02/2011 dated 8th February 2011, exempted Companies from attaching the Financial Statements of Subsidiary Companies (refer Annexure 1). However, as per said circular the Companies are required to provide only the consolidated fi nancial statement in the annual report, accordingly, the Annual Report contains the consolidated fi nancial statements. The Audited Annual Accounts and related information of subsidiaries, whichever applicable, will be made available to shareholders upon request and will also be available for inspection during normal business hours at the Registered Offi ce of the company.
11) Directors
Dr. S Rajagopalan, Director who was appointed as a director on 17th September 2008, is liable to retire by rotation at the ensuing Annual General Meeting and being eligible offers for re-appointment as Director.
During the year under review Mr. C N Madhusudan, Non- Executive Independent Director had resigned from the Board of Directors with effect from 21st September 2011. The Board records its appreciation of the contribution made by Mr. C N Madhusudan during his tenure as a director of the Company.
During the year under review Mr. Rajiv Kuchhal, was inducted as Additional Director in your Board with effect from 21st September 2011. Mr. Rajiv Kuchhal's term expires on the date of the Annual General Meeting. The Company has received a Notice pursuant to the provisions of Section 257 of the Companies Act, 1956 for appointment of Mr. Rajiv Kuchhal as Director of the Company, liable to retire by rotation.
The Board of Directors recommends the appointment/re-appointment of Directors as mentioned above.
12) Auditors
M/s. PKF Sridhar & Santhanam, Chartered Accountants, Chennai retire as the Auditors of the Company at conclusion of the ensuing Annual General Meeting and being eligible offers themselves for re-appointment. The Audit Committee in their meeting held on 27th April 2012 has recommended the reappointment of M/s. PKF Sridhar & Santhanam, Chartered Accountants, Chennai.
13) Conservation of energy, research and development, technology absorption, foreign exchange earnings and outgo
The particulars as prescribed under sub-section(1)(e) of Section 217 of the Companies Act, 1956, read with the Companies (Disclosure of particulars in the report of the Board of Directors) Rules, 1988, are provided in the Annexure 2 to the Directors’ Report section.
Directors' Report
Annual Report 2011-20128
Directors' Report
14) Particulars of employees
In accordance with the provisions of Section 217(2A) of the Companies Act, 1956, and the rules framed there under, the required information is annexed and forms part of this Report. However, as per the provisions of Section 219(1) (b) (iv) of the Companies Act, 1956, the Directors' Report is being sent to all the Shareholders of the Company excluding the said annexure. Any shareholder interested in obtaining a copy of the said annexure may write to the Company Secretary at the Registered Offi ce of the Company.
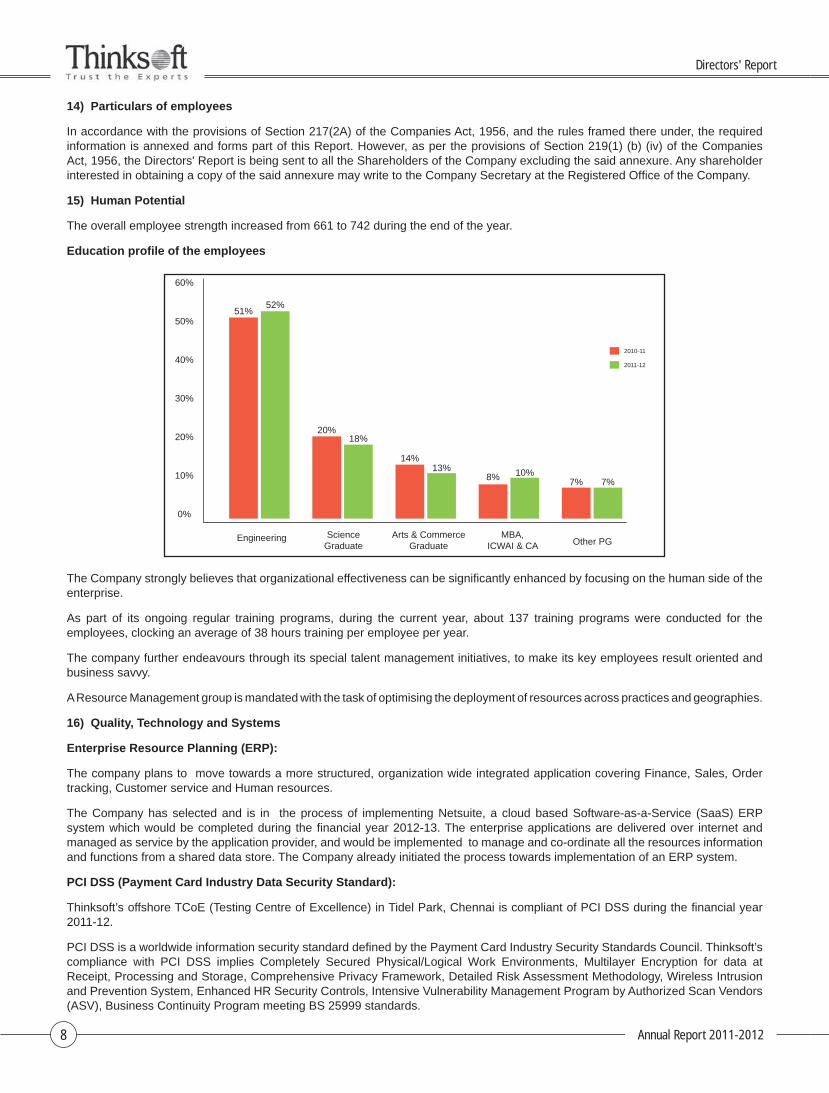
15) Human Potential
The overall employee strength increased from 661 to 742 during the end of the year.
Education profi le of the employees
2010-11
2011-12
Engineering ScienceGraduate
Arts & CommerceGraduate
MBA,ICWAI & CA Other PG
18%20%
7%7%10%8%
13%14%
52%51%
60%
50%
40%
30%
20%
10%
0%
The Company strongly believes that organizational effectiveness can be signifi cantly enhanced by focusing on the human side of the enterprise.
As part of its ongoing regular training programs, during the current year, about 137 training programs were conducted for the employees, clocking an average of 38 hours training per employee per year.
The company further endeavours through its special talent management initiatives, to make its key employees result oriented and business savvy.
A Resource Management group is mandated with the task of optimising the deployment of resources across practices and geographies.
16) Quality, Technology and Systems
Enterprise Resource Planning (ERP):
The company plans to move towards a more structured, organization wide integrated application covering Finance, Sales, Order tracking, Customer service and Human resources.
The Company has selected and is in the process of implementing Netsuite, a cloud based Software-as-a-Service (SaaS) ERP system which would be completed during the fi nancial year 2012-13. The enterprise applications are delivered over internet and managed as service by the application provider, and would be implemented to manage and co-ordinate all the resources information and functions from a shared data store. The Company already initiated the process towards implementation of an ERP system.
PCI DSS (Payment Card Industry Data Security Standard):
Thinksoft’s offshore TCoE (Testing Centre of Excellence) in Tidel Park, Chennai is compliant of PCI DSS during the fi nancial year 2011-12.
PCI DSS is a worldwide information security standard defi ned by the Payment Card Industry Security Standards Council. Thinksoft’s compliance with PCI DSS implies Completely Secured Physical/Logical Work Environments, Multilayer Encryption for data at Receipt, Processing and Storage, Comprehensive Privacy Framework, Detailed Risk Assessment Methodology, Wireless Intrusion and Prevention System, Enhanced HR Security Controls, Intensive Vulnerability Management Program by Authorized Scan Vendors (ASV), Business Continuity Program meeting BS 25999 standards.
Annual Report 2011-2012 9
Directors' Report
Thinksoft Global is currently one of the few companies that can count this among its achievements. Through this compliance and certifi cation the company has reinforced its commitment to its BFSI customers of its ability to meet the stringent global standards on of information security, data privacy, data security and business continuity in its offshore delivery centres. As pioneer in Independent Testing services Thinksoft has proven that it is ahead of the market in proactively meeting client’s expectations.
17) Environmental awareness
The Company continues its ‘go green’ initiatives to conserve resources and also reduce its carbon footprint and create sustainable alternatives wherever feasible.
All steps required for conserving power across all delivery centres are being undertaken. During the current year Desktop power management confi guration has been extended to almost 50% of the desktops used in the delivery centres.
Video conferencing (VC) usage has increased steadily this year, which in turn has reduced the travel cost and improved energy savings.
Continues initiatives within its offi ce buildings to reduce our electrical power, water and paper consumption.
Towards contributing for Green IT for a safe environment, the e-waste generated in-house are being discarded through vendors who adopt “Safe disposal practices”, recycle and re-manufacture the used e-waste like printers, toners and cartridges. These initiatives will be taken forward at a sustained pace.
18) Corporate Governance
A separate section on Corporate Governance forming part of the Directors’ Report and the certifi cate from the Company’s auditors confi rming compliance of Corporate Governance norms as stipulated in Clause 49 of the Listing Agreement with National Stock Exchange of India (NSE) and Bombay Stock Exchange of India (BSE) are included in the Annual Report.
19) Status of Application money refund
Your company already sent three reminders for the refund of application money. The money lying in the account as on 31st March 2012 is Rs. 86,250/- for 90 members. The members who had not availed the refund may please write to the Registrar and Transfer Agent.
20) Fixed deposits
We have not accepted any fi xed deposits and, as such, no amount of principal or interest was outstanding as of the Balance Sheet date.
21) Corporate Social Responsibility
Involvement:
• Thinksoft works closely with Vidya Sagar (formerly known as the Spastic Society of India), an NGO dedicated to the welfare and development of Spastics Children
• The Company has been organizing Blood bank campaign in its premises in collaboration with Jeevan Blood Bank and Research Centre
• The Company has been working with the Premavasam, an orphanage for special and less fortunate children in which our employees were encouraged to participate and donate gifts.
Contributions:
As a part of Corporate Social Responsibility during the current year the company contributed
• INR 0.30 million to the ‘Sadhya’ Program & INR 0.48 Million to Vidhya Sagar’s Spastics society, an NGO dedicated to the welfare and development of Spastics Children.
• INR 0.10 million to Ability foundation for India International Disability Film Festival.
• INR 0.025 million to Narthan Academy of Dance, Bengaluru for the Medical support of Musician and Dancer through Sumangali Seva Ashrama
• INR 0.01 million to Premavasam, an orphanage for special and less fortunate children.
• INR 0.028 million to Health First India to medical support for leprosy treatment.

Annual Report 2011-201210
Directors' Report
22) Directors' responsibility statement as required under Section 217 (2AA) of the Companies Act, 1956
Pursuant to Section 217(2AA) of the Companies Act, 1956, the Directors confi rm that:
(i) They accept responsibility for the integrity and objectivity of these accounting statements.
(ii) The fi nancial statements are prepared in accordance with the guidelines and standards of the ICAI and Companies Act 1956, to the extent applicable. There are no material departures from the above mentioned standards.
(iii) Such standard accounting policies have been applied consistently, except as otherwise stated.
(iv) The judgments and estimates have been made on a reasonable and prudent basis so that the fi nancial statements provide a true and fair view of the state of affairs of the Company at the end of the fi nancial year.
(v) The Directors have taken proper and suffi cient care for the maintenance of adequate accounting records in accordance with the provisions of this Act for safeguarding the assets of the Company and for preventing and detecting fraud and other irregularities;
(vi) The Annual Accounts are prepared on a going concern basis and on an accrual basis.
23) Acknowledgments
We thank our customers, vendors, investors and bankers for their continued support during the year. We place on record our appreciation of the contribution made by our employees at all levels. Our consistent growth was made possible by their hard work, solidarity, cooperation and support.
We thank the governments of various countries where we have operations. We also thank the Government of India, particularly the Ministry of Communication and Information Technology, the Customs and Excise Departments, the Income Tax Department, the Ministry of Commerce, the Ministry of Finance, the Reserve Bank of India, the State Governments, the Madras Export Processing Zone (MEPZ), the Software Technology Parks (STPs) and other Government Agencies for their support, and look forward to their continued support in the future.
For and on behalf of Board of Directors of Thinksoft Global Services Limited
Place: Bengaluru A V Asvini Kumar Vanaja ArvindDate: June 15, 2012 Managing Director Executive Director
Annual Report 2011-2012 11
Directors' Report
An
nex
ure
1
Sta
tem
ent
of
Su
bsi
dia
ries
un
der
Sec
tio
n 2
12 o
f th
e C
om
pan
ies
Act
, 195
6
Nam
e o
f th
e S
ub
sid
iary
Th
inks
oft
Glo
bal
Ser
vice
s P
te L
td,
Sin
gap
ore
Th
inks
oft
Glo
bal
Ser
vice
s In
c, U
SA
Th
inks
oft
Glo
bal
Ser
vice
s (E
uro
pe)
Gm
bH
, Ger
man
y
Th
inks
oft
Glo
bal
Ser
vice
s (U
K)
Lim
ited
,UK
Th
inks
oft
Glo
bal
Ser
vice
s F
ZE
, S
har
jah
, UA
E
The
Fin
anci
al Y
ear
of t
he S
ubsi
diar
y co
mpa
ny e
nded
on
Mar
ch 3
1, 2
012
Mar
ch 3
1, 2
012
Mar
ch 3
1, 2
012
Mar
ch 3
1, 2
012
Mar
ch 3
1, 2
012
Hol
ding
Com
pany
Thi
nkso
ft G
loba
lS
ervi
ces
Lim
ited
Thi
nkso
ft G
loba
lS
ervi
ces
Lim
ited
Thi
nkso
ft G
loba
lS
ervi
ces
Lim
ited
Thi
nkso
ft G
loba
lS
ervi
ces
Lim
ited
Thi
nkso
ft G
loba
lS
ervi
ces
Lim
ited
Hol
ding
Com
pany
inte
rest
100%
100%
100%
100%
100%
Sha
res
held
by
the
Hol
ding
com
pany
in th
e S
ubsi
diar
y10
0,00
0 eq
uity
sha
res
of
SG
D 1
/- e
ach
fully
pai
d up
3,00
0 eq
uity
sha
res
of U
SD
0.0
1/-
each
fully
pai
d up
Eur
o 50
,000
/-35
,000
equ
ity s
hare
s of
G
BP
1/-
eac
h fu
lly p
aid
upA
ED
600
,000
/-
Net
agg
rega
te a
mou
nt o
f Pro
fi t o
f the
sub
sidi
ary
so fa
r as
it
conc
erns
the
mem
bers
of
hold
ing
com
pany
and
is
not
dea
l with
in th
e A
ccou
nts
of H
oldi
ng C
ompa
ny
for
the
fi nan
cial
yea
r en
ded
onM
arch
31,
201
2 (R
s. M
n)5.
775.
59-0
.31
10.7
71.
24
for
the
prev
ious
fi na
ncia
l yea
rs o
f the
subs
idia
ry s
ince
it b
ecam
e a
Sub
sidi
ary
(Rs.
Mn)
21.9
20.
855.
667.
13N
A
Net
agg
rega
te a
mou
nt o
f pro
fi t /
(Los
ses)
of t
he s
ub-
sidi
ary
so fa
r as
it c
once
rns
the
mem
bers
of h
oldi
ng
com
pany
and
is d
ealt
with
in th
e A
ccou
nts
of H
oldi
ng
Com
pany
for
the
fi nan
cial
yea
r en
ded
on M
arch
31,
201
2(R
s. M
n)N
ILN
ILN
ILN
ILN
IL
for
the
prev
ious
fi na
ncia
l yea
rs o
f the
sub
sidi
ary
sinc
e it
beca
me
a S
ubsi
diar
y (R
s. M
n)N
ILN
ILN
ILN
ILN
IL
F
or
and
on
beh
alf
of
the
Bo
ard
of
Dir
ecto
rs o
f
Th
inks
oft
Glo
bal
Ser
vice
s L
imit
ed
Pla
ce:
Ben
galu
ru
A V
Asv
ini K
um
ar
Van
aja
Arv
ind
A
Th
anik
ain
ath
anD
ate:
Jun
e 15
, 201
2 M
anag
ing
Dir
ecto
r E
xecu
tive
Dir
ecto
r C
om
pan
y S
ecre
tary
Annual Report 2011-201212
Directors' Report
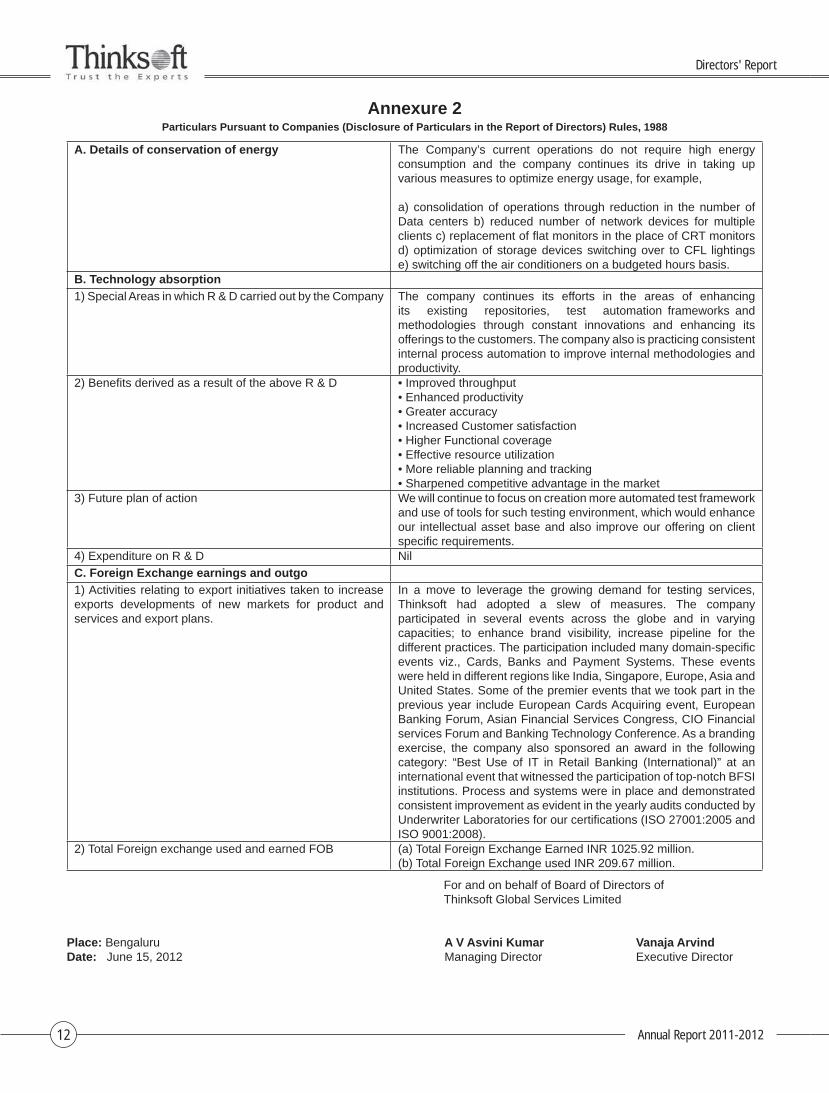
Annexure 2Particulars Pursuant to Companies (Disclosure of Particulars in the Report of Directors) Rules, 1988
A. Details of conservation of energy The Company’s current operations do not require high energy consumption and the company continues its drive in taking up various measures to optimize energy usage, for example,
a) consolidation of operations through reduction in the number of Data centers b) reduced number of network devices for multiple clients c) replacement of fl at monitors in the place of CRT monitors d) optimization of storage devices switching over to CFL lightingse) switching off the air conditioners on a budgeted hours basis.
B. Technology absorption
1) Special Areas in which R & D carried out by the Company The company continues its efforts in the areas of enhancing its existing repositories, test automation frameworks and methodologies through constant innovations and enhancing its offerings to the customers. The company also is practicing consistent internal process automation to improve internal methodologies and productivity.
2) Benefi ts derived as a result of the above R & D • Improved throughput• Enhanced productivity• Greater accuracy• Increased Customer satisfaction• Higher Functional coverage• Effective resource utilization• More reliable planning and tracking• Sharpened competitive advantage in the market
3) Future plan of action We will continue to focus on creation more automated test framework and use of tools for such testing environment, which would enhance our intellectual asset base and also improve our offering on client specifi c requirements.
4) Expenditure on R & D Nil
C. Foreign Exchange earnings and outgo
1) Activities relating to export initiatives taken to increase exports developments of new markets for product and services and export plans.
In a move to leverage the growing demand for testing services, Thinksoft had adopted a slew of measures. The company participated in several events across the globe and in varying capacities; to enhance brand visibility, increase pipeline for the different practices. The participation included many domain-specifi c events viz., Cards, Banks and Payment Systems. These events were held in different regions like India, Singapore, Europe, Asia and United States. Some of the premier events that we took part in the previous year include European Cards Acquiring event, European Banking Forum, Asian Financial Services Congress, CIO Financial services Forum and Banking Technology Conference. As a branding exercise, the company also sponsored an award in the following category: “Best Use of IT in Retail Banking (International)” at an international event that witnessed the participation of top-notch BFSI institutions. Process and systems were in place and demonstrated consistent improvement as evident in the yearly audits conducted by Underwriter Laboratories for our certifi cations (ISO 27001:2005 and ISO 9001:2008).
2) Total Foreign exchange used and earned FOB (a) Total Foreign Exchange Earned INR 1025.92 million.(b) Total Foreign Exchange used INR 209.67 million.
For and on behalf of Board of Directors of Thinksoft Global Services Limited
Place: Bengaluru A V Asvini Kumar Vanaja ArvindDate: June 15, 2012 Managing Director Executive Director
Annual Report 2011-2012 13
Directors' Report
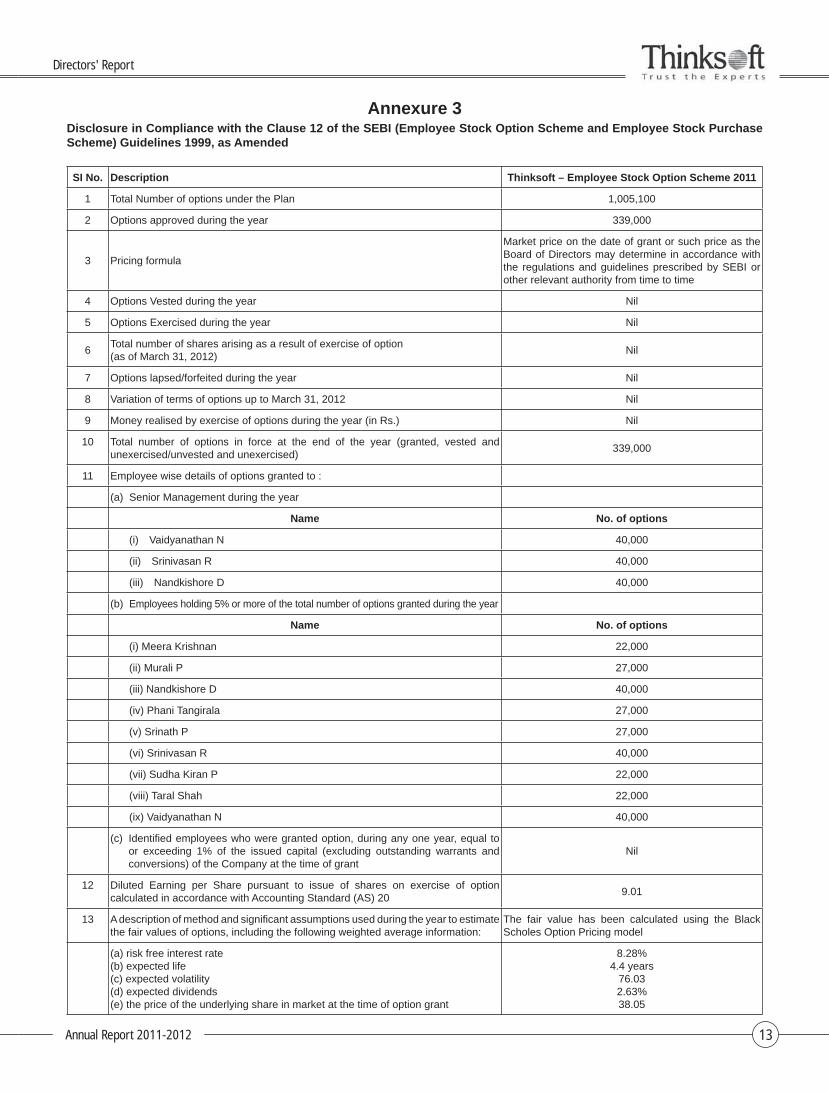
Annexure 3Disclosure in Compliance with the Clause 12 of the SEBI (Employee Stock Option Scheme and Employee Stock Purchase Scheme) Guidelines 1999, as Amended
SI No. Description Thinksoft – Employee Stock Option Scheme 2011
1 Total Number of options under the Plan 1,005,100
2 Options approved during the year 339,000
3 Pricing formula
Market price on the date of grant or such price as the Board of Directors may determine in accordance with the regulations and guidelines prescribed by SEBI or other relevant authority from time to time
4 Options Vested during the year Nil
5 Options Exercised during the year Nil
6Total number of shares arising as a result of exercise of option(as of March 31, 2012)
Nil
7 Options lapsed/forfeited during the year Nil
8 Variation of terms of options up to March 31, 2012 Nil
9 Money realised by exercise of options during the year (in Rs.) Nil
10 Total number of options in force at the end of the year (granted, vested and unexercised/unvested and unexercised)
339,000
11 Employee wise details of options granted to :
(a) Senior Management during the year
Name No. of options
(i) Vaidyanathan N 40,000
(ii) Srinivasan R 40,000
(iii) Nandkishore D 40,000
(b) Employees holding 5% or more of the total number of options granted during the year
Name No. of options
(i) Meera Krishnan 22,000
(ii) Murali P 27,000
(iii) Nandkishore D 40,000
(iv) Phani Tangirala 27,000
(v) Srinath P 27,000
(vi) Srinivasan R 40,000
(vii) Sudha Kiran P 22,000
(viii) Taral Shah 22,000
(ix) Vaidyanathan N 40,000
(c) Identifi ed employees who were granted option, during any one year, equal to or exceeding 1% of the issued capital (excluding outstanding warrants and conversions) of the Company at the time of grant
Nil
12 Diluted Earning per Share pursuant to issue of shares on exercise of option calculated in accordance with Accounting Standard (AS) 20
9.01
13 A description of method and signifi cant assumptions used during the year to estimate the fair values of options, including the following weighted average information:
The fair value has been calculated using the Black Scholes Option Pricing model
(a) risk free interest rate(b) expected life(c) expected volatility(d) expected dividends(e) the price of the underlying share in market at the time of option grant
8.28%4.4 years
76.032.63%38.05
Annual Report 2011-201214
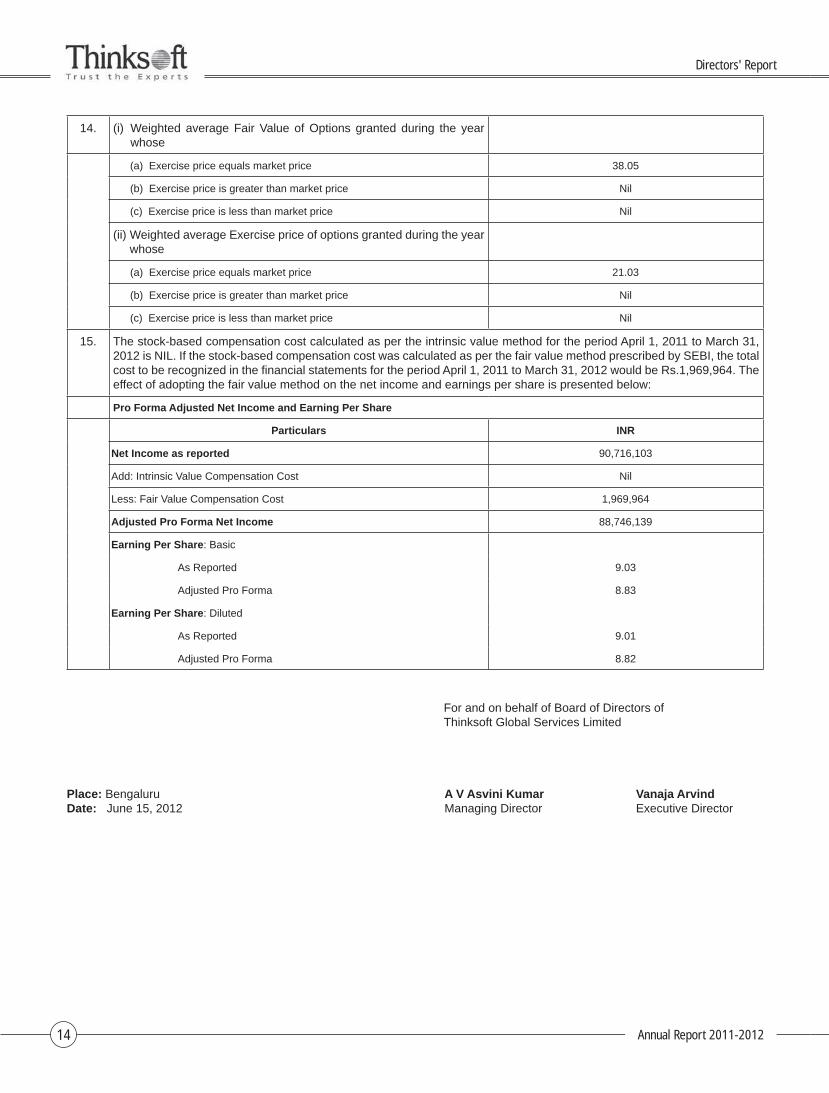
14. (i) Weighted average Fair Value of Options granted during the year whose
(a) Exercise price equals market price 38.05
(b) Exercise price is greater than market price Nil
(c) Exercise price is less than market price Nil
(ii) Weighted average Exercise price of options granted during the year whose
(a) Exercise price equals market price 21.03
(b) Exercise price is greater than market price Nil
(c) Exercise price is less than market price Nil
15. The stock-based compensation cost calculated as per the intrinsic value method for the period April 1, 2011 to March 31, 2012 is NIL. If the stock-based compensation cost was calculated as per the fair value method prescribed by SEBI, the total cost to be recognized in the fi nancial statements for the period April 1, 2011 to March 31, 2012 would be Rs.1,969,964. The effect of adopting the fair value method on the net income and earnings per share is presented below:
Pro Forma Adjusted Net Income and Earning Per Share
Particulars INR
Net Income as reported 90,716,103
Add: Intrinsic Value Compensation Cost Nil
Less: Fair Value Compensation Cost 1,969,964
Adjusted Pro Forma Net Income 88,746,139
Earning Per Share: Basic
As Reported 9.03
Adjusted Pro Forma 8.83
Earning Per Share: Diluted
As Reported 9.01
Adjusted Pro Forma 8.82
For and on behalf of Board of Directors of Thinksoft Global Services Limited
Place: Bengaluru A V Asvini Kumar Vanaja ArvindDate: June 15, 2012 Managing Director Executive Director
Directors' Report
Annual Report 2011-2012 15
Management Discussion and AnalysisIndustry OutlookThe year gone by was a tough one for the global economy and despite the volatility in economic environment, 2011 recorded steady growth for the technology and related services sector, with worldwide spending exceeding 1.7 trillion. Software products, IT and BPO continued to lead, accounting for over 1 trillion of the total spend.
As far as the Indian IT-BPO sector is concerned, FY 2012 is a landmark year as the industry is set to achieve a signifi cant milestone of exceeding US$ 100 billion in aggregate revenue. Despite stiff competition from other locations, India still retains its leadership position as the world’s leading global outsourcing destination for IT-BPO services with a global share of 58 percent in 2011. Key factors contributing to this leadership position would include unparalleled human capital, continued focus on optimal cost effi ciency, unique customer centricity, scalable and secure environment and supportive ecosystem.
The last two years have seen the burgeoning of new technology at a much faster pace and we believe that this will continue to grow faster in the future. Driving this was the pace of mobile adoption, where tablets and smartphones sales growth outpaced the growth of desktop and laptop market. The market for enterprise mobility solutions is expected to grow exponentially to about US$ 17 billion by 2015 according to NASSCOM estimates and this presents a huge opportunity for IT service providers. Apart from this, the public cloud services spending is also expected to outpace growth of overall IT spend by about four times between 2012-2015.
From a vertical perspective, BFSI continues to be the largest vertical committing monies to leverage the potential of IT and propel them to the next level of growth. Indian IT fi rms have developed advanced capabilities across the BFSI value chain and the effort is on to adopting new technologies to enhance customer service. Key technological innovations include cloud and mobility technologies to enable electronic and mobile enabled services, electronic commerce and such.
Testing MarketSoftware testing and Quality Assurance (QA) are perhaps the most critical components of a product’s life cycle and the most valuable IT discipline within an enterprise. Testing is the phase during which the effi cacy and robustness of a solution’s design and code is vetted, logical and functional bugs are unearthed, and gaps between what was intended and what is being delivered are identifi ed.
Software testing is intensive enough to consume more than half of the total software development budget. It demands the preparation of an extensive set of test cases, multiple test situations under which the solution is expected to perform, load tests, and user tests. These tests require adequate hardware, software and personnel support – a heavy claim on enterprises’ budget, time, and internal resources.
As far as testing is concerned, the market for independent software testing services has been growing rapidly and NASSCOM estimates the same as growing by about 19% for FY 2012. Over the last fi ve to six years, India has become the leading destination for outsourced software testing accounting for almost 32% of the global outsourcing share. A key feature to be noted is that export revenues have doubled in the last fi ve years while the number of employees has grown at a much lesser pace indicating the non-linear model of these services. The key functions that are currently outsourced include functional testing, systems testing, regression testing and integration testing.
BFSI accounts for more than half the share of software testing export while we are seeing other sectors like telecommunication, retail and insurance also jumping on to the testing bandwagon. Another distinguishing feature is the greater acceptance of specialist best of breed service providers for testing rather than someone who provides a wide bouquet of services.
Business OverviewThinksoft is India’s only pure play listed entity in the independent software space and provides software validation and verifi cation services to the banking and fi nancial services industry worldwide. The Company has operations across the globe with centers in India, Singapore, USA, Germany and UK. Thinksoft follows a hybrid delivery model, which is a combination of client site services and offshore services. Large amount of the work is carried offshore and Thinksoft sets up and operates dedicated India-based testing centers for customers.
Thinksoft’s proven credentials have resulted in us developing deep relationships with Industry leaders in the Banking & Financial Services space. Our relationship with every client spans multiple divisions within the client’s organization and different geographies covered by the client. For example, with a Bank who is a global leader in the past, we have done testing for various divisions, which include, Private Banking, Credit Cards, Investment Banking, Retail Banking, Corporate Banking across India, Japan, USA, Spain, Hungary, etc.
For the year 2012, consolidated revenues stood at Rs 121.44 crore showing a growth of 46% while the net profi t came in at Rs 11.37 crore, an increase of 508% YoY. The performance in FY 2012 came after two to three years of fl at growth.
In spite of the 3 fl at years, we have grown at a CAGR of almost 24.72% for 10 years ended March 2012 which is close to the NASSCOM Growth rate for Indian IT Services Industry. This reinforces our confi dence in the Specialist business model which is signifi cantly different from that of the end to end IT Service providers. The key to the success of the Company despite some tough economic conditions and the general propensity of clients to look at large players has been its differentiated approach and focus on some key strategic imperatives. We highlight some key initiatives that were undertaken by the management to get the Company back on the path towards growth.
Geographical expansion in Asia helped us de-risk issues arising out of the Euro crisis and this region has contributed almost 35% in FY 2012 compared to the 25% in the previous fi scal.
The Company has consciously adopted a “Follow the Product” model which is paying good dividends not only in the Cards
Management Discussion & Analysis
Annual Report 2011-201216
and Retail Banking but also in other BFSI domains.
Creation of expertise based offerings like Anti Money Laundering (AML), Risk Prioritization and creation of repository has helped us garner specifi c targeted clients in downturn markets like US and Europe
Process improvements and automation has helped us increase our productivity and hence a delighted client ensured better sales growth across geographies.
While repeat business was a sign of delighted clients, the Company also focused on adding new logos to its portfolio and we believe that this has paid us rich dividends this year.
Business OutlookLooking at the current market for specialist independent software testing service providers, the Company is confi dent that growth will be at a pace much faster than that projected by the NASSCOM for the industry as a whole. We believe that organizations around the world using independent testing services are benefi tting with signifi cant improvement in their business strategies including risk mitigation, validation of new products/services, being able to support faster time-to-market with reduced test cycles and improving real time business performance and monitoring.
The Company has therefore focused on certain key aspects of its business to leverage the opportunity in front of it. These include:
Diversifying to newer geographies to address the risk of economic downturn in specifi c regions. Australia, Africa and South America are regions that the Company would focus on in terms of building its sales engine for the fi nancial year 2012-13.
Aligning focus to growing market needs in specifi c domain areas like Payments, Solvency II, Risk and Compliance. Mobile applications testing and using cloud platforms to provide Testing as a Service will be key focus areas to leverage the emerging demands.
Growing adoption of AGILE testing vis-à-vis traditional waterfall model is another potential opportunity for the Company given that there is a huge business potential when we look at it in terms of partnering with development shops of product companies.
Leveraging the high adaptation of cloud based services in rendering mobile testing solutions is a targeted area for growth for Thinksoft in the next couple of years.
Strengthening the marketing and the partnership building in specifi c regions as also addition of remote testing centers near Chennai and Mumbai in Tier 3/4 cities would be also force multipliers in our quest for profi table growth.
Ability to cherry pick marquee Indian clients with a stated objective of building brand recognition is another strategy outlined and we have already seen some traction on that count.
As we move into the next fi scal, Thinksoft’s Leadership team is confi dent that the plans and action points put together by them will slowly but surely translate into superlative growth in the years to come to establish the orgnaisation as leader among specialists in IT services.
Note:
The above discussion and analysis should be read in conjunction with the Company’s fi nancial statements included herein and the notes thereto. The fi nancial statements have been prepared in compliance with the requirements of the Companies Act, 1956 and Generally Accepted Accounting Principles (GAAP) in India. The Company’s management accepts responsibility for the integrity and objectivity of these fi nancial statements, as well as for various estimates and judgments used therein. The estimates and judgments relating to the fi nancial statements have been made on a prudent and reasonable basis, in order that the fi nancial statements refl ect in a true and fair manner the form and substance of transactions, and reasonably present the Company’s state of affairs and profi ts for the year. Investors are cautioned that this discussion contains forward looking statements that involve risks and uncertainties. When used in this discussion, words like ‘will’, ‘shall’, ‘anticipate’, ‘believe’, ‘estimate’, ‘intend’ and ‘expect’ and other similar expressions as they relate to the Company or its business are intended to identify such forward-looking statements. The Company undertakes no obligations to publicly update or revise any forward-looking statements, whether as a result of new information, future events, or otherwise. Actual results, performances or achievements could differ materially from those expressed or implied in such statements. Factors that could cause or contribute to such differences include those described under the heading “Risk factors” in the Company’s prospectus fi led with the Securities and Exchange Board of India (SEBI) as well as factors discussed elsewhere in this report. Readers are cautioned not to place undue reliance on the forward-looking statements as they speak only as of their dates.
Information provided in this Management Discussion and Analysis (MD&A) pertains to Thinksoft Global Services Limited (Company) on a consolidated basis, unless otherwise stated.
Management Discussion & Analysis
Annual Report 2011-2012 17
Report on Corporate Governance
1. Company’s Philosophy on Code of Corporate Governance
Thinksoft is committed to maintaining high standards of Corporate Governance, protecting Customers’, Shareholders’ and other Stakeholders’ interests. In line with this philosophy, Thinksoft Global Services Limited endeavours to maintain transparency at all levels through adoption of best Corporate Governance Practices. The following is a report on the status and progress on major aspects of Corporate Governance.
2. Board of Directors
The Directors of the Company possess highest professional ethics, integrity and values, and are committed to representing the long-term interests of the stakeholders. The basic responsibility of the Board is to provide effective governance over the Company’s affairs exercising its reasonable business judgment on behalf of the Company.
The Board has an optimum combination of Executive and Non Executive & Independent Directors, which ensures proper governance and management. The Chairman of the Board is an Executive Promoter Director. As on March 31, 2012, the Company has six Directors with an Executive Chairman. Of the six Directors, three are Non-Executive Independent Directors (i.e. 50%). The composition of the Board is in conformity with Clause 49 of the Listing Agreements entered into with the Stock Exchanges.
As mandated under Clause 49 of the Listing Agreement with the Stock Exchanges, none of the Directors is a member of more than ten Board level Committees nor is any of them is a Chairman of more than fi ve Board level committees, in which they are members.
Board Meetings
Six Board Meetings held during the year and the gap between two meetings did not exceed four months. The dates on which the said meetings held are as follows:
April 29, 2011; July 29, 2011; September 21, 2011; October 24, 2011; November 3, 2011 and January 25, 2012.
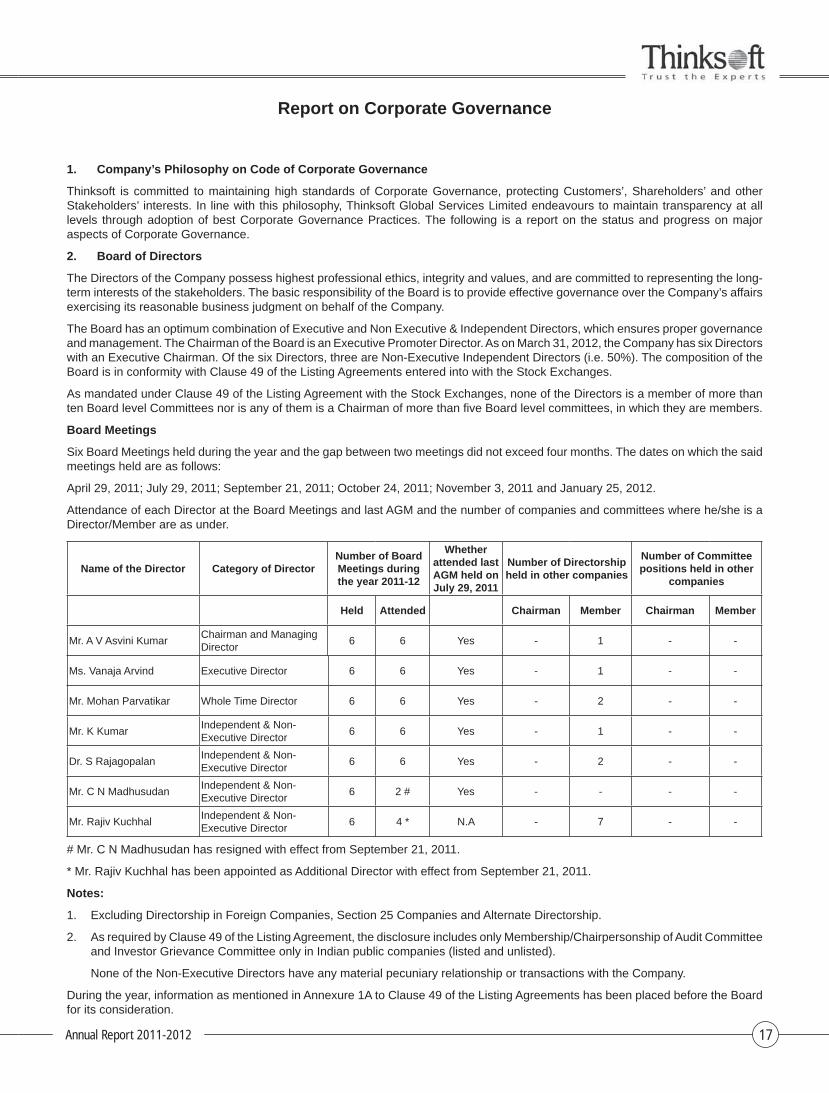
Attendance of each Director at the Board Meetings and last AGM and the number of companies and committees where he/she is a Director/Member are as under.
Name of the Director Category of DirectorNumber of Board Meetings during the year 2011-12
Whether attended last AGM held on July 29, 2011
Number of Directorship held in other companies
Number of Committee positions held in other
companies
Held Attended Chairman Member Chairman Member
Mr. A V Asvini KumarChairman and Managing Director
6 6 Yes - 1 - -
Ms. Vanaja Arvind Executive Director 6 6 Yes - 1 - -
Mr. Mohan Parvatikar Whole Time Director 6 6 Yes - 2 - -
Mr. K KumarIndependent & Non-Executive Director
6 6 Yes - 1 - -
Dr. S RajagopalanIndependent & Non-Executive Director
6 6 Yes - 2 - -
Mr. C N MadhusudanIndependent & Non-Executive Director
6 2 # Yes - - - -
Mr. Rajiv KuchhalIndependent & Non-Executive Director
6 4 * N.A - 7 - -
# Mr. C N Madhusudan has resigned with effect from September 21, 2011.
* Mr. Rajiv Kuchhal has been appointed as Additional Director with effect from September 21, 2011.
Notes:
1. Excluding Directorship in Foreign Companies, Section 25 Companies and Alternate Directorship.
2. As required by Clause 49 of the Listing Agreement, the disclosure includes only Membership/Chairpersonship of Audit Committee and Investor Grievance Committee only in Indian public companies (listed and unlisted).
None of the Non-Executive Directors have any material pecuniary relationship or transactions with the Company.
During the year, information as mentioned in Annexure 1A to Clause 49 of the Listing Agreements has been placed before the Board for its consideration.
Annual Report 2011-201218
Post meeting follow-up mechanism
Important decisions taken at the Board/Committee Meetings are promptly communicated to the concerned departments. Action Taken Report on decisions/minutes of previous meetings is placed at the succeeding meetings of the Board/Committee for noting.
3. Audit Committee
The Audit Committee of the Company is constituted in line with the provisions of Clause 49 of the Listing Agreements with the Stock Exchanges read with Section 292A of the Companies Act, 1956. The Committee was reconstituted by the Board of Directors at their meeting held on 21st September 2011.
The Statutory Auditors and Internal Auditors are invited to attend the Audit Committee meetings as and when necessary and the Company Secretary acts as the Secretary of the Committee.
The minutes of the meetings of the Audit Committee are circulated to all the members of the Board along with the Board Agenda.
I. Meetings and attendance during the year
Four Audit Committee Meetings were held during the year. The dates on which the said meetings were held are as follows:
April 29, 2011; July 29, 2011; October 24, 2011 and January 25, 2012
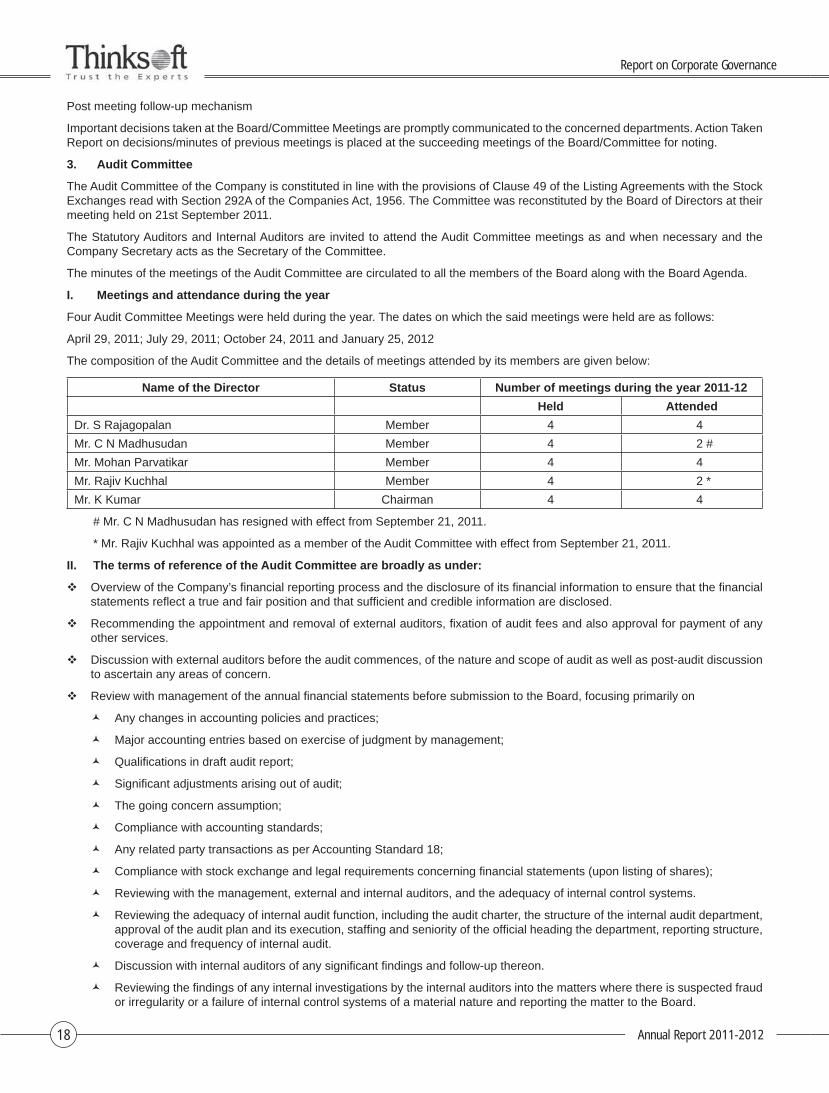
The composition of the Audit Committee and the details of meetings attended by its members are given below:
Name of the Director Status Number of meetings during the year 2011-12
Held Attended
Dr. S Rajagopalan Member 4 4
Mr. C N Madhusudan Member 4 2 #
Mr. Mohan Parvatikar Member 4 4
Mr. Rajiv Kuchhal Member 4 2 *
Mr. K Kumar Chairman 4 4
# Mr. C N Madhusudan has resigned with effect from September 21, 2011.
* Mr. Rajiv Kuchhal was appointed as a member of the Audit Committee with effect from September 21, 2011.
II. The terms of reference of the Audit Committee are broadly as under:
Overview of the Company’s fi nancial reporting process and the disclosure of its fi nancial information to ensure that the fi nancial statements refl ect a true and fair position and that suffi cient and credible information are disclosed.
Recommending the appointment and removal of external auditors, fi xation of audit fees and also approval for payment of any other services.
Discussion with external auditors before the audit commences, of the nature and scope of audit as well as post-audit discussion to ascertain any areas of concern.
Review with management of the annual fi nancial statements before submission to the Board, focusing primarily on
Any changes in accounting policies and practices;
Major accounting entries based on exercise of judgment by management;
Qualifi cations in draft audit report;
Signifi cant adjustments arising out of audit;
The going concern assumption;
Compliance with accounting standards;
Any related party transactions as per Accounting Standard 18;
Compliance with stock exchange and legal requirements concerning fi nancial statements (upon listing of shares);
Reviewing with the management, external and internal auditors, and the adequacy of internal control systems.
Reviewing the adequacy of internal audit function, including the audit charter, the structure of the internal audit department, approval of the audit plan and its execution, staffi ng and seniority of the offi cial heading the department, reporting structure, coverage and frequency of internal audit.
Discussion with internal auditors of any signifi cant fi ndings and follow-up thereon.
Reviewing the fi ndings of any internal investigations by the internal auditors into the matters where there is suspected fraud or irregularity or a failure of internal control systems of a material nature and reporting the matter to the Board.
Report on Corporate Governance
Annual Report 2011-2012 19
Looking into the reasons for substantial defaults in payments to the depositors, debenture holders, shareholders (in case of non-payment of declared dividends) and creditors.
Reviewing, with the management, the statement of uses/application of funds raised through an issue (public issue, rights issue, preferential issue, etc.), the statement of funds utilized for purposes other than those stated in the offer document/prospectus/ notice and the report submitted by the monitoring agency monitoring the utilization of proceeds of a public or rights.
Issue and making appropriate recommendations to the Board to take up steps in the matter.
Mr. K Kumar, Chairman of the Audit Committee attended the previous Annual General Meeting of the Company held on July 29, 2011.
4. Remuneration Committee
Remuneration Committee is not mandatory as per clause 49 of the Listing Agreement. The Committee was reconstituted by the Board of Directors at their meeting held on 21st September 2011.
I. Brief description of terms of reference
The terms of reference of the Remuneration Committee are broadly as under:
To review the Company’s remuneration policy on specifi c remuneration packages to Executive Directors including pension rights and any compensation payment while striking a balance with the interest of the Company and the shareholders.
To approve the Annual Remuneration Plan of the Company.
To formulate the Employees Stock Option Scheme in accordance with the relevant regulations/guidelines for the time being in force and recommend the same to the Board for its consideration.
Administration of ESOP Scheme as stipulated under SEBI (ESOS & ESOP) Guidelines, 1999.
II. Composition, name of the Members and Chairman
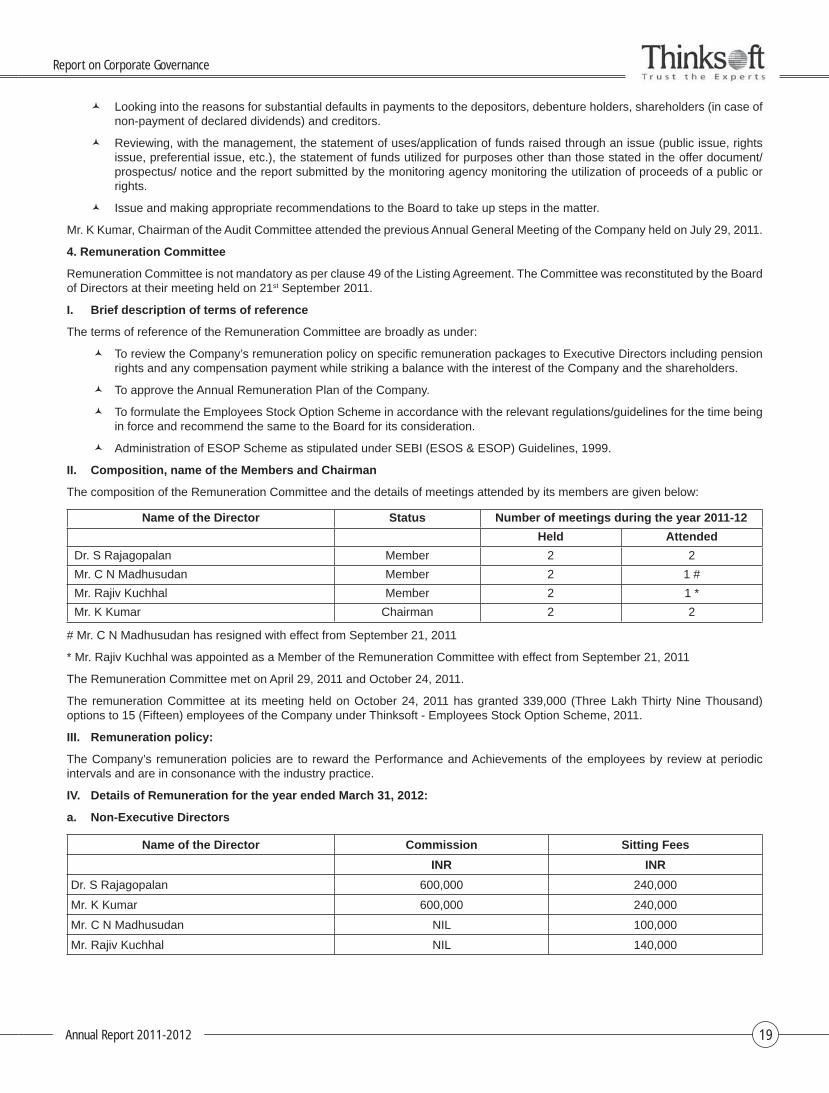
The composition of the Remuneration Committee and the details of meetings attended by its members are given below:
Name of the Director Status Number of meetings during the year 2011-12
Held Attended
Dr. S Rajagopalan Member 2 2
Mr. C N Madhusudan Member 2 1 #
Mr. Rajiv Kuchhal Member 2 1 *
Mr. K Kumar Chairman 2 2
# Mr. C N Madhusudan has resigned with effect from September 21, 2011
* Mr. Rajiv Kuchhal was appointed as a Member of the Remuneration Committee with effect from September 21, 2011
The Remuneration Committee met on April 29, 2011 and October 24, 2011.
The remuneration Committee at its meeting held on October 24, 2011 has granted 339,000 (Three Lakh Thirty Nine Thousand) options to 15 (Fifteen) employees of the Company under Thinksoft - Employees Stock Option Scheme, 2011.
III. Remuneration policy:
The Company’s remuneration policies are to reward the Performance and Achievements of the employees by review at periodic intervals and are in consonance with the industry practice.
IV. Details of Remuneration for the year ended March 31, 2012:
a. Non-Executive Directors
Name of the Director Commission Sitting Fees
INR INR
Dr. S Rajagopalan 600,000 240,000
Mr. K Kumar 600,000 240,000
Mr. C N Madhusudan NIL 100,000
Mr. Rajiv Kuchhal NIL 140,000
Report on Corporate Governance
Annual Report 2011-201220
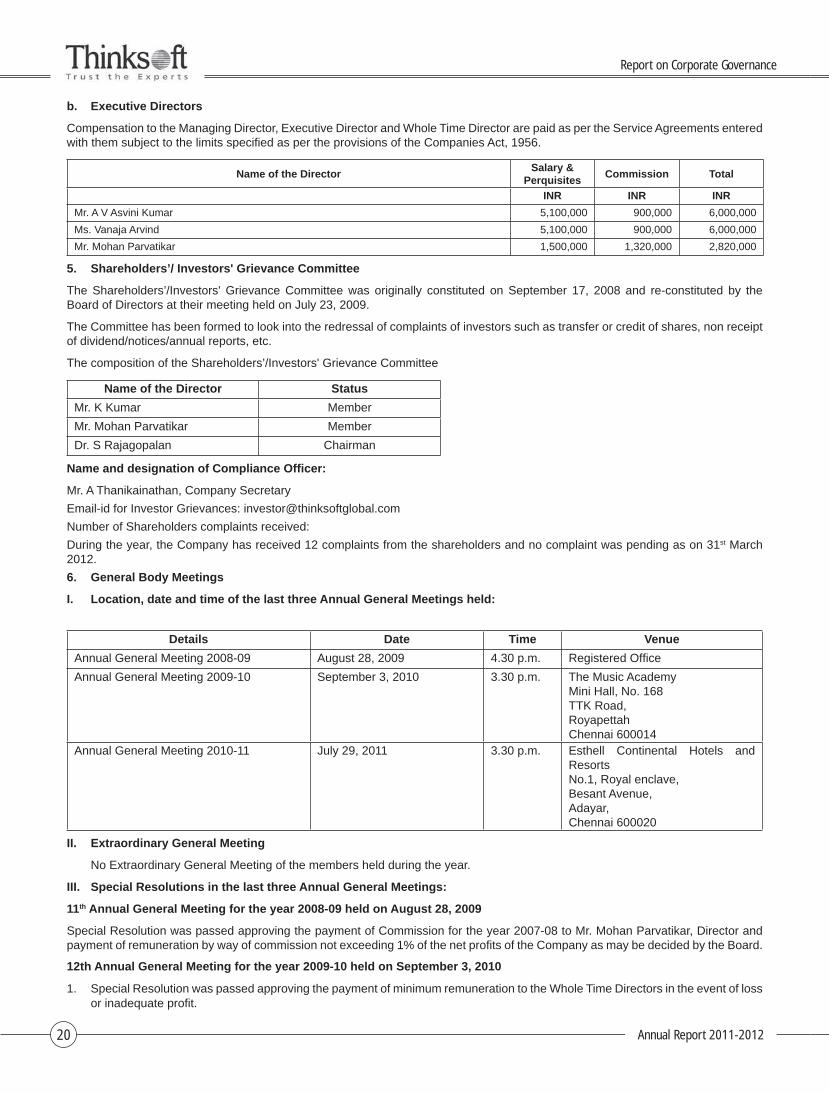
b. Executive Directors
Compensation to the Managing Director, Executive Director and Whole Time Director are paid as per the Service Agreements entered with them subject to the limits specifi ed as per the provisions of the Companies Act, 1956.
Name of the DirectorSalary &
PerquisitesCommission Total
INR INR INR
Mr. A V Asvini Kumar 5,100,000 900,000 6,000,000
Ms. Vanaja Arvind 5,100,000 900,000 6,000,000
Mr. Mohan Parvatikar 1,500,000 1,320,000 2,820,000
5. Shareholders’/ Investors' Grievance Committee
The Shareholders’/Investors' Grievance Committee was originally constituted on September 17, 2008 and re-constituted by the Board of Directors at their meeting held on July 23, 2009.
The Committee has been formed to look into the redressal of complaints of investors such as transfer or credit of shares, non receipt of dividend/notices/annual reports, etc.
The composition of the Shareholders’/Investors' Grievance Committee
Name of the Director Status
Mr. K Kumar Member
Mr. Mohan Parvatikar Member
Dr. S Rajagopalan Chairman
Name and designation of Compliance Offi cer:
Mr. A Thanikainathan, Company Secretary
Email-id for Investor Grievances: [email protected]
Number of Shareholders complaints received:
During the year, the Company has received 12 complaints from the shareholders and no complaint was pending as on 31st March 2012.
6. General Body Meetings
I. Location, date and time of the last three Annual General Meetings held:
Details Date Time Venue
Annual General Meeting 2008-09 August 28, 2009 4.30 p.m. Registered Offi ce
Annual General Meeting 2009-10 September 3, 2010 3.30 p.m. The Music AcademyMini Hall, No. 168TTK Road,RoyapettahChennai 600014
Annual General Meeting 2010-11 July 29, 2011 3.30 p.m. Esthell Continental Hotels and ResortsNo.1, Royal enclave,Besant Avenue,Adayar,Chennai 600020
II. Extraordinary General Meeting
No Extraordinary General Meeting of the members held during the year.
III. Special Resolutions in the last three Annual General Meetings:
11th Annual General Meeting for the year 2008-09 held on August 28, 2009
Special Resolution was passed approving the payment of Commission for the year 2007-08 to Mr. Mohan Parvatikar, Director and payment of remuneration by way of commission not exceeding 1% of the net profi ts of the Company as may be decided by the Board.
12th Annual General Meeting for the year 2009-10 held on September 3, 2010
1. Special Resolution was passed approving the payment of minimum remuneration to the Whole Time Directors in the event of loss or inadequate profi t.
Report on Corporate Governance
Annual Report 2011-2012 21
2. Special Resolution was passed approving the payment of Commission from April 1, 2009 to March 31, 2014 for all the Non-Executive Directors put together not exceeding 1% of the net profi ts of the Company as may be decided by the Board.
13th Annual General Meeting for the year 2010-11 held on July 29, 2011
Special Resolution was passed approving the Thinksoft – Employees Stock Option Scheme 2011.
7. Disclosures
I. Related Party Transactions:
Transactions with related parties are disclosed in detail in Note no. 27 annexed to the fi nancial statements for the year. These transactions were not in confl ict with the interest of the Company.
II. Details of non-compliance by the Company, penalties and strictures imposed on the Company by the Stock Exchanges or Securities and Exchange Board of India (SEBI) or any other statutory authority on any matter related to the Capital markets during the last three years:
There were no instances of material non-compliance and no strictures or penalties were imposed on the Company either by Securities Exchange Board of India (SEBI), Stock Exchanges or any statutory authorities on any matter related to capital markets during the last three years.
III. Whistle Blower Policy
Your company has formulated and adopted a Whistle Blower policy vide the Board of Directors resolution passed by circulation dated September 22, 2010 and confi rmed at its meeting held on October 28, 2010.
IV. Details of compliance with mandatory requirements and adoption of the non-mandatory requirements of this clause:
The Company has complied with all mandatory requirements laid down in Clause 49, as applicable. Though the company has not adopted any non-mandatory requirements, its compliance was disclosed at appropriate place.
8. Means of Communication to Shareholders
I. Quarterly results and news paper wherein results published
During the year, quarterly, half yearly and Annual Financial Results on the Standalone basis and Consolidated basis of the Company were submitted to the Stock Exchanges soon after approved by Board of Directors. The Financial Results are also published in 2 leading newspapers Financial Express (English) and Makkal Kural (Tamil). These were also promptly displayed on the Company’s website www.thinksoftglobal.com. All offi cial news release of relevance to the investors are also made available on the Company’s website for a reasonable period of time.
9. General Shareholder Information
I. Annual General Meeting Date, Time and Venue
14th Annual General Meeting
Date and Time : Wednesday, July 25, 2012 at 3.30 pm
Venue : The Music Academy, Kasturi Srinivasan Hall (Mini Hall), No. 168, TTK Road, Royapettah, Chennai 600014
II. Financial calendar
Tentative Financial Calendar for the year 2012-13
Financial Year April 1, 2012 to March 31, 2013
First Quarter Results On or before August 10, 2012
Half Yearly Results On or before November 15, 2012
Third Quarter Results On or before February 15, 2013
Fourth Quarter Results and Annual On or before May 31, 2013
III. Date of book closure
July 14, 2012 to July 25, 2012 (Both days inclusive)
IV. Dividend payment date
The Dividend proposed to be declared for the year 2011-12 will be paid on or before August 23, 2012.
Report on Corporate Governance

Annual Report 2011-201222
V. Listing of Stock Exchanges and Stock Code
10,051,581 equity shares of INR 10/- each is listed at
Name of the Stock Exchange Stock Symbol
National Stock Exchange of India Limited THINKSOFT
Bombay Stock Exchange Limited 533121
The Company has paid the annual listing fees for the year 2012-13 to both the above Stock Exchanges.
VI Market Price Data:
The closing market price of equity shares on March 30, 2012 (last trading day of the year) was INR 41.70/- on NSE and INR 40.10/- on BSE.
The monthly movement of equity share prices during the year at NSE and BSE are summarized herein below:
VII. Monthly share price movement during 2011-12 at NSE & BSE
Month
NSE BSE
High (INR)
Low(INR)
VolumeHigh (INR)
Low(INR)
Volume
Apr-11 69.80 56.05 1,228,084 69.90 57.00 514,375
May-11 61.95 50.10 2,340,432 62.45 50.05 996,396
Jun-11 59.25 44.00 2,668,692 59.45 46.60 924,196
Jul-11 54.80 47.70 2,465,221 54.65 47.50 1,184,265
Aug-11 50.20 32.10 1,863,355 50.20 32.70 791,265
Sep-11 42.75 33.80 1,391,242 42.55 33.90 465,465
Oct-11 48.75 36.05 1,345,996 48.90 36.10 546,540
Nov-11 49.25 32.15 870,735 49.00 30.10 423,544
Dec-11 44.25 35.55 1,070,984 44.10 35.45 458,031
Jan-12 55.30 37.15 1,378,291 55.40 39.00 573,944
Feb-12 51.00 41.70 747,050 51.95 41.50 252,031
Mar-12 47.45 40.10 297,191 50.00 40.20 114,029
TOTAL 17,667,273 7,244,081
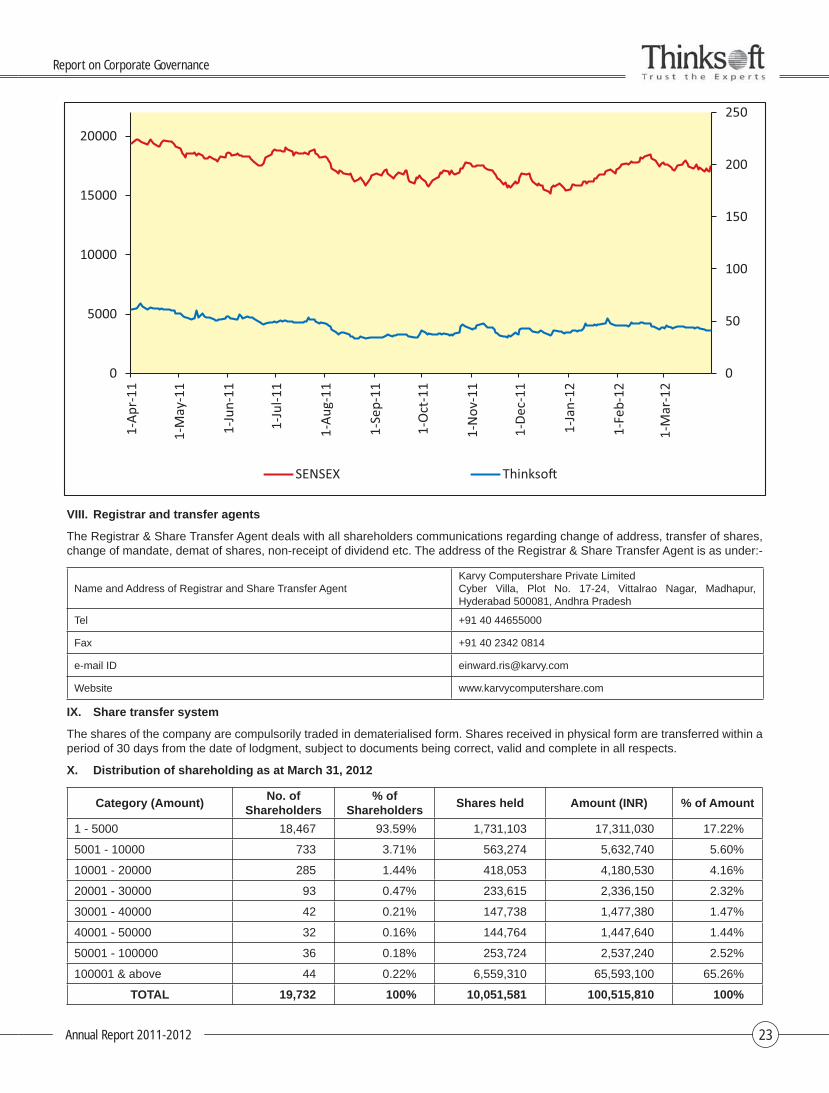
The performance of the equity share price of the Company vis-à-vis the NIFTY at NSE and SENSEX at BSE is as under:
0
50
100
150
200
250
0
1000
2000
3000
4000
5000
6000
1-Ap
r-11
1-May-11
1-Jun-11
1-Jul-1
1
1-Au
g-11
1-Sep-11
1-Oct-11
1-Nov-11
1-De
c-11
1-Jan-12
1-Feb-12
1-Mar-12
NIFTY Thinkso�
Report on Corporate Governance
Annual Report 2011-2012 23
0
50
100
150
200
250
0
5000
10000
15000
200001-Ap
r-11
1-May-11
1-Jun-11
1-Jul-1
1
1-Au
g-11
1-Sep-11
1-Oct-11
1-Nov-11
1-De
c-11
1-Jan-12
1-Feb-12
1-Mar-12
SENSEX Thinkso�
VIII. Registrar and transfer agents
The Registrar & Share Transfer Agent deals with all shareholders communications regarding change of address, transfer of shares, change of mandate, demat of shares, non-receipt of dividend etc. The address of the Registrar & Share Transfer Agent is as under:-
Name and Address of Registrar and Share Transfer AgentKarvy Computershare Private LimitedCyber Villa, Plot No. 17-24, Vittalrao Nagar, Madhapur, Hyderabad 500081, Andhra Pradesh
Tel +91 40 44655000
Fax +91 40 2342 0814
e-mail ID [email protected]
Website www.karvycomputershare.com
IX. Share transfer system
The shares of the company are compulsorily traded in dematerialised form. Shares received in physical form are transferred within a period of 30 days from the date of lodgment, subject to documents being correct, valid and complete in all respects.
X. Distribution of shareholding as at March 31, 2012
Category (Amount)No. of
Shareholders% of
ShareholdersShares held Amount (INR) % of Amount
1 - 5000 18,467 93.59% 1,731,103 17,311,030 17.22%
5001 - 10000 733 3.71% 563,274 5,632,740 5.60%
10001 - 20000 285 1.44% 418,053 4,180,530 4.16%
20001 - 30000 93 0.47% 233,615 2,336,150 2.32%
30001 - 40000 42 0.21% 147,738 1,477,380 1.47%
40001 - 50000 32 0.16% 144,764 1,447,640 1.44%
50001 - 100000 36 0.18% 253,724 2,537,240 2.52%
100001 & above 44 0.22% 6,559,310 65,593,100 65.26%
TOTAL 19,732 100% 10,051,581 100,515,810 100%
Report on Corporate Governance
Annual Report 2011-201224
XI. Dematerialisation of securities and liquidity
As on March 31, 2012, 97.28% shares of the Company were held in dematerialised form. The demat security (ISIN) code for the equity share is INE201K01015.
XII. Outstanding GDRs/ADRs/warrants/any other convertible instruments
The Company has not issued instruments of the captioned type.
XIII. Locations
The Company has three Delivery Centres in Chennai, one in Bengaluru and one Sales offi ce cum Delivery Centre in Mumbai. The Company has branch offi ces in Belgium, Cyprus and Malaysia. The Company has Place of Establishments in Hong Kong and Australia. The addresses of these offi ces are available on your Company’s website.
XIV. Address for correspondenceThinksoft Global Services LimitedType II, Unit 5, Dr. VSI Estate,Thiruvanmiyur, Chennai 600041Telephone: +91 44 43923200Fax: +91 44 43923258Website: www.thinksoftglobal.come-mail: [email protected]
For and on behalf of Board of Directors of Thinksoft Global Services Limited
Place: Bengaluru A V Asvini Kumar Vanaja ArvindDate: June 15, 2012 Managing Director Executive Director
Report on Corporate Governance
Annual Report 2011-2012 25
Compliance Certifi cate
To the Members of Thinksoft Global Services Limited
We have examined the compliance of the conditions of Corporate Governance by Thinksoft Global Services Limited, for the year
ended March 31, 2012 as stipulated in clause 49 of Listing Agreement of the said company with the Stock Exchanges.
The compliance of the conditions of Corporate Governance is the responsibility of the management. Our examination has been
limited to a review of the procedures & implementations thereof adopted by the company for ensuring compliance with the conditions
of Corporate Governance. It is neither an audit nor an expression of opinion of the fi nancial statements of the company.
In our opinion and to the best of our information and according to the explanations given to us, and the representations made by
the directors and the management and we certify that the company has complied with the conditions of Corporate Governance as
stipulated in Clause 49 of the above mentioned listing agreement.
As required by the Guidance note issued by the Institute of Chartered accountants of India, we have to state that based on the report
given by the Registrars of the Company to Investor Grievance Committee, as on March 31, 2012, there were no investor grievance
matters against the Company remaining unattended/pending for more than 30 days.
We further state that such compliance is neither an assurance as to the future viability of the company nor the effi ciency or effectiveness
with which the management has conducted the affairs of the company.
For PKF Sridhar & Santhanam Chartered AccountantsFirm Registration No. 003990S
T V BalasubramanianPartnerMembership No 27251
Place: Chennai Date: April 27, 2012
Annual Report 2011-201226
Declaration by the CEO under Clause 49(I)(D)(II) of the Listing Agreement
As provided under Clause-49 of the Listing Agreement with the Stock Exchanges, the Board of Directors and the Senior Management
Personnel have confi rmed compliance with the Code of Conduct and Ethics for the fi nancial year ended March 31, 2012.
For Thinksoft Global Services Limited
Place: Chennai A V Asvini Kumar
Date: April 27, 2012 Managing Director
Annual Report 2011-2012 27
CEO & CFO Certifi cation under clause49(V) of the Listing Agreement
We, A V Asvini Kumar, Managing Director and N Vaidyanathan, Chief Financial Offi cer, responsible for the fi nance function certify that:
a. We have reviewed fi nancial statements and the cash fl ow statement for the year ended 31st March 2012 and that to the best
of our knowledge and belief:
i. these statements do not contain any materially untrue statement or omit any material fact or contain statements that might
be misleading;
ii. these statements together present a true and fair view of the company’s affairs and are in compliance with existing
accounting standards, applicable laws and regulations.
b. There are, to the best of our knowledge and belief, no transactions entered into by the company during the year ended 31st
March 2012 are fraudulent, illegal or violative of the company’s code of conduct.
c. We accept responsibility for establishing and maintaining internal controls for fi nancial reporting and that we have evaluated
the effectiveness of internal control systems of the company pertaining to fi nancial reporting. Defi ciencies in the design or
operation of such internal controls, if any, of which we are aware of have been disclosed to the Auditors and the Audit
Committee and steps have been taken to rectify these defi ciencies.
d.
i. There has not been any signifi cant change in internal control over fi nancial reporting during the year under reference;
ii. There has not been signifi cant change in accounting policies during the year and that the same have been disclosed in the
notes to the fi nancial statements; and
iii. We are not aware of any instance during the year of signifi cant fraud with involvement therein of the management or an
employee having a signifi cant role in the company’s internal control system over fi nancial reporting.
Place: Chennai A V Asvini Kumar N Vaidyanathan
Date: April 27, 2012 Managing Director Chief Financial offi cer
Annual Report 2011-201228
Auditors’ Certifi cate as required under clause 14 of the SEBI (Employees Stock Option Scheme & Employee Stock Purchase Scheme) Guidelines, 1999
We have examined the books of account and other relevant records of Thinksoft Global Services Limited having its Registered Offi ce
at Type II, No.5, Dr.VSI Estate, Thiruvanmiyur, Chennai- 600041 and based on the information and explanations given to us, we
certify that in our opinion, the company has implemented the Employee Stock Option Scheme in accordance with SEBI (Employees
Stock Option Scheme & Employee Stock Purchase Scheme) Guidelines, 1999 and in accordance with the Special Resolution passed
by the company in the Annual General Meeting held on 29th July 2011.
For PKF Sridhar & Santhanam
Chartered Accountants
Firm Registration No.003990S
T V Balasubramanian
Partner
Membership No. 27251
Place: Chennai
Date: April 27, 2012
Annual Report 2011-2012 29
Auditors' Report
To
The Members of THINKSOFT GLOBAL SERVICES LTD
1. We have audited the attached Balance Sheet of THINKSOFT GLOBAL SERVICES LTD, Type 2, Unit 5, Dr. Vikram Sarabhai
Instronics Estate, Thiruvanmiyur, Chennai – 600041 as at March 31, 2012, the Profi t and Loss Account and also the Cash Flow
Statement for the year ended on that date annexed thereto. These fi nancial statements are the responsibility of the company's
management. Our responsibility is to express an opinion on these fi nancial statements based on our audit.
2. We conducted our audit in accordance with the auditing standards generally accepted in India. Those Standards require that
we plan and perform the audit to obtain reasonable assurance about whether the fi nancial statements are free of material
misstatement. An audit includes examining, on a test basis, evidence supporting the amounts and disclosures in the fi nancial
statements. An audit also includes assessing the accounting principles used and signifi cant estimates made by management,
as well as evaluating the overall fi nancial statement presentation. We believe that our audit provides a reasonable basis for
our opinion.
3. As required by the Companies (Auditor's Report) Order, 2003 issued by the Central Government of India in terms of sub-
section (4A) of section 227 of the Companies Act, 1956, we enclose in the Annexure a statement on the matters specifi ed in
paragraphs 4 and 5 of the said Order.
4. Further to our comments in the Annexure referred to in paragraph 3 above, we report that:
(i) We have obtained all the information and explanations, which to the best of our knowledge and belief were necessary for the purposes of our audit;
(ii) In our opinion, proper books of account as required by law have been kept by the company, including for the branches for which also books are centrally maintained at the head offi ce, so far as appears from our examination of the books.
(iii) The balance sheet, profi t and loss account and cash fl ow statement dealt with by this report are in agreement with the
books of account;
(iv) In our opinion, the balance sheet, profi t and loss account and cash fl ow statement dealt with by this report comply with
the accounting standards referred to in sub-section (3C) of section 211 of the Companies Act, 1956.
(v) On the basis of written representations received from the directors, as on March 31, 2012 and taken on record by the
Board of Directors, we report that none of the directors is disqualifi ed as on March 31, 2012 from being appointed as a
director of the Company in terms of clause (g) of sub-section (1) of section 274 of the Companies Act, 1956;
(vi) In our opinion and to the best of our information and according to the explanations given to us, the said accounts give the
information required by the Companies Act, 1956, in the manner so required and give a true and fair view in conformity
with the accounting principles generally accepted in India:
(a) In the case of the balance sheet, of the state of affairs of the Company as at March 31, 2012;
(b) In the case of the profi t and loss account, of the profi t of the Company for the year ended on that date; and
(c) In the case of the cash fl ow statement, of the cash fl ows for the year ended on that date
For PKF Sridhar & Santhanam Chartered Accountants Firm Registration No 003990S
Place: Chennai T V BalasubramanianDate: April 27, 2012 Partner Membership No.: 27251
Financial Statements
Annual Report 2011-201230
Annexure referred to in paragraph ‘3’ of the Auditors' Report to the members of Thinksoft Global Services Ltd on the accounts for the year ended March 31, 2012
(i)
(a) The Company has maintained proper records showing full particulars including quantitative details and situation of fi xed assets.
(b) The company has a regular program of verifying fi xed assets every year which, in our opinion, is reasonable having regard to the size of the company and nature of its assets. All Fixed assets have been physically verifi ed by the management along with Internal Auditors during the year. As informed, discrepancies noticed on such verifi cation were not material and have been properly dealt with in the books of account.
(c) There was no substantial disposal of fi xed assets during the year.
(ii) Having regard to the nature of the company’s business, clause (ii) of this order is not applicable
(iii)
(a) The company has not granted any loan to the parties covered under Sec 301 register.
(b) In the case of fully owned subsidiaries, expenses reimbursable accounts do not have any stipulation with regard to payment or other terms.
(c) According to the information and explanations given to us, the Company has, during the year, not taken any loans, secured or unsecured from companies, fi rms or other parties covered in the Register maintained under section 301 of the Companies Act, 1956.
(iv) In our opinion and according to the information and explanations given to us, there is an adequate internal control system commensurate with the size of the Company and the nature of its business with regard to the purchase of fi xed assets and sale of services. On the basis of our examination and according to the information and explanations given to us, there is no continuing failure to correct major weaknesses in the aforesaid internal control system.
(v)
(a) According to the information and explanations provided by the management, we are of the opinion that the particulars of contracts or arrangements referred to in section 301 of the Companies Act, 1956 that need to be entered into the register maintained under Section 301 have been so entered.
(b) In our opinion and according to the information and explanations given to us, transactions made in pursuance of such contracts or arrangements exceeding the value of fi ve lakh rupees have been made at prices which are reasonable having regard to the prevailing market prices at the relevant time.
(vi) The Company has not accepted any deposits from the public within the meaning of section 58A and 58AA of the Act and the rules made there under.
(vii) In our opinion, the company has an internal audit system commensurate with its size and the nature of its business
(viii) The Company is not required to maintain cost records prescribed by the Central Government under clause (d) of sub-section (1) of section 209 of the Act.
(ix)
(a) According to the information and explanations given to us and the records of the Company examined by us, the Company has generally been regular in depositing undisputed statutory dues including provident fund, income-tax, customs duty, service tax, cess and other material statutory dues applicable to it with the appropriate authorities. Statutory dues in respect of sales tax, excise duty and investor education and protection fund are not applicable to the company.
(b) According to the information and explanation given to us and the records of the Company examined by us, no undisputed amounts payable in respect of Provident Fund, Income Tax, Service Tax, Customs Duty and cess were in arrears, as at March 31, 2012 for a period of more than six months from the date they became payable.
(c) Dues relating to sales tax / excise duty / cess / Income tax / service tax, which have not been deposited on account of disputes with the related authorities, are stated in the table below:
Financial Statements

Annual Report 2011-2012 31
Name of the statute PeriodAmount
(in Rs. Lacs)Forum where the dispute is pending
Service tax FY 2004 to FY 2006 72.18Customs, Excise and Service Tax Appellate Tribunal (South Zone bench)
Income tax FY 2006 & FY 2009 462.38 CIT Appleals
(x) The Company has no accumulated losses at the end of the year and has not incurred cash losses in the current year and the immediately preceding fi nancial year.
(xi) Based on our audit procedure and as per the information and explanations given by the management, we are of the opinion that the company has not defaulted in repayment of dues to fi nancial institutions, banks or debenture holders.
(xii) The Company has not granted any loans and advances on the basis of security by way of pledge of shares, debentures and other securities, accordingly paragraph 4 (xii) of the Order is not applicable.
(xiii) The Company is not a chit fund / nidhi / mutual benefi t fund / society to which the provisions of special statute relating to chit fund etc., are applicable, accordingly paragraph 4 (xiii) of the Order is not applicable.
(xiv) As the Company is not dealing or trading in shares, securities, debentures and other investments, paragraph 4 (xiv) of the Order is not applicable.
(xv) According to the information and explanations given to us, the company has not given any guarantee during the year for loans taken by others from banks or fi nancial institutions.
(xvi) In our opinion and according to the information and explanations given to us, the Company has not taken any term loan during the year.
(xvii) According to the information and explanations given to us and on an overall examination of the balance sheet of the Company, we report that, during the year, short-term funds have not been used to fi nance long-term investments.
(xviii) The Company has not made any preferential allotment of shares to parties covered under Sec 301 register during the year.
(xix) The Company has not issued any debentures during the year.
(xx) The Company has raised money by way of public issue during fi nancial year 2010 and has disclosed the end use of the money raised by public issue vide Note No. 30 forming part of the fi nancial statements and the same has been verifi ed by us.
(xxi) Based upon the audit procedures performed and information and explanations given by the management, we report that no fraud on or by the Company has been noticed or reported during the year ended March 31, 2012.
For PKF Sridhar & SanthanamChartered AccountantsFirm Registration No 003990S
T V BalasubramanianPartnerMembership No.: 27251
Place: ChennaiDate: April 27, 2012
Financial Statements
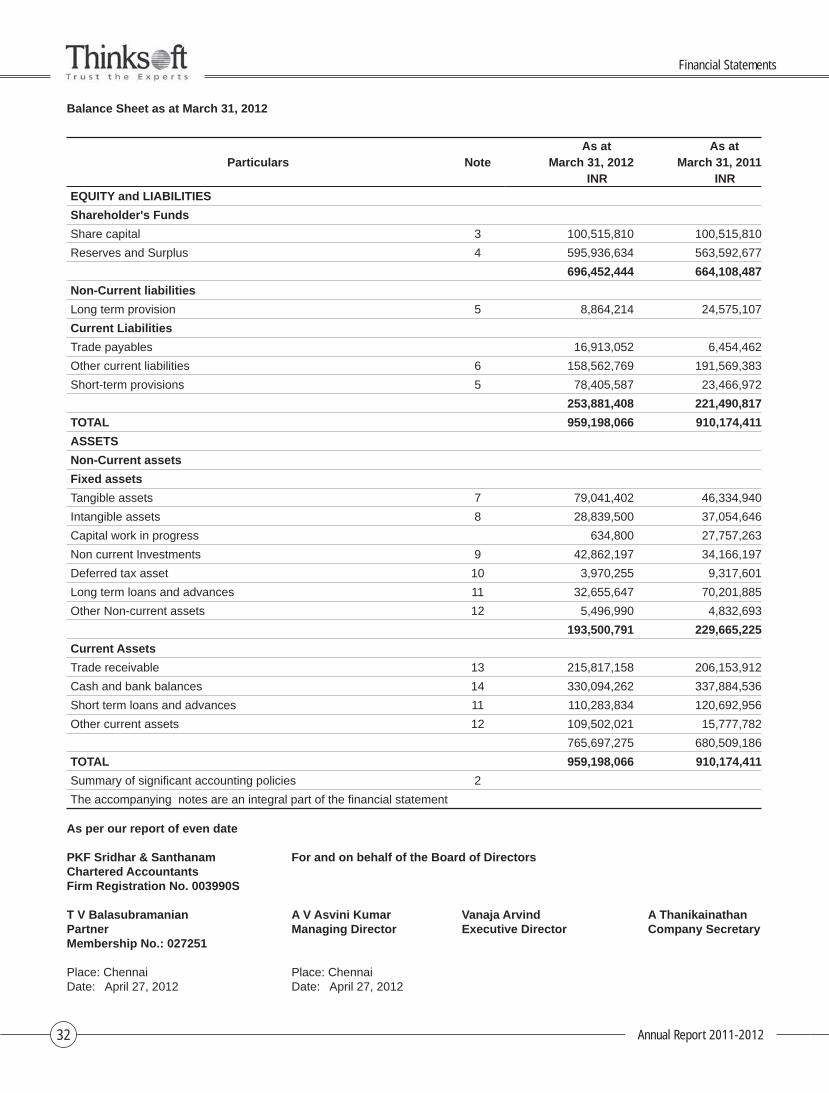
Annual Report 2011-201232
Balance Sheet as at March 31, 2012
Particulars NoteAs at As at
March 31, 2012 March 31, 2011INR INR
EQUITY and LIABILITIES
Shareholder's Funds
Share capital 3 100,515,810 100,515,810
Reserves and Surplus 4 595,936,634 563,592,677
696,452,444 664,108,487
Non-Current liabilities
Long term provision 5 8,864,214 24,575,107
Current Liabilities
Trade payables 16,913,052 6,454,462
Other current liabilities 6 158,562,769 191,569,383
Short-term provisions 5 78,405,587 23,466,972
253,881,408 221,490,817
TOTAL 959,198,066 910,174,411
ASSETS
Non-Current assets
Fixed assets
Tangible assets 7 79,041,402 46,334,940
Intangible assets 8 28,839,500 37,054,646
Capital work in progress 634,800 27,757,263
Non current Investments 9 42,862,197 34,166,197
Deferred tax asset 10 3,970,255 9,317,601
Long term loans and advances 11 32,655,647 70,201,885
Other Non-current assets 12 5,496,990 4,832,693
193,500,791 229,665,225
Current Assets
Trade receivable 13 215,817,158 206,153,912
Cash and bank balances 14 330,094,262 337,884,536
Short term loans and advances 11 110,283,834 120,692,956
Other current assets 12 109,502,021 15,777,782
765,697,275 680,509,186
TOTAL 959,198,066 910,174,411
Summary of signifi cant accounting policies 2
The accompanying notes are an integral part of the fi nancial statement
As per our report of even date
PKF Sridhar & Santhanam For and on behalf of the Board of DirectorsChartered AccountantsFirm Registration No. 003990S
T V Balasubramanian A V Asvini Kumar Vanaja Arvind A ThanikainathanPartner Managing Director Executive Director Company SecretaryMembership No.: 027251
Place: Chennai Place: ChennaiDate: April 27, 2012 Date: April 27, 2012
Financial Statements
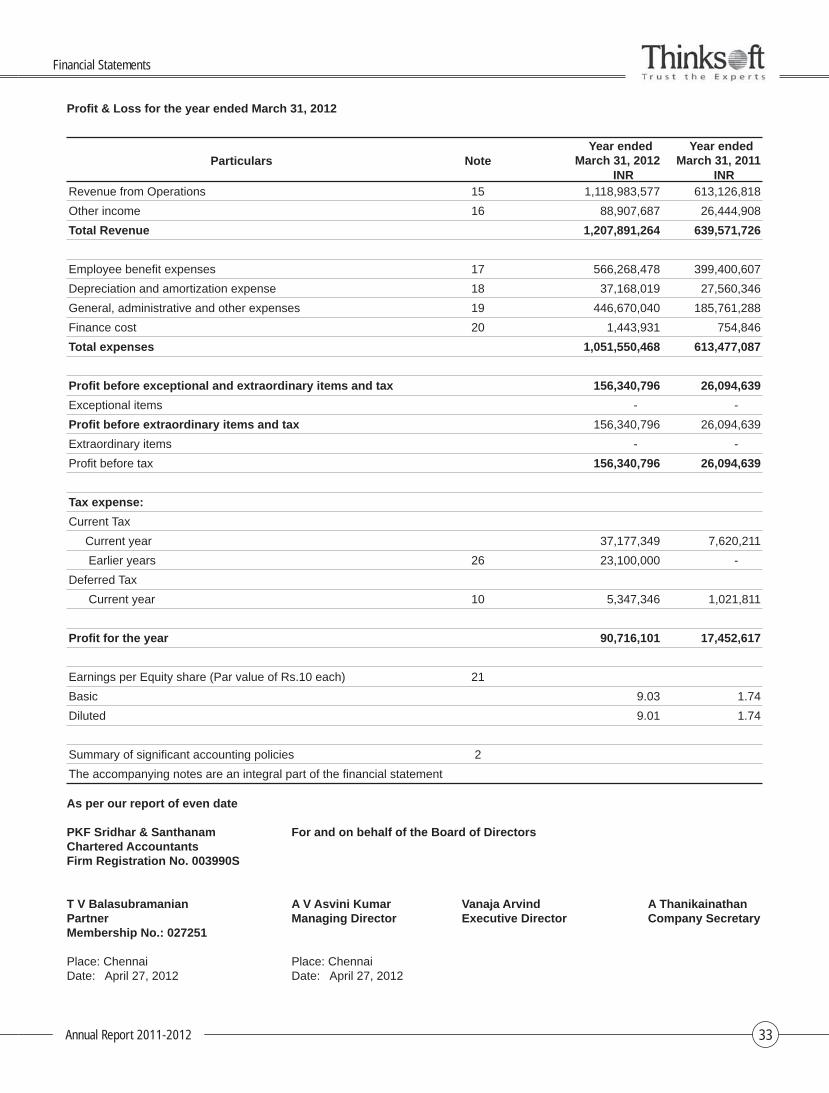
Annual Report 2011-2012 33
Profi t & Loss for the year ended March 31, 2012
Particulars NoteYear ended
March 31, 2012Year ended
March 31, 2011INR INR
Revenue from Operations 15 1,118,983,577 613,126,818
Other income 16 88,907,687 26,444,908
Total Revenue 1,207,891,264 639,571,726
Employee benefi t expenses 17 566,268,478 399,400,607
Depreciation and amortization expense 18 37,168,019 27,560,346
General, administrative and other expenses 19 446,670,040 185,761,288
Finance cost 20 1,443,931 754,846
Total expenses 1,051,550,468 613,477,087
Profi t before exceptional and extraordinary items and tax 156,340,796 26,094,639
Exceptional items - -
Profi t before extraordinary items and tax 156,340,796 26,094,639
Extraordinary items - -
Profi t before tax 156,340,796 26,094,639
Tax expense:
Current Tax
Current year 37,177,349 7,620,211
Earlier years 26 23,100,000 -
Deferred Tax
Current year 10 5,347,346 1,021,811
Profi t for the year 90,716,101 17,452,617
Earnings per Equity share (Par value of Rs.10 each) 21
Basic 9.03 1.74
Diluted 9.01 1.74
Summary of signifi cant accounting policies 2
The accompanying notes are an integral part of the fi nancial statement
As per our report of even date
PKF Sridhar & Santhanam For and on behalf of the Board of DirectorsChartered AccountantsFirm Registration No. 003990S
T V Balasubramanian A V Asvini Kumar Vanaja Arvind A ThanikainathanPartner Managing Director Executive Director Company SecretaryMembership No.: 027251
Place: Chennai Place: ChennaiDate: April 27, 2012 Date: April 27, 2012
Financial Statements
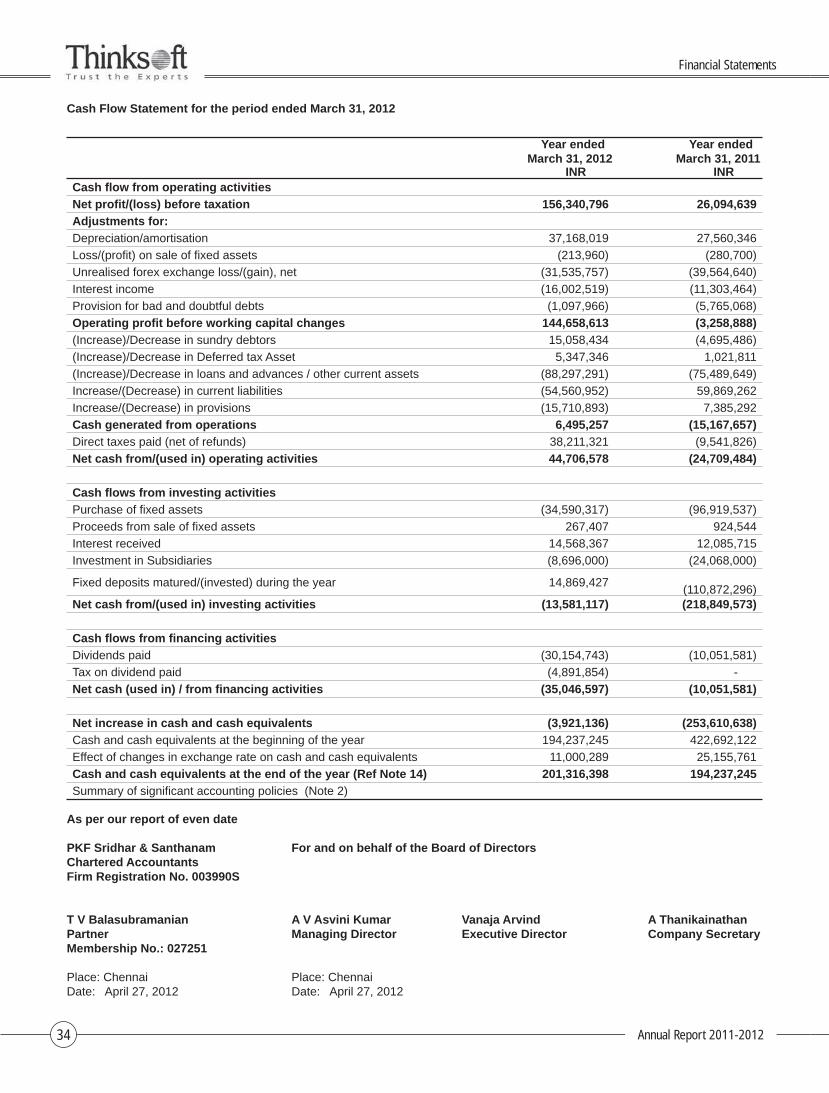
Annual Report 2011-201234
Cash Flow Statement for the period ended March 31, 2012
Year ended March 31, 2012
Year ended March 31, 2011
INR INRCash fl ow from operating activities
Net profi t/(loss) before taxation 156,340,796 26,094,639
Adjustments for:
Depreciation/amortisation 37,168,019 27,560,346
Loss/(profi t) on sale of fi xed assets (213,960) (280,700)
Unrealised forex exchange loss/(gain), net (31,535,757) (39,564,640)
Interest income (16,002,519) (11,303,464)
Provision for bad and doubtful debts (1,097,966) (5,765,068)
Operating profi t before working capital changes 144,658,613 (3,258,888)
(Increase)/Decrease in sundry debtors 15,058,434 (4,695,486)
(Increase)/Decrease in Deferred tax Asset 5,347,346 1,021,811
(Increase)/Decrease in loans and advances / other current assets (88,297,291) (75,489,649)
Increase/(Decrease) in current liabilities (54,560,952) 59,869,262
Increase/(Decrease) in provisions (15,710,893) 7,385,292
Cash generated from operations 6,495,257 (15,167,657)
Direct taxes paid (net of refunds) 38,211,321 (9,541,826)
Net cash from/(used in) operating activities 44,706,578 (24,709,484)
Cash fl ows from investing activities
Purchase of fi xed assets (34,590,317) (96,919,537)
Proceeds from sale of fi xed assets 267,407 924,544
Interest received 14,568,367 12,085,715
Investment in Subsidiaries (8,696,000) (24,068,000)
Fixed deposits matured/(invested) during the year 14,869,427 (110,872,296)
Net cash from/(used in) investing activities (13,581,117) (218,849,573)
Cash fl ows from fi nancing activities
Dividends paid (30,154,743) (10,051,581)
Tax on dividend paid (4,891,854) -
Net cash (used in) / from fi nancing activities (35,046,597) (10,051,581)
Net increase in cash and cash equivalents (3,921,136) (253,610,638)
Cash and cash equivalents at the beginning of the year 194,237,245 422,692,122
Effect of changes in exchange rate on cash and cash equivalents 11,000,289 25,155,761
Cash and cash equivalents at the end of the year (Ref Note 14) 201,316,398 194,237,245
Summary of signifi cant accounting policies (Note 2)
As per our report of even date
PKF Sridhar & Santhanam For and on behalf of the Board of DirectorsChartered AccountantsFirm Registration No. 003990S
T V Balasubramanian A V Asvini Kumar Vanaja Arvind A ThanikainathanPartner Managing Director Executive Director Company SecretaryMembership No.: 027251
Place: Chennai Place: ChennaiDate: April 27, 2012 Date: April 27, 2012
Financial Statements
Annual Report 2011-2012 35
Notes to the Financial Statements for the year ended March 31, 2012
Note 1
i. Background
Thinksoft Global Services Limited (“Thinksoft” or “the Company”) was incorporated on June 8, 1998 under the Companies Act, 1956 as a private limited company. The Company has been converted into a public limited company with effect from 19th August 2008. The Company had made an Initial Public Offering (IPO) on 24th September 2009 (issue open date) as approved by the members in the Extra Ordinary General Meeting held on 17th September 2008. The Shares under IPO were allotted on 14th October 2009 and the Company shares have been listed in National Stock exchange and Bombay Stock exchange on 26th October 2009.
The Company is an India based software service provider primarily delivering software validation and verifi cation services to the banking and fi nancial services industry worldwide. The Company has invested in fi ve wholly owned subsidaries in Singapore, USA, Germany, UK and UAE for market development in the respective regions.
The Company has a cash credit facility with Lakshmi Vilas Bank, Chennai, which is secured by hypothecation of fi xed assets, book debts of the Company both present and future and also by personal guarantee of two Directors of the Company.
ii. Basis of preparation of fi nancial statements
The fi nancial statements of the company have been prepared and presented under historical cost convention on the accrual basis of accounting as a going concern and materially comply with the Companies (Accounting Standards) Rules, 2006 issued by the Central Government, in consultation with National Advisory Committee on Accounting Standards and the relevant provisions of the Companies Act, 1956, to the extent applicable. The accounting policies applied by the Company are consistent with those used in the previous year.
iii. This Balance Sheet and Profi t & Loss account include fi gures pertaining to Head offi ce and Branches/Places of Business located at Madras Export Processing Zone, Chennai, United Kingdom, Australia, Belgium, Hong Kong, Velankani Technology Park, Bengaluru, India,Cyprus and Malaysia.
Note 2 Summary of signifi cant accounting policies:
i. Use of estimates
The preparation of fi nancial statements in conformity with generally accepted accounting principles in India requires the management to make estimates and assumptions that affect the reported amounts of revenues, expenses, assets and liabilities at the date of the fi nancial statement and notes thereto and the reported amounts of revenues and expenses during the accounting period. Any revision to the accounting estimates is recognized prospectively in the current and future periods. Examples of such estimates include provision for doubtful debts, economic useful lives of fi xed assets, etc. Actual results could differ from those estimates.
ii. Fixed assets and depreciation
Tangible Fixed assets
Fixed assets, tangible are stated at cost less accumulated depreciation and impairment losses if any. Cost comprises the purchase price and any attributable cost of bringing the asset to its working condition for its intended use. Borrowing costs relating to acquisition of qualifying fi xed assets which takes substantial period of time to get ready for its intended use are also included to the extent they relate to the period till such assets are ready to be put to use.
Depreciation
Depreciation is provided using the Straight Line Method as per the useful lives of the assets estimated by the management, or at the rates prescribed under schedule XIV of the companies Act, 1956 whichever is higher. The rates currently applied as follows:
Asset description Percentage
Building 5%
Plant, machinery and equipment 33.33%
Computer equipment 33.33%
Furniture and fi ttings 33.33%
Offi ce equipment 33.33%
Vehicles 25%
Temporary partitions 100%
Leasehold Rights & Improvements Tenure of lease period or 10 years whichever is less
Fixed assets individually costing Rs 5,000 or less are entirely depreciated in the year of acquisition.
Notes to the Financial Statements
Annual Report 2011-201236
Capital work-in-progress includes the cost of fi xed assets that are not ready for their intended use and advances paid to acquire the fi xed assets.
iii. Intangible assets
Intangible assets acquired separately are measured on initial recognition at cost. Following initial recognition, intangible assets are carried at cost less accumulated amortization and accumulated impairment losses, if any.
Intangible assets are amortized on a straight line basis over the estimated useful economic life. The amortization period and amortization method are reviewed at least at each fi nancial year end. If the expected useful life of the asset is signifi cantly different from previous estimates, the amortization period is changed accordingly. Gain or losses arising from derecognition of an intangible asset are measured as the difference between the net disposal proceeds and the carrying amount of the asset and are recognized in the statement of Profi t and loss, when the asset is derecognized.
A summary of amortization policies applied to the company's intangible assets is as below:
Asset description Percentage
Intangible assets – Computer software 33.33%
Intangible assets – Software tools 20%
iv. Impairment
a. The carrying amounts of assets are reviewed at each balance sheet date to see if there is any indication of impairment based on internal/external factors. An impairment loss is recognized wherever the carrying amount of an asset exceeds its recoverable amount. The recoverable amount is the greater of the asset’s net selling price and value in use. In assessing value in use, the estimated future cash fl ows are discounted to their present value at the weighted average cost of capital.
b. After impairment, depreciation is provided on the revised carrying amount of the asset over its remaining useful life.
v. Investment
Investments that are readily realizable and intended to be held for not more than a year are classifi ed as current investments. All other investments are classifi ed as long-term investments. Current investments are carried at lower of cost and fair value determined on an individual investment basis. Long-term investments are carried at cost. However, any decline, other than temporary, in the value of the investments is charged to the profi t and loss account.
vi. Revenue recognition
Software service income
a. Revenue from software testing on software testing and allied services comprises revenue from time and material contracts and fi xed price contracts.
b. Revenue from time-and-materials contracts is recognized based on time/efforts spent on software tested and billed to clients as per the terms of specifi c contracts.
c. On fi xed-price contracts, revenue is recognized on the proportionate completion method on the basis of the work completed.
d. Revenue from software testing includes reimbursement of expenses billed as per the terms of contracts.
Interest income
Interest on deployment of surplus funds is recognized using the time-proportion method.
Government grant
Government grant is recognized upon confi rmation of the entitlement of the grant.
vii. Retirement and other employee benefi ts
a. Retirement benefi ts in the form of Provident Fund / Social Security payments is defi ned contribution schemes and the contributions are charged to the Profi t and Loss Account of the year when the contributions are made to the concerned authorities. The Company has no further obligations under the plan beyond its periodic contributions.
b. Gratuity liability is a defi ned benefi t obligation and is provided for on the basis of an actuarial valuation made at the end of each fi nancial year under the projected unit credit method. Actuarial Gains/Losses comprise experience adjustments and the effect of changes in actuarial assumptions and are recognized immediately in Profi t & Loss Account as Income/Expense.
c. The company does not allow leave encashment on retirement. However, appropriate provision has been made based on estimates for the accrued and unaveiled leave entitlements which are short-term in nature.
Notes to the Financial Statements

Annual Report 2011-2012 37
viii. Taxation
Tax expense comprises current tax, deferred tax charge or credit and Minimum Alternate Tax credit. Current income tax is measured at the amount expected to be paid to the tax authorities in accordance with the relevant tax laws of each country. Deferred income taxes refl ect the impact of current year timing differences between taxable income and accounting income for the year and reversal of timing differences of earlier years.
Deferred tax is measured based on the tax rates and the tax laws enacted or substantively enacted at the balance sheet date. Deferred tax assets are recognised only to the extent that there is reasonable certainty that suffi cient future taxable income will be available against which such deferred tax assets can be realised. In situations where the company has unabsorbed depreciation or carry forward tax losses, deferred tax assets are recognised only if there is virtual certainty supported by convincing evidence that such deferred tax assets can be realised against future taxable profi ts.
The company has got two 100% Export Oriented Unit (“EOU”) registered with the Software Technology Parks of India (“STPI”) one in Chennai and another in Bengaluru. The Company has operations in Special Economic Zone (SEZ) – MEPZ Tambaram, also from the fi nancial year 2009-10. The Company enjoyed tax holiday for Export earnings relating to its EOU in Chennai under Section 10A of the Income Tax Act,1961 till the fi nancial year 2009-10. Such tax holiday is available for the fi nancial year 2010-11 also in respect of export earnings relating to its EOU in Bengaluru. Income from MEPZ’s is fully tax exempt for the fi rst fi ve years, 50% exempt for the next fi ve years and 50% exempt for another fi ve years subject to fulfi lling certain conditions.
MAT Credit is measured at the amounts of Minimum Alternative Tax payable for the year, which is adjustable against regular tax payable in subsequent years and is recognized to the extent considered probable of such adjustment.
ix. Earnings per share
Basic earnings per share are calculated by dividing the net profi t or loss for the period attributable to equity shareholders by the weighted average number of equity shares outstanding during the period.
For the purpose of calculating diluted earnings per share, the net profi t or loss for the period attributable to equity shareholders and the weighted average number of shares outstanding during the period are adjusted for the effects of all dilutive potential equity shares.
x. Foreign currency transactions and translations
a. Initial recognition
Foreign currency transactions are recorded in the reporting currency, by applying to the foreign currency amount the exchange rate between the reporting currency and the foreign currency at the date of the transaction. Income and expenditure transactions of the foreign operations are recognized at the rate on transaction date / average rate applicable for the year.
b. Conversion
Foreign currency monetary items are reported using the closing rate. Non-monetary items which are carried in terms of historical cost denominated in a foreign currency are reported using the exchange rate at the date of the transaction.
c. Exchange differences
Exchange differences arising on the settlement of monetary items at rates different from those at which they were initially recorded during the year, or reported in previous fi nancial statements, are recognised as income or as expenses in the year in which they arise. Exchange differences on account of conversion of foreign operations are also recognized as income or as expenses in the year in which they arise.
d. Forward contracts in foreign currency
The Company uses, to a limited extent, foreign exchange forward contracts to hedge its exposure to movements in foreign exchange rates. The company does not use the foreign currency forward contracts for trading or speculation purposes. Realized/unrealized gains and losses on forward contracts are accounted in the profi t and loss account for the period. Premium/Discount on forward contracts are accounted over the contract period.
e. Transalation of integral and non-integral foreign operation
The company classifi es all its foreign operation as either "integral foreign operations. The fi nancial statements of an integral foreign operation are translated as if the transactions of the foreign operation have been those of the company itself.
xi. Provisions
A provision is recognised when an enterprise has a present obligation as a result of past event and it is probable that an outfl ow of resources will be required to settle the obligation, in respect of which a reliable estimate can be made. Provisions are not discounted to its present value and are determined based on best estimate required to settle the obligation at the balance sheet date. These are reviewed at each balance sheet date and adjusted to refl ect the current best estimates.
Notes to the Financial Statements
Annual Report 2011-201238
xii. Leases
Where the company is lessee
Leases where the lessor effectively retains substantially all the risks and benefi ts of ownership of the leased term, are classifi ed as operating leases. Operating lease payments are recognized as an expense in the Profi t and Loss account as per the terms of the agreements over the lease term.
Where the company is lessor
Operating lease receipts are recognized as Other Income in the Profi t and Loss account as per the terms of the agreements over the sub lease period
xiii. Employee stock compensation cost
Measurement and disclosure of the employee share-based payment plans is done in accordance with the Guidance Note on Accounting for Employee Share-based Payments, issued by the Institute of Chartered Accountants of India. The Company measures compensation cost relating to employee stock options using the intrinsic value method. Compensation expense is amortized over the vesting period of the option on a straight line basis.
xiv. Segment information
Business segments
The group’s operations predominantly relate to software validation and verifi cation services relating to banking and fi nancial services industry and, accordingly, this is the only primary reportable segment.
Geographical segments
The segmental information is provided on geographical basis classifi ed as India and Rest of the World.
xv. Cash fl ows
Cash fl ows are reported using indirect method, whereby net profi t before tax is adjusted for the effects of transactions of a non-cash nature and any deferrals or accruals of past or future cash receipts or payments. The cash fl ows from regular revenue generating, investing and fi nancing activities are segregated.
Cash and cash equivalents: Cash and cash equivalents, in the statement of cash fl ow, comprise cash at bank and in hand and fi xed deposits with original maturity of maximum 90 days.
xvi. Contingent liabilities
A contingent liability is a possible obligation that arises due to past events whose existence will be confi rmed by the occurrence or non-occurrence of one or more uncertain future events beyond the control of the company or a present obligation that is not recognized because it is not probable that an outfl ow of resources will be required to settle the obligation. A contingent liability also arises in extremely rare cases where there is a liability that cannot be recognized because it cannot be measured reliably. The company does not recognize a contingent liability but discloses its existence in the fi nancial statements
Note 3 Share capital
March 31, 2012 March 31, 2011Authorised shares INR INR12,000,000 equity shares (31-Mar-2011: 12,000,000) of Rs.10 each 120,000,000 120,000,000
Issued, subscribed and fully paid up shares10,051,581 equity shares (31-Mar-2011: 10,051,581) of Rs.10 each 100,515,810 100,515,810
a. Reconciliation of the shares outstanding at the beginning and at the end of the reporting periodEquity shares
March 31, 2012 March 31, 2011Number INR Number INR
At the beginning of the period 10,051,581 100,515,810 10,051,581 100,515,810 Issued during the periodOutstanding at the end of the period 10,051,581 100,515,810 10,051,581 100,515,810
b. Terms/rights attached to equity sharesThe company has only one class of equity shares having a par value of Rs.10 per share. Each holder of equity share is entitled to one vote per share. The company declares and pays dividend in Indian rupees. The dividend proposed by Board of Directors is subject to approval of the shareholders in the ensuing Annual General Meeting
c.Aggregate number of bonus shares issued, shares issued for consideration other than cash and shares bought back during the period of fi ve years immediately preceding the reporting date:
March 31, 2012 March 31, 2011Equity shares alloted as fully paid bonus shares by capitalization of securities premium 870,156 870,156
Notes to the Financial Statements
Annual Report 2011-2012 39
d. Details of shareholders holding more than 5% shares in the companyMarch 31, 2012 March 31, 2012
Number % Holding Number % HoldingA V Asvini Kumar 3,642,777 36.24% 3,642,777 36.24%Vanaja Arvind 1,097,762 10.92% 1,050,662 10.45%
As per records of the company, including its register of shareholders/members and other declarations received from shareholders regarding benefi cial interest, the above shareholding represents both legal and benefi cial ownership of shares
e Shares reserved for issue under optionsFor details of shares reserved for issue under the employee stock option (ESOP) plan of the company, please refer Note 23
Note 4 Reserves and surplusMarch 31, 2012 March 31, 2011
Securities premium account INR INRClosing balance A 148,759,605 148,759,605
General ReserveBalance at the beginning of the year 30,071,695 30,071,695 Add: Additions during the year 9,100,000 - Balance at the end of the year B 39,171,695 30,071,695
Surplus/(Defecit) in the statement of profi t and LossBalance as per last fi nancial statements 384,761,377 379,029,808 Profi t for the year 90,716,103 17,452,617 Less: AppropriationsProposed fi nal / Intriem equity dividend (50,257,905) (10,051,581)Tax on proposed fi nal / Interim Equity Dividend (8,114,241) (1,669,467)Transfer to general reserve (9,100,000) - Total appropriations (67,472,146) (11,721,048)Net surplus in statement of Profi t and Loss C 408,005,334 384,761,377
Total Reserves and Surplus (A+B+C) 595,936,634 563,592,677
Note 5 ProvisionsLong term Short term
March 31, 2012 March 31, 2011 March 31, 2012 March 31, 2011INR INR INR INR
Provision for employee benefi tsProvision for gratuity 8,864,214 24,575,107 - -
8,864,214 24,575,107 - -
Other provisionsProposed equity dividend - - 30,154,743 10,051,581 Provision for tax on proposed equity dividend - - 4,891,854 1,669,467 Provision for taxation (Net) - - 43,358,990 11,745,924
- - 78,405,587 23,466,972
Total 8,864,214 24,575,107 78,405,587 23,466,972
Note 6 Other current liabilitiesMarch 31, 2012 March 31, 2011
INR INROther liabilitiesOutstanding Liabilities 72,177,125 58,839,894 Unpaid application money due for refund 86,250 93,000 Unpaid dividend 559,523 91,803 Advance received from customers/others 3,620,391 807,504 Inter-company payables to subsidiaries 32,270,760 75,223,125 Employee benefi ts payable 31,275,847 44,740,809 Statutory dues 18,572,873 11,773,248 Total 158,562,769 191,569,383
There are no amounts due for payment to the Investor Education and Protection Fund under Section 205C of the Companies Act, 1956 as at the year end
Notes to the Financial Statements
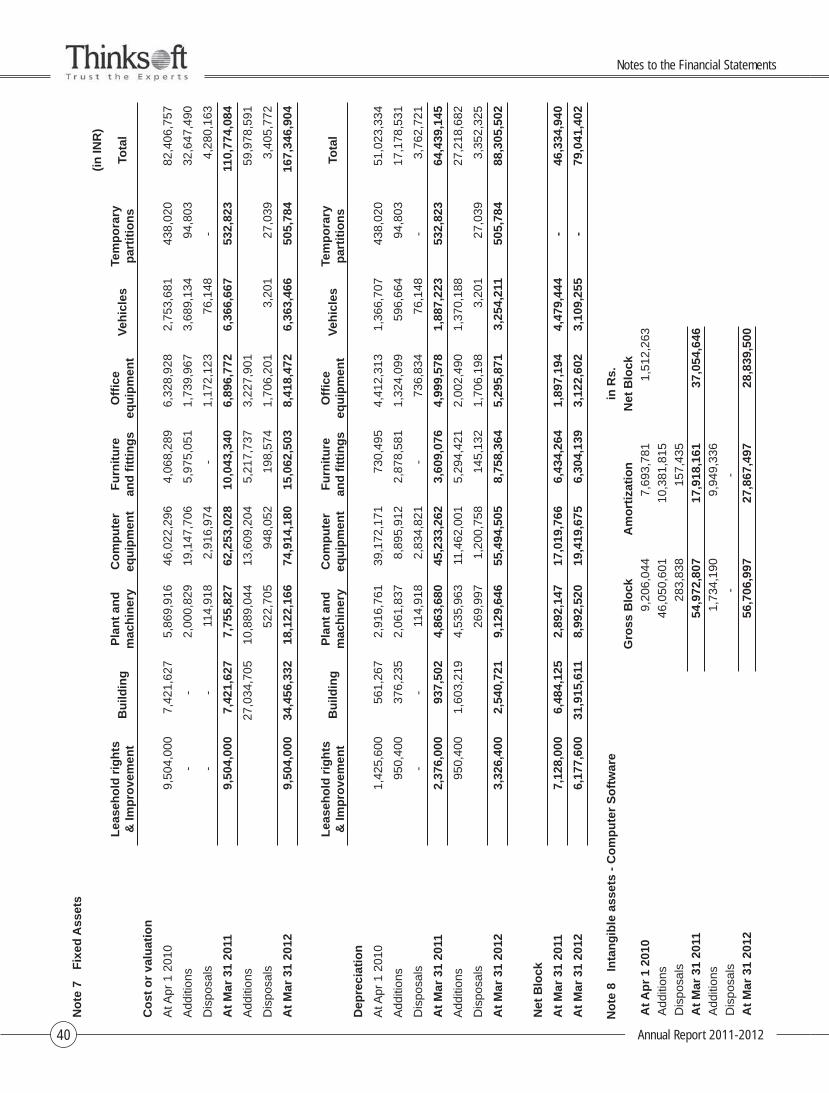
Annual Report 2011-201240
No
te 7
F
ixed
Ass
ets
(in
INR
)
Lea
seh
old
rig
hts
&
Imp
rove
men
tB
uild
ing
Pla
nt
and
m
ach
iner
yC
om
pu
ter
equ
ipm
ent
Fu
rnit
ure
an
d fi
tti
ng
sO
ffi c
e eq
uip
men
tV
ehic
les
Tem
po
rary
p
arti
tio
ns
Tota
l
Co
st o
r va
luat
ion
At A
pr 1
201
09,
504,
000
7,42
1,62
75,
869,
916
46,0
22,2
964,
068,
289
6,32
8,92
82,
753,
681
438,
020
82,4
06,7
57
Add
ition
s-
-2,
000,
829
19,1
47,7
065,
975,
051
1,73
9,96
73,
689,
134
94,8
0332
,647
,490
Dis
posa
ls-
-11
4,91
82,
916,
974
-1,
172,
123
76,1
48-
4,28
0,16
3
At
Mar
31
2011
9,50
4,00
07,
421,
627
7,75
5,82
762
,253
,028
10,0
43,3
406,
896,
772
6,36
6,66
753
2,82
311
0,77
4,08
4
Add
ition
s27
,034
,705
10,8
89,0
4413
,609
,204
5,21
7,73
73,
227,
901
59,9
78,5
91
Dis
posa
ls52
2,70
594
8,05
219
8,57
41,
706,
201
3,20
127
,039
3,40
5,77
2
At
Mar
31
2012
9,50
4,00
034
,456
,332
18,1
22,1
6674
,914
,180
15,0
62,5
038,
418,
472
6,36
3,46
650
5,78
416
7,34
6,90
4
Lea
seh
old
rig
hts
&
Imp
rove
men
tB
uild
ing
Pla
nt
and
m
ach
iner
yC
om
pu
ter
equ
ipm
ent
Fu
rnit
ure
an
d fi
tti
ng
sO
ffi c
e eq
uip
men
tV
ehic
les
Tem
po
rary
p
arti
tio
ns
Tota
l
Dep
reci
atio
n
At A
pr 1
201
01,
425,
600
561,
267
2,91
6,76
139
,172
,171
730,
495
4,41
2,31
31,
366,
707
438,
020
51,0
23,3
34
Add
ition
s95
0,40
037
6,23
52,
061,
837
8,89
5,91
22,
878,
581
1,32
4,09
959
6,66
494
,803
17,1
78,5
31
Dis
posa
ls-
-11
4,91
82,
834,
821
-73
6,83
476
,148
-3,
762,
721
At
Mar
31
2011
2,37
6,00
093
7,50
24,
863,
680
45,2
33,2
623,
609,
076
4,99
9,57
81,
887,
223
532,
823
64,4
39,1
45
Add
ition
s95
0,40
01,
603,
219
4,53
5,96
311
,462
,001
5,29
4,42
12,
002,
490
1,37
0,18
827
,218
,682
Dis
posa
ls26
9,99
71,
200,
758
145,
132
1,70
6,19
83,
201
27,0
393,
352,
325
At
Mar
31
2012
3,32
6,40
02,
540,
721
9,12
9,64
655
,494
,505
8,75
8,36
45,
295,
871
3,25
4,21
150
5,78
488
,305
,502
Net
Blo
ck
At
Mar
31
2011
7,12
8,00
06,
484,
125
2,89
2,14
717
,019
,766
6,43
4,26
41,
897,
194
4,47
9,44
4-
46,3
34,9
40
At
Mar
31
2012
6,17
7,60
031
,915
,611
8,99
2,52
019
,419
,675
6,30
4,13
93,
122,
602
3,10
9,25
5-
79,0
41,4
02
No
te 8
In
tan
gib
le a
sset
s -
Co
mp
ute
r S
oft
war
ein
Rs.
Gro
ss B
lock
Am
ort
izat
ion
Net
Blo
ck
At
Ap
r 1
2010
9,20
6,04
4
7,6
93,7
81
1
,512
,263
Add
ition
s
46,
050,
601
10,
381,
815
Dis
posa
ls
283
,838
1
57,4
35
At
Mar
31
2011
5
4,97
2,80
7 1
7,91
8,16
1 3
7,05
4,64
6
Add
ition
s
1,
734,
190
9
,949
,336
Dis
posa
ls
-
-
At
Mar
31
2012
5
6,70
6,99
7 2
7,86
7,49
7 2
8,83
9,50
0
Notes to the Financial Statements
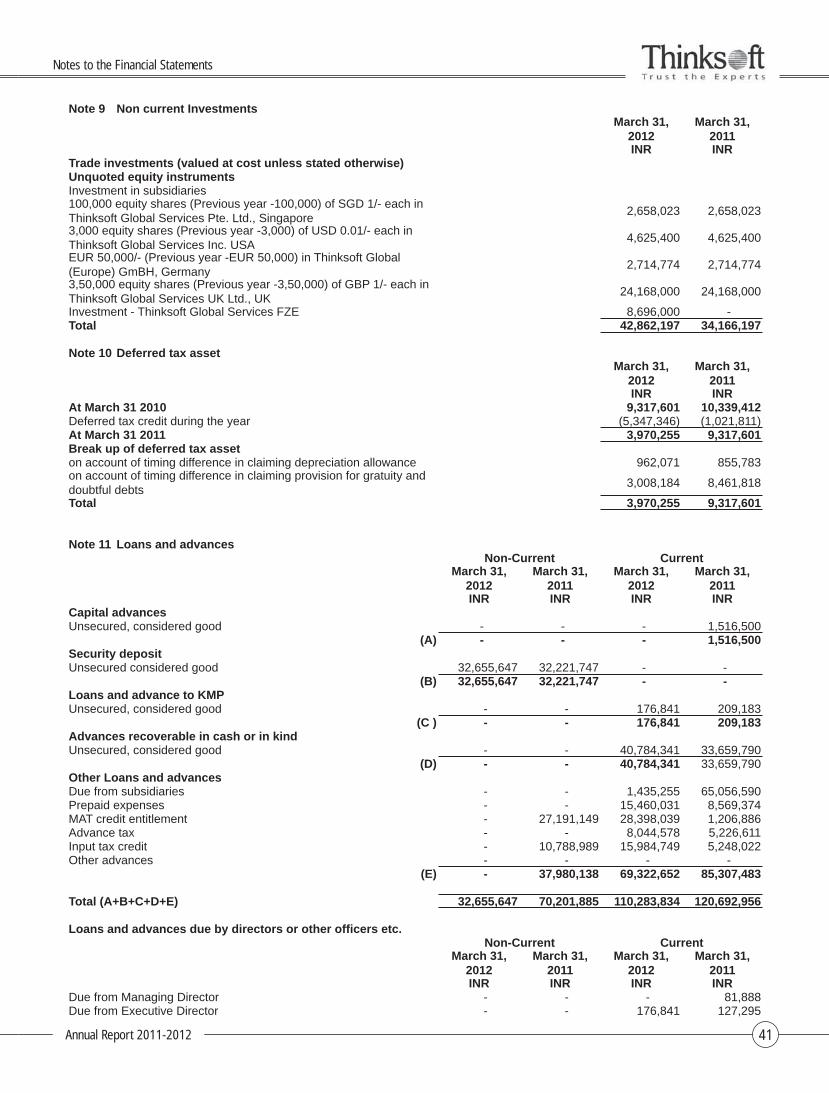
Annual Report 2011-2012 41
Note 9 Non current InvestmentsMarch 31,
2012March 31,
2011INR INR
Trade investments (valued at cost unless stated otherwise)Unquoted equity instrumentsInvestment in subsidiaries100,000 equity shares (Previous year -100,000) of SGD 1/- each in Thinksoft Global Services Pte. Ltd., Singapore
2,658,023 2,658,023
3,000 equity shares (Previous year -3,000) of USD 0.01/- each in Thinksoft Global Services Inc. USA
4,625,400 4,625,400
EUR 50,000/- (Previous year -EUR 50,000) in Thinksoft Global (Europe) GmBH, Germany
2,714,774 2,714,774
3,50,000 equity shares (Previous year -3,50,000) of GBP 1/- each in Thinksoft Global Services UK Ltd., UK
24,168,000 24,168,000
Investment - Thinksoft Global Services FZE 8,696,000 - Total 42,862,197 34,166,197
Note 10 Deferred tax assetMarch 31,
2012March 31,
2011INR INR
At March 31 2010 9,317,601 10,339,412Deferred tax credit during the year (5,347,346) (1,021,811)At March 31 2011 3,970,255 9,317,601 Break up of deferred tax asseton account of timing difference in claiming depreciation allowance 962,071 855,783 on account of timing difference in claiming provision for gratuity and doubtful debts
3,008,184 8,461,818
Total 3,970,255 9,317,601
Note 11 Loans and advancesNon-Current Current
March 31, 2012
March 31, 2011
March 31, 2012
March 31, 2011
INR INR INR INRCapital advancesUnsecured, considered good - - - 1,516,500
(A) - - - 1,516,500 Security depositUnsecured considered good 32,655,647 32,221,747 - -
(B) 32,655,647 32,221,747 - - Loans and advance to KMPUnsecured, considered good - - 176,841 209,183
(C ) - - 176,841 209,183 Advances recoverable in cash or in kindUnsecured, considered good - - 40,784,341 33,659,790
(D) - - 40,784,341 33,659,790 Other Loans and advancesDue from subsidiaries - - 1,435,255 65,056,590 Prepaid expenses - - 15,460,031 8,569,374 MAT credit entitlement - 27,191,149 28,398,039 1,206,886 Advance tax - - 8,044,578 5,226,611 Input tax credit - 10,788,989 15,984,749 5,248,022 Other advances - - - -
(E) - 37,980,138 69,322,652 85,307,483
Total (A+B+C+D+E) 32,655,647 70,201,885 110,283,834 120,692,956
Loans and advances due by directors or other offi cers etc.Non-Current Current
March 31, 2012
March 31, 2011
March 31, 2012
March 31, 2011
INR INR INR INRDue from Managing Director - - - 81,888 Due from Executive Director - - 176,841 127,295
Notes to the Financial Statements
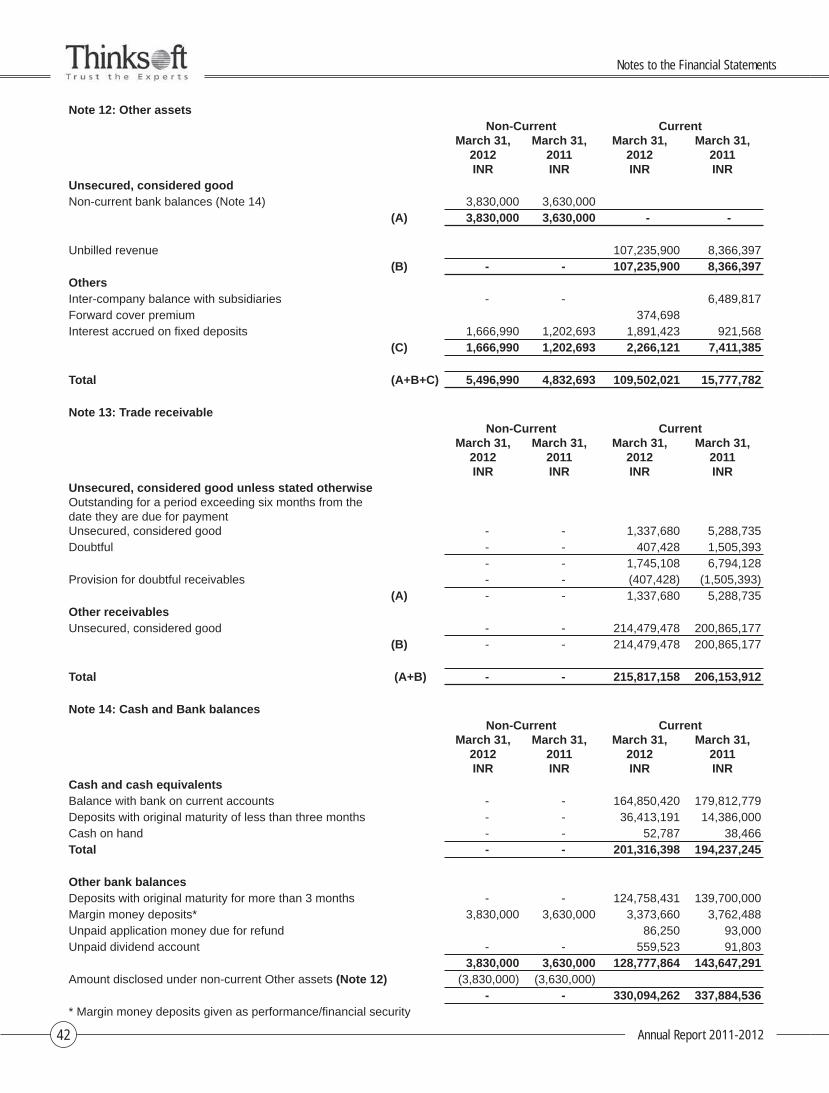
Annual Report 2011-201242
Note 12: Other assetsNon-Current Current
March 31, 2012
March 31, 2011
March 31, 2012
March 31, 2011
INR INR INR INRUnsecured, considered goodNon-current bank balances (Note 14) 3,830,000 3,630,000
(A) 3,830,000 3,630,000 - -
Unbilled revenue 107,235,900 8,366,397(B) - - 107,235,900 8,366,397
OthersInter-company balance with subsidiaries - - 6,489,817Forward cover premium 374,698Interest accrued on fi xed deposits 1,666,990 1,202,693 1,891,423 921,568
(C) 1,666,990 1,202,693 2,266,121 7,411,385
Total (A+B+C) 5,496,990 4,832,693 109,502,021 15,777,782
Note 13: Trade receivableNon-Current Current
March 31, 2012
March 31, 2011
March 31, 2012
March 31, 2011
INR INR INR INRUnsecured, considered good unless stated otherwiseOutstanding for a period exceeding six months from the date they are due for paymentUnsecured, considered good - - 1,337,680 5,288,735Doubtful - - 407,428 1,505,393
- - 1,745,108 6,794,128Provision for doubtful receivables - - (407,428) (1,505,393)
(A) - - 1,337,680 5,288,735Other receivablesUnsecured, considered good - - 214,479,478 200,865,177
(B) - - 214,479,478 200,865,177
Total (A+B) - - 215,817,158 206,153,912
Note 14: Cash and Bank balancesNon-Current Current
March 31, 2012
March 31, 2011
March 31, 2012
March 31, 2011
INR INR INR INRCash and cash equivalentsBalance with bank on current accounts - - 164,850,420 179,812,779Deposits with original maturity of less than three months - - 36,413,191 14,386,000Cash on hand - - 52,787 38,466Total - - 201,316,398 194,237,245
Other bank balancesDeposits with original maturity for more than 3 months - - 124,758,431 139,700,000Margin money deposits* 3,830,000 3,630,000 3,373,660 3,762,488Unpaid application money due for refund 86,250 93,000Unpaid dividend account - - 559,523 91,803
3,830,000 3,630,000 128,777,864 143,647,291Amount disclosed under non-current Other assets (Note 12) (3,830,000) (3,630,000)
- - 330,094,262 337,884,536* Margin money deposits given as performance/fi nancial security
Notes to the Financial Statements
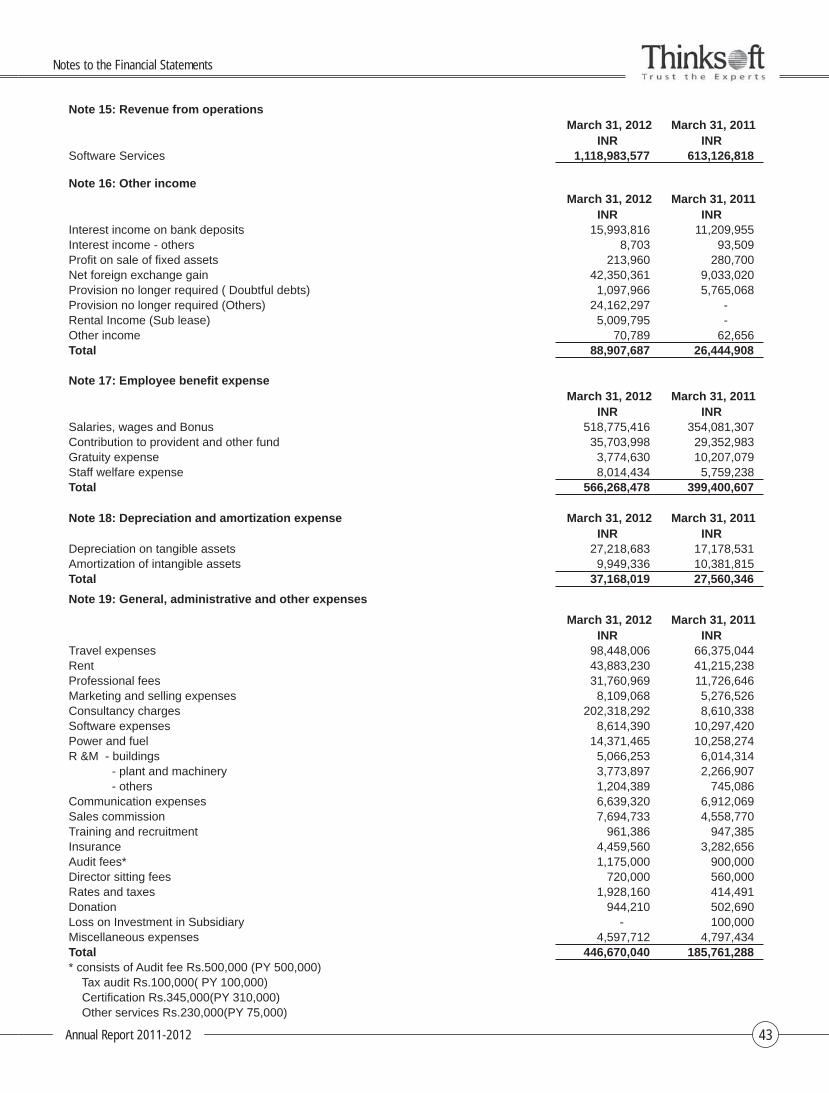
Annual Report 2011-2012 43
Note 15: Revenue from operationsMarch 31, 2012 March 31, 2011
INR INRSoftware Services 1,118,983,577 613,126,818
Note 16: Other incomeMarch 31, 2012 March 31, 2011
INR INRInterest income on bank deposits 15,993,816 11,209,955Interest income - others 8,703 93,509Profi t on sale of fi xed assets 213,960 280,700Net foreign exchange gain 42,350,361 9,033,020Provision no longer required ( Doubtful debts) 1,097,966 5,765,068Provision no longer required (Others) 24,162,297 -Rental Income (Sub lease) 5,009,795 - Other income 70,789 62,656Total 88,907,687 26,444,908
Note 17: Employee benefi t expenseMarch 31, 2012 March 31, 2011
INR INRSalaries, wages and Bonus 518,775,416 354,081,307Contribution to provident and other fund 35,703,998 29,352,983Gratuity expense 3,774,630 10,207,079Staff welfare expense 8,014,434 5,759,238Total 566,268,478 399,400,607
Note 18: Depreciation and amortization expense March 31, 2012 March 31, 2011INR INR
Depreciation on tangible assets 27,218,683 17,178,531Amortization of intangible assets 9,949,336 10,381,815Total 37,168,019 27,560,346
Note 19: General, administrative and other expenses
March 31, 2012 March 31, 2011INR INR
Travel expenses 98,448,006 66,375,044Rent 43,883,230 41,215,238Professional fees 31,760,969 11,726,646Marketing and selling expenses 8,109,068 5,276,526Consultancy charges 202,318,292 8,610,338Software expenses 8,614,390 10,297,420Power and fuel 14,371,465 10,258,274R &M - buildings 5,066,253 6,014,314 - plant and machinery 3,773,897 2,266,907 - others 1,204,389 745,086Communication expenses 6,639,320 6,912,069Sales commission 7,694,733 4,558,770Training and recruitment 961,386 947,385Insurance 4,459,560 3,282,656Audit fees* 1,175,000 900,000Director sitting fees 720,000 560,000Rates and taxes 1,928,160 414,491Donation 944,210 502,690Loss on Investment in Subsidiary - 100,000Miscellaneous expenses 4,597,712 4,797,434Total 446,670,040 185,761,288 * consists of Audit fee Rs.500,000 (PY 500,000) Tax audit Rs.100,000( PY 100,000) Certifi cation Rs.345,000(PY 310,000) Other services Rs.230,000(PY 75,000)
Notes to the Financial Statements
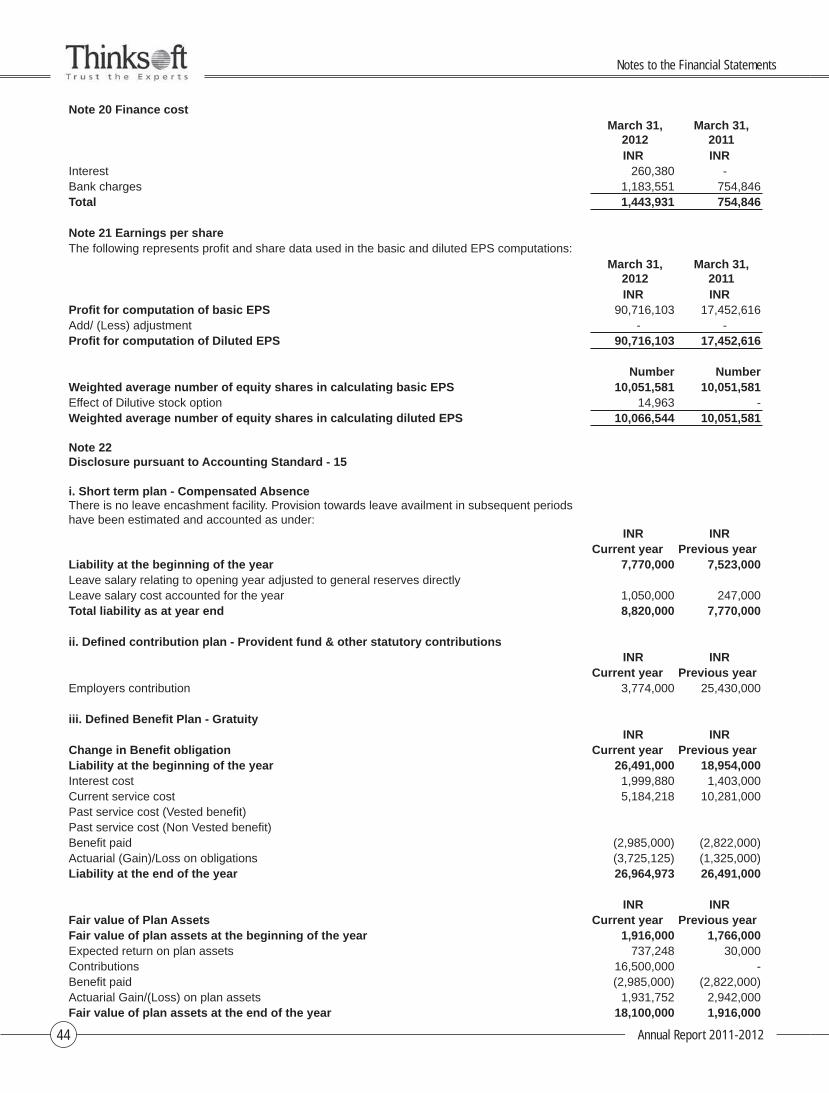
Annual Report 2011-201244
Note 20 Finance costMarch 31,
2012March 31,
2011INR INR
Interest 260,380 - Bank charges 1,183,551 754,846 Total 1,443,931 754,846
Note 21 Earnings per shareThe following represents profi t and share data used in the basic and diluted EPS computations:
March 31, 2012
March 31, 2011
INR INRProfi t for computation of basic EPS 90,716,103 17,452,616 Add/ (Less) adjustment - - Profi t for computation of Diluted EPS 90,716,103 17,452,616
Number NumberWeighted average number of equity shares in calculating basic EPS 10,051,581 10,051,581 Effect of Dilutive stock option 14,963 - Weighted average number of equity shares in calculating diluted EPS 10,066,544 10,051,581
Note 22 Disclosure pursuant to Accounting Standard - 15
i. Short term plan - Compensated AbsenceThere is no leave encashment facility. Provision towards leave availment in subsequent periods have been estimated and accounted as under:
INR INRCurrent year Previous year
Liability at the beginning of the year 7,770,000 7,523,000 Leave salary relating to opening year adjusted to general reserves directlyLeave salary cost accounted for the year 1,050,000 247,000 Total liability as at year end 8,820,000 7,770,000
ii. Defi ned contribution plan - Provident fund & other statutory contributionsINR INR
Current year Previous yearEmployers contribution 3,774,000 25,430,000
iii. Defi ned Benefi t Plan - GratuityINR INR
Change in Benefi t obligation Current year Previous yearLiability at the beginning of the year 26,491,000 18,954,000Interest cost 1,999,880 1,403,000 Current service cost 5,184,218 10,281,000 Past service cost (Vested benefi t)Past service cost (Non Vested benefi t)Benefi t paid (2,985,000) (2,822,000)Actuarial (Gain)/Loss on obligations (3,725,125) (1,325,000)Liability at the end of the year 26,964,973 26,491,000
INR INRFair value of Plan Assets Current year Previous yearFair value of plan assets at the beginning of the year 1,916,000 1,766,000Expected return on plan assets 737,248 30,000 Contributions 16,500,000 - Benefi t paid (2,985,000) (2,822,000)Actuarial Gain/(Loss) on plan assets 1,931,752 2,942,000 Fair value of plan assets at the end of the year 18,100,000 1,916,000
Notes to the Financial Statements
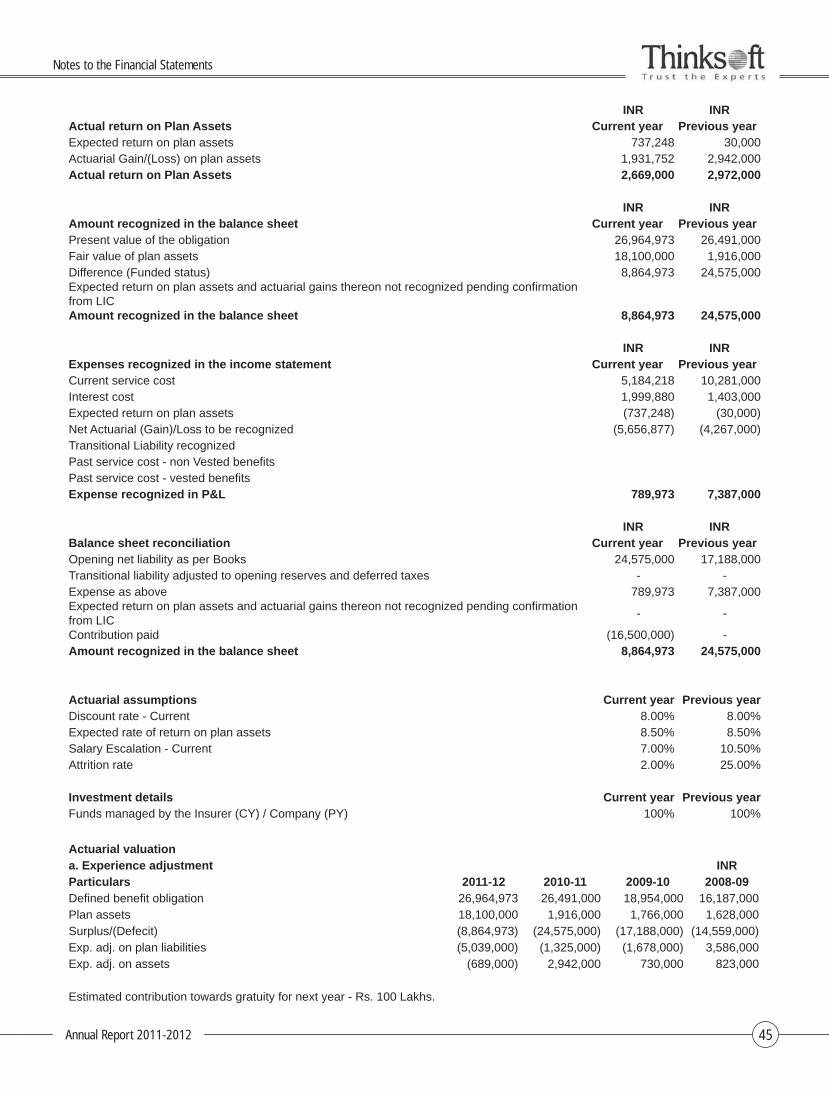
Annual Report 2011-2012 45
INR INRActual return on Plan Assets Current year Previous yearExpected return on plan assets 737,248 30,000 Actuarial Gain/(Loss) on plan assets 1,931,752 2,942,000 Actual return on Plan Assets 2,669,000 2,972,000
INR INRAmount recognized in the balance sheet Current year Previous yearPresent value of the obligation 26,964,973 26,491,000 Fair value of plan assets 18,100,000 1,916,000 Difference (Funded status) 8,864,973 24,575,000 Expected return on plan assets and actuarial gains thereon not recognized pending confi rmation from LICAmount recognized in the balance sheet 8,864,973 24,575,000
INR INRExpenses recognized in the income statement Current year Previous yearCurrent service cost 5,184,218 10,281,000 Interest cost 1,999,880 1,403,000 Expected return on plan assets (737,248) (30,000)Net Actuarial (Gain)/Loss to be recognized (5,656,877) (4,267,000)Transitional Liability recognizedPast service cost - non Vested benefi tsPast service cost - vested benefi tsExpense recognized in P&L 789,973 7,387,000
INR INRBalance sheet reconciliation Current year Previous yearOpening net liability as per Books 24,575,000 17,188,000Transitional liability adjusted to opening reserves and deferred taxes - -Expense as above 789,973 7,387,000Expected return on plan assets and actuarial gains thereon not recognized pending confi rmation from LIC
- -
Contribution paid (16,500,000) - Amount recognized in the balance sheet 8,864,973 24,575,000
Actuarial assumptions Current year Previous yearDiscount rate - Current 8.00% 8.00%Expected rate of return on plan assets 8.50% 8.50%Salary Escalation - Current 7.00% 10.50%Attrition rate 2.00% 25.00%
Investment details Current year Previous yearFunds managed by the Insurer (CY) / Company (PY) 100% 100%
Actuarial valuationa. Experience adjustment INRParticulars 2011-12 2010-11 2009-10 2008-09Defi ned benefi t obligation 26,964,973 26,491,000 18,954,000 16,187,000 Plan assets 18,100,000 1,916,000 1,766,000 1,628,000 Surplus/(Defecit) (8,864,973) (24,575,000) (17,188,000) (14,559,000)Exp. adj. on plan liabilities (5,039,000) (1,325,000) (1,678,000) 3,586,000 Exp. adj. on assets (689,000) 2,942,000 730,000 823,000
Estimated contribution towards gratuity for next year - Rs. 100 Lakhs.
Notes to the Financial Statements
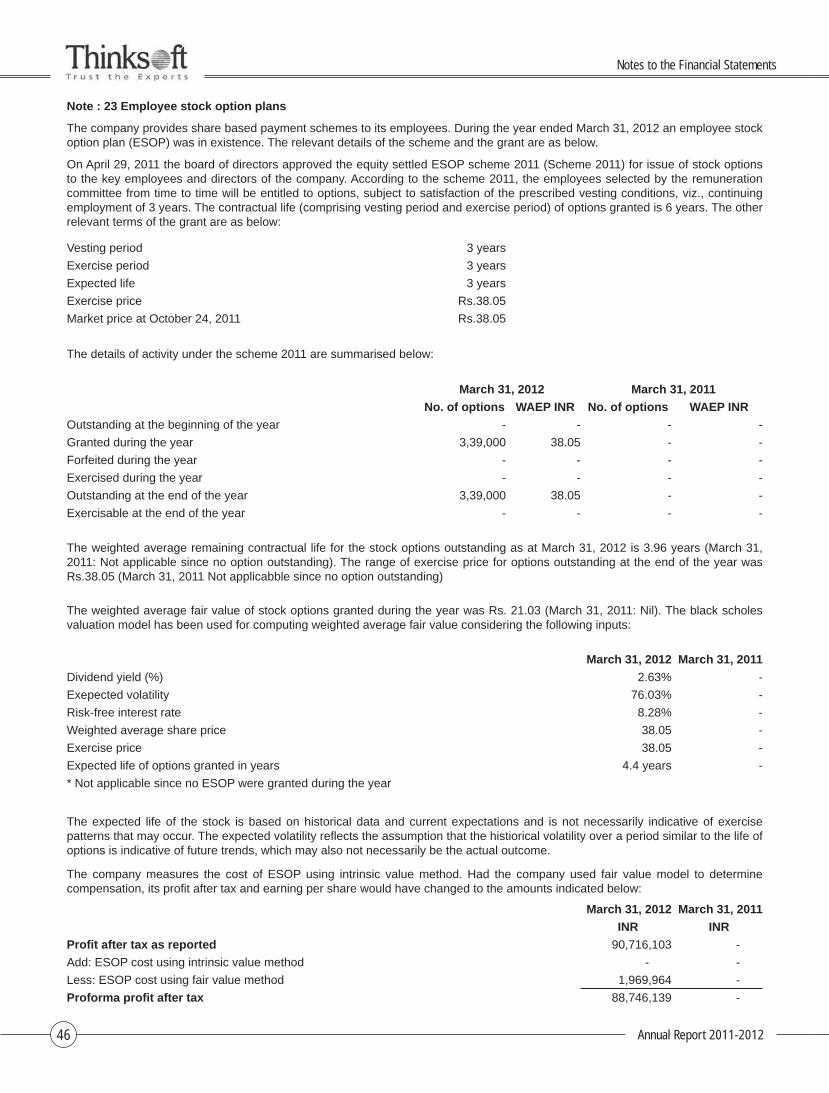
Annual Report 2011-201246
Note : 23 Employee stock option plans
The company provides share based payment schemes to its employees. During the year ended March 31, 2012 an employee stock option plan (ESOP) was in existence. The relevant details of the scheme and the grant are as below.
On April 29, 2011 the board of directors approved the equity settled ESOP scheme 2011 (Scheme 2011) for issue of stock options to the key employees and directors of the company. According to the scheme 2011, the employees selected by the remuneration committee from time to time will be entitled to options, subject to satisfaction of the prescribed vesting conditions, viz., continuing employment of 3 years. The contractual life (comprising vesting period and exercise period) of options granted is 6 years. The other relevant terms of the grant are as below:
Vesting period 3 years
Exercise period 3 years
Expected life 3 years
Exercise price Rs.38.05
Market price at October 24, 2011 Rs.38.05
The details of activity under the scheme 2011 are summarised below:
March 31, 2012 March 31, 2011
No. of options WAEP INR No. of options WAEP INR
Outstanding at the beginning of the year - - - -
Granted during the year 3,39,000 38.05 - -
Forfeited during the year - - - -
Exercised during the year - - - -
Outstanding at the end of the year 3,39,000 38.05 - -
Exercisable at the end of the year - - - -
The weighted average remaining contractual life for the stock options outstanding as at March 31, 2012 is 3.96 years (March 31, 2011: Not applicable since no option outstanding). The range of exercise price for options outstanding at the end of the year was Rs.38.05 (March 31, 2011 Not applicabble since no option outstanding)
The weighted average fair value of stock options granted during the year was Rs. 21.03 (March 31, 2011: Nil). The black scholes valuation model has been used for computing weighted average fair value considering the following inputs:
March 31, 2012 March 31, 2011
Dividend yield (%) 2.63% -
Exepected volatility 76.03% -
Risk-free interest rate 8.28% -
Weighted average share price 38.05 -
Exercise price 38.05 -
Expected life of options granted in years 4.4 years -
* Not applicable since no ESOP were granted during the year
The expected life of the stock is based on historical data and current expectations and is not necessarily indicative of exercise patterns that may occur. The expected volatility refl ects the assumption that the histiorical volatility over a period similar to the life of options is indicative of future trends, which may also not necessarily be the actual outcome.
The company measures the cost of ESOP using intrinsic value method. Had the company used fair value model to determine compensation, its profi t after tax and earning per share would have changed to the amounts indicated below:
March 31, 2012 March 31, 2011
INR INR
Profi t after tax as reported 90,716,103 -
Add: ESOP cost using intrinsic value method - -
Less: ESOP cost using fair value method 1,969,964 -
Proforma profi t after tax 88,746,139 -
Notes to the Financial Statements
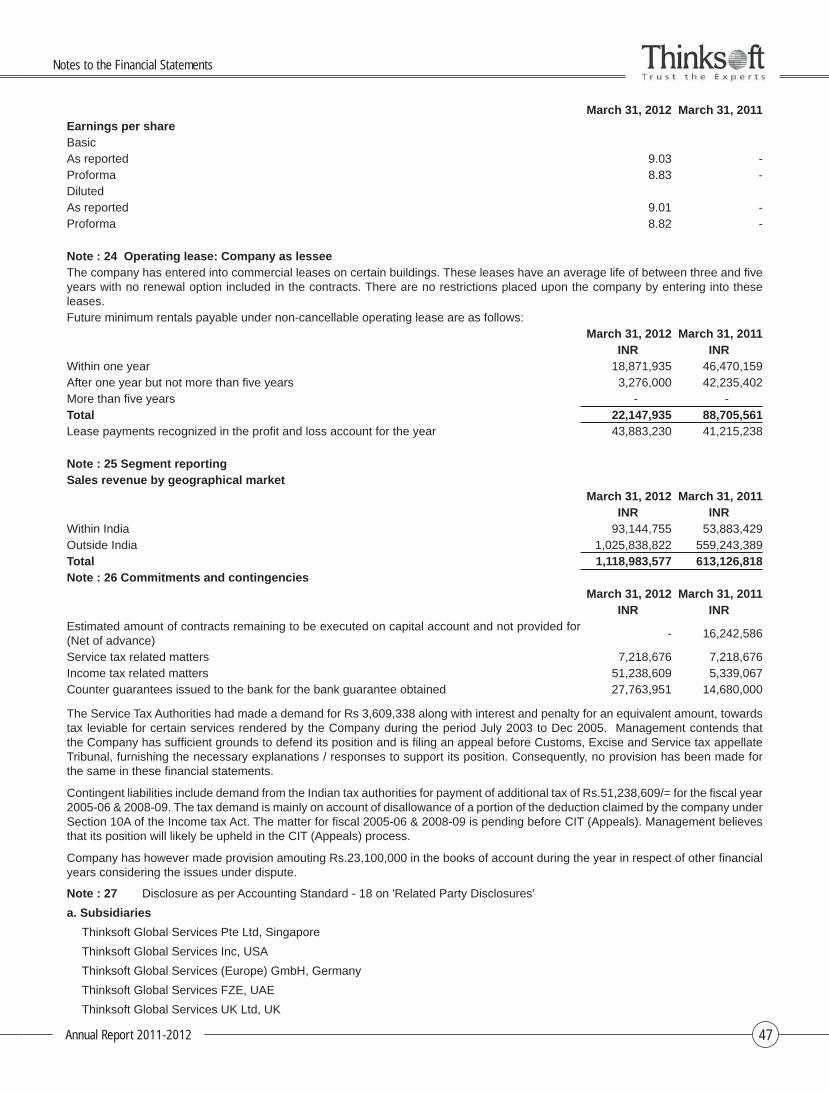
Annual Report 2011-2012 47
March 31, 2012 March 31, 2011Earnings per shareBasicAs reported 9.03 -Proforma 8.83 -DilutedAs reported 9.01 -Proforma 8.82 -
Note : 24 Operating lease: Company as lesseeThe company has entered into commercial leases on certain buildings. These leases have an average life of between three and fi ve years with no renewal option included in the contracts. There are no restrictions placed upon the company by entering into these leases.Future minimum rentals payable under non-cancellable operating lease are as follows:
March 31, 2012 March 31, 2011INR INR
Within one year 18,871,935 46,470,159 After one year but not more than fi ve years 3,276,000 42,235,402 More than fi ve years - -Total 22,147,935 88,705,561 Lease payments recognized in the profi t and loss account for the year 43,883,230 41,215,238
Note : 25 Segment reportingSales revenue by geographical market
March 31, 2012 March 31, 2011INR INR
Within India 93,144,755 53,883,429 Outside India 1,025,838,822 559,243,389 Total 1,118,983,577 613,126,818 Note : 26 Commitments and contingencies
March 31, 2012 March 31, 2011INR INR
Estimated amount of contracts remaining to be executed on capital account and not provided for (Net of advance)
- 16,242,586
Service tax related matters 7,218,676 7,218,676 Income tax related matters 51,238,609 5,339,067 Counter guarantees issued to the bank for the bank guarantee obtained 27,763,951 14,680,000
The Service Tax Authorities had made a demand for Rs 3,609,338 along with interest and penalty for an equivalent amount, towards tax leviable for certain services rendered by the Company during the period July 2003 to Dec 2005. Management contends that the Company has suffi cient grounds to defend its position and is fi ling an appeal before Customs, Excise and Service tax appellate Tribunal, furnishing the necessary explanations / responses to support its position. Consequently, no provision has been made for the same in these fi nancial statements.
Contingent liabilities include demand from the Indian tax authorities for payment of additional tax of Rs.51,238,609/= for the fi scal year 2005-06 & 2008-09. The tax demand is mainly on account of disallowance of a portion of the deduction claimed by the company under Section 10A of the Income tax Act. The matter for fi scal 2005-06 & 2008-09 is pending before CIT (Appeals). Management believes that its position will likely be upheld in the CIT (Appeals) process.
Company has however made provision amouting Rs.23,100,000 in the books of account during the year in respect of other fi nancial years considering the issues under dispute.
Note : 27 Disclosure as per Accounting Standard - 18 on 'Related Party Disclosures'
a. Subsidiaries
Thinksoft Global Services Pte Ltd, Singapore
Thinksoft Global Services Inc, USA
Thinksoft Global Services (Europe) GmbH, Germany
Thinksoft Global Services FZE, UAE
Thinksoft Global Services UK Ltd, UK
Notes to the Financial Statements
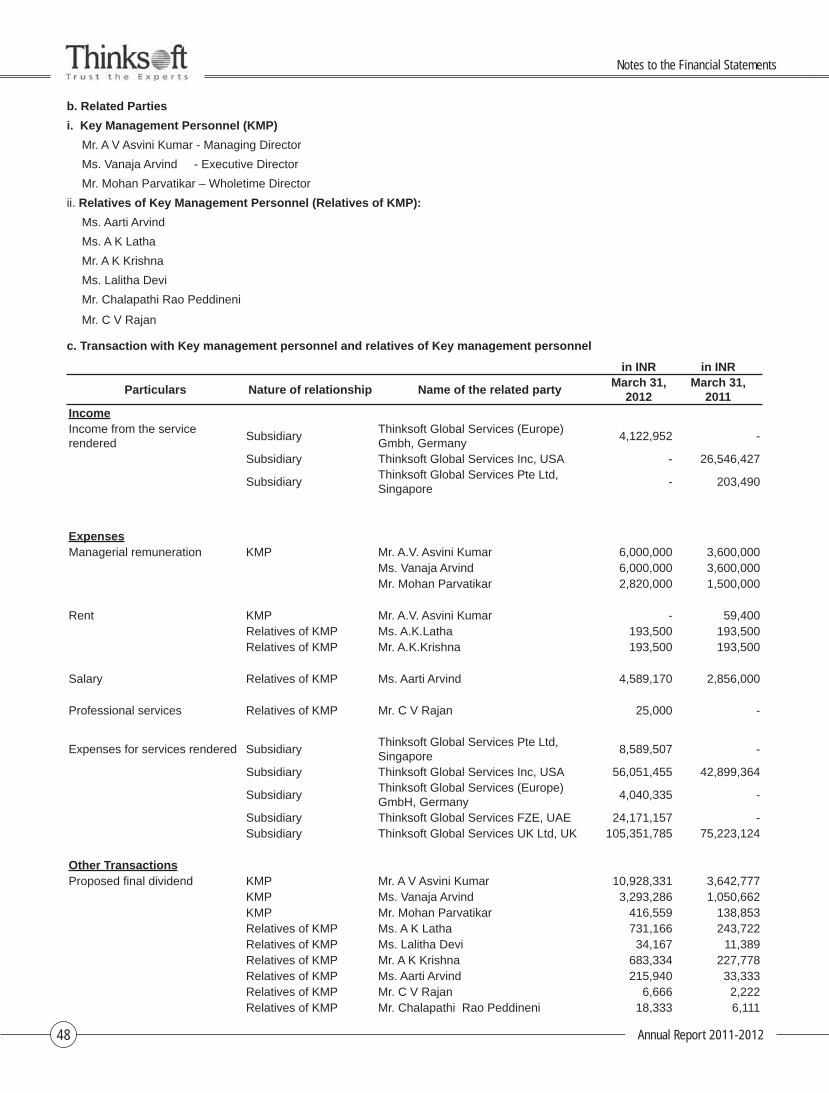
Annual Report 2011-201248
b. Related Parties
i. Key Management Personnel (KMP)
Mr. A V Asvini Kumar - Managing Director
Ms. Vanaja Arvind - Executive Director
Mr. Mohan Parvatikar – Wholetime Director
ii. Relatives of Key Management Personnel (Relatives of KMP):
Ms. Aarti Arvind
Ms. A K Latha
Mr. A K Krishna
Ms. Lalitha Devi
Mr. Chalapathi Rao Peddineni
Mr. C V Rajan
c. Transaction with Key management personnel and relatives of Key management personnel
in INR in INR
Particulars Nature of relationship Name of the related partyMarch 31,
2012March 31,
2011IncomeIncome from the service rendered
SubsidiaryThinksoft Global Services (Europe) Gmbh, Germany
4,122,952 -
Subsidiary Thinksoft Global Services Inc, USA - 26,546,427
SubsidiaryThinksoft Global Services Pte Ltd, Singapore
- 203,490
ExpensesManagerial remuneration KMP Mr. A.V. Asvini Kumar 6,000,000 3,600,000
Ms. Vanaja Arvind 6,000,000 3,600,000Mr. Mohan Parvatikar 2,820,000 1,500,000
Rent KMP Mr. A.V. Asvini Kumar - 59,400 Relatives of KMP Ms. A.K.Latha 193,500 193,500 Relatives of KMP Mr. A.K.Krishna 193,500 193,500
Salary Relatives of KMP Ms. Aarti Arvind 4,589,170 2,856,000
Professional services Relatives of KMP Mr. C V Rajan 25,000 -
Expenses for services rendered SubsidiaryThinksoft Global Services Pte Ltd, Singapore
8,589,507 -
Subsidiary Thinksoft Global Services Inc, USA 56,051,455 42,899,364
SubsidiaryThinksoft Global Services (Europe) GmbH, Germany
4,040,335 -
Subsidiary Thinksoft Global Services FZE, UAE 24,171,157 -Subsidiary Thinksoft Global Services UK Ltd, UK 105,351,785 75,223,124
Other TransactionsProposed fi nal dividend KMP Mr. A V Asvini Kumar 10,928,331 3,642,777
KMP Ms. Vanaja Arvind 3,293,286 1,050,662 KMP Mr. Mohan Parvatikar 416,559 138,853 Relatives of KMP Ms. A K Latha 731,166 243,722 Relatives of KMP Ms. Lalitha Devi 34,167 11,389 Relatives of KMP Mr. A K Krishna 683,334 227,778 Relatives of KMP Ms. Aarti Arvind 215,940 33,333Relatives of KMP Mr. C V Rajan 6,666 2,222Relatives of KMP Mr. Chalapathi Rao Peddineni 18,333 6,111
Notes to the Financial Statements
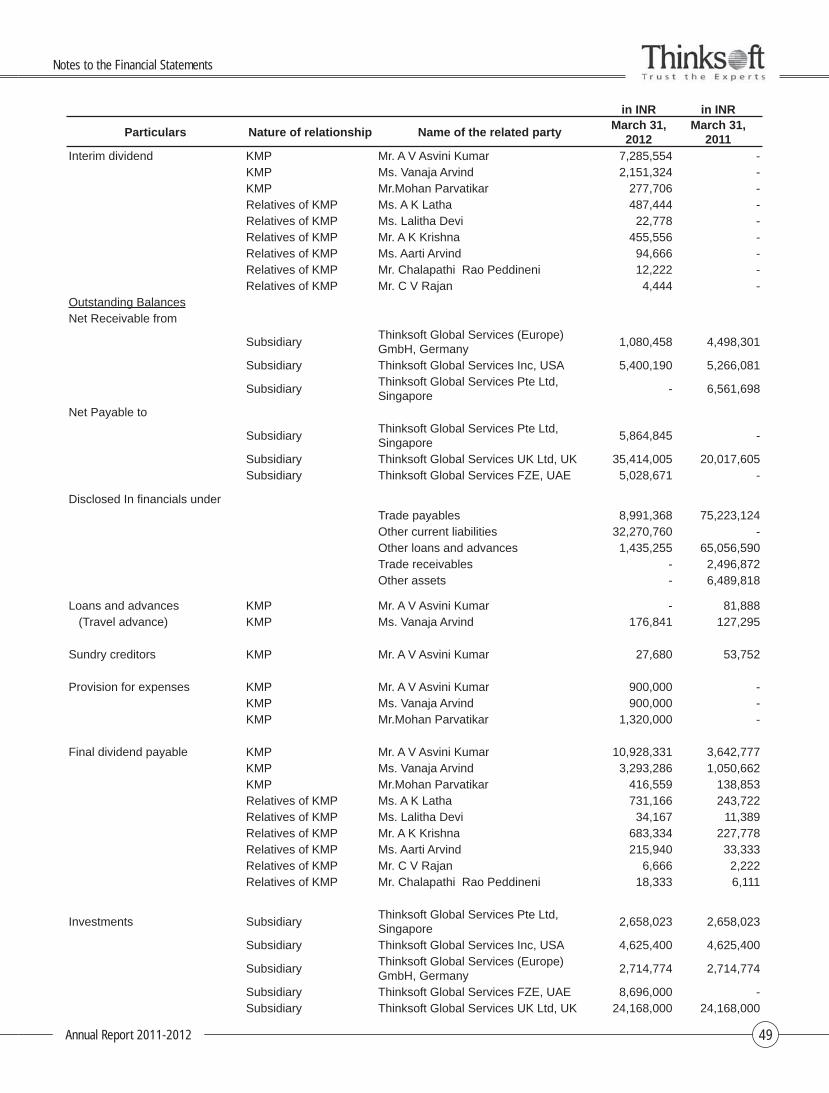
Annual Report 2011-2012 49
in INR in INR
Particulars Nature of relationship Name of the related partyMarch 31,
2012March 31,
2011Interim dividend KMP Mr. A V Asvini Kumar 7,285,554 -
KMP Ms. Vanaja Arvind 2,151,324 -KMP Mr.Mohan Parvatikar 277,706 -Relatives of KMP Ms. A K Latha 487,444 -Relatives of KMP Ms. Lalitha Devi 22,778 -Relatives of KMP Mr. A K Krishna 455,556 -Relatives of KMP Ms. Aarti Arvind 94,666 -Relatives of KMP Mr. Chalapathi Rao Peddineni 12,222 -Relatives of KMP Mr. C V Rajan 4,444 -
Outstanding BalancesNet Receivable from
SubsidiaryThinksoft Global Services (Europe) GmbH, Germany
1,080,458 4,498,301
Subsidiary Thinksoft Global Services Inc, USA 5,400,190 5,266,081
SubsidiaryThinksoft Global Services Pte Ltd, Singapore
- 6,561,698
Net Payable to
SubsidiaryThinksoft Global Services Pte Ltd, Singapore
5,864,845 -
Subsidiary Thinksoft Global Services UK Ltd, UK 35,414,005 20,017,605Subsidiary Thinksoft Global Services FZE, UAE 5,028,671 -
Disclosed In fi nancials underTrade payables 8,991,368 75,223,124Other current liabilities 32,270,760 -Other loans and advances 1,435,255 65,056,590Trade receivables - 2,496,872Other assets - 6,489,818
Loans and advances KMP Mr. A V Asvini Kumar - 81,888 (Travel advance) KMP Ms. Vanaja Arvind 176,841 127,295
Sundry creditors KMP Mr. A V Asvini Kumar 27,680 53,752
Provision for expenses KMP Mr. A V Asvini Kumar 900,000 -KMP Ms. Vanaja Arvind 900,000 -KMP Mr.Mohan Parvatikar 1,320,000 -
Final dividend payable KMP Mr. A V Asvini Kumar 10,928,331 3,642,777KMP Ms. Vanaja Arvind 3,293,286 1,050,662KMP Mr.Mohan Parvatikar 416,559 138,853Relatives of KMP Ms. A K Latha 731,166 243,722Relatives of KMP Ms. Lalitha Devi 34,167 11,389Relatives of KMP Mr. A K Krishna 683,334 227,778Relatives of KMP Ms. Aarti Arvind 215,940 33,333Relatives of KMP Mr. C V Rajan 6,666 2,222Relatives of KMP Mr. Chalapathi Rao Peddineni 18,333 6,111
Investments SubsidiaryThinksoft Global Services Pte Ltd, Singapore
2,658,023 2,658,023
Subsidiary Thinksoft Global Services Inc, USA 4,625,400 4,625,400
SubsidiaryThinksoft Global Services (Europe) GmbH, Germany
2,714,774 2,714,774
Subsidiary Thinksoft Global Services FZE, UAE 8,696,000 -Subsidiary Thinksoft Global Services UK Ltd, UK 24,168,000 24,168,000
Notes to the Financial Statements
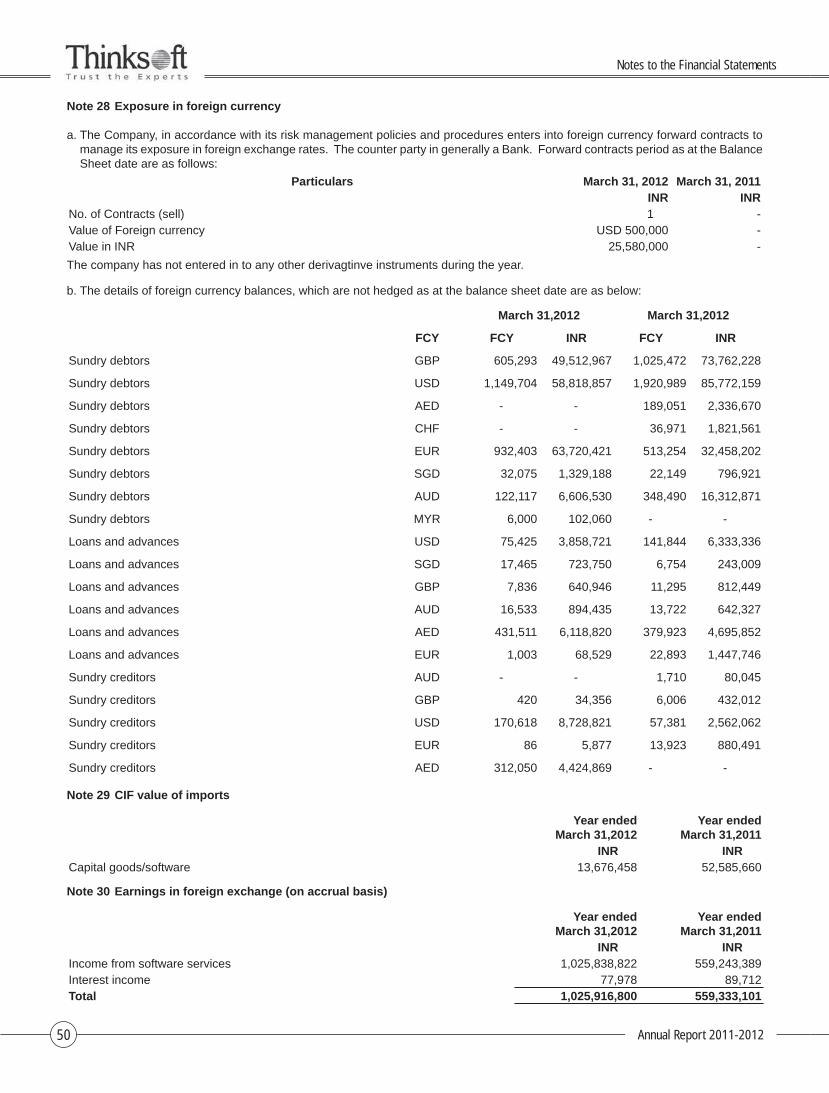
Annual Report 2011-201250
Note 28 Exposure in foreign currency a. The Company, in accordance with its risk management policies and procedures enters into foreign currency forward contracts to
manage its exposure in foreign exchange rates. The counter party in generally a Bank. Forward contracts period as at the Balance Sheet date are as follows:
Particulars March 31, 2012 March 31, 2011INR INR
No. of Contracts (sell) 1 -Value of Foreign currency USD 500,000 -Value in INR 25,580,000 -
The company has not entered in to any other derivagtinve instruments during the year.
b. The details of foreign currency balances, which are not hedged as at the balance sheet date are as below:
March 31,2012 March 31,2012
FCY FCY INR FCY INR
Sundry debtors GBP 605,293 49,512,967 1,025,472 73,762,228
Sundry debtors USD 1,149,704 58,818,857 1,920,989 85,772,159
Sundry debtors AED - - 189,051 2,336,670
Sundry debtors CHF - - 36,971 1,821,561
Sundry debtors EUR 932,403 63,720,421 513,254 32,458,202
Sundry debtors SGD 32,075 1,329,188 22,149 796,921
Sundry debtors AUD 122,117 6,606,530 348,490 16,312,871
Sundry debtors MYR 6,000 102,060 - -
Loans and advances USD 75,425 3,858,721 141,844 6,333,336
Loans and advances SGD 17,465 723,750 6,754 243,009
Loans and advances GBP 7,836 640,946 11,295 812,449
Loans and advances AUD 16,533 894,435 13,722 642,327
Loans and advances AED 431,511 6,118,820 379,923 4,695,852
Loans and advances EUR 1,003 68,529 22,893 1,447,746
Sundry creditors AUD - - 1,710 80,045
Sundry creditors GBP 420 34,356 6,006 432,012
Sundry creditors USD 170,618 8,728,821 57,381 2,562,062
Sundry creditors EUR 86 5,877 13,923 880,491
Sundry creditors AED 312,050 4,424,869 - -
Note 29 CIF value of imports
Year ended March 31,2012
Year endedMarch 31,2011
INR INRCapital goods/software 13,676,458 52,585,660
Note 30 Earnings in foreign exchange (on accrual basis)
Year ended March 31,2012
Year ended March 31,2011
INR INRIncome from software services 1,025,838,822 559,243,389 Interest income 77,978 89,712 Total 1,025,916,800 559,333,101
Notes to the Financial Statements
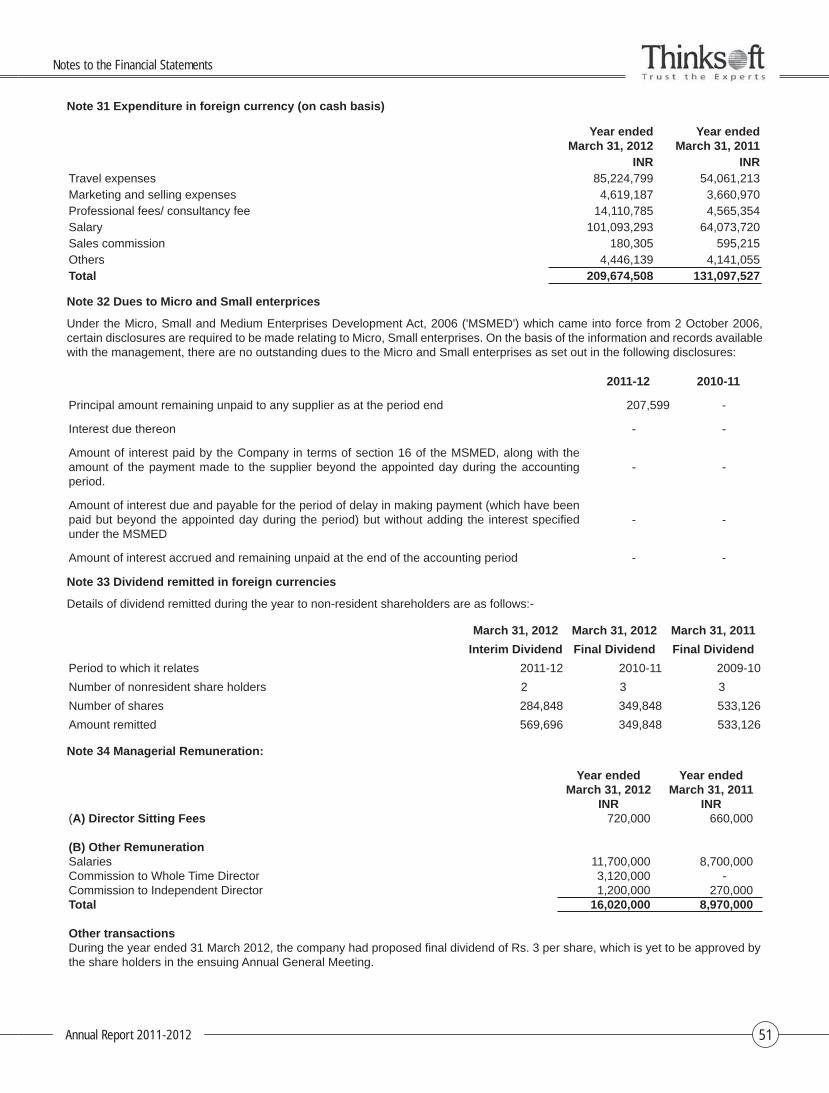
Annual Report 2011-2012 51
Note 31 Expenditure in foreign currency (on cash basis)
Year ended March 31, 2012
Year ended March 31, 2011
INR INRTravel expenses 85,224,799 54,061,213 Marketing and selling expenses 4,619,187 3,660,970 Professional fees/ consultancy fee 14,110,785 4,565,354 Salary 101,093,293 64,073,720 Sales commission 180,305 595,215 Others 4,446,139 4,141,055 Total 209,674,508 131,097,527
Note 32 Dues to Micro and Small enterprices
Under the Micro, Small and Medium Enterprises Development Act, 2006 ('MSMED') which came into force from 2 October 2006, certain disclosures are required to be made relating to Micro, Small enterprises. On the basis of the information and records available with the management, there are no outstanding dues to the Micro and Small enterprises as set out in the following disclosures:
2011-12 2010-11
Principal amount remaining unpaid to any supplier as at the period end 207,599 -
Interest due thereon - -
Amount of interest paid by the Company in terms of section 16 of the MSMED, along with the amount of the payment made to the supplier beyond the appointed day during the accounting period.
- -
Amount of interest due and payable for the period of delay in making payment (which have been paid but beyond the appointed day during the period) but without adding the interest specifi ed under the MSMED
- -
Amount of interest accrued and remaining unpaid at the end of the accounting period - -
Note 33 Dividend remitted in foreign currencies
Details of dividend remitted during the year to non-resident shareholders are as follows:-
March 31, 2012 March 31, 2012 March 31, 2011
Interim Dividend Final Dividend Final Dividend
Period to which it relates 2011-12 2010-11 2009-10
Number of nonresident share holders 2 3 3
Number of shares 284,848 349,848 533,126
Amount remitted 569,696 349,848 533,126
Note 34 Managerial Remuneration:
Year ended March 31, 2012
Year endedMarch 31, 2011
INR INR(A) Director Sitting Fees 720,000 660,000
(B) Other RemunerationSalaries 11,700,000 8,700,000Commission to Whole Time Director 3,120,000 -Commission to Independent Director 1,200,000 270,000Total 16,020,000 8,970,000
Other transactionsDuring the year ended 31 March 2012, the company had proposed fi nal dividend of Rs. 3 per share, which is yet to be approved by the share holders in the ensuing Annual General Meeting.
Notes to the Financial Statements
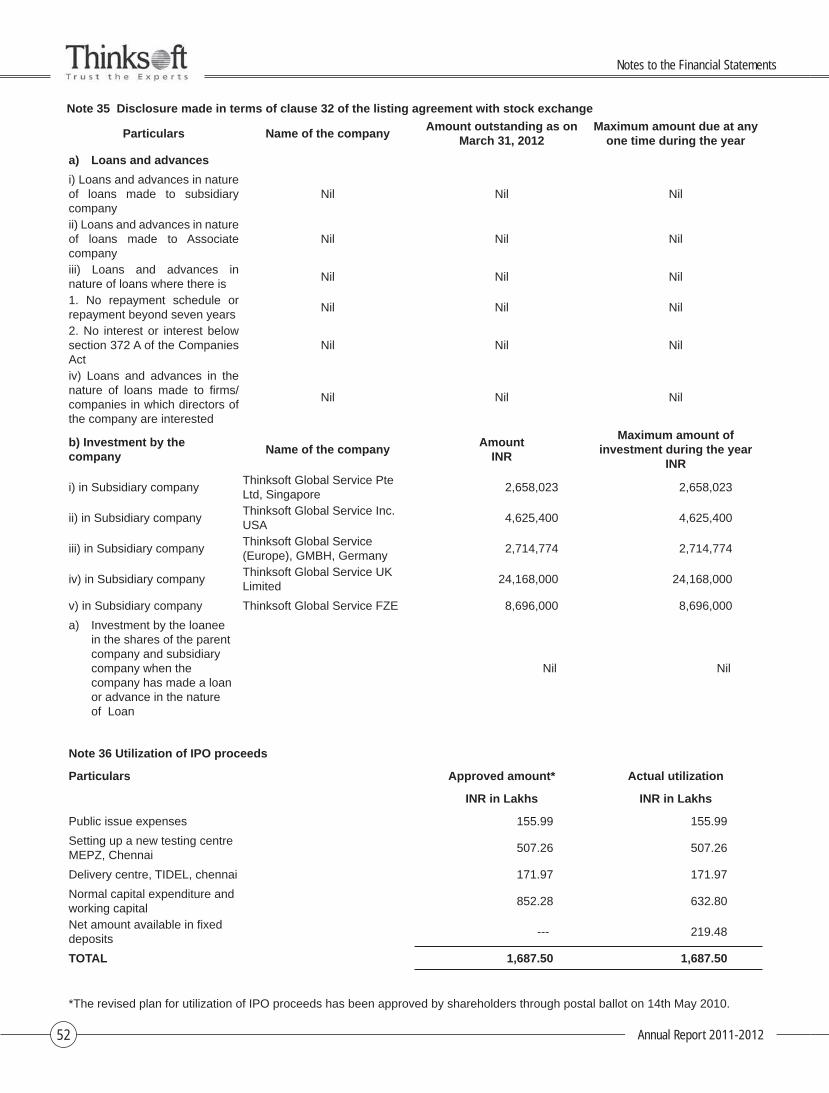
Annual Report 2011-201252
Note 35 Disclosure made in terms of clause 32 of the listing agreement with stock exchange
Particulars Name of the companyAmount outstanding as on
March 31, 2012Maximum amount due at any
one time during the year
a) Loans and advances
i) Loans and advances in nature of loans made to subsidiary company
Nil Nil Nil
ii) Loans and advances in nature of loans made to Associate company
Nil Nil Nil
iii) Loans and advances in nature of loans where there is
Nil Nil Nil
1. No repayment schedule or repayment beyond seven years
Nil Nil Nil
2. No interest or interest below section 372 A of the Companies Act
Nil Nil Nil
iv) Loans and advances in the nature of loans made to fi rms/companies in which directors of the company are interested
Nil Nil Nil
b) Investment by the company
Name of the companyAmount
INR
Maximum amount of investment during the year
INR
i) in Subsidiary company Thinksoft Global Service Pte Ltd, Singapore
2,658,023 2,658,023
ii) in Subsidiary company Thinksoft Global Service Inc. USA
4,625,400 4,625,400
iii) in Subsidiary company Thinksoft Global Service (Europe), GMBH, Germany
2,714,774 2,714,774
iv) in Subsidiary company Thinksoft Global Service UK Limited
24,168,000 24,168,000
v) in Subsidiary company Thinksoft Global Service FZE 8,696,000 8,696,000
a) Investment by the loanee in the shares of the parent company and subsidiary company when the company has made a loan or advance in the nature of Loan
Nil Nil
Note 36 Utilization of IPO proceeds
Particulars Approved amount* Actual utilization
INR in Lakhs INR in Lakhs
Public issue expenses 155.99 155.99
Setting up a new testing centre MEPZ, Chennai
507.26 507.26
Delivery centre, TIDEL, chennai 171.97 171.97
Normal capital expenditure and working capital
852.28 632.80
Net amount available in fi xed deposits
--- 219.48
TOTAL 1,687.50 1,687.50
*The revised plan for utilization of IPO proceeds has been approved by shareholders through postal ballot on 14th May 2010.
Notes to the Financial Statements
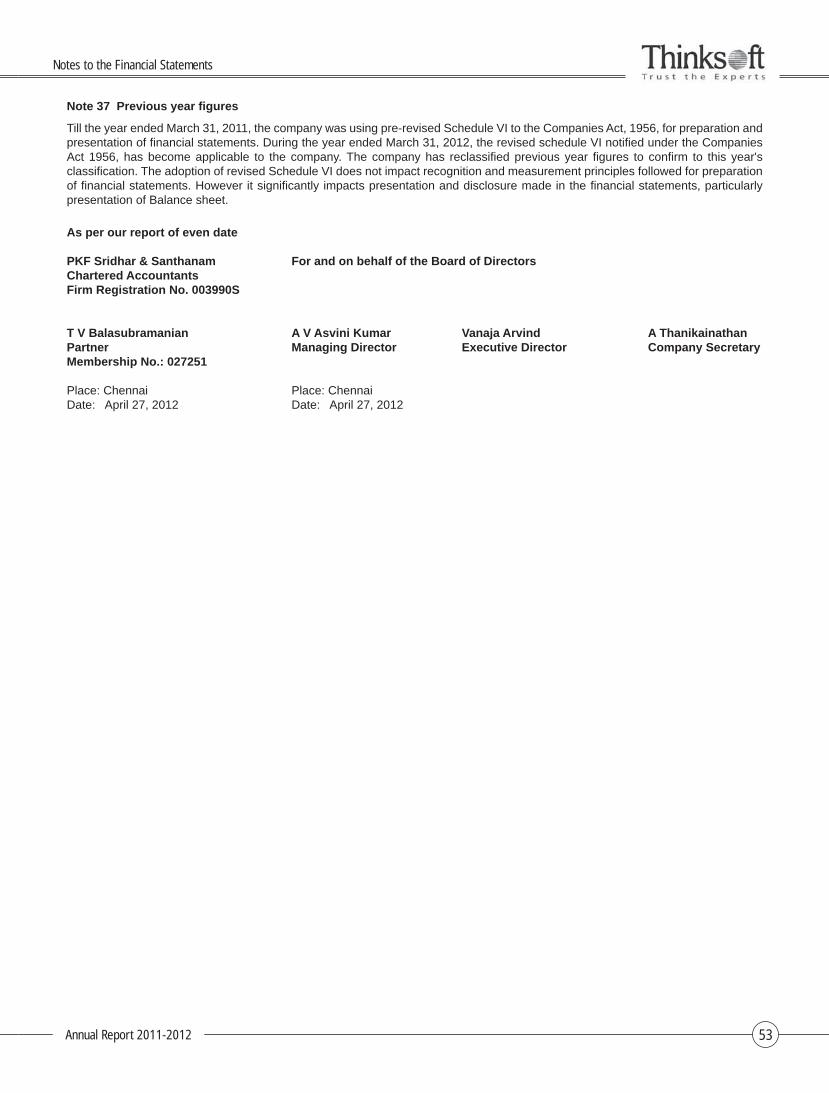
Annual Report 2011-2012 53
Note 37 Previous year fi gures
Till the year ended March 31, 2011, the company was using pre-revised Schedule VI to the Companies Act, 1956, for preparation and presentation of fi nancial statements. During the year ended March 31, 2012, the revised schedule VI notifi ed under the Companies Act 1956, has become applicable to the company. The company has reclassifi ed previous year fi gures to confi rm to this year's classifi cation. The adoption of revised Schedule VI does not impact recognition and measurement principles followed for preparation of fi nancial statements. However it signifi cantly impacts presentation and disclosure made in the fi nancial statements, particularly presentation of Balance sheet.
As per our report of even date
PKF Sridhar & Santhanam For and on behalf of the Board of DirectorsChartered AccountantsFirm Registration No. 003990S
T V Balasubramanian A V Asvini Kumar Vanaja Arvind A ThanikainathanPartner Managing Director Executive Director Company SecretaryMembership No.: 027251
Place: Chennai Place: ChennaiDate: April 27, 2012 Date: April 27, 2012
Notes to the Financial Statements
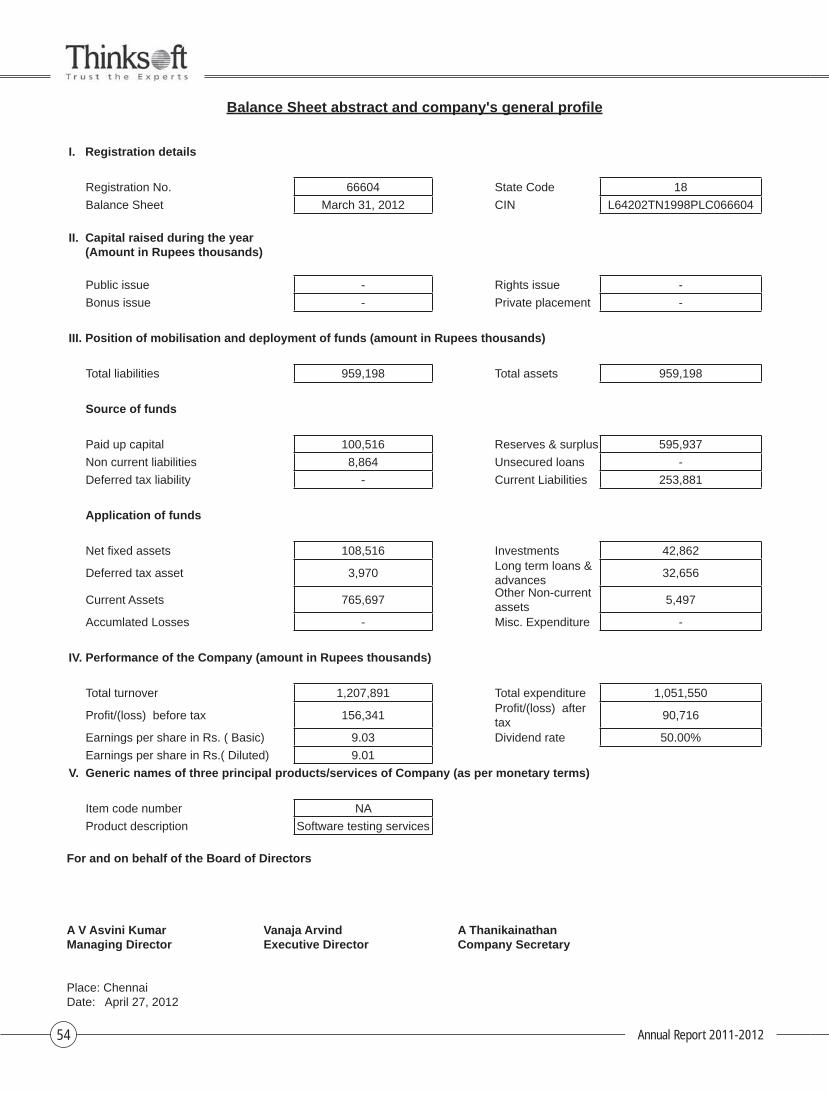
Annual Report 2011-201254
Balance Sheet abstract and company's general profi le
I. Registration details
Registration No. 66604 State Code 18
Balance Sheet March 31, 2012 CIN L64202TN1998PLC066604
II. Capital raised during the year (Amount in Rupees thousands)
Public issue - Rights issue -
Bonus issue - Private placement -
III. Position of mobilisation and deployment of funds (amount in Rupees thousands)
Total liabilities 959,198 Total assets 959,198
Source of funds
Paid up capital 100,516 Reserves & surplus 595,937
Non current liabilities 8,864 Unsecured loans -
Deferred tax liability - Current Liabilities 253,881
Application of funds
Net fi xed assets 108,516 Investments 42,862
Deferred tax asset 3,970 Long term loans & advances
32,656
Current Assets 765,697 Other Non-current assets
5,497
Accumlated Losses - Misc. Expenditure -
IV. Performance of the Company (amount in Rupees thousands)
Total turnover 1,207,891 Total expenditure 1,051,550
Profi t/(loss) before tax 156,341 Profi t/(loss) after tax
90,716
Earnings per share in Rs. ( Basic) 9.03 Dividend rate 50.00%
Earnings per share in Rs.( Diluted) 9.01
V. Generic names of three principal products/services of Company (as per monetary terms)
Item code number NA
Product description Software testing services
For and on behalf of the Board of Directors
A V Asvini Kumar Vanaja Arvind A ThanikainathanManaging Director Executive Director Company Secretary
Place: ChennaiDate: April 27, 2012
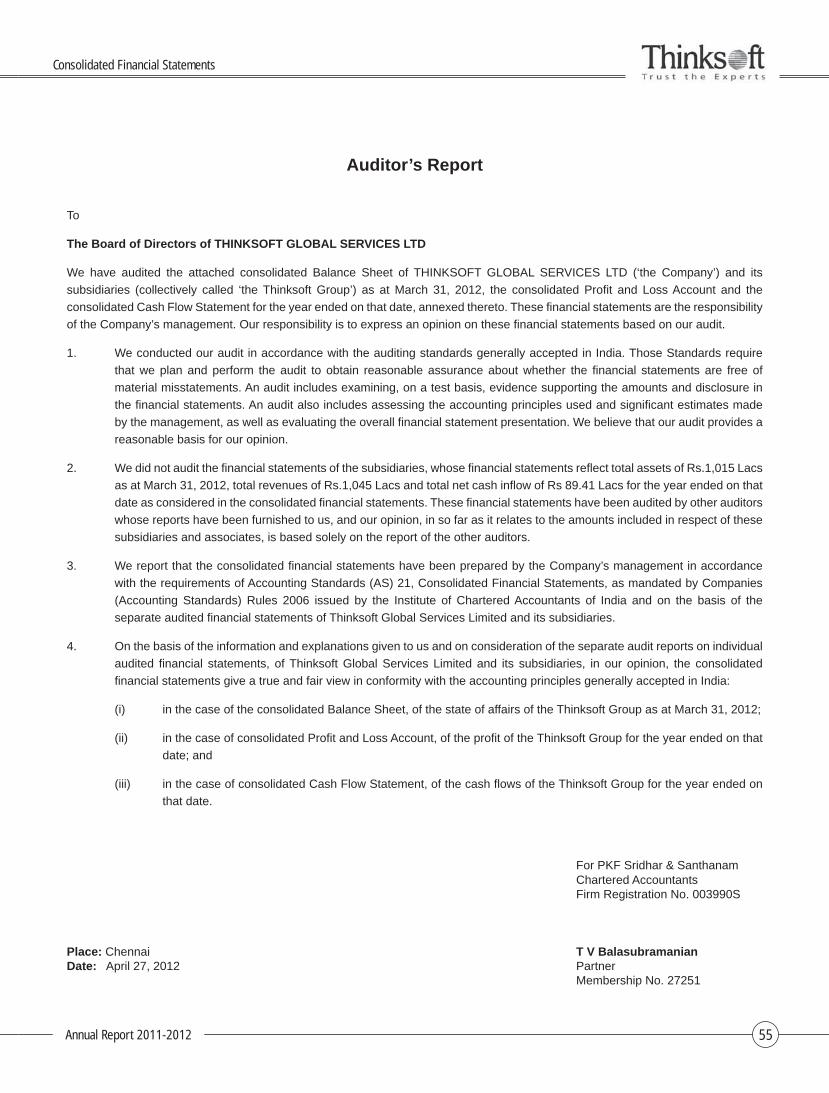
Annual Report 2011-2012 55
Auditor’s Report
To
The Board of Directors of THINKSOFT GLOBAL SERVICES LTD
We have audited the attached consolidated Balance Sheet of THINKSOFT GLOBAL SERVICES LTD (‘the Company’) and its
subsidiaries (collectively called ‘the Thinksoft Group’) as at March 31, 2012, the consolidated Profi t and Loss Account and the
consolidated Cash Flow Statement for the year ended on that date, annexed thereto. These fi nancial statements are the responsibility
of the Company’s management. Our responsibility is to express an opinion on these fi nancial statements based on our audit.
1. We conducted our audit in accordance with the auditing standards generally accepted in India. Those Standards require
that we plan and perform the audit to obtain reasonable assurance about whether the fi nancial statements are free of
material misstatements. An audit includes examining, on a test basis, evidence supporting the amounts and disclosure in
the fi nancial statements. An audit also includes assessing the accounting principles used and signifi cant estimates made
by the management, as well as evaluating the overall fi nancial statement presentation. We believe that our audit provides a
reasonable basis for our opinion.
2. We did not audit the fi nancial statements of the subsidiaries, whose fi nancial statements refl ect total assets of Rs.1,015 Lacs
as at March 31, 2012, total revenues of Rs.1,045 Lacs and total net cash infl ow of Rs 89.41 Lacs for the year ended on that
date as considered in the consolidated fi nancial statements. These fi nancial statements have been audited by other auditors
whose reports have been furnished to us, and our opinion, in so far as it relates to the amounts included in respect of these
subsidiaries and associates, is based solely on the report of the other auditors.
3. We report that the consolidated fi nancial statements have been prepared by the Company’s management in accordance
with the requirements of Accounting Standards (AS) 21, Consolidated Financial Statements, as mandated by Companies
(Accounting Standards) Rules 2006 issued by the Institute of Chartered Accountants of India and on the basis of the
separate audited fi nancial statements of Thinksoft Global Services Limited and its subsidiaries.
4. On the basis of the information and explanations given to us and on consideration of the separate audit reports on individual
audited fi nancial statements, of Thinksoft Global Services Limited and its subsidiaries, in our opinion, the consolidated
fi nancial statements give a true and fair view in conformity with the accounting principles generally accepted in India:
(i) in the case of the consolidated Balance Sheet, of the state of affairs of the Thinksoft Group as at March 31, 2012;
(ii) in the case of consolidated Profi t and Loss Account, of the profi t of the Thinksoft Group for the year ended on that
date; and
(iii) in the case of consolidated Cash Flow Statement, of the cash fl ows of the Thinksoft Group for the year ended on
that date.
For PKF Sridhar & Santhanam Chartered Accountants Firm Registration No. 003990S
Place: Chennai T V BalasubramanianDate: April 27, 2012 Partner Membership No. 27251
Consolidated Financial Statements
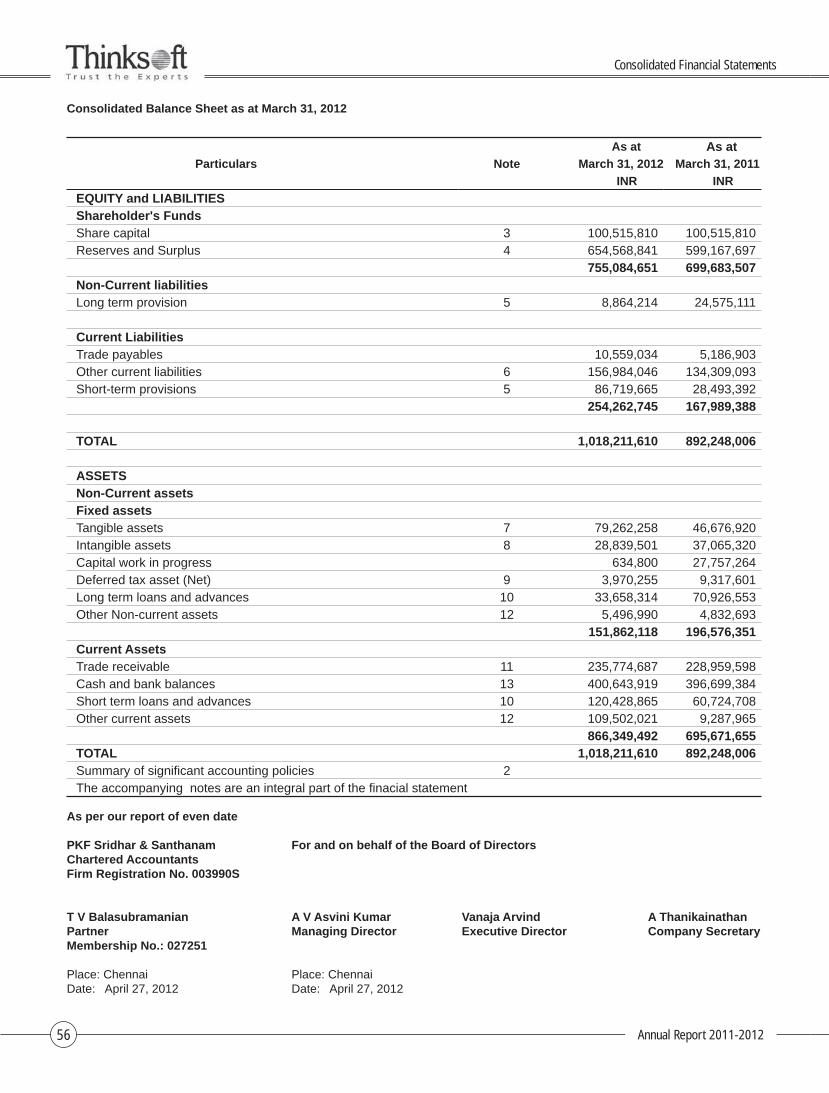
Annual Report 2011-201256
Consolidated Balance Sheet as at March 31, 2012
Particulars Note
As at As atMarch 31, 2012 March 31, 2011
INR INR
EQUITY and LIABILITIESShareholder's FundsShare capital 3 100,515,810 100,515,810 Reserves and Surplus 4 654,568,841 599,167,697
755,084,651 699,683,507 Non-Current liabilitiesLong term provision 5 8,864,214 24,575,111
Current LiabilitiesTrade payables 10,559,034 5,186,903 Other current liabilities 6 156,984,046 134,309,093 Short-term provisions 5 86,719,665 28,493,392
254,262,745 167,989,388
TOTAL 1,018,211,610 892,248,006
ASSETSNon-Current assetsFixed assetsTangible assets 7 79,262,258 46,676,920 Intangible assets 8 28,839,501 37,065,320 Capital work in progress 634,800 27,757,264 Deferred tax asset (Net) 9 3,970,255 9,317,601 Long term loans and advances 10 33,658,314 70,926,553 Other Non-current assets 12 5,496,990 4,832,693
151,862,118 196,576,351 Current AssetsTrade receivable 11 235,774,687 228,959,598 Cash and bank balances 13 400,643,919 396,699,384 Short term loans and advances 10 120,428,865 60,724,708 Other current assets 12 109,502,021 9,287,965
866,349,492 695,671,655 TOTAL 1,018,211,610 892,248,006 Summary of signifi cant accounting policies 2The accompanying notes are an integral part of the fi nacial statement
As per our report of even date
PKF Sridhar & Santhanam For and on behalf of the Board of DirectorsChartered AccountantsFirm Registration No. 003990S
T V Balasubramanian A V Asvini Kumar Vanaja Arvind A ThanikainathanPartner Managing Director Executive Director Company SecretaryMembership No.: 027251
Place: Chennai Place: ChennaiDate: April 27, 2012 Date: April 27, 2012
Consolidated Financial Statements
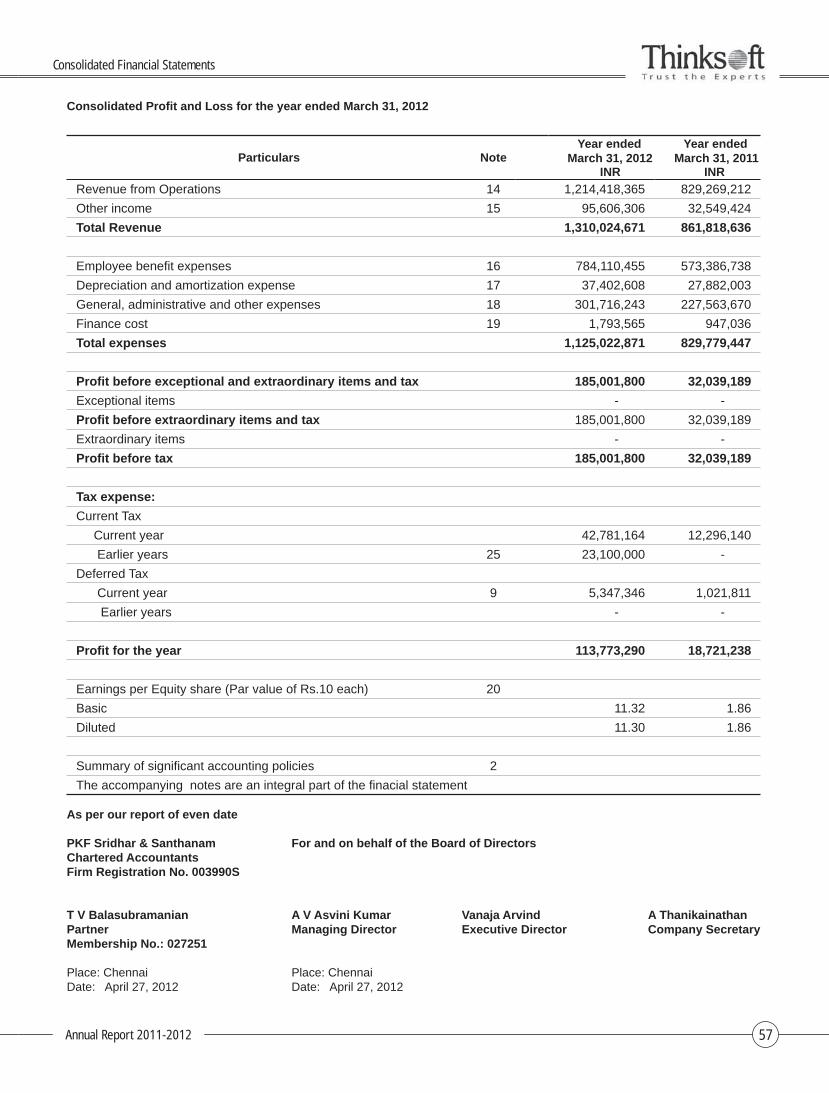
Annual Report 2011-2012 57
Consolidated Profi t and Loss for the year ended March 31, 2012
Particulars NoteYear ended
March 31, 2012Year ended
March 31, 2011INR INR
Revenue from Operations 14 1,214,418,365 829,269,212
Other income 15 95,606,306 32,549,424
Total Revenue 1,310,024,671 861,818,636
Employee benefi t expenses 16 784,110,455 573,386,738
Depreciation and amortization expense 17 37,402,608 27,882,003
General, administrative and other expenses 18 301,716,243 227,563,670
Finance cost 19 1,793,565 947,036
Total expenses 1,125,022,871 829,779,447
Profi t before exceptional and extraordinary items and tax 185,001,800 32,039,189
Exceptional items - -
Profi t before extraordinary items and tax 185,001,800 32,039,189
Extraordinary items - -
Profi t before tax 185,001,800 32,039,189
Tax expense:
Current Tax
Current year 42,781,164 12,296,140
Earlier years 25 23,100,000 -
Deferred Tax
Current year 9 5,347,346 1,021,811
Earlier years - -
Profi t for the year 113,773,290 18,721,238
Earnings per Equity share (Par value of Rs.10 each) 20
Basic 11.32 1.86
Diluted 11.30 1.86
Summary of signifi cant accounting policies 2
The accompanying notes are an integral part of the fi nacial statement
As per our report of even date
PKF Sridhar & Santhanam For and on behalf of the Board of DirectorsChartered AccountantsFirm Registration No. 003990S
T V Balasubramanian A V Asvini Kumar Vanaja Arvind A ThanikainathanPartner Managing Director Executive Director Company SecretaryMembership No.: 027251
Place: Chennai Place: ChennaiDate: April 27, 2012 Date: April 27, 2012
Consolidated Financial Statements
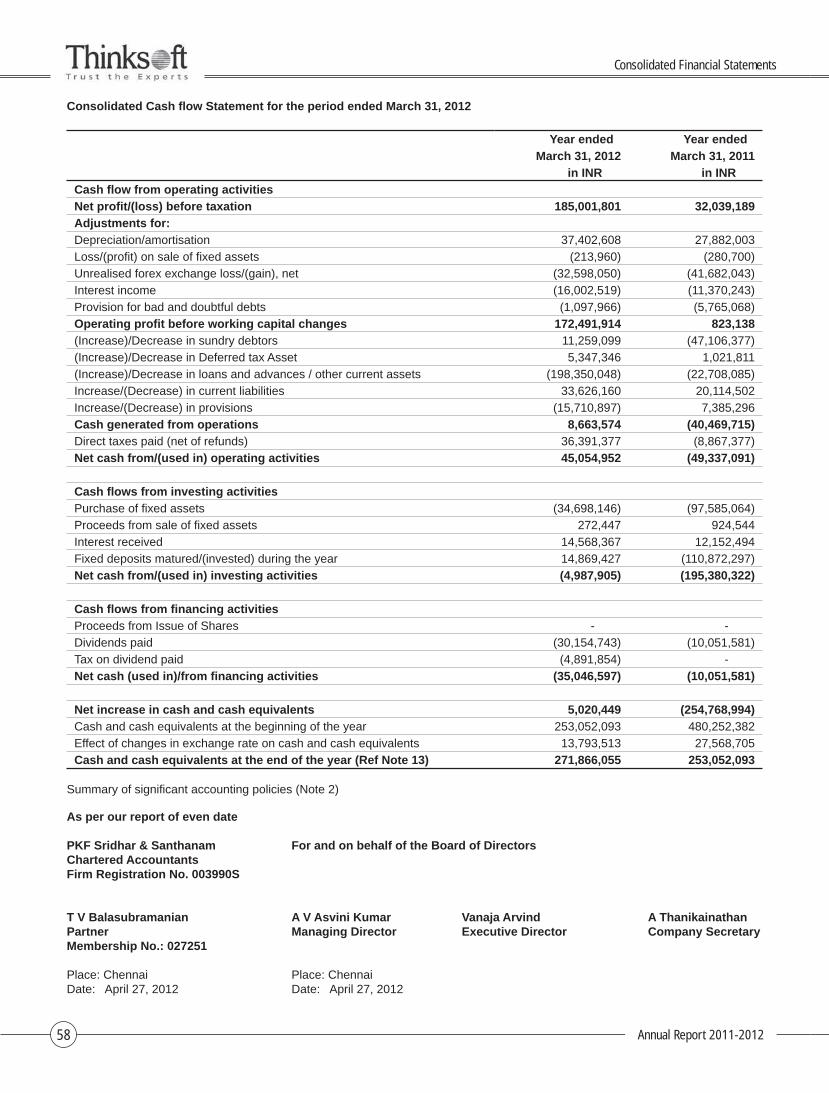
Annual Report 2011-201258
Consolidated Cash fl ow Statement for the period ended March 31, 2012
Year ended Year ended
March 31, 2012 March 31, 2011
in INR in INR
Cash fl ow from operating activities
Net profi t/(loss) before taxation 185,001,801 32,039,189
Adjustments for:
Depreciation/amortisation 37,402,608 27,882,003
Loss/(profi t) on sale of fi xed assets (213,960) (280,700)
Unrealised forex exchange loss/(gain), net (32,598,050) (41,682,043)
Interest income (16,002,519) (11,370,243)
Provision for bad and doubtful debts (1,097,966) (5,765,068)
Operating profi t before working capital changes 172,491,914 823,138
(Increase)/Decrease in sundry debtors 11,259,099 (47,106,377)
(Increase)/Decrease in Deferred tax Asset 5,347,346 1,021,811
(Increase)/Decrease in loans and advances / other current assets (198,350,048) (22,708,085)
Increase/(Decrease) in current liabilities 33,626,160 20,114,502
Increase/(Decrease) in provisions (15,710,897) 7,385,296
Cash generated from operations 8,663,574 (40,469,715)
Direct taxes paid (net of refunds) 36,391,377 (8,867,377)
Net cash from/(used in) operating activities 45,054,952 (49,337,091)
Cash fl ows from investing activities
Purchase of fi xed assets (34,698,146) (97,585,064)
Proceeds from sale of fi xed assets 272,447 924,544
Interest received 14,568,367 12,152,494
Fixed deposits matured/(invested) during the year 14,869,427 (110,872,297)
Net cash from/(used in) investing activities (4,987,905) (195,380,322)
Cash fl ows from fi nancing activities
Proceeds from Issue of Shares - -
Dividends paid (30,154,743) (10,051,581)
Tax on dividend paid (4,891,854) -
Net cash (used in)/from fi nancing activities (35,046,597) (10,051,581)
Net increase in cash and cash equivalents 5,020,449 (254,768,994)
Cash and cash equivalents at the beginning of the year 253,052,093 480,252,382
Effect of changes in exchange rate on cash and cash equivalents 13,793,513 27,568,705
Cash and cash equivalents at the end of the year (Ref Note 13) 271,866,055 253,052,093
Summary of signifi cant accounting policies (Note 2)
As per our report of even date
PKF Sridhar & Santhanam For and on behalf of the Board of DirectorsChartered AccountantsFirm Registration No. 003990S
T V Balasubramanian A V Asvini Kumar Vanaja Arvind A ThanikainathanPartner Managing Director Executive Director Company SecretaryMembership No.: 027251
Place: Chennai Place: ChennaiDate: April 27, 2012 Date: April 27, 2012
Consolidated Financial Statements
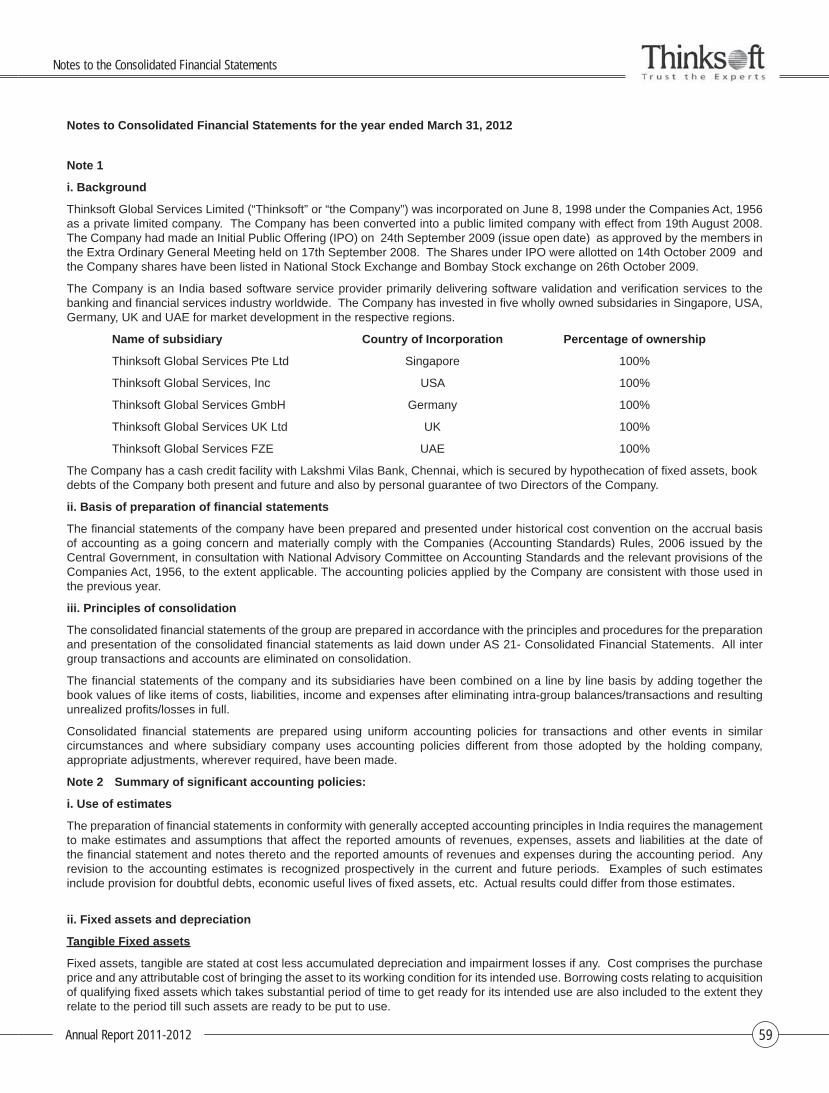
Annual Report 2011-2012 59
Notes to Consolidated Financial Statements for the year ended March 31, 2012
Note 1
i. Background
Thinksoft Global Services Limited (“Thinksoft” or “the Company”) was incorporated on June 8, 1998 under the Companies Act, 1956 as a private limited company. The Company has been converted into a public limited company with effect from 19th August 2008. The Company had made an Initial Public Offering (IPO) on 24th September 2009 (issue open date) as approved by the members in the Extra Ordinary General Meeting held on 17th September 2008. The Shares under IPO were allotted on 14th October 2009 and the Company shares have been listed in National Stock Exchange and Bombay Stock exchange on 26th October 2009.
The Company is an India based software service provider primarily delivering software validation and verifi cation services to the banking and fi nancial services industry worldwide. The Company has invested in fi ve wholly owned subsidaries in Singapore, USA, Germany, UK and UAE for market development in the respective regions.
Name of subsidiary Country of Incorporation Percentage of ownership
Thinksoft Global Services Pte Ltd Singapore 100%
Thinksoft Global Services, Inc USA 100%
Thinksoft Global Services GmbH Germany 100%
Thinksoft Global Services UK Ltd UK 100%
Thinksoft Global Services FZE UAE 100%
The Company has a cash credit facility with Lakshmi Vilas Bank, Chennai, which is secured by hypothecation of fi xed assets, book debts of the Company both present and future and also by personal guarantee of two Directors of the Company.
ii. Basis of preparation of fi nancial statements
The fi nancial statements of the company have been prepared and presented under historical cost convention on the accrual basis of accounting as a going concern and materially comply with the Companies (Accounting Standards) Rules, 2006 issued by the Central Government, in consultation with National Advisory Committee on Accounting Standards and the relevant provisions of the Companies Act, 1956, to the extent applicable. The accounting policies applied by the Company are consistent with those used in the previous year.
iii. Principles of consolidation
The consolidated fi nancial statements of the group are prepared in accordance with the principles and procedures for the preparation and presentation of the consolidated fi nancial statements as laid down under AS 21- Consolidated Financial Statements. All inter group transactions and accounts are eliminated on consolidation.
The fi nancial statements of the company and its subsidiaries have been combined on a line by line basis by adding together the book values of like items of costs, liabilities, income and expenses after eliminating intra-group balances/transactions and resulting unrealized profi ts/losses in full.
Consolidated fi nancial statements are prepared using uniform accounting policies for transactions and other events in similar circumstances and where subsidiary company uses accounting policies different from those adopted by the holding company, appropriate adjustments, wherever required, have been made.
Note 2 Summary of signifi cant accounting policies:
i. Use of estimates
The preparation of fi nancial statements in conformity with generally accepted accounting principles in India requires the management to make estimates and assumptions that affect the reported amounts of revenues, expenses, assets and liabilities at the date of the fi nancial statement and notes thereto and the reported amounts of revenues and expenses during the accounting period. Any revision to the accounting estimates is recognized prospectively in the current and future periods. Examples of such estimates include provision for doubtful debts, economic useful lives of fi xed assets, etc. Actual results could differ from those estimates.
ii. Fixed assets and depreciation
Tangible Fixed assets
Fixed assets, tangible are stated at cost less accumulated depreciation and impairment losses if any. Cost comprises the purchase price and any attributable cost of bringing the asset to its working condition for its intended use. Borrowing costs relating to acquisition of qualifying fi xed assets which takes substantial period of time to get ready for its intended use are also included to the extent they relate to the period till such assets are ready to be put to use.
Notes to the Consolidated Financial Statements
Annual Report 2011-201260
Depreciation
Depreciation is provided using the Straight Line Method as per the useful lives of the assets estimated by the management. The rates current applied as follows:
Asset description Percentage
Building 5%
Plant, machinery and equipment 33.33%
Computer equipment 33.33%
Furniture and fi ttings 33.33%
Offi ce equipment 33.33%
Vehicles 25%
Temporary partitions 100%
Leasehold Rights & Improvements Tenure of lease period or 10 years whichever is less
Fixed assets individually costing Rs 5,000 or less are entirely depreciated in the year of acquisition in case of companies incorporated in India.
Capital work-in-progress includes the cost of fi xed assets that are not ready for their intended use and advances paid to acquire the fi xed assets.
iii. Intangible assets
Intangible assets acquired separately are measured on initial recognition at cost. Following initial recognition, intangible assets are carried at cost less accumulated amortization and accumulated impairment losses, if any.
Intangible assets are amortized on a straight line basis over the estimated useful economic life. The amortization period and amortization method are reviewed at least at each fi nancial year end. If the expected useful life of the asset is signifi cantly different from previous estimates, the amortization period is changed accordingly. Gain or loss arising from derecognition of an intangible asset are measured as the difference between the net disposal proceeds and the carrying amount of the asset and are recognized in the statement of Profi t and loss, when the asset is derecognized.
A summary of amortization policies applied to the company's intangible assets is as below:
Asset description Percentage
Intangible assets – Computer software 33.33%
Intangible assets – Software tools 20%
iv. Impairment
a. The carrying amount of assets are reviewed at each balance sheet date to see if there is any indication of impairment based on internal/external factors. An impairment loss is recognized wherever the carrying amount of an asset exceeds its recoverable amount.
The recoverable amount is greater of the asset’s net selling price and value in use. In assessing value in use, the estimated future cash fl ows are discounted to their present value at the weighted average cost of capital.
b. After impairment, depreciation is provided on the revised carrying amount of the asset over its remaining useful life.
v. Investment
Investments that are readily realizable and intended to be held for not more than a year are classifi ed as current investments. All other investments are classifi ed as long-term investments. Current investments are carried at lower of cost and fair value determined on an individual investment basis. Long-term investments are carried at cost. However, any decline, other than temporary, in the value of the investments is charged to the profi t and loss account.
vi. Revenue recognition
Software service income
a. Revenue from software testing on software testing and allied services comprises revenue from time and material contracts and fi xed price contracts.
b. Revenue from time-and-materials contracts is recognized based on time/efforts spent on software tested and billed to clients as per the terms of specifi c contracts.
Notes to the Consolidated Financial Statements
Annual Report 2011-2012 61
c. On fi xed-price contracts, revenue is recognized on the proportionate completion method on the basis of the work completed.
d. Revenue from software testing includes reimbursement of expenses billed as per the terms of contracts.
Interest income
Interest on deployment of surplus funds is recognized using the time-proportion method.
Government grant
Government grant is recognized upon confi rmation of the entitlement of the grant.
vii. Retirement and other employee benefi ts
a. Retirement benefi ts in the form of Provident Fund / Social Security payments is defi ned contribution schemes and the contributions are charged to the Profi t and Loss Account of the year when the contributions are made to the concerned authorities. The Company has no further obligations under the plan beyond its periodic contributions.
b. Gratuity liability is a defi ned benefi t obligation and is provided for on the basis of an actuarial valuation made at the end of each fi nancial year under the projected unit credit method. Actuarial Gains/Losses comprise experience adjustments and the effect of changes in actuarial assumptions and are recognized immediately in Profi t & Loss Account as Income/Expense.
c. Appropriate provision has been made for the accrued and unaveiled leave entitlements which are short-term in nature.
viii. Taxation
Tax expense comprises current tax, deferred tax charge or credit and Minimum Alternate Tax credit. Current income tax is measured at the amount expected to be paid to the tax authorities in accordance with the relevant tax laws of each country. Deferred income taxes refl ect the impact of current year timing differences between taxable income and accounting income for the year and reversal of timing differences of earlier years.
Deferred tax is measured based on the tax rates and the tax laws enacted or substantively enacted at the balance sheet date. Deferred tax assets are recognised only to the extent that there is reasonable certainty that suffi cient future taxable income will be available against which such deferred tax assets can be realised. In situations where the company has unabsorbed depreciation or carry forward tax losses, deferred tax assets are recognised only if there is virtual certainty supported by convincing evidence that such deferred tax assets can be realised against future taxable profi ts.
MAT Credit is measured at the amounts of Minimum Alternative Tax payable for the year, which is adjustable against regular tax payable in subsequent years and is recognized to the extent considered probable of such adjustment.
ix. Earnings per share
Basic earnings per share are calculated by dividing the net profi t or loss for the period attributable to equity shareholders by the weighted average number of equity shares outstanding during the period.
For the purpose of calculating diluted earnings per share, the net profi t or loss for the period attributable to equity shareholders and the weighted average number of shares outstanding during the period are adjusted for the effects of all dilutive potential equity shares.
x. Foreign currency transactions and translations
a. Initial recognition
Foreign currency transactions are recorded in the reporting currency, by applying to the foreign currency amount the exchange rate between the reporting currency and the foreign currency at the date of the transaction. Income and expenditure transactions of the foreign operations are recognized at the rate on transaction date / average rate applicable for the year.
b. Conversion
Foreign currency monetary items are reported using the closing rate. Non-monetary items which are carried in terms of historical cost denominated in a foreign currency are reported using the exchange rate at the date of the transaction.
c. Exchange differences
Exchange differences arising on the settlement of monetary items at rates different from those at which they were initially recorded during the year, or reported in previous fi nancial statements, are recognised as income or as expenses in the year in which they arise. Exchange differences on account of conversion of foreign operations are also recognized as income or as expenses in the year in which they arise.
d. Forward contracts in foreign currency
The Company uses, to a limited extent, foreign exchange forward contracts to hedge its exposure to movements in foreign exchange rates. The company does not use the foreign currency forward contracts for trading or speculation purposes. Realized/unrealized gains and losses on forward contracts are accounted in the profi t and loss account for the period. Premium/Discount on forward contracts are accounted over the contract period.
Notes to the Consolidated Financial Statements
Annual Report 2011-201262
e. Transalation of integral and non-integral foreign operation
The company classifi es all its foreign operation as "integral foreign operations".
The fi nancial statements of an integral foreign operation are translated as if the transactions of the foreign operation have been those of the company itself.
xi. Provisions
A provision is recognised when an enterprise has a present obligation as a result of past event, it is probable that an outfl ow of resources will be required to settle the obligation, in respect of which a reliable estimate can be made. Provisions are not discounted to its present value and are determined based on best estimate required to settle the obligation at the balance sheet date. These are reviewed at each balance sheet date and adjusted to refl ect the current best estimates.
xii. Leases
Where the company is lessee
Leases where the lessor effectively retains substantially all the risks and benefi ts of ownership of the leased term, are classifi ed as operating leases. Operating lease payments are recognized as an expense in the Profi t and Loss account as per the terms of the agreements over the lease term.
Where the company is lessor
Operating lease receipts are recognized as Other Income in the Profi t and Loss account as per the terms of the agreements over the sub lease period
xiii. Employee stock compensation cost
Measurement and disclosure of the employee share-based payment plans is done in accordance with the Guidance Note on Accounting for Employee Share-based payments, issued by the Institute of Chartered Accountants of India. The Company measures compensation cost relating to employee stock options using the intrinsic value method. Compensation expense is amortized over the vesting period of the option on a straight line basis.
xiv. Segment information
Business segments
The group’s operations predominantly relate to software validation and verifi cation services relating to banking and fi nancial services industry and, accordingly, this is the only primary reportable segment.
Geographical segments
The segmental information is provided on geographical basis classifi ed as India and Rest of the World.
xv. Cash fl ows
Cash fl ows are reported using indirect method, whereby net profi t before tax is adjusted for the effects of transactions of a non-cash nature and any deferrals or accruals of past or future cash receipts or payments. The cash fl ows from regular revenue generating, investing and fi nancing activities are segregated.
Cash and cash equivalents: Cash and cash equivalents, in the statement of cash fl ow, comprise cash at bank and in hand and fi xed deposits with original maturity of maximum 90 days.
xvi. Contingent liabilities
A contingent liability is a possible obligation that arises due to past events whose existence will be confi rmed by the occurrence or non-occurrence of one or more uncertain future events beyond the control of the company or a present obligation that is not recognized because it is not probable that an outfl ow of resources will be required to settle the obligation. A contingent liability also arises in extremely rare cases where there is a liability that cannot be recognized because it cannot be measured reliably. The company does not recognize a contingent liability but discloses its existence in the fi nancial statements
Notes to the Consolidated Financial Statements
Annual Report 2011-2012 63
Note 3 Share capitalMarch 31, 2012 March 31, 2011
Authorised shares INR INR12,000,000 equity shares (31-Mar-2011: 12,000,000) of Rs.10 each 120,000,000 120,000,000
Issued, subscribed and fully paid up shares10,051,581 equity shares (31-Mar-2011: 10,051,581) of Rs.10 each 100,515,810 100,515,810
a. Reconciliation of the shares outstanding at the beginning and at the end of the reporting periodEquity shares
March 31, 2012 March 31, 2011Number INR Number INR
At the beginning of the period 10,051,581 100,515,810 10,051,581 100,515,810Issued during the period - - - -Outstanding at the end of the period 10,051,581 100,515,810 10,051,581 100,515,810
b. Terms/rights attached to equity sharesThe company has only one class of equity shares having a par value of Rs.10 per share. Each holder of equity share is entitled to one vote per share. The company declares and pays dividend in Indian rupees. The dividend proposed by Board of Directors is subject to approval of the shareholders in the ensuing Annual General Meeting
c. Aggregate number of bonus shares issued, shares issued for consideration other than cash and shares bought back during the period of fi ve years immediately preceding the reporting date:
March 31, 2012 March 31, 2011Equity shares alloted as fully paid bonus shares by capitalization of securities premium 870,156 870,156during the fi nancial year 2008-09
d. Details of shareholders holding more than 5% shares in the companyMarch 31, 2012 March 31, 2011
Number %holding Number %holdingA V Asvini Kumar 3,642,777 36.24% 3,642,777 36.24%Vanaja Arvind 1,097,762 10.92% 1,050,662 10.45%
As per records of the company, including its register of shareholders/members and other declarations received from shareholders regarding benefi cial interest, the above shareholding represents both legal and benefi cial ownership of shares
e. Shares reserved for issue under optionsFor details of shares reserved for issue under the employee stock option (ESOP) plan of the company, please refer Note 21
Note 4 Reserves and surplusMarch 31, 2012 March 31, 2011
Securities premium account INR INRClosing balance A 148,759,605 148,759,605
General ReserveBalance at the beginning of the year 30,071,695 30,071,695Add: Additions during the year 9,100,000 -Balance at the end of the year B 39,171,695 30,071,695
Surplus/(Defecit) in the statement of profi t and LossBalance as per last fi nancial statements 420,336,397 413,336,207Profi t for the year 113,773,290 18,721,238Less: AppropriationsInterim equity dividend (20,103,162) -Proposed fi nal equity dividend (30,154,743) (10,051,581)Tax on Interim Equity Dividend (3,222,388) -tax on proposed equity dividend (4,891,853) (1,669,467)Transfer to general reserve (9,100,000) -Total appropriations (67,472,146) (11,721,048)Net surplus in statement of Profi t and Loss C 466,637,541 420,336,397Total Reserves and Surplus (A+B+C) 654,568,841 599,167,697
Notes to the Consolidated Financial Statements
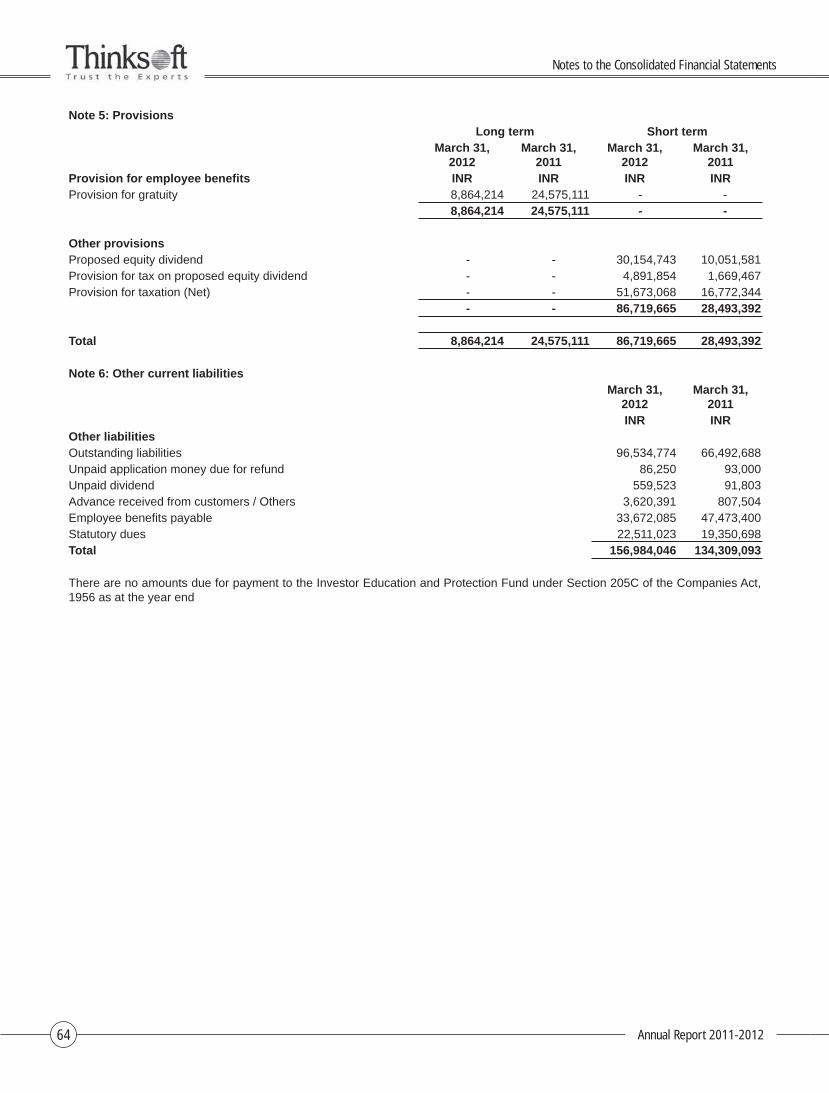
Annual Report 2011-201264
Note 5: ProvisionsLong term Short term
March 31, 2012
March 31, 2011
March 31, 2012
March 31, 2011
Provision for employee benefi ts INR INR INR INRProvision for gratuity 8,864,214 24,575,111 - -
8,864,214 24,575,111 - -
Other provisionsProposed equity dividend - - 30,154,743 10,051,581 Provision for tax on proposed equity dividend - - 4,891,854 1,669,467 Provision for taxation (Net) - - 51,673,068 16,772,344
- - 86,719,665 28,493,392
Total 8,864,214 24,575,111 86,719,665 28,493,392
Note 6: Other current liabilitiesMarch 31,
2012March 31,
2011INR INR
Other liabilitiesOutstanding liabilities 96,534,774 66,492,688 Unpaid application money due for refund 86,250 93,000 Unpaid dividend 559,523 91,803 Advance received from customers / Others 3,620,391 807,504 Employee benefi ts payable 33,672,085 47,473,400 Statutory dues 22,511,023 19,350,698 Total 156,984,046 134,309,093
There are no amounts due for payment to the Investor Education and Protection Fund under Section 205C of the Companies Act, 1956 as at the year end
Notes to the Consolidated Financial Statements
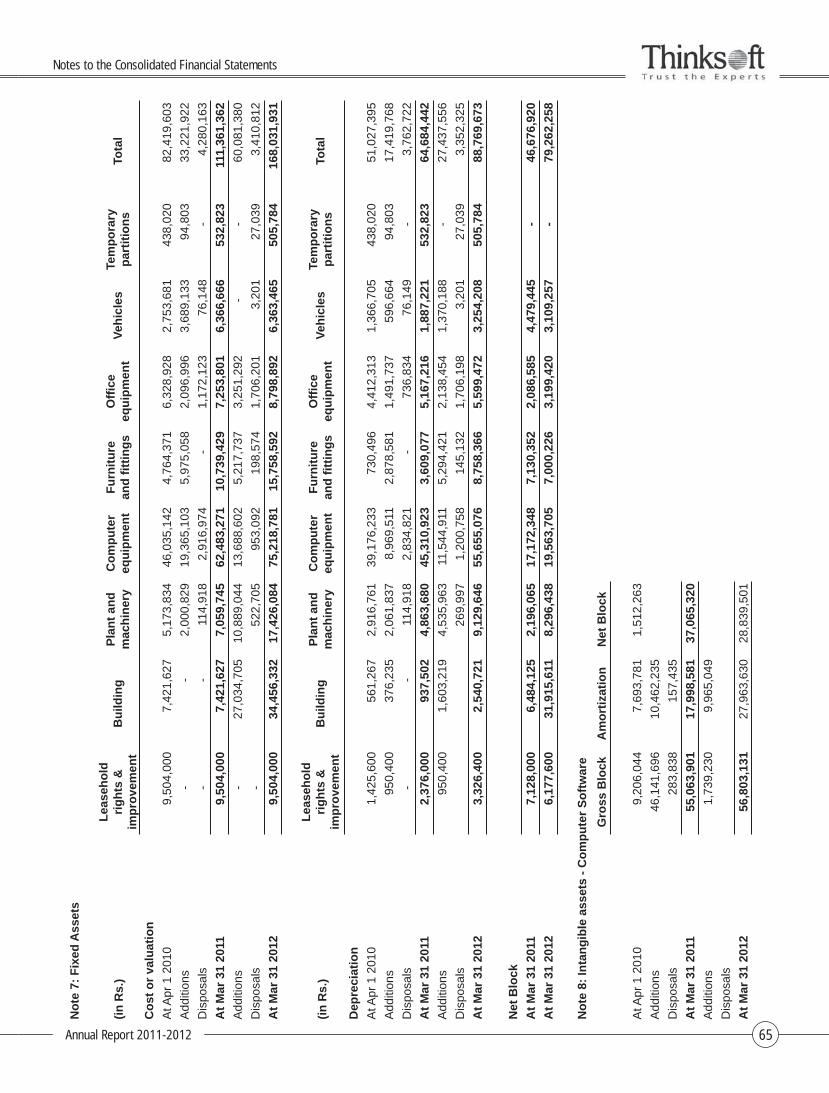
Annual Report 2011-2012 65
No
te 7
: F
ixed
Ass
ets
(in
Rs.
)L
ease
ho
ld
rig
hts
&
imp
rove
men
tB
uild
ing
Pla
nt
and
m
ach
iner
yC
om
pu
ter
equ
ipm
ent
Fu
rnit
ure
an
d fi
tti
ng
sO
ffi c
e eq
uip
men
tV
ehic
les
Tem
po
rary
p
arti
tio
ns
Tota
l
Co
st o
r va
luat
ion
At A
pr 1
201
09,
504,
000
7,42
1,62
75,
173,
834
46,0
35,1
424,
764,
371
6,32
8,92
82,
753,
681
438,
020
82,4
19,6
03
Add
ition
s-
-2,
000,
829
19,3
65,1
035,
975,
058
2,09
6,99
63,
689,
133
94,8
0333
,221
,922
Dis
posa
ls-
-11
4,91
82,
916,
974
-1,
172,
123
76,1
48-
4,28
0,16
3
At
Mar
31
2011
9,50
4,00
07,
421,
627
7,05
9,74
562
,483
,271
10,7
39,4
297,
253,
801
6,36
6,66
653
2,82
311
1,36
1,36
2
Add
ition
s-
27,0
34,7
0510
,889
,044
13,6
88,6
025,
217,
737
3,25
1,29
2-
-60
,081
,380
Dis
posa
ls-
522,
705
953,
092
198,
574
1,70
6,20
13,
201
27,0
393,
410,
812
At
Mar
31
2012
9,50
4,00
034
,456
,332
17,4
26,0
8475
,218
,781
15,7
58,5
928,
798,
892
6,36
3,46
550
5,78
416
8,03
1,93
1
(in
Rs.
)L
ease
ho
ld
rig
hts
&
imp
rove
men
tB
uild
ing
Pla
nt
and
m
ach
iner
yC
om
pu
ter
equ
ipm
ent
Fu
rnit
ure
an
d fi
tti
ng
sO
ffi c
e eq
uip
men
tV
ehic
les
Tem
po
rary
p
arti
tio
ns
Tota
l
Dep
reci
atio
n
At A
pr 1
201
01,
425,
600
561,
267
2,91
6,76
139
,176
,233
730,
496
4,41
2,31
31,
366,
705
438,
020
51,0
27,3
95
Add
ition
s95
0,40
037
6,23
52,
061,
837
8,96
9,51
12,
878,
581
1,49
1,73
759
6,66
494
,803
17,4
19,7
68
Dis
posa
ls-
-11
4,91
82,
834,
821
-73
6,83
476
,149
-3,
762,
722
At
Mar
31
2011
2,37
6,00
093
7,50
24,
863,
680
45,3
10,9
233,
609,
077
5,16
7,21
61,
887,
221
532,
823
64,6
84,4
42
Add
ition
s95
0,40
01,
603,
219
4,53
5,96
311
,544
,911
5,29
4,42
12,
138,
454
1,37
0,18
8-
27,4
37,5
56
Dis
posa
ls26
9,99
71,
200,
758
145,
132
1,70
6,19
83,
201
27,0
393,
352,
325
At
Mar
31
2012
3,32
6,40
02,
540,
721
9,12
9,64
655
,655
,076
8,75
8,36
65,
599,
472
3,25
4,20
850
5,78
488
,769
,673
Net
Blo
ck
At
Mar
31
2011
7,12
8,00
06,
484,
125
2,19
6,06
517
,172
,348
7,13
0,35
22,
086,
585
4,47
9,44
5-
46,6
76,9
20
At
Mar
31
2012
6,17
7,60
031
,915
,611
8,29
6,43
819
,563
,705
7,00
0,22
63,
199,
420
3,10
9,25
7-
79,2
62,2
58
No
te 8
: In
tan
gib
le a
sset
s -
Co
mp
ute
r S
oft
war
e
Gro
ss B
lock
Am
ort
izat
ion
Net
Blo
ck
At A
pr 1
201
09,
206,
044
7,69
3,78
11,
512,
263
Add
ition
s46
,141
,696
10,4
62,2
35
Dis
posa
ls28
3,83
815
7,43
5
At
Mar
31
2011
55,0
63,9
0117
,998
,581
37,0
65,3
20
Add
ition
s1,
739,
230
9,96
5,04
9
Dis
posa
ls
At
Mar
31
2012
56,8
03,1
3127
,963
,630
28,8
39,5
01
Notes to the Consolidated Financial Statements
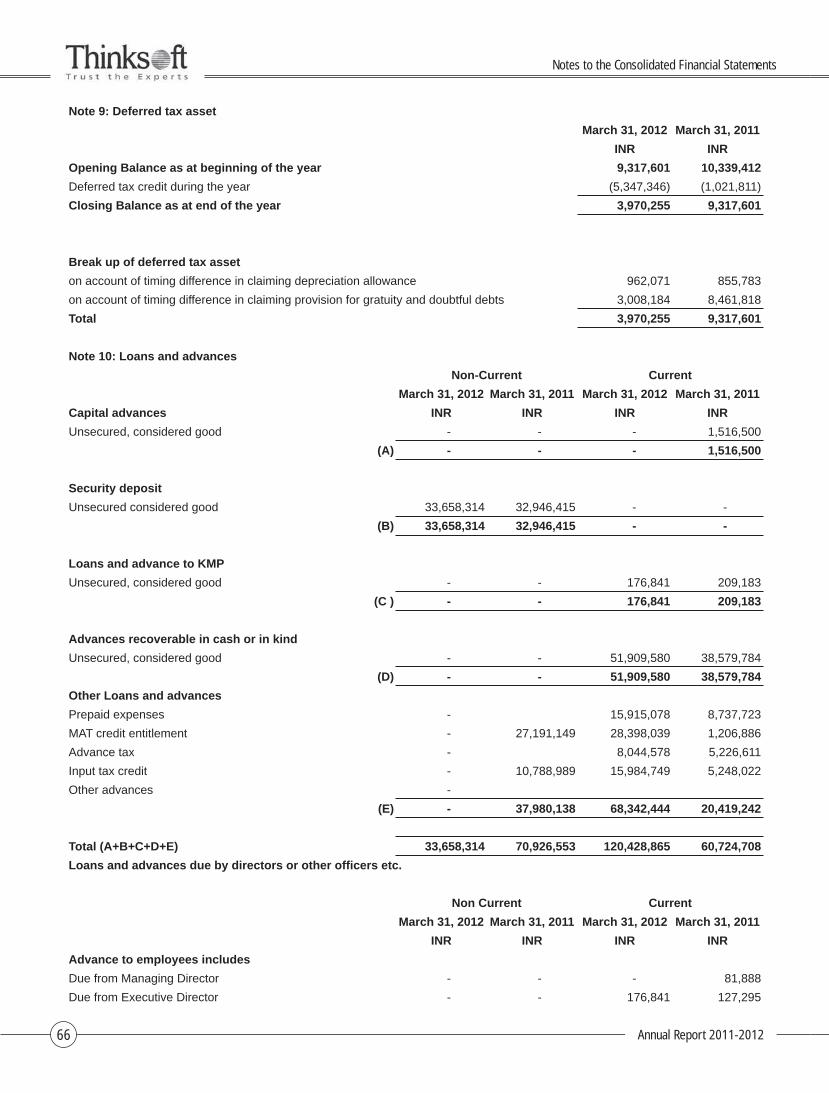
Annual Report 2011-201266
Note 9: Deferred tax asset
March 31, 2012 March 31, 2011
INR INR
Opening Balance as at beginning of the year 9,317,601 10,339,412
Deferred tax credit during the year (5,347,346) (1,021,811)
Closing Balance as at end of the year 3,970,255 9,317,601
Break up of deferred tax asset
on account of timing difference in claiming depreciation allowance 962,071 855,783
on account of timing difference in claiming provision for gratuity and doubtful debts 3,008,184 8,461,818
Total 3,970,255 9,317,601
Note 10: Loans and advances
Non-Current Current
March 31, 2012 March 31, 2011 March 31, 2012 March 31, 2011
Capital advances INR INR INR INR
Unsecured, considered good - - - 1,516,500
(A) - - - 1,516,500
Security deposit
Unsecured considered good 33,658,314 32,946,415 - -
(B) 33,658,314 32,946,415 - -
Loans and advance to KMP
Unsecured, considered good - - 176,841 209,183
(C ) - - 176,841 209,183
Advances recoverable in cash or in kind
Unsecured, considered good - - 51,909,580 38,579,784
(D) - - 51,909,580 38,579,784
Other Loans and advances
Prepaid expenses - 15,915,078 8,737,723
MAT credit entitlement - 27,191,149 28,398,039 1,206,886
Advance tax - 8,044,578 5,226,611
Input tax credit - 10,788,989 15,984,749 5,248,022
Other advances -
(E) - 37,980,138 68,342,444 20,419,242
Total (A+B+C+D+E) 33,658,314 70,926,553 120,428,865 60,724,708
Loans and advances due by directors or other offi cers etc.
Non Current Current
March 31, 2012 March 31, 2011 March 31, 2012 March 31, 2011
INR INR INR INR
Advance to employees includes
Due from Managing Director - - - 81,888
Due from Executive Director - - 176,841 127,295
Notes to the Consolidated Financial Statements
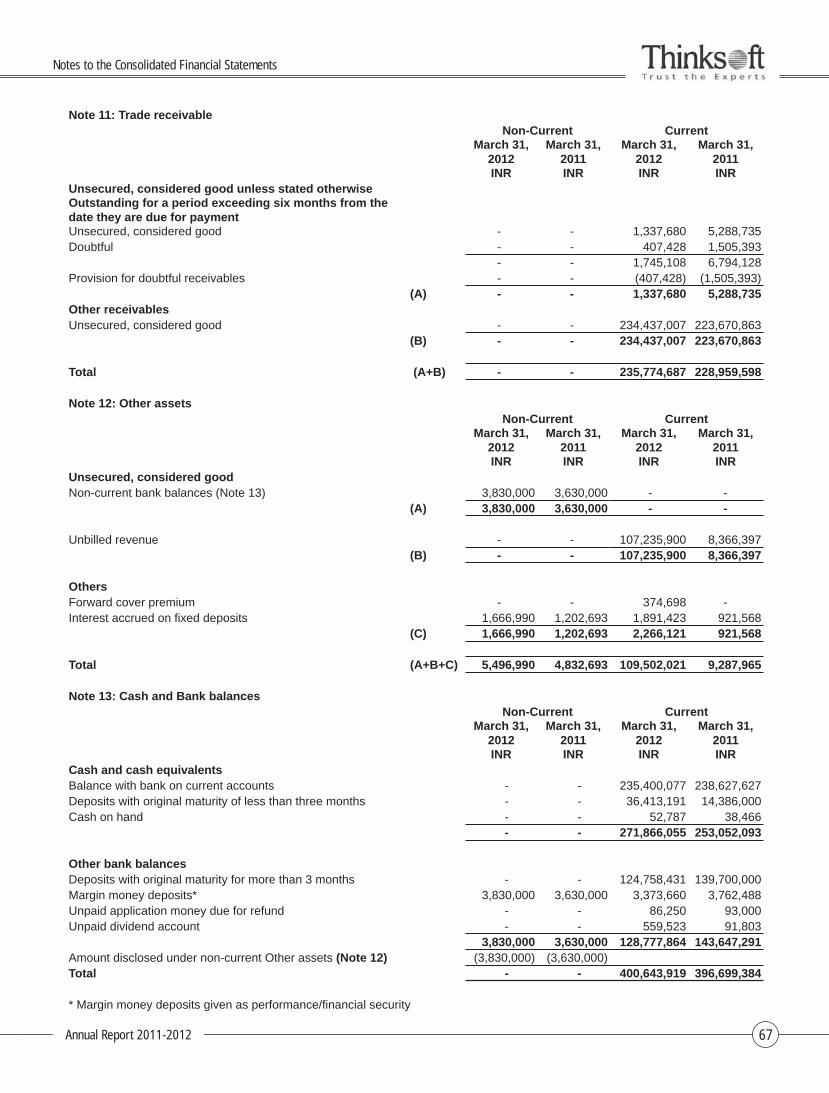
Annual Report 2011-2012 67
Note 11: Trade receivableNon-Current Current
March 31, 2012
March 31, 2011
March 31, 2012
March 31, 2011
INR INR INR INRUnsecured, considered good unless stated otherwiseOutstanding for a period exceeding six months from the date they are due for paymentUnsecured, considered good - - 1,337,680 5,288,735Doubtful - - 407,428 1,505,393
- - 1,745,108 6,794,128Provision for doubtful receivables - - (407,428) (1,505,393)
(A) - - 1,337,680 5,288,735Other receivablesUnsecured, considered good - - 234,437,007 223,670,863
(B) - - 234,437,007 223,670,863
Total (A+B) - - 235,774,687 228,959,598
Note 12: Other assetsNon-Current Current
March 31, 2012
March 31, 2011
March 31, 2012
March 31, 2011
INR INR INR INRUnsecured, considered goodNon-current bank balances (Note 13) 3,830,000 3,630,000 - -
(A) 3,830,000 3,630,000 - -
Unbilled revenue - - 107,235,900 8,366,397(B) - - 107,235,900 8,366,397
OthersForward cover premium - - 374,698 -Interest accrued on fi xed deposits 1,666,990 1,202,693 1,891,423 921,568
(C) 1,666,990 1,202,693 2,266,121 921,568
Total (A+B+C) 5,496,990 4,832,693 109,502,021 9,287,965
Note 13: Cash and Bank balancesNon-Current Current
March 31, 2012
March 31, 2011
March 31, 2012
March 31, 2011
INR INR INR INRCash and cash equivalentsBalance with bank on current accounts - - 235,400,077 238,627,627Deposits with original maturity of less than three months - - 36,413,191 14,386,000Cash on hand - - 52,787 38,466
- - 271,866,055 253,052,093
Other bank balancesDeposits with original maturity for more than 3 months - - 124,758,431 139,700,000Margin money deposits* 3,830,000 3,630,000 3,373,660 3,762,488Unpaid application money due for refund - - 86,250 93,000Unpaid dividend account - - 559,523 91,803
3,830,000 3,630,000 128,777,864 143,647,291Amount disclosed under non-current Other assets (Note 12) (3,830,000) (3,630,000)Total - - 400,643,919 396,699,384
* Margin money deposits given as performance/fi nancial security
Notes to the Consolidated Financial Statements
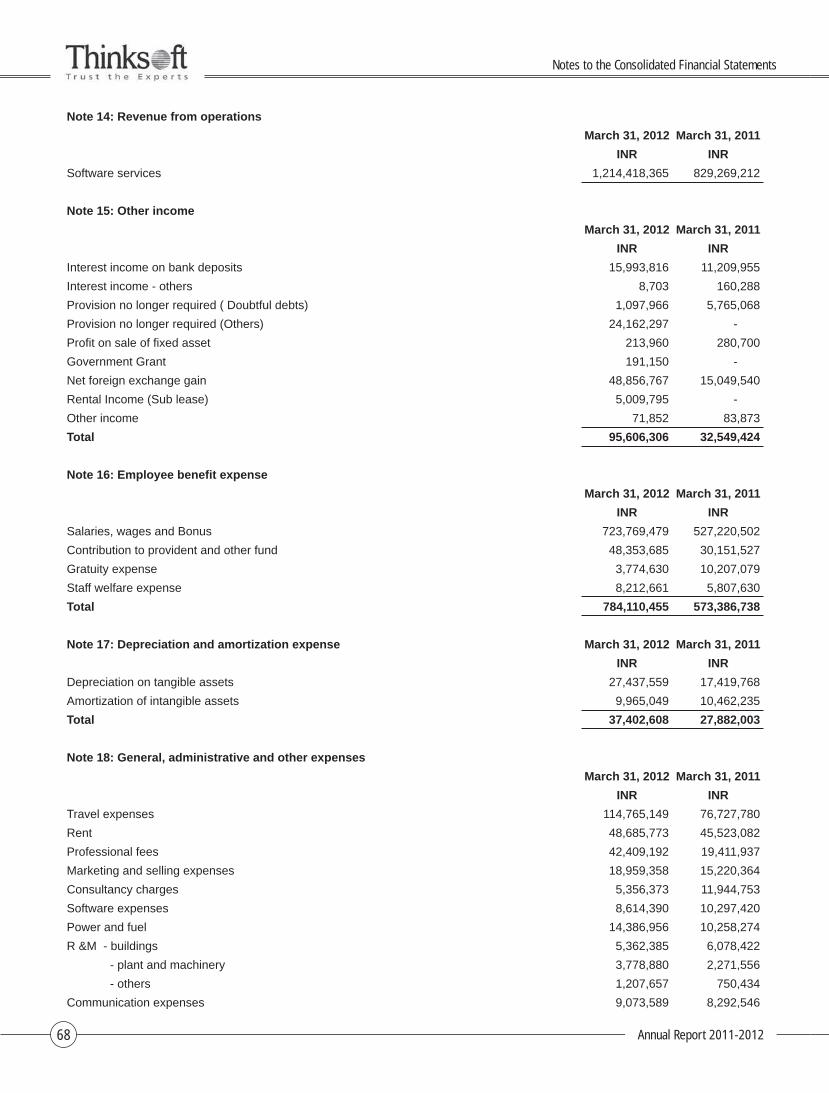
Annual Report 2011-201268
Note 14: Revenue from operations
March 31, 2012 March 31, 2011
INR INR
Software services 1,214,418,365 829,269,212
Note 15: Other income
March 31, 2012 March 31, 2011
INR INR
Interest income on bank deposits 15,993,816 11,209,955
Interest income - others 8,703 160,288
Provision no longer required ( Doubtful debts) 1,097,966 5,765,068
Provision no longer required (Others) 24,162,297 -
Profi t on sale of fi xed asset 213,960 280,700
Government Grant 191,150 -
Net foreign exchange gain 48,856,767 15,049,540
Rental Income (Sub lease) 5,009,795 -
Other income 71,852 83,873
Total 95,606,306 32,549,424
Note 16: Employee benefi t expense
March 31, 2012 March 31, 2011
INR INR
Salaries, wages and Bonus 723,769,479 527,220,502
Contribution to provident and other fund 48,353,685 30,151,527
Gratuity expense 3,774,630 10,207,079
Staff welfare expense 8,212,661 5,807,630
Total 784,110,455 573,386,738
Note 17: Depreciation and amortization expense March 31, 2012 March 31, 2011
INR INR
Depreciation on tangible assets 27,437,559 17,419,768
Amortization of intangible assets 9,965,049 10,462,235
Total 37,402,608 27,882,003
Note 18: General, administrative and other expenses
March 31, 2012 March 31, 2011
INR INR
Travel expenses 114,765,149 76,727,780
Rent 48,685,773 45,523,082
Professional fees 42,409,192 19,411,937
Marketing and selling expenses 18,959,358 15,220,364
Consultancy charges 5,356,373 11,944,753
Software expenses 8,614,390 10,297,420
Power and fuel 14,386,956 10,258,274
R &M - buildings 5,362,385 6,078,422
- plant and machinery 3,778,880 2,271,556
- others 1,207,657 750,434
Communication expenses 9,073,589 8,292,546
Notes to the Consolidated Financial Statements
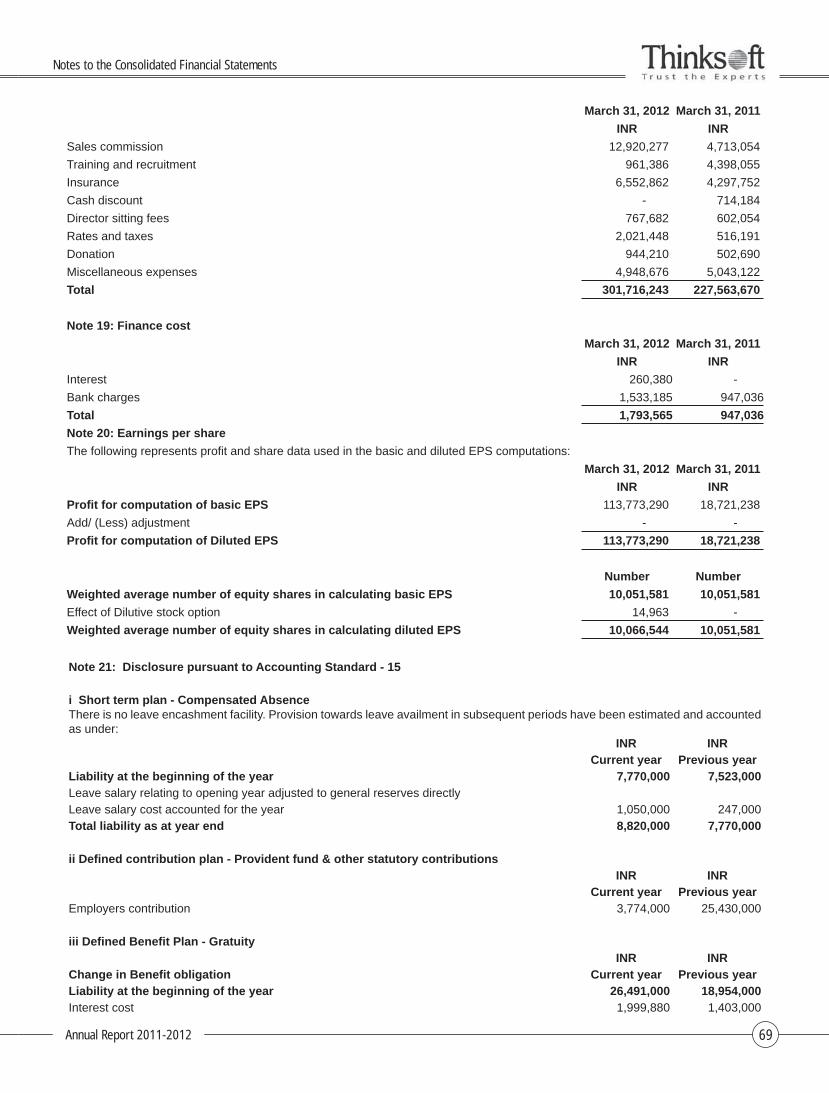
Annual Report 2011-2012 69
March 31, 2012 March 31, 2011
INR INR
Sales commission 12,920,277 4,713,054
Training and recruitment 961,386 4,398,055
Insurance 6,552,862 4,297,752
Cash discount - 714,184
Director sitting fees 767,682 602,054
Rates and taxes 2,021,448 516,191
Donation 944,210 502,690
Miscellaneous expenses 4,948,676 5,043,122
Total 301,716,243 227,563,670
Note 19: Finance cost
March 31, 2012 March 31, 2011
INR INR
Interest 260,380 -
Bank charges 1,533,185 947,036
Total 1,793,565 947,036
Note 20: Earnings per share
The following represents profi t and share data used in the basic and diluted EPS computations:
March 31, 2012 March 31, 2011
INR INR
Profi t for computation of basic EPS 113,773,290 18,721,238
Add/ (Less) adjustment - -
Profi t for computation of Diluted EPS 113,773,290 18,721,238
Number Number
Weighted average number of equity shares in calculating basic EPS 10,051,581 10,051,581
Effect of Dilutive stock option 14,963 -
Weighted average number of equity shares in calculating diluted EPS 10,066,544 10,051,581
Note 21: Disclosure pursuant to Accounting Standard - 15
i Short term plan - Compensated AbsenceThere is no leave encashment facility. Provision towards leave availment in subsequent periods have been estimated and accounted as under:
INR INRCurrent year Previous year
Liability at the beginning of the year 7,770,000 7,523,000 Leave salary relating to opening year adjusted to general reserves directlyLeave salary cost accounted for the year 1,050,000 247,000 Total liability as at year end 8,820,000 7,770,000
ii Defi ned contribution plan - Provident fund & other statutory contributionsINR INR
Current year Previous yearEmployers contribution 3,774,000 25,430,000
iii Defi ned Benefi t Plan - GratuityINR INR
Change in Benefi t obligation Current year Previous yearLiability at the beginning of the year 26,491,000 18,954,000Interest cost 1,999,880 1,403,000
Notes to the Consolidated Financial Statements
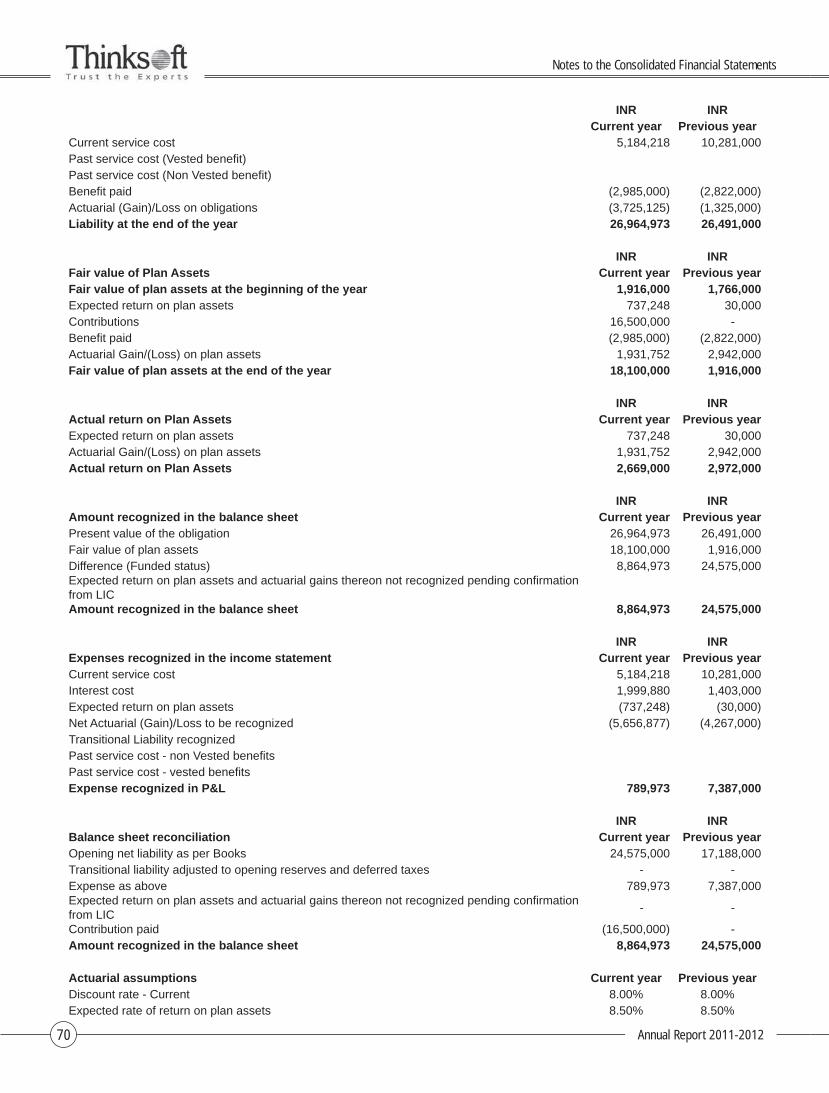
Annual Report 2011-201270
INR INRCurrent year Previous year
Current service cost 5,184,218 10,281,000Past service cost (Vested benefi t)Past service cost (Non Vested benefi t)Benefi t paid (2,985,000) (2,822,000)Actuarial (Gain)/Loss on obligations (3,725,125) (1,325,000)Liability at the end of the year 26,964,973 26,491,000
INR INRFair value of Plan Assets Current year Previous yearFair value of plan assets at the beginning of the year 1,916,000 1,766,000Expected return on plan assets 737,248 30,000Contributions 16,500,000 -Benefi t paid (2,985,000) (2,822,000)Actuarial Gain/(Loss) on plan assets 1,931,752 2,942,000Fair value of plan assets at the end of the year 18,100,000 1,916,000
INR INRActual return on Plan Assets Current year Previous yearExpected return on plan assets 737,248 30,000Actuarial Gain/(Loss) on plan assets 1,931,752 2,942,000Actual return on Plan Assets 2,669,000 2,972,000
INR INRAmount recognized in the balance sheet Current year Previous yearPresent value of the obligation 26,964,973 26,491,000 Fair value of plan assets 18,100,000 1,916,000 Difference (Funded status) 8,864,973 24,575,000 Expected return on plan assets and actuarial gains thereon not recognized pending confi rmation from LICAmount recognized in the balance sheet 8,864,973 24,575,000
INR INRExpenses recognized in the income statement Current year Previous yearCurrent service cost 5,184,218 10,281,000 Interest cost 1,999,880 1,403,000 Expected return on plan assets (737,248) (30,000)Net Actuarial (Gain)/Loss to be recognized (5,656,877) (4,267,000)Transitional Liability recognizedPast service cost - non Vested benefi tsPast service cost - vested benefi tsExpense recognized in P&L 789,973 7,387,000
INR INRBalance sheet reconciliation Current year Previous yearOpening net liability as per Books 24,575,000 17,188,000Transitional liability adjusted to opening reserves and deferred taxes - -Expense as above 789,973 7,387,000Expected return on plan assets and actuarial gains thereon not recognized pending confi rmation from LIC
- -
Contribution paid (16,500,000) -Amount recognized in the balance sheet 8,864,973 24,575,000
Actuarial assumptions Current year Previous yearDiscount rate - Current 8.00% 8.00%Expected rate of return on plan assets 8.50% 8.50%
Notes to the Consolidated Financial Statements
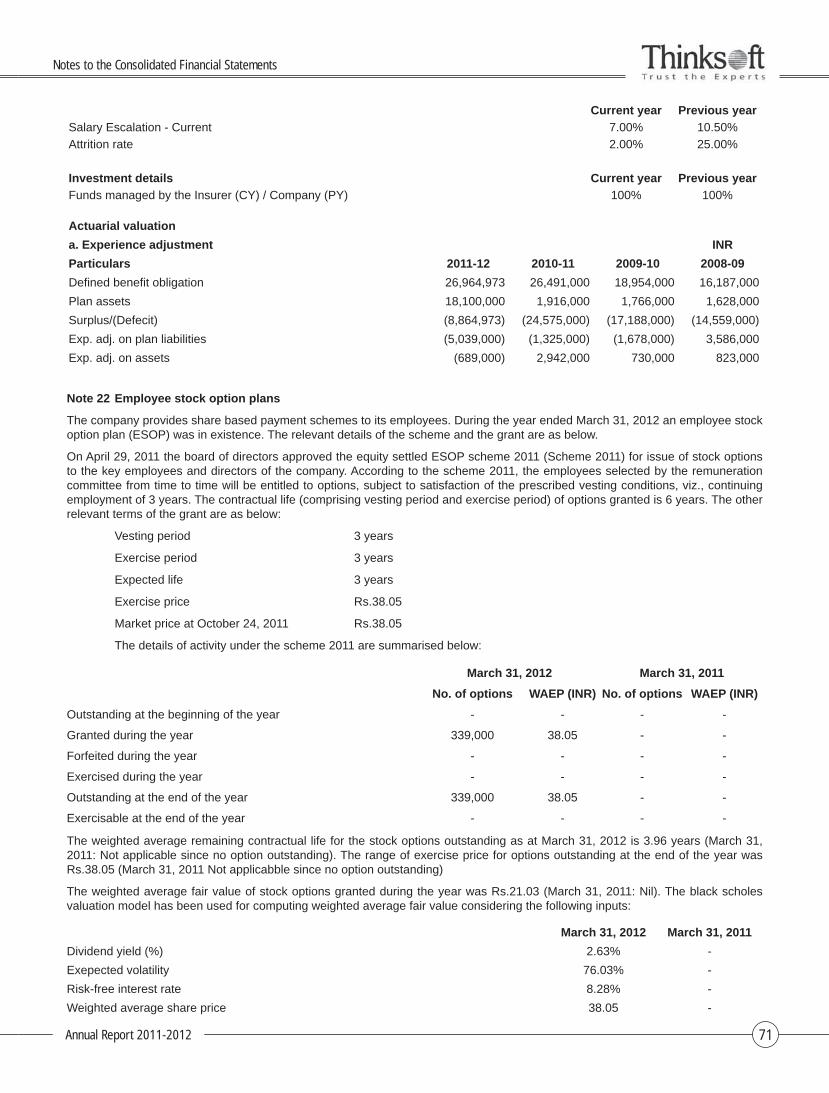
Annual Report 2011-2012 71
Current year Previous year
Salary Escalation - Current 7.00% 10.50%
Attrition rate 2.00% 25.00%
Investment details Current year Previous year
Funds managed by the Insurer (CY) / Company (PY) 100% 100%
Actuarial valuation
a. Experience adjustment INR
Particulars 2011-12 2010-11 2009-10 2008-09
Defi ned benefi t obligation 26,964,973 26,491,000 18,954,000 16,187,000
Plan assets 18,100,000 1,916,000 1,766,000 1,628,000
Surplus/(Defecit) (8,864,973) (24,575,000) (17,188,000) (14,559,000)
Exp. adj. on plan liabilities (5,039,000) (1,325,000) (1,678,000) 3,586,000
Exp. adj. on assets (689,000) 2,942,000 730,000 823,000
Note 22 Employee stock option plans
The company provides share based payment schemes to its employees. During the year ended March 31, 2012 an employee stock option plan (ESOP) was in existence. The relevant details of the scheme and the grant are as below.
On April 29, 2011 the board of directors approved the equity settled ESOP scheme 2011 (Scheme 2011) for issue of stock options to the key employees and directors of the company. According to the scheme 2011, the employees selected by the remuneration committee from time to time will be entitled to options, subject to satisfaction of the prescribed vesting conditions, viz., continuing employment of 3 years. The contractual life (comprising vesting period and exercise period) of options granted is 6 years. The other relevant terms of the grant are as below:
Vesting period 3 years
Exercise period 3 years
Expected life 3 years
Exercise price Rs.38.05
Market price at October 24, 2011 Rs.38.05
The details of activity under the scheme 2011 are summarised below:
March 31, 2012 March 31, 2011
No. of options WAEP (INR) No. of options WAEP (INR)
Outstanding at the beginning of the year - - - -
Granted during the year 339,000 38.05 - -
Forfeited during the year - - - -
Exercised during the year - - - -
Outstanding at the end of the year 339,000 38.05 - -
Exercisable at the end of the year - - - -
The weighted average remaining contractual life for the stock options outstanding as at March 31, 2012 is 3.96 years (March 31, 2011: Not applicable since no option outstanding). The range of exercise price for options outstanding at the end of the year was Rs.38.05 (March 31, 2011 Not applicabble since no option outstanding)
The weighted average fair value of stock options granted during the year was Rs.21.03 (March 31, 2011: Nil). The black scholes valuation model has been used for computing weighted average fair value considering the following inputs:
March 31, 2012 March 31, 2011
Dividend yield (%) 2.63% -
Exepected volatility 76.03% -
Risk-free interest rate 8.28% -
Weighted average share price 38.05 -
Notes to the Consolidated Financial Statements

Annual Report 2011-201272
March 31, 2012 March 31, 2011
Exercise price 38.05 -
Expected life of options granted in years 4.4 years -
* Not applicable since no ESOP were granted during the year
The expected life of the stock is based on historical data and current expectations and is not necessarily indicative of exercise patterns that may occur. The expected volatility refl ects the assumption that the histiorical volatility over a period similar to the life of options is indicative of future trends, which may also not necessarily be the actual outcome.
The company measures the cost of ESOP using intrinsic value method. Had the company used fair value model to determine compensation, its profi t after tax and earning per share would have changed to the amounts indicated below:
March 31, 2012 March 31, 2011INR INR
Profi t after tax as reported 113,773,290 -Add: ESOP cost using intrinsic value method - -Less: ESOP cost using fair value method 1,969,964 -Proforma profi t after tax 111,803,326 -
Earnings per shareBasic -As reported 11.32 -Proforma 11.12 -
-Diluted -As reported 11.30 -Proforma 11.11 -
Note 23 Operating lease: Company as lessee
The company has entered into commercial leases on certain buildings. These leases have an average life of between three and fi ve years with no renewal option included in the contracts. There are no restrictions placed upon the company by entering into these leases.
Future minimum rentals payable under non-cancellable operating lease are as follows:
March 31, 2012 March 31, 2011INR INR
Within one year 20,548,206 46,470,159 After one year but not more than fi ve years 3,276,000 42,235,402 More than fi ve years - -Total 23,824,206 88,705,561
Lease payments recognised in the P&L account 48,685,773 45,532,082
Note 24 Segment reporting
Sales revenue by geographical marketMarch 31, 2012 March 31, 2011
INR INRWithin India 93,144,755 53,883,429 Outside India 1,121,273,610 775,385,783 Total 1,214,418,365 829,269,212
Note 25 Commitments and contingenciesMarch 31, 2012 March 31, 2011
INR INREstimated amount of contracts remaining to be executed on capital account and not provided for (Net of advance)
- 16,242,586
Service tax related matters 7,218,676 7,218,676 Income tax related matters 51,238,609 5,339,067Counter guarantees issued to the bank for the bank guarantee obtained 27,763,951 14,680,000
Notes to the Consolidated Financial Statements
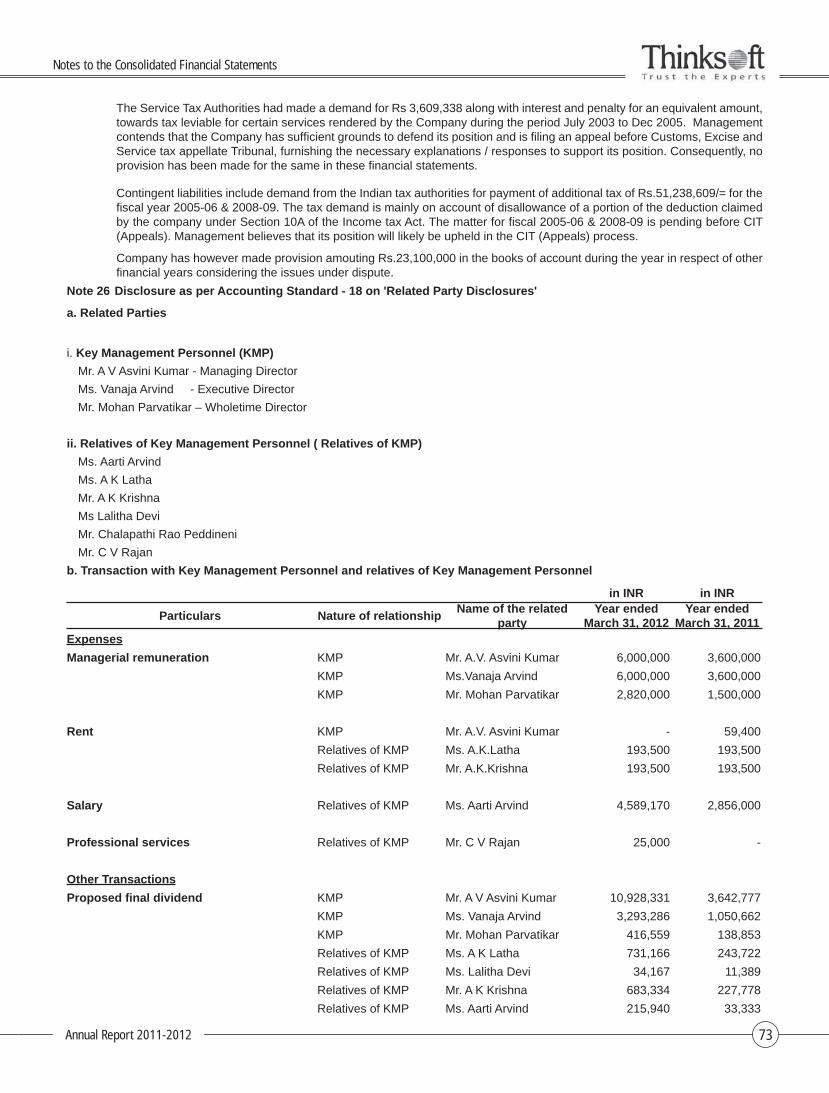
Annual Report 2011-2012 73
The Service Tax Authorities had made a demand for Rs 3,609,338 along with interest and penalty for an equivalent amount, towards tax leviable for certain services rendered by the Company during the period July 2003 to Dec 2005. Management contends that the Company has suffi cient grounds to defend its position and is fi ling an appeal before Customs, Excise and Service tax appellate Tribunal, furnishing the necessary explanations / responses to support its position. Consequently, no provision has been made for the same in these fi nancial statements.
Contingent liabilities include demand from the Indian tax authorities for payment of additional tax of Rs.51,238,609/= for the fi scal year 2005-06 & 2008-09. The tax demand is mainly on account of disallowance of a portion of the deduction claimed by the company under Section 10A of the Income tax Act. The matter for fi scal 2005-06 & 2008-09 is pending before CIT (Appeals). Management believes that its position will likely be upheld in the CIT (Appeals) process.
Company has however made provision amouting Rs.23,100,000 in the books of account during the year in respect of other fi nancial years considering the issues under dispute.
Note 26 Disclosure as per Accounting Standard - 18 on 'Related Party Disclosures'
a. Related Parties
i. Key Management Personnel (KMP)
Mr. A V Asvini Kumar - Managing Director
Ms. Vanaja Arvind - Executive Director
Mr. Mohan Parvatikar – Wholetime Director
ii. Relatives of Key Management Personnel ( Relatives of KMP)
Ms. Aarti Arvind
Ms. A K Latha
Mr. A K Krishna
Ms Lalitha Devi
Mr. Chalapathi Rao Peddineni
Mr. C V Rajan
b. Transaction with Key Management Personnel and relatives of Key Management Personnel
in INR in INR
Particulars Nature of relationshipName of the related
partyYear ended
March 31, 2012Year ended
March 31, 2011Expenses
Managerial remuneration KMP Mr. A.V. Asvini Kumar 6,000,000 3,600,000
KMP Ms.Vanaja Arvind 6,000,000 3,600,000
KMP Mr. Mohan Parvatikar 2,820,000 1,500,000
Rent KMP Mr. A.V. Asvini Kumar - 59,400
Relatives of KMP Ms. A.K.Latha 193,500 193,500
Relatives of KMP Mr. A.K.Krishna 193,500 193,500
Salary Relatives of KMP Ms. Aarti Arvind 4,589,170 2,856,000
Professional services Relatives of KMP Mr. C V Rajan 25,000 -
Other Transactions
Proposed fi nal dividend KMP Mr. A V Asvini Kumar 10,928,331 3,642,777
KMP Ms. Vanaja Arvind 3,293,286 1,050,662
KMP Mr. Mohan Parvatikar 416,559 138,853
Relatives of KMP Ms. A K Latha 731,166 243,722
Relatives of KMP Ms. Lalitha Devi 34,167 11,389
Relatives of KMP Mr. A K Krishna 683,334 227,778
Relatives of KMP Ms. Aarti Arvind 215,940 33,333
Notes to the Consolidated Financial Statements
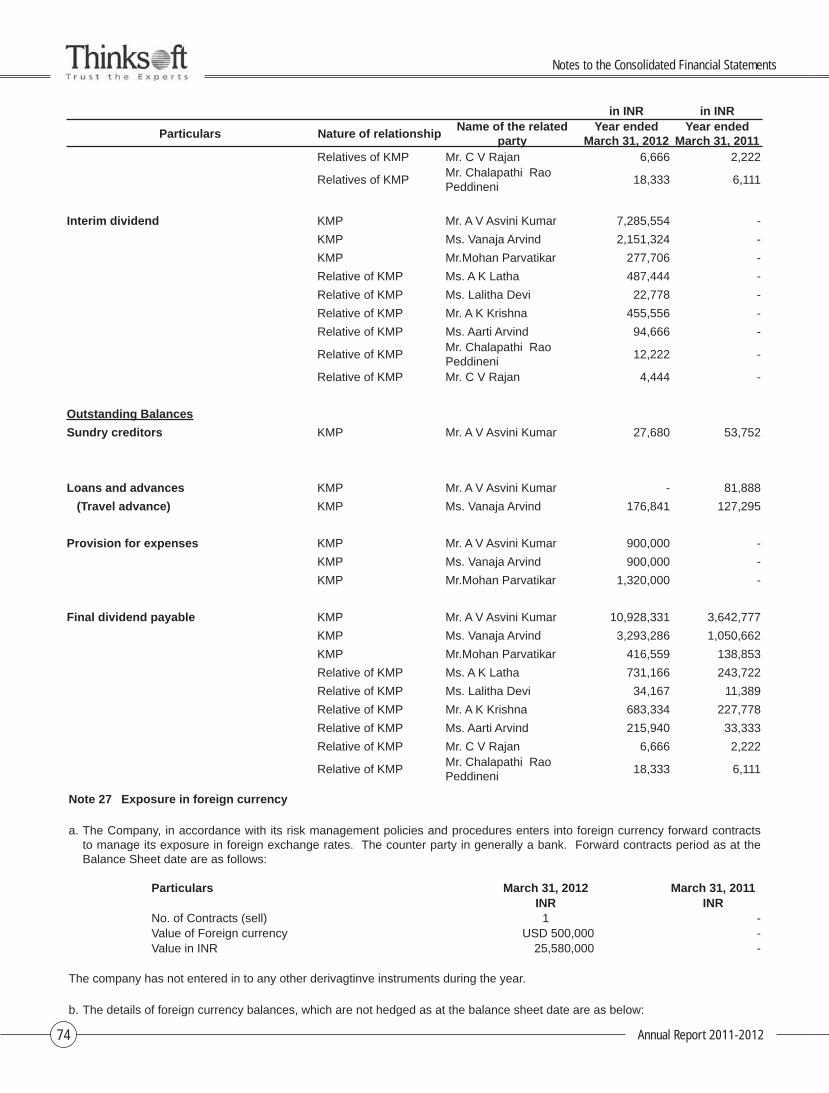
Annual Report 2011-201274
in INR in INR
Particulars Nature of relationshipName of the related
partyYear ended
March 31, 2012Year ended
March 31, 2011Relatives of KMP Mr. C V Rajan 6,666 2,222
Relatives of KMPMr. Chalapathi Rao Peddineni
18,333 6,111
Interim dividend KMP Mr. A V Asvini Kumar 7,285,554 -
KMP Ms. Vanaja Arvind 2,151,324 -
KMP Mr.Mohan Parvatikar 277,706 -
Relative of KMP Ms. A K Latha 487,444 -
Relative of KMP Ms. Lalitha Devi 22,778 -
Relative of KMP Mr. A K Krishna 455,556 -
Relative of KMP Ms. Aarti Arvind 94,666 -
Relative of KMPMr. Chalapathi Rao Peddineni
12,222 -
Relative of KMP Mr. C V Rajan 4,444 -
Outstanding Balances
Sundry creditors KMP Mr. A V Asvini Kumar 27,680 53,752
Loans and advances KMP Mr. A V Asvini Kumar - 81,888
(Travel advance) KMP Ms. Vanaja Arvind 176,841 127,295
Provision for expenses KMP Mr. A V Asvini Kumar 900,000 -
KMP Ms. Vanaja Arvind 900,000 -
KMP Mr.Mohan Parvatikar 1,320,000 -
Final dividend payable KMP Mr. A V Asvini Kumar 10,928,331 3,642,777
KMP Ms. Vanaja Arvind 3,293,286 1,050,662
KMP Mr.Mohan Parvatikar 416,559 138,853
Relative of KMP Ms. A K Latha 731,166 243,722
Relative of KMP Ms. Lalitha Devi 34,167 11,389
Relative of KMP Mr. A K Krishna 683,334 227,778
Relative of KMP Ms. Aarti Arvind 215,940 33,333
Relative of KMP Mr. C V Rajan 6,666 2,222
Relative of KMPMr. Chalapathi Rao Peddineni
18,333 6,111
Note 27 Exposure in foreign currency
a. The Company, in accordance with its risk management policies and procedures enters into foreign currency forward contracts to manage its exposure in foreign exchange rates. The counter party in generally a bank. Forward contracts period as at the Balance Sheet date are as follows:
Particulars March 31, 2012 March 31, 2011INR INR
No. of Contracts (sell) 1 -Value of Foreign currency USD 500,000 -Value in INR 25,580,000 -
The company has not entered in to any other derivagtinve instruments during the year.
b. The details of foreign currency balances, which are not hedged as at the balance sheet date are as below:
Notes to the Consolidated Financial Statements
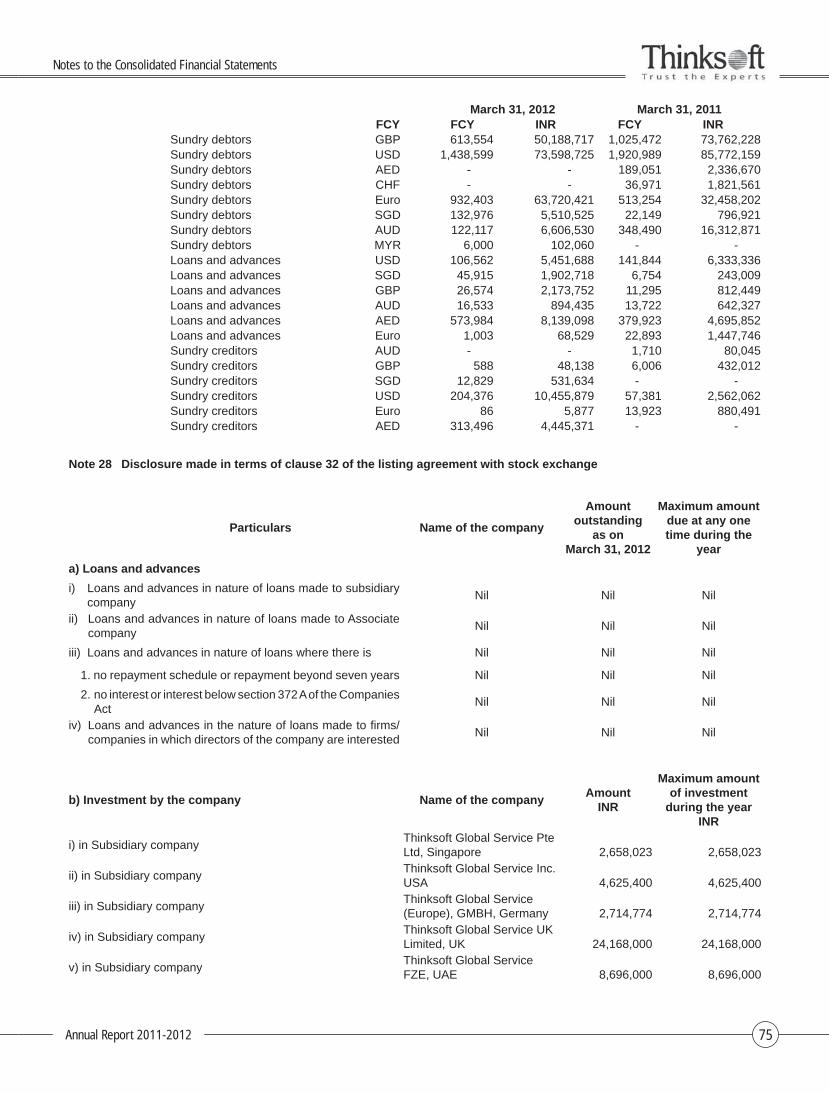
Annual Report 2011-2012 75
March 31, 2012 March 31, 2011FCY FCY INR FCY INR
Sundry debtors GBP 613,554 50,188,717 1,025,472 73,762,228Sundry debtors USD 1,438,599 73,598,725 1,920,989 85,772,159Sundry debtors AED - - 189,051 2,336,670Sundry debtors CHF - - 36,971 1,821,561Sundry debtors Euro 932,403 63,720,421 513,254 32,458,202Sundry debtors SGD 132,976 5,510,525 22,149 796,921Sundry debtors AUD 122,117 6,606,530 348,490 16,312,871Sundry debtors MYR 6,000 102,060 - -Loans and advances USD 106,562 5,451,688 141,844 6,333,336Loans and advances SGD 45,915 1,902,718 6,754 243,009Loans and advances GBP 26,574 2,173,752 11,295 812,449Loans and advances AUD 16,533 894,435 13,722 642,327Loans and advances AED 573,984 8,139,098 379,923 4,695,852Loans and advances Euro 1,003 68,529 22,893 1,447,746Sundry creditors AUD - - 1,710 80,045Sundry creditors GBP 588 48,138 6,006 432,012Sundry creditors SGD 12,829 531,634 - -Sundry creditors USD 204,376 10,455,879 57,381 2,562,062Sundry creditors Euro 86 5,877 13,923 880,491Sundry creditors AED 313,496 4,445,371 - -
Note 28 Disclosure made in terms of clause 32 of the listing agreement with stock exchange
Particulars Name of the company
Amount outstanding
as on March 31, 2012
Maximum amount due at any one time during the
year
a) Loans and advances
i) Loans and advances in nature of loans made to subsidiary company
Nil Nil Nil
ii) Loans and advances in nature of loans made to Associate company
Nil Nil Nil
iii) Loans and advances in nature of loans where there is Nil Nil Nil
1. no repayment schedule or repayment beyond seven years Nil Nil Nil
2. no interest or interest below section 372 A of the Companies Act
Nil Nil Nil
iv) Loans and advances in the nature of loans made to fi rms/companies in which directors of the company are interested
Nil Nil Nil
b) Investment by the company Name of the companyAmount
INR
Maximum amount of investment
during the year INR
i) in Subsidiary company Thinksoft Global Service Pte Ltd, Singapore
2,658,023
2,658,023
ii) in Subsidiary company Thinksoft Global Service Inc. USA
4,625,400
4,625,400
iii) in Subsidiary company Thinksoft Global Service (Europe), GMBH, Germany
2,714,774
2,714,774
iv) in Subsidiary company Thinksoft Global Service UK Limited, UK
24,168,000
24,168,000
v) in Subsidiary company Thinksoft Global Service FZE, UAE
8,696,000
8,696,000
Notes to the Consolidated Financial Statements
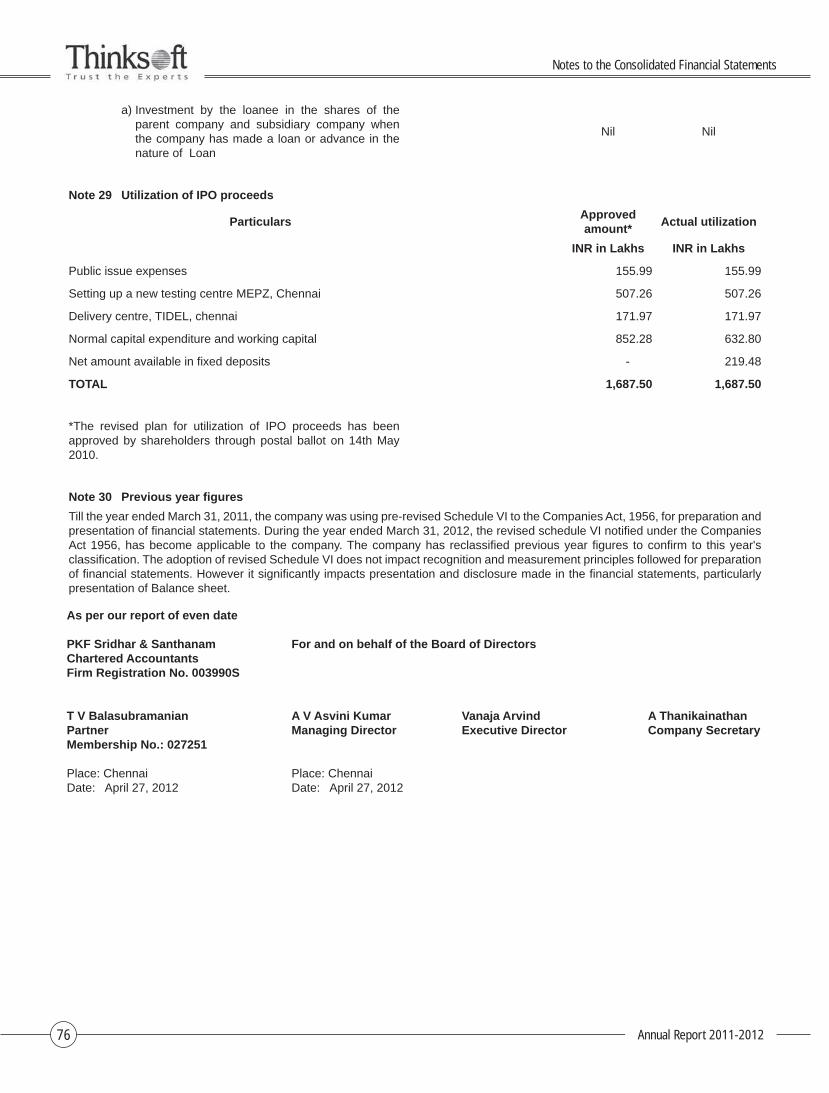
Annual Report 2011-201276
a) Investment by the loanee in the shares of the parent company and subsidiary company when the company has made a loan or advance in the nature of Loan
Nil Nil
Note 29 Utilization of IPO proceeds
ParticularsApproved amount*
Actual utilization
INR in Lakhs INR in Lakhs
Public issue expenses 155.99 155.99
Setting up a new testing centre MEPZ, Chennai 507.26 507.26
Delivery centre, TIDEL, chennai 171.97 171.97
Normal capital expenditure and working capital 852.28 632.80
Net amount available in fi xed deposits - 219.48
TOTAL 1,687.50 1,687.50
*The revised plan for utilization of IPO proceeds has been approved by shareholders through postal ballot on 14th May 2010.
Note 30 Previous year fi gures
Till the year ended March 31, 2011, the company was using pre-revised Schedule VI to the Companies Act, 1956, for preparation and presentation of fi nancial statements. During the year ended March 31, 2012, the revised schedule VI notifi ed under the Companies Act 1956, has become applicable to the company. The company has reclassifi ed previous year fi gures to confi rm to this year's classifi cation. The adoption of revised Schedule VI does not impact recognition and measurement principles followed for preparation of fi nancial statements. However it signifi cantly impacts presentation and disclosure made in the fi nancial statements, particularly presentation of Balance sheet.
As per our report of even date
PKF Sridhar & Santhanam For and on behalf of the Board of DirectorsChartered AccountantsFirm Registration No. 003990S
T V Balasubramanian A V Asvini Kumar Vanaja Arvind A ThanikainathanPartner Managing Director Executive Director Company SecretaryMembership No.: 027251
Place: Chennai Place: ChennaiDate: April 27, 2012 Date: April 27, 2012
Notes to the Consolidated Financial Statements

This page intentionally left blank

This page intentionally left blank
THINKSOFT GLOBAL SERVICES LIMITEDRegd. Off. : Type II, Unit 5, Dr.VSI Estate, Thiruvanmiyur, Chennai – 600041, Tamil Nadu
PROXY FORM
I/We ________________________ of ________________________being a Member/Member(s) of Thinksoft Global Services
Limited appoint _________________________ or failing him/her ______________________of ___________________ or
failing him/her ________________of ______________________as my/our proxy to attend and vote for me/us and on my/
our behalf at the Fourteenth Annual General Meeting of the company to be held on Wednesday, 25th July 2012 at 3.30 p.m.
at The Music Academy, Kasturi Srinivasan Hall (Mini Hall), No.168, T.T.K. Road, Royapettah, Chennai-600014 and at any
adjournment thereof.
Folio No……………….......…….. DP ID No…………........……… Client ID……………........…………
No. of Shares………….......................
Signed this .................................... day of ...................................., 2012
Notes: 1. The Proxy form should be signed by the member across the stamp. 2. A member intending to appoint a Proxy should complete the Proxy form and deposit it at the Company’s Registered
offi ce, at least 48 hours before the time for holding the aforesaid meeting. 3. Members, who hold shares in Demat form to quote their Demat Account no. and Depository Participant (D.P.) Id No.
Please affi xRe.1/-
revenue stamp and sign across
THINKSOFT GLOBAL SERVICES LIMITEDRegd. Off. : Type II, Unit 5, Dr.VSI Estate, Thiruvanmiyur, Chennai – 600041, Tamil Nadu
ATTENDANCE SLIP(To be presented at the entrance)
14TH ANNUAL GENERAL MEETING ON WEDNESDAY, 25th JULY 2012 AT 3.30 P.M.at The Music Academy, Kasturi Srinivasan Hall (Mini Hall), No.168, T.T.K. Road, Royapettah, Chennai-600014
Folio No……….........………..………….. DP ID No……………….........………........ Client ID…………….......…...……………....
I/We hereby record my/our presence at the 14th Annual General Meeting of the members of the Company held on Wednesday,
25th July 2012 at 3.30 p.m. at The Music Academy, Kasturi Srinivasan Hall (Mini Hall), No.168, T.T.K. Road, Royapettah,
Chennai-600014
Name of the Member/Proxy holder:
Signature of Shareholder/proxy