Embed Size (px)
Citation preview
Corporate Governance, Firm Size and Liquidity Constraints: A Dynamic Analysis
Bersant HOBDARI
Copenhagen Business School Porcelanshaven 24 A, 2000, Frederiksberg, Denmark
E-mail: [email protected]
Derek JONES Hamilton College
Clinton, NY 13323, United States
Niels MYGIND Copenhagen Business School
Porcelanshaven 24 A, 2000, Frederiksberg, Denmark
Abstract:
A rich panel data for a large and representative sample of firms is used to estimate the
sensitivity of access to capital to differing ownership structures and firm sizes. The
investment behaviour of firms is examined in a dynamic setting in the presence of adjustment
costs, liquidity constraints and imperfect competition. The empirical work is based on the
derivation of Euler equations in the presence of symmetric and quadratic adjustment costs
and both debt and equity constraints. Our GMM estimates confirm the importance of
financial factors in determining investment rates and suggest that firms owned by insiders,
especially non-managerial employees, are more prone to be liquidity constrained than are
others. Among the other results, somewhat surprisingly, small firms display lower degree of
financing constraints that large firms.
Keywords: Corporate Investment, Corporate Governance, Firm Size, Liquidity Constraints, GMM Estimates.
JEL Classification: C33, D21, D92, E22, G32, J54, P34.
1
1.Introduction
The importance of liquidity constraints in firms’ real investment decisions has long been the
focus of economic research (Stein, 2003). The literature finds that access to capital is not
unlimited and is determined by the degree of informational asymmetries and agency costs.
The large empirical work has focused on identifying indicators at the firm level, such as
dividend payout ratios, bond rating, degree of bank affiliation, membership in financial
conglomerates, firm size, firm age and/or governance structure, that approximate for the
severity of capital market imperfections and explain the observed differences in investment
behavior across firms1. In this paper, by using a rich panel data for a large and representative
sample of Estonian firms, we investigate firms’ investment behavior during the period 1993
through 1999 and make several contributions.
Fundamentally, we provide new empirical evidence on a topic that has attracted the attention
of theorists but for which there is little empirical evidence --the impact on investment of
alternative governance structures and firm sizes. The study contributes to the literature in
several ways. First, it accounts for the effect of governance structures in investment decisions
through their role in mitigating or exacerbating informational asymmetries and agency costs.
Second, it assesses the long-run viability of certain ownership forms. This is an important
issue in light of the continuing debate in the literature on the efficiency of various ownership
forms resulting from the extensive privatization process in almost all former centralized
economies. Third, in a more general context, it contributes to the debate in the corporate
governance literature on the effect of governance through ownership. Fourth, it sheds light
on the size-financial constraints relationship. Finally, the results of the analysis allow us to
answer questions such as how pervasive across firms and over time are liquidity constraints
in Estonia and the extent to which different governance structures and firm sizes are likely to
2
be financially constrained. These answers, in turn, provide directions where public policy
should focus in terms of designing effective policies to promote successful restructuring on
the part of firms.
The remainder of the paper is structured as follows. In the following section we outline the
testable hypotheses and present the specifications to be estimated in the empirical work. The
next two sections focus on sample construction and data description, and the estimating
strategy and presentation of empirical results. In the last section we conclude with further
discussion and some policy recommendations.
2. Governance Structures, Firm Size, Investment and Liquidity Constraints
The extensive literature on investment behavior has not much to say on the role of different
governance structures on investment decisions, with the reason being that most of the
empirical studies are based on samples of large publicly traded firms where ownership is
vastly dispersed and managers enjoy high degrees of discretion2. In the process of
decentralizing their economies, in many countries the movement away from state ownership
has led to the emergence of diverse forms of ownership. On many instances insiders3 have
majority or dominant ownership or, even when they possess minority ownership, enjoy
substantial degrees of control. The existence of such diverse governance structures allows
testing of various theoretical propositions regarding the efficiency of different owners in
capital allocation and in monitoring management.
Various arguments point to firms under insider ownership facing higher likelihood of being
more constrained in raising capital than others. The literature on employee ownership stresses
3
a host of factors such as member’ wealth position, their time horizon, risk attitudes, goal
structure and the structure of property rights4 in the firm that make employee owners prefer
taking the residual in the form of higher income rather than investing it in the firm (Dow,
2003). This preference, along with employee owners’ potential aversion to accepting new
members, leads to potential goal conflict between insiders and outside providers of both
equity and debt capital. In addition, the fact that most of these firms are small and not listed
in the stock markets exacerbates informational asymmetries and makes access to desired
capital more difficult. The net effect of the interaction of these factors could be that outside
investors might be reluctant to invest in employee owned firms or, when they do invest, the
risk premium they charge is substantially higher than the market one. Overall, disincentives
to invest internally and barriers to raise capital externally might lead to employee owned
firms under-investing.
The literature on managerial ownership stresses that an initial increase in managerial
ownership is beneficial because it better aligns the interests of managers and shareholders
and, consequently, lowers managerial discretion. However, at high levels, managerial
ownership5 is associated with entrenchment and divergence of interests between managers
and shareholders. In transition economies, managerial shareholding in post-privatization
ownership configurations, in the form of majority, dominant or minority shareholders, is
substantial. The possibility of entrenchment and subsequent rent seeking or asset stripping
behavior on the part of managers has been an argument against managerial ownership
(Djankov, 1999). The likelihood of this happening depends to a large extent on managers’
outside career opportunities and portfolio diversification, the way they obtain shares and the
efficiency of market for corporate control. When outside career opportunities do not exists
and managers have invested most of their human and financial capital in the firm, they will
4
try to hold on to their equity share by following policies, including investments, which will
increase their job security. Furthermore, manager’s behavior might be fundamentally
different depending on whether he/she acquires the firm through a managerial buy-out
(MBO) or gets it either for free or in the framework of a voucher-funded privatization. If the
ownership is gained through one of the latter two cases, the manager might perceive it as a
windfall gain and consume it faster than earned income (Djankov, 1999). On the contrary,
MBOs serve as screening mechanisms that allow only highly qualified, growth oriented
managers to become owners6. Finally, markets for corporate control serve as disciplining
devices for managers. Yet, in an environment of high uncertainty and infantile capital
markets, informational asymmetries might lead to adverse selection problems in the market
for corporate control (Earle and Estrin, 1996). Overall these arguments imply that, in a
transition economy, ownership concentration in the hands of managers is likely to lead to
managers’ entrenchment, which in itself exacerbates informational asymmetries and leads to
more expensive external finance and less investment.
When managers control, but do not own, the firm agency problems arise. Under these
circumstances the identity of outside owners is crucial with respect to their ability to curb
managerial discretion. We distinguish in between three types of outside owners: the state,
foreign owners and domestic outside owners. The efficiency of each owner in disciplining
management results in differences in managerial discretion across firms, which, in turn,
results in differences in access to capital and investment behaviour. High degrees of
managerial discretion mean that managers could engage in unprofitable investment projects
or even in projects with negative present value that are valuable to them and lead to their
entrenchment. Moreover, high managerial discretion accentuates the degree of asymmetric
information and makes external finance more expensive. The outcome is reliance on internal
5
funds, which results in investment being highly sensitive to the availability of internal
finance.
When a firm is under foreign ownership managerial discretion is kept at minimal levels
because foreign owners are expected to possess enough experience and resources to engage
in effective monitoring. Further, given that foreign owners have access to their parent
company’ resources and/or to international capital markets, investment behavior of foreign
owned firms is not expected to be constrained by the availability of either internal or external
finance. When ownership is concentrated in the hands of domestic outsider investors the
degree of effective monitoring depends on the identity, number and size of investors.
Depending on the combination of these factors several scenarios might arise. For instance, if
ownership is concentrated in the hands of a few big institutional investors with experience,
resources and low coordination costs, then effective monitoring will arise. Alternatively, if
ownership is dispersed in the hands of a large number of small investors, then managers are
more likely to enjoy substantial discretion in pursuing their objectives. Finally, when
ownership is concentrated in the hands of the state7 managers will possess virtual control of
the firm and enjoy high degrees of discretion in pursuing their interests.
A further determinant of investment behavior and access to capital is firm size. Smaller firms
exhibit larger degrees of information asymmetry between insiders and outsiders. In addition,
these firms also face higher costs in issuing new equity. If these factors are significant then
small firms are expected to rely more on internal funds. Agency costs may also be greater for
these firms, raising further the cost of external financing. Overall, small firms are expected to
rely more on internal funds than larger firms. The results of previous empirical work find
partial support to this proposition, with Fazzari, Hubbard and Petersen (1988) and Hooks
6
(2003) finding that financing constraints decrease with firm size. Yet, Devereux and
Schiantarelli (1990), Athey and Laumas (1994) and Vogt (1994) find that large firms display
higher investment-cash flow sensitivities.
In testing the propositions firm’s investment behavior is modeled in a dynamic setting in the
presence of adjustment costs, liquidity constraints and imperfect competition, similar to
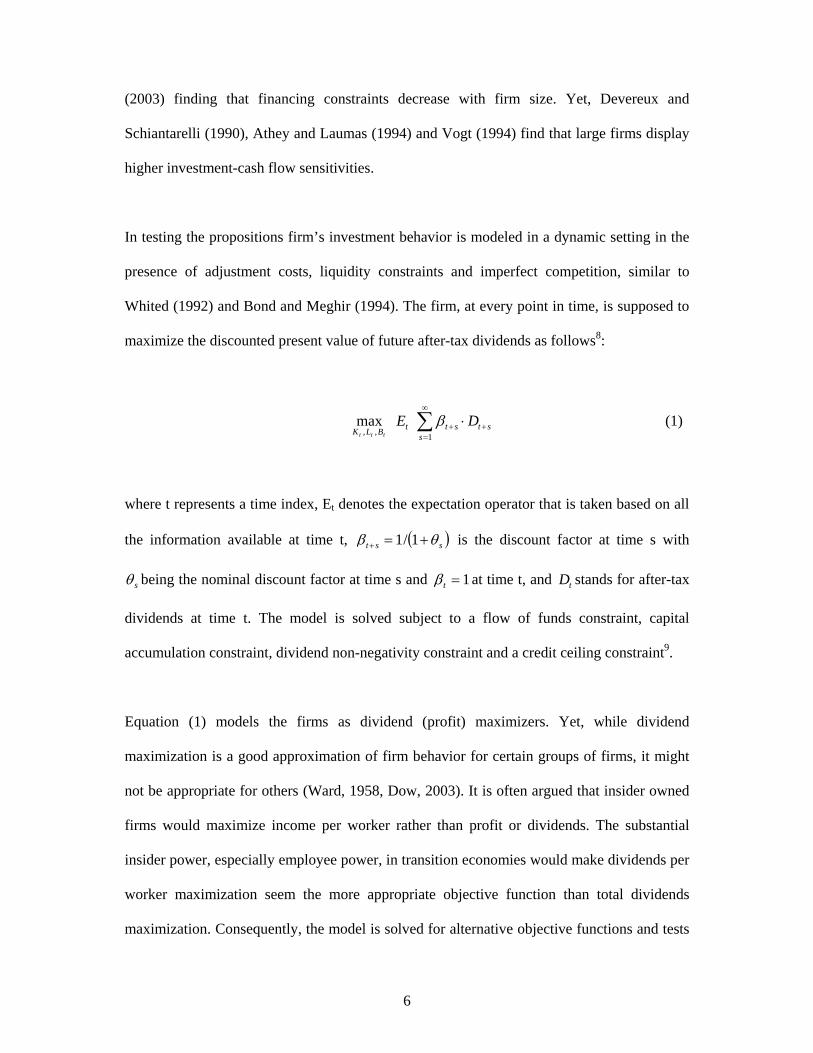
Whited (1992) and Bond and Meghir (1994). The firm, at every point in time, is supposed to
maximize the discounted present value of future after-tax dividends as follows8:
ttt BLK ,,max tE ∑
∞
=++ ⋅
1sstst Dβ (1)
where t represents a time index, Et denotes the expectation operator that is taken based on all
the information available at time t, ( )sst θβ +=+ 1/1 is the discount factor at time s with
sθ being the nominal discount factor at time s and 1=tβ at time t, and tD stands for after-tax
dividends at time t. The model is solved subject to a flow of funds constraint, capital
accumulation constraint, dividend non-negativity constraint and a credit ceiling constraint9.
Equation (1) models the firms as dividend (profit) maximizers. Yet, while dividend
maximization is a good approximation of firm behavior for certain groups of firms, it might
not be appropriate for others (Ward, 1958, Dow, 2003). It is often argued that insider owned
firms would maximize income per worker rather than profit or dividends. The substantial
insider power, especially employee power, in transition economies would make dividends per
worker maximization seem the more appropriate objective function than total dividends
maximization. Consequently, the model is solved for alternative objective functions and tests
7
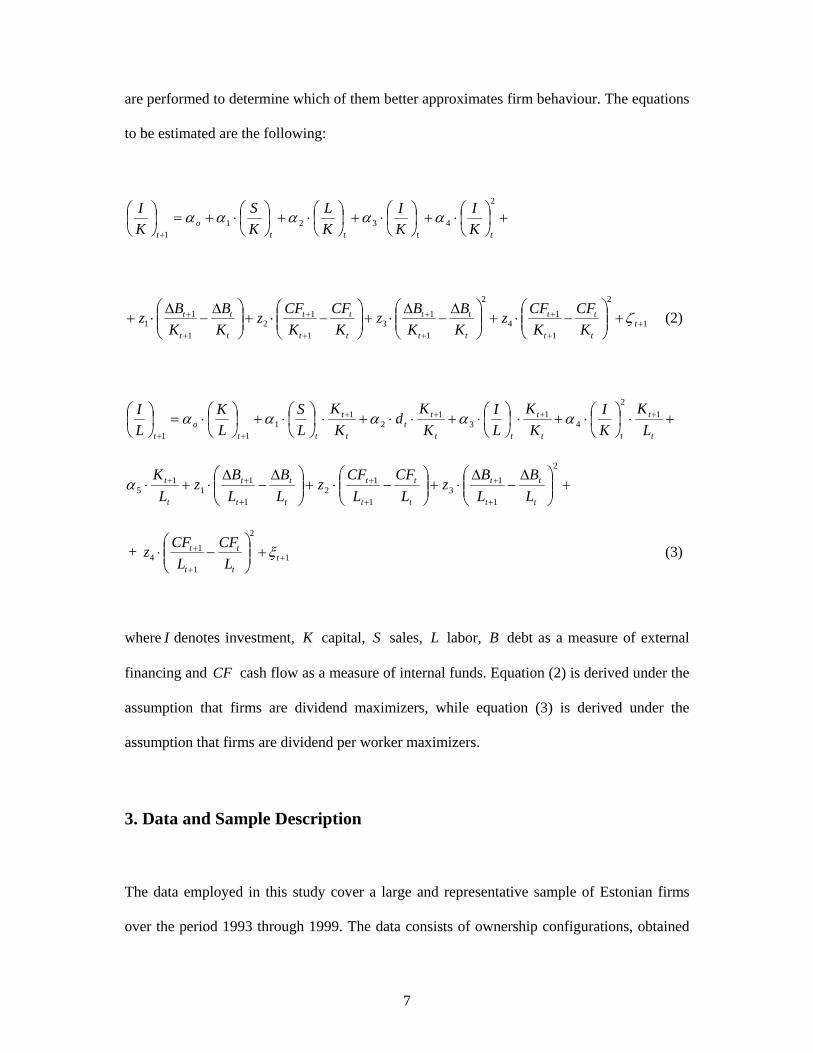
are performed to determine which of them better approximates firm behaviour. The equations
to be estimated are the following:
+⎟⎠⎞
⎜⎝⎛⋅+⎟
⎠⎞
⎜⎝⎛⋅+⎟
⎠⎞
⎜⎝⎛⋅+⎟
⎠⎞
⎜⎝⎛⋅+=⎟
⎠⎞
⎜⎝⎛
+
2
43211 tttt
ot K
IKI
KL
KS
KI ααααα
1
2
1
14
2
1
13
1
12
1
11 +
+
+
+
+
+
+
+
+ +⎟⎟⎠
⎞⎜⎜⎝
⎛−⋅+⎟⎟
⎠
⎞⎜⎜⎝
⎛ Δ−
Δ⋅+⎟⎟
⎠
⎞⎜⎜⎝
⎛−⋅+⎟⎟
⎠
⎞⎜⎜⎝
⎛ Δ−
Δ⋅+ t
t
t
t
t
t
t
t
t
t
t
t
t
t
t
t
t
KCF
KCFz
KB
KBz
KCF
KCFz
KB
KBz ζ (2)
+⋅⎟⎠⎞
⎜⎝⎛⋅+⋅⎟
⎠⎞
⎜⎝⎛⋅+⋅⋅+⋅⎟
⎠⎞
⎜⎝⎛⋅+⎟
⎠⎞
⎜⎝⎛⋅=⎟
⎠⎞
⎜⎝⎛ ++++
++ t
t
tt
t
tt
tt
t
t
tto
t LK
KI
KK
LI
KK
dK
KLS
LK
LI 1
2
41
31
21
111
ααααα
+⎟⎟⎠
⎞⎜⎜⎝
⎛ Δ−
Δ⋅+⎟⎟
⎠
⎞⎜⎜⎝
⎛−⋅+⎟⎟
⎠
⎞⎜⎜⎝
⎛ Δ−
Δ⋅+⋅
+
+
+
+
+
++
2
1
13
1
12
1
11
15
t
t
t
t
t
t
t
t
t
t
t
t
t
t
LB
LB
zL
CFL
CFz
LB
LB
zL
Kα
+ 1
2
1
14 +
+
+ +⎟⎟⎠
⎞⎜⎜⎝
⎛−⋅ t
t
t
t
t
LCF
LCFz ξ (3)
where I denotes investment, K capital, S sales, L labor, B debt as a measure of external
financing and CF cash flow as a measure of internal funds. Equation (2) is derived under the
assumption that firms are dividend maximizers, while equation (3) is derived under the
assumption that firms are dividend per worker maximizers.
3. Data and Sample Description
The data employed in this study cover a large and representative sample of Estonian firms
over the period 1993 through 1999. The data consists of ownership configurations, obtained
8
from surveys, and of financial information from firm’s balance sheet and income statements
reported to the Estonian Statistical Office. The firms included in the survey scheme are
selected as a stratified random sample based on size and industrial affiliation. For the
purposes of the analysis firms have to be classified into ownership groups. Yet, this
classification is not a trivial pursuit. Often firms are misclassified among ownership groups
because important information contained in ownership variables is overlooked (Filer and
Hanousek, 2002). In the Appendix we present a detailed account of how ownership structures
are defined. After correcting for data inconsistencies10, the merging of ownership and
financial information creates an unbalanced panel of 3294 observations to be used in the
analysis.
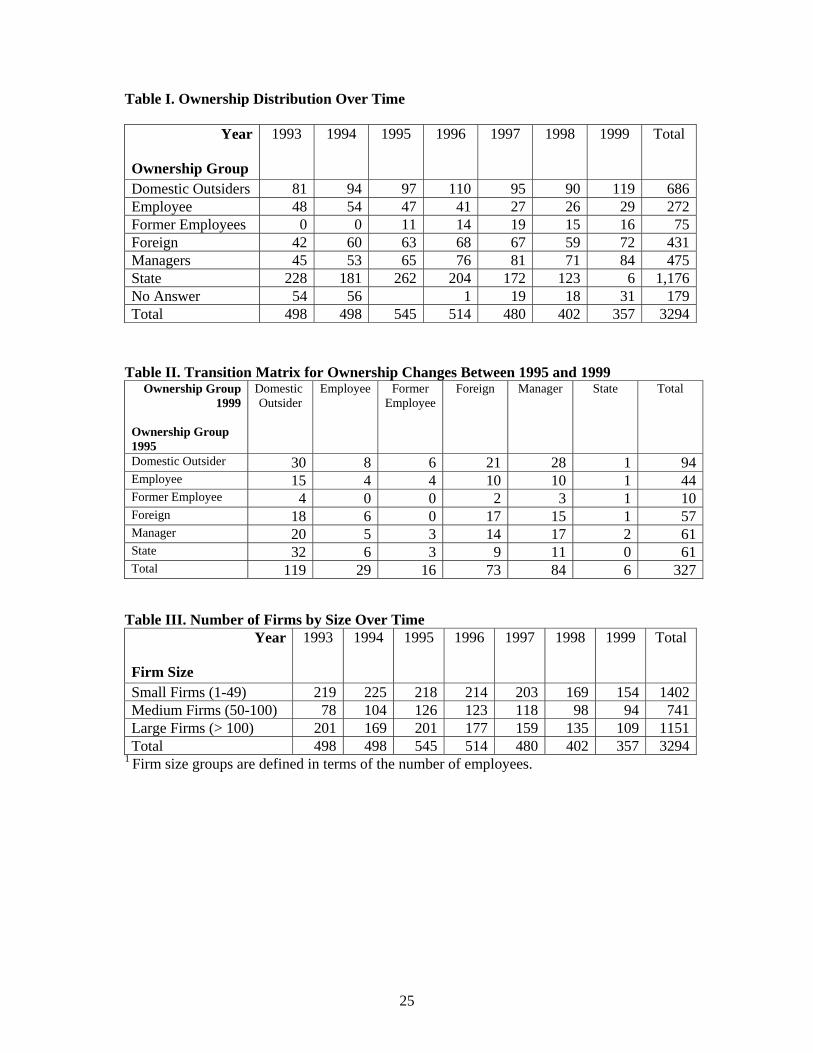
Table I provides information on the distribution at a given point in time and evolution over
time of the number of firms that fall in a given ownership category. Focusing on the 1995
sample, it is apparent that, in more than 22% of cases, insiders, i.e., employees and managers,
or former insiders are dominant owners. This provides evidence to the importance of insider
ownership during the early years of transition. Foreign owned companies comprise around
12% of the sample, while domestic outsider owned firms comprise around 18% of the
sample. Finally, state owned firms comprise around 48% of the sample, with 232 firms being
fully under state ownership while 30 firms being mostly in private hands but with the state
still holding the dominant position11.
The table also contains important information on ownership dynamics. It is apparent that the
number of state and employee owned firms steadily decreases, while the number of domestic
outsider and manager owned firms increases over time. While the decrease in the number of
state owned firms over time is expected due to the continuation of the privatization process,
9
the decrease in the number of employee owned firms seems to underline the suspicion that in
the long-run this ownership structure is not viable and will be diluted in favor of others. Their
inability to secure enough external funding and, consequently, to carry out the necessary
investment in order to remain competitive may be among the drivers of these dynamics. As
for the increase in the number of manager owned firms, an argument often made is that it
might be mostly caused by the concentration of ownership in the hands of managers in
insider owned firms, i.e., by the shift of ownership rights from employees to managers.
Evidence on these claims is provided by transition matrixes, which plot ownership structures
at two different points in time against each other. An example is given in Table II, where
ownership categories in 1995 are plotted against ownership categories in 1999.
Overall, some important facts emerge from these transitions. First, state firms privatized after
1995 end up mostly in the hands of outsider investors, i.e., domestic outsiders and foreigners,
with employees and former employees being the least preferred option. Second, there is little
employee or former employee activity in taking over firms once they are in private hands.
Third, domestic outsiders, foreigners and managers are quite active in the market for
corporate control, with continuous acquisitions and cessations across groups. Fourth, the
concentration of ownership from employees to managers, although existing, is not the driving
force behind the rise in managerial ownership. Finally, former employees hang on to their
dominating ownership position for some time after they have left the firm, but ultimately
renounce it.
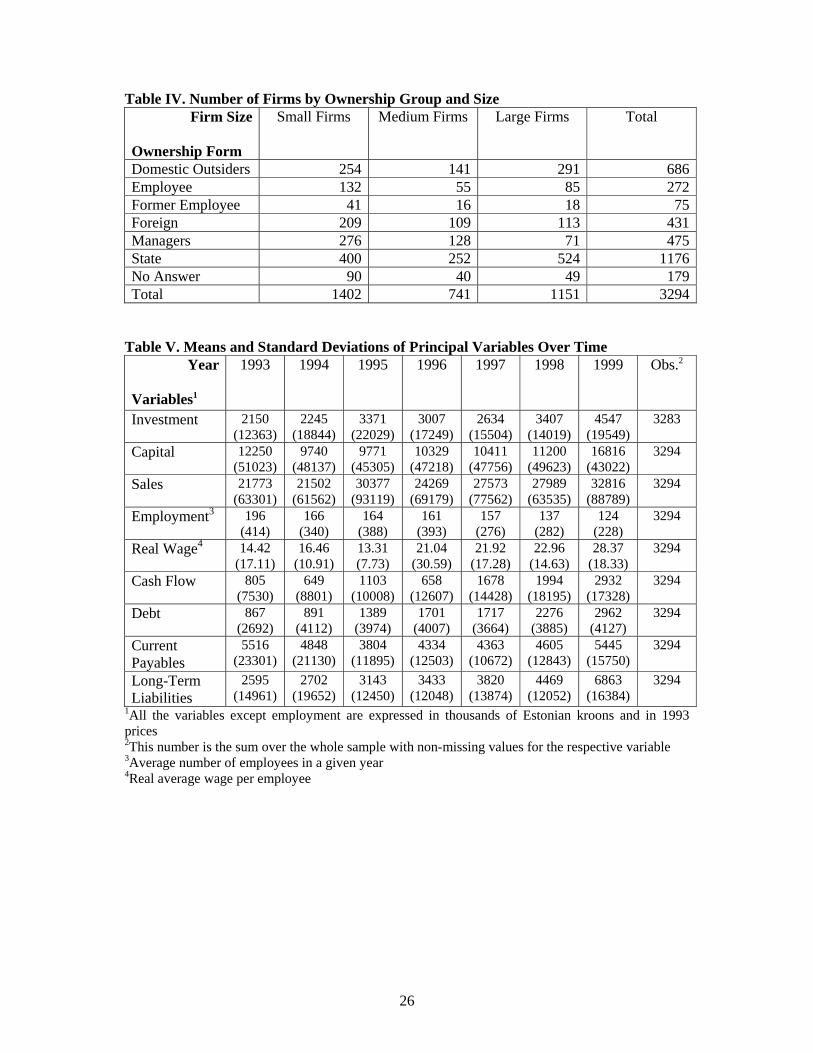
Turning to firm size distribution, Table III shows the distribution of firms by size groups over
time, while Table IV shows the joint distribution of firms by ownership and size groups. It is
seen that over time large firms drop out of the sample. Because of the large number of state
10
owned firms in this group, two potential reasons for the steady decrease in number of firms
over time might be their break-up before privatization into smaller units or decreases in
employment due to pre-privatization restructuring. Inspecting the joint distribution of
ownership and size it is apparent that state owned firms tend mostly to be large, insider
owned and, surprisingly, foreign owned firms tend to be small and medium, while domestic
outsider owned firms tend to be small and large.
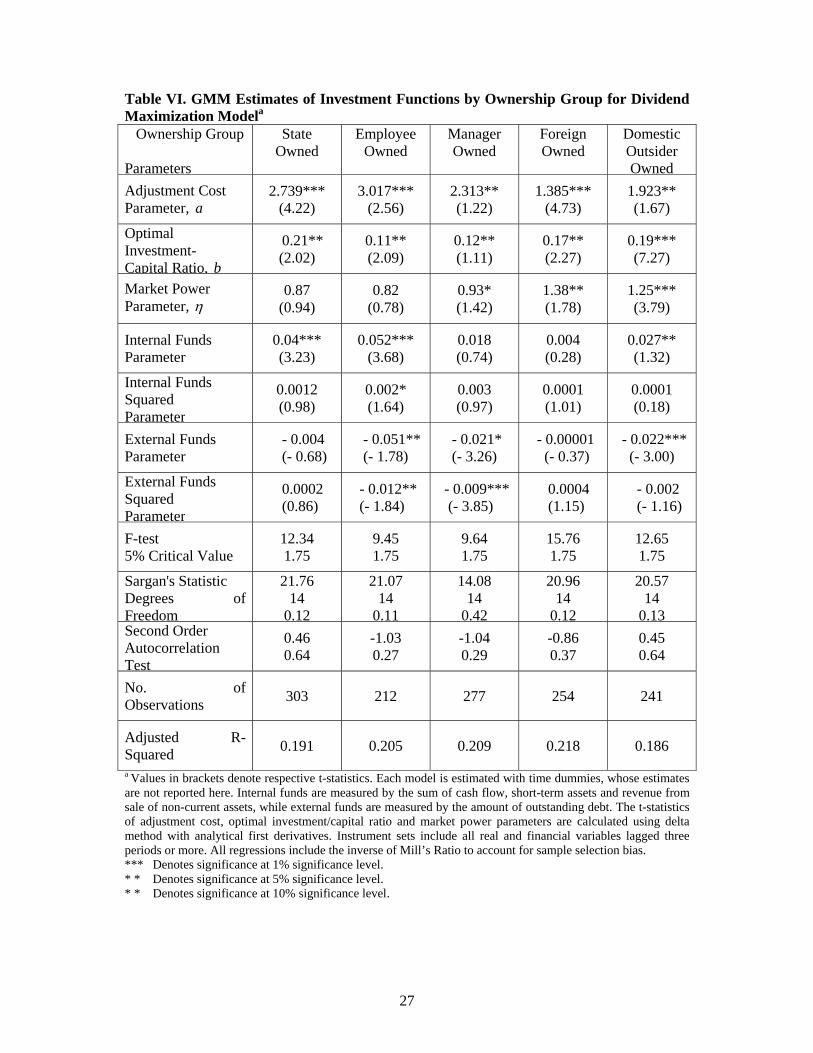
Table V presents the summary statistics of the most relevant variables used in the analysis.
The general facts that emerge from this table are that investment levels are high relative to
capital stock, with investment/capital ratio ranging from 0.17 in 1993 to 0.34 in 1995, that
average employment decreases while real wage increases over time, that cash flow is
positive, that short-term debt increases over time and that cash flow and short-term debt are
approximately of the same magnitude in all years but 1996. The increase in debt after 1995 is
consistent with the general increase of lending to the private sector during this period in
Estonia. Furthermore, up to 1997, the sum of cash flow and short-term debt is less than
investment suggesting that firms might have had access to other sources of capital such as
short-term trade credit and/or long-term debt.
This conjecture is supported by the last two rows of the table that show current payables and
long-term liabilities, which include long-term loans as well as any other long-term debt a firm
accumulates. The rate of growth of long-term liabilities is not high, except for the last year,
suggesting that long-term liabilities do not constitute an important source of capital over the
stated period. Current payables, however, are quite high and higher than investment over the
whole period. Another important feature of Estonian firms during this period is that, on
11
average, they have become more capital intensive as demonstrated by the increase in capital
and decrease in employment.
4. Results and Discussion
In this section we report the results of estimating investment equations by ownership and size
group. The results are obtained using Arellano’s and Bond's (1991) GMM estimator.
Inference on coefficients is based on one-step procedure results, while on model specification
on two-step procedure results. This is due to a downward bias in standard errors for small
samples when the two-step procedure is applied. The standard errors of the underlying
parameters of the model, i.e., the adjustment cost parameter, the optimal investment/capital
ratio and the market power parameter, are then calculated using the delta method with
analytical first derivatives.
The effect of ownership structures on firm’s investment behavior and the degree of financial
constraints is normally investigated by introducing ownership dummies and estimating the
specifications using the pooled sample. Further, all dummies are interacted with all other real
and financial variables in the regression allowing not only the intercepts but also slopes to
differ across groups. A major problem in estimating such specifications with ownership
variables as right-hand side variables is the endogeneity of ownership, i.e., in equilibrium
different owners will determine their optimal ownership share based on various firm
characteristics, among which is firm’s investment needs. A potential solution to the problem
is the use of instrumental variables, i.e., the endogenous variables in the model, the
ownership dummies in our case, are instrumented with a set of variables that are correlated
with them but not with the error term.
12
Yet, the instrumental variable approach is not without problems. Finding appropriate
instruments for ownership dummies is difficult. The literature on the determinants of
ownership structures identifies firm size, productivity, profitability, capital intensity,
financing requirements and/or firm quality as determinants of ownership shares. All these
variables could serve as instruments for the endogenous ownership dummies. The application
of the instrumental variable approach requires all instruments to be uncorrelated with the
unobserved variables. In structural investment equations, however, all factors mentioned will
be correlated with unobserved firm specific shocks to investment and, as such, still be
correlated with the error terms. Then, the use of bad instruments will still lead to biased
parameter estimates (Angrist and Krueger, 2001).
An alternative approach is the division of the sample into several sub-samples according to
the ownership groups defined and the estimation of the relevant specifications for every sub-
sample separately. Other than avoiding the pitfalls of instrumental variable approach, this
approach offers the possibility to test the hypothesis on the existence of different objective
functions across groups of firms. This is the approach adopted here by dividing the sample
into five sub-samples as follows: state owned, domestic outsider owned, foreign owned,
manager owned and employee owned firms12. In the interpretation of results we then focus on
the differences in respective coefficients across ownership groups, which provide unbiased
estimates of the true differences. The results of estimating the equations under alternative
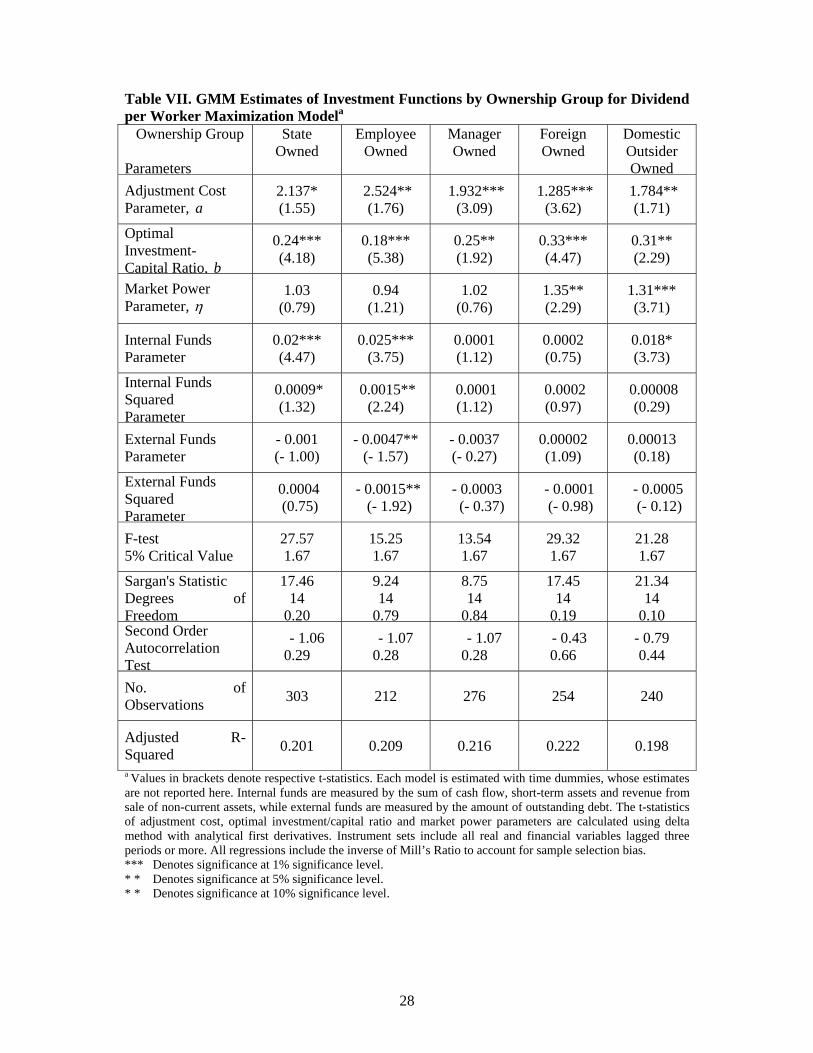
assumptions on firm’s objective function are reported in Tables VI and VII.
Focusing first on model performance we see that the over-identifying restrictions, tested
through Sargan’s test, are accepted at high probability levels, while the second order
13
autocorrelation test is always rejected. Also, adjusted R-squared are comparable across
equations and range from around 18% to around 22%. Finally, model adequacy is also
confirmed by the rejection of the null that all coefficients are jointly zero.
Turning to estimates of structural parameters we see that the adjustment cost parameter and
the optimal investment/capital ratio are generally positive and significant across all equations,
while the market power parameter is significant only in the case of domestic outsider owned
and foreign owned firms. The estimates of adjustment cost parameters imply different
relative size of adjustment costs to investment expenditures across ownership groups.
Assuming that parameter b is zero and evaluating the size of adjustment costs at the mean
investment capital ratio for each group, we find that adjustment costs for foreign owned firms
vary between 16% and 19% of investment expenditures, for domestic outsider owned firms
between 20% and 22%, for manager owned firms between 29% and 36%, for employee
owned firms between 30% and 36% and for state owned firms between 27% and 34%. When
optimal investment/capital ratios are compared with their sample means across ownership
groups we find that state owned firms have the lowest deviation of actual versus optimal
investment rate, while manager and employee owned firms have the highest. This suggest
that, even accounting for the non zero value of b in calculating adjustment costs, manager
and employee owned firms will face large adjustment costs relative to investment
expenditures. Finally, the estimates of market power parameter are insignificant for state
owned and employee owned firms. The estimate of this parameter for manager owned firms
in Table VI is positive and significant. The value of 0.93, however, is close to unity, implying
no market power. In contrast, the values of this parameter for domestic outsider and foreign
owned firms are positive, significant and well above unity, indicating that these firms operate
14
in the elastic portion of their demand curve and enjoy monopoly power. The values of the
parameter are larger for foreign owned firms than for domestic outsider owned firms.
Important differences in investment behavior across ownership groups emerge while
inspecting the estimates of financial variables’ coefficients. Comparing the coefficients
across groups several things are worth noting. First, as expected, different types of firms
display different sensitivity to measures of financial constraints. As seen from the tables,
estimates of all coefficients of financial variables for foreign owned firms are insignificant,
indicating that these firms are not constrained in any sense in their investment behavior.
Given that foreign owned firms in Estonia might be either subsidiaries or joint ventures with
foreign partners, it is highly possible that profits earned in other countries could be invested
in Estonia and the other way round. As such, the measures of internal funds and debt as
defined here will not be the relevant ones for these firms. Instead, measures of global funds
across different markets where these firms operate will be needed to describe their behavior.
Other types of firms, albeit to differing degrees, display sensitivity to the availability of
internal and/or external finance. Manager owned firms are the only ones among them not
displaying significant sensitivity to the availability of internal funds, while state owned,
domestic outside owned and employee owned firms all display positive and significant
sensitivity to measures of internal funds, implying different degrees of financing constraints.
Among the latter three groups, the sensitivity is highest for employee owned firms and then
for state owned ones. For instance, the estimate of internal funds parameter in Table VI for
employee owned firms is 0.052. This estimate is 30% larger than the one for state owned
firms and almost twice as large as the one for domestic outsider owned ones. The differences
in estimates vary depending on the objective function assumed, but the pattern remains the
15
same. The estimate of internal funds squared parameter, included to capture potential non-
linearities, is significant only for employee owned firms, indicating that for these firms
availability of internal finance is crucial in investment policies.
One argument against the interpretation of coefficients of cash flow as indicators of financing
constraints is that they also proxy for future investment opportunities. However, if measures
of cash flow are equally correlated with future opportunities across all firm types, then the
differences in these coefficients are unbiased indicators of differences in financing
constraints. This conjecture is tested by estimating an equation with sales as dependent
variable and different lags of cash flow, ownership dummies and their interaction with lagged
cash flow variables as independent ones. The results, not reported here, show that cash flow
predicts future sales across all firms and that the effect is larger for foreign and domestic
outsider owned firms than for the other types. This finding supports our conjecture that
differences in internal funds parameter between, for example, employee owned or state
owned firms and foreign owned firms are a good predictor of financing constraints.
Further evidence of financial constraints comes from the inspection of coefficients of external
finance variables. In this case, state owned firms display no sensitivity to availability of
external finance, as shown by the insignificant coefficients of debt and its squared
parameters. This could serve as indicator that state owned firms are not as constrained as
might be conjectured in raising external finance, i.e. they might be operating under soft
budget constraints regime. Alternatively, it could be conjectured that, due to high price they
might have to pay for external finance, they rely mostly on internal funds to finance their
investment, as expressed by the positive and significant coefficient of internal funds
parameters, and, as such, have not yet hit their credit limit. Finally, the significant coefficient
16
of internal finance and the insignificant coefficient of external finance could also be
interpreted as evidence of managerial discretion and their preferences against outside control.
In contrast, all other domestic owned firms, that is domestic outsider owned, manager owned
and employee owned, seem to have hit their debt limit in that, whenever significant, higher
levels of debt are associated with lower investment rates. The sensitivities are highest, in
absolute value, for employee owned firms and then for domestic outsider owned firms across
all specifications. Interestingly, the case of manager owned firms is the opposite of that of
state owned firms, in that they show significant sensitivity to the availability of external
finance but insignificant sensitivity to the availability of internal funds.
A general fact emerging from inspecting the tables is that financial constraints operate both
through debt and availability of internal funds, although the coefficients of internal funds are
significant more often than those of external finance. A final observation is that, results are
robust to the alternative definitions of internal funds, i.e., the use of cash flow or value added,
as well as to the assumption on firm’s objective function. This means that, while their
magnitude and significance changes across different specifications, their sign remains the
same.
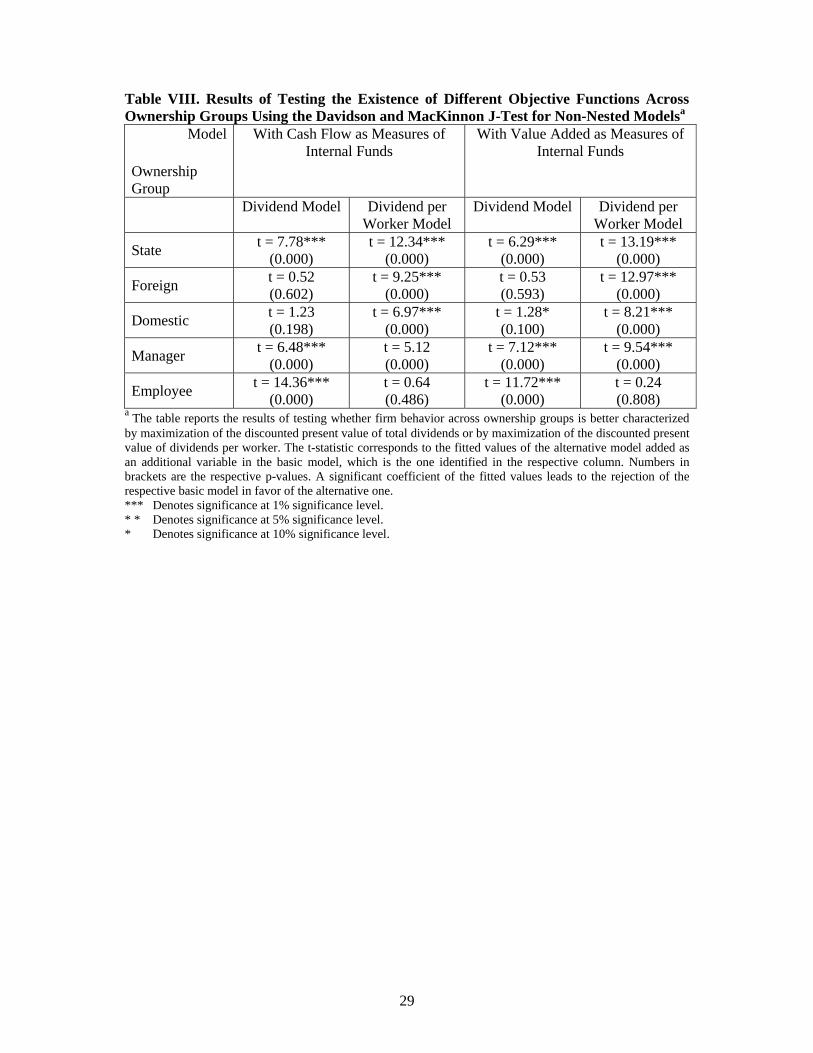
The last step of the analysis is testing whether firms under different ownership structures
have different objective functions. Given the non-nested nature of the competing models, the
tests are carried out using Davidson and MacKinnon’s (1981) J-test for non-nested
alternatives. The results of the test are reported in Table VIII. The table should be read as
follows. The cells in column “Dividend Model” show the t-test on the significance of the
fitted values from estimating equations assuming dividend per worker maximization added as
an additional regressor in the equation derived from dividend maximization, while the cells in
17
column “Dividend per Worker Model” show the t-test on the significance of the fitted values
from estimating equations assuming dividend maximization added as an additional regressor
in the equation derived from dividend per worker maximization. The test results show that for
state and manager owned firms we are able to reject both models as being the correct ones.
However, under alternative definitions of internal funds, we conclude that foreign and
domestic outsider owned firms behave consistently with profit (dividends) maximization
hypothesis, while employee owned firms behave consistently with dividends per worker
maximization hypothesis. These conclusions provide support against treating all the firms as
being similar and pooling them in one sample.
We argued that the probability of firms facing liquidity constraints is not independent from
firm size. The reasons for this are that both the cost to outsiders of collecting information and
the cost to insiders of issuing debt and/or equity decrease with firm size. Consequently, small
firms are expected to face more severe liquidity constraints than large firms. In testing this
proposition we adopt a similar approach as in the case of ownership structure. That is, the
sample is divided into three sub-samples of small, medium and large firms13, and the analysis
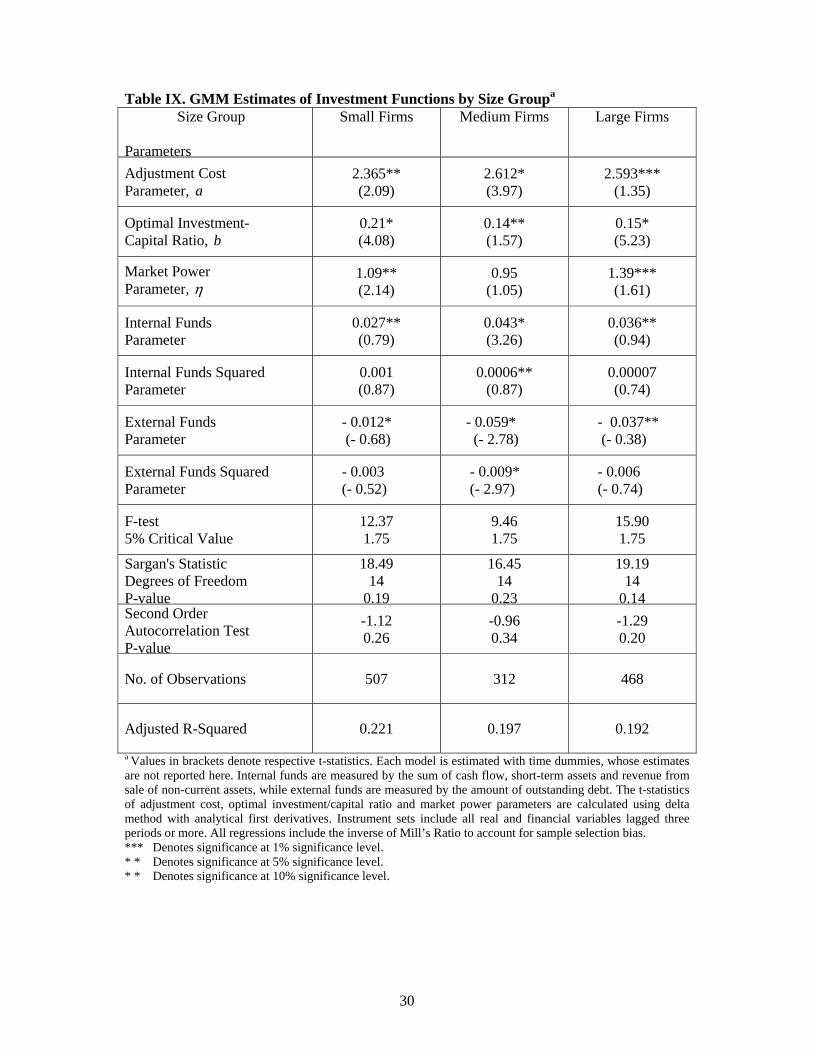
is performed separately for every sub-sample. The estimation results are reported in Table IX.
Model performance is in line with the previous results. Sargan's statistic in all the models is
accepted at high probability levels, the second order autocorrelation hypothesis is always
rejected at high significance levels and the adjusted R-squared are at the range of 19% to
22%. Furthermore, the estimates of adjustment cost and optimal investment/capital ratio
parameters are positive and significant for all the three size groups, while the market power
parameter is positive and significant only for small and large firms but insignificant for
medium firms.
18
With respect to estimates of financial variables parameters, it is seen that they are significant
and of the expected sign across all size groups. However, the magnitude of respective
coefficients shows that there exists a non-linear relationship between firm size and financial
constraints. Medium sized firms are the ones displaying the largest degree of financing
constraints, while small firm the lowest. These results are at odds with the results obtained,
for instance, by Fazzari, Hubbard and Petersen (1988), who find that the likelihood of firms
experiencing liquidity constraints decreases with firm size, and Hooks (2003), but are in line
with the results of Audretsch and Elston (2002) who find that small German firms face fewer
liquidity constraints. However, while Audretsch’s and Elston’s (2002) results are driven by
the specific institutional structure in Germany, which provides long-term and competitively
priced capital to small enterprises, in our sample, results are driven by the specific ownership
distribution within each size group. More specifically, the group of small firms is
characterized by a large share of foreign and manager owned firms, which, as reported earlier
show little sensitivity to financial variables. The significant results for medium firms could be
driven by the large share of domestic outsider owned and state owned firms within this group.
It is also possible that agency conflicts may be more pronounced in these firms with
managers enjoying larger degrees of discretion and attempting to increase firm size whenever
internal funds become available.
5. Conclusions and Policy Implications
Strategic restructuring is identified as one of the pillars on which rests the success of
transition. It, in turn, depends, to a large extent, on firms’ ability to carry out the necessary
investment by raising large amounts of capital operating under hard budget constraints.
Furthermore, a good investment climate is a precondition for achieving sustainable long-term
19
economic growth and poverty reduction. In this paper we have investigated whether
investment spending of firms in Estonia is affected by liquidity constraints as well as whether
the degree of such constraints differs across firms under different governance structures and
firm size.
While we argue that the identity of owners matters in the severity of liquidity constraints that
firms face, current and future financing needs are also important determinants of the choice
of optimal ownership structures. This two-way causality leads to endogeneity of ownership
structures with respect to investment rates, which, if not accounted for, would result in biased
estimates. These considerations lead us to adopt the following estimation strategy: divide the
sample into sub-samples of firms belonging to a given ownership class, estimate investment
equations separately for each group and focus on the differences in estimated coefficients
across groups.
The empirical results underline several important points. First of all, the adjustment cost
parameter and the optimal investment/capital ratio with minimal adjustment costs are positive
and significant across all groups and across all specifications. Second, only for foreign and
domestic outsider owned firms the market power parameter is significant and well above
unity, indicating that these firms enjoy some monopoly power. Third, financial variables,
used as proxy for the degree of liquidity constraints, play a significant role in firm's
investment decisions. Although all coefficients of internal and external funds are insignificant
when the Euler equations are estimated for the whole sample, the inclusion of financial
variables improved the performance of estimated equations in terms of not being able to
reject the hypothesis that they are correctly specified.
20
Fourth, the degree of liquidity constraints varies with firm ownership structure. We
consistently find that, on average, all non-foreign owned firms face some liquidity constraints
either through positive and significant coefficients of internal funds variables or through
negative and significant coefficients of external funds variables. The behavior of foreign
owned firms, however, is consistent with the Euler equation specification in the absence of
liquidity constraints. These findings provide support to the hierarchy of finance arguments
and are consistent with the belief that successful restructuring in a transition economy is
dependent on the availability of finance. Focusing on coefficient differences across groups,
we find that the sensitivity of investment to the availability of internal and external finance is
stronger for employee owned firms. From the other groups, somewhat surprisingly, only
domestic outsider owned firms display sensitivity to both measures of the availability of
finance, with manager owned firms being sensitive to the availability of external finance,
while state owned firms being sensitive to the availability of internal finance. The results on
domestic outsider owned firms imply that these firms could suffer from high levels of
managerial discretion and control.
Finally, we provide evidence that firm behavior in a transition economy cannot be analyzed
by invoking the representative firm approach. The results of Davidson’s and MacKinnon’s
(1981) J-tests for non-nested alternatives reject the hypothesis that employee owned firms can
be modeled as profit maximizers. Curiously, the tests do not reach a clear conclusion with
respect to state owned and manager owned firms, implying that their behavior is consistent
with both profit maximization and profit per worker maximization. The results imply that,
due to firm heterogeneity, pooling all firms in one sample for the purpose of the analysis
would result in mis-specification bias.
21
The paper contributes to the literature in several important aspects. First, it provides more
evidence in support of the financing hierarchy hypothesis. Second, it adds to the stock of the
limited evidence on the role of liquidity constraints on firm behavior in a transition economy.
Third, it is among the few studies, such as the ones by Lizal and Svejnar (1998) and Lizal and
Svejnar (2002), which make a comprehensive analysis of the effect of various ownership
structures on firm investment behavior. Especially, advantage of this paper compared to the
others is the possibility of identification of insider owners, both managers and employees,
which allows us to test various propositions related to their behavior. In most of other studies,
due to data unavailability, authors use state versus private owned or state, private and foreign
owned division. A study that investigates similar issues for Estonian firms using company
accounts data is Masso (2002). The author, however, focuses only on the differences between
foreign and Estonian domestic firms. As such, this study offers a better picture of processes
that characterize Estonian transition.
A continuous and lively debate in the transition literature is the efficiency and viability of
various ownership structures. The arguments in the debate could be well summarized in
Hansmann’s (1996) survivorship test, which says that if a given organizational form does not
survive, then it must have been at a comparative disadvantage compared to other forms. One
of the organizational structures that, on various theoretical grounds, has been pinpointed as
inefficient, and, as such, subject to extinction, is employee owned firms. The theoretical
arguments have given rise to empirical work that tries to assess the inefficiency of employee
owned firms. Estonia is one of the countries where employee ownership has been in decline,
as indicated also by our data presented in Table II. Kalmi (2002) makes a thorough analysis
of the degeneration of these firms and finds that structural bias towards extinction14 and
insufficient motives of incumbent insiders to extend ownership to new employees are the
22
main reasons that drive their decline. Our results emphasize here the degree of liquidity
constraints as a further factor that potentially accentuates the decline of employee ownership.
Indeed, Kalmi’s (2002) and ours sets of conclusions are complementary and provide the
strongest evidence yet on the causes of employee ownership degeneration. In addition, a
major contribution of this paper is that it provides robust evidence to the arguments that
employee owned firms do face larger liquidity constraints than other types of firms.
These results imply a role for public policy in increasing the level of investment by
influencing the environment firms operate in through policy measures such as the provision
of fiscal incentives, development of capital markets and financial system and improvements
of access to capital. Fiscal incentives in the form of lower corporate taxes and/or exemption
of retained earnings used for investment from taxes, i.e. taxes will be paid only on the level of
profits above that of investments, will stimulate investment through an increase in availability
of internal funds. Indeed, since 2000 retained earnings are exempt from taxation in Estonia.
While it is still early to assess the full effects of such policy, it is expected that, in the long
run it will result in higher capital stock. For instance, Masso (2002), citing unpublished work
done using a model based on Tobin’s Q, states that the long run effect of this policy is
expected to bring about an increase in capital stock of 6.1%. There is a possibility, however,
that such policies might produce undesirable effects. Under the conditions when managers
enjoy high degrees of discretion, an increase in the availability of internal finance simply
offers them more resources at their disposal to pursue their own interests at the expense of
those of the other shareholders. Instead of relaxing the constraints, the outcome of this policy
might then be over investment. These potential costs, as well as the fact that the provision of
fiscal incentives depends on government’s budget constraints, imply a limited role for fiscal
policies. As such, they must be combined with other policies designed not only to relax

23
liquidity constraints but also to mitigate agency conflicts within the firm by curbing
managerial discretion.
One way to achieve both objectives is to follow policies to further develop capital markets
and the financial sector, i.e., banking and non-banking institutions. Estonia’s capital market,
although growing, is small, and, as such, its future will lie in alliances with other stock
exchanges. The first step in this direction is the creation of the pan-Baltic stock exchange in
early 2000. Subsequent membership of Estonia in the European Union in 2004 has opened
European capital markets to Estonian companies. However, those likely to benefit from the
stock market, at least in the short term, are large firms. More important for Estonian firms in
general is the development of the banking sector and other non-banking institutions, such as
investment funds, venture capital funds, mutual funds and credit unions. The banking system
in Estonia is consolidated and well regulated. Nevertheless, it is mostly involved in financing
the government than the private sector. Here there is scope to introduce legislation that will
increase banks incentives to extend loans to private companies. Similar steps need to be taken
to increase non-banking institutions participation in financing the private sector, which until
now has been marginal. A possible way would be to provide tax breaks to such institutions
that would be contingent to the amount of loans they extend to private companies, especially
to those encountering difficulties in raising finance.
Finally, a faster way of injecting capital into firms is to promote the inflow of foreign direct
investment either in the form of fully foreign owned subsidiaries, established through
greenfield investment or acquisition of an Estonian state or private owned company, or
partnerships with domestic capital. The latter is of particular interests for Estonian private
companies in need of fresh funds for investment. Given that foreign owners have access to

24
global capital markets, this will enable Estonian companies to gain access to sources of funds
that will have otherwise been either inaccessible or too costly.
25
Table I. Ownership Distribution Over Time
Year Ownership Group
1993 1994 1995 1996 1997 1998 1999 Total
Domestic Outsiders 81 94 97 110 95 90 119 686Employee 48 54 47 41 27 26 29 272Former Employees 0 0 11 14 19 15 16 75Foreign 42 60 63 68 67 59 72 431Managers 45 53 65 76 81 71 84 475State 228 181 262 204 172 123 6 1,176No Answer 54 56 1 19 18 31 179Total 498 498 545 514 480 402 357 3294
Table II. Transition Matrix for Ownership Changes Between 1995 and 1999 Ownership Group
1999 Ownership Group 1995
Domestic Outsider
Employee Former Employee
Foreign Manager State Total
Domestic Outsider 30 8 6 21 28 1 94Employee 15 4 4 10 10 1 44Former Employee 4 0 0 2 3 1 10Foreign 18 6 0 17 15 1 57Manager 20 5 3 14 17 2 61State 32 6 3 9 11 0 61Total 119 29 16 73 84 6 327
Table III. Number of Firms by Size Over Time
Year Firm Size
1993 1994 1995 1996 1997 1998 1999 Total
Small Firms (1-49) 219 225 218 214 203 169 154 1402Medium Firms (50-100) 78 104 126 123 118 98 94 741 Large Firms (> 100) 201 169 201 177 159 135 109 1151Total 498 498 545 514 480 402 357 3294
1 Firm size groups are defined in terms of the number of employees.
26
Table IV. Number of Firms by Ownership Group and Size Firm Size
Ownership Form
Small Firms Medium Firms Large Firms Total
Domestic Outsiders 254 141 291 686Employee 132 55 85 272 Former Employee 41 16 18 75 Foreign 209 109 113 431 Managers 276 128 71 475 State 400 252 524 1176 No Answer 90 40 49 179Total 1402 741 1151 3294
Table V. Means and Standard Deviations of Principal Variables Over Time Year
Variables1
1993 1994 1995 1996 1997 1998 1999 Obs.2
Investment 2150 (12363)
2245 (18844)
3371 (22029)
3007 (17249)
2634 (15504)
3407 (14019)
4547 (19549)
3283
Capital 12250 (51023)
9740 (48137)
9771 (45305)
10329 (47218)
10411 (47756)
11200 (49623)
16816 (43022)
3294
Sales 21773 (63301)
21502 (61562)
30377 (93119)
24269 (69179)
27573 (77562)
27989 (63535)
32816 (88789)
3294
Employment3 196 (414)
166 (340)
164 (388)
161 (393)
157 (276)
137 (282)
124 (228)
3294
Real Wage4 14.42 (17.11)
16.46 (10.91)
13.31 (7.73)
21.04 (30.59)
21.92 (17.28)
22.96 (14.63)
28.37 (18.33)
3294
Cash Flow 805 (7530)
649 (8801)
1103 (10008)
658 (12607)
1678 (14428)
1994 (18195)
2932 (17328)
3294
Debt 867 (2692)
891 (4112)
1389 (3974)
1701 (4007)
1717 (3664)
2276 (3885)
2962 (4127)
3294
Current Payables
5516 (23301)
4848 (21130)
3804 (11895)
4334 (12503)
4363 (10672)
4605 (12843)
5445 (15750)
3294
Long-Term Liabilities
2595 (14961)
2702 (19652)
3143 (12450)
3433 (12048)
3820 (13874)
4469 (12052)
6863 (16384)
3294
1All the variables except employment are expressed in thousands of Estonian kroons and in 1993 prices 2This number is the sum over the whole sample with non-missing values for the respective variable 3Average number of employees in a given year 4Real average wage per employee
27
Table VI. GMM Estimates of Investment Functions by Ownership Group for Dividend Maximization Modela Ownership Group Parameters
State Owned
Employee Owned
Manager Owned
Foreign Owned
Domestic Outsider Owned
Adjustment Cost Parameter, a
2.739*** (4.22)
3.017*** (2.56)
2.313** (1.22)
1.385*** (4.73)
1.923** (1.67)
Optimal Investment- Capital Ratio, b
0.21** (2.02)
0.11** (2.09)
0.12** (1.11)
0.17** (2.27)
0.19*** (7.27)
Market Power Parameter, η
0.87 (0.94)
0.82 (0.78)
0.93* (1.42)
1.38** (1.78)
1.25*** (3.79)
Internal Funds Parameter
0.04*** (3.23)
0.052*** (3.68)
0.018 (0.74)
0.004 (0.28)
0.027** (1.32)
Internal Funds Squared Parameter
0.0012 (0.98)
0.002* (1.64)
0.003 (0.97)
0.0001 (1.01)
0.0001 (0.18)
External Funds Parameter
- 0.004 (- 0.68)
- 0.051** (- 1.78)
- 0.021* (- 3.26)
- 0.00001 (- 0.37)
- 0.022*** (- 3.00)
External Funds Squared Parameter
0.0002 (0.86)
- 0.012** (- 1.84)
- 0.009*** (- 3.85)
0.0004 (1.15)
- 0.002 (- 1.16)
F-test 5% Critical Value
12.34 1.75
9.45 1.75
9.64 1.75
15.76 1.75
12.65 1.75
Sargan's Statistic Degrees of Freedom
21.76 14
0.12
21.07 14
0.11
14.08 14
0.42
20.96 14
0.12
20.57 14
0.13Second Order Autocorrelation Test
0.46 0.64
-1.03 0.27
-1.04 0.29
-0.86 0.37
0.45 0.64
No. of Observations 303 212 277 254 241
Adjusted R-Squared 0.191 0.205 0.209 0.218 0.186
a Values in brackets denote respective t-statistics. Each model is estimated with time dummies, whose estimates are not reported here. Internal funds are measured by the sum of cash flow, short-term assets and revenue from sale of non-current assets, while external funds are measured by the amount of outstanding debt. The t-statistics of adjustment cost, optimal investment/capital ratio and market power parameters are calculated using delta method with analytical first derivatives. Instrument sets include all real and financial variables lagged three periods or more. All regressions include the inverse of Mill’s Ratio to account for sample selection bias. *** Denotes significance at 1% significance level. * * Denotes significance at 5% significance level. * * Denotes significance at 10% significance level.
28
Table VII. GMM Estimates of Investment Functions by Ownership Group for Dividend per Worker Maximization Modela Ownership Group Parameters
State Owned
Employee Owned
Manager Owned
Foreign Owned
Domestic Outsider Owned
Adjustment Cost Parameter, a
2.137* (1.55)
2.524** (1.76)
1.932*** (3.09)
1.285*** (3.62)
1.784** (1.71)
Optimal Investment- Capital Ratio, b
0.24*** (4.18)
0.18*** (5.38)
0.25** (1.92)
0.33*** (4.47)
0.31** (2.29)
Market Power Parameter, η
1.03 (0.79)
0.94 (1.21)
1.02 (0.76)
1.35** (2.29)
1.31*** (3.71)
Internal Funds Parameter
0.02*** (4.47)
0.025*** (3.75)
0.0001 (1.12)
0.0002 (0.75)
0.018* (3.73)
Internal Funds Squared Parameter
0.0009* (1.32)
0.0015** (2.24)
0.0001 (1.12)
0.0002 (0.97)
0.00008 (0.29)
External Funds Parameter
- 0.001 (- 1.00)
- 0.0047** (- 1.57)
- 0.0037 (- 0.27)
0.00002 (1.09)
0.00013 (0.18)
External Funds Squared Parameter
0.0004 (0.75)
- 0.0015** (- 1.92)
- 0.0003 (- 0.37)
- 0.0001 (- 0.98)
- 0.0005 (- 0.12)
F-test 5% Critical Value
27.57 1.67
15.25 1.67
13.54 1.67
29.32 1.67
21.28 1.67
Sargan's Statistic Degrees of Freedom
17.46 14
0.20
9.24 14
0.79
8.75 14
0.84
17.45 14
0.19
21.34 14
0.10Second Order Autocorrelation Test
- 1.06 0.29
- 1.07 0.28
- 1.07 0.28
- 0.43 0.66
- 0.79 0.44
No. of Observations 303 212 276 254 240
Adjusted R-Squared 0.201 0.209 0.216 0.222 0.198
a Values in brackets denote respective t-statistics. Each model is estimated with time dummies, whose estimates are not reported here. Internal funds are measured by the sum of cash flow, short-term assets and revenue from sale of non-current assets, while external funds are measured by the amount of outstanding debt. The t-statistics of adjustment cost, optimal investment/capital ratio and market power parameters are calculated using delta method with analytical first derivatives. Instrument sets include all real and financial variables lagged three periods or more. All regressions include the inverse of Mill’s Ratio to account for sample selection bias. *** Denotes significance at 1% significance level. * * Denotes significance at 5% significance level. * * Denotes significance at 10% significance level.
29
Table VIII. Results of Testing the Existence of Different Objective Functions Across Ownership Groups Using the Davidson and MacKinnon J-Test for Non-Nested Modelsa
Model
Ownership Group
With Cash Flow as Measures of Internal Funds
With Value Added as Measures of Internal Funds
Dividend Model Dividend per Worker Model
Dividend Model Dividend per Worker Model
State t = 7.78*** (0.000)
t = 12.34*** (0.000)
t = 6.29*** (0.000)
t = 13.19*** (0.000)
Foreign t = 0.52 (0.602)
t = 9.25*** (0.000)
t = 0.53 (0.593)
t = 12.97*** (0.000)
Domestic t = 1.23 (0.198)
t = 6.97*** (0.000)
t = 1.28* (0.100)
t = 8.21*** (0.000)
Manager t = 6.48*** (0.000)
t = 5.12 (0.000)
t = 7.12*** (0.000)
t = 9.54*** (0.000)
Employee t = 14.36*** (0.000)
t = 0.64 (0.486)
t = 11.72*** (0.000)
t = 0.24 (0.808)
a The table reports the results of testing whether firm behavior across ownership groups is better characterized by maximization of the discounted present value of total dividends or by maximization of the discounted present value of dividends per worker. The t-statistic corresponds to the fitted values of the alternative model added as an additional variable in the basic model, which is the one identified in the respective column. Numbers in brackets are the respective p-values. A significant coefficient of the fitted values leads to the rejection of the respective basic model in favor of the alternative one. *** Denotes significance at 1% significance level. * * Denotes significance at 5% significance level. * Denotes significance at 10% significance level.
30
Table IX. GMM Estimates of Investment Functions by Size Groupa Size Group Parameters
Small Firms Medium Firms Large Firms
Adjustment Cost Parameter, a
2.365** (2.09)
2.612* (3.97)
2.593*** (1.35)
Optimal Investment- Capital Ratio, b
0.21* (4.08)
0.14** (1.57)
0.15* (5.23)
Market Power Parameter, η
1.09** (2.14)
0.95 (1.05)
1.39*** (1.61)
Internal Funds Parameter
0.027** (0.79)
0.043* (3.26)
0.036** (0.94)
Internal Funds Squared Parameter
0.001 (0.87)
0.0006** (0.87)
0.00007 (0.74)
External Funds Parameter
- 0.012* (- 0.68)
- 0.059* (- 2.78)
- 0.037** (- 0.38)
External Funds Squared Parameter
- 0.003 (- 0.52)
- 0.009* (- 2.97)
- 0.006 (- 0.74)
F-test 5% Critical Value
12.37 1.75
9.46 1.75
15.90 1.75
Sargan's Statistic Degrees of Freedom P-value
18.49 14
0.19
16.45 14
0.23
19.19 14
0.14 Second Order Autocorrelation Test P-value
-1.12 0.26
-0.96 0.34
-1.29 0.20
No. of Observations 507 312 468
Adjusted R-Squared 0.221 0.197 0.192
a Values in brackets denote respective t-statistics. Each model is estimated with time dummies, whose estimates are not reported here. Internal funds are measured by the sum of cash flow, short-term assets and revenue from sale of non-current assets, while external funds are measured by the amount of outstanding debt. The t-statistics of adjustment cost, optimal investment/capital ratio and market power parameters are calculated using delta method with analytical first derivatives. Instrument sets include all real and financial variables lagged three periods or more. All regressions include the inverse of Mill’s Ratio to account for sample selection bias. *** Denotes significance at 1% significance level. * * Denotes significance at 5% significance level. * * Denotes significance at 10% significance level.
31
A P P E N D I X
In constructing ownership groups and categories the precise meaning of ownership needs to be defined. In the
literature, ownership is considered to be the right to residual returns, i.e., to what remains after the factors of
production have been paid their contribution. In addition, some argue that control rights should also be included
in the definition of ownership (Hansmann, 1996). This brings up the issue whether formal or real control needs
to be taken into account. Measuring control and, especially, distinguishing formal versus real control, in the data
used in this paper, is not possible. Establishing this relationship, or the lack of it, would require data, for
instance, on owners’ board representation, on voting rules, shares classes and voting behavior of different
groups of owners, which are not available. Bearing this in mind, for the purposes of this analysis ownership is
defined in terms of the percentage of shares held by each group of owners.
Based on the respective direct shareholdings, six broad groups of owners are defined as follows: state, foreign,
domestic outsiders, former employees, incumbent employees and managers. A common pitfall in defining
ownership stakes for all these groups is that no correction is made for potential cross holding of shares, as the
identity of the enterprises that hold shares to each other is not known. This problem could result in understating
the real share held by some owner types and overstating the share held by other owner types. For example, due
to specifics of privatization legislation15 foreigners invest in an enterprise through another domestic holding
registered in Estonia. This practice assigns the shares held by the domestic holding as being held by domestic
outsiders. This issue might also arise in the case of insider ownership when insiders, in order to acquire an
enterprise, establish first another company that officially takes over the enterprise to be privatized16.
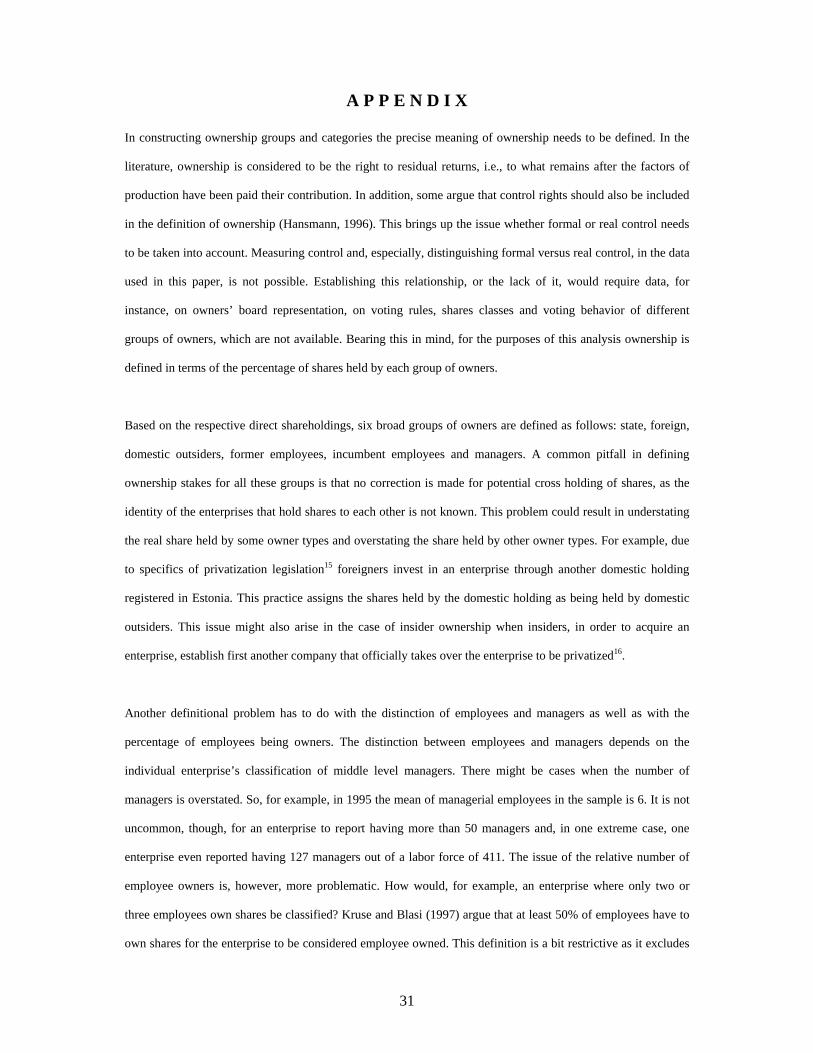
Another definitional problem has to do with the distinction of employees and managers as well as with the
percentage of employees being owners. The distinction between employees and managers depends on the
individual enterprise’s classification of middle level managers. There might be cases when the number of
managers is overstated. So, for example, in 1995 the mean of managerial employees in the sample is 6. It is not
uncommon, though, for an enterprise to report having more than 50 managers and, in one extreme case, one
enterprise even reported having 127 managers out of a labor force of 411. The issue of the relative number of
employee owners is, however, more problematic. How would, for example, an enterprise where only two or
three employees own shares be classified? Kruse and Blasi (1997) argue that at least 50% of employees have to
own shares for the enterprise to be considered employee owned. This definition is a bit restrictive as it excludes
32
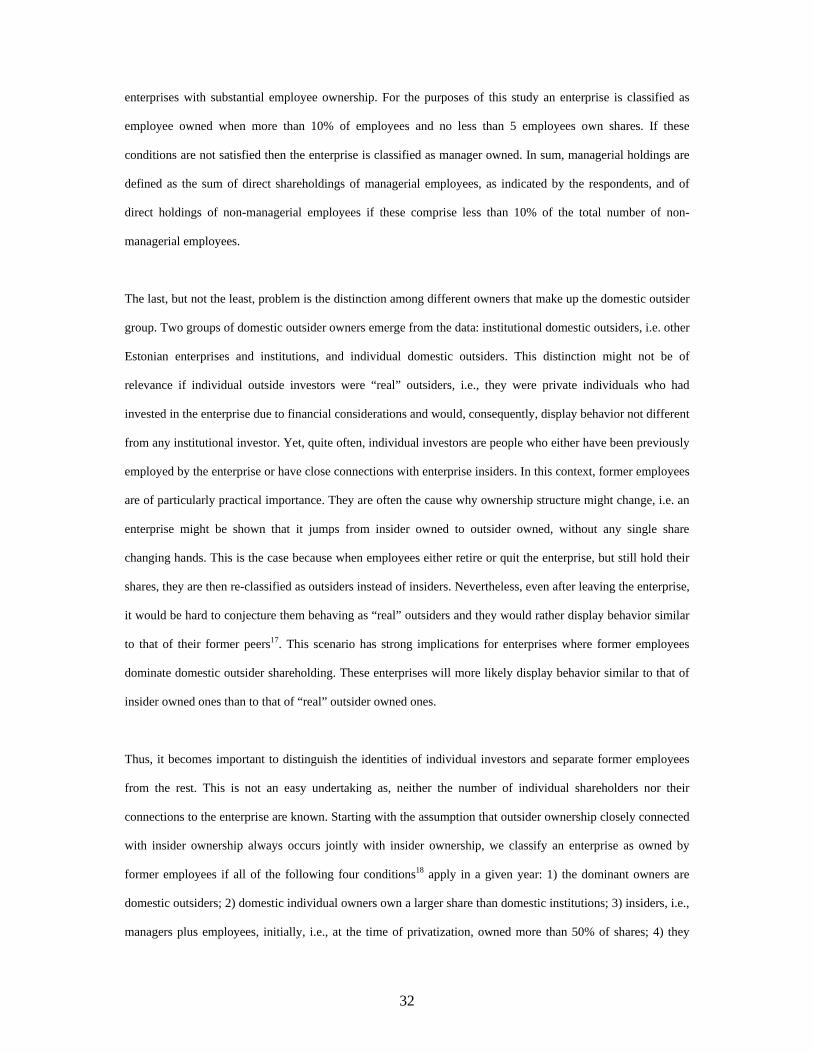
enterprises with substantial employee ownership. For the purposes of this study an enterprise is classified as
employee owned when more than 10% of employees and no less than 5 employees own shares. If these
conditions are not satisfied then the enterprise is classified as manager owned. In sum, managerial holdings are
defined as the sum of direct shareholdings of managerial employees, as indicated by the respondents, and of
direct holdings of non-managerial employees if these comprise less than 10% of the total number of non-
managerial employees.
The last, but not the least, problem is the distinction among different owners that make up the domestic outsider
group. Two groups of domestic outsider owners emerge from the data: institutional domestic outsiders, i.e. other
Estonian enterprises and institutions, and individual domestic outsiders. This distinction might not be of
relevance if individual outside investors were “real” outsiders, i.e., they were private individuals who had
invested in the enterprise due to financial considerations and would, consequently, display behavior not different
from any institutional investor. Yet, quite often, individual investors are people who either have been previously
employed by the enterprise or have close connections with enterprise insiders. In this context, former employees
are of particularly practical importance. They are often the cause why ownership structure might change, i.e. an
enterprise might be shown that it jumps from insider owned to outsider owned, without any single share
changing hands. This is the case because when employees either retire or quit the enterprise, but still hold their
shares, they are then re-classified as outsiders instead of insiders. Nevertheless, even after leaving the enterprise,
it would be hard to conjecture them behaving as “real” outsiders and they would rather display behavior similar
to that of their former peers17. This scenario has strong implications for enterprises where former employees
dominate domestic outsider shareholding. These enterprises will more likely display behavior similar to that of
insider owned ones than to that of “real” outsider owned ones.
Thus, it becomes important to distinguish the identities of individual investors and separate former employees
from the rest. This is not an easy undertaking as, neither the number of individual shareholders nor their
connections to the enterprise are known. Starting with the assumption that outsider ownership closely connected
with insider ownership always occurs jointly with insider ownership, we classify an enterprise as owned by
former employees if all of the following four conditions18 apply in a given year: 1) the dominant owners are
domestic outsiders; 2) domestic individual owners own a larger share than domestic institutions; 3) insiders, i.e.,
managers plus employees, initially, i.e., at the time of privatization, owned more than 50% of shares; 4) they
33
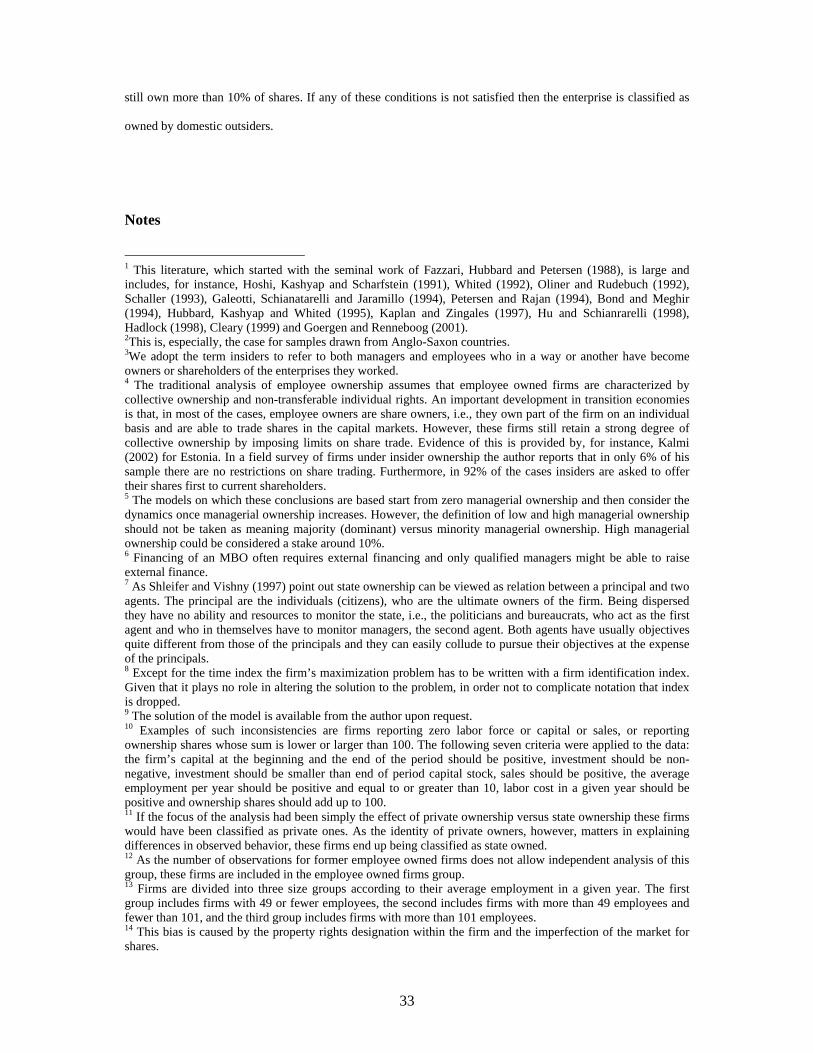
still own more than 10% of shares. If any of these conditions is not satisfied then the enterprise is classified as
owned by domestic outsiders.
Notes
1 This literature, which started with the seminal work of Fazzari, Hubbard and Petersen (1988), is large and includes, for instance, Hoshi, Kashyap and Scharfstein (1991), Whited (1992), Oliner and Rudebuch (1992), Schaller (1993), Galeotti, Schianatarelli and Jaramillo (1994), Petersen and Rajan (1994), Bond and Meghir (1994), Hubbard, Kashyap and Whited (1995), Kaplan and Zingales (1997), Hu and Schianrarelli (1998), Hadlock (1998), Cleary (1999) and Goergen and Renneboog (2001). 2This is, especially, the case for samples drawn from Anglo-Saxon countries. 3We adopt the term insiders to refer to both managers and employees who in a way or another have become owners or shareholders of the enterprises they worked. 4 The traditional analysis of employee ownership assumes that employee owned firms are characterized by collective ownership and non-transferable individual rights. An important development in transition economies is that, in most of the cases, employee owners are share owners, i.e., they own part of the firm on an individual basis and are able to trade shares in the capital markets. However, these firms still retain a strong degree of collective ownership by imposing limits on share trade. Evidence of this is provided by, for instance, Kalmi (2002) for Estonia. In a field survey of firms under insider ownership the author reports that in only 6% of his sample there are no restrictions on share trading. Furthermore, in 92% of the cases insiders are asked to offer their shares first to current shareholders. 5 The models on which these conclusions are based start from zero managerial ownership and then consider the dynamics once managerial ownership increases. However, the definition of low and high managerial ownership should not be taken as meaning majority (dominant) versus minority managerial ownership. High managerial ownership could be considered a stake around 10%. 6 Financing of an MBO often requires external financing and only qualified managers might be able to raise external finance. 7 As Shleifer and Vishny (1997) point out state ownership can be viewed as relation between a principal and two agents. The principal are the individuals (citizens), who are the ultimate owners of the firm. Being dispersed they have no ability and resources to monitor the state, i.e., the politicians and bureaucrats, who act as the first agent and who in themselves have to monitor managers, the second agent. Both agents have usually objectives quite different from those of the principals and they can easily collude to pursue their objectives at the expense of the principals. 8 Except for the time index the firm’s maximization problem has to be written with a firm identification index. Given that it plays no role in altering the solution to the problem, in order not to complicate notation that index is dropped. 9 The solution of the model is available from the author upon request. 10 Examples of such inconsistencies are firms reporting zero labor force or capital or sales, or reporting ownership shares whose sum is lower or larger than 100. The following seven criteria were applied to the data: the firm’s capital at the beginning and the end of the period should be positive, investment should be non-negative, investment should be smaller than end of period capital stock, sales should be positive, the average employment per year should be positive and equal to or greater than 10, labor cost in a given year should be positive and ownership shares should add up to 100. 11 If the focus of the analysis had been simply the effect of private ownership versus state ownership these firms would have been classified as private ones. As the identity of private owners, however, matters in explaining differences in observed behavior, these firms end up being classified as state owned. 12 As the number of observations for former employee owned firms does not allow independent analysis of this group, these firms are included in the employee owned firms group. 13 Firms are divided into three size groups according to their average employment in a given year. The first group includes firms with 49 or fewer employees, the second includes firms with more than 49 employees and fewer than 101, and the third group includes firms with more than 101 employees. 14 This bias is caused by the property rights designation within the firm and the imperfection of the market for shares.
34
15 When privatization through auctions started, domestic outsiders had the possibility to pay by installments and through vouchers, while foreigners did not have this possibility. Later on, this was changed, but, in the meantime, it created incentives for foreigners to bypass the law and acquire enterprises through established domestic holdings. 16 Kalmi (2002) presents some evidence of this phenomenon occurring in the privatization of state and collective farms. 17 This does not however preclude the possibility that they, for example, might ally themselves with a core institutional investor or other individual investors and, consequently, exercise their ownership and control rights as “real” outsiders. 18 These criteria are selected among alternative definitions such as to minimize errors. This does not mean, however, that all errors are eliminated and we acknowledge that there are errors in both directions.
B I B L I O G R A P H Y
Angrist, Joshua D. and Alan B. Krueger, 2001, ‘Instrumental Variables and the Search for
Identification: From Supply and Demand to Natural Experiments’, Journal of Economic
Perspectives 15(4), 69-85.
Arellano, Manuel and Stephen R. Bond, 1991, ‘Some Tests of Specification for Panel Data:
Monte Carlo Evidence and an Application to Employment Equations’, Review of Economic
Studies 58(194), 277-297.
Athey, M. J. and P. Laumas, 1994, ‘Internal Funds and Corporate Funds in India’, Journal of
Development Economics 45, 287-303.
Audretch, David B. and Julie Ann Elston, 2002, ‘Does Firm Size Matter? Evidence on the
Impact of Liquidity Constraints on Firm Investment Behavior in Germany’, International
Journal of Industrial Organization 20(1), 1-17.
Bond, Stephen R. and Costas Meghir, 1994, ‘Dynamic Investment Models and the Firm's
Financial Policy’, Review of Economic Studies 61(207), 197-222.
Cleary, Sean, 1999, ‘The Relationship Between Firm Investment and Financial Status’, The
Journal of Finance 54(2), 673-692.
Davidson, R. and J. G. MacKinnon, 1981, ‘Several Tests for Model Specification in the
Presence of Alternative Hypotheses’, Econometrica 49, 781-793.
1
Devereux M. and F. Schaintarelli, 1990, ‘Investment, Financial Factors and Cash Flow:
Evidence from UK Panel Data’, in Glenn R. Hubbard (eds.), Asymmetric Information,
Corporate Finance and Investment, University of Chicago Press: pp. 279-306.
Djankov, Simeon, 1999, ‘The Restructuring of Insider-Dominated Firms: A Comparative
Analysis’, Economics of Transition 7(2), 467-479.
Dow, Gregory K., 2003, Governing the Firm: Workers’ Control in Theory and Practice,
Cambridge University Press.
Earle, John and Saul Estrin, 1996, ‘Employee Ownership in Transition’, in Roman Frydman,
Chery W. Gray and Andrzej Rapaczynski (eds.), Corporate Governance in Central Europe
and Russia, Volume 2, Central European University Press, pp. 1-62.
Fazzari, Steven M., Glenn R. Hubbard and Bruce C. Petersen, 1988, ‘Financing Constraints
and Corporate Investment’, Brooking Papers on Economic Activity 1, 141-200.
Filer, Randall K. and Jan Hanousek, 2002, ‘Data Watch: Research Data from Transition
Economies’, Journal of Economic Perspectives 16(1), 225-240.
Galeotti, Marzio, Fabio Schiantarelli and Fidel Jaramillo, 1994, ‘Investment Decisions and
the Role of Debt, Liquid Assets and Cash Flow: Evidence from Italian Panel Data’, Applied
Financial Economics 4(2), 121-132.
2
Goergen, Marc and Luc Renneboog, 2001, ‘Investment Policy, Internal Financing and
Ownership Concentration in the United Kingdom’, Journal of Corporate Finance 7, 257-284.
Hadlock, Charles J., 1998, ‘Ownership, Liquidity and Investment’, RAND Journal of
Economics 29(3), 487-508.
Hansmann, Henry, 1996, The Ownership of Enterprise, Belknap Press, Cambridge, MA.
Hoshi, Takeo, Anil Kashyap and David Scharfstein, 1991, ‘Corporate Structure, Liquidity and
Investment: Evidence from Japanese Industrial Groups’, Quarterly Journal of Economics
106(1), 33-60.
Hooks, Linda W., 2003, ‘The Impact of Firm Size on Bank Debt Use’, Review of Financial
Economics 12, 173-189.
Hubbard, Glenn R., Anil Kashyap and Toni M. Whited, 1995, ‘Internal Finance and Firm
Investment’, Journal of Money, Credit and Banking 27(3), 683-701.
Hu, Xiaoqiang and Fabio Schiantarelli, 1998, ‘Investment and Capital Market Imperfections:
A Switching Regression Approach Using U.S. Firm Panel Data’, The Review of Economics
and Statistics 80(3), 466-479.
Kalmi, Panu, 2002, ‘On the (In)stability of Employee Ownership: Estonian Evidence and
Lessons for Transition Economies’, Ph.D. Dissertation. Copenhagen Business School, Ph.D.
Serie 10.
3
Kaplan, Steven N. and Luigi Zingales, 1997, ‘Do Investment-Cash Flow Sensitivities Provide
Useful Measures of Financing Constraints’, Quarterly Journal of Economics 112(1), 169-215.
Lizal, Lubomir and Jan Svejnar, 1998, ‘Enterprise Investment During the Transition:
Evidence From Czech Panel Data’, CEPR Discussion Paper Series, No. 1835.
Lizal, Lubomir and Jan Svejnar, 2002, ‘Investment, Credit Rationing and the Soft-Budget
Constraint: Evidence From Czech Panel Data’, Review of Economics and Statistics 84(2),
353-370.
Masso, Jaan, 2002, ‘Financing Constraints as Determinants of the Investment Behavior of
Estonian Firms’, Baltic Journal of Economics 3(1), 8-30.
Oliner, Stephen D. and Glenn D. Rudebusch, 1992, ‘Sources of the Financing Hierarchy for
Business Investment’, The Review of Economics and Statistics 74(4), 643-654.
Petersen, Mitchell A. and Raghuran G. Rajan, 1994, ‘The Benefits of Lending Relationships:
Evidence From Small Business Data’, The Journal of Finance 59(1), 3-37.
Schaller, Huntley, 1993, ‘Asymmetric Information, Liquidity Constraints and Canadian
Investment’, Canadian Journal of Economics 26(3), 552-574.
4
Stein, Jeremy C., 2003, ‘Agency, Information and Corporate Investment’, in George M.
Constantinides, Milton Harris and Rene M. Stultz (eds.), Handbook of Economics and
Finance, Volume 1, Elsevier North Holland, pp. 111-166.
Shleifer, Andrei and Rober W. Vishny, 1997, ‘A Survey of Corporate Governance’, The
Journal of Finance 52(3), 737-783.
Vogt, S. C., 1994, ‘The Cash Flow Investment Relationship: Evidence from US
Manufacturing Firms’, Financial Management 23(2), 3-20,
Ward, Benjamin, 1958, ‘The Firm in Illyria: Market Syndicalism, American Economic
Review 48(4), 566-589.
Whited, Toni M., 1992, ‘Debt, Liquidity Constraints and Corporate Investments: Evidence
From Panel Data’, The Journal of Finance 53(4), 1425-1460.