Embed Size (px)
Citation preview
Author's Accepted Manuscript
Corporate Goodness and Shareholder Wealth
Philipp Krüger
PII: S0304-405X(14)00192-5DOI: http://dx.doi.org/10.1016/j.jfineco.2014.09.008Reference: FINEC2472
To appear in: Journal of Financial Economics
Cite this article as: Philipp Krüger, Corporate Goodness and ShareholderWealth, Journal of Financial Economics, http://dx.doi.org/10.1016/j.jfine-co.2014.09.008
This is a PDF file of an unedited manuscript that has been accepted forpublication. As a service to our customers we are providing this early version ofthe manuscript. The manuscript will undergo copyediting, typesetting, andreview of the resulting galley proof before it is published in its final citable form.Please note that during the production process errors may be discovered whichcould affect the content, and all legal disclaimers that apply to the journalpertain.
www.elsevier.com/locate/jfec
Corporate Goodness and Shareholder Wealth�
Philipp Krugera
aUniversite de Geneve, Geneva Finance Research Institute (GFRI), UNIMAIL, Bd du Pont d’Arve 40, 1211 Geneva 4, Switzerland
Abstract
Using a unique data set, I study how stock markets react to positive and negative events concerned with a firm’s cor-porate social responsibility (CSR). I show that investors respond strongly negatively to negative events and weaklynegatively to positive events. I then show that investors do value “offsetting CSR,” that is positive CSR news concern-ing firms with a history of poor stakeholder relations. In contrast, investors respond negatively to positive CSR newswhich is more likely to result from agency problems. Finally, I provide evidence that CSR news with stronger legaland economic information content generates a more pronounced investor reaction.
Keywords: Corporate Social Responsibility, Corporate Sustainability, Agency Costs, Event Study, CorporateGovernanceJEL: M14, G14, D21, L21
1. Introduction
Economic theory suggests that companies should notinternalize the negative externalities they exert on non-shareholding stakeholders such as communities, employ-ees, or the environment (see, e.g., Pigou, 1920). Similarly,Friedman (1970) declared in his well known New YorkTimes essay that the sole “social responsibility of busi-ness is to increase its profits.” Nevertheless, companiescontinue to channel significant resources to improvingtheir relations with key stakeholders. Although putting anaccurate figure on exactly how much large corporationsspend on corporate social responsibility (CSR) initiatives
�I thank the referee Leonard Kostovetsky for his constructive com-ments and suggestions. I am also grateful for comments and sugges-tions by Bruno Biais, Chiara Canta, Gunther Capelle-Blancard, Cather-ine Casamatta, Julian Franks, Rajna Gibson-Brandon, Denys Glushkov,Christian Gollier, Augustin Landier, Baptiste Massenot, SebastienPouget, Bill Schwert, Henri Servaes, David Sraer, Rene Stulz, and DavidThesmar. I thank the BSI GAMMA Foundation for providing a researchgrant. Financial support from Geneve Place Financiere is also greatlyacknowledged.
Email address: [email protected] (Philipp Kruger)
is difficult, Hong, Kubik, and Scheinkman (2012) quoteanecdotal evidence showing that annual CSR outlays oflarge U.S. corporations can and do end up in the hundredsof millions of dollars.
At the same time, an impressive body of research hasbeen devoted to understanding whether and how invest-ments in stakeholder relations impact a firm’s profitabil-ity. Yet, much of this research has yielded inconclusive re-sults: some studies find a positive relation, whereas othersshow a negative or no relation at all. Margolis, Elfenbein,and Walsh (2007) conduct a meta-analysis of many suchempirical studies and conclude that the average relationbetween CSR and profitability is positive but small. Inthe present paper, I revisit the salient question of whetherand how CSR matters for shareholder value by analyzinghow investors react to positive and negative CSR events1
in the short-run.
Some have argued that CSR is simply the manifes-tation of agency problems inside the firm (see Tirole,
1The Internet appendix contains numerous examples of the kind ofevents analyzed in the paper.
Preprint submitted to Elsevier September 13, 2014
2001; Benabou and Tirole, 2010; Cheng, Hong, and Shue,2013). According to this line of thought, CSR primar-ily benefits managers who, at the expense of sharehold-ers, earn a good reputation among key stakeholders (e.g.,local politicians, non-governmental organizations, or la-bor unions). Consequently, this agency perspective im-plies that positive news about CSR is bad news for share-holders. In contrast, an alternative perspective holds thatcompanies engage with stakeholders for value-enhancingpurposes. This view is sometimes referred to as “do-ing well by doing good,” and Edmans (2011), Dimson,Karakas, and Li (2013), Derwall, Guenster, Bauer, andKoedijk (2005), Flammer (2013a), Servaes and Tamayo(2013), or Dowell, Hart, and Yeung (2000) provide ex-amples of mechanisms through which CSR can enhanceshareholder wealth. Under this value-enhancing view ofCSR, managers engage with stakeholders simply becausesuch projects are deemed to have positive net presentvalue (NPV), and thus, positive news about CSR shouldbe received favorably by shareholders. In this paper, Idisentangle the short-run shareholder value implicationsof such agency and value-motivated CSR and provide ev-idence consistent with the view that when CSR is morelikely to be driven by agency problems, it is detrimen-tal to shareholder value. In contrast, shareholders tend toreact positively to CSR news whenever it is more likelyto be the result of the firm addressing problematic stake-holder relations by “offsetting” previous corporate socialirresponsibility.2
The second contribution of this paper is to provideunique short-run event study evidence on the share-holder value implications of CSR data by Kinder, Lyden-berg, and Domini Research and Analytics (KLD), a dataprovider whose measures are widely used in the financialeconomics literature (see, e.g., Statman and Glushkov,2009; Gillan et al., 2010; Hong and Kostovetsky, 2012;Hong et al., 2012; Cheng et al., 2013; Di Giuli and Kos-tovetsky, 2014; Albuquerque et al., 2013; Servaes andTamayo, 2013; Deng et al., 2013).3 Thirdly, this paper
2Kotchen and Moon (2012) show that firms do indeed respond toprevious negative external events (e.g., lawsuits, controversies) by sub-sequently improving their stakeholder relations.
3Statman and Glushkov (2009) use KLD’s measures to examine theperformance of CSR-screened equity portfolios. Gillan, Hartzell, Koch,and Starks (2010) study the extent to which the measures are related
provides thought-provoking and novel insights into themeasurement and value implications of CSR by relyingon textual analysis in the spirit of Tetlock (2007): I show,for instance, that investors react more strongly to CSRnews containing strong economic and legal informationcontent. Finally, the present paper is innovative becauseit explicitly addresses two methodological concerns thatare pervasive in research concerned with CSR, namely,(i) measurement error and (ii) reverse causality.
Measurement error is an issue in research that examinesthe value implications of CSR because of the difficulty inaccurately quantifying CSR given the qualitative nature ofmany CSR-related issues. In addition, no legally bindingstandards exist that require publicly listed companies toreport coherently and, above all, truthfully on the extentto which they impose positive or negative externalities ontheir stakeholders. Although numerous private and non-private sector reporting and certification initiatives exist,4
regulators such as the Securities and Exchange Commis-sion (SEC) have only tentatively started to explore the no-tion of making the disclosure of environmental and socialinformation a mandatory listing requirement for publicfirms.5 Another reason why accurately measuring a firm’s
to operating performance, efficiency, compensation practices, tradingby institutional investors, and valuation. Hong and Kostovetsky (2012)show that Democrat-leaning fund managers tend to invest more sociallyresponsibly. Hong, Kubik, and Scheinkman (2012) provide evidencethat less financially constrained firms score higher on KLD’s measures.Cheng, Hong, and Shue (2013) present evidence of an agency theoreticperspective on CSR in which managers engage in unproductive CSR as away to enjoy private benefits. Di Giuli and Kostovetsky (2014) show thatfirms with Democratic-leaning chief executive officers (CEOs) are moresocially responsible. Albuquerque, Durnev, and Koskinen (2013) showthat CSR decreases systematic risk and increases firm value. Servaesand Tamayo (2013) show that KLD’s measures are positively related tofirm value for firms with high customer awareness. In the context ofMergers and Acquisitions, Deng, Kang, and Sin Low (2013) show thatCSR creates value for acquiring firms’ shareholders.
4See, for instance, the International Organization for Standard-ization (ISO) 14000 family regarding “Environmental Management”http://www.iso.org, the Global Reporting Initiative http://www.
globalreporting.org/, the Sustainability Accounting StandardsBoard http://www.sasb.org/, the Carbon Disclosure Project http://www.cdproject.net, the International Integrated Reporting Coun-cil http://www.theiirc.org, the Climate Disclosure StandardsBoard http://www.cdsb.net, or social rating agencies such as MSCIhttp://www.msci.com/products/esg/stats or Thomson Reutershttp://thomsonreuters.com/esg-research-data.
5See the SEC’s Environmental, Social, and Governance Dis-
2
stakeholder relations remains difficult is that overall mea-sures of the effects of corporate actions on the welfare ofstakeholders do not exist. For example, corporate poli-cies that benefit communities might turn out to be harm-ful to employees. Hence, coming up with a measure ofoverall stakeholder value is particularly challenging (seeTirole, 2001). Finally, outsiders (e.g., investors or regula-tors) cannot observe firm choices regarding CSR, imply-ing that measures are likely to be biased, because firmshave an incentive to greenwash, i.e., overstate their goodand understate their bad deeds.
To overcome these measurement challenges, this paperfocuses on outcomes of corporate behavior in the formof publicly observable events. I do so by constructinga unique data set of 2,116 corporate events with eitherpositive or negative implications for the wellbeing of afirm’s main stakeholders (e.g., communities, customers,the environment, or employees). In contrast to priorresearch, which focuses strongly on analyzing largelytime-invariant CSR ratings,6 the event-related data in thepresent study are of point-in-time nature. Focusing onpublicly observable events is akin to studying changesin shareholder value at instances during which investorsupdate their beliefs about a firm’s stakeholder relations.Using such high-frequency point-in-time CSR measuresallows for the precise measurement of both the date andinformation content of the events, enabling me to crediblyaddress the measurement error problem.
Relying on short-run event study methodology allowsfor the effective handling of the second problem in re-
closure Work Plan at http://www.sec.gov/spotlight/
invadvcomm/iacmeeting022210-minutes.pdf. Notable ex-ceptions are the UK and the European Union. Since 2013,the London Stock Exchange requires UK incorporated firmslisted on the Main Market to disclose their greenhouse gasemissions. See http://www.gov.uk/government/news/
leading-businesses-to-disclose-greenhouse-gas-emissions.In a similar spirit, The European Parliament adopted on 15 April 2014the EU Non-Financial Reporting Directive, which will require largecompanies and groups to disclose information on policies, risks, andresults regarding environmental matters, social and employee-relatedaspects, respect for human rights, anti-corruption and bribery issues,and diversity on boards of directors. See http://europa.eu/rapid/press-release_STATEMENT-14-124_en.htm.
6A notable exception is Flammer (2013b), who studies the passageof close-call CSR-related shareholder proposals and provides causal ev-idence in favor of the view that CSR enhances shareholder value.
search concerned with the value implications of CSR,i.e., the omnipresent reverse causality issue: studies thatregress portfolio returns of trading strategies or other an-nual measures of firm value (e.g., Tobin’s q) on low-frequency measures of CSR (e.g., annual ratings) can-not address the basic question of whether companies dowell because they do good or whether they do good be-cause they do well. Hence, the mere observation of apositive correlation between some low-frequency CSRmeasure and value is consistent with at least two differ-ent interpretations: either more responsible firms tend tobe more profitable or, alternatively, more profitable firmstend to channel more resources into projects that increasethe wellbeing of stakeholders. In fact, Hong, Kubik, andScheinkman (2012) provide causal evidence that less fi-nancially constrained firms tend to have better CSR per-formance, which is somewhat consistent with the latterview.
Because this paper examines short-run changes inshareholder value in response to high-frequency changesin CSR, I can plausibly mitigate these reverse causalityconcerns. This is because the short-run stock market re-action gives a direct estimate of the NPV associated withan event, and the precise knowledge of the timing as wellas the information contained in an event allows discard-ing alternative explanations for changes in shareholdervalue. On the contrary, research relating long-run returnsor annual measures of valuation or profitability to low-frequency (e.g., annual) measures of CSR cannot crediblyrule out that a positive relation between CSR and prof-itability is in fact driven by a latent factor, which is cor-related with both the firm’s profitability and its commit-ment to CSR. Finally, long-run studies are also sensitiveto the presence of confounding effects because, after all, aplethora of value-relevant events which are not necessar-ily related to CSR occur throughout a year.
I show that investors react strongly negatively to thearrival of negative CSR news. The negative reaction isparticularly pronounced for information regarding com-munities and the environment. Declining stock prices fol-lowing the release of negative stakeholder information isconsistent with the view that there is a substantial andnon-negligible cost associated with social irresponsibil-ity. The median cost of negative CSR, which I calculateas the product of the median sample market capitaliza-tion and the median 21-day cumulative abnormal return
3
(CAR), is approximately $76 million. Although such anegative stock market reaction is a necessary conditionfor CSR to be in the shareholder’s best interest, it doesnot yield a sufficient condition. This is because negativeshareholder wealth effects with respect to negative eventsprovide no insights into the costs associated with imple-menting policies aimed at reducing the likelihood of neg-ative events.
Turning to the analysis of positive events, this paperprovides evidence that investors respond slightly nega-tively to the release of positive CSR news. Again, the re-action is most pronounced when the news concerns com-munities or the environment. However, the negative reac-tion with respect to positive information is much weaker,both economically and statistically. The weakly negativereaction to positive news regarding CSR suggests that, un-conditionally, investors do not appreciate the implemen-tation of CSR policies. Focusing on the average stockmarket reaction with respect to positive events might bedisguising, however, that CSR-related policies could en-hance shareholder value under certain circumstances. Aspreviously outlined, it could be that dependent on certainconditions (e.g., the desire to improve poor environmen-tal policies or to make a notoriously dangerous workplacesafer by investing in health and safety measures), CSRprojects may actually have positive NPV. To explore thisidea of conditionality, I separate positive events accordingto whether they are more likely to be the result of agencyproblems or the firm’s desire to offset previous episodesof corporate social irresponsibility.
First, I measure agency problems in the spirit ofJensen (1986) by focusing on book leverage and liquid-ity. High leverage constrains managers to spend cor-porate resources sensibly, whereas high liquidity pro-vides greater scope for wasteful spending through nega-tive NPV projects. Hence, high leverage and low liquidityshould indicate fewer agency concerns, and positive CSRevents involving such firms should bring about more posi-tive stock market reactions. Second, I build on a recent pa-per by Kotchen and Moon (2012) showing that firms thatdo more harm to stakeholders tend to “offset” such corpo-rate social irresponsibility by improving their stakeholderpolicies in the future. In line with this view, I argue thatthe extent to which companies face problems with theirstakeholders at the occurrence of an event is a reasonableproxy for whether the positive CSR event is more likely
to be the result of value- or agency-motivated corporatepolicies. As such, positive events concerning firms withpoor stakeholder relations should be received more posi-tively by shareholders than events concerning firms withno apparent controversies.
The analysis largely confirms the view that the valueimplications of positive CSR events do depend on the mo-tivation for stakeholder engagement. First, positive eventsconcerning high-leverage and low-liquidity firms turn outto generate significantly higher cumulative abnormal re-turns (CARs). Likewise, and in line with the idea that off-setting CSR in the spirit of Kotchen and Moon (2012) hasdifferent shareholder value implications, positive eventsregarding companies with known controversies generatea significantly more positive stock market reaction thanpositive events concerning firms with no apparent stake-holder problems. Taken together, the results from analyz-ing the cross section of CARs provide an economic justifi-cation, and thus a sufficient condition for companies withbad stakeholder relations to improve their CSR policies.
The remainder of the paper is organized as follows. Thenext section provides an overview of the related literature.Section 3 introduces the sources of the data. Section 4presents the baseline event study results. In Section 5, Ipresent the results from examining the value implicationsof agency-motivated and offsetting CSR. In Section 6, Iexamine the textual characteristics of the events and re-late CARs to the textual variables before concluding inSection 7.
2. Related literature
This paper contributes to several strands of research.First, it is related to the extensive literature studying thelink between CSR7 and corporate value. For example, Ed-mans (2011) provides evidence of risk-adjusted excess re-turns for portfolios comprising firms with high employeesatisfaction. Derwall, Guenster, Bauer, and Koedijk(2005) show that portfolios of companies with strong en-vironmental responsibility generate risk-adjusted excess
7For a literature review on the economics of CSR, see Kitzmuellerand Shimshack (2012). For more general overviews of issues relatedto CSR and socially responsible investing (SRI), see Landier and Nair(2009), Heal (2005, 2008), and Carroll, Lipartito, Post, and Werhane(2012).
4
returns.8 Statman and Glushkov (2009) and Kempf andOsthoff (2007) show that portfolios comprising firms withstrong CSR policies perform better than portfolios con-sisting of weak CSR companies. In contrast, Geczy,Stambaugh, and Levin (2003), Renneboog, Ter Horst,and Zhang (2008), or Hong and Kacperczyk (2009) showthat SRI funds or SRI-screened portfolios underperform,whereas Hamilton, Jo, and Statman (1993), Kurtz andDiBartolomeo (1996), Guerard (1997), Bauer, Koedijk,and Otten (2005), or Schroder (2007) find no (risk-adjusted) performance differences between SRI mutualfunds/indices and conventional ones. Another recent pa-per in the CSR-financial performance literature is Eccles,Ioannou, and Serafeim (2013), who show a positive linkbetween a firm’s financial and corporate sustainabilityperformance.
This paper differs from those stated above primarily be-cause it focuses not only on higher frequency measures ofCSR, but also on event study methodology and short-runvalue implications. The present paper is by far not the firstto apply event study methodology to the study of CSR.For example, Karpoff, Lott, and Wehrly (2005), Becchetti,Ciciretti, Hasan, and Kobeissi (2012), Fisher-Vanden andThorburn (2011), Capelle-Blancard and Laguna (2010),Flammer (2013a), Deng, Kang, and Sin Low (2013), orAktas, De Bodt, and Cousin (2011) also focus on eventstudy methodology in the CSR context. However, thepresent paper makes important contributions with respectto these studies, because it examines the individual impor-tance of a large variety of different aspects of CSR (e.g.,product safety, use of clean energy, workplace safety vi-olations, or human rights abuses). In addition, prior pa-pers employing event study methodology have neither ad-dressed the trade-off between agency and offsetting CSR,nor have they applied textual analysis to the study of CSR.
The present paper is also closely related to a contempo-raneous paper, which studies the shareholder value impli-cations of Environmental, Social, and Governance (ESG)shareholder engagements carried out by a large institu-tional investor (see Dimson, Karakas, and Li, 2013). Theauthors provide evidence that successful engagements
8Chava (2011), Bauer and Hann (2010), and Konar and Cohen(2001) provide further evidence on the impact of environmental policieson firm value, credit risk, or the cost of capital.
with respect to climate change and corporate governanceissues generate positive shareholder value effects. Theiranalysis is somewhat consistent with the evidence pro-vided in the present paper but differs in an important re-spect: whereas Dimson, Karakas, and Li (2013) analyzehow private ESG information (i.e., shareholder engage-ments) is incorporated into corporate valuations, my pa-per focuses on how markets process public environmen-tal and social information in the short-run. Reassuringly,however, both papers allow for similar conclusions.
Moreover, the paper is also related to the growing liter-ature dealing with theories of stakeholder-oriented firms(see Allen, Carletti, and Marquez, 2014; Jensen, 2001;Magill, Quinzii, and Rochet, 2013) and theories of SRIinvestors (Heinkel, Kraus, and Zechner, 2001; Gollier andPouget, 2014). Finally, the paper contributes to the liter-ature on determinants of CSR. In this stream of research,Hong, Kubik, and Scheinkman (2012) study the role offinancial constraints for corporate policies aimed at in-creasing stakeholder welfare and provide evidence thatless financially constrained firms care more about stake-holders. Di Giuli and Kostovetsky (2014) study how polit-ical opinions of the main executives affect the stakeholderrelations of a company, and provide evidence that Demo-cratically leaning executives tend to pay more attentionto stakeholders than Republican ones. Cheng, Hong, andShue (2013) provide evidence that agency problems havean important bearing on a firm’s CSR. Liang and Ren-neboog (2013) examine whether legal origins and polit-ical institutions shape the trade-off between shareholderand stakeholder rights. Other papers in this branch ofthe literature study the role of governance mechanisms(see Kacperczyk, 2009; Barnea and Rubin, 2010; Kruger,2010).
3. Data and summary statistics
The data used in this paper come from KLD, now partof MSCI.9 KLD is an information intermediary that spe-cializes in quantifying stakeholder relations of publicly
9Kinder, Lydenberg, and Domini Research and Analytics was ac-quired by the RiskMetrics Group in November 2009. In turn, MSCI(http://www.msci.com), a leading provider of investment decisionsupport tools, acquired RiskMetrics in June 2010.
5
listed firms. To quantify ESG performances, KLD’s an-alysts rely to a large extent on publicly available infor-mation gathered through customized press searches. Dur-ing this process, the analysts single out information rele-vant to measuring a firm’s ESG performance. One impor-tant source of information is news stories about corporateevents that have welfare implications for the firm’s stake-holders. Examples of these events include a newspaper ar-ticle about poor labor relations at one of the firm’s plantsor a critical report published by a non-governmental or-ganization regarding the disposal of toxic waste. The In-ternet appendix contains numerous representative events.If an event is deemed sufficiently important in terms ofits ESG impact, the analysts at KLD record and classifythe event based on pre-established criteria. KLD classifiesevents into one of the following stakeholder issue areas:
1. Community2. Corporate governance3. Diversity4. Employee relations5. Environment6. Human rights7. Product
In each of the seven issue areas, KLD has defined aset of binary indicator variables, which are either posi-tive (Strengths), or negative (Concerns). For example, apositive indicator might be concerned with the work-lifebenefits a company offers to its employees, and a nega-tive employee relations indicator could be concerned withpoor union relations. In essence, KLD’s analysts matchpublicly available information with the most appropriatepositive or negative indicator.10
In this paper, I eliminate the corporate governance is-sue area, mainly because previous research has shownthat KLD’s corporate governance issue area differs fromthe other issue areas (see Hong, Kubik, and Scheinkman,2012). Furthermore, there are doubts about whether KLDmeasures corporate governance in the traditional sense.Also, improving corporate governance does not neces-sarily require monetary investments, while improving the
10See the KLD STATS manual at http://wrds.wharton.upenn.edu for more information on the different binary indicators and issueareas.
welfare of other stakeholders most often requires pecu-niary outlays. In addition, it is unclear whether sharehold-ers should be thought of as stakeholders in the context ofCSR and dismissing the corporate governance issue areaallows for a focus on the firm’s primary nonsharehold-ing stakeholders. To construct the data set, I rely on twodifferent KLD products, namely, KLD Socrates and the@KLD newsletters.
3.1. KLD SocratesKLD Socrates is a database containing complete ESG
profiles for a large number of publicly listed U.S. firms.The information in these profiles forms the basis for con-structing the widely studied KLD STATS measures ofCSR (see, for instance, Hong and Kostovetsky, 2012;Hong, Kubik, and Scheinkman, 2012; Cheng, Hong,and Shue, 2013; Waddock and Graves, 1997; Chatterji,Levine, and Toffel, 2009). For each firm, KLD’s analystscollect relevant ESG information and include it in the re-spective Socrates company profile. Fig. 1 shows a screen-shot of parts of Apple Inc.’s Socrates profile.
[Insert Fig. 1 here]
KLD organizes the information contained in the pro-files around the seven different issue areas and accordingto whether the information is deemed positive or nega-tive for the stakeholder. For example, the following eventregarding the food-processing and commodities-tradingfirm Archer Daniels Midland Company11 was filed un-der the negative indicator “Other Concern” in the envi-ronment issue area:
In May 2006, the Political Economy ResearchInstitute (PERI) included ADM on its Toxic 100,a list of the top 100 corporate air polluters inthe U.S. ADM ranked tenth on the Toxic 100,which is based on the quantity and toxicity ofhundreds of chemicals released into the air.
Within the database, companies are identified by theirticker symbol. I download all available company profilesand isolate text elements containing references to events.Often, the description of the corporate events contained in
11http://www.adm.com
6
the Socrates profiles commence with expressions such as“In August 2004,” “In 2004,” or “A 2004 New York Timesarticle...” This systematic character of the event descrip-tions allows parsing the events by relying on regular ex-pressions. I retain all events with explicit time referencesand run a Factiva search to obtain the date on which thenews item to which KLD is referring to became publiclyavailable. For each retained event from the KLD Socratesdatabase, I collect the company ticker, event description,issue area (e.g., community, etc.), indicator (e.g., OtherStrength), and event date (i.e., the date the event occurredor, more generally, the date on which the information be-came publicly available). I retain all events with time ref-erences that fall between 2001 and 2007.
3.2. @KLD newsletters
In addition to maintaining the Socrates database withcompany profiles of the aforementioned form, KLD usedto send out irregularly spaced newsletters, which con-tained the most noteworthy CSR-related news stories re-tained by the analysts. I obtain a sample of 92 suchnewsletters between August 2001 and April 2007 and ex-tract all events. Each event in a given newsletter containsthe following information
• Company name (e.g., Allied Capital Corporation)
• Company ticker (e.g., ALD)
• KLD Issue Area (e.g., environment)
• KLD Social Indicator (e.g., Other Concern)
• Event description
• Event date (e.g., 11/12/2006)
The event date refers to the point in time when the in-formation reported in the newsletter is publicly released.For example, this date may correspond with the date onwhich a newspaper article on a socially controversial topicis published, a regulatory filing is made, or irresponsiblecorporate behavior is reported by a non-governmental or-ganization. Analysts at KLD systematically collect thesedates and include them in the @KLD newsletters. Fig. 2shows a screenshot of such a newsletter.
[Insert Fig. 2 here]
3.3. Relation between events and KLD STATS
KLD also provides a set of binary indicators (KLDStrengths and Concerns) that quantify the effect firmshave on the welfare of their main stakeholders. These in-dicators are known as KLD STATS.12 In the process ofconstructing KLD STATS indicators, KLD relies heavilyon the type of events analyzed in this paper (e.g., news-paper articles, Non-governmental organization (NGO) re-ports, regulatory reports, or company rankings). In fact,the occurrence of such firm-specific events has an impor-tant influence on KLD’s decision to assign a certain con-cern or strength to a company. For example, the inclusionof General Electric in the 100 Best Workplaces for Work-ing Mothers Ranking in 2003 (see Fig. 2) resulted in KLDsubsequently assigning a family benefits strength to Gen-eral Electric.
However, firm-specific events such as those gatheredin KLD Socrates or the @KLD newsletters constitutean important, but not the only component in determin-ing KLD Strengths or Concerns. This statement is evi-denced by the fact that the correlation between the KLDSTATS scores and the number of events is imperfect.Hence, changes in KLD’s scores exist which cannot be at-tributed to the occurrence of specific events. For example,such changes can be the result of information obtainedby KLD through company interviews or questionnaires.Nonetheless, events are an important element in deter-mining KLD’s STATS scores. Empirically, it turns outthat whenever events in a given issue area occur, scores inthat issue area increase somewhat permanently. In otherwords, an environmental accident results in a companybeing attributed an environmental concern for several ofthe subsequent years.
In analysis reported in the Internet appendix, I regressKLD scores by issue area in year t on the number of eventsin that issue area in years t, t − 1, and t − 2. The resultsshow that scores depend strongly not only on the num-ber of contemporaneous events, but also on the numberof past events. In fact, lagged events appear to have astronger association with current KLD scores, underpin-ning the notion that following the occurrence of events,
12STATS stands for Statistical Tool for Analyzing Trends in So-cial and Environmental Performance. See: http://www.msci.com/
products/esg/stats/.
7
scores change permanently for at least a couple of years.The finding that current scores depend more strongly onlagged events is also largely consistent with anecdotal ev-idence from KLD that scores are updated once a year toaccount for newly arrived information from the previousyear(s) and could explain the positive autocorrelation orstickiness present in KLD STATS data.
3.4. Event selection
I join all events from the @KLD newsletters with theparsed events from the KLD Socrates database for whichI can identify an event date. Whenever a positive anda negative event for a company fall on the same day, Idrop both events from the analysis. I check and removeall events with ambiguous time stamps. I also manu-ally check on Factiva for confounding events and whetherKLD’s reported event date coincides with the date theinformation is publicly released. I remove events withconfounding events and, in most of the cases, the eventdate in Factiva coincides with the event date included inthe @KLD newsletter. Furthermore, I perform company-specific Factiva searches for a random subsample of 250firms to check whether KLD systematically misses rele-vant events, but do not find this to be the case.
Next, I match daily stock prices and returns with thevalue-weighted market index from the Center for Re-search in Security Prices (CRSP) as well as balance sheetand income statement items from Compustat. I also ob-tain KLD STATS scores for the sample firms. I drop allevents for which the average daily closing price over theprevious year has been lower than $3 to mitigate a biasedmeasurement of shareholder value effects due to extremeabnormal returns of penny stocks. The sample selectionprocedure yields a final sample of 2,116 events concern-ing 745 different firms between 2001 and 2007. Table 1shows the distribution of events by issue area.
[Insert Table 1 here.]
Table 1 reveals that KLD records more negative thanpositive events. Out of a total of 2,116 events, 1,542 wereclassified as negative, while 574 were deemed positive interms of CSR. In addition, the relative importance of is-sue areas (e.g., community, environment, human rights)differs substantially for positive and negative events. For
example, issues related to a company’s diversity, the envi-ronment, or the firm’s relation with communities make upalmost 60% of the set of positive events. In contrast, neg-ative events are largely dominated by matters related tothe firm’s products and its relation with customers. Assuch, the majority of negative events pertains to issuessuch as product safety or fraudulent marketing and con-tracting practices. Hence, an important element of KLD’sdefinition of CSR deals with the wellbeing of a firm’s cus-tomers.
[Insert Table 2 here.]
Table 2 shows summary statistics for some firm-levelvariables. The median sample firm has approximately20,000 Employees, a Market cap of about $6.86 billion,and Assets of $8.65 billion. During the sample period(2001–2007), median Employees, Market cap, and Assetsfor the entire Compustat universe are about 500, $147 mil-lion, and $249 million, respectively. Hence, the mediansample firm corresponds roughly to the 90th percentilefirm in the Compustat universe, and the sample seemsskewed toward large firms. Table 2 also reports Liquidity,defined as cash and short-term investments (Compustatitem che) scaled by total assets (item at), Book leveragedefined as total liabilities (item lt) scaled by total assets,and the S&P issuer credit rating, which is defined as themedian Standard & Poor’s (S&P) domestic long-term is-suer credit rating in a given year. The medians of thesevariables are approximately the same among the samplefirms and the entire Compustat universe, i.e., 0.64, 0.08,and “BBB,” respectively.
4. Event study analysis
In studying the shareholder wealth effects of the CSRevents, I focus on daily CARs. I start by estimating mar-ket model parameters for each firm-event date pair usingestimation periods of 250 trading days ending 50 daysbefore the event date. The CRSP value-weighted indexserves as the market index in the regressions, and abnor-mal returns for event i and event day t are defined as
ARit = rit − ai − bi × rvw,t, (1)
where ai and bi are the estimated market model param-eters, rit the firm return, and rvw,t the value-weighted
8
market index return on event day t. Besides calculatinga t–statistic allowing for event-induced changes in vari-ance (see Boehmer, Musumeci, and Poulsen, 1991), I alsocompute a nonparametric sign test due to Cowan (1992).
4.1. Negative events
I analyze the statistical properties of the 11-day [-5,5]and 21-day [-10,10] CARs around the event date.
[Insert Table 3 here.]
Table 3 displays the results for negative events. PanelA reports the mean, median, minimum, and maximumCAR for all negative events alongside the aforementionedtest statistics. The mean and median CARs are signif-icantly negative for negative events, providing evidencethat whenever information with negative stakeholder im-plications becomes publicly available, stock prices of con-cerned companies decline significantly. The effect iseconomically meaningful with a mean (median) 11-dayCAR of -88 (-42) basis points. Both the mean and me-dian CARs are highly statistically significant with a t–statistic (generalized Z-statistic) of -4.95 (-4.00). Giventhat the median market capitalization of the sample firmsis approximately $6.86 billion and the median 21-dayCAR is -111 basis points, the median cost associatedwith negative CSR events is approximately $76 million(0.0111 × $6.86 billion).
However, pooling together all negative incidents is acrude way of analyzing the relation between changes inshareholder value and negative CSR news because thisprocedure assumes that all six issue areas are equallyrelevant in terms of their shareholder value implica-tions. Yet, certain issue areas might not be value-relevantwhen analyzed individually. To address this issue, Isort negative events by issue area and run event stud-ies for each issue area separately. Panels B–G, Table 3report the results. All issue areas except for humanrights and diversity show negative and significant mean11-day CARs. Product-related events seem to gener-ate the most statistically significant (t–statistic=-3.98) 11-day mean CAR, followed by community- (t–statistic=-2.80), environment- (t–statistic=-1.77), and employee-related (t–statistic=-1.76) issues. In terms of economicmagnitudes, the value effects of negative community and
environment events are the strongest. Mean (median) 11-day CAR in the community issue area is -214 (-122) ba-sis points, whereas negative events classified in the envi-ronment issue area generate mean (median) CAR of -154(-35) basis points. The results are stronger, both econom-ically and statistically, when looking at 21-day CARs.
The empirical evidence shows that whenever negativeinformation about a firm’s stakeholder policies becomespublicly available, shareholders also incur economicallymeaningful losses. Such evidence is consistent with theview that shareholders do care strongly about corporatesocial irresponsibility. A plausible explanation for thestrong negative reaction to negative events is that nega-tive events contain substantive negative cash-flow news,which is crucially important for the discounted value ofthe firm’s future cash flows. This interpretation is alsoconsistent with evidence from the textual analysis show-ing that negative events contain hard, i.e., legal and quan-titative, information content.
The negative CARs associated with negative newsabout a firm’s stakeholder relations provide a necessary,but not sufficient condition for CSR being in the best inter-est of shareholders. Studying how the stock market pro-cesses negative information regarding stakeholders can-not provide a sufficient condition because negative share-holder wealth effects with respect to negative events con-vey no information about the costs associated with imple-menting policies aimed at reducing the likelihood of suchevents from occurring: corporate actions aimed at pre-venting negative CSR events could be much more costlythan the occasional stock price decline induced by themanifestation of negative events.
4.2. Positive events
To examine whether the data bear out a sufficient con-dition for CSR being in the best interest of shareholders, Inow turn to analyzing shareholder wealth effects inducedby positive events. In line with the previous analysis, Ibegin by examining the shareholder wealth effects of anevent portfolio consisting of all positive events.
[Insert Table 4 here.]
Panel A, Table 4 shows that the mean (median) 11-day CAR is not significantly different from zero for the
9
set of positive events. However, marginal statistical ev-idence exists that the 21-day CAR is slightly negative.With a t–statistic (generalized Z-statistic) of -1.82 (-1.66),the level of statistical significance of the mean (median)CAR is much lower for positive than for negative events.In addition, the mean 21-day positive event CAR of -47basis points is much smaller when compared with themean CAR for negative events. Hence, stock marketsreact much less systematically to positive news regard-ing stakeholder welfare. However, marginally negativeCARs around days on which positive information abouta firm’s stakeholder relations become known to the mar-ket are consistent with the view that investing in CSRis not, on average, beneficial for shareholder value. Inother words, the negative stock market reaction suggeststhat (i) implementing CSR policies is costly and (ii) theexpected benefits from implementing these policies fallshort of the costs. Also, this evidence is consistent withthe view that the implementation of positive CSR policiesis in fact costly. Such a view is neglected by CSR propo-nents, who sometimes claim that increasing stakeholderwelfare is costless and, at the same time, miraculouslyprofit-enhancing. Di Giuli and Kostovetsky (2014) pro-vide evidence consistent with the view that positive CSRcould be costly: companies with better stakeholder rela-tions also tend to have higher selling, general, and admin-istrative expenses.
The next step sorts positive events by issue area andruns individual event studies for positive events from eachissue area. This analysis paints a somewhat more nuancedpicture. The conditional analysis reveals that, individu-ally, CARs are not statistically significantly different fromzero for the majority of the six issue areas. The only issueareas displaying significantly negative CARs for the 21-day event window are those concerned with the environ-ment and communities. This evidence suggests that stockmarkets perceive policies aimed at voluntarily increasingthe welfare of communities as wasteful wealth transfersfrom shareholders to communities. This negative reac-tion could be due to at least two reasons: first, increas-ing the welfare of communities might reflect agency prob-lems in that managers seek to build strong ties with theirsurrounding communities at the expense of sharehold-ers. If community-related CSR initiatives are the result ofagency problems, stock markets should indeed react neg-atively. Cespa and Cestone (2007) provide a theoretical
argument along these lines. A second potential explana-tion is related to negative cash-flow shocks. Community-related events are often concerned with charitable givingto or pro bono work in communities. Shareholders couldperceive news about initiatives that increase communitywelfare as negative cash-flow shocks, which should thenlead to a decline in stock prices in the short-run.
The marginally negative mean 21-day CAR for pos-itive events related to environmental responsibility ismore puzzling because the negative short-term reactionseems to suggest that shareholders do not reward invest-ments aimed at improving a firm’s environmental foot-print. Again, agency problems could play an importantrole here in that CEOs of firms involved in positive envi-ronmental events might be improving their personal repu-tation as “sustainable” or “green” corporate leaders at theexpense of shareholders. Another potential explanationfor the negative stock price reaction could be that posi-tive environmental events are related to substantial currentcash outlays, and therefore have negative short-term cash-flow implications. In contrast, the benefits from such poli-cies accrue only in the long-run. Although the short-runoutlays are easy to quantify, it may be more difficult forinvestors to accurately value the long-term benefits result-ing from sound environmental policies. If the majority ofshareholders are short-term oriented, such long-term ori-ented investments in environmental responsibility wouldnot be sufficiently rewarded and stock prices should de-cline on average
Finally, a marginally positive reaction exists to positiveproduct events (see Panel G, Table 4). These events are of-ten related to issues such as high product quality or beingan industry leader in terms of research and developmentand supply of innovative products. If anything, it seemssurprising that the stock market reaction to these events isnot more pronounced.13
13For completeness, I verify in the Internet appendix that the eventstudy results are not due to other non-event characteristics (e.g., size orvalue) of the sample firms by basing the analysis on abnormal returnswith respect to the Fama and French (1993) model.
10
5. Agency-motivated and offsetting CSR
5.1. Positive events
In this subsection, I analyze the cross section of posi-tive event CARs to determine whether the stock market’sreaction to news about CSR depends on the firm’s motivesfor engaging with stakeholders. In doing so, I distinguishwhether positive CSR events are more likely to be the re-sult of a firm’s desire to improve poor stakeholder rela-tions, that is, to “offset” prior corporate irresponsibility,14
or, whether events are more likely to be due to agencyproblems inside the firm. I use two distinct and indirectways to separate the events into agency-motivated ones,and events more likely to result from the firm offsettingprior irresponsibility.
First, I measure agency concerns in the spirit of Jensen(1986) by focusing on book leverage and liquidity. Highleverage forces managers to spend corporate resourcessensibly, whereas high liquidity provides greater scope forwasteful spending in the form of negative NPV projects.Hence, high leverage and low liquidity should indicatefewer agency concerns, and positive CSR events involv-ing such firms should bring about a more favorable stockmarket reaction.
Second, a firm’s prior CSR performance is also an in-dication of the motives for stakeholder engagement. Itseems plausible that investor reaction to positive CSR in-formation should depend on whether a firm is known forhaving a history of poor relations with stakeholders. Forexample, if a company with a highly polluting productiontechnology decides to invest in environmental efficiency,markets should react favorably because an improvementin corporate environmental policies is likely to bring downcosts in the long-term. In contrast, if a company withno apparent environmental problems or an already cleanproduction technology decides to allocate substantial re-sources to increasing environmental responsibility, suchinvestments might indicate wasteful spending and mar-kets should, on average, react unfavorably.
[Insert Table 5 here.]
14Prior research has shown that companies tend to offset corporatesocial irresponsibility by improving their CSR in subsequent years.Kotchen and Moon (2012) show that companies with more CSR con-troversies also tend to show more pro-social behavior in the future.
Testing this notion of offsetting versus agency-motivated CSR, I begin by regressing the 21-day CAR forall positive events on a constant, a measure of companysize, and indirect measures of agency concerns. Formally,I estimate the following model:
CARit = a + b × S izeit + c × Agencyit + εit, (2)
where CARit is the cumulative abnormal return associ-ated with the occurrence of positive events and S izeit issimply the natural logarithm of the firm’s market capital-ization. I use the logarithm of the firm’s market capital-ization as a size control, but obtain qualitatively similarresults when using other proxies for size (e.g., the loga-rithm of assets). In line with Jensen (1986), I use Bookleverage and Liquidity as measures of agency concerns.The coefficient estimate for Book leverage is significantlypositive (t–statistic=2.73), suggesting that markets valuepositive stakeholder news more for high- than for low-leverage firms (see column 1, Panel A, Table 5). Sim-ilarly, column 2, Panel A, Table 5 shows a statisticallysignificant and negative coefficient estimate for Liquidity(t–statistic=-2.29), indicating that when companies withhigh levels of liquidity are involved in positive CSR news,investors react less favorably. Together, the evidence incolumns 1 and 2 is consistent with the view that CSR isshareholder value-reducing whenever it is conducted bycompanies that are more likely to be facing agency prob-lems.
A possible concern with the interpretation of the pre-vious finding is that both liquidity and leverage are cor-related with financial distress. Hence, alternatively, thestock market might be reacting more positively to positiveevents concerning low-liquidity and high-leverage firmsbecause these firms are in financial distress, and goodnews in terms of CSR indicates that management sees bet-ter financial prospects ahead, and is thus confident enoughto spend resources on CSR. To rule out this alternative in-terpretation, I now control explicitly for the firm’s creditrating by estimating the following equation:
CARit = a+b×S izeit+c×Agencyit+d×CreditRatingit+εit.(3)
I obtain firm-wide credit ratings from S&P and transformletter ratings into numerical ones. CreditRatingit is sim-ply the median credit rating of firm i in the year of theevent. The rating variable is not available for all firms,
11
which is why I estimate the model on a reduced sample.In these alternative specifications, the credit rating is notsignificantly related to positive event CARs, and the co-efficient estimate for Book leverage is of similar magni-tude (see column 3, Panel A, Table 5). In contrast, thecoefficient estimate for Liquidity becomes stronger botheconomically and statistically (see column 4).
To rule out that other non-event characteristics such assize, value, growth, or industry are driving the presentedresults, I also compute cumulative abnormal returns withrespect to alternative benchmark models. Columns 5 and6 show regressions in which event returns are risk ad-justed using the asset pricing model proposed by Famaand French (1993). In columns 7 and 8, I use the Famaand French 48 value-weighted industry return (see Famaand French, 1997) as the benchmark return. These alter-native ways of calculating abnormal returns leave the pre-vious conclusions unaffected, which is in line with priormethodological research on event studies (see Brown andWarner, 1985; Kothari and Warner, 2007) showing thatbenchmark returns used for risk adjustment rarely matterin the short-run. Overall, the evidence presented in PanelA, Table 5 supports the view that investors perceive pos-itive CSR news concerning firms in which agency prob-lems are less likely to be present more favorably.
I now turn to the second approach of separating posi-tive events into agency-motivated ones and those that aremore likely to be the result of the firm’s implementationof useful and potentially value-enhancing CSR policies.Kotchen and Moon (2012) provide evidence that compa-nies engage in CSR to offset prior corporate social irre-sponsibility. They find that firms which do harm tendto do more good in the future, suggesting that firms of-ten respond to negative external events (e.g., lawsuits orother controversies) by subsequently changing corporatebehavior. Here, I develop this evidence further by hy-pothesizing that whenever positive events are more likelyto result from offsetting prior corporate irresponsibility,shareholders should not react the same as when firms startengaging in CSR out of the blue. In other words, I expectoffsetting CSR to be driven by efficiency considerations,and hence to be shareholder value-enhancing, whereasCSR which occurs unexpectedly and thus for no apparentreason to be due to agency problems, and thus detrimentalto value.
To test this idea, I now condition positive event CARs
on KLD’s Concerns. I start by regressing the 21-dayCAR induced by the occurrence of positive events froma specific issue area on a constant and a category-specificdummy variable indicating whether the involved firm hashad at least one KLD Concern in the specific issue area.Formally, I estimate the following model for each issuearea j:
CARjit = a j + b j ×Concern j
it + εjit, (4)
where the variable Concern jit takes the value of one if firm
i has had a KLD Concern in issue area j at the beginningof the year in which the event takes place, and zero oth-erwise. CARj
it is the 21-day CAR associated with positiveevents from issue area j. In this specification, the coef-ficient estimate b j measures the differential 21-day CARfor positive events from issue area j that are more likelyto be the result of a firm’s desire to offset prior corporatesocial irresponsibility.
[Insert Table 6 here.]
The test in column 1, Panel A, Table 6 shows a slightlymore positive stock market reaction for positive commu-nity events concerning firms with problematic communityrelations. In a similar vein, columns 3, 4, and 5 show sig-nificantly higher CARs for positive events from the em-ployee relations, environment, and human rights issue ar-eas whenever these events concern firms with known con-troversies. In contrast, the mean 21-day CAR for posi-tive events from the community and environment issue ar-eas concerning firms in which agency problems are morelikely to be present, i.e., firms with no concerns, is sig-nificantly negative (see the Constant in columns 1 and4). For example, column 4 shows that the 21-day meanCAR associated with environmental events for which theinvolved companies do not have any environmental con-cerns is approximately -250 basis points. On the con-trary, the mean 21-day CAR for events involving com-panies having at least one environmental concern is 110basis points (-0.025 + 0.036), with the coefficient estimatefor the interaction term Environment concern being highlystatistically significant (t–statistic=2.90). Taken together,the tests in Panel A, Table 6 provide evidence in favor ofthe view that investors distinguish between positive newsabout CSR —more likely to be the result of a firm’s de-sire to offset prior corporate irresponsibility— and posi-
12
tive CSR news more likely to be the result of agency prob-lems.
An important question regarding the previous resultsof higher CARs for offsetting as opposed to agency-motivated CSR is whether these results generalize to allfirms or whether they are only valid for large firms inwhich agency problems are more severe. To address thisissue, I add the natural logarithm of the firm’s market cap-italization as a control variable to the previous specifica-tion and estimate the following model for each issue area:
CARjit = a j + b j ×Concern j
it + c j × S izeit + εjit. (5)
The results by issue area are presented in Panel A, Ta-ble 7. The specifications that control explicitly for firmsize suggest that offsetting CSR generates a more posi-tive stock market reaction independent of whether a firmis small or large: after controlling for size, the coefficientestimate for Concern j remains significant in the employeerelations, environment, and human rights issue areas (seecolumns 3, 4, and 5, Panel A, Table 7). In contrast, theConstant becomes insignificant in all but the human rightsissue area. The lack of statistical significance for the con-stant suggests that the result of negative value implica-tions for agency-motivated CSR may not be applicable tosmall firms but should be regarded as a large-firm phe-nomenon.15 This result seems quite plausible as agencyproblems are likely to be more pronounced in larger firms.
[Insert Table 7 here.]
Note also, as an aside, that the coefficient estimate forln(Market cap) is significantly negative (t–statistic=-2.23)in the human rights issue area (see column 5, Panel B,Table 7). A significantly negative coefficient estimate forfirm size suggests that it is more costly for large firmsto become good corporate citizens with respect to humanrights issues.
In their paper, Kotchen and Moon (2012) also showthat firms sometimes offset weaknesses in one of KLD’sissue areas with subsequent strengths in others. I nowstudy whether I find a similar pattern when analyz-
15Note, however, that the result of lower CARs for positive CSRevents involving low-leverage and high-liquidity firms is robust to con-trolling for size (see Panel A, Table 5).
ing the cross section of CARs, by examining, for in-stance, whether responding to product-related concernsby increasing employee-related strengths creates value forshareholders. Conducting such an analysis is also an im-portant robustness check on the results regarding offset-ting CSR because the issue area-specific concerns indica-tor variables are correlated with each other: the averagepairwise correlation is 0.15. To examine the issue, I nowregress positive event CARs by issue area on all category-specific concerns indicators simultaneously:
CARjit = a j +
6∑
j=1
b j ×Concern jit + c j × S izeit + ε
jit. (6)
The tests (see Panel A, Table 8) convey that it is al-most exclusively the dummy variable indicating concernsin the specific issue area which is statistically significant(see columns 3, 4, and 5). Some marginally significantevidence exists that positive human rights events concern-ing firms with past environmental controversies generatea more positive stock market reaction too (see column 5).Overall, however, these results suggest that the underlyingvalue-creating mechanism behind offsetting CSR is moreone of addressing specific stakeholder problems by im-proving the policies in the specific issue area rather thanone of ramping up the entire CSR profile of the firm.
[Insert Table 8 here.]
In summary, the analysis of this subsection provides asufficient condition for CSR to be in the shareholder’s bestinterest whenever such CSR improves poor stakeholderrelations.16
5.2. Negative eventsThis subsection repeats the preceding analysis by fo-
cusing on CARs for negative events. I begin by regress-ing the 21-day CAR attributable to negative events on thepreviously employed measures of agency problems andthe logarithm of market capitalization:
16In analysis which is available in the Internet appendix to this paper,I also verify that the results presented in Table 8 are not due to othernon-event characteristics such as value, size, or industry of the samplefirms.
13
CARit = a + b × S izeit + c × Agencyit + εit. (7)
Panel B, Table 5 reports the results. Whereas, Bookleverage is not significantly related to negative eventCARs (see column 1), the test in column 2 shows somemarginal evidence that investors respond more benignlyto negative CSR news when such information concernshigh-liquidity firms (t–statistic=1.91). Considering thatnegative events are often related to issues such as law-suits, fines, and regulatory concerns (see also Section 6),a positive coefficient estimate for Liquidity is somewhatplausible: it seems as if investors regard companies withhigher cash reserves as being in a better position to shoul-der the negative cash-flow implications of negative events.
Interestingly, the equation in which the credit rating isintroduced as a control variable, that is,
CARit = a+b×S izeit+c×Agencyit+d×CreditRatingit+εit,(8)
reveals that negative event CARs are significantly nega-tively related to the firm’s credit rating (see columns 3–8, Panel B, Table 5). Put differently, firms with highcredit ratings tend to suffer stronger negative stock mar-ket reactions following the occurrence of negative eventscompared with firms with low credit ratings. This evi-dence is consistent with the notion that negative eventshave the strongest negative price impact when the nega-tive information starkly contrasts with current investor ex-pectations about the firm’s financial strength (high creditrating). In other words, the most pronounced change inshareholder value occurs when the negative events arelikely to result in a dramatic update of investor beliefsabout the firm’s prospects.
Akin to the positive Liquidity coefficient (see column 2,Panel B, Table 5), the coefficient on ln(Market cap) isalso significantly and positively related to negative eventCARs in the specifications that control for the firm’s creditrating (see columns 3, 4, 7, and 8).17 This result is sug-gestive of investors believing that larger companies are in
17Not surprisingly, the ln(Market cap) coefficient is not significantwhen CARs are also risk-adjusted with respect to firm size (see columns5 and 6, Panel B, Table 5).
a better position to absorb the negative cash-flow newscontained in negative events.
Turning to the second type of analysis, I now regressnegative event CARs by issue area on category-specificdummy variables denoted by S trength j
it, which indicatethe presence of a KLD Strength in a specific issue area:
CARjit = a j + b j × S trength j
it + εjit. (9)
In these equations, as well as in the specifications thatcontrol explicitly for firm size, i.e.,
CARjit = a j + b j × S trength j
it + c j × S izeit + εjit, (10)
all KLD Strengths indicator variables are insignificant,except the community concern indicator (see column 1,Panel B, Tables 6 and 7), suggesting that firms with strongcommunity relations suffer less-pronounced stock pricedeclines following the release of negative news about thefirm’s impact on communities. Note also that the coeffi-cient estimate for ln(Market cap) in column 4, Panel B,Table 7 is significantly positive for negative environment-related events, showing that negative events regarding theenvironment are less value-reducing for larger companies.
Finally, I repeat the Kotchen and Moon (2012)-typeanalysis for negative event CARs by estimating
CARjit = a j +
6∑
j=1
b j × S trength jit + c j × S izeit + ε
jit. (11)
The test in column 1, Panel B, Table 8 continues toshow a significantly positive coefficient for the commu-nity strength dummy. In addition, the regression in col-umn 6 shows evidence that product-related concerns tendto have a less negative impact on firm value when asso-ciated with firms with strong community relations. Onepotential explanation for negative product-related newsbeing less damaging to shareholder value for firms withstrong community relations could be that consumers aremore loyal toward firms that are committed to doing goodin their communities.
Finally, there is mildly significant evidence that nega-tive community-related news concerning firms with hu-man rights strengths generate a more negative stock mar-ket reaction (see column 1, Panel B, Table 8). Note also
14
that the specifications in Panel B do not show a clear pat-tern as to how negative event CARs by issue area relateto firm size: columns 1 and 6 show a negative relation-ship for community- and product-related events, whereasemployee- and environment-related events display a pos-itive association (see columns 3 and 4).
5.3. Alternative hypothesis: selection bias
One concern with the results presented in this paper isthat there could be a causal relation between the stockmarket reaction and an event making it into the media,and hence KLD’s ratings database.18 Unlike earningsannouncements, which are associated with SEC filings,there is the potential for selection of which CSR eventsare or are not covered by KLD. A large positive or nega-tive stock market reaction can increase the probability thatthe media will notice and write about the event, and thatKLD will include it in their newsletters. If such a biasis simply about only important events making it into thedata, then that is a small problem. However, if negativeevents are more likely to make it into the data than posi-tive events, then the measurement of the value and costsassociated with CSR would be biased as well.
To rule out the possibility of such a selection bias, twoquestions need to be answered: First, do only importantevents make it into the data? Second, and more impor-tantly, are negative events more likely to make it into thedata than positive ones?
To answer these questions, I focus on a subset of thesample events, i.e., the events that were taken from the@KLD newsletters. I do so because I observe the ex-act date on which KLD disseminated these events to itsclients. The median length of time between the day onwhich an event took place (event date) and the day it wassent out to clients (dissemination date) is about 13 tradingdays.
One observable implication of only important eventsmaking it into the data is that the entire return distribu-tion between the event and the dissemination dates shouldbe somewhat unusual. The event study results alreadysuggests this, but to provide additional evidence, I com-pare the entire return distribution on days preceding the
18I thank the anonymous referee for pointing out this issue to me.
dissemination date with the return distribution proceed-ing random pseudo-dissemination dates. To obtain thesepseudo-dissemination dates, I draw for each event a ran-dom date from the year in which the event was dissemi-nated. For example, if an event was disseminated in Octo-ber 2003, I draw a random dissemination date from 2003for that specific event. The idea behind this test is thatif KLD focuses only on important events, one would ex-pect the return distributions that precede true and pseudo-dissemination dates to differ significantly.
[Insert Table 9 here.]
Panel A, Table 9 shows distributional statistics (e.g.,25th percentile (P25) or median (P50)) of daily returnsin the period running up to the true and to the pseudo-dissemination dates. The pseudo- (true) run-up periodcomprises the days preceding the pseudo (true) dissem-ination date. I use different lengths for these run-up peri-ods, i.e., 6, 11, 16, and 21 trading days, which are denotedby [-5,0], [-10,0], [-15,0], and [-20,0]. For example, themedian (P50) daily return in the five days running up tothe true and the pseudo-dissemination dates is approxi-mately 0%, and the 75th percentile (P75) return is about1.2%. I use the Kolmogorov-Smirnov (KS) test to com-pare the daily return distribution of the true run-up periodwith that of the pseudo run-up period. The KS test con-firms that unusual stock market returns occur in the run-upto the true dissemination date: the return distributions forthe true and the pseudo run-up periods differ significantlyat reasonable levels of significance (see last two columns,Panel A, Table 9). Consequently, this difference in re-turn distributions implies that KLD somewhat focuses onimportant events. However, KLD’s tendency toward sam-pling important events is not necessarily problematic aslong as negative events are not more likely to make it intothe data than positive events.
To address the more important question of whether neg-ative events are more likely to make it into the data thanpositive ones, I now compare the run-up period return dis-tribution of positive events with that of negative eventsfocusing only on true dissemination dates. If positiveand negative events differed in their likelihood to be in-cluded in the sample, they should demonstrate differentreturn distributions in the true run-up period. The median(P50) daily return in the five days before dissemination is
15
about 0% for both positive and negative events (see PanelB, Table 9). A comparison of the run-up period returndistribution of positive and negative events using the KStest shows little evidence that the return distributions dif-fer significantly (see last two columns, Panel A, Table 9).In other words, the KS test suggests that returns preced-ing the dissemination of positive and negative events aredrawn from the same distribution. The statistical testspresented in Panel B, Table 9 should thus alleviate theconcern that the likelihood of negative and positive eventsmaking it into the data differs. This, in turn, should alsoease concerns of a biased measurement of the value andcosts associated with CSR due to a selection problem.
6. Textual analysis
Recent work in accounting and finance has focused onthe systematic analysis of qualitative information in theform of textual data (see, for instance, Tetlock, 2007).Such textual analysis consists of creating a quantitativeprofile of a text by mapping the words of the text to pre-defined word categories.
In this section, I first apply textual analysis to the eventdescriptions. Secondly, I relate event CARs to the tex-tual characteristics of the events. Analyzing textual char-acteristics of the event descriptions may deliver insightsinto how KLD measures CSR and what may differentiatethe measurement of negative and positive CSR. In turn,relating CARs to textual characteristics may deliver in-sights into what kind of CSR information is more relevantfor stock prices. I focus on predefined word categoriesbased on the Harvard IV-4 dictionary and calculate, foreach event description, the fraction of words pertaining toeach of the following categories:19
• Positive: 1,915 words of positive outlook. (e.g.,ABILITY, ADMIRATION, ADVANTAGE)
• Negative: 2,291 words of negative outlook (e.g., AB-SENCE, ACCIDENT, ACCUSE)
• Legal: 192 words relating to legal, judicial, or policematters. (e.g., ACCUSE, ALLEGATION, AMEND-MENT)
19See http://www.wjh.harvard.edu/~inquirer/ for more de-tails.
• Econ: 510 words of an economic, commercial, in-dustrial, or business orientation, including roles, col-lectivities, acts, abstract ideas, and symbols, includ-ing references to money. Includes names of com-mon commodities in business. (e.g., ANTI-TRUST,AUCTION, BANKRUPT)
• Quan: 314 words indicating the assessment of quan-tity, including the use of numbers. (e.g., ADDI-TIONAL, ACCUMULATION, CONSIDERABLE)
• Numbers: 51 words identifying the use of numbers,which is divided in
– Cardinal: 36 cardinal words (e.g., BILLION,MILLION, ZERO)
– Ordinal: 15 ordinal words (e.g., FINAL, FOR-MER, LAST)
I also count the occurrence of digits in each of the eventdescriptions.
6.1. All eventsMean difference tests reported in Table 10 reveal that
positive and negative event descriptions differ systemat-ically. Not surprisingly, positive event descriptions aremore positively worded than negative ones, and viceversa. More interestingly, however, the tests also showthat negative events are more strongly related to legal mat-ters: the fraction of legal words (e.g., words referring toproduct litigation, regulatory concerns, or affirmative ac-tion lawsuits) is much higher for negative than for posi-tive event descriptions. On average, 2.3% of the wordsused to describe negative events have a legal connotation,whereas only 1% do so for positive events. With a t–statistic of -11.07, this difference is also highly statisti-cally significant. In contrast, the incidence of words withan economic connotation is not statistically different forpositive and negative event descriptions, indicating thateconomic matters are equally important in positive andnegative events.
[Insert Table 10 here.]
The mean difference tests also show that negativeevents contain significantly more quantitative informationcompared with positive ones. On average, 3.4% of the
16
words used to describe negative events are words indi-cating the presence of quantities, while this fraction is3.1% for positive ones. In the same spirit, negative eventdescriptions are also subject to a stronger use of digitsand words indicating the presence of numbers. Finally,negative event descriptions contain more cardinal words,whereas ordinal words seem to play a more important rolein positive event descriptions. The last finding could in-dicate that orderings such as rankings are important ele-ments of positive events, while natural numbers and car-dinality, potentially the result of fines, are more present innegative events. Taken as a whole, the evidence from Ta-ble 10 suggests that negative events contain more hard in-formation (e.g., quantitative and legal) than positive ones.
6.2. By issue area
Table 11 provides a breakdown of how different typesof words are distributed across the six issue areas. Morespecifically, I report how the issue area-specific averageword usage deviates from the overall word usage.
[Insert Table 11 here.]
Negative events from the product, environment, and—above all—the diversity issue areas are mainly “strongly”negative, i.e., subject to event descriptions with aboveaverage use of negative words (see Panel B). This find-ing suggests that KLD’s analysts perceive situations inwhich customers, the environment, or employees expe-rience negative welfare effects due to corporate behavioras particularly harmful.
Product-, human rights-, and environment-relatedevents are characterized by strong legal language: allthree categories show above average use of legal words(see Panel A). The strong legal information contentin the environment and product issue areas is mainlydriven by negative events (see Panel B), suggesting thatenvironment- and product-related negative events are con-cerned with matters such as lawsuits or fines. Positiveevents from both the human rights and the employee re-lations issue areas are subject to above average legal lan-guage (see Panel C), indicating that KLD attaches greatimportance to legal rights (e.g., respect of labor or humanrights treaties) when determining whether a company is agood corporate citizen with respect to human rights- andemployee-related issues.
Employee-related event descriptions are subject toabove average use of digits, suggesting that the informa-tion content of employee relations events is of quantitativenature (see Panels A, B, and C). A potential explanationfor this pattern is that positive employee relations eventsare sometimes related to corporate rankings, whereas neg-ative ones often entail issues related to the payment offines or other indemnities.
Explicit language indicating the assessment of quan-tities is the most prominent among community- anddiversity-related events (see Panel A). The above averagequantitative information content in the community issuearea is present in both positive and negative event descrip-tions (see Panels B and C), which could be explained byissues related to charitable giving for positive events, andfines and other penalties for negative ones. The above av-erage quantitative information content of negative diver-sity events (see Panel B) is most likely due to fines such asthose resulting from affirmative action lawsuits. Finally,negative events from the product area are characterizedby above average use of words indicating the presence ofnumbers, particularly cardinal ones (see Panel B). Thischaracterization is again likely to be due to fines.
6.3. CARs and textual analysis
In this this last subsection, I relate CARs by issue areato the textual variables introduced in the previous subsec-tion. I do so by estimating the following equation indi-vidually for positive and negative events from each issuearea:
CARjit = a jk + b jk × S izeit + c jk × Textualkit + ε
jkit . (12)
In this equation, Textualkit measures the fraction ofwords from word category k (e.g., positive, negative, le-gal) contained in the event’s description. S ize is the nat-ural log of the firm’s market capitalization. I estimate theequation separately for each issue area and each word cat-egory. To minimize the number of tables, I report only thecoefficient estimates c jk. These coefficients measure therelation between CARs and the fraction of words belong-ing to a specific word category.
[Insert Table 12 here.]
17
Panel A, Table 12 displays the regression results for neg-ative events, whereas Panel A, Table 13 reports the resultsfor positive ones. Each element in these tables representsa coefficient resulting from the estimation of an individ-ual regression equation. For example, the coefficient esti-mate in the first column and first row of Panel A, Table 12measures the relation between CARs of negative commu-nity events and the fraction of positive words in the eventdescriptions. Thus, the columns of the tables are not re-porting results from multivariate regression equations inwhich the CARs are simultaneously related to all textualvariables.
[Insert Table 13 here.]
As an alternative way of analyzing whether CARs haveany relation to the type of words used to describe theevents, I also examine if the events with the most extremelanguage exhibit differential CARs. To this effect, I codedummy variables indicating the top decile of each textualvariable and estimate the following equation by word cat-egory and issue area:
CARjit = a jk+b jk×S izeit+c jk×HighTextual jk
it +εjit. (13)
The dummy variable HighTextual jkit indicates the top
decile of the respective textual variable for positive ornegative events in a given issue area. The coefficient esti-mates for HighTextual jk are reported in Panel B, Table 12for negative events and in Panel B, Table 13 for positiveones. In a given issue area, these coefficients measure theincremental CAR for events that are subject to the mostextreme language.20
6.3.1. Positive and negative languageI start by examining whether “strongly” positive,
“strongly” negative, “weakly” positive, and “weakly”negative events generate differential stock market re-actions. A positive event is considered “strongly”(“weakly”) positive if its description contains a high frac-tion of positive (negative) words. In contrast, negative
20The full regression results for the equations estimated in this sectionare reported in the Internet appendix, which also contains the resultsfrom relating the CARs for all positive and all negative events to thetextual variables.
events are “strongly” (“weakly”) negative when charac-terized by a high fraction of negative (positive) words.
The tests suggest that investors react less strongly toweakly negative events. For example, the coefficient es-timate for Positive in column 1, Panel A, Table 12 showsthat weakly negative community events, i.e., more posi-tively worded negative community events, generate a lessnegative stock market reaction (t–statistic=2.47). A simi-lar pattern holds for weakly negative diversity events: thecoefficient estimate for High positive in column 2, PanelB, Table 12 is significantly positive (t–statistic=1.88). Ina similar spirit, investors also respond more strongly tostrongly negative events: the coefficient estimate for Neg-ative regarding negative product events (see column 6,Panel A, Table 12) indicates that stock prices decreasemore strongly for strongly negatively worded productevents (t–statistic=-3.24). Analysis of positive events pro-vides similar evidence: positive community events (seecolumn 1, Panel A, Table 13) generate a more positivestock market reaction (t–statistic=2.07). Taken together,the results suggest that investors do sometimes manage toevaluate the severity of CSR events and incorporate thisassessment into their reactions.
In contrast, the evidence also suggests that KLD’s an-alysts and investors sometimes disagree over the severityof events. For example, the significantly negative coeffi-cient estimate on High positive for negative environmentalevents (see column 4, Panel B, Table 12) shows that themost positively worded negative environment events gen-erate a significantly more negative stock market reaction.In other words, stock prices decrease more strongly whenweakly negative environmental events occur (t–statistic=-2.38). In a similar spirit, the significantly positive coef-ficient estimate for Negative in the community issue area(see column 1, Panel A, Table 13) shows that more nega-tively worded positive community events are subject toa significantly more positive stock market reaction (t–statistic=1.98). A potential alternative explanation for thislast finding could be that these events refer to the resolu-tion of previous episodes of irresponsible corporate be-havior. If more negatively worded positive events referto prior irresponsible corporate behavior, their descrip-tions should contain more negative language and a morepositive stock market reaction to more negatively wordedpositive events would be perfectly consistent with the ev-idence on “offsetting CSR” presented in Section 5.
18
6.3.2. Legal languageNext, I condition CARs on the use of legal language,
a proxy for the extent of legal information contained inan event. Interestingly, the coefficient estimate for Legalis significantly negative for negative human rights events(see column 5, Panel A, Table 12), suggesting that nega-tive human rights events with more legal information con-tent generate a more negative stock market reaction (t–statistic=-1.82). The same is true for negative events fromthe product issue area: column 6, Panel B, Table 12 re-veals that the ten percent negative product events with thestrongest legal information content exhibit significantlylower CARs (t–statistic=-1.73). Note that significancelevels in these tests are not particularly high. I attribute thelevel of statistical significance to measurement error in thesense that the fraction of legal words is only a noisy proxyfor the legal information contained in an event. As a con-sequence, imprecise measurement is likely to downward-bias the coefficient estimates.
Rather surprisingly, the coefficient estimate for Legalturns out to be significantly negative for positive productevents (see column 6, Panel A, Table 13). In other words,positive product events with stronger legal informationcontent result in a more negative stock market reaction (t–statistic=-2.37). A potential explanation for this findingis that positive product events with strong legal informa-tion content are related to consumer-oriented regulation,which can be good news for consumers but also imposesubstantial financial burdens on the concerned firms.
6.3.3. Economic languageColumn 3, Panel A, Table 12 provides evidence of
a more negative stock market reaction to negative em-ployee relations events with strong economic informa-tion content: the coefficient estimate for Econ is signif-icantly negative (t–statistic=-2.38). I observe similar pat-terns for negative community (t–statistic of -2.11) and hu-man rights events (t–statistic=-1.66) with the highest eco-nomic information content (see columns 1 and 5, PanelB, Table 12). Finally, the finding that positive events fromthe product issue area with strong economic informationcontent result in a higher CAR (t–statistic=1.76) lends ad-ditional support to the view that stock markets react morestrongly to CSR events that are more strongly related toeconomic issues (see column 6, Panel A, Table 13).
6.3.4. DigitsRather surprisingly, Panels A and B, Table 12 show that
negative events from the employee relations issue areawith a high incidence of digits generate a more positivestock market reaction: both the coefficient estimate forDigits (t–statistic=2.49) and High digits (t–statistic=2.45)are significantly positive (see column 3, Panels A and B). Iobserve a similar, though less significant, pattern for neg-ative diversity events (see column 2, Panel B, Table 12). Apotential way to rationalize this counterintuitive result isthat both negative employee relations and negative diver-sity events containing a high fraction of digits are relatedto payments of fines and/or the settlement of legal issues(e.g., employee harassment or affirmative action lawsuits,indemnities related to workplace accidents, etc.). Stockprices should go up as a result of such negative news if in-vestors had anticipated the charges to be more severe thanthey actually turn out to be.
6.3.5. Quantitative languageThe analysis of words indicating the assessment of
quantity is largely consistent with the previous evidenceof a more positive stock market reaction to negative eventswith a high incidence of digits. There is rather consistentevidence that investors react more positively to negativeevents characterized by the use of more quantitatively ori-ented language. As such, columns 2 and 5, Panel B, Ta-ble 12 show significantly positive coefficient estimates forHigh quan regarding negative diversity (t–statistic=2.20)and negative human rights (t–statistic=2.12) events. A po-tential explanation is that quantitative language indicatesthe settlement of fines or indemnities. If investors hadformed overly negative expectations about the magnitudeof the payouts related to the legal settlements, stock pricesshould increase once the uncertainty about the exact mea-sure of indemnity is resolved.
Some of the most quantitatively worded positive eventsare subject to lower CARs (see columns 2 and 6, PanelB, Table 13): The High quan coefficient estimate is sig-nificantly negative in the diversity (t–statistic=-2.13) andproduct issue areas (t–statistic= -1.87). This negative re-lation could be attributable to quantitatively oriented pos-itive events being related to corporate expenses aimed atincreasing the welfare of employees (e.g., programs ad-dressing work-life balance through offering childcare, el-der care, or flextime) and communities (e.g., pro bono
19
work, charitable donations). If investors regard such mon-etary transfers as wasteful spending, decreasing stockprices as a result of these events are not surprising.
7. Conclusion
In this paper, I study the shareholder value implicationsof positive and negative CSR events in the short-run. Ishow that investors react strongly negatively to negativenews about CSR. The reaction is particularly pronouncedfor information regarding communities and the environ-ment. A negative reaction with respect to negative eventsis consistent with the view that a substantial cost is as-sociated with corporate social irresponsibility. My esti-mates place the median cost at approximately $76 mil-lion, implying that when events that decrease the welfareof the firm’s main stakeholders occur, shareholders alsolose money.
The negative reaction with respect to negative stake-holder news provides a necessary but not sufficient con-dition for socially responsible policies being in the share-holder’s best interest. This is because analysis of share-holder value effects due to negative events does not pro-vide any insights into the costs associated with imple-menting corporate policies that would prevent such neg-ative events from happening. To examine whether share-holders should encourage the implementation of sociallyresponsible corporate policies, I then go on and study thevalue implications of positive events. I find that investorsreact slightly negatively when positive news about a firm’sCSR policies is revealed. Yet, when contrasted with themarket reaction to negative events, investor reaction withrespect to positive events is much weaker and less system-atic.
Nonetheless, a refinement of the analysis provides ev-idence that improving a firm’s CSR can be shareholdervalue-enhancing under certain circumstances. It turns outthat when positive news about CSR concerns firms inwhich agency problems are less likely to be present, in-vestors tend to react more favorably. In addition, I alsoshow that when the positive CSR news is more likely tobe the result of managerial efforts aimed at offsetting priorcorporate social irresponsibility, stock prices do increaseon average. Hence, a sufficient condition for environmen-tal and social responsibility being in the shareholder’s best
interest is borne out by the data for firms with a history ofstakeholder-related controversies.
Finally, I apply textual analysis in the spirit of Tetlock(2007) to the study of shareholder value effects of CSR.The results from this analysis show that investors reactmore strongly to CSR news containing strong economicand legal information content. In addition, evidenceseems to exist that investors tend to evaluate the sever-ity of CSR events by reacting more strongly to stronglypositive and strongly negative events and less strongly toweakly negative and weakly positive events.
20
Aktas, N., De Bodt, E., Cousin, J., 2011. Do financialmarkets care about SRI? Evidence from mergers andacquisitions. Journal of Banking & Finance 35 (7),1753–1761.
Albuquerque, R., Durnev, A., Koskinen, Y., 2013. Corpo-rate social responsibility and firm risk: theory and em-pirical evidence. Unpublished working paper. BostonUniversity and University of Iowa.
Allen, F., Carletti, E., Marquez, R., 2014. Stakeholdergovernance, competition and firm value. ForthcomingReview of Finance.
Barnea, A., Rubin, A., 2010. Corporate social responsibil-ity as a conflict between shareholders. Journal of Busi-ness Ethics 97 (1), 71–86.
Bauer, R., Hann, D., 2010. Corporate environmental man-agement and credit risk. Unpublished working paper.Maastricht University.
Bauer, R., Koedijk, K., Otten, R., 2005. International ev-idence on ethical mutual fund performance and invest-ment style. Journal of Banking & Finance 29 (7), 1751–1767.
Becchetti, L., Ciciretti, R., Hasan, I., Kobeissi, N., 2012.Corporate social responsibility and shareholder’s value.Journal of Business Research 65 (11), 1628–1635.
Benabou, R., Tirole, J., 2010. Individual and corporatesocial responsibility. Economica 77 (305), 1–19.
Boehmer, E., Musumeci, J., Poulsen, A., 1991. Event-study methodology under conditions of event-inducedvariance. Journal of Financial Economics 30 (2), 253–272.
Brown, S., Warner, J., 1985. Using daily stock returns:The case of event studies. Journal of Financial Eco-nomics 14 (1), 3–31.
Capelle-Blancard, G., Laguna, M., 2010. How does thestock market respond to chemical disasters? Journalof Environmental Economics and Management 59 (2),192–205.
Carroll, A. B., Lipartito, K. J., Post, J. E., Werhane, P. H.,2012. Corporate Responsibility: The American Expe-rience. Cambridge University Press, Cambridge.
Cespa, G., Cestone, G., 2007. Corporate social respon-sibility and managerial entrenchment. Journal of Eco-nomics & Management Strategy 16 (3), 741–771.
Chatterji, A., Levine, D., Toffel, M., 2009. How well dosocial ratings actually measure corporate social respon-sibility? Journal of Economics & Management Strat-egy 18 (1), 125–169.
Chava, S., 2011. Environmental externalities and cost ofcapital. Forthcoming Management Science.
Cheng, H., Hong, H., Shue, K., 2013. Do managers dogood with other peoples money? Unpublished workingpaper. Darthmouth College, Princeton University, andUniversity of Chicago.
Cowan, A., 1992. Nonparametric event study tests. Re-view of Quantitative Finance and Accounting 2 (4),343–358.
Deng, X., Kang, J.-k., Sin Low, B., 2013. Corporate socialresponsibility and stakeholder value maximization: Ev-idence from mergers. Journal of Financial Economics110 (1), 87–109.
Derwall, J., Guenster, N., Bauer, R., Koedijk, K., 2005.The eco-efficiency premium puzzle. Financial AnalystsJournal 61 (2), 51–63.
Di Giuli, A., Kostovetsky, L., 2014. Are red or blue com-panies more likely to go green? Politics and corporatesocial responsibility. Journal of Financial Economics111 (1), 158–180.
Dimson, E., Karakas, O., Li, X., 2013. Active ownership.Unpublished working paper. London Business School,Boston College, and Temple University.
Dowell, G., Hart, S., Yeung, B., 2000. Do corporateglobal environmental standards create or destroy mar-ket value? Management Science 46 (8), 1059–1074.
Eccles, R. G., Ioannou, I., Serafeim, G., 2013. The impactof corporate sustainability on organizational processesand performance. Forthcoming Management Science.
21
Edmans, A., 2011. Does the stock market fully value in-tangibles? Employee satisfaction and equity prices.Journal of Financial Economics 101 (3), 621–640.
Fama, E. F., French, K. R., 1993. Common risk factorsin the returns on stocks and bonds. Journal of FinancialEconomics 33 (1), 3–56.
Fama, E. F., French, K. R., 1997. Industry costs of equity.Journal of Financial Economics 43 (2), 153–193.
Fisher-Vanden, K., Thorburn, K., 2011. Voluntary corpo-rate environmental initiatives and shareholder wealth.Journal of Environmental Economics and Management62 (3), 430–445.
Flammer, C., 2013a. Corporate social responsibility andshareholder reaction: The environmental awareness ofinvestors. Academy of Management Journal 56 (3),758–781.
Flammer, C., 2013b. Does corporate social responsibil-ity lead to superior financial performance? A regres-sion discontinuity approach. Unpublished working pa-per. University of Western Ontario.
Friedman, M., 1970. The social responsibility of businessis to increase its profits. New York Times Magazine32 (13), 122–126.
Geczy, C. C., Stambaugh, R. F., Levin, D., 2003. Invest-ing in socially responsible mutual funds. Unpublishedworking paper. University of Pennsylvania.
Gillan, S., Hartzell, J., Koch, A., Starks, L., 2010. Firms’environmental, social and governance (ESG) choices,performance, and managerial motivation. Unpublishedworking paper, Texas Tech University and Universityof Texas at Austin.
Gollier, C., Pouget, S., 2014. The washing machine: As-set prices and corporate behavior with socially respon-sible investors. Unpublished working paper. ToulouseSchool of Economics.
Guerard, J., 1997. Is there a cost to being socially respon-sible in investing? The Journal of Investing 6 (2), 11–18.
Hamilton, S., Jo, H., Statman, M., 1993. Doing well whiledoing good? The investment performance of sociallyresponsible mutual funds. Financial Analysts Journal49, 62–66.
Heal, G., 2005. Corporate social responsibility: An eco-nomic and financial framework. The Geneva Papers onRisk and Insurance 30 (3), 387–409.
Heal, G. M., 2008. When Principles Pay: Corporate So-cial Responsibility and the Bottom Line. ColumbiaUniversity Press, New York.
Heinkel, R., Kraus, A., Zechner, J., 2001. The effect ofgreen investment on corporate behavior. Journal of Fi-nancial and Quantitative Analysis 36 (4), 431–450.
Hong, H., Kacperczyk, M., 2009. The price of sin: Theeffects of social norms on markets. Journal of FinancialEconomics 93 (1), 15–36.
Hong, H., Kostovetsky, L., 2012. Red and blue investing:Values and finance. Journal of Financial Economics103 (1), 1–19.
Hong, H. G., Kubik, J. K., Scheinkman, J. A., 2012.Financial constraints on corporate goodness. Unpub-lished working paper. Princeton University and Syra-cuse University.
Jensen, M., 1986. Agency cost of free cash flow, corpo-rate finance, and takeovers. American Economic Re-view 76 (2), 323–329.
Jensen, M. C., 2001. Value maximization, stakeholdertheory, and the corporate objective function. Journal ofApplied Corporate Finance 14 (3), 8–21.
Kacperczyk, A., 2009. With greater power comes greaterresponsibility? Takeover protection and corporate at-tention to stakeholders. Strategic Management Journal30 (3), 261–285.
Karpoff, J., Lott, Jr., J., Wehrly, E., 2005. The reputationalpenalties for environmental violations: Empirical evi-dence. The Journal of Law and Economics 48 (2), 653–675.
22
Kempf, A., Osthoff, P., 2007. The effect of socially re-sponsible investing on portfolio performance. Euro-pean Financial Management 13 (5), 908–922.
Kitzmueller, M., Shimshack, J., 2012. Economic perspec-tives on corporate social responsibility. Journal of Eco-nomic Literature 50 (1), 51–84.
Konar, S., Cohen, M., 2001. Does the market value en-vironmental performance? Review of Economics andStatistics 83 (2), 281–289.
Kotchen, M., Moon, J., 2012. Corporate social responsi-bility for irresponsibility. The BE Journal of EconomicAnalysis & Policy 12 (1), 1–23.
Kothari, S., Warner, J., 2007. Econometrics of event stud-ies. In: Eckbo, B. (Ed.), Handbook of Corporate Fi-nance: Empirical Corporate Finance. Vol. 1. Elsevier,Amsterdam, pp. 3–36.
Kruger, P., 2010. Corporate social responsibility and theboard of directors. Unpublished working paper. GenevaFinance Research Institute, University of Geneva.
Kurtz, L., DiBartolomeo, D., 1996. Socially screenedportfolios: an attribution analysis of relative perfor-mance. The Journal of Investing 5 (3), 35–41.
Landier, A., Nair, V. B., 2009. Investing for Change:Profit from Responsible Investment. Oxford UniversityPress, Oxford.
Liang, H., Renneboog, L., 2013. The foundations of cor-porate social responsibility. Unpublished working pa-per. CentER, Tilburg University.
Magill, M., Quinzii, M., Rochet, J.-C., 2013. A critiqueof market value maximization. Unpublished workingpaper. University of Southern California, University ofCalifornia, Davis, and University of Zurich.
Margolis, J., Elfenbein, H., Walsh, J., 2007. Does it pay tobe good? A meta-analysis and redirection of researchon the relationship between corporate social and finan-cial performance. Unpublished Working Paper. Har-vard University, University of California Berkeley, andUniversity of Michigan.
Pigou, A., 1920. The Economics of Welfare. McMillan &Co., London.
Renneboog, L., Ter Horst, J., Zhang, C., 2008. Sociallyresponsible investments: institutional aspects, perfor-mance, and investor behavior. Journal of Banking &Finance 32 (9), 1723–1742.
Schroder, M., 2007. Is there a difference? The perfor-mance characteristics of SRI equity indices. Journal ofBusiness Finance and Accounting 34 (1,2), 331–348.
Servaes, H., Tamayo, A., 2013. The impact of corporatesocial responsibility on firm value: The role of cus-tomer awareness. Management Science 59 (5), 1045–1061.
Statman, M., Glushkov, D., 2009. The wages of socialresponsibility. Financial Analysts Journal 65 (4), 774–800.
Tetlock, P., 2007. Giving content to investor sentiment:The role of media in the stock market. The Journal ofFinance 62 (3), 1139–1168.
Tirole, J., 2001. Corporate governance. Econometrica69 (1), 1–35.
Waddock, S., Graves, S., 1997. The corporate so-cial performance-financial performance link. StrategicManagement Journal 18 (4), 303–319.
23
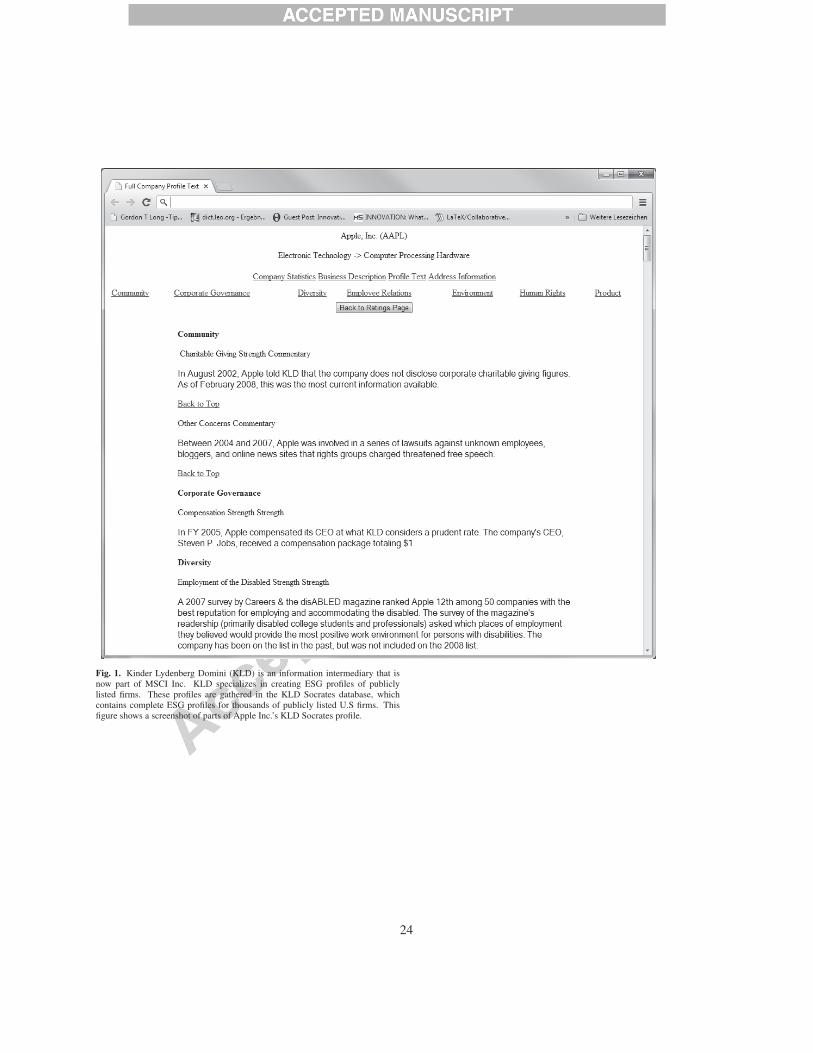
Fig. 1. Kinder Lydenberg Domini (KLD) is an information intermediary that isnow part of MSCI Inc. KLD specializes in creating ESG profiles of publiclylisted firms. These profiles are gathered in the KLD Socrates database, whichcontains complete ESG profiles for thousands of publicly listed U.S firms. Thisfigure shows a screenshot of parts of Apple Inc.’s KLD Socrates profile.
24
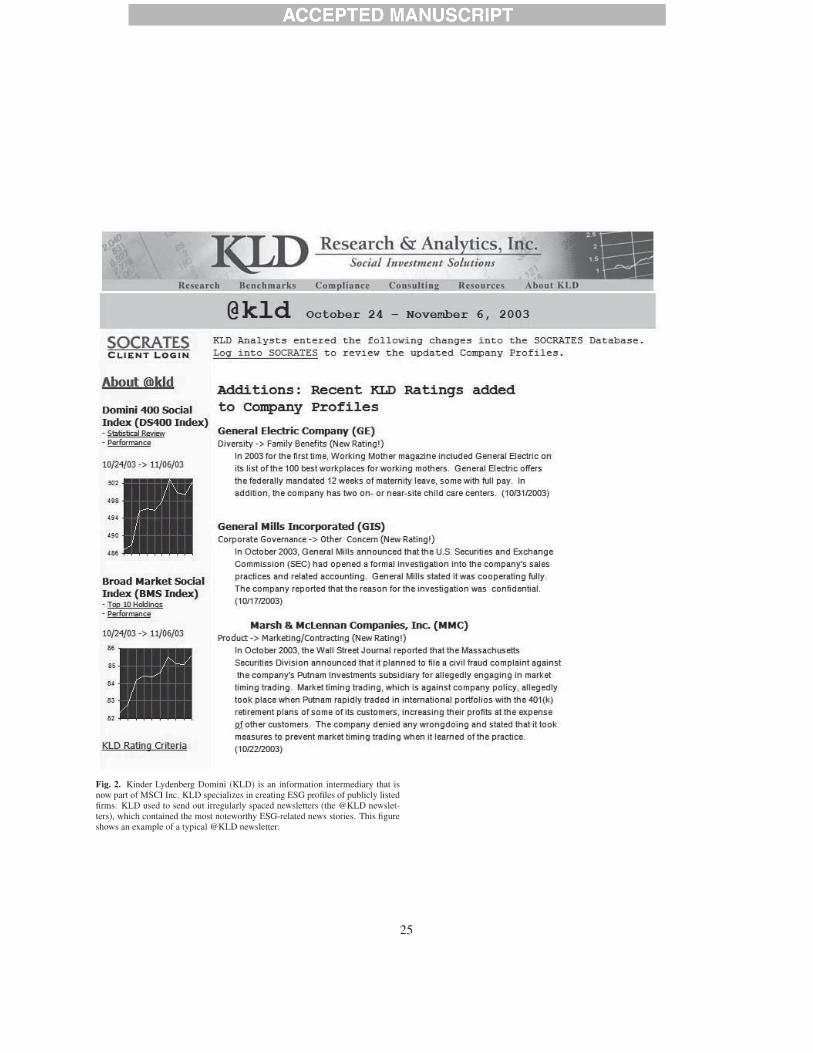
Fig. 2. Kinder Lydenberg Domini (KLD) is an information intermediary that isnow part of MSCI Inc. KLD specializes in creating ESG profiles of publicly listedfirms. KLD used to send out irregularly spaced newsletters (the @KLD newslet-ters), which contained the most noteworthy ESG-related news stories. This figureshows an example of a typical @KLD newsletter.
25
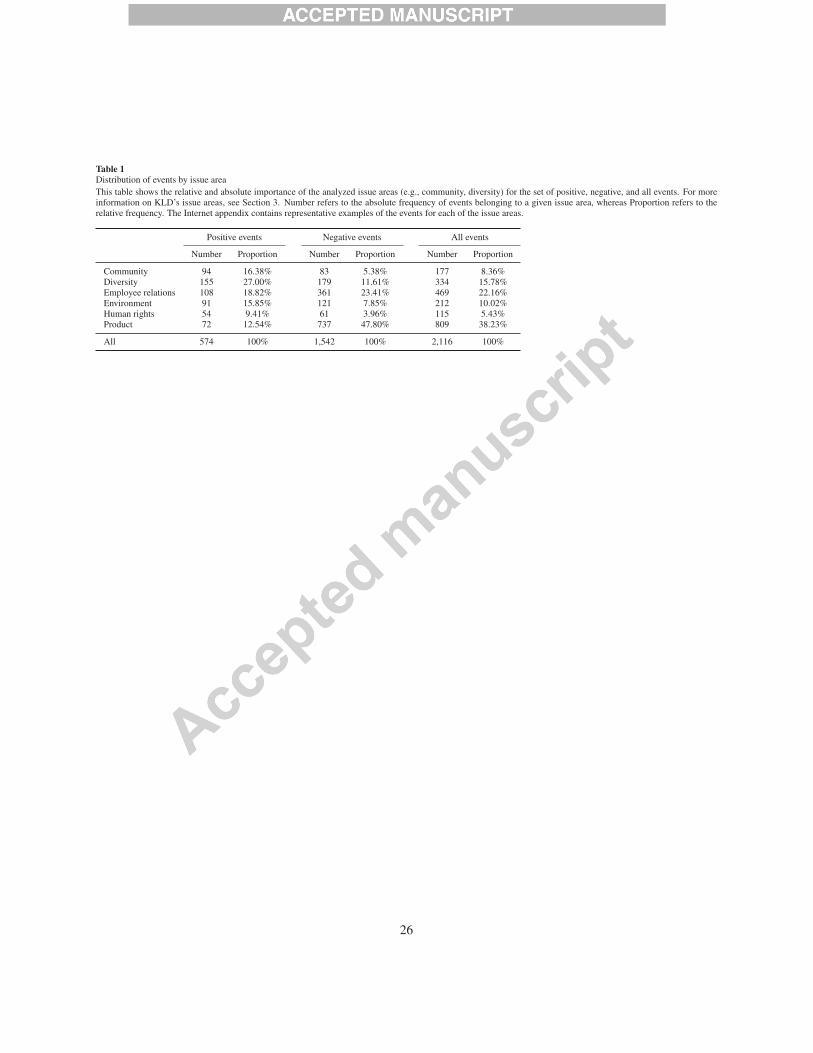
Table 1
Distribution of events by issue areaThis table shows the relative and absolute importance of the analyzed issue areas (e.g., community, diversity) for the set of positive, negative, and all events. For moreinformation on KLD’s issue areas, see Section 3. Number refers to the absolute frequency of events belonging to a given issue area, whereas Proportion refers to therelative frequency. The Internet appendix contains representative examples of the events for each of the issue areas.
Positive events Negative events All events
Number Proportion Number Proportion Number Proportion
Community 94 16.38% 83 5.38% 177 8.36%Diversity 155 27.00% 179 11.61% 334 15.78%Employee relations 108 18.82% 361 23.41% 469 22.16%Environment 91 15.85% 121 7.85% 212 10.02%Human rights 54 9.41% 61 3.96% 115 5.43%Product 72 12.54% 737 47.80% 809 38.23%
All 574 100% 1,542 100% 2,116 100%
26
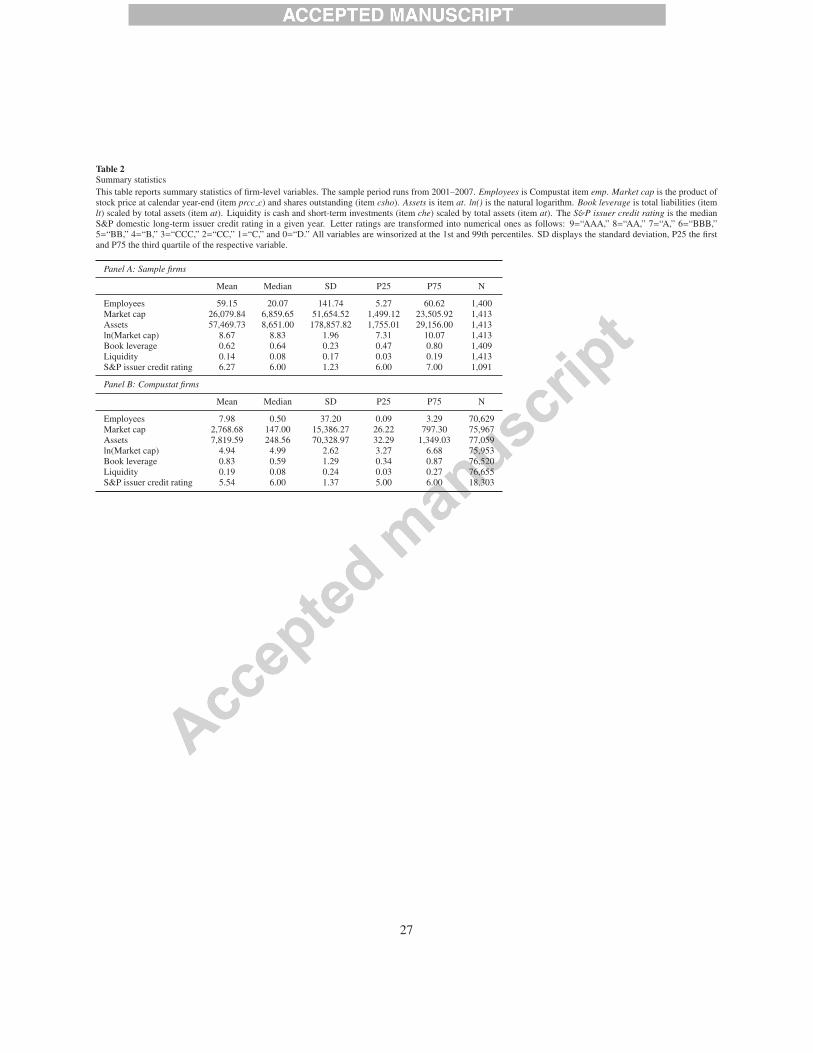
Table 2
Summary statisticsThis table reports summary statistics of firm-level variables. The sample period runs from 2001–2007. Employees is Compustat item emp. Market cap is the product ofstock price at calendar year-end (item prcc c) and shares outstanding (item csho). Assets is item at. ln() is the natural logarithm. Book leverage is total liabilities (itemlt) scaled by total assets (item at). Liquidity is cash and short-term investments (item che) scaled by total assets (item at). The S&P issuer credit rating is the medianS&P domestic long-term issuer credit rating in a given year. Letter ratings are transformed into numerical ones as follows: 9=“AAA,” 8=“AA,” 7=“A,” 6=“BBB,”5=“BB,” 4=“B,” 3=“CCC,” 2=“CC,” 1=“C,” and 0=“D.” All variables are winsorized at the 1st and 99th percentiles. SD displays the standard deviation, P25 the firstand P75 the third quartile of the respective variable.
Panel A: Sample firms
Mean Median SD P25 P75 N
Employees 59.15 20.07 141.74 5.27 60.62 1,400Market cap 26,079.84 6,859.65 51,654.52 1,499.12 23,505.92 1,413Assets 57,469.73 8,651.00 178,857.82 1,755.01 29,156.00 1,413ln(Market cap) 8.67 8.83 1.96 7.31 10.07 1,413Book leverage 0.62 0.64 0.23 0.47 0.80 1,409Liquidity 0.14 0.08 0.17 0.03 0.19 1,413S&P issuer credit rating 6.27 6.00 1.23 6.00 7.00 1,091
Panel B: Compustat firms
Mean Median SD P25 P75 N
Employees 7.98 0.50 37.20 0.09 3.29 70,629Market cap 2,768.68 147.00 15,386.27 26.22 797.30 75,967Assets 7,819.59 248.56 70,328.97 32.29 1,349.03 77,059ln(Market cap) 4.94 4.99 2.62 3.27 6.68 75,953Book leverage 0.83 0.59 1.29 0.34 0.87 76,520Liquidity 0.19 0.08 0.24 0.03 0.27 76,655S&P issuer credit rating 5.54 6.00 1.37 5.00 6.00 18,303
27

Table 3
Cumulative abnormal returns (negative events)This table reports cumulative abnormal returns for negative events. I consider event windows of 11 [-5,5] and 21 [-10,10] days. The test portfolio in Panel A containsall negative events, whereas the test portfolios in Panels B–G contain only negative events belonging to the respective issue areas. For representative negative eventsbelonging to each issue area, see the Internet appendix. The columns MEAN, MIN, MED, and MAX display the mean, minimum, median, and maximum CAR,respectively. The column Perc. pos. represents the fraction of positive event CARs. The t–statistics account for event-induced changes in volatility and are calculatedaccording to Boehmer, Musumeci, and Poulsen (1991). The generalized sign test (see Cowan, 1992), displayed in column Sign test, is a test of the median cumulativeabnormal return being equal to zero. (∗ p < 0.10, ∗∗ p < 0.05, ∗∗∗ p < 0.01)
Mean MIN MED MAX Perc. SignWindow (%) t–Stat (%) (%) (%) pos. (%) test N
Panel A: All negative events
[−5, 5] -0.88∗∗∗ -4.95 -73.49 -0.42 55.39 43.57 -4.00 1,542[−10, 10] -1.31∗∗∗ -6.57 -65.38 -1.11 60.58 42.08 -5.20 1,542
Panel B: Community
[−5, 5] -2.14∗∗∗ -2.80 -27.64 -1.22 13.12 35.71 -2.53 83[−10, 10] -3.33∗∗∗ -3.17 -29.68 -2.30 34.35 30.95 -3.41 83
Panel C: Diversity
[−5, 5] -0.45 -1.08 -27.61 -0.27 19.28 45.45 -0.71 179[−10, 10] -0.84∗ -1.93 -36.99 -0.46 23.50 44.39 -1.00 179
Panel D: Employee relations
[−5, 5] -0.88∗ -1.76 -73.49 -0.18 55.39 44.62 -1.11 361[−10, 10] -0.94∗∗ -2.33 -64.88 -1.10 54.98 42.82 -1.82 361
Panel E: Environment
[−5, 5] -1.54∗ -1.77 -43.90 -0.35 22.40 41.73 -1.60 121[−10, 10] -3.03∗∗ -2.43 -56.45 -1.11 26.54 40.16 -1.95 121
Panel F: Human rights
[−5, 5] 1.07 1.34 -6.86 0.89 20.56 57.14 1.35 61[−10, 10] 0.17 -0.09 -34.52 0.01 17.56 49.21 0.09 61
Panel G: Product
[−5, 5] -0.89∗∗∗ -3.98 -51.49 -0.53 39.06 42.61 -3.57 737[−10, 10] -1.22∗∗∗ -4.71 -65.38 -1.15 60.58 42.08 -3.86 737
28

Table 4
Cumulative abnormal returns (positive events)This table reports cumulative abnormal returns for positive events. I consider event windows of 11 [-5,5] and 21 [-10,10] days. The test portfolio in Panel A containsall positive events, whereas the test portfolios in Panels B–G contain only positive events belonging to the respective issue areas. For representative positive eventsbelonging to each issue area, see the Internet appendix. The columns MEAN, MIN, MED, and MAX display the mean, minimum, median, and maximum CAR,respectively. The column Perc. pos. represents the fraction of positive event CARs. The t–statistics account for event-induced changes in volatility and are calculatedaccording to Boehmer, Musumeci, and Poulsen (1991). The generalized sign test (see Cowan, 1992), displayed in column Sign test, is a test of the median cumulativeabnormal return being equal to zero. (∗ p < 0.10, ∗∗ p < 0.05, ∗∗∗ p < 0.01)
Mean MIN MED MAX Perc. SignWindow (%) t–Stat (%) (%) (%) pos. (%) test N
Panel A: All positive events
[−5, 5] -0.16 -0.77 -37.11 -0.31 31.08 45.36 -1.25 574[−10, 10] -0.47∗ -1.82 -61.62 -0.54 37.90 44.52 -1.66 574
Panel B: Community
[−5, 5] -1.25∗ -1.75 -30.69 -0.98 8.92 43.30 -0.91 94[−10, 10] -1.61∗∗ -2.35 -31.83 -1.44 13.42 38.14 -1.92 94
Panel C: Diversity
[−5, 5] -0.10 -0.61 -25.78 -0.53 31.08 44.44 -0.98 155[−10, 10] -0.56 -0.80 -61.62 -0.67 37.90 44.44 -0.98 155
Panel D: Employee relations
[−5, 5] -0.42 -0.41 -37.11 -0.63 19.83 39.64 -1.73 108[−10, 10] 0.59 0.69 -25.36 0.88 31.90 52.25 0.93 108
Panel E: Environment
[−5, 5] 0.07 -0.05 -12.75 -0.02 11.31 47.31 -0.11 91[−10, 10] -1.37∗ -1.85 -19.26 -0.96 9.23 44.09 -0.73 91
Panel F: Human rights
[−5, 5] -0.45 -0.74 -13.91 0.24 14.67 51.85 0.42 54[−10, 10] 0.02 -0.10 -15.02 -0.50 18.67 42.59 -0.94 54
Panel G: Product
[−5, 5] 1.41∗ 1.75 -9.82 0.28 22.15 51.32 0.80 72[−10, 10] 0.41 -0.25 -17.91 -0.68 19.40 43.42 -0.58 72
29
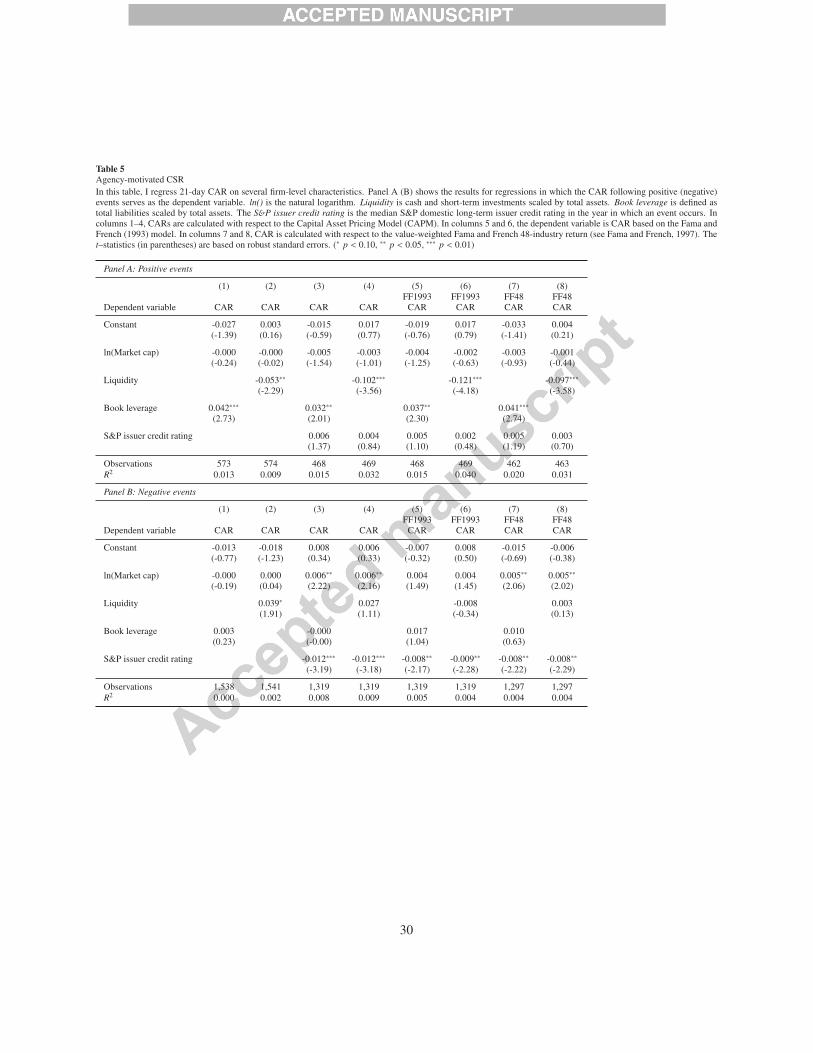
Table 5
Agency-motivated CSRIn this table, I regress 21-day CAR on several firm-level characteristics. Panel A (B) shows the results for regressions in which the CAR following positive (negative)events serves as the dependent variable. ln() is the natural logarithm. Liquidity is cash and short-term investments scaled by total assets. Book leverage is defined astotal liabilities scaled by total assets. The S&P issuer credit rating is the median S&P domestic long-term issuer credit rating in the year in which an event occurs. Incolumns 1–4, CARs are calculated with respect to the Capital Asset Pricing Model (CAPM). In columns 5 and 6, the dependent variable is CAR based on the Fama andFrench (1993) model. In columns 7 and 8, CAR is calculated with respect to the value-weighted Fama and French 48-industry return (see Fama and French, 1997). Thet–statistics (in parentheses) are based on robust standard errors. (∗ p < 0.10, ∗∗ p < 0.05, ∗∗∗ p < 0.01)
Panel A: Positive events
(1) (2) (3) (4) (5) (6) (7) (8)FF1993 FF1993 FF48 FF48
Dependent variable CAR CAR CAR CAR CAR CAR CAR CAR
Constant -0.027 0.003 -0.015 0.017 -0.019 0.017 -0.033 0.004(-1.39) (0.16) (-0.59) (0.77) (-0.76) (0.79) (-1.41) (0.21)
ln(Market cap) -0.000 -0.000 -0.005 -0.003 -0.004 -0.002 -0.003 -0.001(-0.24) (-0.02) (-1.54) (-1.01) (-1.25) (-0.63) (-0.93) (-0.44)
Liquidity -0.053∗∗ -0.102∗∗∗ -0.121∗∗∗ -0.097∗∗∗(-2.29) (-3.56) (-4.18) (-3.58)
Book leverage 0.042∗∗∗ 0.032∗∗ 0.037∗∗ 0.041∗∗∗(2.73) (2.01) (2.30) (2.74)
S&P issuer credit rating 0.006 0.004 0.005 0.002 0.005 0.003(1.37) (0.84) (1.10) (0.48) (1.19) (0.70)
Observations 573 574 468 469 468 469 462 463R2 0.013 0.009 0.015 0.032 0.015 0.040 0.020 0.031
Panel B: Negative events
(1) (2) (3) (4) (5) (6) (7) (8)FF1993 FF1993 FF48 FF48
Dependent variable CAR CAR CAR CAR CAR CAR CAR CAR
Constant -0.013 -0.018 0.008 0.006 -0.007 0.008 -0.015 -0.006(-0.77) (-1.23) (0.34) (0.33) (-0.32) (0.50) (-0.69) (-0.38)
ln(Market cap) -0.000 0.000 0.006∗∗ 0.006∗∗ 0.004 0.004 0.005∗∗ 0.005∗∗(-0.19) (0.04) (2.22) (2.16) (1.49) (1.45) (2.06) (2.02)
Liquidity 0.039∗ 0.027 -0.008 0.003(1.91) (1.11) (-0.34) (0.13)
Book leverage 0.003 -0.000 0.017 0.010(0.23) (-0.00) (1.04) (0.63)
S&P issuer credit rating -0.012∗∗∗ -0.012∗∗∗ -0.008∗∗ -0.009∗∗ -0.008∗∗ -0.008∗∗(-3.19) (-3.18) (-2.17) (-2.28) (-2.22) (-2.29)
Observations 1,538 1,541 1,319 1,319 1,319 1,319 1,297 1,297R2 0.000 0.002 0.008 0.009 0.005 0.004 0.004 0.004
30
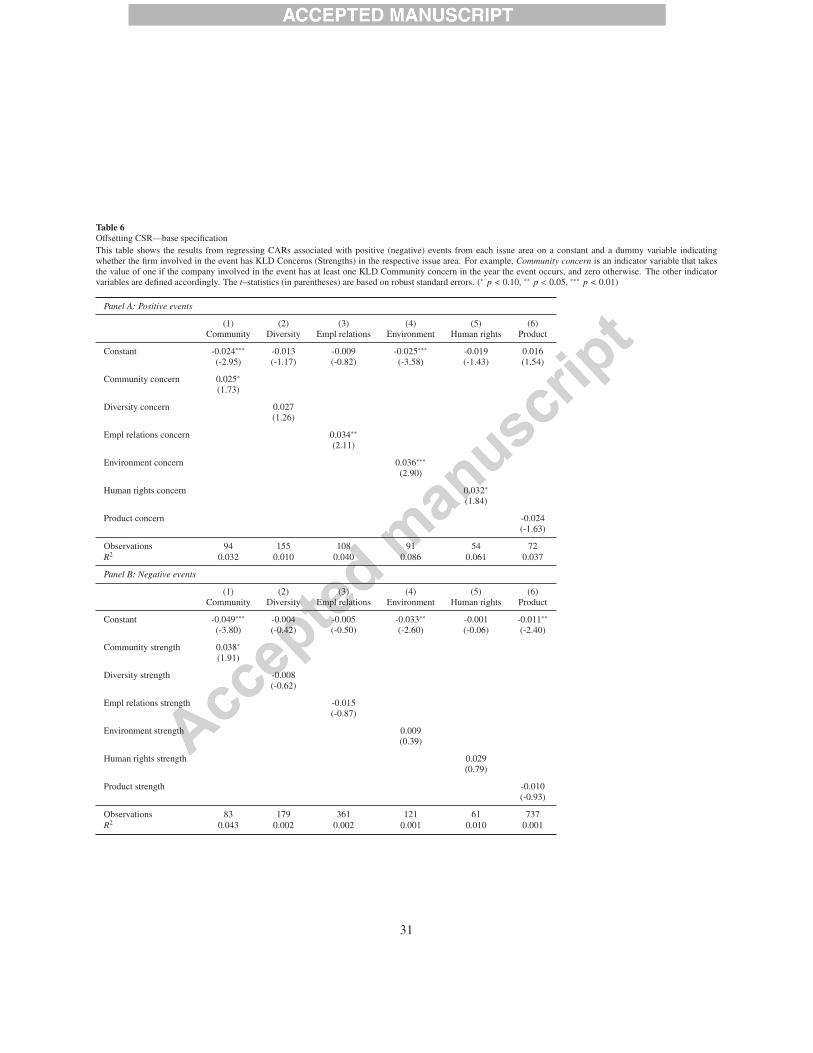
Table 6
Offsetting CSR—base specificationThis table shows the results from regressing CARs associated with positive (negative) events from each issue area on a constant and a dummy variable indicatingwhether the firm involved in the event has KLD Concerns (Strengths) in the respective issue area. For example, Community concern is an indicator variable that takesthe value of one if the company involved in the event has at least one KLD Community concern in the year the event occurs, and zero otherwise. The other indicatorvariables are defined accordingly. The t–statistics (in parentheses) are based on robust standard errors. (∗ p < 0.10, ∗∗ p < 0.05, ∗∗∗ p < 0.01)
Panel A: Positive events
(1) (2) (3) (4) (5) (6)Community Diversity Empl relations Environment Human rights Product
Constant -0.024∗∗∗ -0.013 -0.009 -0.025∗∗∗ -0.019 0.016(-2.95) (-1.17) (-0.82) (-3.58) (-1.43) (1.54)
Community concern 0.025∗(1.73)
Diversity concern 0.027(1.26)
Empl relations concern 0.034∗∗(2.11)
Environment concern 0.036∗∗∗(2.90)
Human rights concern 0.032∗(1.84)
Product concern -0.024(-1.63)
Observations 94 155 108 91 54 72R2 0.032 0.010 0.040 0.086 0.061 0.037
Panel B: Negative events
(1) (2) (3) (4) (5) (6)Community Diversity Empl relations Environment Human rights Product
Constant -0.049∗∗∗ -0.004 -0.005 -0.033∗∗ -0.001 -0.011∗∗(-3.80) (-0.42) (-0.50) (-2.60) (-0.06) (-2.40)
Community strength 0.038∗(1.91)
Diversity strength -0.008(-0.62)
Empl relations strength -0.015(-0.87)
Environment strength 0.009(0.39)
Human rights strength 0.029(0.79)
Product strength -0.010(-0.93)
Observations 83 179 361 121 61 737R2 0.043 0.002 0.002 0.001 0.010 0.001
31
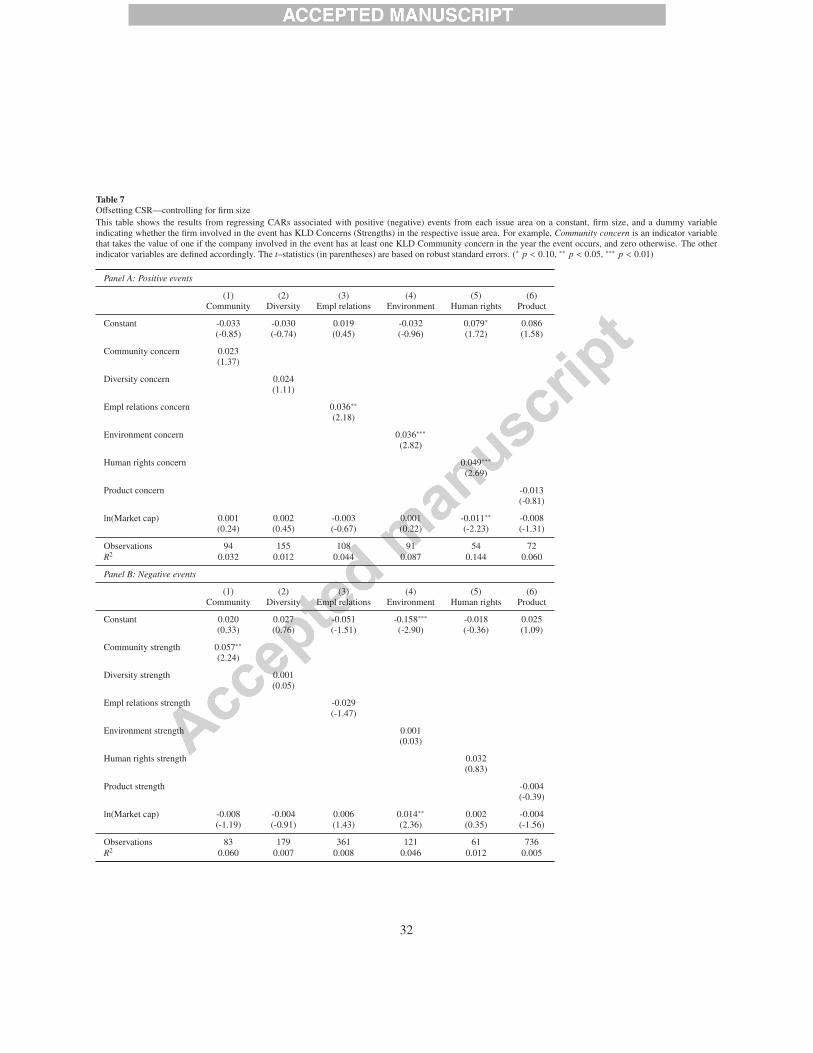
Table 7
Offsetting CSR—controlling for firm sizeThis table shows the results from regressing CARs associated with positive (negative) events from each issue area on a constant, firm size, and a dummy variableindicating whether the firm involved in the event has KLD Concerns (Strengths) in the respective issue area. For example, Community concern is an indicator variablethat takes the value of one if the company involved in the event has at least one KLD Community concern in the year the event occurs, and zero otherwise. The otherindicator variables are defined accordingly. The t–statistics (in parentheses) are based on robust standard errors. (∗ p < 0.10, ∗∗ p < 0.05, ∗∗∗ p < 0.01)
Panel A: Positive events
(1) (2) (3) (4) (5) (6)Community Diversity Empl relations Environment Human rights Product
Constant -0.033 -0.030 0.019 -0.032 0.079∗ 0.086(-0.85) (-0.74) (0.45) (-0.96) (1.72) (1.58)
Community concern 0.023(1.37)
Diversity concern 0.024(1.11)
Empl relations concern 0.036∗∗(2.18)
Environment concern 0.036∗∗∗(2.82)
Human rights concern 0.049∗∗∗(2.69)
Product concern -0.013(-0.81)
ln(Market cap) 0.001 0.002 -0.003 0.001 -0.011∗∗ -0.008(0.24) (0.45) (-0.67) (0.22) (-2.23) (-1.31)
Observations 94 155 108 91 54 72R2 0.032 0.012 0.044 0.087 0.144 0.060
Panel B: Negative events
(1) (2) (3) (4) (5) (6)Community Diversity Empl relations Environment Human rights Product
Constant 0.020 0.027 -0.051 -0.158∗∗∗ -0.018 0.025(0.33) (0.76) (-1.51) (-2.90) (-0.36) (1.09)
Community strength 0.057∗∗(2.24)
Diversity strength 0.001(0.05)
Empl relations strength -0.029(-1.47)
Environment strength 0.001(0.03)
Human rights strength 0.032(0.83)
Product strength -0.004(-0.39)
ln(Market cap) -0.008 -0.004 0.006 0.014∗∗ 0.002 -0.004(-1.19) (-0.91) (1.43) (2.36) (0.35) (-1.56)
Observations 83 179 361 121 61 736R2 0.060 0.007 0.008 0.046 0.012 0.005
32
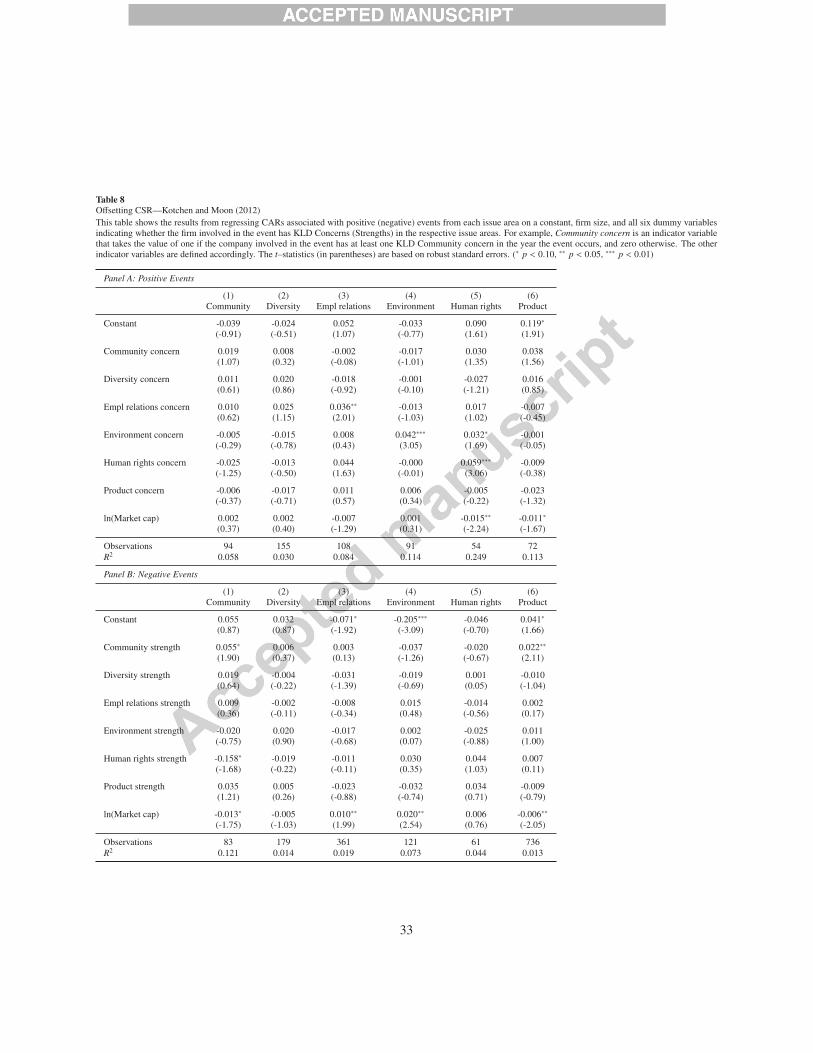
Table 8
Offsetting CSR—Kotchen and Moon (2012)This table shows the results from regressing CARs associated with positive (negative) events from each issue area on a constant, firm size, and all six dummy variablesindicating whether the firm involved in the event has KLD Concerns (Strengths) in the respective issue areas. For example, Community concern is an indicator variablethat takes the value of one if the company involved in the event has at least one KLD Community concern in the year the event occurs, and zero otherwise. The otherindicator variables are defined accordingly. The t–statistics (in parentheses) are based on robust standard errors. (∗ p < 0.10, ∗∗ p < 0.05, ∗∗∗ p < 0.01)
Panel A: Positive Events
(1) (2) (3) (4) (5) (6)Community Diversity Empl relations Environment Human rights Product
Constant -0.039 -0.024 0.052 -0.033 0.090 0.119∗(-0.91) (-0.51) (1.07) (-0.77) (1.61) (1.91)
Community concern 0.019 0.008 -0.002 -0.017 0.030 0.038(1.07) (0.32) (-0.08) (-1.01) (1.35) (1.56)
Diversity concern 0.011 0.020 -0.018 -0.001 -0.027 0.016(0.61) (0.86) (-0.92) (-0.10) (-1.21) (0.85)
Empl relations concern 0.010 0.025 0.036∗∗ -0.013 0.017 -0.007(0.62) (1.15) (2.01) (-1.03) (1.02) (-0.45)
Environment concern -0.005 -0.015 0.008 0.042∗∗∗ 0.032∗ -0.001(-0.29) (-0.78) (0.43) (3.05) (1.69) (-0.05)
Human rights concern -0.025 -0.013 0.044 -0.000 0.059∗∗∗ -0.009(-1.25) (-0.50) (1.63) (-0.01) (3.06) (-0.38)
Product concern -0.006 -0.017 0.011 0.006 -0.005 -0.023(-0.37) (-0.71) (0.57) (0.34) (-0.22) (-1.32)
ln(Market cap) 0.002 0.002 -0.007 0.001 -0.015∗∗ -0.011∗(0.37) (0.40) (-1.29) (0.31) (-2.24) (-1.67)
Observations 94 155 108 91 54 72R2 0.058 0.030 0.084 0.114 0.249 0.113
Panel B: Negative Events
(1) (2) (3) (4) (5) (6)Community Diversity Empl relations Environment Human rights Product
Constant 0.055 0.032 -0.071∗ -0.205∗∗∗ -0.046 0.041∗(0.87) (0.87) (-1.92) (-3.09) (-0.70) (1.66)
Community strength 0.055∗ 0.006 0.003 -0.037 -0.020 0.022∗∗(1.90) (0.37) (0.13) (-1.26) (-0.67) (2.11)
Diversity strength 0.019 -0.004 -0.031 -0.019 0.001 -0.010(0.64) (-0.22) (-1.39) (-0.69) (0.05) (-1.04)
Empl relations strength 0.009 -0.002 -0.008 0.015 -0.014 0.002(0.36) (-0.11) (-0.34) (0.48) (-0.56) (0.17)
Environment strength -0.020 0.020 -0.017 0.002 -0.025 0.011(-0.75) (0.90) (-0.68) (0.07) (-0.88) (1.00)
Human rights strength -0.158∗ -0.019 -0.011 0.030 0.044 0.007(-1.68) (-0.22) (-0.11) (0.35) (1.03) (0.11)
Product strength 0.035 0.005 -0.023 -0.032 0.034 -0.009(1.21) (0.26) (-0.88) (-0.74) (0.71) (-0.79)
ln(Market cap) -0.013∗ -0.005 0.010∗∗ 0.020∗∗ 0.006 -0.006∗∗(-1.75) (-1.03) (1.99) (2.54) (0.76) (-2.05)
Observations 83 179 361 121 61 736R2 0.121 0.014 0.019 0.073 0.044 0.013
33
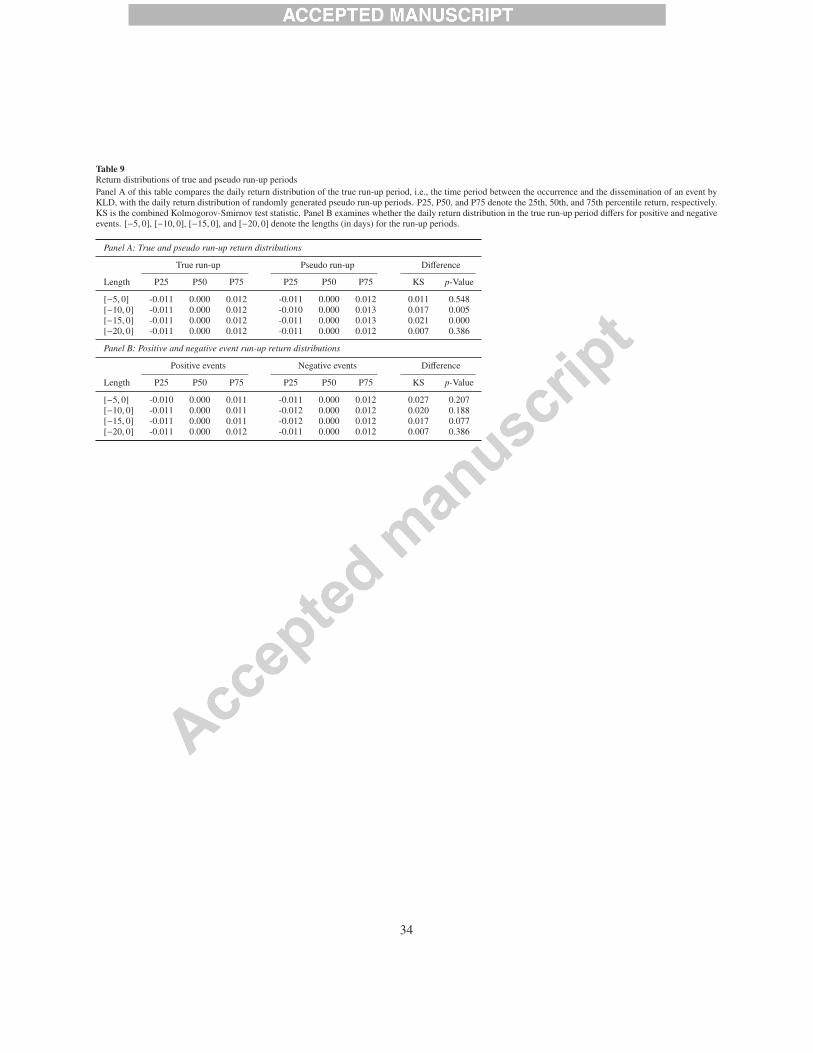
Table 9
Return distributions of true and pseudo run-up periodsPanel A of this table compares the daily return distribution of the true run-up period, i.e., the time period between the occurrence and the dissemination of an event byKLD, with the daily return distribution of randomly generated pseudo run-up periods. P25, P50, and P75 denote the 25th, 50th, and 75th percentile return, respectively.KS is the combined Kolmogorov-Smirnov test statistic. Panel B examines whether the daily return distribution in the true run-up period differs for positive and negativeevents. [−5, 0], [−10, 0], [−15, 0], and [−20, 0] denote the lengths (in days) for the run-up periods.
Panel A: True and pseudo run-up return distributions
True run-up Pseudo run-up Difference
Length P25 P50 P75 P25 P50 P75 KS p-Value
[−5, 0] -0.011 0.000 0.012 -0.011 0.000 0.012 0.011 0.548[−10, 0] -0.011 0.000 0.012 -0.010 0.000 0.013 0.017 0.005[−15, 0] -0.011 0.000 0.012 -0.011 0.000 0.013 0.021 0.000[−20, 0] -0.011 0.000 0.012 -0.011 0.000 0.012 0.007 0.386
Panel B: Positive and negative event run-up return distributions
Positive events Negative events Difference
Length P25 P50 P75 P25 P50 P75 KS p-Value
[−5, 0] -0.010 0.000 0.011 -0.011 0.000 0.012 0.027 0.207[−10, 0] -0.011 0.000 0.011 -0.012 0.000 0.012 0.020 0.188[−15, 0] -0.011 0.000 0.011 -0.012 0.000 0.012 0.017 0.077[−20, 0] -0.011 0.000 0.012 -0.011 0.000 0.012 0.007 0.386
34
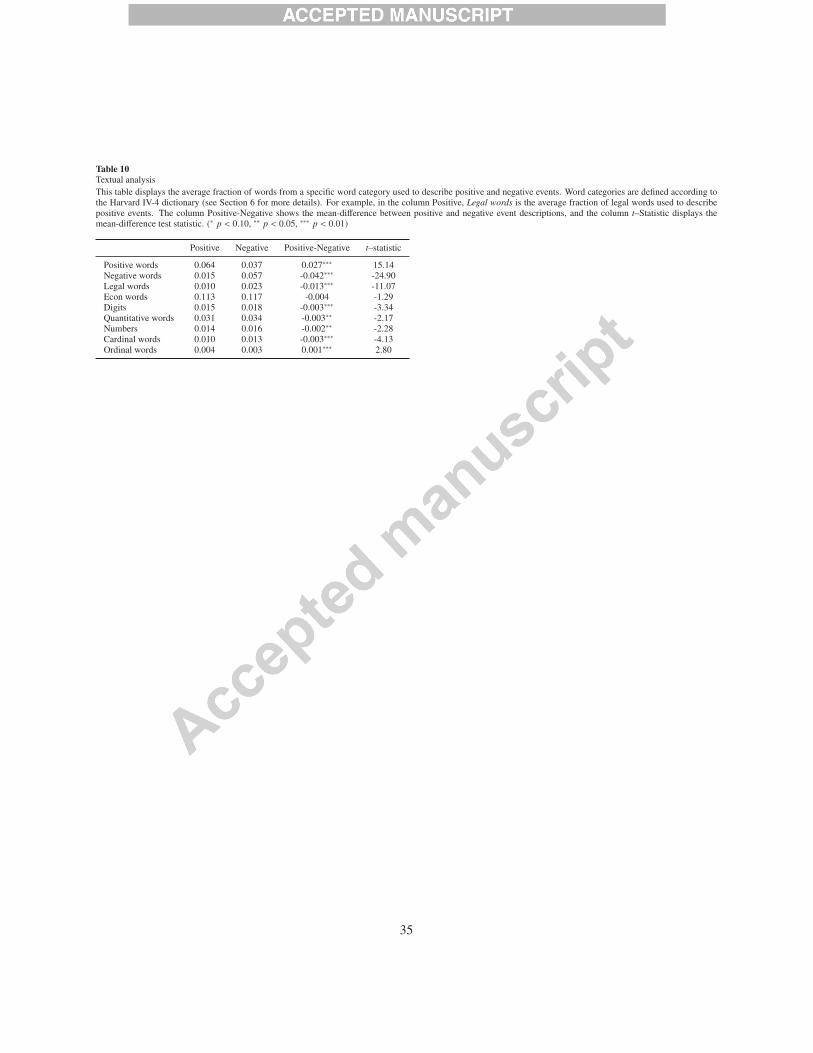
Table 10
Textual analysisThis table displays the average fraction of words from a specific word category used to describe positive and negative events. Word categories are defined according tothe Harvard IV-4 dictionary (see Section 6 for more details). For example, in the column Positive, Legal words is the average fraction of legal words used to describepositive events. The column Positive-Negative shows the mean-difference between positive and negative event descriptions, and the column t–Statistic displays themean-difference test statistic. (∗ p < 0.10, ∗∗ p < 0.05, ∗∗∗ p < 0.01)
Positive Negative Positive-Negative t–statistic
Positive words 0.064 0.037 0.027∗∗∗ 15.14Negative words 0.015 0.057 -0.042∗∗∗ -24.90Legal words 0.010 0.023 -0.013∗∗∗ -11.07Econ words 0.113 0.117 -0.004 -1.29Digits 0.015 0.018 -0.003∗∗∗ -3.34Quantitative words 0.031 0.034 -0.003∗∗ -2.17Numbers 0.014 0.016 -0.002∗∗ -2.28Cardinal words 0.010 0.013 -0.003∗∗∗ -4.13Ordinal words 0.004 0.003 0.001∗∗∗ 2.80
35
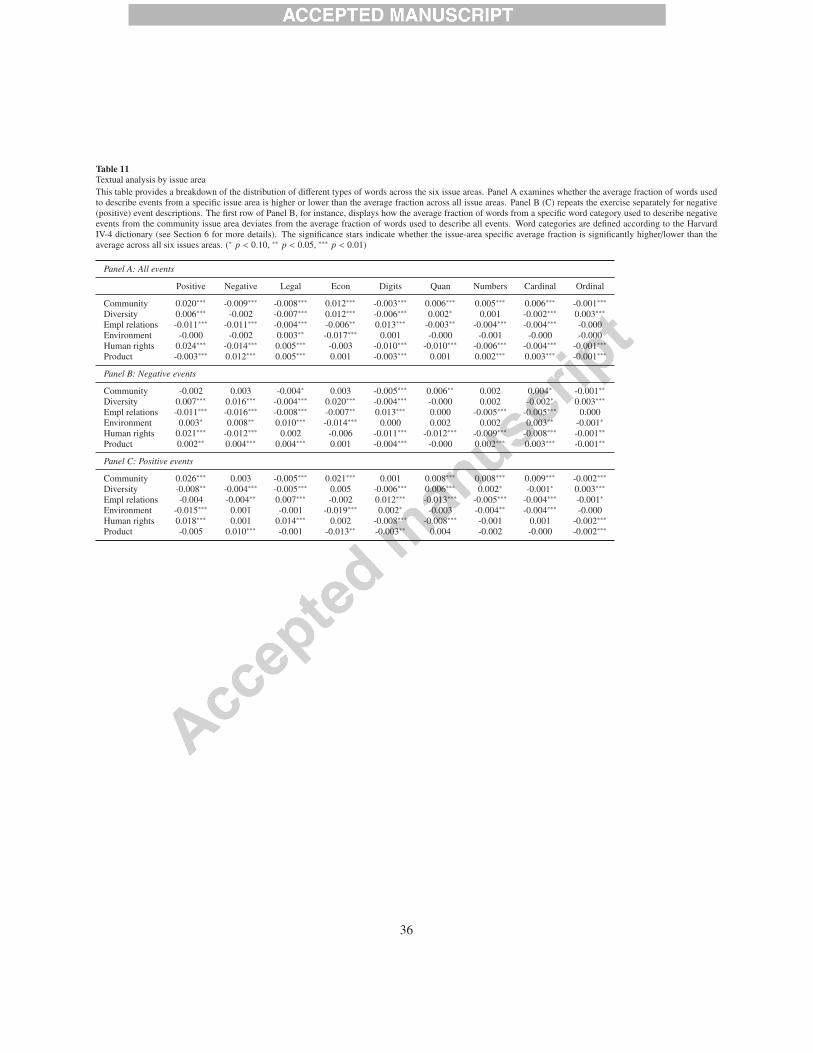
Table 11
Textual analysis by issue areaThis table provides a breakdown of the distribution of different types of words across the six issue areas. Panel A examines whether the average fraction of words usedto describe events from a specific issue area is higher or lower than the average fraction across all issue areas. Panel B (C) repeats the exercise separately for negative(positive) event descriptions. The first row of Panel B, for instance, displays how the average fraction of words from a specific word category used to describe negativeevents from the community issue area deviates from the average fraction of words used to describe all events. Word categories are defined according to the HarvardIV-4 dictionary (see Section 6 for more details). The significance stars indicate whether the issue-area specific average fraction is significantly higher/lower than theaverage across all six issues areas. (∗ p < 0.10, ∗∗ p < 0.05, ∗∗∗ p < 0.01)
Panel A: All events
Positive Negative Legal Econ Digits Quan Numbers Cardinal Ordinal
Community 0.020∗∗∗ -0.009∗∗∗ -0.008∗∗∗ 0.012∗∗∗ -0.003∗∗∗ 0.006∗∗∗ 0.005∗∗∗ 0.006∗∗∗ -0.001∗∗∗Diversity 0.006∗∗∗ -0.002 -0.007∗∗∗ 0.012∗∗∗ -0.006∗∗∗ 0.002∗ 0.001 -0.002∗∗∗ 0.003∗∗∗Empl relations -0.011∗∗∗ -0.011∗∗∗ -0.004∗∗∗ -0.006∗∗ 0.013∗∗∗ -0.003∗∗ -0.004∗∗∗ -0.004∗∗∗ -0.000Environment -0.000 -0.002 0.003∗∗ -0.017∗∗∗ 0.001 -0.000 -0.001 -0.000 -0.000Human rights 0.024∗∗∗ -0.014∗∗∗ 0.005∗∗∗ -0.003 -0.010∗∗∗ -0.010∗∗∗ -0.006∗∗∗ -0.004∗∗∗ -0.001∗∗∗Product -0.003∗∗∗ 0.012∗∗∗ 0.005∗∗∗ 0.001 -0.003∗∗∗ 0.001 0.002∗∗∗ 0.003∗∗∗ -0.001∗∗∗
Panel B: Negative events
Community -0.002 0.003 -0.004∗ 0.003 -0.005∗∗∗ 0.006∗∗ 0.002 0.004∗ -0.001∗∗Diversity 0.007∗∗∗ 0.016∗∗∗ -0.004∗∗∗ 0.020∗∗∗ -0.004∗∗∗ -0.000 0.002 -0.002∗ 0.003∗∗∗Empl relations -0.011∗∗∗ -0.016∗∗∗ -0.008∗∗∗ -0.007∗∗ 0.013∗∗∗ 0.000 -0.005∗∗∗ -0.005∗∗∗ 0.000Environment 0.003∗ 0.008∗∗ 0.010∗∗∗ -0.014∗∗∗ 0.000 0.002 0.002 0.003∗∗ -0.001∗Human rights 0.021∗∗∗ -0.012∗∗∗ 0.002 -0.006 -0.011∗∗∗ -0.012∗∗∗ -0.009∗∗∗ -0.008∗∗∗ -0.001∗∗Product 0.002∗∗ 0.004∗∗∗ 0.004∗∗∗ 0.001 -0.004∗∗∗ -0.000 0.002∗∗∗ 0.003∗∗∗ -0.001∗∗
Panel C: Positive events
Community 0.026∗∗∗ 0.003 -0.005∗∗∗ 0.021∗∗∗ 0.001 0.008∗∗∗ 0.008∗∗∗ 0.009∗∗∗ -0.002∗∗∗Diversity -0.008∗∗ -0.004∗∗∗ -0.005∗∗∗ 0.005 -0.006∗∗∗ 0.006∗∗∗ 0.002∗ -0.001∗ 0.003∗∗∗Empl relations -0.004 -0.004∗∗ 0.007∗∗∗ -0.002 0.012∗∗∗ -0.013∗∗∗ -0.005∗∗∗ -0.004∗∗∗ -0.001∗Environment -0.015∗∗∗ 0.001 -0.001 -0.019∗∗∗ 0.002∗ -0.003 -0.004∗∗ -0.004∗∗∗ -0.000Human rights 0.018∗∗∗ 0.001 0.014∗∗∗ 0.002 -0.008∗∗∗ -0.008∗∗∗ -0.001 0.001 -0.002∗∗∗Product -0.005 0.010∗∗∗ -0.001 -0.013∗∗ -0.003∗∗ 0.004 -0.002 -0.000 -0.002∗∗∗
36
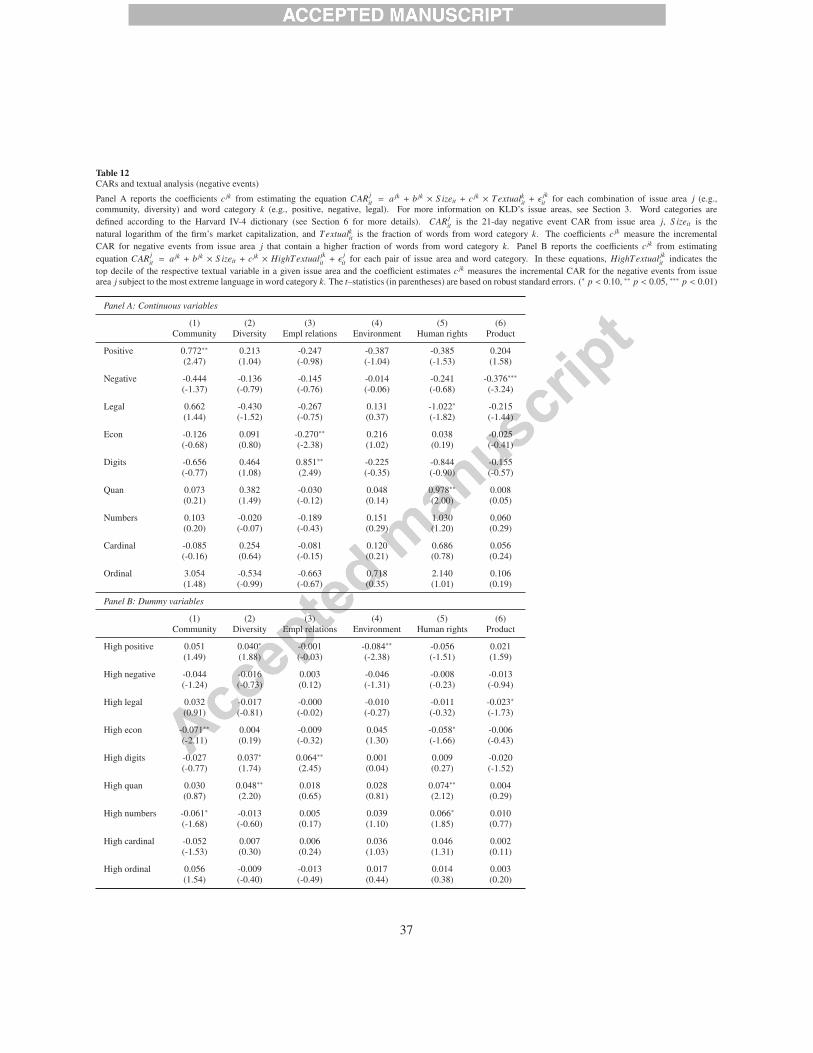
Table 12
CARs and textual analysis (negative events)
Panel A reports the coefficients c jk from estimating the equation CAR jit = a jk + b jk × S izeit + c jk × Textualkit + ε
jkit for each combination of issue area j (e.g.,
community, diversity) and word category k (e.g., positive, negative, legal). For more information on KLD’s issue areas, see Section 3. Word categories aredefined according to the Harvard IV-4 dictionary (see Section 6 for more details). CAR j
it is the 21-day negative event CAR from issue area j, S izeit is thenatural logarithm of the firm’s market capitalization, and Textualkit is the fraction of words from word category k. The coefficients c jk measure the incrementalCAR for negative events from issue area j that contain a higher fraction of words from word category k. Panel B reports the coefficients c jk from estimatingequation CARj
it = a jk + b jk × S izeit + c jk × HighTextual jkit + ε
jit for each pair of issue area and word category. In these equations, HighTextual jk
it indicates thetop decile of the respective textual variable in a given issue area and the coefficient estimates c jk measures the incremental CAR for the negative events from issuearea j subject to the most extreme language in word category k. The t–statistics (in parentheses) are based on robust standard errors. (∗ p < 0.10, ∗∗ p < 0.05, ∗∗∗ p < 0.01)
Panel A: Continuous variables
(1) (2) (3) (4) (5) (6)Community Diversity Empl relations Environment Human rights Product
Positive 0.772∗∗ 0.213 -0.247 -0.387 -0.385 0.204(2.47) (1.04) (-0.98) (-1.04) (-1.53) (1.58)
Negative -0.444 -0.136 -0.145 -0.014 -0.241 -0.376∗∗∗(-1.37) (-0.79) (-0.76) (-0.06) (-0.68) (-3.24)
Legal 0.662 -0.430 -0.267 0.131 -1.022∗ -0.215(1.44) (-1.52) (-0.75) (0.37) (-1.82) (-1.44)
Econ -0.126 0.091 -0.270∗∗ 0.216 0.038 -0.025(-0.68) (0.80) (-2.38) (1.02) (0.19) (-0.41)
Digits -0.656 0.464 0.851∗∗ -0.225 -0.844 -0.155(-0.77) (1.08) (2.49) (-0.35) (-0.90) (-0.57)
Quan 0.073 0.382 -0.030 0.048 0.978∗∗ 0.008(0.21) (1.49) (-0.12) (0.14) (2.00) (0.05)
Numbers 0.103 -0.020 -0.189 0.151 1.030 0.060(0.20) (-0.07) (-0.43) (0.29) (1.20) (0.29)
Cardinal -0.085 0.254 -0.081 0.120 0.686 0.056(-0.16) (0.64) (-0.15) (0.21) (0.78) (0.24)
Ordinal 3.054 -0.534 -0.663 0.718 2.140 0.106(1.48) (-0.99) (-0.67) (0.35) (1.01) (0.19)
Panel B: Dummy variables
(1) (2) (3) (4) (5) (6)Community Diversity Empl relations Environment Human rights Product
High positive 0.051 0.040∗ -0.001 -0.084∗∗ -0.056 0.021(1.49) (1.88) (-0.03) (-2.38) (-1.51) (1.59)
High negative -0.044 -0.016 0.003 -0.046 -0.008 -0.013(-1.24) (-0.73) (0.12) (-1.31) (-0.23) (-0.94)
High legal 0.032 -0.017 -0.000 -0.010 -0.011 -0.023∗(0.91) (-0.81) (-0.02) (-0.27) (-0.32) (-1.73)
High econ -0.071∗∗ 0.004 -0.009 0.045 -0.058∗ -0.006(-2.11) (0.19) (-0.32) (1.30) (-1.66) (-0.43)
High digits -0.027 0.037∗ 0.064∗∗ 0.001 0.009 -0.020(-0.77) (1.74) (2.45) (0.04) (0.27) (-1.52)
High quan 0.030 0.048∗∗ 0.018 0.028 0.074∗∗ 0.004(0.87) (2.20) (0.65) (0.81) (2.12) (0.29)
High numbers -0.061∗ -0.013 0.005 0.039 0.066∗ 0.010(-1.68) (-0.60) (0.17) (1.10) (1.85) (0.77)
High cardinal -0.052 0.007 0.006 0.036 0.046 0.002(-1.53) (0.30) (0.24) (1.03) (1.31) (0.11)
High ordinal 0.056 -0.009 -0.013 0.017 0.014 0.003(1.54) (-0.40) (-0.49) (0.44) (0.38) (0.20)
37

Table 13
CARs and textual analysis (positive events)
Panel A reports the coefficients c jk from estimating the equation CAR jit = a jk + b jk × S izeit + c jk × Textualkit + ε
jkit for each combination of issue area j (e.g.,
community, diversity) and word category k (e.g., positive, negative, legal). For more information on KLD’s issue areas, see Section 3. Word categories aredefined according to the Harvard IV-4 dictionary (see Section 6 for more details). CAR j
it is the 21-day positive event CAR from issue area j, S izeit is the naturallogarithm of the firm’s market capitalization, and Textualkit is the fraction of words from word category k. The coefficients c jk measure the incremental CARfor positive events from issue area j that contain a higher fraction of words from word category k. Panel B reports the coefficients c jk from estimating equationCAR j
it = a jk + b jk × S izeit + c jk × HighTextual jkit + ε
jit for each pair of issue area and word category. In these equations, HighTextual jk
it indicates the topdecile of the respective textual variable in a given issue area and the coefficient estimates c jk measures the incremental CAR for the positive events from issuearea j subject to the most extreme language in word category k. The t–statistics (in parentheses) are based on robust standard errors. (∗ p < 0.10, ∗∗ p < 0.05, ∗∗∗ p < 0.01)
Panel A: Continuous variable
(1) (2) (3) (4) (5) (6)Community Diversity Empl relations Environment Human rights Product
Positive 0.306∗∗ -0.045 0.035 -0.217 -0.112 -0.110(2.07) (-0.23) (0.22) (-1.48) (-0.38) (-0.56)
Negative 0.539∗∗ 0.144 0.610∗ 0.204 -0.157 0.113(1.98) (0.36) (1.78) (0.69) (-0.31) (0.42)
Legal 0.483 0.191 -0.238 -0.308 -0.528 -0.906∗∗(1.05) (0.24) (-0.45) (-0.86) (-1.10) (-2.37)
Econ 0.030 0.229 0.084 -0.182 0.074 0.259∗(0.24) (1.31) (0.49) (-1.30) (0.35) (1.76)
Digits -0.521 -0.667 -0.138 0.246 -1.427 0.095(-1.25) (-0.80) (-0.30) (0.58) (-0.99) (0.13)
Quan 0.304 -0.044 0.546 0.104 -0.335 -0.054(1.44) (-0.14) (1.57) (0.49) (-0.62) (-0.21)
Numbers 0.379 -0.439 0.981 0.130 -0.005 -0.459(1.27) (-0.86) (1.64) (0.36) (-0.01) (-1.26)
Cardinal 0.403 0.067 1.567∗∗ 0.253 0.108 -0.422(1.27) (0.10) (2.17) (0.52) (0.11) (-1.10)
Ordinal 0.267 -0.617 -0.192 -0.031 -0.606 -0.909(0.25) (-1.07) (-0.19) (-0.06) (-0.27) (-0.74)
Panel B: Dummy variable
(1) (2) (3) (4) (5) (6)Community Diversity Empl relations Environment Human rights Product
High positive 0.005 -0.003 0.000 -0.001 -0.013 -0.001(0.22) (-0.08) (0.01) (-0.04) (-0.43) (-0.02)
High negative 0.028 0.018 0.029 0.022 0.014 0.011(1.23) (0.57) (1.01) (1.10) (0.47) (0.47)
High legal -0.009 -0.005 0.014 0.024 -0.043 -0.018(-0.40) (-0.16) (0.50) (1.16) (-1.48) (-0.70)
High econ 0.009 0.018 -0.012 -0.024 -0.002 0.026(0.40) (0.56) (-0.44) (-1.17) (-0.07) (1.07)
High digits -0.022 -0.023 -0.003 -0.004 -0.041 -0.020(-0.96) (-0.78) (-0.09) (-0.22) (-1.42) (-0.81)
High quan -0.003 -0.070∗∗ 0.040 0.020 -0.034 -0.045∗(-0.11) (-2.13) (1.42) (1.01) (-1.17) (-1.87)
High numbers -0.009 -0.052 0.021 0.018 -0.027 0.000(-0.39) (-1.61) (0.74) (0.90) (-0.91) (0.01)
High cardinal 0.017 0.023 0.030 -0.001 0.064∗ -0.034(0.70) (0.74) (0.84) (-0.05) (1.68) (-1.39)
High ordinal 0.013 -0.025 0.008 -0.015 -0.010 -0.022(0.55) (-0.77) (0.27) (-0.72) (-0.34) (-0.91)
38