Embed Size (px)
Citation preview
Mergers and shareholder wealth in European
banking
Alberto Cybo-Ottone a, Maurizio Murgia b,*
a INA Asset Management SGR SpA, Via Campania 59/C, 00187 Roma, Italyb City University Business School, Frobisher Crescent, Barbican Centre, London EC2Y 8HB, UK
Abstract
We study the stock market valuation of mergers and acquisitions in the European
banking industry. Based on a sample of very large deals observed from 1988 to 1997 we
document that, on average, at the announcement time the size-adjusted combined
performance of both the bidder and the target is statistically signi®cant and economi-
cally relevant. Although our sample shows a great deal of cross-sectional variation, the
general results are mainly driven by the signi®cant positive abnormal returns associated
with the announcement of domestic bank to bank deals and by product diversi®cation
of banks into insurance. On the contrary, we found that M&A with securities ®rms and
concluded with foreign institutions did not gain a positive market's expectation.
Our results are remarkably di�erent from those reported for US bank mergers. We
explain our di�erent results as stemming from the di�erent structure and regulation of
EU banking markets, which are shown to be more similar between them than as
compared with the US one. Ó 2000 Elsevier Science B.V. All rights reserved.
JEL classi®cation: G21; G34
Keywords: Bank mergers; Mergers and acquisitions; European banking markets;
Universal banking
Journal of Banking & Finance 24 (2000) 831±859
www.elsevier.com/locate/econbase
* Corresponding author.
E-mail address: [email protected] (M. Murgia).
0378-4266/00/$ - see front matter Ó 2000 Elsevier Science B.V. All rights reserved.
PII: S 0 3 7 8 - 4 2 6 6 ( 9 9 ) 0 0 1 0 9 - 0
1. Introduction
This paper studies the stock market valuation e�ects of mergers and ac-quisitions in European banking between 1988 and 1997. Over the last twodecades, the banking and ®nancial services industry has experienced profoundchanges. One of the most important e�ects of this restructuring process hasbeen an increase in consolidation activity. From 1987 to 1997, the value ofmergers and acquisitions in the world ®nancial industry has reached nearly 1.4trillions of US$ (e.g. The Economist, 1997). At the beginning of this period, USdeals dominated the scene but, more recently, M&As in European bankinghave started to catch up. After averaging 15 deals a year up to 1985, EuropeanM&A deals, including minority deals, jumped to a new level of 50±90 deals peryear between 1986 and 1994 (e.g. Economic Research Europe, 1996, par. 4.3.4).According to Securities Data Corporation, between January 1991 and April1996 the value of European deals totaled 77.9 billion $US compared with 193.6in the US.
To date, most of the available knowledge on M&As in banking comes fromscrutiny of the US market. Pillo� and Santomero (1998) review the voluminousempirical literature on the US experience. The authors point to the followingparadox: despite academic studies showing no signi®cant gains in value orperformance from bank mergers, the number and value of new mergers in theUS continues to grow unabated! European M&A deals, the focus of this paper,while being important, have however attracted much less scrutiny. This is dueboth to the lead of M&A activity in the US market and to the huge method-ological di�culties of studying the fragmented European banking market (e.g.Leonard et al., 1992).
However, such an analysis of the European experience is warranted for anumber of reasons. Whatever past experience is available would be extremelyuseful for players who are still planning to start a major M&A deal or cam-paign. In this respect, the US experience cannot be automatically applied to theEuropean environment where one can observe product expansion in a some-what less restricted environment. As compared with the US market, the uni-versal banking structure, that characterize Europe, implies that there are lessstringent limits to product market diversi®cation from commercial bankinginto investment banking. Bancassurance is also a European phenomenon asregulations allow EU banks to own insurance subsidiaries and to perform indirect distribution of insurance products in most jurisdictions; there, majorlimits to banking/insurance only remain for direct bank underwriting of poli-cies. On the other hand, US legislation is much more restrictive both on crossownership and cross selling between banking and insurance (e.g. Borio andFilosa, 1994). Further, the limitations on interstate expansion in the US, em-bedded in the McFadden Act, might inhibit geographic and scale expansion ofAmerican banks as compared to their European counterparts.
832 A. Cybo-Ottone, M. Murgia / Journal of Banking & Finance 24 (2000) 831±859
We perform an event study analysis of 54 M&A deals covering 13 Europeanbanking markets of the European Union plus the important Swiss market. Welook at deals where full control is changed and both the target and the bidderare listed; this procedure yields a very large average deal size. The sample alsoincludes 18 cross-product deals where banks expand in insurance or investmentbanking. To our knowledge, this is the ®rst study that examines the consoli-dation of large listed banks and ®nancial institutions in the European markets.
Two recent papers by Vander Vennet (1996, 1997) examine the e�ciencyand pro®tability of 492 bank mergers and acquisitions between European in-stitutions from 1988 to 1992, using accounting data. His 1996 study, per-forming univariate tests, ®nds some pro®tability improvements in domesticmergers among equal-sized entities and some e�ciency improvements in cross-border acquisitions. However, the study is only partially comparable to ours asthe average deal value is much smaller; cross product deals are not included inthe study; the sample selection procedure de®nes an M&A deal as any acqui-sitions of a stake of 50% without controlling if the transfer is between a�liatedparties or between di�erent parties. The 1997 study is a limited dependentanalysis on the same sample and su�ers from similar limitations.
An M&A deal can be considered as an event that moves the involved entitiesalong the pro®t function through a change in size, scope and distance from thee�cient frontier. Hence, available evidence on cross section estimates of pro®tand cost functions may help to explain the likely pro®tability impacts of thesedeals. A cost function estimation for the largest international banks was per-formed by Saunders and Walter (1994), who compare the performance ofuniversal banks in Europe with specialized banks in the US and Japan. They®nd evidence of diseconomies of scope between commercial and investmentbanking and some evidence of economies of super-scale in specialized banks.Altunbas et al. (1996) perform estimates of cost functions in all major EUjurisdictions between 1988 and 1994. Despite the huge variability of the resultsacross the various time and country pairs, they ®nd evidence of economies ofscale in the majority of their regressions, thus con®rming the results of a largenumber of cost studies conducted at the country level.
Our study of European M&A deals ®nds a positive and signi®cant increasein stock market value for the average merger at the time of the deal an-nouncement. We are able to show that country e�ects do not drive these re-sults, hinting at a relatively homogeneous stock market valuation andinstitutional framework across Europe. Our ®ndings contradict the bulk ofempirical studies conducted in the US banking markets where no value cre-ation e�ects are generally found. By analyzing the size of value creation fordi�erent types of deals, we provide some evidence that domestic combinationsbetween banks and banking/insurance deals tend to drive our results. Wetentatively interpret the di�erence between our ®ndings and those of the USliterature as stemming from the di�erent regulatory regimes in Europe and the
A. Cybo-Ottone, M. Murgia / Journal of Banking & Finance 24 (2000) 831±859 833
US. The results for banking/insurance deals point to the possible advantages ofhaving a more liberal regime regulating product diversi®cation for Europeanversus American banks. Our ®ndings for the value creation e�ect of domesticcombinations are more puzzling to understand as a consequence of institu-tional factors. They are however consistent with ®ndings of decreasing costfunctions in European but not in American banking. They are also consistentwith somewhat less rigorous antitrust enforcement in Europe versus the US.
The paper is organized as follows. Section 2 reviews the main hypotheses onthe determinants of bank mergers. Section 3 describes how the sample isconstructed. Section 4 presents the empirical analysis and results. Section 5concludes the paper.
2. Determinants of bank mergers and acquisitions
Stock market data cast some evidence on the impact of M&A deals onshareholder value creation. A positive impact value can be explained by anincrease in e�ciency or in market power following the deal (e.g. Beatty et al.,1987; Berger and Humphrey, 1992). More information on the determinants ofM&A gains at the time of the public announcement can be obtained bysplitting the sample according to scope, geography, size and legal nature of thedeals.
Scope. One may look for the existence of economies of scope by comparingthe value creation e�ect of bank to bank as opposed to cross product deals.
Geography. The geographical dimension of the deal is also relevant. In asample of horizontal (within-market) mergers, Rhoades (1993) showed that amore e�cient ®rm acquiring a less e�cient ®rm concluded the average deal.That is, bank mergers may be motivated to eliminate duplicated activities, andthat could be more likely when there is considerable overlap between markets.In our sample, looking at domestic (overlapping) versus cross-border (non-overlapping) deals can test this.
Scale. Some evidence of economies of scale e�ects can be observed if valuecreation e�ects are larger the larger is the deal size. 1 A recent study by Siems(1996), on the stock market valuation of US bank mega-mergers announced in1995, found some evidence of this hypotheses especially for in-market mergers.
1 The size of the deal is also a rough proxy of the change in market concentration following the
deal, a parameter that is included in some merger guidelines. However, the most recent literature on
the impact of market structure on monopoly power shows that market concentration is a very poor
determinant of market power (e.g., Sha�er, 1994); hence, our data do not enable us to shed any
light on the impact on whether M&A gains are related to monopoly power as compared to other
factors we observe.
834 A. Cybo-Ottone, M. Murgia / Journal of Banking & Finance 24 (2000) 831±859
Legal. The legal structure of the deal, acquisition versus merger, may shedfurther light on the motivation of the deal (e.g. Gilson, 1986). A desired in-crease in cost e�ciency will be more likely to be related to a centralized modeof organization like a merger (e.g. James and Houston, 1996). On the otherhand, an acquisition deal may follow from a desire to preserve the identity ofthe target by limiting intervention to the injection of capital or other inputsmay be signaled by its incorporation within an holding or business groupstructure. In addition, since most acquisitions in our sample are engineered aspublic o�ers, where incumbent management has a relatively limited vetopower, change in control through an acquisition may signal a more disciplinarymotivation than in a transaction organized through a merger. The distinctionbetween the two types of deals is however blurred, as some acquired ®rms arelater merged with the bidder and by the friendly nature of many acquisitions,especially in regulated sectors like banking.
Comparing bidders and targets. Further details on the motivation of M&Adeals can be inferred by looking at characteristics of bidders and targets beforethe event. For example, if the pre-event performance of the target is poor ascompared with the bidder and with the market, it is more likely that the ac-quisition is motivated by the desire to replace ine�cient management than bythe pursuit of synergy (e.g. Morck et al., 1988).
3. Sample design and data sources on European bank mergers
The ®rst building block of our study is a list of transactions. We analyzemergers and acquisitions that were announced in the European markets from1988 to 1997. Our sample construction is as follows. We require that at leastone partner was a banking ®rm. We restrict our attention to transactions re-lated to change in control of the target. Our sample comes from searching theAcquisition Monthly Data (AMDATA), data set and the Financial Times CD-ROM. We searched for all deals larger than 100 Mns. USD, where the target isa European bank, or the bidder is a European bank and the target is a Eu-ropean ®nancial service company. Stock market data were taken from theDatastream database. This procedure yielded 72 target ®nancial institutionsthat were listed in some European stock market. We then identi®ed 54 cases,out of the target sample, in which also the acquiring bank was listed. This isour ®nal sample, and the focus of our empirical analyses.
For each deal we included in the sample we also collected the following data:· information about the deal was from the data source we mentioned above.
We also found further information through a CD-ROM search of the Fi-nancial Times;
· stock market prices were obtained searching through the Datastream data-base;
A. Cybo-Ottone, M. Murgia / Journal of Banking & Finance 24 (2000) 831±859 835
· data on balance sheets assets and equity were collected from the mentionedsources and from other data providers as Bloomberg and the publications ofMorgan Stanley Capital International.Due to the presence of di�erent regulations across Europe, we were unable
to follow the US practice of not including M&A deals resulting from rescuemotivations; this should bias downward our value creation estimates. In ad-dition, we followed Pillo� and Santomero (1998) suggestions and did not purgethe sample from a few instances of repeated bidder activity.
In Table 1 we present a summary statistics of the ®nal sample. Panel A gives®rst a classi®cation by type of deal and by year. It has to be noted that type-classi®cation is largely overlapped. For example, we can have deals that areclassi®ed cross-border, and which are simultaneously cross-product transac-tions. 2 The most striking feature of the sample is the very large average valueof the transactions as compared to the US case (see Column 2 in Panel A).
The average value deal included in our sample is worth 1.61 USD billions;the median deal is worth 0.62 USD billions. The mean stake acquired in thetarget equity has been 84.94% (median � 100%); this con®rm that we onlysampled unambiguous transfers in control. Some kind of institutional investorscontrol the vast majority of the banks included in our sample. Governmentcontrolled banks are rare in our sample since they tend to be closely held.Further features of our sample are the preponderance of acquisitions and theincrease of deals around 1990 and in more recent years. These two peaks referto anticipation of the impact of the Single Market Program and of MonetaryUnion. Also looking at other statistics of panel A, we see that starting in thenineties, bank M&As in Europe involved bigger players than in the earlierperiod of our sample.
In Panel B we present the sample composition by country, to better ap-preciate the intensity of consolidation processes in each European country. Weobserve an higher number of institutions involved in deals for Italy, Sweden,Portugal, UK and Spain. However, there is not a dominating country in thetransaction sample. There is a much clear pattern between countries mainlyinvolved in domestic transactions between banks, and banking markets whichhave been interested by more cross-product mergers. The quantitative impor-tance of cross border mergers is relatively limited, however. In our sample, theyaccount for only 12% of the value of total deals with an increase from 8% in the®rst sub period to 14% in the second sub-period (see also Bank of England,1993). From this perspective, South Europe has been the land to conquer and
2 Here are the most relevant one-way overlaps. More than 80% of large deals, cross-product
deals and cross-border deals are organized as acquisitions. More than 80% of deals which are
organized as mergers are domestic and bank to bank. More than 80% of bank to bank deals are
domestic. Multivariate analysis is employed below to sort out the most important e�ects.
836 A. Cybo-Ottone, M. Murgia / Journal of Banking & Finance 24 (2000) 831±859
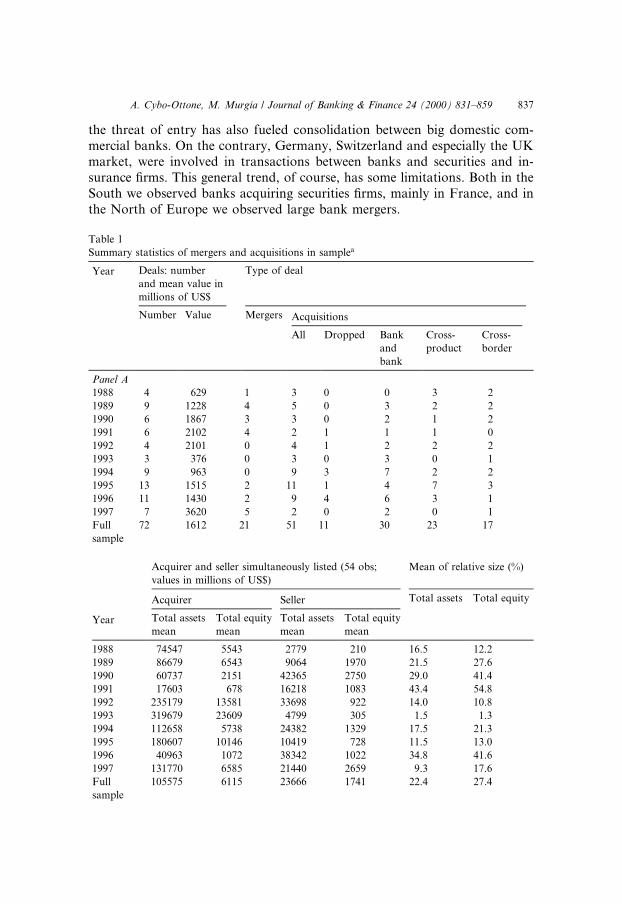
the threat of entry has also fueled consolidation between big domestic com-mercial banks. On the contrary, Germany, Switzerland and especially the UKmarket, were involved in transactions between banks and securities and in-surance ®rms. This general trend, of course, has some limitations. Both in theSouth we observed banks acquiring securities ®rms, mainly in France, and inthe North of Europe we observed large bank mergers.
Table 1
Summary statistics of mergers and acquisitions in samplea
Year Deals: number
and mean value in
millions of US$
Type of deal
Number Value Mergers Acquisitions
All Dropped Bank
and
bank
Cross-
product
Cross-
border
Panel A
1988 4 629 1 3 0 0 3 2
1989 9 1228 4 5 0 3 2 2
1990 6 1867 3 3 0 2 1 2
1991 6 2102 4 2 1 1 1 0
1992 4 2101 0 4 1 2 2 2
1993 3 376 0 3 0 3 0 1
1994 9 963 0 9 3 7 2 2
1995 13 1515 2 11 1 4 7 3
1996 11 1430 2 9 4 6 3 1
1997 7 3620 5 2 0 2 0 1
Full
sample
72 1612 21 51 11 30 23 17
Acquirer and seller simultaneously listed (54 obs;
values in millions of US$)
Mean of relative size (%)
Acquirer Seller Total assets Total equity
Year Total assets
mean
Total equity
mean
Total assets
mean
Total equity
mean
1988 74547 5543 2779 210 16.5 12.2
1989 86679 6543 9064 1970 21.5 27.6
1990 60737 2151 42365 2750 29.0 41.4
1991 17603 678 16218 1083 43.4 54.8
1992 235179 13581 33698 922 14.0 10.8
1993 319679 23609 4799 305 1.5 1.3
1994 112658 5738 24382 1329 17.5 21.3
1995 180607 10146 10419 728 11.5 13.0
1996 40963 1072 38342 1022 34.8 41.6
1997 131770 6585 21440 2659 9.3 17.6
Full
sample
105575 6115 23666 1741 22.4 27.4
A. Cybo-Ottone, M. Murgia / Journal of Banking & Finance 24 (2000) 831±859 837
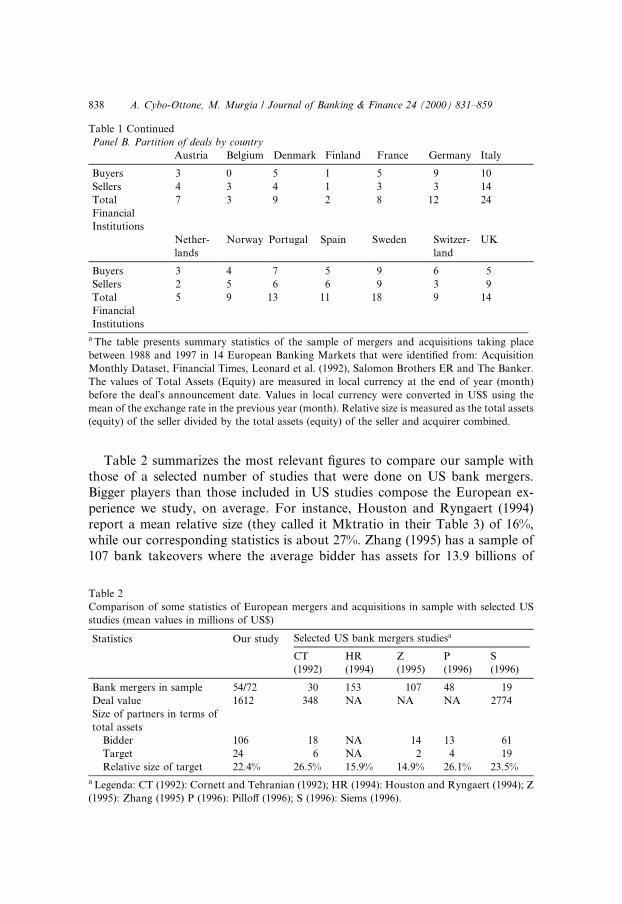
Table 2 summarizes the most relevant ®gures to compare our sample withthose of a selected number of studies that were done on US bank mergers.Bigger players than those included in US studies compose the European ex-perience we study, on average. For instance, Houston and Ryngaert (1994)report a mean relative size (they called it Mktratio in their Table 3) of 16%,while our corresponding statistics is about 27%. Zhang (1995) has a sample of107 bank takeovers where the average bidder has assets for 13.9 billions of
Table 1 Continued
Panel B. Partition of deals by country
Austria Belgium Denmark Finland France Germany Italy
Buyers 3 0 5 1 5 9 10
Sellers 4 3 4 1 3 3 14
Total
Financial
Institutions
7 3 9 2 8 12 24
Nether-
lands
Norway Portugal Spain Sweden Switzer-
land
UK
Buyers 3 4 7 5 9 6 5
Sellers 2 5 6 6 9 3 9
Total
Financial
Institutions
5 9 13 11 18 9 14
a The table presents summary statistics of the sample of mergers and acquisitions taking place
between 1988 and 1997 in 14 European Banking Markets that were identi®ed from: Acquisition
Monthly Dataset, Financial Times, Leonard et al. (1992), Salomon Brothers ER and The Banker.
The values of Total Assets (Equity) are measured in local currency at the end of year (month)
before the dealÕs announcement date. Values in local currency were converted in US$ using the
mean of the exchange rate in the previous year (month). Relative size is measured as the total assets
(equity) of the seller divided by the total assets (equity) of the seller and acquirer combined.
Table 2
Comparison of some statistics of European mergers and acquisitions in sample with selected US
studies (mean values in millions of US$)
Statistics Our study Selected US bank mergers studiesa
CT
(1992)
HR
(1994)
Z
(1995)
P
(1996)
S
(1996)
Bank mergers in sample 54/72 30 153 107 48 19
Deal value 1612 348 NA NA NA 2774
Size of partners in terms of
total assets
Bidder 106 18 NA 14 13 61
Target 24 6 NA 2 4 19
Relative size of target 22.4% 26.5% 15.9% 14.9% 26.1% 23.5%
a Legenda: CT (1992): Cornett and Tehranian (1992); HR (1994): Houston and Ryngaert (1994); Z
(1995): Zhang (1995) P (1996): Pillo� (1996); S (1996): Siems (1996).
838 A. Cybo-Ottone, M. Murgia / Journal of Banking & Finance 24 (2000) 831±859
USD and the mean target total assets is about 2.4 billions of USD. Pillo�(1996) analyses a sample of 48 mergers between listed banks and reports amean total assets for acquirer and target banks of 13 and 3.7 billions of USD,respectively. In our restricted sample of 54 deals where buyer and seller weresimultaneously listed, the mean acquiring bank has total assets for 105 billionsof USD. Our average target ®nancial institution has total assets around 23billions of USD, and therefore it is much bigger than the mean acquiring bankof most of US studies with the possible exception of the paper by Siems (1996)on bank mega-mergers announced in 1995, when the average size of dealsstarted to reach the European mean dimension.
Table 3
Weighted average daily abnormal returnsa
Event window Mean (%) S.D. (%) Pos/Neg Test of signi®cance
Z-test p-value
Panel A. Weight: Total assets
()1, +1) 2.22 5.60 38 16 7.79 <0.000
()2, +2) 2.58 6.38 36 18 6.42 <0.000
()5, +5) 2.53 6.89 33 21 4.22 0.000
()10, +10) 3.07 9.20 32 22 3.13 0.001
()20, +20) 3.69 10.81 35 19 3.24 0.001
()1, 0) 2.06 4.75 37 17 7.83 <0.000
()2, 0) 2.27 4.93 38 16 7.13 <0.000
()5, 0) 2.37 5.72 36 18 5.13 <0.000
()10, 0) 2.86 6.85 37 17 4.11 <0.000
()20, 0) 3.58 6.48 41 13 3.97 <0.000
Panel B. Weight: Equity value
()1, +1) 2.67 6.76 38 16 7.61 <0.000
()2, +2) 2.89 6.82 39 15 6.23 <0.000
()5, +5) 2.86 7.61 32 22 3.88 <0.000
()10, +10) 3.41 10.22 32 22 2.70 0.003
()20, +20) 4.27 11.44 35 19 2.71 0.003
()1, 0) 2.65 6.22 40 14 8.16 <0.000
()2, 0) 2.81 6.28 40 14 7.44 <0.000
()5, 0) 2.88 6.91 36 18 5.13 <0.000
()10, 0) 3.52 7.92 36 18 4.18 <0.000
()20, 0) 4.49 7.43 42 12 4.07 <0.000
a The table presents results of the event study for a sample of 54 deals where buyers and sellers were
simultaneously listed. Abnormal returns (ARs) are computed individually for acquirers and sellers
with the OLS market model using for each deal the Datastream bank sector index. Regression
parameters are estimated using the Scholes±Williams (1977) procedure from t � )270 to t � )21,
where t � 0 is the day the deal was initially announced in the Financial Times. Value-weighted ARs
are computed using the value of Total Assets (Equity) at the end-of-year (month) before the dealÕsannouncement date. Tests of signi®cance are calculated from standardized abnormal returns em-
ploying the Dodd±Warner (1983) procedure.
A. Cybo-Ottone, M. Murgia / Journal of Banking & Finance 24 (2000) 831±859 839
Our sample selection procedure, and particularly the requirement that thetarget is listed on a stock exchange, helps to explain the large transaction sizewe ®nd. Another important reason why European deals seem to be larger thanUS ones is the larger average size of European banks as compared withAmerican banks. For example, in 1993, the 10 largest European banks were 1.5larger than their American counterparts in terms of Tier-1 capital; the di�er-ence surged to 1.8 if we looked at the 50 largest banks in the two areas (dif-ferences in size as measured by assets were even more striking).
4. Empirical study
4.1. Constructing abnormal returns
To measure abnormal stock market returns we apply a standard event studymethodology. For each deal we construct abnormal returns separately for theacquirer and the seller. The market model is used to calculate an abnormalreturn (AR) for ®rm i on day t as follows:
ARit � Rit � �ai � bi � Rmt�; �1�
where Rit is the observed return on security i (taking account of dividends andcapital changes) for event day t and Rmt is the observed return on the bench-mark for event day t. We used two di�erent benchmarks to estimate OLS re-gression parameters a and b either the Datastream General market index or theDatastream Bank sector index, respectively, for the bidder and target's coun-try. 3 Market model parameters are estimated over day )270 to day )21, whereday 0 is the deal's announcement day.
To take in consideration possible problems of nonsynchronous trading,each regression was run using the Scholes±Williams (1977) procedure, andOLS coe�cients are adjusted accordingly. However, the large size of theaverage and median deal contained in our sample should signal that thestocks we analysed are generally liquid ones. Finally, to test for signi®canceof abnormal returns we follow Dodd and Warner (1983) method of aggre-
3 For deals involving an insurance company we have used the Datastream Insurance Index,
instead of the Bank sector index. However, in the paper we'll be referring loosely to the Bank Index.
We also run for each deal a two-factor model regression using simultaneously the General and
Bank sector indexes as independent variables. The results, on average, do not change signi®cantly
and were very similar in magnitude to those reported with only the Bank sector index. To this end
we'll be using more this benchmark in our analyses. However, when the two factors are highly
correlated, either the interpretation or the e�ciency of the estimates is biased. Furthermore even an
orthogonalization procedure did not produce a signi®cant bene®t (e.g. Giliberto, 1985).
840 A. Cybo-Ottone, M. Murgia / Journal of Banking & Finance 24 (2000) 831±859
gating standardised abnormal returns. The method allows to control fordi�erent volatility of stock returns and the di�erent number of observationsused for each event.
A further step in our empirical analysis is to evaluate the market's expec-tations on the combined gain resulting from the merger of the two ®nancialinstitutions. In fact, looking only at the two separate entities may give a partialand perhaps distorted interpretation of the market reaction to the deal's an-nouncement. Therefore, we calculate the weighted sum of acquirer and sellerabnormal returns according to the following equation:
ARbi �MVbi � ARsi �MVsi
MVbi �MVsi; �2�
where MVbi and MVsi are the Market capitalisation at the end of month beforethe deal's announcement date, respectively for buyer (b) and seller (s). As analternative measure to weight abnormal returns we also used Total Assets (TA)at the end of year before the day 0. When we approached test of signi®cance,we calculated the variance of each deal value-weighted abnormal returns takingin account the estimated correlation between bidder and target market modelresiduals. 4
4.2. Market valuation at announcement time
Mean abnormal returns have been measured over several event windows tobetter evaluate the market reaction before and after the deal's announcement.As it will become clear examining the empirical results, the European evidenceon bank M&As shows a signi®cant price e�ect several days before the publicannouncement. In fact, when we compare symmetric cumulative abnormalreturns ± CAR (i.e., using same number of days before and after day 0), withCAR computed before the announcement, we see that the di�erence betweenthe two measures is nil. 5
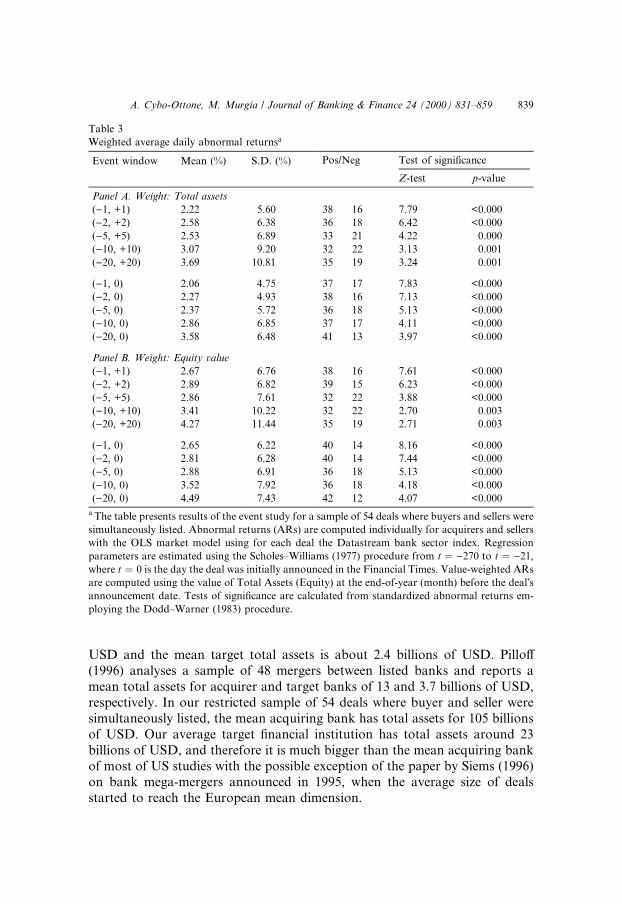
Table 3 reports the results for value-weighted abnormal returns using thebank sector index as benchmark in the market model. 6 Panel A contains theresults using the total assets at the end of the last ®scal year as a weight forabnormal returns, while Panel B uses the stock market value at the end of
4 Our approach is similar to that used by Houston and Ryngaert (1994).5 This fact is not new in the merger literature. Bradley (1980) and others have found that most of
the time market reacts to merger announcement at least ten days prior to the ®rst public
announcement.6 The results using the Datastream general market index do not change signi®cantly, but lead to
slightly higher abnormal returns.
A. Cybo-Ottone, M. Murgia / Journal of Banking & Finance 24 (2000) 831±859 841
month before the announcement date as a weight-measure. As can be notedobserving the column containing the p-value of the Z-test, all measures ofCARs are highly signi®cant. We can compare the results presented in Table 3with those reported in some US studies. Zhang (1995) shows that theweighted average CAR for 5 days ()2, +2) is about 7%, while we found amean around 3%. The two results are signi®cantly di�erent at the 1% levelbut, as we mentioned, the average size of our pairs of deals is also signi®-cantly higher. Pillo� (1996) shows a mean value-weighted CAR of 1.44%(signi®cant at 10%) for the eleven-day window ()10, 0); our comparablemeasure is 2.86%, signi®cant at 1%; however the two statistics are non-sig-ni®cantly di�erent. Houston and Ryngaert (1994) reported a mean value-weighted CAR of 0.4% for a ®ve day window ()4, 0). Our closest eventwindow shows a mean of 2.9%, and a t-test on the mean di�erence is sig-ni®cant at 5%.
To better appreciate the economic impact of the market valuation of themean deal in our sample, we calculate the weighted wealth gains as theweighted sum of the variation in market value of the buyer and the seller. Forthe short period of 3 days ()2, 0) is about 226 millions of USD, which it alsorepresents, on average, 14% of the deal value. This number can be comparedwith that reported by Zhang (1995) for a two-day window: in the US market hefound that the dollar value created averages about 42 millions per banktakeover.
In Tables 4 and 5 we present separate results for bidder and target banks.Table 4 reports the results for the sample of acquiring banks. In Panel A wepresent results using the Datastream general market index of each country inthe market model regressions, while in Panel B the abnormal returns have beencalculated employing the Datastream Bank sector index. Although the resultsseem quite di�erent using the two di�erent benchmarks, average di�erences arenot statistically signi®cant. With the General Market index, acquiring banksshow a signi®cant and positive market revaluation in the shorter event win-dows. On the other hand, results using the bank sector index do not con®rm asigni®cant and positive e�ect. The contagious e�ects at merger announcementscan explain the less pronounced market revaluation we observe when abnormalreturns are constructed with the Industry Index. In other words, when a bankmerger is announced bank stocks tend to rise, either because the increase of themarket concentration improves pro®ts of the largest players (e.g. Eckbo, 1983),or because ®nancial analysts expect other peers to be more likely to be ac-quired. This implies that the sector index reaches a higher level, reducing excessreturns.
Our empirical results for acquiring banks are signi®cantly di�erent fromseveral related studies for the US bank mergers, which have documented asigni®cant negative price e�ect for acquiring banks (e.g., Cornett and Tehra-nian, 1992; Houston and Ryngaert, 1994). Siems (1996) in the aforementioned
842 A. Cybo-Ottone, M. Murgia / Journal of Banking & Finance 24 (2000) 831±859
study of 19 US bank mega mergers announced in 1995, also found a signi®cantnegative market reaction to the mean acquiring bank.
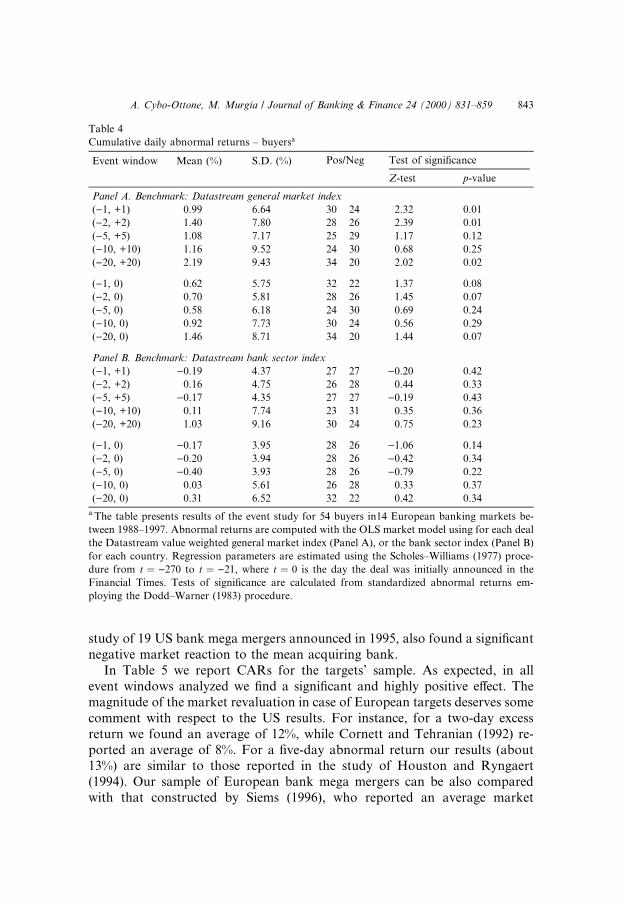
In Table 5 we report CARs for the targets' sample. As expected, in allevent windows analyzed we ®nd a signi®cant and highly positive e�ect. Themagnitude of the market revaluation in case of European targets deserves somecomment with respect to the US results. For instance, for a two-day excessreturn we found an average of 12%, while Cornett and Tehranian (1992) re-ported an average of 8%. For a ®ve-day abnormal return our results (about13%) are similar to those reported in the study of Houston and Ryngaert(1994). Our sample of European bank mega mergers can be also comparedwith that constructed by Siems (1996), who reported an average market
Table 4
Cumulative daily abnormal returns ± buyersa
Event window Mean (%) S.D. (%) Pos/Neg Test of signi®cance
Z-test p-value
Panel A. Benchmark: Datastream general market index
()1, +1) 0.99 6.64 30 24 2.32 0.01
()2, +2) 1.40 7.80 28 26 2.39 0.01
()5, +5) 1.08 7.17 25 29 1.17 0.12
()10, +10) 1.16 9.52 24 30 0.68 0.25
()20, +20) 2.19 9.43 34 20 2.02 0.02
()1, 0) 0.62 5.75 32 22 1.37 0.08
()2, 0) 0.70 5.81 28 26 1.45 0.07
()5, 0) 0.58 6.18 24 30 0.69 0.24
()10, 0) 0.92 7.73 30 24 0.56 0.29
()20, 0) 1.46 8.71 34 20 1.44 0.07
Panel B. Benchmark: Datastream bank sector index
()1, +1) )0.19 4.37 27 27 )0.20 0.42
()2, +2) 0.16 4.75 26 28 0.44 0.33
()5, +5) )0.17 4.35 27 27 )0.19 0.43
()10, +10) 0.11 7.74 23 31 0.35 0.36
()20, +20) 1.03 9.16 30 24 0.75 0.23
()1, 0) )0.17 3.95 28 26 )1.06 0.14
()2, 0) )0.20 3.94 28 26 )0.42 0.34
()5, 0) )0.40 3.93 28 26 )0.79 0.22
()10, 0) 0.03 5.61 26 28 0.33 0.37
()20, 0) 0.31 6.52 32 22 0.42 0.34
a The table presents results of the event study for 54 buyers in14 European banking markets be-
tween 1988±1997. Abnormal returns are computed with the OLS market model using for each deal
the Datastream value weighted general market index (Panel A), or the bank sector index (Panel B)
for each country. Regression parameters are estimated using the Scholes±Williams (1977) proce-
dure from t � )270 to t � )21, where t � 0 is the day the deal was initially announced in the
Financial Times. Tests of signi®cance are calculated from standardized abnormal returns em-
ploying the Dodd±Warner (1983) procedure.
A. Cybo-Ottone, M. Murgia / Journal of Banking & Finance 24 (2000) 831±859 843
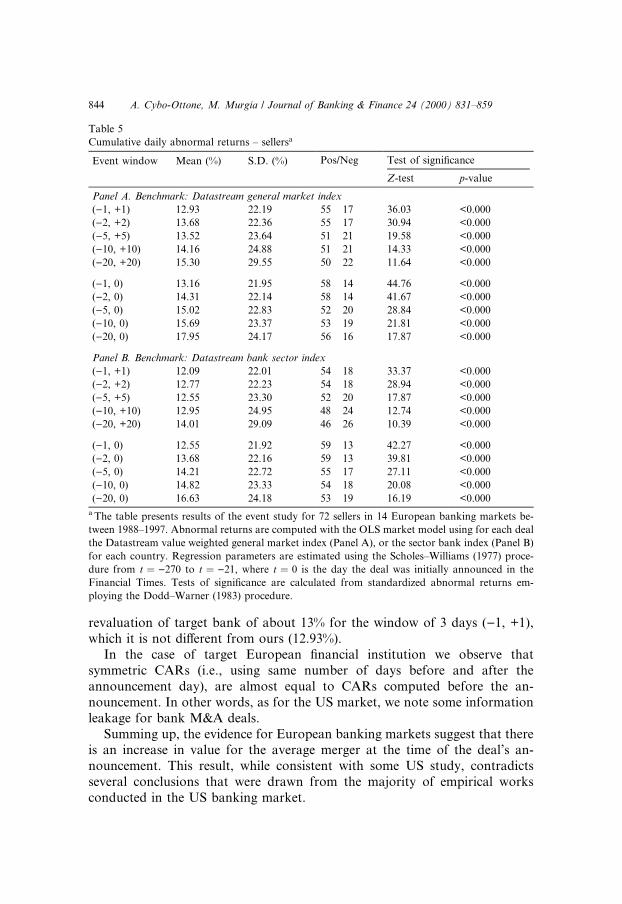
revaluation of target bank of about 13% for the window of 3 days ()1, +1),which it is not di�erent from ours (12.93%).
In the case of target European ®nancial institution we observe thatsymmetric CARs (i.e., using same number of days before and after theannouncement day), are almost equal to CARs computed before the an-nouncement. In other words, as for the US market, we note some informationleakage for bank M&A deals.
Summing up, the evidence for European banking markets suggest that thereis an increase in value for the average merger at the time of the deal's an-nouncement. This result, while consistent with some US study, contradictsseveral conclusions that were drawn from the majority of empirical worksconducted in the US banking market.
Table 5
Cumulative daily abnormal returns ± sellersa
Event window Mean (%) S.D. (%) Pos/Neg Test of signi®cance
Z-test p-value
Panel A. Benchmark: Datastream general market index
()1, +1) 12.93 22.19 55 17 36.03 <0.000
()2, +2) 13.68 22.36 55 17 30.94 <0.000
()5, +5) 13.52 23.64 51 21 19.58 <0.000
()10, +10) 14.16 24.88 51 21 14.33 <0.000
()20, +20) 15.30 29.55 50 22 11.64 <0.000
()1, 0) 13.16 21.95 58 14 44.76 <0.000
()2, 0) 14.31 22.14 58 14 41.67 <0.000
()5, 0) 15.02 22.83 52 20 28.84 <0.000
()10, 0) 15.69 23.37 53 19 21.81 <0.000
()20, 0) 17.95 24.17 56 16 17.87 <0.000
Panel B. Benchmark: Datastream bank sector index
()1, +1) 12.09 22.01 54 18 33.37 <0.000
()2, +2) 12.77 22.23 54 18 28.94 <0.000
()5, +5) 12.55 23.30 52 20 17.87 <0.000
()10, +10) 12.95 24.95 48 24 12.74 <0.000
()20, +20) 14.01 29.09 46 26 10.39 <0.000
()1, 0) 12.55 21.92 59 13 42.27 <0.000
()2, 0) 13.68 22.16 59 13 39.81 <0.000
()5, 0) 14.21 22.72 55 17 27.11 <0.000
()10, 0) 14.82 23.33 54 18 20.08 <0.000
()20, 0) 16.63 24.18 53 19 16.19 <0.000
a The table presents results of the event study for 72 sellers in 14 European banking markets be-
tween 1988±1997. Abnormal returns are computed with the OLS market model using for each deal
the Datastream value weighted general market index (Panel A), or the sector bank index (Panel B)
for each country. Regression parameters are estimated using the Scholes±Williams (1977) proce-
dure from t � )270 to t � )21, where t � 0 is the day the deal was initially announced in the
Financial Times. Tests of signi®cance are calculated from standardized abnormal returns em-
ploying the Dodd±Warner (1983) procedure.
844 A. Cybo-Ottone, M. Murgia / Journal of Banking & Finance 24 (2000) 831±859
4.3. Bivariate analysis of deal type and stock market returns
From our sample we were able to construct several sub-samples, classifyingeach deal in several groups. First, we compare mergers and acquisitions be-tween commercial banks against cross-products deals, which involved bankswith either an insurance or a security ®rm. Second, we contrast results betweenmergers of national partners versus deals regarding ®nancial institutions ofdi�erent countries, we label the latter as cross-border transactions. Third, wedivided our sample with regards to the mean deal value, classifying large dealsall those which had a deal value greater than the mean, and small deals theothers. Finally, in the fourth classi®cation, we separate our sample betweenmajority acquisitions and pure merger transactions.
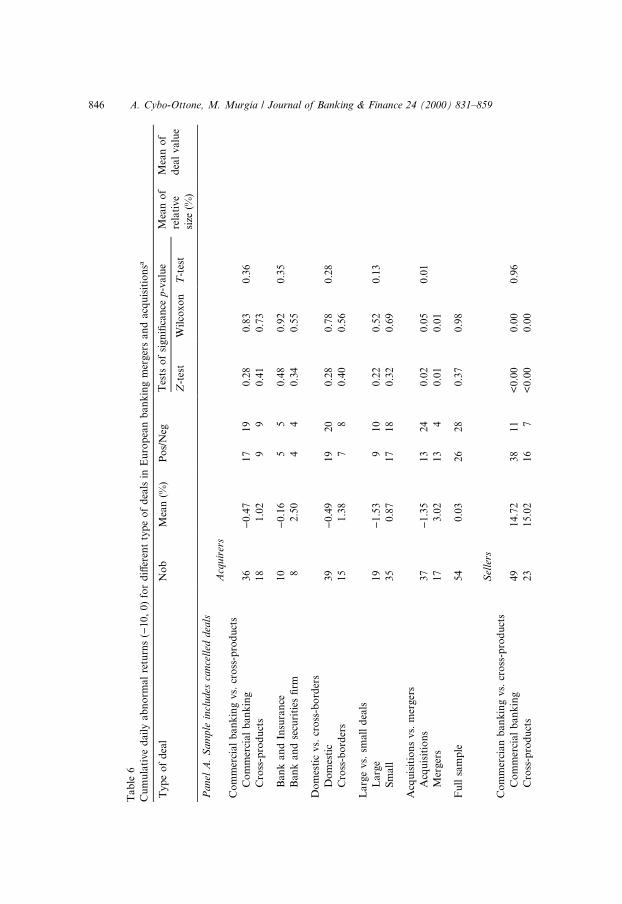
In panel A of Table 6 we present the CARs over an eleven day period,separately for buyers, sellers and the combined entity, for the sample whichincludes deals that were subsequently canceled. 7 We also present some tests ofsigni®cance. Z-test and Wilcoxon statistics test, respectively, whether the meanand the median is di�erent from zero (the latter is important here, due to thesmaller size of various sub-samples and the non normal distribution of theexcess returns). We also used a t-test to verify whether the mean of two pairedsubgroups is di�erent from each other. In case the assumption of equal vari-ance between the two distributions is rejected, we use the Cochrane±Coxmethod to approximate the t-statistic.
Scope. In the ®rst partition between one-line business (commercial banking)against cross-products deals we see that both groups show a positive andstatistically signi®cant value-weighted returns in the selected event window.However, the two results although di�erent in size are not statistically di�erentfrom each other and both groups tend to exhibit positive shareholder valuecreation. Bidding banks show a negative market reaction in case of M&Abetween banks, while reach a positive CARs when announced a diversi®cationmerger. Cross-products deals show a great deal of variability. In the twobottom lines of the ®rst partition we also present results separately for dealsinvolving banks and insurance ®rms and bank mergers with securities ®rms.We note that the positive results we obtain for the cross-product deals aremainly driven by the strong market reaction of deals announced between banksand insurance ®rms. Deals that involved a securities ®rm show a positive
7 Replicating the experiment using either di�erent event windows (e.g. )1, 0) or CARs calculated
with the general market index yields essentially the same results. However, the window of 11 days
seems the most suitable to analyze the market reaction to the merger announcement as showed by
the vast literature on mergers (e.g. Bradley, 1980). Furthermore we also checked the sensitivity of
our results to the weighting method. Although all the next tables present results which use the
Market Capitalization as the weight for abnormal returns of the two combined ®nancial
institutions, using Total Assets did not change signi®cantly our main empirical ®ndings.
A. Cybo-Ottone, M. Murgia / Journal of Banking & Finance 24 (2000) 831±859 845
Ta
ble
6
Cu
mu
lati
ve
dail
yab
no
rmal
retu
rns
()10,
0)
for
di�
eren
tty
pe
of
dea
lsin
Eu
rop
ean
ban
kin
gm
erger
san
dacq
uis
itio
nsa
Ty
pe
of
dea
lN
ob
Mea
n(%
)P
os/
Neg
Tes
tso
fsi
gn
i®ca
nce
p-v
alu
eM
ean
of
rela
tive
size
(%)
Mea
no
f
dea
lvalu
eZ
-tes
tW
ilco
xo
nT
-tes
t
Pa
nel
A.
Sam
ple
incl
ud
esca
nce
lled
dea
ls
Acq
uir
ers
Co
mm
erci
al
ban
kin
gvs.
cro
ss-p
rod
uct
s
Co
mm
erci
al
ba
nk
ing
36
)0.4
717
19
0.2
80.8
30.3
6
Cro
ss-p
rod
uct
s1
81.0
29
90.4
10.7
3
Ban
ka
nd
Insu
ran
ce1
0)
0.1
65
50.4
80.9
20.3
5
Ban
ka
nd
secu
riti
es®
rm8
2.5
04
40.3
40.5
5
Do
mes
tic
vs.
cro
ss-b
ord
ers
Do
mes
tic
39
)0.4
919
20
0.2
80.7
80.2
8
Cro
ss-b
ord
ers
15
1.3
87
80.4
00.5
6
La
rge
vs.
small
dea
ls
Larg
e1
9)
1.5
39
10
0.2
20.5
20.1
3
Sm
all
35
0.8
717
18
0.3
20.6
9
Acq
uis
itio
ns
vs.
mer
ger
s
Acq
uis
itio
ns
37
)1.3
513
24
0.0
20.0
50.0
1
Mer
ger
s1
73.0
213
40.0
10.0
1
Fu
llsa
mp
le5
40.0
326
28
0.3
70.9
8
Sel
lers
Co
mm
erci
an
ban
kin
gvs.
cro
ss-p
rod
uct
s
Co
mm
erci
al
ba
nk
ing
49
14.7
238
11
<0.0
00.0
00.9
6
Cro
ss-p
rod
uct
s2
315.0
216
7<
0.0
00.0
0
846 A. Cybo-Ottone, M. Murgia / Journal of Banking & Finance 24 (2000) 831±859
Ba
nk
an
din
sura
nce
10
19.2
90.5
5<
0.0
00.2
70.5
4
Ban
kan
dse
curi
ties
®rm
13
11.7
411
2<
0.0
00.0
0
Do
mes
tic
vs.
cro
ss-b
ord
ers
Do
mes
tic
55
13.7
438
17
<0.0
00.0
00.4
9
Cro
ss-b
ord
ers
17
18.2
916
1<
0.0
00.0
0
Larg
ev
s.sm
all
La
rge
21
11.4
915
6<
0.0
00.0
10.4
4
Sm
all
51
16.1
839
12
<0.0
00.0
0
Acq
uis
itio
ns
vs.
mer
ger
s
Acq
uis
itio
ns
51
17.4
641
10
<0.0
00.0
00.1
3
Mer
ger
s2
18.3
913
8<
0.0
00.0
3
Fu
llsa
mp
le7
214.8
254
18
<0.0
0<
0.0
0
Wei
ghte
d
Co
mm
erci
al
ba
nk
ing
vs.
cro
ssp
rod
uct
s
Co
mm
erci
al
ban
kin
g36
2.5
425
11
0.0
20.0
00.2
031.1
1736
Cro
ss-p
rod
uct
s1
85.4
911
7<
0.0
00.1
319
.81903
Ba
nk
an
din
sura
nce
10
7.0
36
4<
0.0
00.3
20.5
429.7
2733
Ban
kan
dse
curi
ties
®rm
83.5
65
30.3
80.3
17.6
866
Do
mes
tic
vs.
cro
ssb
ord
ers
Do
mes
tic
39
4.0
026
13
<0.0
00.0
00.4
833
.72138
Cro
ss-b
ord
ers
15
2.2
810
50.4
40.2
310.8
893
Larg
ev
s.sm
all
La
rge
19
3.7
513
60.1
30.1
30.8
838.2
4096
Sm
all
35
3.4
023
12
<0.0
00.0
021
.5541
A. Cybo-Ottone, M. Murgia / Journal of Banking & Finance 24 (2000) 831±859 847
Tab
le6
(Co
nti
nu
ed)
Typ
eo
fd
eal
No
bM
ean
(%)
Po
s/N
egT
ests
of
sign
i®ca
nce
p-v
alu
eM
ean
of
rela
tive
size
(%)
Mea
no
f
dea
lvalu
eZ
-tes
tW
ilco
xo
nT
-tes
t
Acq
uis
itio
ns
vs.
mer
ger
s
Acq
uis
itio
ns
37
2.5
222
15
0.1
70.1
20.1
723.1
1392
Mer
ger
s1
75.7
114
3<
0.0
0<
0.0
036.6
2662
Fu
llsa
mp
le5
43.5
236
18
<0.0
00.0
02
7.4
1612
Pan
elB
.S
am
ple
of
com
ple
ted
dea
ls
Co
mm
erci
al
ba
nk
ing
vs.
cro
ss-p
rod
uct
s
Co
mm
erci
al
ban
kin
g30
0.2
617
13
0.4
10.3
70.4
8
Cro
ss-p
rod
uct
s1
61.5
49
70.2
90.3
8
Ba
nk
an
din
sura
nce
80.5
85
30.3
60.6
40.4
9
Ban
kan
dse
curi
ties
®rm
82.5
04
40.3
40.5
5
Do
mes
tic
vs.
cro
ss-b
ord
ers
Do
mes
tic
33
0.1
919
14
0.4
20.3
80.3
4
Cro
ss-b
ord
ers
13
2.0
07
60.2
50.2
4
Larg
ev
s.sm
all
dea
ls
La
rge
16
)1.2
39
10
0.1
70.9
80.1
5
Sm
all
30
1.7
317
13
0.1
00.1
1
Acq
uis
itio
ns
vs.
mer
ger
s
Acq
uis
itio
ns
30
)0.7
613
17
0.1
10.4
00.0
1
Mer
ger
s1
63.4
513
30.0
00.0
0
Fu
llsa
mp
le4
60.7
026
20
0.3
10.1
8
848 A. Cybo-Ottone, M. Murgia / Journal of Banking & Finance 24 (2000) 831±859

Co
mm
erci
al
ban
kin
gvs.
cro
ss-p
rod
uct
s
Co
mm
erci
al
ba
nk
ing
43
15.2
632
9<
0.0
00.0
00.6
8
Cro
ss-p
rod
uct
s1
818.1
114
4<
0.0
00.0
0
Ban
ka
nd
insu
ran
ce8
25.0
14
4<
0.0
00.3
10.4
0
Ban
ka
nd
secu
riti
es®
rm1
012.5
910
0<
0.0
00.0
0
Do
mst
icv
s.cr
oss
-pro
du
cts
Do
mes
tic
47
14.2
832
15
<0.0
00.0
00.2
9
Cro
ss-p
rod
uct
s1
422.2
214
0<
0.0
00.0
0
La
rge
vs.
sma
ll
Larg
e1
812.8
312
6<
0.0
00.0
40.5
0
Sm
all
43
17.4
734
9<
0.0
00.0
0
Acq
uis
itio
ns
vs.
mer
ger
s
Acq
uis
itio
ns
41
19.7
234
7<
0.0
00.0
00.1
0
Mer
ger
s2
08.6
912
8<
0.0
00.0
4
Fu
llsa
mp
le6
116.1
046
15
<0.0
0<
0.0
0
Co
mm
erci
al
ban
kin
gvs.
cro
ss-p
rod
uct
s
Co
mm
erci
al
ba
nk
ing
30
2.8
121
90.0
50.0
00.2
830
.81716
Cro
ss-p
rod
uct
s1
66.3
310
6<
0.0
00.0
918
.61901
Ban
ka
nd
insu
ran
ce8
9.0
95
3<
0.0
00.2
50.3
929.7
2936
Ban
ka
nd
secu
riti
es®
rm8
3.5
65
30.3
80.3
17
.6866
Do
mes
tic
vs.
cro
ss-b
ord
ers
Do
mes
tic
33
4.4
722
11
<0.0
00.0
00.5
833
.32150
Cro
ss-b
ord
ers
13
2.9
29
40.2
80.1
39.5
841
La
rge
vs.
sma
ll
Larg
e1
64.4
711
50.0
90.1
40.8
038.0
4218
Sm
all
30
3.8
020
10
<0.0
00.0
020
.5480
A. Cybo-Ottone, M. Murgia / Journal of Banking & Finance 24 (2000) 831±859 849
Ta
ble
6(C
on
tin
ued
)
Ty
pe
of
dea
lN
ob
Mea
n(%
)P
os/
Neg
Tes
tso
fsi
gn
i®ca
nce
p-v
alu
eM
ean
of
rela
tive
size
(%)
Mea
no
f
dea
lvalu
eZ
-tes
tW
ilco
xo
nT
-tes
t
Acq
uis
itio
ns
vs.
mer
ger
s
Acq
uis
itio
ns
30
2.9
317
13
0.3
10.1
40.2
221.7
1409
Mer
ger
s1
66.1
014
2<
0.0
00.0
035.7
2476
Fu
llsa
mp
le4
64.0
331
15
<0.0
00.0
020.3
1781
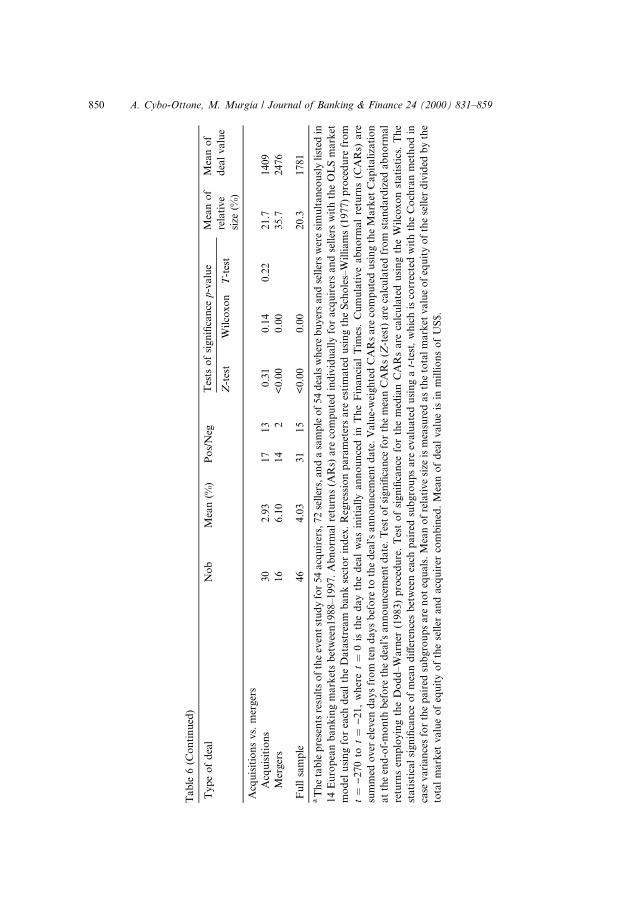
aT
he
tab
lep
rese
nts
resu
lts
of
the
even
tst
ud
yfo
r5
4a
cqu
irer
s,72
sell
ers,
an
da
sam
ple
of
54
dea
lsw
her
eb
uyer
san
dse
ller
sw
ere
sim
ult
an
eou
sly
list
edin
14
Eu
rop
ean
ba
nk
ing
ma
rket
sb
etw
een
19
88
±1
99
7.
Ab
no
rmal
retu
rns
(AR
s)are
com
pu
ted
ind
ivid
uall
yfo
racq
uir
ers
an
dse
ller
sw
ith
the
OL
Sm
ark
et
mo
del
usi
ng
for
each
dea
lth
eD
ata
stre
am
ban
kse
cto
rin
dex
.R
egre
ssio
np
ara
met
ers
are
esti
mate
du
sin
gth
eS
cho
les±
Wil
liam
s(1
977)
pro
ced
ure
fro
m
t�
)2
70
tot�
)2
1,
wh
ere
t�
0is
the
da
yth
ed
eal
was
init
iall
yan
no
un
ced
inT
he
Fin
an
cial
Tim
es.
Cu
mu
lati
ve
ab
no
rma
lre
turn
s(C
AR
s)are
sum
med
ov
erel
even
da
ys
fro
mte
nd
ays
bef
ore
toth
ed
ealÕs
an
no
un
cem
ent
date
.V
alu
e-w
eigh
ted
CA
Rs
are
com
pu
ted
usi
ng
the
Mark
etC
ap
itali
zati
on
at
the
end
-of-
mo
nth
bef
ore
the
dea
lÕsan
no
un
cem
ent
date
.T
est
of
sign
i®ca
nce
for
the
mea
nC
AR
s(Z
-tes
t)are
calc
ula
ted
fro
mst
an
dard
ized
ab
no
rmal
retu
rns
emp
loyin
gth
eD
od
d±W
arn
er(1
983)
pro
ced
ure
.T
est
of
sign
i®ca
nce
for
the
med
ian
CA
Rs
are
calc
ula
ted
usi
ng
the
Wil
coxo
nst
ati
stic
s.T
he
stati
stic
al
sign
i®ca
nce
of
mea
nd
i�er
ence
sb
etw
een
each
pair
edsu
bgro
up
sare
evalu
ate
du
sin
ga
t-te
st,
wh
ich
isco
rrec
ted
wit
hth
eC
och
ran
met
ho
din
case
va
rian
ces
for
the
pa
ired
sub
gro
up
sa
ren
ot
equ
als
.M
ean
of
rela
tive
size
ism
easu
red
as
the
tota
lm
ark
etvalu
eo
feq
uit
yo
fth
ese
ller
div
ided
by
the
tota
lm
ark
etvalu
eo
feq
uit
yo
fth
ese
ller
an
dacq
uir
erco
mb
ined
.M
ean
of
dea
lvalu
eis
inm
illi
on
so
fU
S$.
850 A. Cybo-Ottone, M. Murgia / Journal of Banking & Finance 24 (2000) 831±859
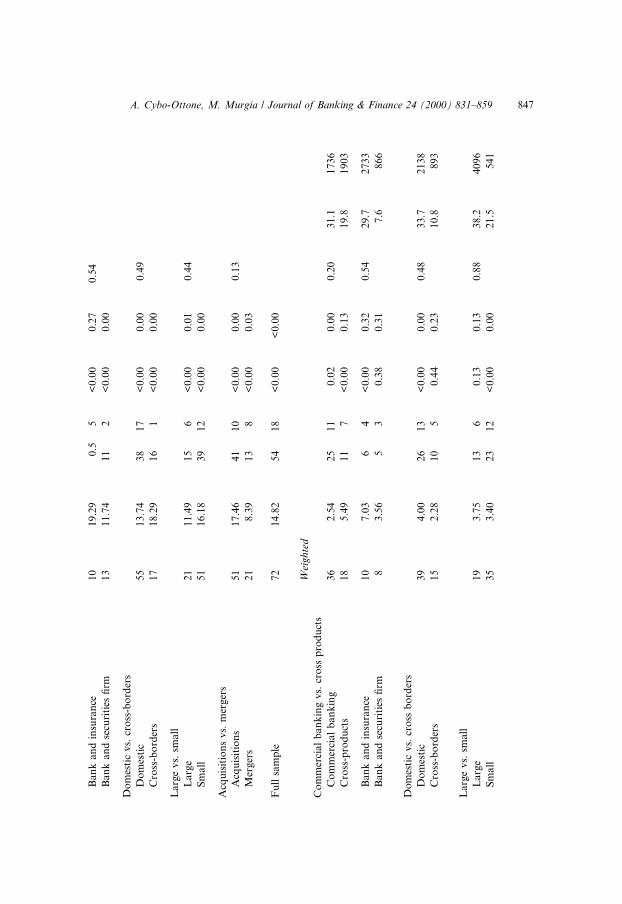
market reaction, although not signi®cantly di�erent from zero. Banks mergerswith insurance ®rms show very high CARs, which it is also statistically di�erentfrom the rest of the full sample at the 1% level. In the last two columns of thetable we report the average of target relative size and the mean of deal value, togain some further insights on the sample partition. For instance, in the case ofcross-products deals we observe that mergers with insurance companies arerelatively bigger than deals that involved securities ®rms.
Geography. Looking at results for our second partition we may concludethat only the combined value of domestic deals create shareholder value, whilstcross-border deals did not capture positive expectations from the market.Cross-border deals in sample are relatively smaller deals compared to in-country mergers. In addition, the average size of the foreign target institutionsis very small, which probably explain the insigni®cant overall value creation.
Scale. In our third partition we compare results between small and largedeals. It is interesting to note our sub-sample of small deals is relatively similarto many US bank merger studies. On the contrary, the group of large deals isquite new in the bank mergers literature, since it shows a mean deal value ofabout 4 billions of $US. The stock market's expectations for future perfor-mance are more positive for small deals than for large deals. Although largedeals show a positive market reaction at the announcement time, the signi®-cance of results is weak, probably driven by the negative market reaction of theacquiring institution.
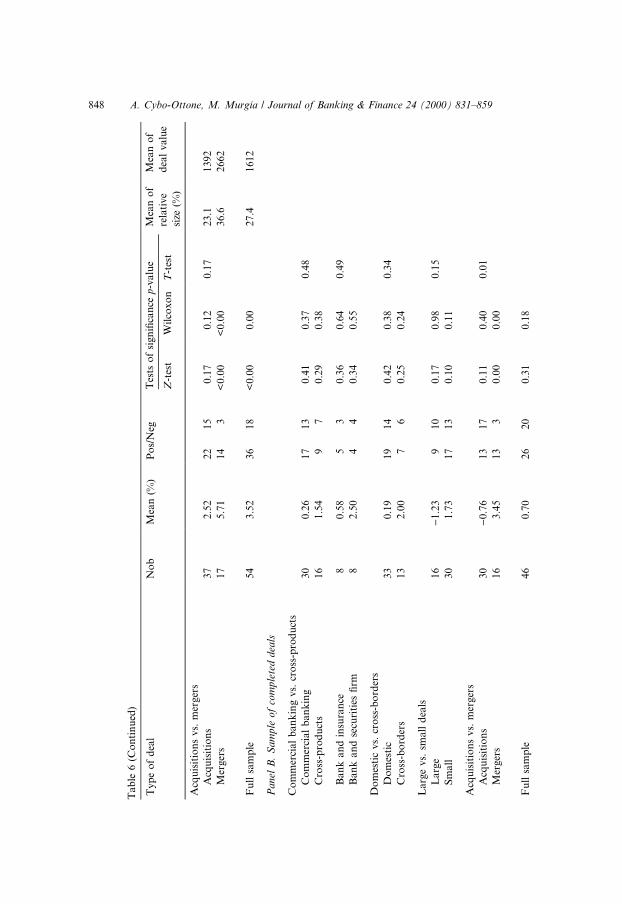
Legal. In the last partition of our sample, we present results for the twosub-groups of majority acquisitions and against pure mergers. It has to benoted that this last partition is mainly justi®ed by the legal di�erence, whichdistinguish the two types of deals. Our results show that pure mergers create aconsistent and signi®cant shareholder value, which it is also di�erent at the8% level from the average CARs of majority acquisitions. Observing thestatistics on relative size and deal value for the targets, we note that purebank mergers involve bigger players than other type of transactions of oursample.
Dropped deals. In panel B of Table 6 we present results for the sample whicheliminates deals that were subsequently canceled because of disagreement be-tween the parties or regulatory intervention. Our results are not strikingly af-fected by exclusions of these deals except for our results on focus reported inthe upper panel of the table (non parametric tests are less signi®cant) and scope(parametric tests are less signi®cant) that are somewhat weaker than in Table 6,Panel A.
4.4. Regression and multivariate analysis
In Tables 7 and 8 we report some regression analyses in order to furtherexplore our data set.
A. Cybo-Ottone, M. Murgia / Journal of Banking & Finance 24 (2000) 831±859 851
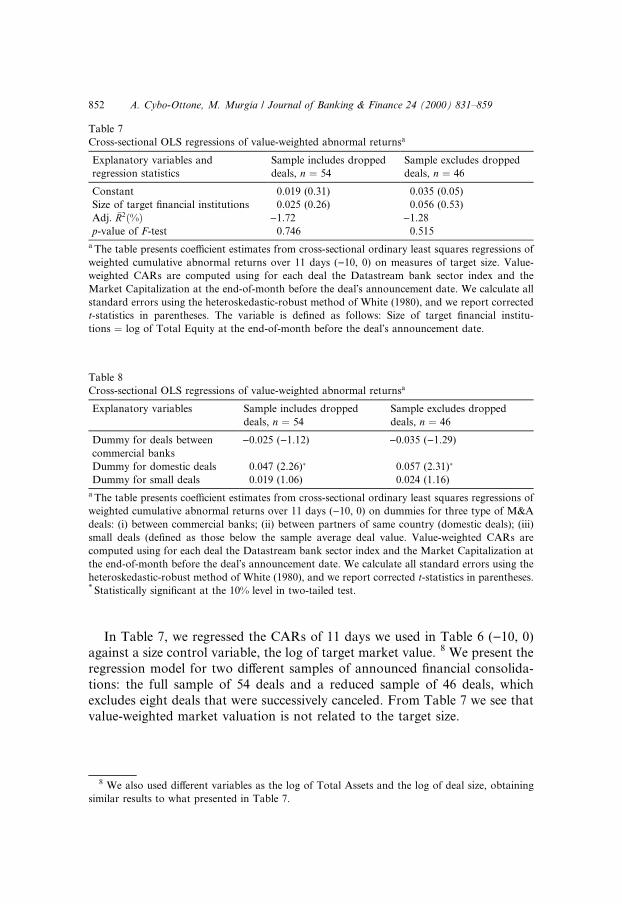
In Table 7, we regressed the CARs of 11 days we used in Table 6 ()10, 0)against a size control variable, the log of target market value. 8 We present theregression model for two di�erent samples of announced ®nancial consolida-tions: the full sample of 54 deals and a reduced sample of 46 deals, whichexcludes eight deals that were successively canceled. From Table 7 we see thatvalue-weighted market valuation is not related to the target size.
Table 8
Cross-sectional OLS regressions of value-weighted abnormal returnsa
Explanatory variables Sample includes dropped
deals, n � 54
Sample excludes dropped
deals, n � 46
Dummy for deals between
commercial banks
)0.025 ()1.12) )0.035 ()1.29)
Dummy for domestic deals 0.047 (2.26)� 0.057 (2.31)�
Dummy for small deals 0.019 (1.06) 0.024 (1.16)
a The table presents coe�cient estimates from cross-sectional ordinary least squares regressions of
weighted cumulative abnormal returns over 11 days ()10, 0) on dummies for three type of M&A
deals: (i) between commercial banks; (ii) between partners of same country (domestic deals); (iii)
small deals (de®ned as those below the sample average deal value. Value-weighted CARs are
computed using for each deal the Datastream bank sector index and the Market Capitalization at
the end-of-month before the dealÕs announcement date. We calculate all standard errors using the
heteroskedastic-robust method of White (1980), and we report corrected t-statistics in parentheses.* Statistically signi®cant at the 10% level in two-tailed test.
Table 7
Cross-sectional OLS regressions of value-weighted abnormal returnsa
Explanatory variables and
regression statistics
Sample includes dropped
deals, n � 54
Sample excludes dropped
deals, n � 46
Constant 0.019 (0.31) 0.035 (0.05)
Size of target ®nancial institutions 0.025 (0.26) 0.056 (0.53)
Adj. �R2�%� )1.72 )1.28
p-value of F-test 0.746 0.515
a The table presents coe�cient estimates from cross-sectional ordinary least squares regressions of
weighted cumulative abnormal returns over 11 days ()10, 0) on measures of target size. Value-
weighted CARs are computed using for each deal the Datastream bank sector index and the
Market Capitalization at the end-of-month before the dealÕs announcement date. We calculate all
standard errors using the heteroskedastic-robust method of White (1980), and we report corrected
t-statistics in parentheses. The variable is de®ned as follows: Size of target ®nancial institu-
tions � log of Total Equity at the end-of-month before the dealÕs announcement date.
8 We also used di�erent variables as the log of Total Assets and the log of deal size, obtaining
similar results to what presented in Table 7.
852 A. Cybo-Ottone, M. Murgia / Journal of Banking & Finance 24 (2000) 831±859
In Table 8 we also regressed the CARs of 11 days against a set of threedummies: the dummy related to bank to bank deals; a dummy for the domesticmergers, and the dummy use to identify small deals. The regression was runeither for the full sample of announced 54 combined deals and also for thesample of 46 deals that were subsequently concluded. This analysis allows us todisentangle the e�ect of a particular sample partition, taking account of pos-sible overlap e�ects that are present in our sub-sample classi®cation. As can beobserved from the table we found a signi®cant coe�cient, at the 10% level, onlyfor the group of domestic bank mergers.
4.5. One year time window
As a further analysis of the stock market behavior around bank M&Aannouncements, not reported in the tables, we computed average excess returnsone year before and after the event period. To calculate these performancemeasures we exclude the 20 days surrounding the public announcement and weuse a buy-and-hold procedure, in which a stock's buy and hold return is de-®ned as the product of one plus each day abnormal return, minus one. Marketmodel parameters of each year were estimated with daily returns of the sameyear.
Long term impact of the deals. In the year following the deal's announce-ment, we ®nd that the higher and signi®cant abnormal returns are observedonly for mergers with insurance companies, with an average excess return of+4.73% signi®cant at the 5% level. This strengthens our results based on ashort-term event window. Our interpretation of the market performance afterthe announcement period is mainly related to the complexity of the deal an-nounced. We believe that marriages between banks and other type of ®nancialinstitutions must be scrutinized carefully by the market. It is possible that ittakes some time to better appreciate the impact of the transaction on thepro®tability of both buyer and seller. A learning story is also likely in the caseof dropped deals, which were penalized from the market as the outcome failedto materialize.
Ex ante results. In the year before the deal, both bidder and targets tend tounder perform the market. In domestic deals, we ®nd some weak evidence thatbidders under perform the market less than the targets whereas the oppositeoccurs for cross-border deals. These results are somehow consistent with thoseof Rhoades (1993) for the US. For the target ®nancial institutions we have aclear pattern of signi®cant under-performance in the year before the deal'sannouncement. We also compared the ex-ante performance of target bank thathave been acquired with targets that have been merged and we ®nd a very smalland non-signi®cant under-performance of merger targets as compared withacquisitions targets and with merger bidders. All that is a weak evidence thatmerger deals have a more disciplinary nature than acquisition deals and does
A. Cybo-Ottone, M. Murgia / Journal of Banking & Finance 24 (2000) 831±859 853
not con®rm results reported by Vander Vennet (1996). We suspect that thelegal nature of the deal is a very poor proxy of its motivation. 9
4.6. Controlling for time and country e�ects
Further analysis shows that our results on the announced European bankmergers are not biased either by time or country e�ects.
Time e�ects. The temporal evolution of European bank mergers, as can beseen from the descriptive statistics of Table 1 above, presents two main timeperiods. From 1988 to 1992 the Single Market probably leaded Europeandeals. From 1995, European bank mergers rose by value and number and wereplausibly motivated by the advent of EMU (e.g. McCauley and White, 1996).We run a set of regressions, separately for bidder and target banks, of theCARs of 11 days against dummy variables for the 10 di�erent years, and alsowith dummies related to two major time periods (1998±1992 and 1995±1997).We could not ®nd any time e�ect related to either the buyer or target abnormalreturns.
Country e�ects. From a country perspective we already underlined the factthat, although some markets in our sample were interested by an highernumber of bank mergers, the overall sample is almost evenly distributed acrossthe major European bank markets. We looked for the presence of countrye�ects running two regressions of buyers and target banks CARs against a setof country dummies. To avoid perfect multi-collinearity we omit the dummyfor the Italian deals, which e�ects are therefore estimated through the intercept.Table 9 presents regressions results.
In the case of acquiring banks we found a signi®cant (negative) estimatedcoe�cients only for Spanish banks. For target banks, German and Dutch in-stitutions resulted with a signi®cantly lower abnormal returns (results fromFinland do refer to a single deal and should not be overemphasized). 10 Fur-thermore, we also perform in both regressions a joint F-test to verify whetherthe estimated coe�cients are di�erent from each other, and we could not rejectthe null hypothesis at standard signi®cance level. We conclude that country
9 Morck et al. (1988) were able to sort the ex-ante performance of a sample of acquired ®rms
according to the motivation of the deal. They proposed to interpret deals where the transaction was
an hostile takeover as disciplinary and deals were transfer of control was not disputed by
management as synergetic. In Vander Vennet's study (1996) synergetic deals are proxied by mergers
and disciplinary deals are proxied by acquisitions (whereas it is well known that many acquisitions
have a synergetic motivation). Our results show that his proposed proxy is very weak.10 We also used Sweden as a base country, reaching same conclusions. Furthermore, the positive
coe�cient of Italian target banks disappeared, thus con®rming that no sample country of our study
had a positive and signi®cantly di�erent market valuation from the rest of full sample.
854 A. Cybo-Ottone, M. Murgia / Journal of Banking & Finance 24 (2000) 831±859
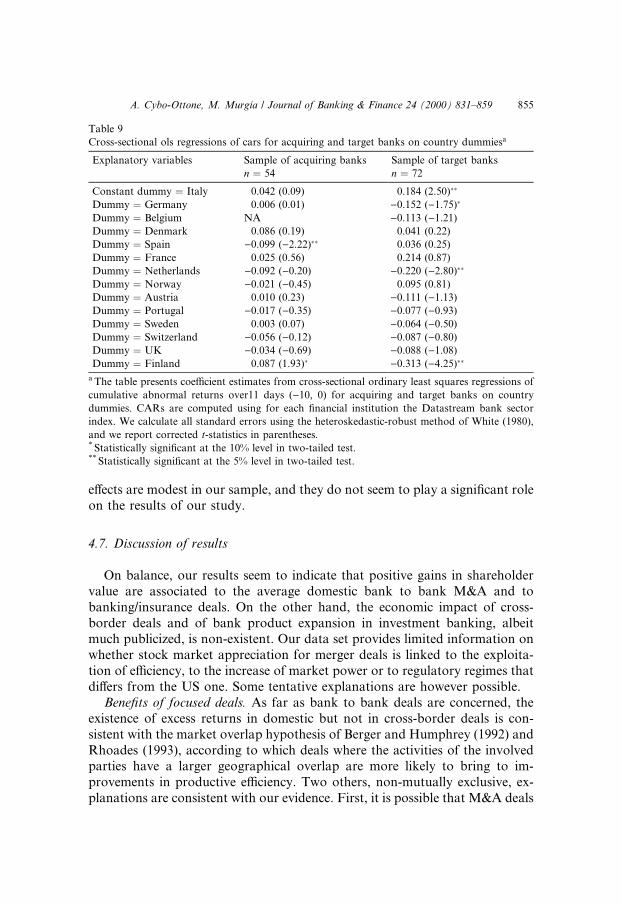
e�ects are modest in our sample, and they do not seem to play a signi®cant roleon the results of our study.
4.7. Discussion of results
On balance, our results seem to indicate that positive gains in shareholdervalue are associated to the average domestic bank to bank M&A and tobanking/insurance deals. On the other hand, the economic impact of cross-border deals and of bank product expansion in investment banking, albeitmuch publicized, is non-existent. Our data set provides limited information onwhether stock market appreciation for merger deals is linked to the exploita-tion of e�ciency, to the increase of market power or to regulatory regimes thatdi�ers from the US one. Some tentative explanations are however possible.
Bene®ts of focused deals. As far as bank to bank deals are concerned, theexistence of excess returns in domestic but not in cross-border deals is con-sistent with the market overlap hypothesis of Berger and Humphrey (1992) andRhoades (1993), according to which deals where the activities of the involvedparties have a larger geographical overlap are more likely to bring to im-provements in productive e�ciency. Two others, non-mutually exclusive, ex-planations are consistent with our evidence. First, it is possible that M&A deals
Table 9
Cross-sectional ols regressions of cars for acquiring and target banks on country dummiesa
Explanatory variables Sample of acquiring banks
n � 54
Sample of target banks
n � 72
Constant dummy � Italy 0.042 (0.09) 0.184 (2.50)��
Dummy � Germany 0.006 (0.01) )0.152 ()1.75)�
Dummy � Belgium NA )0.113 ()1.21)
Dummy � Denmark 0.086 (0.19) 0.041 (0.22)
Dummy � Spain )0.099 ()2.22)�� 0.036 (0.25)
Dummy � France 0.025 (0.56) 0.214 (0.87)
Dummy � Netherlands )0.092 ()0.20) )0.220 ()2.80)��
Dummy � Norway )0.021 ()0.45) 0.095 (0.81)
Dummy � Austria 0.010 (0.23) )0.111 ()1.13)
Dummy � Portugal )0.017 ()0.35) )0.077 ()0.93)
Dummy � Sweden 0.003 (0.07) )0.064 ()0.50)
Dummy � Switzerland )0.056 ()0.12) )0.087 ()0.80)
Dummy � UK )0.034 ()0.69) )0.088 ()1.08)
Dummy � Finland 0.087 (1.93)� )0.313 ()4.25)��
a The table presents coe�cient estimates from cross-sectional ordinary least squares regressions of
cumulative abnormal returns over11 days ()10, 0) for acquiring and target banks on country
dummies. CARs are computed using for each ®nancial institution the Datastream bank sector
index. We calculate all standard errors using the heteroskedastic-robust method of White (1980),
and we report corrected t-statistics in parentheses.* Statistically signi®cant at the 10% level in two-tailed test.** Statistically signi®cant at the 5% level in two-tailed test.
A. Cybo-Ottone, M. Murgia / Journal of Banking & Finance 24 (2000) 831±859 855
bring to a more e�cient scale; this would be consistent with the more common®nding of economies of scale at the size range of our deals, both large and small,in Europe than in the US (see Altunbas et al., 1996). Within the size thresholdencompassing our sample deals, Altunbas et al. (1996) performed 48 country-year regressions for the individual EU banking markets. Their results are timedependent and should be interpreted with caution. However, they found thateconomies of scales are statistically signi®cant in 46% of the cases, as comparedwith 27% each for the remaining cases of constant returns to scale and dis-economies of scale.
Further, there is some evidence that antitrust enforcement in US banking ismore stringent than in Europe, for example because the geographic de®nitionof the relevant market is at the ®ner level of the standard metropolitan area(e.g. Savage, 1993). The McFadden Act limited the geographic expansion ofAmerican banks, albeit in a less and less stringent way culminating to the 1994deregulation, may inhibit a number of e�ciency bringing mergers in the US(see Chapter 17 of Saunders, 1994). 11
Bene®ts of banking/insurance. The analyses and the results obtained forcross-product deals are new in literature. The only available ®ndings comefrom studies which used hypothetical mergers and simulations, which foundrisk reduction e�ects from these deals (e.g. Boyd et al., 1993). Risk reductionmoves should not, per se, a�ect shareholder value (compare Amihud et al.(1986) with Santomero (1995)); rather, economies of scope or revenue e�-ciencies due to cross selling of banks and insurance products to retail customersare more likely to explain our results (e.g. Akhavein et al., 1997). Clash incorporate cultures between universal banks and investment banks is a likelyexplanation for the relative failure of bank expansion in investment banking(see Eccles and Crane, 1988, Table 10.1).
5. Conclusions
This paper provides the ®rst analysis of the stock market valuation of thelargest mergers and acquisitions between banks and ®nancial institutions thathave been announced from 1988 to 1997 in 14 European markets. Our resultsdocument that there is a positive and signi®cant increase in value for the av-erage merger at the time of the deal's announcement. This ®nding is not
11 Given a similar total GNP, the US and the EU show di�erent sizes of domestic markets, as
de®ned by the individual state in the Unions. Whereas there are only 15 states in Europe, there are
52 states in the US. Hence, American bank growth is somewhat limited by the size of the state of
incorporation. An indirect evidence of these limits is the much larger size of European banks as
compared with American banks.
856 A. Cybo-Ottone, M. Murgia / Journal of Banking & Finance 24 (2000) 831±859
consistent with the bulk of empirical studies conducted in the US bankingmarket.
When we analyzed the combined abnormal returns of bidder and target fordi�erent types of deals, we uncover that there is a positive and signi®cantmarket reaction around the short period of eleven days for the following typeof transactions: commercial banks; focused transactions; combinations withinsurance companies; domestic transactions; relatively small deals in oursample, which is anyway biased toward large size.
On the contrary, we found that M&A with securities ®rms and concludedwith foreign institutions did not gain a positive market's expectation. Theevidence we presented for very large deals is statistically weak, and it isprobably linked to the negative market reaction to the acquiring bank.
Our research on European bank mergers reaches di�erent conclusions fromthose of many related studies conducted in the US banking industry. We ex-plain our di�erent results as stemming from the di�erent structure and regu-lation of EU banking markets, which are shown to be more similar betweenthem than as compared with the US one.
Acknowledgements
This paper is a very extended revision of a note prepared by the authorswithin the Research Unit of European Banking Report (1995), sponsored bythe Italian Banking Association and Fitch-IBCA. We thank an anonymousreferee for helpful suggestions. We are also grateful to Yakov Amihud, StephenRhoades, Anthony Santomero, Anthony Saunders, and seminar participants atthe 1996 European Financial Management Association Meetings in Innsbruck,the Seventh Symposium on Money, Finance, Banking and Insurance at theUniversity of Karlsruhe, the Center for Financial Economics P. Ba� of Boc-coni University in Milan, and the Tor Vergata Conference on EURO andFinancial Institutions in Rome, for valuable comments on earlier versions. Wealso thank Alessandra Franceschini for her help in data collection in the earlystage of the work. The views expressed in this paper are the authors' alone. Allremaining errors are the responsibility of the authors.
References
Akhavein, J.D., Berger, A.N., Humphrey, D.B., 1997. The e�ects of bank megamergers on
e�ciency and prices: Evidence from a bank pro®t function. Review of Industrial Organization
12, 95±139.
Altunbas, Y., Gardener, E., Molyneux, P., 1996. Economies of scale, cost subadditivity and X-
e�ciencies in European banking, Mimeo. University College of North Wales, Bangor.
A. Cybo-Ottone, M. Murgia / Journal of Banking & Finance 24 (2000) 831±859 857
Amihud, Y., Dodd, P., Weinstein, M., 1986. Conglomerate mergers, managerial motives and
stockholder wealth. Journal of Banking and Finance 10, 401±410.
Bank of England, 1993. Cross-border alliances in banking and ®nancial services in the Single
Market. Bank of England Quarterly Bulletin, August, pp. 372±378.
Beatty, A., Santomero, A., Smirlock, A., 1987. Bank Merger Premiums: Analysis and Evidence.
Monograph Series in Finance and Economics, 1987/3, Salomon Brothers Center, New York
University.
Berger, A.N., Humphrey, D.B., 1992. Megamergers in banking and the use of cost e�ciency as an
antitrust defense. The Antitrust Bulletin 37 (3), 541±600.
Borio, C., Filosa, R., 1994. The changing borders of banking: Trends and implications. BIS
Economic Papers, 43, Bank for International Settlements, Basle.
Boyd, J.H., Graham, S.L., Hewitt, R.S., 1993. Bank holding company mergers with non-bank
®nancial ®rms: E�ects on the risk of failure. Journal of Banking and Finance 17, 43±63.
Bradley, M., 1980. Inter®rm tender o�ers and the market for corporate control. Journal of Business
53, 345±376.
Cornett, M.M., Tehranian, H., 1992. Changes in corporate performance associated with bank
acquisitions. Journal of Financial Economics 31, 211±234.
Dodd, P., Warner, J.B., 1983. On corporate governance. A study of proxy contests. Journal of
Financial Economics 11, 401±438.
Eccles, R., Crane, D., 1988. Doing Deals, Investment Banks at Work. Harvard University Press,
Boston.
Eckbo, E., 1983. Horizontal mergers collusion and shareholder wealth. Journal of Financial
Economics 11, 241±273.
Economic Research Europe, 1996. A study of the e�ectiveness and impact of Internal Market
Integration on the banking and credit sector.
European Banking Report, 1995. Le operazioni di fusione ed acquisizione nel mercato bancario
europeo, Fifth Seminar, Mimeo. Rome, 6 December, 1995.
Giliberto, M., 1985. Interest rate sensitivity in the common stocks of ®nancial intermediaries: A
methodological note. Journal of Financial and Quantitative Analysis 20 (1), 123±126.
Gilson, R.J., 1986. The Law and Finance of Corporate Acquisitions, University Casebook Series.
The Foundation Press, Minneola.
Houston, J.F., Ryngaert, M.D., 1994. The overall gains from large bank mergers. Journal of
Banking and Finance 18, 1155±1176.
James, C., Houston, J., 1996. Evolution or extinction: Where are banks headed? Journal of Applied
Corporate Finance 9 (2), 8±23.
Leonard, J., Glossman, D., Nasheck, J., Strauss, R., 1992. European bank mergers: Lessons of
experience for the future. Salomon Brothers International Equity Research, May.
McCauley, R., White, W., 1996. The Euro and European ®nancial markets. WP41, Bank of
International Settlements, Basle.
Morck, R., Shleifer, A., Vishny, R., 1988. Characteristics of hostile and friendly takeovers. In:
Auerbach, A. (Ed.), Corporate Takeovers: Causes and Consequences, NBER, Chicago, pp.
101±137.
Pillo�, S.J., 1996. Performance changes and shareholder wealth creation associated with mergers of
publicly traded banking institutions. Journal of Money Credit and Banking 28 (3), 294±310.
Pillo�, S.J., Santomero, A.M., 1998. The value e�ects of bank mergers and acquisitions. In:
Amihud, Y., Miller, G. (Eds.), Bank Mergers and Acquisitions. Kluwer Academic Publishers,
Dordrecht.
Rhoades, S.A., 1993. E�ciency e�ects of horizontal (In-market) bank mergers. Journal of Banking
and Finance 17, 411±422.
Santomero, A., 1995. Commercial bank risk management: An analysis of the process. Working
Paper, Wharton Financial Institutions Center, Philadelphia, PA, December 1995.
858 A. Cybo-Ottone, M. Murgia / Journal of Banking & Finance 24 (2000) 831±859
Saunders, A., Walter, I., 1994. Universal Banking in the United States. What We Could Gain?
What We Could Lose? Oxford University Press, New York.
Saunders, A., 1994. Financial Institutions Management ± A Modern Perspective. Irwin, New York.
Savage, D., 1993. Interstate banking: A status report. Federal Reserve Bulletin 79, 1075±1089.
Scha�er, S., 1994. Bank competition in concentrated markets. Federal Reserve Bank of
Philadelphia Business Review, March/April 1994, pp. 3±16.
Scholes, M.S., Williams, J.T., 1977. Estimating betas from nonsynchronous data. Journal of
Financial Economics 5, 309±328.
Siems, T.F., 1996. Bank mergers and shareholder wealth: Evidence from1995s megamerger deals.
Financial Industry Studies of the Federal Reserve Bank of Dallas, 1±12.
The Economist, 1997. It is got to ®t somehow, August 16, pp. 59±61.
Vander Vennet, R., 1996. The e�ect of mergers and acquisitions on the e�ciency and pro®tability
of EC credit institutions. Journal of Banking and Finance 20, 1531±1558.
Vander Vennet, R., 1997. Determinants of EU bank takeovers: A logit analysis. Working Paper,
University of Ghent.
White, H., 1980. A heteroskedastic-consistent covariance matrix estimator and a direct test for
heteroskedasticity. Econometrica 48, 817±838.
Zhang, H., 1995. Wealth e�ects of US bank takeovers. Applied Financial Economics 5, 329±336.
A. Cybo-Ottone, M. Murgia / Journal of Banking & Finance 24 (2000) 831±859 859