Embed Size (px)
Citation preview
Corporate Equity Ownership and the Governance of Product Market Relationships*
C. Edward Fee
Michigan State University [email protected]
Charles J. Hadlock
University of Virginia [email protected]
Shawn Thomas
University of Pittsburgh [email protected]
*We thank Wei-Lin Liu and seminar participants at the University of Virginia and Washington University for helpful comments. Hoon-Taek Seo provided superb research assistance. All errors remain our own.

Corporate Equity Ownership and the Governance of Product Market Relationships
ABSTRACT We assemble a sample of over 10,000 customer-supplier relationships and determine whether the customer owns equity in the supplier. We find that factors related to both contractual incompleteness and financial market frictions are important in the decision of a customer firm to take an equity stake in a supplier. Evidence on the size of equity stakes suggests that there may be limits to equity ownership in some contexts. Finally, even after controlling for a number of other factors, we find that relationships accompanied by equity ownership last significantly longer than other relationships, suggesting that ownership aids in bonding trading parties together. Keywords: Contracting, Ownership, Vertical Integration JEL classifications: G32, L22, D23

1
I. Introduction
Firms face a menu of choices in obtaining inputs from their suppliers. At one extreme,
firms can simply purchase inputs in spot market transactions. At the other extreme, customers
and suppliers can vertically integrate. Intermediate possibilities include signing detailed long-
term contracts or forming partially integrated structures where one firm takes an equity stake in
the other. While previous research has devoted much attention to understanding both vertical
integration and long-term contracting, there is comparatively little evidence on the role of partial
equity stakes as a mechanism to aid in the governance of product market relationships.
In this paper, we study the decision to take an equity stake in a trading partner with a
unique sample of over 10,000 customer-supplier pairs from 1988-2001. We examine whether
variables that proxy for the theorized benefits of equity ownership are systematically related to
the presence or size of observed equity stakes. In addition, we investigate whether the presence
of an ownership position is related to the subsequent evolution of the trading relationship.
Our analysis reveals several interesting findings. First, we find that intense trading
relationships where a firm sells a significant fraction of its output to a single customer are quite
common. Second, we find that it is relatively rare for a customer to take an equity stake in their
supplier.1 Specifically, equity stakes are present in only 3.31% of all sample relationships,
although this frequency is higher in some subsamples. The low overall incidence of equity
ownership suggests that many trading relationships can be governed effectively by explicit or
implicit contracts, with no need for equity participation. There are still, however, a large number
of relationships where this is apparently not the case: these cases, where customers do take
equity stakes in their suppliers, provide us the opportunity to investigate the types of frictions
1 Suppliers in our sample are much smaller than customers. Thus, equity blocks by suppliers in their major customers are virtually non-existent.

2
that arise in customer-supplier relationships and also allow us to study the role of equity in
easing these frictions.
Our results suggest that factors related to contractual incompleteness, relationship-
specific investment, and financial market frictions contribute to the decision for a customer to
obtain an equity stake in its supplier. In particular, the likelihood of observing an equity stake is
related to whether the supplier is a research and development (R&D) intensive firm. Since we
expect relationships involving R&D activities to be particularly prone to contractual frictions
arising from poorly delineated property rights, this finding appears consistent with an incomplete
contracts motivation for the use of equity. The presence of an equity stake is also significantly
related to the fraction of a supplier's sales that are made to the customer. This suggests that
equity ownership may encourage efficient actions in settings where firms are concerned with
expropriation and hold-up problems arising from relationship-specific investments.
We also find that equity stakes are significantly more common in relationships with
formal alliance agreements. This indicates that explicit contracts and equity ownership are often
complements rather than substitutes in governing potential conflicts between trading parties.
Since relationships with explicit alliances are more likely to include substantial relationship-
specific investments and/or scope for incentive conflicts, our findings on alliances suggest that
equity ownership helps ease inefficiencies arising from incomplete contracting in these settings.
Turning to financial market frictions as a potential motivation for equity stakes, we find
that suppliers who are cash constrained (i.e., have negative free cash flow) are more likely to
have customers as blockholders than firms who are not cash constrained. This suggests that part
of the equity stake phenomenon reflects behavior in which customers serve as informed sources
of capital to ease financial constraints at the supplier level. Customer financial constraints also

3
appear important, as we find some evidence that customers with deeper pockets are more likely
to invest in their suppliers.
When we examine the variation in the size of observed equity blocks, we find that
variables that have a positive effect on the likelihood of observing the presence of a block often
have an insignificant or negative effect on the size of the blocks. This suggests that there are
limits to equity ownership, perhaps because suppliers are concerned about customers having too
much control over their operations at high ownership levels. Thus, in settings where incentives
must be delicately managed, notably relationships entailing high levels of R&D, a large fraction
of supplier sales to the customer, or explicit alliance agreements, it appears that an equity stake is
relatively more likely to be established, but that the size of the stake will be moderate.
Finally, we find that relationships accompanied by equity ownership last significantly
longer than other relationships. However, outright mergers between customers and suppliers are
rare, even when customers own equity in their suppliers. These findings suggest that ownership
may affect relationship governance and help bond trading parties. This evidence fits nicely with
our findings on the decisions to take equity stakes, which presumably are made in anticipation of
the potential future benefits.
The rest of the paper is organized as follows. In Section 2, we review the existing
theoretical and empirical literature concerning the governance of product market relationships
and the possible role for equity ownership. We use this discussion to motivate our empirical
strategy, which we outline at the end of Section 2. In Section 3, we discuss our data, sample
selection, and summary statistics. In Section 4, we present our main multivariate results on the
factors associated with equity stakes in product market relationships. In Section 5, we report our
findings on the duration of relationships. We conclude in Section 6.

4
2. Related Literature and Empirical Strategy
2.1 Theoretical Considerations
The vertical integration decision is a classic issue in the theory of the firm. Pioneering
work in transactions cost economics by Williamson (1975, 1985) and Klein, Crawford, and
Alchian (1978) emphasizes the role of asset specificity and relationship-specific investments in
the integration decision. Related work on incomplete contracts by Grossman and Hart (1986)
and Hart and Moore (1990) demonstrates how integration can change investment incentives by
changing property rights and the division of jointly created surplus. If we view a customer
taking an equity stake in its supplier as a form of partial vertical integration, we might expect that
the factors that the theory suggests will affect the vertical integration decision will also affect the
likelihood of partial integration. Thus, we might expect relationships characterized by a high
degree of asset specificity and/or the presence of important non-contractible decisions to be more
likely to exhibit equity stakes.2
This view of partial integration, while informative, may overlook some of the subtleties
that arise in this hybrid ownership structure. An alternative view of partial ownership is that it
provides the blockholder with an incentive to partially internalize the effects of its actions on its
trading partner. Thus, in cases when one party may underinvest in actions that help the other
party, a partial equity stake may be beneficial in improving total surplus.3 The size of such
stakes will be limited if high ownership by a blockholder begins to dilute the target's incentives.
2 Holmstrom and Roberts (1998) and Whinston (2003) note that the transactions cost approach and the property rights approach to integration are distinct and have different empirical implications. We do not formally test these theories, but rather use them as general motivation for the role of incomplete contracting in partial equity ownership. 3 The general idea that equity stakes help internalize the effect of one parties actions on a partner is used by, among others, Riordan (1990, 1991) and Mathews (2003).

5
This view of partial equity ownership as a solution, albeit imperfect, to a double moral hazard
problem, would suggest that equity stakes are more likely to be observed in relationships where
actions by one party have a significant positive spillover effect on their partner.
While partial equity ownership may at times alleviate incentive problems, Aghion and
Tirole (1994) show that it is possible for partial equity ownership to be irrelevant in relationships
when parties bargain ex post over any trading surplus. In their analysis, the price that product
market partners agree on in bargaining will adjust to reflect any equity stake in a way that leaves
both partners with the same surplus that they would realize without the ownership position.
However, recent papers by Dasgupta and Tao (2000), Harbaugh (2001), and Van den Steen
(2002) show that when one generalizes the Aghion and Tirole (1994) framework, there can be a
role for partial equity stakes to increase relationship efficiency by changing the threat points in
the bargaining game over joint surplus. For example, Dasgupta and Tao (2000) show that if a
customer has a stake in a supplier, the supplier will tilt its choices towards relationship-specific
investments and away from general investments, because part of the return from the general
investment will accrue to the customer via its equity position.
These models of partial equity ownership are quite specialized. Thus, it is hard to
interpret them as literal descriptions of typical multi-dimensional, long-lived product market
relationships. Nevertheless, this work suggests that equity may play a role in enhancing
efficiency in environments where contracting is incomplete. In addition, it seems possible that
equity stakes may serve a role in encouraging information sharing or cooperation between
trading parties over time in ways not captured by existing models. In our empirical analysis we
hope to both confirm some general possibilities suggested by existing theory and to inform
further work in this area.

6
2.2 Related Empirical Evidence
Following the work of Pisano (1989), several studies have examined equity stakes in
product market relationships.4 Motivated primarily by transactions cost economics, these papers
identify several factors that are related to equity participation and are plausibly related to
contracting problems and expropriation risks. A common result in several of these studies is that
R&D intensive relationships are more likely to include an equity tie between partners.
While these prior studies are informative, they do not provide a comprehensive picture of
equity holdings in a broad cross-section of publicly traded firms. Many of these studies focus on
specific industries (e.g., biotechnology), and almost all restrict attention to a special type of
product market relationship (e.g., strategic alliances or technology transfer agreements). In
addition, many of the firms studied are private and/or foreign. Given these sampling procedures,
which are usually dictated by data availability, it is not surprising that the existing literature
reports substantially higher rates of equity participation in relationships than we find, with a rate
of over 50% reported by Gulati (1995).
A recent working paper by Pablo and Subramaniam (2002) shares similar goals to our
study. These authors examine whether the presence of equity stakes in a sample of 759 product
market alliances can be predicted by variables related to contractual frictions and/or financial
constraints, and they find some evidence in the affirmative. Our sample is much larger, as
product market alliances comprise only a small fraction of intense trading relationships. Thus,
we are able to test whether relationships governed by alliance agreements are different than other
trading relationships, and it turns out they are. In addition, given the richness of our data, we are
4 A partial list of studies includes Gulati (1995), Gulati and Singh (1998), Oxley (1997, 1999), Robinson and Stuart (2001), and Pablo and Subramaniam (2002).

7
able to examine how the intensity of a trading relationship affects ownership stakes. Moreover,
we can exploit the unique panel nature of our data to examine relationship duration. Where our
analysis overlaps with Pablo and Subramaniam (2002), the results are similar in nature,
suggesting that the two studies are uncovering similar economic phenomena.
Our investigation is also related to the work of Allen and Phillips (2000). In a sample of
block purchases, they find that blocks established in connection with product market alliances
exhibit the most positive announcement returns and subsequent changes in operating
performance. These results certainly suggest that there is something special about equity
ownership coupled with a product market relationship. However, because Allen and Phillips
(2000) select their sample based on the purchase of an equity block, their study is unable to
contrast relationships accompanied by equity stakes with relationships not accompanied by such
stakes. As we show, close trading relationships without equity ownership are quite common.
The broader literature on large blockholders (e.g., Holderness and Sheehan (1988, 2000))
is also related to our analysis. This literature establishes that corporations do at times hold large
blocks in other firms, suggesting that this can be a viable organizational form. However, this
literature is silent on identifying when this organizational form is preferred to others, and it does
not identify any special role for equity in the context of product market relationships. Of related
interest is also the literature on corporate venture capital, although the focus there is on private
firms rather than public firms. Gompers and Lerner (2000) and Santhanakrishnan (2003) report
that equity ties in a venture capital setting are more successful when the investor and the venture
have some strategic overlap or an alliance. Similar to Allen and Phillips (2000), this suggests
that equity stakes coupled with product market relationships may ease contractual frictions or
financing constraints.

8
2.3 Empirical Strategy
Our approach is to identify several variables that theory suggests may be related to equity
stakes and then to examine whether these variables systematically predict the presence of a stake.
Our preceding discussion establishes that there may be several scenarios under which equity
plays a role in easing incentive conflicts and contracting frictions between trading parties in a
world where contracts are incomplete. We refer to this general role for partial equity stakes as
the contracting hypothesis.
One variable that we expect will be related to contracting problems is the R&D focus of
the relationship. As has been well recognized (e.g., Aghion and Tirole (1994)), property rights
are often quite blurry when it comes to R&D activities. In addition, when firms are sharing
knowledge, there may be significant potential for the activities of one party to indirectly benefit
the other party in ways outside the scope of any contractual agreement. If equity stakes alleviate
these frictions, then they should be more prevalent in R&D oriented relationships. Other studies
have found a relation between R&D and equity in certain special samples, and thus this variable
is not unique to our study. However, our study is unique in looking at the relation between R&D
and equity stakes in a broad set of relationships between publicly traded firms.
The second contracting factor we study is the fraction of a firm's sales that are made to
their product market partner. The idea here is that the more a supplier sells to a given customer,
the more likely the supplier is making a substantial relationship-specific investment, and,
consequently, the greater will be concerns about expropriation. If equity stakes serve to ease
concerns about expropriation or holdup, we would expect to observe greater equity stakes when
this sales dependence variable is elevated.

9
The final factor we identify to test the contracting hypothesis is a variable indicating
whether the two firms in a relationship have an explicit alliance agreement. Many prior studies
of corporate equity ownership either restrict attention to alliances (e.g., Pablo and Subramaniam
(2002)), or use the existence of an alliance to identify a product market relationship (e.g., Allen
and Phillips (2000)). As we show below, it is quite common for firms to have close product
market relationships without an alliance agreement. The existence of a formal alliance
agreement suggests that trading partners are concerned about conflicts that may evolve over time
and that they attempt to ameliorate these conflicts using a contractual mechanism. If these
contractual agreements only imperfectly alleviate the problems, we would expect to observe the
presence of an equity stake as an additional governance device. Additionally, the formal alliance
can itself be viewed as a form of relationship-specific investment. As such, the contracting
hypothesis might predict a greater need for equity in alliances compared to relationships with
less mutual investment.
Equity investments by product market partners may also arise because of financial market
imperfections.5 In particular, firms may have a difficult time securing external financing at
reasonable terms in arm's length transactions because of information problems (e.g., Myers and
Majluf (1984)). If a product market partner, by virtue of their relationship with the firm, has the
ability to more accurately assess a firm's value, they may be in a superior position to provide
financing.6 We will refer to this possibility as the financial frictions hypothesis.
5 With the exception of Allen and Phillips (2000) and Pablo and Subramaniam (2002), prior studies of partial equity stakes largely ignore financial frictions as a motivation for these ownership positions. 6 Our argument here parallels similar arguments for choosing to issue private securities over public securities (e.g., Wruck (1989) and Hadlock and James (2002)). See Lerner, Shane, and Tsai (2003) for evidence on equity market conditions and partner financing.

10
To test this hypothesis, we consider two types of factors that may proxy for heightened
problems in accessing arm's length equity markets. First, we consider a firm's need for external
funding, since financing problems can be avoided if a firm has sufficient internal funding. We
measure external capital needs as the difference between a firm's capital spending and its internal
cash flow. Second, we consider variables that may proxy for the severity of information
problems when firms decide to access the external capital markets. We expect that the relative
preference for partner financing should be elevated when these variables are elevated. We
identify these variables from the existing literature (described below).
While both the contracting hypothesis and the financial frictions hypothesis suggest that
partial equity ownership may be an optimal arrangement under some circumstances, contracting
theories also suggest that there can be limits to partial equity ownership stakes. In particular,
majority stakes can allow one firm to control the other, and large minority stakes can lead to the
possibility of seizing control in the future. Concerns about control may impair incentives,
suggesting that there are limits to the optimal size of partial equity blocks. Thus, in situations
where equity ownership has the potential to ease contracting frictions by delicately managing
incentives, we may expect to observe moderate sized equity stakes rather than large blocks. We
will directly examine this possibility in the data.
To add to our understanding of the role of ownership in relationships, it would be helpful
to evaluate whether the presence of a partial equity stake actually has an effect on how a
relationship evolves over time. This is a challenge, since many possible effects concern
variables we do not observe (pricing, investment, etc.). To address this issue indirectly, we
propose to examine relationship durability. If relationships with equity stakes tend to last longer,
this would suggest that equity aids in fostering cooperation and in increasing the surplus from

11
trade. Of course the existence of an equity stake is endogenous, so the direction of causality is
unclear. However, whatever the direction of causality, such a finding would appear broadly
consistent with the contracting hypothesis.
3. Data and Sample Selection
3.1 Identifying Customer-Supplier Relationships
We begin by selecting the set of all firms listed on the merged Center for Research in
Security Prices (CRSP) and Compustat database with non-missing values reported for book
value of assets and fiscal-year-end stock price. Since our ownership data is only available
starting in 1988, we restrict attention to the 1988-2001 period. Disclosure rules require that
firms report the identities of all customers responsible for over 10% of their annual sales, and
some firms voluntarily report the names of other major customers when sales are below this
threshold. We consider all disclosed customers to be major customers of the firm, although
much of our later analysis conditions on the magnitude of trade between the customer and the
supplier. The identity of the firm's customers and sales to these customers are extracted from the
Compustat industry segment files.
For each identified customer, we attempt to determine whether the customer is another
CRSP/Compustat listed firm. This is not a straightforward task, as customer names are often
abbreviated. Thus, following Fee and Thomas (2004), we use a computer algorithm to generate
a list of the four names listed in the CRSP historical name field that are most likely to be a match
to the customer's name. We then use visual inspection and information on the industry of the
supplier to determine if the customer is in fact one of these CRSP listed firms. For customer
names where we find no match on CRSP, we search the Directory of Corporate Affiliations to

12
determine if the customer is a subsidiary of a publicly traded firm. If it is, we assign the
customer the CRSP identifier of the parent corporation. We are deliberately conservative in our
matching of customer names to firm identifiers, and thus we are confident that customers are
matched to the appropriate financial information.
3.2 Firms in Customer-Supplier Relationships
We retain in our sample all relationship-years from 1988-2001 in which a supplier is
listed in the CRSP/Compustat merged database and is matched in the observation year with a
customer that we can confirm appears in the CRSP and Compustat databases at some point
during the sample period. The resulting sample includes 10,493 distinct relationships
representing 27,037 relationship-years.
In Panel A of Table I we report summary statistics where each relationship is treated as a
single observation. Firm characteristics are measured as of the first sample-period year that the
relationship is observed. For comparison purposes, we also report statistics for the entire
Compustat universe.7 Given the skewness in many of the variables, we focus our discussion here
on medians rather than means. As we report in Panel A, suppliers are typically much smaller
than their major customers, with a median ratio of supplier assets to customer assets of less than
0.01. However, the median supplier is nearly half the size of the median Compustat firm,
indicating that suppliers are not extraordinarily small firms in general. Suppliers are typically
much younger than their major customers (median age of 6.00 versus 30.00) and slightly
younger than the median Compustat firm. The median level of R&D intensity for suppliers is
7 All figures are inflation adjusted. The Compustat universe figures in Panel A are for 1993, the year near the middle of our sample period with the greatest number of new relationships. Our summary statistics comparisons are very similar if we treat the relationship-year as our basic unit of observation rather than the relationship.

13
slightly larger than it is for customers, and both groups of firms appear to have fairly similar
market-to-book ratios.8
To gauge the overall frequency of trading relationships, we report in Panel B of Table I
the fraction of firm-year observations in the entire CRSP/Compustat universe where a firm is
involved in an identified relationship. We find that in 16.78% (7.17%) of all firm-years a firm is
identified as a supplier (customer) in a trading relationship. Smaller firms are relatively more
likely to be identified as suppliers, while larger firms are more likely to be major customers. The
fact that a sizeable fraction of public firms are involved in intense trading relationships suggests
that understanding the dynamics of these relationships is a fruitful area for inquiry. If anything,
our figures here are likely to be understated, since the conservative procedures we follow are
likely to miss some customer-supplier matches.
To understand how relationships vary by industry, we also report in Panel B of Table I
the industries in the Compustat universe with the highest proportion of firms involved in
relationships using the Fama and French (1997) industry classification scheme. Firms in the
automobile and aerospace industries are represented both in the supplier list and the customer
list, indicating that large within-industry sales relationships are common in these sectors. Other
industries in this panel reflect natural vertical supply relationships. For example, the fact that the
apparel industry is on the supplier industry list and retailers are on the customer industry list is
consistent with the common dependence of apparel manufacturers on sales to large retailers.9
8 Firm age is the number of years since the firm was first listed on Compustat. R&D intensity is a firm's annual R&D expenditures divided by total assets, where missing values for R&D are treated as zero. The Market-to-book ratio (MB) is calculated as (total assets - book value of equity + market value of equity) / total assets. Both R&D intensity and MB are winsorized at the 1% and 99% level. 9 The firm in our sample that is a major customer to the highest number of suppliers is Wal-Mart. Interestingly, Wal-Mart never takes a 5% equity block in any of the 292 suppliers who identify Wal-Mart as a major customer.

14
Lastly, in panel C of Table I we report statistics on multiple relationships. Our figures
here indicate that this phenomenon is quite common. In particular, more than one third of the
sample supplier-years (customer-years) are cases where the firm is a supplier (customer) in
another relationship in that same year.
3.3 Ownership and Alliances
Most of the variables we use in our analysis are collected directly from the Compustat or
CRSP files. However, these data sources do not contain information on ownership or alliances.
To gather ownership information, we use the Compact Disclosure database. This data source
reports information on 5% blockholders collected directly from proxy statements and other
federal filings for virtually all publicly traded U.S. firms from 1988 onwards.10 For each
relationship, we use the Compact Disclosure disks to determine whether the customer is ever
listed as a 5% blockholder in the supplier. If it is, we record the size of the blockholding each
year and supplement this with information collected directly from the supplier firm's proxy
statements. Our rules for combining and coding the ownership data from Compact Disclosure
and proxy statements are detailed in the Appendix. Our final data set includes information on
whether the customer owned equity in the supplier and, if so, the size of the equity stake around
the end of each fiscal year. By adding the requirement that a supplier is listed on Compact
Disclosure, our final sample size falls slightly to 10,211 relationships.
To gather information on alliances, we select the first year that a relationship appears
during our sample period and search for whether the firms were listed together in the Securities
10 For more details on Compact Disclosure, see Anderson and Lee (1997). We use two disks a year from January 1988 to January 2003. Consistent with very broad coverage, we lose very few observations (less than 3%) when we add the restriction that the supplier must be listed in Compact Disclosure.

15
Data Corporation (SDC) strategic alliance database at any point in time from 1980 up to 365
days after the end of this fiscal year. The SDC database begins listing alliances in 1980, and the
comprehensiveness of their coverage appears to increase starting in 1985. Thus, we believe that
we should detect most instances in where relationships are accompanied by alliance agreements.
3.4 Characteristics of Customer-Supplier Relationships
We present basic information on sample relationships in Panel A of Table II. The mean
(median) value for the fraction of the supplier's sales made to their customer is 19.23%
(13.73%). As one would expect given our data collection procedures, this confirms that we have
selected relationships where the supplier sells a substantial fraction of their output to a single
customer. A fairly small fraction (5.09%) of sample relationships entail an alliance agreement,
indicating that intense trading relationships often exist without formal alliance-type contracts.
The figures in the table indicate that a majority of relationships involve firms in different
industries, even when industries are categorized at the coarse 1-digit or 2-digit SIC code level.
Finally, we report in Panel A of Table II evidence that there is substantial heterogeneity in the
estimated duration of trading relationships. Many relationships are quite short lived (25 percent
last only one year), but a fair number last for many years (25 percent last 6 years or more).11
In Panel B of Table II we report figures on equity ownership. We define a relationship to
have had an equity stake if the customer owned a block in the supplier at some point in the
relationship during the sample period. In almost all cases where there is an equity stake, the
11 Relationships first observed in 1978 (the first year customers are reported) are excluded from the duration calculation since the starting year for the relationship cannot be observed. Relationship duration is calculated by estimating the distribution of survival times using the Kaplan-Meier product limit estimator.

16
ownership position appears early on in the relationship.12 As we report in the table, equity
ownership by customers in their suppliers is the exception rather than the rule. In fact, in only
3.31% of our trading relationships do we observe the customer holding a 5% block of the
supplier's equity. Thus, while we have a sample of suppliers who are either moderately or highly
dependent on certain large customers, it appears that many of these relationships flourish without
the need for the customer to purchase equity in the supplier.
The overall sample rate of equity participation of 3.31% is significantly lower than what
is reported in prior studies. This suggests, not surprisingly, that the sampling procedures in these
studies result in samples where equity ties are relatively more important than for the typical
public firm. However, our overall rate of equity ownership is also much lower than recent
figures reported by Barclay, Holderness and Sheehan (2003) and Field and Sheehan (2003) for
block ownership rates in public corporations. To reconcile these findings and confirm the
validity of our data collection procedures, we selected 100 random suppliers in our sample in
1995 and inspected all available machine-readable proxy statements. Similar to Barclay,
Holderness, and Sheehan (2003), we find that just over 30% of these suppliers have blocks held
by other corporations (32.6%), with approximately half of these blocks held by non-financial
firms. However, the proxy statements confirm that we correctly identified each customer's status
as a blockholder in the selected supplier. This evidence indicates that while many firms have
blocks of stock held by other corporations, a relatively small number of these blocks are between
firms with significant trading relationships.
Turning to ownership rates for selected subsamples, we report in Panel B of Table II
some initial evidence consistent with the hypotheses outlined in our introductory sections.
12 In 93% of all relationships we observe an equity stake in the first or second year of the relationship. Our results are qualitatively unchanged when we restrict attention to equity stakes that exist early in the relationship.

17
Consistent with the contracting hypothesis, we find that suppliers with high R&D intensity (i.e.,
R&D intensity above the sample median) are significantly more likely to have equity stakes held
by customers compared to low R&D intensity suppliers. In addition, relationships where the
customer is responsible for a large (greater than median) fraction of the supplier's sales are also
characterized by a higher frequency of equity stakes. Finally, there is a significant difference
between relationships with an alliance agreement and relationships without such an agreement.
The magnitudes here are particularly large. We find that 19.23% of all relationships that are
accompanied by an alliance have an equity stake, compared to 2.46% for all other relationships.
Other interesting comparisons are also reported in panel B of Table II. We find that
younger suppliers are more likely to have an equity stake held by the customer, while firm size
does not appear to be related to the likelihood of a stake. If younger firms have greater
information problems, the difference across age groups could be interpreted as broadly consistent
with the financing frictions hypothesis. More convincing evidence is provided when we divide
the sample into suppliers that have negative and positive free cash flow, where free cash flow is
defined as operating earnings plus depreciation minus capital expenditures. Here we find that
customers with negative free cash flow are more likely to have customers with equity stakes.
3.5 The Establishment of Equity Stakes
Before turning to modeling the equity stake decision, it is informative to investigate how
these stakes are typically established. To determine this, we performed news searches in the
Factiva.com news sources (newspapers, newswires, magazines, etc.) The results of this analysis
are described in Table III. Approximately two-thirds of the observed equity stakes appear to be
related to either a formal or informal business arrangement, e.g., anticipated cooperation on

18
activity of mutual interest, establishment of supply contract, signing of a licensing agreement,
etc.13 Less common ways these stakes arise are through carve-outs of formerly wholly-owned
divisions, as consideration in asset sales between parties, and as pre-emptive purchases to
prevent third-party takeovers. The anecdotal evidence here suggests that equity stakes are not
typically merely coincidental to trading relationships, but serve a role in maintaining them. In
Section 5, below, we investigate the link between equity stakes and relationship maintenance in a
more quantitative fashion.
4. Models of Equity Stakes
4.1 Determinants of Equity Stakes in Customer-Supplier Relationships
The univariate statistics we discuss above are broadly consistent with the contracting and
financial frictions hypotheses. However, since many of the variables are correlated, a
multivariate analysis is called for. Our approach here is to estimate logit models where the
dependent variable takes a value of one if a relationship is characterized by an equity stake and
zero otherwise. All of the explanatory variables are measured as of the first year during the
sample period that we observe the relationship. To account for possible changes in ownership
patterns over time, all models include a year trend.
In column 1 of Table IV we report results for a simple specification that includes the
supplier's R&D intensity and the fraction of the supplier's sales to the customer (sales
dependence) as explanatory variables. We do not have explicit data on the nature of each trading
relationship, so we assume that suppliers with high levels of R&D are more likely to be involved
13 In the majority of these cases (76%), news articles indicate that the stake was established in direct connection with the signing of some type of explicit agreement. In the remaining cases we find more limited evidence that the ownership position is related to a business relationship or explicit contract.

19
in R&D focused trade with the customer. The estimates on the R&D variable and the sales
dependence variable in column 1 are both positive and highly significant. Since we expect
contracting frictions to be elevated in R&D focused relationships and in arrangements where the
supplier is dependent on the customer, these findings provide initial support for the contracting
motivation for the use of partial equity stakes.
In column 2 of Table IV, we add the strategic alliance dummy variable. As we report in
the table, the coefficient on this variable is positive and highly significant. This indicates that
extensive formal contracts (i.e., alliances) and partial equity ownership are complements rather
than substitutes. As was discussed earlier, this is consistent with equity ownership easing
contractual frictions in arrangements where firms make important relationship-specific
investments and/or where there is significant scope for incentive conflicts to arise over time.
Given the correlation between the variables, it is not surprising that inclusion of the alliance
variable lowers the estimated coefficients on the R&D variable and the sales dependence
variable. However, they remain positive and significant at the 1% level. Thus, while prior
studies typically restrict attention to firms with alliance agreements, our evidence suggests that
contracting frictions play a role in determining ownership structure even in relationships not
governed by such an agreement.
One may be concerned that our contracting frictions variables are correlated with other
characteristics, such as the supplier's size or age, that are not as clearly related to the theory. In
column 3 of Table IV, we add these variables to the specification. The coefficient on age is
negative and significant, indicating that younger firms are more likely to have equity stakes held
by their trading partners. Surprisingly, the coefficient on firm size is positive and significant.
This suggests that, holding all else equal, larger firms are more likely to have equity blocks held

20
by their product market partners.14 The coefficients on the variables related to contractual
frictions maintain their signs and significance levels with these added controls.
Turning to financial market frictions possibilities, we include in column 4 a dummy
variable that assumes a value of one when a firm has a cash flow that is insufficient to cover its
capital expenditures (negative free cash flow). These are firms who are likely to need external
funding and may turn to their partners for financing if other sources of capital are relatively
expensive. Consistent with this conjecture, the estimated coefficient on this variable in column 4
is in fact positive and significant. This finding lends substantial support to the financial-frictions
motivation for the presence of partial equity stakes.
To investigate the role of other variables that may represent capital market frictions, we
include variables related to the supplier's stock return volatility (a proxy for asymmetric
information), the supplier's leverage ratio (a proxy for financial constraints), and a dummy
variable indicating whether the supplier pays dividends (indicating a lack of financial
constraints). The estimates on the volatility measure and the dividend measure are small and
insignificant, while the estimate on the leverage ratio is significant and negative, opposite of the
expected sign. We are hesitant to infer much from the leverage coefficient, because leverage is
endogenous and borrowing may serve as a substitute for customer equity financing. Clearly
these additional variables add no additional support to the financial frictions hypothesis.
To summarize our evidence here, it appears that the existence of a financial deficit is
related to partner financing. However, further distinctions based on the severity of financial
constraints or information problems cannot be easily detected. We interpret this evidence as
14 We are hesitant to put too much weight on the size coefficient, as the univariate results in Table II reveal no significant difference in equity ownership between small and large firms. We experimented with using sales rather than assets as a measure of size (and as a normalizing variable), but this had no substantive effect on any of the coefficient estimates. Supplier size could proxy for mutual dependence between the supplier and the customer.

21
broadly consistent with the financial frictions hypothesis, with the caveat that the types of
frictions and the mechanism by which they lead to partner financing are quite murky.
To gauge the economic magnitude of our estimates, we select the specification in column
4 of Table IV as our baseline model and calculate the effect of changing the explanatory
variables on the implied probability of observing an equity stake. In these calculations, we vary
the explanatory variables, one at a time, from the 10th percentile level to the 90th percentile level
for scalar variables, and from zero to one for dummy variables. All other variables are held
constant at their sample mean. For the R&D variable, the estimated likelihood of observing an
equity stake increases from 1.8% to 2.9%. The corresponding figures for the sales dependence
variable are 1.6% and 3.0%. Relationships without alliances have a 1.9% estimated likelihood of
observing an equity stake, increasing to 8.2% when there is an alliance. These figures indicate
that the likelihood of observing an equity stake seems to rise sharply (in a relative sense) as our
measures of contracting frictions and the likelihood of relationship-specific investment increase.
The other estimates in specification 4 of Table IV also seem to have reasonably large
economic magnitudes. As firm age moves from the 10th percentile to the 90th percentile, the
estimated probability of observing an equity stake declines sharply from 3.9% to 0.6%. When
we turn to firm size, the figures are 1.1% and 4.6%. Finally, when suppliers move from positive
free cash flow to negative free cash flow status, the estimated likelihood of observing an equity
stake jumps from 1.6% up to 2.6%. This increase suggests that financial constraints play an
economically significant role in the decision to obtain partner financing.
4.2 Robustness and extensions

22
The results above support both the contracting and financial frictions motivations for the
use of partial equity ownership stakes in product market relationships. In this subsection we
experiment with some alternative empirical specifications in order to assess the robustness of
these findings and to further add to our understanding of the partial equity stake phenomenon.
We select specification 4 of Table IV as our baseline model and experiment with alterations to
this model.
One concern with the findings above is that they may be driven by a certain industry or a
small set of industries. For example, much of the related empirical literature focuses on the
pharmaceutical sector, and it is possible that what we are finding is being driven by that industry.
To investigate, we experiment with (a) dropping all pharmaceutical firms, and (b) including
industry dummy variables (using Fama and French (1997) industry definitions). These
alterations to our baseline model have no effect on the signs or significance levels of any of the
explanatory variables included in Table IV.
In some cases we first detect a relationship when the supplier initially appears on
Compustat, while other relationships appear later in a supplier's life. In the former case the
parties are likely to have had a significant level of trade before the supplier's initial public
offering (IPO), and one may suspect that equity ties are more common in these cases. To
investigate, we create an IPO dummy variable indicating whether a relationship exists in the first
year a supplier appears on Compustat. When we add this variable to our baseline model, the
estimate is small, positive, and insignificant, and the other estimates are qualitatively unchanged.
This suggests that there is nothing unique about equity ties that are established before the IPO.
We also experiment with excluding all relationships that existed in our first sample year, 1988,

23
as our variables for these relationships typically are measured at a later stage in the relationship's
existence. This exclusion has no substantive effect on any of our coefficient estimates.
As an extension to our analysis, we also consider the role of customer characteristics.
Our approach here is to replace the age, size, R&D, and free cash flow variables in our baseline
model (column 4, table IV) with the corresponding variables based on customer characteristics
(estimates not reported).15 The estimated coefficients from this model for the customer's age and
size variables are small and insignificant. The coefficient on the customer's R&D intensity is
positive and significant at the 5% level. Since supplier R&D intensity and customer R&D
intensity are both likely to proxy for R&D focus, this finding adds additional support to the
hypothesis that R&D focused relationships are more frequently accompanied by equity
ownership. Finally, the coefficient on a dummy variable indicating whether the customer has
positive free cash flow is positive and significant at the 10% level (p-value = .073). Consistent
with a generalized version of the financial frictions hypothesis, this provides some suggestive
evidence that deep pockets are necessary for informed sources of capital to be the optimal
financiers of financially constrained partners.
4.3 Multiple Relationships
A striking feature in the data that we noted above is that firms are often involved in
multiple trading relationships. It seems quite possible that the presence of other partners may
change the bargaining dynamics in any given relationship, which in turn may change the need for
15 We also experiment with including both the supplier and customer characteristics together in one regression. The results were quite similar to what we report above. If we add a variable indicating the customer's dependence on the supplier (amount purchased/cost of goods sold), the estimate is small and insignificant. We suspect that customers are too large for this variable to be meaningful.

24
equity ownership.16 For example, a supplier with multiple relationships may be less dependent
on any single customer, and thus an equity tie may be less important. To investigate, we
experiment with including in our baseline model a dummy variable indicating whether a supplier
is involved in more than one relationship during the observation year (estimates not reported).
Given the time-varying nature of this variable, all regressions concerning multiple relationships
are run at the relationship-year level rather than the relationship level.
When we estimate this model, the estimated coefficient on the multiple-relationship
variable is negative and significant at the 1% level. Holding other variables at their means, the
implied probability of a given customer holding a stake in the supplier drops from 2.55% to
1.56% as a supplier moves from single to multiple relationships. These figures suggests that the
likelihood a supplier gets financing from at least one customer is relatively independent of the
number of customers they have, but the probability of getting financing from any given customer
decreases once they have more than one major customer.17
This effect of multiple relationships on equity stakes could reflect a variety of
phenomenon. It could be that once a single customer has taken an equity stake, the other
customers can free-ride off of this customer's financing or monitoring capabilities. Alternatively,
it may be when there are multiple customers, there is some strategic interaction between
customers resulting in an outcome where either all customers have equity stakes or else none do.
To examine these possibilities, we estimate our baseline model restricted to cases where
suppliers are in multiple relationships. We include in this model a dummy variable indicating
16 It may be that potential for other trading opportunities affects the dynamics of a given relationship and the likelihood of observing an equity tie. However, when we include in the baseline model sales-based 4-digit SIC Herfindahl indices, they are insignificant and do not materially change the other coefficient estimates. 17 Confirming this intuition, when we run our baseline model treating each supplier (rather than each relationship) as the unit of observation, the estimate on the multiple relationship dummy variable is insignificant.

25
whether or not any other customer has an equity stake. The coefficient (estimates not reported)
on this variable is positive and significant (1% level), implying that the likelihood of taking an
equity stake increases from 1.10% to 8.12% when another customer holds equity. This suggests
that customers do pay close strategic attention to other customer's equity purchase decision.
Alternatively, we may be picking up unobserved supplier-specific characteristics. Either of these
possibilities is consistent with a generalized version of our contracting hypothesis. In any event,
the data here do not support a simple free-riding type story with regard to multiple relationships.
The presence of a large number of multiple relationships provides us with an opportunity
to revisit our earlier tests predicting equity stakes. In particular, it allows us to hold supplier
characteristics constant and then to predict which of the supplier's multiple partners takes equity.
To conduct this analysis, we use Chamberlain’s (1980) fixed effects (conditional) logit approach.
Specifically, we restrict attention to the subset of cases where the supplier has multiple
relationships in which at least one customer has a stake and at least one does not, and then we
estimate models predicting which customer has the ownership position (estimates not reported).
We include in these models the year each relationship started, the sales dependence of the
supplier on the customer, and a dummy variable for formal alliances. We then add the following
customer characteristics: R&D intensity, age, size (log assets), and a negative free cash flow
dummy variable. The coefficients on supplier sales dependence, customer R&D intensity, and
alliance variable are all positive and significant (1%, 5%, and 10% level respectively). The
customer cash flow dummy, while negative, is insignificant. These estimates are consistent with
our earlier findings that R&D intensity, sales dependence, and alliances are all positively related
to the equity stake decision, lending further support to the contracting hypothesis.

26
4.4 Equity Stakes and Formal Alliances
Our preceding results are consistent with equity ownership easing contractual frictions in
certain types of relationships. As we report above, the connection between alliances and equity
stakes is particularly strong. Since alliances themselves can be viewed as form of relationship
governance, it is informative to further investigate the link between these two governance
devices.
First we investigate whether alliances can be predicted based on relationship
characteristics. To accomplish this, we estimate our baseline model with an alliance dummy
rather than a partial equity stake dummy as the dependent variable. Interestingly, as we report in
column 1 of Table V, many of the factors that increase the likelihood of observing an equity tie
also increase the likelihood of an alliance. In particular, the estimated coefficients on R&D
intensity, sales dependence, and the negative cash flow dummy variable are all positive and
highly significant.18 This suggests that alliances and partial equity stakes are both chosen to
solve similar types of contracting and financing problems.
In column 2 of Table V we return to predicting equity stakes, but we restrict attention to
relationships that are not formalized by an alliance. The results here are informative. The
coefficients in column 2 are very similar to our earlier baseline model estimates. In particular, in
the absence of alliances, there is a strong relationship between equity stakes and R&D intensity,
sales dependence, and the negative cash flow dummy. This confirms that our earlier results on
equity stakes hold independent of the alliance effect.
18 Our results on the connection between R&D and the likelihood of an alliance complement the evidence of Chan, Kensinger, Keown, and Martin (1997) who report that abnormal returns in R&D/technology related alliances are particularly large in their sample of alliance agreement announcements.

27
Turning now to relationship with alliances, the estimates for this subsample are reported
in column 3 of Table V. Note that the subsample here is similar to those in prior studies that
choose samples based on the existence of an alliance or similar agreement (e.g., Pablo and
Subramaniam (2002)). The coefficient estimate on the supplier dependence variable in column 3
is positive and highly significant. This adds further to our evidence that equity ties are closely
related to the dependence of the supplier on the customer. However, the estimated coefficients
on R&D intensity and the cash flow variable in this column become insignificant. This is
perhaps not too surprising, as the sample of alliances is small and there is little variation in these
two explanatory variables once we restrict attention to alliances.
Taken as a whole, our evidence here suggests that alliances and equity stakes are
frequently observed together, and thus they can be viewed as complements at solving underlying
contractual issues. However, since it is also common to observe alliances without equity and
equity without alliances, there is clearly an independent dimension to each governance
mechanism. Even without the presence of an alliance, the variation in equity stakes appears
highly consistent with the notion that these positions help alleviate underlying contractual and
financing difficulties.
4.5 The Size of Equity Stakes
Our preceding analysis of the presence of equity blocks appears highly consistent with
idea that contracting problems and financing frictions lead to equity investments by product
market partners. We now turn to examining the size of observed equity blocks. As we discuss
earlier, the relationship between contracting problems and the size of blocks is less clear. In

28
particular, in delicate contracting environments there may be a dark side to high levels of equity
ownership arising from fears about excessive control or diluted incentives.19
To investigate this issue, we first we divide the entire sample into three groups: the no
ownership group (no disclosed block), the moderate ownership group (ownership in the 5%-25%
range), and the high ownership group (ownership > 25%).20 Summary statistics for each group
are reported in Panel A of the Table VI. The differences between the no ownership group and
the moderate ownership group are large and similar to our earlier comparisons between
relationships with and without equity ties. In particular, the moderate ownership group has
significantly higher average values for the variables measuring R&D intensity, sales dependence,
alliances, and financing needs. In contrast, the high ownership group actually looks more similar
to the no ownership group than to the moderate ownership group on these dimensions. These
simple comparisons suggest that contracting problems and financial frictions are more related to
moderate equity stakes than to large equity stakes, which in turn suggests that the mechanism
governing the size of equity stakes is different from that which governs the presence of a stake.
To further explore this issue, we present in Panel B of Table VI figures on the average
size of ownership stakes grouped by firm and relationship characteristics. The figures in the first
column are calculated over only those relationships where there is at least some disclosed
ownership. Here we see that our variables related to R&D intensity, sales dependence, alliances,
and external financial needs are negatively related to the size of ownership stakes. However, if
we look at all relationships, most of which have no disclosed ownership, the figures in the
second column suggest that these same variables are positively related to ownership levels. The
19 See Fee (2002) for an examination of this issue in the context of motion picture financing. 20 Our choice of 25% to define high ownership is somewhat arbitrary but follows the convention first developed by Morck, Shleifer, and Vishny (1988). Control issues are likely to become important at around this ownership level.

29
natural explanation for these findings is that these variables are positively related to the presence
of a stake, as we document in our earlier analysis, but negatively related to the size of a stake
conditional on observing one. In the overall sample the first effect dominates the second.
Turning to a multivariate analysis, we present estimates from several different empirical
models in Table VII. In column 1, we estimate a Tobit model where the ownership level is the
dependent variable and relationships with no ownership are treated as censored at the 5%
ownership level. The results here are similar to our earlier analysis predicting the presence of an
equity stake. This indicates that the factors associated with the presence of an equity stake also
are associated with the size of the stake in an unconditional sense. In column 2, we run an
ordinary least squares regression explaining the size ownership positions restricted to
observations where there is some ownership (a conditional analysis). Here, the picture is quite
different. With the exception of the size and year variables, all of the explanatory variables have
opposite signs to what we observe in column 1, and in some cases they are significant. Thus,
conditional on the existence of an equity tie, the mechanism governing the size of the stake is
almost the opposite of that which governs the stakes presence.21
To present a reasonable unconditional picture of ownership positions, we consider a
multinomial logit model predicting which of the three ownership groups (no, moderate, and
high) a relationship will fall into using our usual set of explanatory variables. The estimates in
column 3 of Table VII, which indicate the relative likelihood of observing moderate ownership
rather than low ownership, are again similar to what we found earlier when we predicting equity
21 As discussed by Greene (1993, p. 700) and Wooldridge (2002, p.536), there are many economic contexts where a significant difference in the mechanism governing closely related variables arises, in this case the presence and size of equity stakes. The Tobit model implicitly assumes that this difference is not substantial.

30
stakes using logit models. Thus, the evidence is quite strong that our contracting and financial
frictions variables are significantly related to the decision to take on a moderate equity stake.
When we turn to column 4, which indicates the relative likelihood of observing moderate
ownership rather than high ownership, the results have a different character. The estimated
coefficients on R&D intensity, sales dependence, alliance, and negative cash flow variables are
all positive, and the latter three significantly so (10%, 1%, and 1% levels respectively). This
indicates that when contracting and financing frictions are elevated, it more likely that we will
observe moderate ownership rather than high ownership.
Taken as a whole, our evidence on the size of ownership stakes presents a picture where
factors that we associate with high levels of contractual difficulties and financial frictions lead to
relationships where a customer takes a moderate stake in its supplier. The presence of high
ownership in relationships appears to be much less driven by these factors, if at all. This
evidence is consistent with moderate ownership stakes being chosen in order to delicately
balance incentives between trading parties and to provide financing to financially constrained
suppliers without ceding control. The data are less informative on the factors driving the
presence of larger ownership blocks where control is likely an important issue.
5. Equity Ownership and the Dynamics of Relationships
5.1 Equity Ownership and the Duration of Trading Relationships
Our preceding analysis assumes that equity investments are the outcome of an optimizing
process where firms choose this organizational form when the expected benefits are particularly
high. The systematic variation we uncover certainly does suggest that trading partners anticipate
that block ownership will have a real effect on the dynamics of their relationship. To

31
complement this analysis, it is informative to consider whether any of the anticipated effects of
block ownership manifest themselves after the formation of the block. However, measuring
these effects is difficult, as they are likely to appear in variables that are inherently difficult to
observe (pricing decisions, investment in relationship-specific assets, information sharing, etc.).
As a more modest goal, we consider whether block equity ownership has an effect on
relationship durability. If ownership has the effect of easing contractual frictions and
encouraging cooperation, we would expect relationships with partial ownership, all else equal, to
last longer on average.
To examine this issue, we use duration analysis techniques (see Kiefer (1988)). These
techniques estimate a hazard function describing the length of a typical relationship.
Importantly, the estimation procedures can adjust for the fact that for some relationships we
know exactly how long the relationship lasts, while for others our information is more limited
(but still useful) because of censoring. To accomplish the estimation, we define the start year
(end year) of each relationship to be the first year (last year) the two firms are linked together in
the Compustat files.22 In cases where we can confirm that both firms are still listed on
Compustat immediately after the end year, we assume that the relationship's completed length is
equal to end year minus start year. In the remaining cases, we lose the ability to detect a
relationship's status after some year because one of the two firms disappears from Compustat. In
these cases, we record the relationship's censored length as end year minus start year. Here we
know that the relationship lasted at least as long as the censored length.
22 Our sample includes all relationships in existence between 1988 and 2001. Because of this, relationships in existence as of the start of the sample period will be biased towards longer length relationships. To account for this, when an observation enters the sample with a tenure of n, our estimation adjusts for this delayed entry by using this observation only to make inferences about the hazard function in the region pertaining to a tenure of n or more.

32
In columns 1-4 of Table VIII we present estimates from proportional hazards type
models. These models jointly estimate an underlying hazard function and the role of selected
explanatory variables in proportionally shifting the hazard function. A coefficient above one
(below one) implies that the indicated variable shifts the hazard function upwards (downwards),
thus indicating that the variable decreases (increases) average relationship length. In column 1
we present estimates from the Cox proportional hazard model with ownership as the only
explanatory variable. This model places no parametric structure on the hazard function, but it
allows the explanatory variables to shift the function up or down in a parametric way. The
estimated coefficient on the ownership dummy variable in this model is significantly less than
one at the 1% level. This provides strong initial evidence that relationships accompanied by
equity ownership tend to have lower hazard functions and, consequently, longer average
durations.
In column 2 of Table VIII we estimate the same model but add our usual set of
explanatory variables. We also add a quadratic term for sales dependence, since the requirement
that firms report customers who are responsible for 10% of sales is likely to generate some
nonlinearities with respect to this variable.23 The estimated coefficient on ownership in this
model remains significantly below one at the 5% level, again indicating that ownership is
associated with more durable relationships. Many of the other explanatory variables are also
significantly different from one. This suggests that there is substantial systematic variation in
how long relationships last. For example, the estimated coefficient on R&D, which significantly
23 Results are substantively unchanged if we use sales dependence quartiles rather than a quadratic. Many relationships that we deem to have "ended" are likely to be situations where sales fall below the 10% threshold. Our duration results are still informative, as the length of an intense trading partnership is an important quantity in its own right, and, we suspect, highly correlated with the length of time the two parties have any significant trade.

33
exceeds one, indicates that relationships with an R&D focus are typically shorter lived than
others.
To confirm these results in a more parametric framework, we also estimate models that
assume the hazard function follows the (fairly flexible) Weibull distribution. These results,
which we report in columns 3 and 4 of Table VIII, are even stronger than our prior results based
on the Cox model. The coefficient on ownership in both specifications is significantly below one
at the 1% level. All of the other control variables, with the exception of the year variable, have
similar interpretations and significance levels to the earlier Cox model estimates.
Finally, we consider a more traditional model that treats the relationship-year as the unit
of observation rather than the relationship. Our approach here is to estimate logit models
predicting whether a relationship breaks up in a given year as a function of whether the firms had
an equity tie at some point in the past. All other explanatory variables are measured as of the
start of the year. We include in these models the tenure of the relationship as of the start of the
year, as relationships with longer past tenures may be more durable in the future. We report
estimates from this type of model, with and without the full set of control variables, in columns 5
and 6, respectively, of Table VIII. In both specifications, the coefficient on the ownership
variable is negative and highly significant. This indicates that a relationship where there has
been an equity tie at some point in the past is significantly less likely to break up in the
subsequent year than relationships without equity. If we hold all control variables at their sample
means, the estimates in column 6 imply that the annual probability of a breakup for a relationship
without equity is 24.11%, falling to 18.41% when there has been an equity tie.
Taken as whole, the evidence here appears fairly convincing that the presence of equity
ownership is associated with longer-lived relationships, even when we control for factors that

34
govern the ownership choice. A natural interpretation of this finding is that an ownership tie
helps ease contracting frictions and disagreements, thus nurturing the relationship and allowing it
to last for a longer period of time. If one wants to be more cautious with regard to causality, at
the very least we can view this as another piece of evidence indicating that ownership is elevated
in situations where contracting frictions are expected to be magnified (i.e., in longer
relationships).
5.2 Equity Ownership and Mergers
An alternative way for an independent trading relationship to end is for the trading parties
to merge. Our preceding analysis implicitly assumes that partial equity ownership is a unique
form of relationship governance that is at times preferable to full vertical integration. Certainly
much of the variation in the data appears consistent with this view. However, it is possible that
equity stakes are typically just a step in a dynamic process of full integration.
To explore the connection between ownership and integration, we use the SDC mergers
and acquisitions database to determine whether the two parties in each of our 10,211 customer-
supplier relationships eventually merge together. Interestingly, we find that only 55 of these
relationships (.54%) end in a merger. Thus, it appears that intense trading relationships only
rarely result in mergers. In the subsample of relationships with an equity tie, the propensity to
eventually merge climbs to a still modest 7.10% (24 out of 338).24 Thus, while equity
investments are occasionally preludes to outright integration, in the vast majority of cases they
24 Many of these mergers (almost half) are reverse carveouts. These are usually high-ownership relationships where our models above (see Table VII) offer only weak evidence on the role of contracting and financial frictions in the equity investment.

35
are not. This helps confirm our assumption that we are studying a unique form of relationship
governance that is quite different from full vertical integration.
6. Conclusion
We study the causes and consequences of the decision to take an equity stake in a trading
partner by examining blockholdings by customers in their suppliers. We find that in most
relationships, there is no such equity investment, indicating that it is often the case that intense
trading partnerships can be effectively governed without equity participation. However, the
presence of an equity stake does systematically vary with several explanatory variables,
suggesting that equity can at times play a role in relationship governance.
Our results indicate that factors related both to contractual incompleteness and financial
market frictions are related to the equity stake phenomenon. With regard to contracting related
problems, we find that the likelihood of an equity stake is strongly positively related to whether
the supplier is an R&D intensive firm, whether a large fraction of the supplier's sales are made to
the customer, and whether there is a formal alliance agreement between the trading partners. We
argue that these findings are consistent with equity ownership easing contractual frictions that
arise in a world of incomplete contracts where trading parties are concerned about possible
expropriation problems and incentive conflicts arising over time.
With regard to financial frictions, we find that suppliers who are cash constrained in the
sense that they exhibit negative free cash flow are more likely than other firms to have equity
blocks held by their major customers. This suggests that part of the equity stake phenomenon
reflects behavior where customers serve as informed sources of capital to ease financial
constraints at the supplier level. However, other variables that may be related to supplier

36
financial constraints, for example stock return volatility and the payment of a cash dividend, do
not appear to be related to the presence of equity holdings.
When we examine the size of customers' equity holdings in their suppliers, we find that
many of the factors that affect the likelihood of observing the presence of a block do not affect
the size of a block if it is observed, and several factors even have opposite signs. This suggests
that there are limits to equity ownership, perhaps because suppliers are concerned about
customers having too much control over their operations if the customer's stake grows beyond a
certain level. Thus, in settings where incentives must be delicately managed, notably
relationships entailing high levels of R&D, a large fraction of supplier sales to the customer, or
explicit alliance agreements, it appears that an equity stake is more likely to be established, but
the size of the stake will be moderate.
Finally, we find that partial equity stakes are associated with longer-lived relationships.
However, outright mergers between customers and suppliers are rare, even when there is an
equity tie. These findings suggest that ownership has a real effect on the dynamics of trading
relationships, providing firms with a valid motivation to consider carefully the costs and benefits
of adopting this organizational form.
Taken as a whole, our evidence is consistent with the general notion that tensions exist in
close trading relationships and with the specific idea that equity at times can play a role in
alleviating these tensions. In addition, our results on financial frictions add to the literature
suggesting that external capital market imperfections can influence financing choices.
Identifying the precise mechanisms through which partial equity stakes alleviate contracting and
financing problems is a potentially interesting topic for future research.

37
Appendix
Our initial source of ownership data is the Compact Disclosure CDs. We examine 2 CDs per year, one near the start of each calendar year (usually January) and one near the middle of the year (typically July). In any CD where the customer is listed as owning a block in the supplier, we record the indicated size of the block (when available) and the date of the filing. Over 95% of these filings are from a firm's annual proxy statement. We then match the ownership data with the most recent fiscal year end that precedes the filing date, unless the filing date precedes the fiscal year end by less than 10 days, in which case we match the ownership data with the fiscal year end that follows the filing date.
If our first procedure reveals that the customer ever has an equity stake in the supplier, we also examine the blockholder section of the firm's proxy statement in the Lexis/Nexis database for all available years. This database is fairly comprehensive starting in the early/mid 1990s, but coverage is sparse in the late 1980s. Using the same timing conventions to match proxy filings with fiscal years, we use ownership data from these electronic filings to supplement the information from the Compact Disclosure CDs. We record the ownership percentage number listed in the blockholder table, with no special adjustments for any considerations noted in the footnotes. In cases where our two data sources indicate different ownership percentages, we choose the number in the proxy over the number in Compact Disclosure unless the proxy lists no ownership by the customer, in which case we use the Compact Disclosure figure. Fortunately, the overlap between the two data sources is quite high. Occasionally these data sources differ in the timeliness of their information, and sometimes they differ in how they record special equity like claims such as convertibles or warrants. We believe our procedures provide a practical way to collect reliable information on ownership for a large set of firms.
There are a few cases where either Compact Disclosure or the proxy statement indicates that a customer is a blockholder without indicating the size of their stake. These blocks are often accompanied by text explaining the nature of the stake, often with certain option like features to them. We code these relationships as having an equity tie, but we do not record or use the size of the equity stake in our analysis. In the few cases where firms have two classes of voting stock, we record from the proxy the percentage of equity held by the blockholder for the class that corresponds to the Compact Disclosure record, or, when this is not available, the percentage of shares held of the class with most shares outstanding. Consistent with the observations of Anderson and Lee (1997), we find that Compact Disclosure usually records ownership numbers for this class.

38
References Aghion, Philippe, and Jean Tirole, 1994, The management of innovation, Quarterly Journal of Economics 109, 1185-1209. Allen, Jeffrey, and Gordon Phillips, 2000, Corporate equity ownership, strategic alliances, and product market relationships, Journal of Finance 55, 2791-2815. Anderson, Ronald, and Scott Lee, 1997, Ownership studies: The data source does matter, Journal of Financial and Quantitative Analysis 32, 311-329. Barclay, Michael, Clifford Holderness, and Dennis Sheehan, 2003, Dividends and dominant corporate shareholders, Working paper, University of Rochester. Chamberlain, Gary, 1980, Analysis of covariance with qualitative data, Review of Economic Studies 47, 225-238. Chan, Su Han, John Kensinger, Arthur Keown, and John Martin, 1997, Do strategic alliances create value?, Journal of Financial Economics 46, 199-221. Dasgupta, Sudipto, and Zhigang Tao, 2000, Bargaining, bonding, and partial ownership, International Economic Review 41, 609-635. Fama, Eugene, and Kenneth French, 1997, Industry costs of equity, Journal of Financial Economics 43, 153-193. Fee, C. Edward, 2002, The costs of outside equity control: Evidence from motion picture financing decisions, Journal of Business, 75, 681-711. Fee, C. Edward, and Shawn Thomas, 2004, Sources of gains in horizontal mergers: Evidence from customer, supplier, and rival firms, Journal of Financial Economics, forthcoming. Field, Laura, and Dennis Sheehan, 2003, IPO underpricing and outside blockholdings, Journal of Corporate Finance, forthcoming. Gompers, Paul, and Josh Lerner, 2000, The determinants of corporate venture capital success: organizational structures, incentives, and complementarities, in R. Morck, ed.: Concentrated Corporate Ownership (University of Chicago Press, Chicago, Ill.). Greene, William, 1993, Econometrics (Prentice-Hall, Englewood Cliffs, NJ). Grossman, Sanford, and Oliver Hart, 1986, The costs and benefits of ownership: A theory of vertical and lateral integration, Journal of Political Economy 94, 691-719. Gulati, Ranjay, 1995, Does familiarity breed trust - the implications of repeated ties for contractual choice of alliances, Academy of Management Journal 38, 85-112.

39
Gulati, Ranjay, and Harbir Singh, 1998, The architecture of cooperation: Managing coordination costs and appropriation concerns in strategic alliances, Administrative Science Quarterly 43, 781-814. Hadlock, Charles, and Christopher James, Do banks provide financial slack?, Journal of Finance 57, 1383-1419. Harbaugh, Rick, 1990, Equity stakes and hold-up problems, Working paper, Claremont College. Hart, Oliver, and John Moore, 1990, Property rights and the nature of the firm, Journal of Political Economy 98, 1119-1158. Holderness, Clifford, and Dennis Sheehan, 1988, The role of majority shareholders in publicly held corporations: An exploratory analysis, Journal of Financial Economics 20, 317-346. Holderness, Clifford , and Dennis Sheehan, 2000, Constraints on large block shareholders, in R. Morck, ed.: Concentrated Corporate Ownership (University of Chicago Press, Chicago, Ill.). Holmstrom, Bengt, and John Roberts, 1998, The boundaries of the firm revisited, Journal of Economic Perspectives 12, 73-94. Kiefer, Nicholas, 1988, Economic duration data and hazard functions, Journal of Economic Literature 26, 646-679. Klein, Benjamin, Robert Crawford, and Armen Alchian, 1978, Vertical integration, appropriable rents, and the competitive contracting process, Journal of Law and Economics 21, 297-326. Lerner, Josh, Hilary Shane, and Alexander Tsai, 2003, Do equity financing cycles matter? Evidence from biotechnology alliances, Journal of Financial Economics 67, 411-446. Mathews, Richmond, 2003, Strategic alliances, equity stakes, and entry deterrence, Working paper, Duke University. Morck, Randall, Andrei Shleifer, and Robert Vishny, 1988, Management ownership and market valuation: An empirical analysis, Journal of Financial Economics 20, 293-315. Myers, Stewart, and Nicholas Majluf, 1984, Corporate financing and investment decisions when firms have information that investors do not have, Journal of Financial Economics 13, 187-221. Oxley, Joanne, 1997, Appropriability hazards and governance in strategic alliances: A transaction cost approach, Journal of Law, Economics, and Organization 13, 387-409. Oxley, Joanne, 1999, Institutional environment and the mechanisms of governance: The impact of intellectual property protection on the structure of inter-firm alliances, Journal of Economic Behavior and Organization 38, 283-309.

40
Pablo, Eduardo, and Venkat Subramaniam, 2002, When is equity more than just financing? Evidence from strategic alliances, Working paper, Tulane University. Pisano, Gary, 1989, Using equity participation to support exchange: Evidence from the biotechnology industry, Journal of Law, Economics, and Organization 5, 109-126. Riordan, Michael, 1990, Asset specificity and backward integration, Journal of Institutional and Theoretical Economics 146, 133-146. Riordan, Michael, 1991, Ownership without control: Toward a theory of backward integration, Journal of the Japanese and International Economies 5, 101-119. Robinson, David, and Toby Stuart, 2001, Just how incomplete are incomplete contracts? Evidence from biotech strategic alliances, Working paper, Columbia University. Santhanakrishnan, Mukunthan, 2003, The influence of complementarity on the performance of entrepreneurial companies, Working paper, Arizona State University. Van den Steen, Eric, 2002, Equity participation, hold-up, and firm boundaries, Working paper, Massachusetts Institute of Technology. Whinston, Michael, 2003, On the transaction cost determinants of vertical integration, Journal of Law, Economics, and Organization 19, 1-23. Williamson, Oliver, 1975, Markets and Hierarchies: Analysis and Antitrust Implications (The Free Press, New York, NY). Williamson, Oliver, 1985, The Economic Institutions of Capitalism (The Free Press, New York, NY). Wooldridge, Jeffrey, 2002, Econometric Analysis of Cross Section and Panel Data (MIT Press, Cambridge, MA). Wruck, Karen, 1989, Equity ownership concentration and firm value: Evidence from private equity financings, Journal of Financial Economics 23, 3-28.

41
Table I: Characteristics of Firms in Customer-Supplier Relationships
Panel A: Characteristics of Customer and Supplier Firms Median Mean Observations Supplier assets 65.84 649.59 10,493 Customer assets 12,216.49 35,909.13 9,398 Supplier assets/customer assets .0078 .8038 9,398 Assets of all Compustat firms 134.02 2,539.97 7,126 Supplier age 6.00 9.72 10,493 Customer age 30.00 27.89 9,398 Supplier age/customer age 0.29 0.76 9,398 Age of all Compustat firms 8.00 12.55 7,126 Supplier research & development (R&D) intensity .0108 .0723 10,493 Customer R&D intensity .0089 .0364 9,398 Supplier R&D intensity/customer R&D intensity 0.75 3.35 5,397 R&D intensity of all Compustat firms .0000 .0353 7,125 Supplier market-to-book ratio (MB) 1.65 2.60 10,457 Customer market-to-book ratio 1.46 2.08 8,968 Supplier MB/customer MB 1.05 1.56 8,936 Panel B: Incidence of Relationships by Firm Size and Industry Percentage Observations % Compustat observations identified as suppliers 16.78 101,523 % Compustat observations identified as suppliers, assets < $100 million 20.33 46,058 % Compustat observations identified as suppliers, assets > $10 billion 6.16 4,869 % Compustat observations identified as customers 7.17 101,523 % Compustat observations identified as customers, assets < $100 million 1.08 46,058 % Compustat observations identified as customers, assets > $10 billion 40.11 4,869 % Compustat observations identified as suppliers, apparel industry 45.24 1,333 % Compustat observations identified as suppliers, aerospace industry 45.22 387 % Compustat observations identified as suppliers, automobiles/trucks industry 37.98 1,285 % Compustat observations identified as suppliers, electronic equip. industry 36.81 5,137 % Compustat observations identified as suppliers, recreational prods. industry 35.82 980 % Compustat observations identified as customers, aerospace industry 24.03 387 % Compustat observations identified as customers, alcoholic bev. industry 19.18 318 % Compustat observations identified as customers, automobiles/trucks industry 18.44 1,285 % Compustat observations identified as customers, retail industry 17.12 4,709 % Compustat observations identified as customers, telecom. industry 13.68 2,808 Panel C: Multiple Relationships Percentage Observations % Supplier in multiple relationships 38.94 16,565 % Customers in multiple relationships 37.11 9,197
Note.- Customer and supplier firms are identified from the Compustat industry segment file. The sample period is 1988-2001 and all statistics are inflation adjusted to 2001 dollars. Each customer-supplier relationship is treated as a single observation in Panel A. Summary statistics for supplier and customer firms are based on firm characteristics in the first year that we observe the relationship during the sample period. The figures for all Compustat firms in Panel A are from 1993 which is the year near the middle of our sample period with the greatest number of new relationships. Assets are total book assets in millions of dollars. Firm age is the number of years since the firm was first listed on Compustat. R&D intensity is a firm's annual R&D expenditures divided by total assets, where missing values for R&D are treated as zero. The Market-to-book ratio (MB) is calculated as (total assets - book value of equity + market value of equity) / total assets. Both R&D intensity and MB are winsorized at the 1% and 99% level throughout the paper. Frequencies reported in Panel B are calculated over the set of all Compustat firm-years with non-missing data between 1988 and 2001. Industries in Panel B are defined as in Fama and French (1997) and exclude industries that do not have at least one year between 1988 and 2001 with at least 15 firms. The percentage of supplier (customer) years where a supplier (customer) is involved in multiple relationships is calculated over the entire set of supplier (customer) firm years.

42
Table II: Characteristics of Customer-Supplier Relationships Panel A: Relationship Characteristics Statistic Observations Supplier sales dependence -- mean 19.23% 8,337 Supplier sales dependence -- 25th percentile 10.10% 8,337 Supplier sales dependence -- 50th percentile 13.73% 8,337 Supplier sales dependence -- 75th percentile 22.00% 8,337 Relationships accompanied by an alliance 5.09% 10,211 Relationships in same 4-digit SIC code 8.04% 10,038 Relationships in same 3-digit SIC code 16.40% 10,038 Relationships in same 2-digit SIC code 23.29% 10,038 Relationships in same 1-digit SIC code 42.77% 10,038 Relationship duration -- 25th percentile 1 year 10,062 Relationship duration -- 50th percentile 3 years 10,062 Relationship duration -- 75th percentile 6 years 10,062 Panel B: Frequency of Equity Stakes Percentage Observations Relationships where customer has an equity stake in supplier 3.31 10,211 Relationships with equity stake, supplier R&D intensity ≤ median 1.65 5,106 Relationships with equity stake, supplier R&D intensity > median 4.98*** 5,105 Relationships with equity stake, supplier sales dependence ≤ median 2.49 4,169 Relationships with equity stake, supplier sales dependence > median 5.09*** 4,168 Relationships with equity stake, no alliance 2.46 9,691 Relationships with equity stake, alliance 19.23*** 520 Relationships with equity stake, supplier age ≤ median 4.56 5,591 Relationships with equity stake, supplier age > median 1.80*** 4,620 Relationships with equity stake, supplier assets ≤ median 3.29 5,108 Relationships with equity stake, supplier assets > median 3.33 5,103 Relationships with equity stake, supplier free cash flow ≤ 0 4.43 5,255 Relationships with equity stake, supplier free cash flow > 0 2.04*** 4,749
Note.- Customer and supplier firms are identified from the Compustat industry segment file. Customer and supplier firms must also be listed in Compact Disclosure. The sample period is 1988-2001 and includes 10,211 unique customer-supplier relationships. All figures are inflation adjusted to 2001 dollars. Each customer-supplier relationship is treated as a single observation in this table. Summary statistics are based on firm or relationship characteristics in the first year that we observe the relationship during the sample period. The number of observations used to calculate each statistic is indicated in the right-hand column. Supplier sales dependence is the percentage of supplier sales that are made to the customer. The percentage of relationships accompanied by an alliance is determined by examining whether firms in a relationship had a formal alliance agreement in place as of the first year during the sample period where we detect their trading relationship. Alliance data are from Securities Data Corporation’s joint ventures/strategic alliance database. Relationships in the same 4-digit (3-digit, 2-digit, and 1-digit) Standard Industrial Classification (SIC) code are those relationships where the customer and supplier have the same 4-digit (3-digit, 2-digit, and 1-digit) SIC code in the first year the relationship is observed. In calculating relationship duration, we assume a relationship starts in the first year the customer-supplier relationship is observed in the Compustat industry segment file (1978-2001). Relationship durations for relationships first observed in 1978 are excluded from this calculation since the actual starting year for the relationship cannot be observed. Relationship duration is calculated by estimating the distribution of survival times using the Kaplan-Meier product limit estimator. This estimation accounts for censoring and late entry. Summary statistics for the indicated subsamples in Panel B are based on firm or relationship characteristics in the first year that we observe the relationship during the sample period. Medians are calculated over the sample of all relationships based on these first year characteristics. A relationship is deemed to have an equity stake if the customer owned a block of equity in the supplier at some point in the sample period overlapping their sales relationship. R&D intensity is a firm's annual R&D expenditures divided by total assets, where missing values for R&D are treated as zero. Supplier age is the number of years since the firm was first listed on Compustat. Supplier assets are total book assets. Supplier free cash flow is a firm's income before extraordinary items plus depreciation and amortization less capital expenditures. ***, **, and * denote significance at the 0.01, 0.05, and 0.10 level, respectively, of the differences within subsamples (i.e., no alliance versus alliance) as assessed using a t-test.

43
Table III: How Equity Stakes are Established
Percentage
Number of Observations
In association with a formal or informal business arrangement 66.86 226 As a result of a spin-off, carve-out, or joint venture 17.46 59 Received as consideration in an asset sale 5.62 19 No indication given of reason for establishing stake 3.55 12 Purchased for investment purposes 2.66 9 As a result of an acquisition of a third-party firm holding the stake 1.48 5 To alleviate financial distress of supplier or assist in supplier takeover defense 1.48 5 Other 0.89 3 Total 100.00 338
Note.- A relationship is deemed to have an equity stake if the customer owned a block of equity in the supplier at some point in the sample period overlapping their sales relationship. The causes for the observed equity stakes in our sample were determined via news searches on Factiva.com. Stakes established in association with a formal or informal business arrangement are those stakes for which news articles suggested the firms involved had likely entered into a business arrangement, e.g., supply, licensing, marketing, research and development, etc.
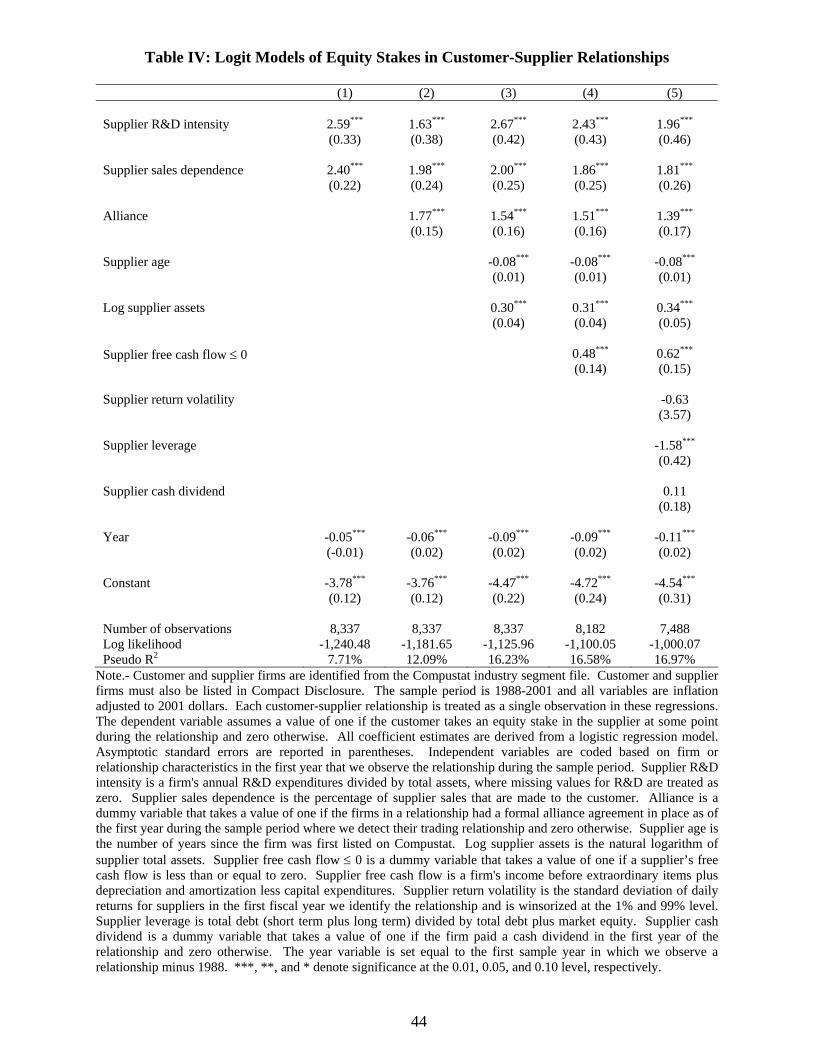
44
Table IV: Logit Models of Equity Stakes in Customer-Supplier Relationships
(1) (2) (3) (4) (5) Supplier R&D intensity 2.59***
(0.33) 1.63*** (0.38)
2.67*** (0.42)
2.43*** (0.43)
1.96*** (0.46)
Supplier sales dependence 2.40***
(0.22) 1.98*** (0.24)
2.00*** (0.25)
1.86*** (0.25)
1.81*** (0.26)
Alliance 1.77***
(0.15) 1.54*** (0.16)
1.51*** (0.16)
1.39*** (0.17)
Supplier age -0.08***
(0.01) -0.08*** (0.01)
-0.08*** (0.01)
Log supplier assets 0.30***
(0.04) 0.31*** (0.04)
0.34*** (0.05)
Supplier free cash flow ≤ 0 0.48***
(0.14) 0.62*** (0.15)
Supplier return volatility -0.63
(3.57) Supplier leverage -1.58***
(0.42) Supplier cash dividend 0.11
(0.18) Year -0.05***
(-0.01) -0.06*** (0.02)
-0.09*** (0.02)
-0.09*** (0.02)
-0.11*** (0.02)
Constant -3.78***
(0.12) -3.76*** (0.12)
-4.47*** (0.22)
-4.72***
(0.24) -4.54*** (0.31)
Number of observations 8,337 8,337 8,337 8,182 7,488 Log likelihood -1,240.48 -1,181.65 -1,125.96 -1,100.05 -1,000.07 Pseudo R2 7.71% 12.09% 16.23% 16.58% 16.97%
Note.- Customer and supplier firms are identified from the Compustat industry segment file. Customer and supplier firms must also be listed in Compact Disclosure. The sample period is 1988-2001 and all variables are inflation adjusted to 2001 dollars. Each customer-supplier relationship is treated as a single observation in these regressions. The dependent variable assumes a value of one if the customer takes an equity stake in the supplier at some point during the relationship and zero otherwise. All coefficient estimates are derived from a logistic regression model. Asymptotic standard errors are reported in parentheses. Independent variables are coded based on firm or relationship characteristics in the first year that we observe the relationship during the sample period. Supplier R&D intensity is a firm's annual R&D expenditures divided by total assets, where missing values for R&D are treated as zero. Supplier sales dependence is the percentage of supplier sales that are made to the customer. Alliance is a dummy variable that takes a value of one if the firms in a relationship had a formal alliance agreement in place as of the first year during the sample period where we detect their trading relationship and zero otherwise. Supplier age is the number of years since the firm was first listed on Compustat. Log supplier assets is the natural logarithm of supplier total assets. Supplier free cash flow ≤ 0 is a dummy variable that takes a value of one if a supplier’s free cash flow is less than or equal to zero. Supplier free cash flow is a firm's income before extraordinary items plus depreciation and amortization less capital expenditures. Supplier return volatility is the standard deviation of daily returns for suppliers in the first fiscal year we identify the relationship and is winsorized at the 1% and 99% level. Supplier leverage is total debt (short term plus long term) divided by total debt plus market equity. Supplier cash dividend is a dummy variable that takes a value of one if the firm paid a cash dividend in the first year of the relationship and zero otherwise. The year variable is set equal to the first sample year in which we observe a relationship minus 1988. ***, **, and * denote significance at the 0.01, 0.05, and 0.10 level, respectively.
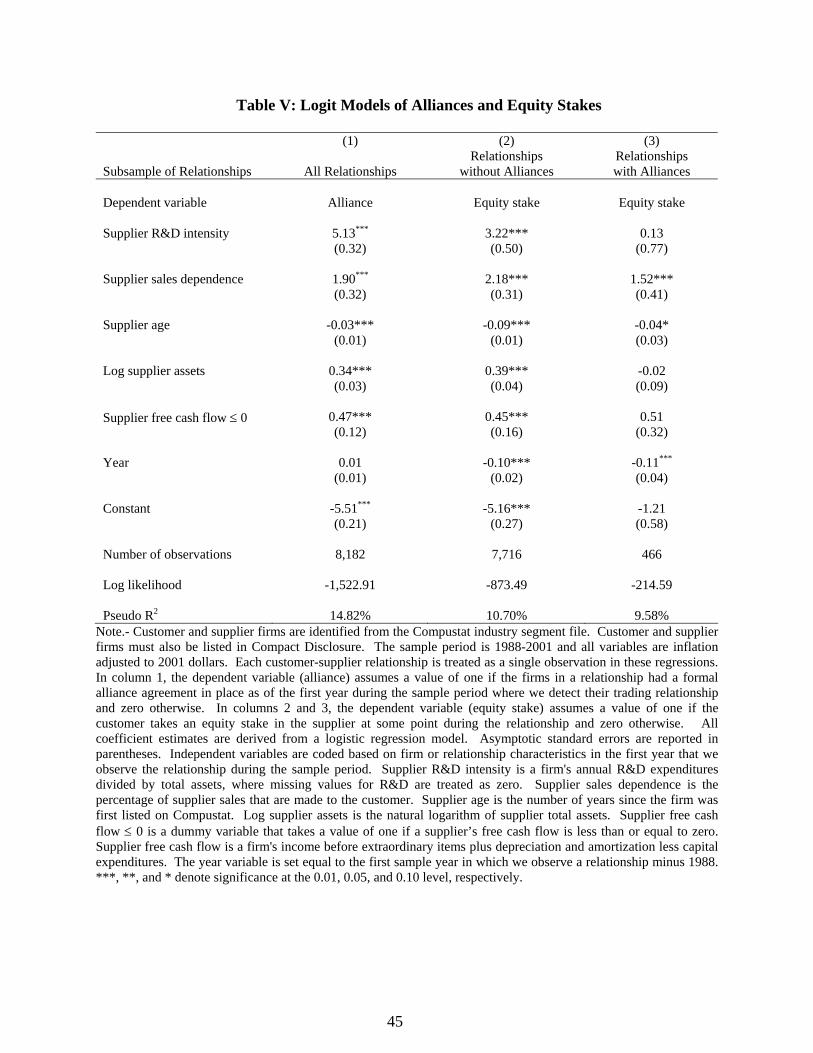
45
Table V: Logit Models of Alliances and Equity Stakes
(1) (2) (3) Subsample of Relationships
All Relationships
Relationships without Alliances
Relationships with Alliances
Dependent variable Alliance Equity stake Equity stake Supplier R&D intensity 5.13***
(0.32) 3.22*** (0.50)
0.13 (0.77)
Supplier sales dependence 1.90***
(0.32) 2.18*** (0.31)
1.52*** (0.41)
Supplier age -0.03***
(0.01) -0.09***
(0.01) -0.04* (0.03)
Log supplier assets 0.34***
(0.03) 0.39*** (0.04)
-0.02 (0.09)
Supplier free cash flow ≤ 0 0.47***
(0.12) 0.45*** (0.16)
0.51 (0.32)
Year 0.01
(0.01) -0.10***
(0.02) -0.11*** (0.04)
Constant -5.51***
(0.21) -5.16***
(0.27) -1.21 (0.58)
Number of observations 8,182 7,716 466 Log likelihood -1,522.91 -873.49 -214.59 Pseudo R2 14.82% 10.70% 9.58%
Note.- Customer and supplier firms are identified from the Compustat industry segment file. Customer and supplier firms must also be listed in Compact Disclosure. The sample period is 1988-2001 and all variables are inflation adjusted to 2001 dollars. Each customer-supplier relationship is treated as a single observation in these regressions. In column 1, the dependent variable (alliance) assumes a value of one if the firms in a relationship had a formal alliance agreement in place as of the first year during the sample period where we detect their trading relationship and zero otherwise. In columns 2 and 3, the dependent variable (equity stake) assumes a value of one if the customer takes an equity stake in the supplier at some point during the relationship and zero otherwise. All coefficient estimates are derived from a logistic regression model. Asymptotic standard errors are reported in parentheses. Independent variables are coded based on firm or relationship characteristics in the first year that we observe the relationship during the sample period. Supplier R&D intensity is a firm's annual R&D expenditures divided by total assets, where missing values for R&D are treated as zero. Supplier sales dependence is the percentage of supplier sales that are made to the customer. Supplier age is the number of years since the firm was first listed on Compustat. Log supplier assets is the natural logarithm of supplier total assets. Supplier free cash flow ≤ 0 is a dummy variable that takes a value of one if a supplier’s free cash flow is less than or equal to zero. Supplier free cash flow is a firm's income before extraordinary items plus depreciation and amortization less capital expenditures. The year variable is set equal to the first sample year in which we observe a relationship minus 1988. ***, **, and * denote significance at the 0.01, 0.05, and 0.10 level, respectively.

46
Table VI Summary Statistics on Firm and Relationship Characteristics and the Size of Equity Stakes
Panel A: Mean Firm and Relationship Characteristics by the Size of Equity Stakes No Equity Stake 5% ≤ Equity Stake < 25% 25% ≤ Equity Stake Supplier R&D intensity .0704 .1812*** .0779 Supplier sales dependence .1867 .3752*** .2201* Alliance .0425 .3697*** .0814* Supplier age 8.86 4.03 *** 5.94 *** Supplier assets 619.89 229.21* 2,848.19*** Supplier free cash flow ≤ 0 .5191 .7830*** .4940 Number of observations 9,873 238 86 Panel B: Mean Size of Equity Stake by Other Sample Characteristics Relationships with Equity All Relationships Supplier R&D intensity ≤ median 36.52% 0.57% Supplier R&D intensity > median 17.29%*** 0.83%** Supplier sales dependence ≤ median 29.22% 0.71% Supplier sales dependence > median 18.69%*** 0.91% No alliance 25.90% 0.61% Alliance 12.72%*** 2.35%*** Supplier age ≤ median 20.52% 0.94% Supplier age > median 25.58%* 0.47%*** Supplier assets ≤ median 19.28% 0.60% Supplier assets > median 24.66%** 0.80%* Supplier free cash flow ≤ 0 17.49% 0.75% Supplier free cash flow > 0 32.45%*** 0.64%
Note.- The size of an equity stake is the percentage of supplier equity held by the customer in the first year over the sample period 1988-2001 where the firms have an observed trading relationship and the customer is revealed to be a 5% blockholder. We exclude from this table a small number of relationships (24) where the size of a customer's equity stake is missing. In this table, all relationships where the customer is never listed as a blockholder are assumed to have zero ownership. In Panel A, we assign each customer-supplier relationship to one of the three columns based on the size of the equity stake held by the customer in the supplier and report the mean of each indicated variable for the firms in the assigned column. The asterixes in Panel A indicate significant differences between firms in the indicated column and the relationships with ownership in the below 5% group using a t-test. In panel B, we report the mean level of ownership (percent) for subsamples created based on the criteria listed in each row. The relationship with equity column considers only those sample relationships where the customer has an equity stake in the supplier. The all relationships column considers all sample relationships. The asterixes in Panel B indicate significant differences between the respective subsamples (i.e., no alliance versus alliance) as assessed using a t-test. Supplier R&D intensity is a firm's annual R&D expenditures divided by total assets, where missing values for R&D are treated as zero. Supplier sales dependence is the percentage of supplier sales that are made to the customer. Alliance is a dummy variable that takes a value of one if the firms in a relationship had a formal alliance agreement in place as of the first year during the sample period where we detect their trading relationship and zero otherwise. Supplier age is the number of years since the firm was first listed on Compustat. Supplier assets are in millions of 2001 dollars. Supplier free cash flow ≤ 0 is a dummy variable that takes a value of one if a supplier’s free cash flow is less than or equal to zero. Supplier free cash flow is a firm's income before extraordinary items plus depreciation and amortization less capital expenditures. ***, **, and * denote significance at the 0.01, 0.05, and 0.10 level, respectively.

47
Table VII: Estimated Models of Equity Stake Size
(1) (2) (3) (4) Regression: Sample
Tobit: All Relationships
Ordinary Least
Squares: Relationships with Equity
Multinomial Logit: Moderate
Ownership versus No Ownership
Multinomial Logit: Moderate
Ownership versus High Ownership
Supplier R&D intensity
50.38*** (10.07)
-7.16 (6.88)
2.54*** (0.49)
1.12 (1.13)
Supplier sales dependence
35.89*** (6.05)
-7.82**
(3.79) 2.06*** (0.28)
1.19* (0.66)
Alliance
28.56*** (4.01)
-7.47*** (2.10)
1.71***
(0.17) 1.27*** (0.45)
Supplier age
-1.45*** (0.22)
0.08 (0.22)
-0.10*** (0.02)
-0.03 (0.02)
Log supplier assets
7.33*** (0.89)
2.15**
(1.03) 0.30***
(0.05) -0.09 (0.08)
Supplier free cash flow ≤ 0 7.13**
(2.85) -9.64*** (3.18)
0.82***
(0.18) 0.94*** (0.29)
Year
-1.84*** (0.34)
-0.29 (0.31)
-0.09*** (0.02)
-0.01 (0.03)
Constant
-110.13***
(7.68) 26.61***
(5.47) -5.36***
(0.30) 0.31
(0.51) Number of observations 8,171 299 8,171 8,171 Log likelihood -2,244.75 -1,216.53 -1,216.53 Pseudo R2 7.02% 19.89% 16.40% 16.40%
Note.- The dependent variable in all specifications is the size of the customer’s equity stake in its supplier. The size of an equity stake is the percentage of supplier equity held by the customer in the first year over the sample period 1988-2001 where the firms have an observed trading relationship and the customer is revealed to be a 5% blockholder. All relationships where the customer is never listed as a blockholder are assumed to have zero ownership. The regression in column 1 is a Tobit regression on the set of all relationships, where relationships with no revealed ownership are assumed to be censored at the 5% ownership level. The regression in column 2 is an ordinary least squares regression (with heteroskedasticity consistent standard errors) on the set of all relationships where we observe the presence and size of the customer’s equity stake. Columns 3 and 4 are multinomial logits run over the sample of all relationships. In these specifications, we group relationships into three categories based on whether the customer’s stake is above 25% (the high ownership group), between 5% and 25% (the moderate ownership group), or below 5% (the no disclosed ownership group). Estimates reported for column 3 (4) are for the relative likelihood of observing moderate ownership versus no (high) ownership. Asymptotic standard errors are reported in parentheses. Supplier R&D intensity is a firm's annual R&D expenditures divided by total assets, where missing values for R&D are treated as zero. Supplier sales dependence is the percentage of supplier sales that are made to the customer. Alliance is a dummy variable that takes a value of one if the firms in a relationship had a formal alliance agreement in place as of the first year during the sample period where we detect their trading relationship and zero otherwise. Supplier age is the number of years since the firm was first listed on Compustat. Log supplier assets is the natural logarithm of supplier total assets. Supplier free cash flow ≤ 0 is a dummy variable that takes a value of one if a supplier’s free cash flow is less than or equal to zero. Supplier free cash flow is a firm's income before extraordinary items plus depreciation and amortization less capital expenditures. The year variable is set equal to the first sample year in which we observe a relationship minus 1988. ***, **, and * denote significance at the 0.01, 0.05, and 0.10 level, respectively.

48
Table VIII: Estimated Models of Relationship Duration (1) (2) (3) (4) (5) (6) Regression Cox Cox Weibull Weibull Logit Logit Equity stake 0.85***
(0.05) 0.86**
(0.06) 0.79***
(0.06) 0.80*** (0.06)
-0.34***
(0.08) -0.34*** (0.10)
Supplier R&D intensity 1.55***
(0.16) 1.89***
(0.25) 0.90***
(0.16) Supplier sales dependence 0.04***
(0.007) 0.12***
(0.004) -8.49***
(0.31) (Supplier sales dependence)2 16.85***
(4.00) 32.84***
(10.11) 7.26***
(0.35) Alliance
1.04 (0.05)
1.04 (0.07)
-0.01 (0.08)
Supplier age
0.99***
(0.001) 0.99***
(0.002) -0.004**
(0.002) Log supplier assets
0.90*** (0.007)
0.87*** (0.009)
-0.20*** (0.01)
Supplier free cash flow ≤ 0 1.17***
(0.03) 1.26***
(0.04) 0.35***
(0.04) Tenure of relationship
-0.05***
(0.01) Year
0.99** (0.004)
1.06*** (0.004)
0.07*** (0.01)
Constant
-144.81***
(10.26) Number of Observations 10,062 8,056 10,062 8,056 22,406 18,596 Pseudo R2 0.07% 9.19% Log likelihood -52,776.37 -3,9574.27 -11,092.62 -8,335.20 -13,398.84 -9,775.10
Note.- The specifications in columns 1-4 treat each relationship as a single observation and estimate models of the hazard function describing relationship lengths. The dependent variable in columns 1-4 is the length of the observed customer-supplier relationship in years. We assume a relationship starts in the first year the customer-supplier relationship is observed in the Compustat industry segment file (1978-2001). Relationships first observed in 1978 are excluded from this analysis since the actual starting year for the relationship cannot be observed. If a relationship ends because one of the firms becomes inactive in Compustat or if a relationship lasts up to the last year of the sample period, we treat the length of that relationship as right censored. We use data on all relationships in existence from 1988-2001, and our estimation adjusts for the fact that some relationships enter the sample with positive tenure (i.e., we adjust for delayed entry for observations at the start of the sample period). The estimates in columns 1 and 2 are from a Cox proportional hazards model with robust standard errors reported in parentheses. The estimates in columns 3 and 4 are from a Weibull distribution model with robust standard errors in parentheses. In columns 5 and 6, we treat each relationship-year as the unit of observation and estimate a logit model predicting whether the relationship ends in the subsequent year. Asymptotic standard errors are reported in parentheses. Independent variables are coded based on firm or relationship characteristics in the first year that we observe the relationship during the sample period. In columns 5 and 6 the dependent variable is set equal to missing if either of the firms in a customer-supplier pair disappears from the Compustat universe. Significance levels in columns 1-4 (5-6) refer to differences between the estimated coefficient and one (zero). In columns 5 and 6, the explanatory variables are measured as of the start of the observation year. In these columns, the equity stake dummy takes a value of one only when the relationship has been characterized by equity at some point in the past and the alliance variable is defined as of the relationship's first year. Equity stake is a dummy variable that assumes a value of one if the customer takes an equity stake in the supplier at some point during the relationship and zero otherwise. Supplier R&D intensity is a firm's annual R&D expenditures divided by total assets, where missing values for R&D are treated as zero. Supplier sales dependence is the percentage of supplier sales that are made to the customer. Alliance is a dummy variable that takes a value of one if the firms in a relationship had a formal alliance agreement in place as of the first year during the sample period where we detect their trading relationship and zero otherwise. Supplier age is the number of years since the firm was first listed on Compustat. Log supplier assets is the natural logarithm of supplier total assets. Supplier free cash flow ≤ 0 is a dummy variable that takes a value of one if a supplier’s free cash flow is less than or equal to zero. Supplier free cash flow is a firm's income before extraordinary items plus depreciation and amortization less capital expenditures. Tenure of relationship is the number of years the relationship had been in existence as of the start of the observation year. The year variable is set equal to the first sample year in which we observe a relationship minus 1988. ***, **, and * denote significance at the 0.01, 0.05, and 0.10 level, respectively.