Embed Size (px)
Citation preview

BNCCORP, INC. (BNCCORP or the Company) is a bank holding company registered under the Bank Holding Company Act of 1956 headquartered in Bismarck, North Dakota. It is the parent company of BNC National Bank (the Bank). The Company operates community banking and wealth management businesses in North Dakota, Arizona and Minnesota from 13 locations. BNC also conducts mortgage banking from 12 locations in Arizona, North Dakota, Illinois, Kansas, and Missouri.
CORPORATE DATAInvestor Relations
E-mail Inquiries: [email protected]
General Inquiries:BNCCORP, INC.322 East Main Avenue, Bismarck, North Dakota 58501Telephone (701) 250-3040 | Facsimile (701) 222-3653
Daniel J. CollinsChief Financial Officer612-305-2210
Timothy J. Franz President/CEO612-305-2213
Annual MeetingThe 2018 annual meeting of stockholders will be held on Wednesday, June 19, 2019 at 8:30 a.m. (Central Daylight Time) at BNC National Bank, Second Floor Conference Room, 322 East Main Avenue, Bismarck, ND 58501.
Independent Public AccountantsKPMG LLPSuite 1100 1000 Walnut StreetKansas City, MO 64106-2162
Securities ListingBNCCORP, INC.’s common stock is traded on the OTCQX Markets under the symbol: “BNCC.”
Common Stock PricesFor the Years Ended December 31,
2018(1) 2017(1)
High Low High LowFirst Quarter $31.00 $26.00 $27.25 $25.50Second Quarter $27.25 $25.41 $26.49 $25.30Third Quarter $28.10 $25.66 $27.70 $25.26Fourth Quarter $27.90 $19.20 $31.00 $26.90
(1) The quotes represent the high and low closing sales prices as reported by OTCQX Markets.
Stock Transfer Agent and RegistrarAmerican Stock Transfer & Trust Company, LLC 6201 15th AvenueBrooklyn, NY 11219(800) 937-5449
Corporate Broker D. A. Davidson Community Banking and Wealth Management Group1-800-288-2811 | [email protected]
Directors, BNCCORP, INC.Tracy Scott
Chairman of the Board andRetired Co-Founder of BNCCORP, INC.
Timothy J. FranzPresident andChief Executive Officer of BNCCORP, INC.
Nathan P. BrennaOwner, Brenna Farm and RanchFormer Attorney
Directors, BNC National BankDoug BrendelShawn ClevelandDaniel J. Collins Timothy J. Franz Dave Hoekstra Mark E. PeilerScott SpillmanCheryl A. Stanton
Gaylen GhylinRetired EVP, Secretary and CFO ofTiller Corporation d/b/a Barton Sand &Gravel Co., Commercial Asphalt Co. andBarton Enterprises, Inc.
Michael M. VekichCEO, Vekich Chartered
Tom RedmannRetired- Loan Manager, Bank of North Dakota
BNC National Bank Bank Branches – North Dakota:
Bismarck Main(2)
322 East Main AvenueBismarck, ND 58501
Bismarck South219 South 3rd StreetBismarck, ND 58504
Bismarck North(2)
801 East Century AvenueBismarck, ND 58503
Bismarck Sunrise(2)
3000 Yorktown DriveBismarck, ND 58503
Primrose Assisted Living Apartments1144 College DriveBismarck, ND 58501
Crosby206 South Main StreetCrosby, ND 58730
Bank Branches - ArizonaGlendale – Charter Address20175 North 67th AveGlendale, AZ 85308
Mortgage Banking Offices:Glendale6685 W. Beardsley Glendale, AZ 85383
Wichita8558 W 21st Street N Wichita, KS 67205
Wichita12031 East 13th Street Wichita, KS 67206
Andover1718 N Webb RoadAndover, KS 67206
(2) Bank branches offering mortgage banking services.
Garrison92 North MainGarrison, ND 58540 Linton104 North BroadwayLinton, ND 58552
Stanley210 South MainStanley, ND 58784
Watford City205 North MainWatford City, ND 58854
Mandan(2)
2711 Sunset Drive NWMandan, ND 58554
Bank Branches - MinnesotaGolden Valley650 North Douglas DriveGolden Valley, MN 55422
Overland Park7007 College BoulevardOverland Park, KS 66211
Moline800 36th AvenueMoline, IL 61265
Lebanon1403 West Elm StreetLebanon, Missouri 65336

BNCCORP, INC. Annual Report 2018 3
CORPORATE PROFILE: THE BUSINESS OF BNC
BNC (or the Company) is a diversified community bank with three primary areas of focus: commercial banking, retail and mortgage banking, and wealth management.
Commercial Banking. We meet the needs of small to middle-market businesses with a range of commercial banking services, including: business financing, commercial real estate lending, SBA loans, business checking, cash management, corporate credit cards and merchant services. The core of our commercial banking relationships are in North Dakota, mainly in the capital region of Bismarck/Mandan. From Bismarck, and locations to the north and west, we serve communities in North Dakota that are economically influenced by oil and energy, and to a lesser extent, we serve the agricultural communities of central North Dakota. In recent years, our banking presence in Phoenix, Arizona has grown significantly. By operating banking locations in Phoenix and Minnesota we create further opportunities for growth while diversifying our credit exposure.
Retail and Mortgage Banking. BNC’s services to consumers include retail banking, provided through a network of locations in North Dakota, Arizona and Minnesota. Among our broad array of retail banking services are personal checking and savings products, personal loans and card services. Our branch network is concentrated in North Dakota, where we are responsive to the preference of our customers for convenient face-to-face transactional banking. BNC has been rewarded with our customers’ loyalty as our deposit growth and retention has been remarkable.
Our mortgage banking operations generate residential loans through a consumer direct channel, as well as a retail channel with locations in Arizona, Minnesota, North Dakota, Illinois, Kansas and Missouri. The consumer direct channel emphasizes the use of technology, including internet-generated leads and a call center, to originate loans throughout the U.S. The retail channel is more traditional and emphasizes relationships to originate loans near our branch network.
Wealth Management. A trusted partner for our clients as they plan for retirement and manage their investments, BNC’s wealth management solutions include: 401(k) and other retirement plans, trust services, and personal wealth advisory services. Many of our wealth management clients are derived from commercial banking relationships. For example, we administer retirement savings plans for the employees of our business clients. We are well positioned to help clients manage wealth and transfer assets in a manner that enables them to accomplish their financial goals.

BNCCORP, INC. Annual Report 20184
It was a beautiful morning for a 5K run/walk when several employees and family members participated in the Head For The Cure event in Overland Park, Kansas, which benefits brain cancer research.
Timothy J. FranzPresident and Chief Executive
Officer
TO OUR COMMUNITY, SHAREHOLDERS, CUSTOMERS AND EMPLOYEES:
At BNC, we whole-heartedly believe that a community bank like ours plays a unique and vital role in the economic and social improvement of the people whose lives we touch. We make and keep important commitments: to supply the capital that enables businesses to thrive, to help individuals and families save and create wealth for the future, to provide a rewarding workplace for talented employees, to invest in the well-being of the community, and to deliver increasing value for shareholders.
What enables us to deliver on these important commitments and grow our business is the strong platform that BNC has built over many years. It is this solid platform that supports the ability to engage with, and serve the needs of our customers, employees and neighbors, while delivering profitable growth for our shareholders.
Building a Solid Platform The most important element of our platform is BNC’s relationship driven approach to serving our customers. In particular, we focus on the small and medium sized businesses that are the engines of growth in our communities. Because our bankers get to know their customers and understand their needs, they can deliver a high level of attentive, personalized service. Customers know they can “bank on their relationship” with BNC – and that we will be at their side to provide solutions that address specific financial challenges and opportunities. Relationship-based banking is not only better for BNC’s customers, but for our shareholders as well. By fostering enduring relationships, we have the ability to grow with our clients, providing additional products and services over time as their needs evolve.
Our platform is also built on a valuable, deposit-rich franchise. Because of our relationship approach, we have been able to attract a base of deposits that provides
5BNCCORP, INC. Annual Report 2018
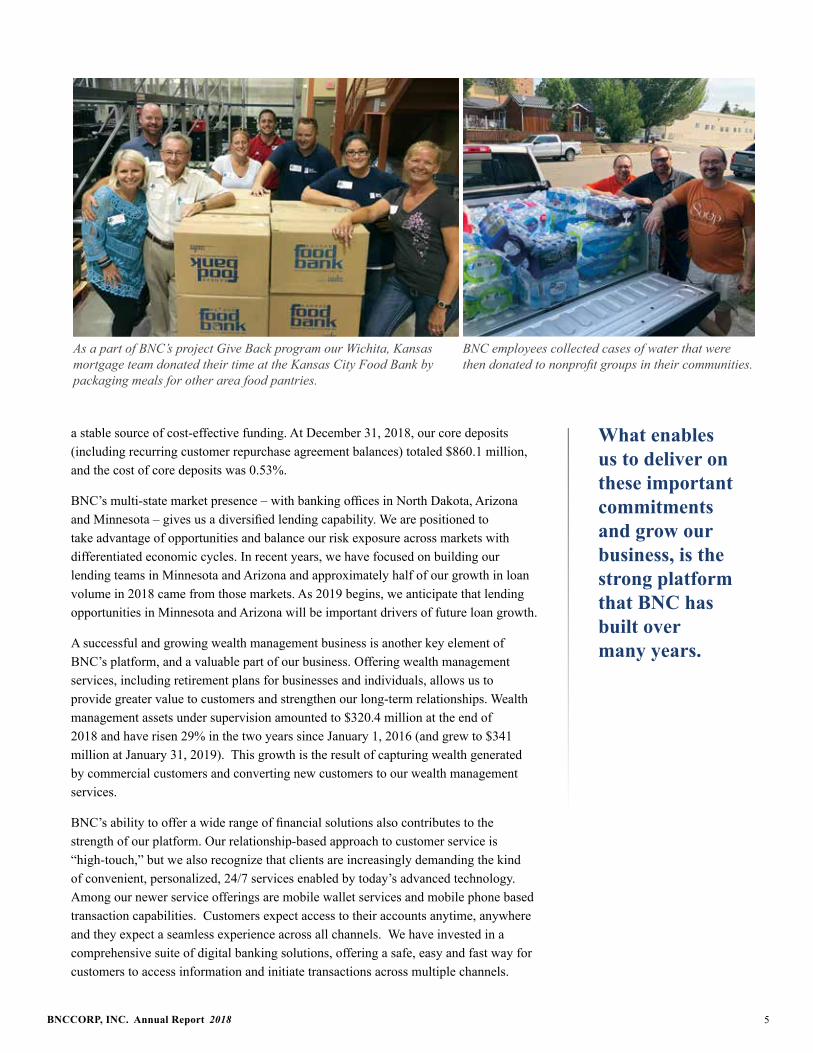
As a part of BNC’s project Give Back program our Wichita, Kansas mortgage team donated their time at the Kansas City Food Bank by packaging meals for other area food pantries.
a stable source of cost-effective funding. At December 31, 2018, our core deposits (including recurring customer repurchase agreement balances) totaled $860.1 million, and the cost of core deposits was 0.53%.
BNC’s multi-state market presence – with banking offices in North Dakota, Arizona and Minnesota – gives us a diversified lending capability. We are positioned to take advantage of opportunities and balance our risk exposure across markets with differentiated economic cycles. In recent years, we have focused on building our lending teams in Minnesota and Arizona and approximately half of our growth in loan volume in 2018 came from those markets. As 2019 begins, we anticipate that lending opportunities in Minnesota and Arizona will be important drivers of future loan growth.
A successful and growing wealth management business is another key element of BNC’s platform, and a valuable part of our business. Offering wealth management services, including retirement plans for businesses and individuals, allows us to provide greater value to customers and strengthen our long-term relationships. Wealth management assets under supervision amounted to $320.4 million at the end of 2018 and have risen 29% in the two years since January 1, 2016 (and grew to $341 million at January 31, 2019). This growth is the result of capturing wealth generated by commercial customers and converting new customers to our wealth management services.
BNC’s ability to offer a wide range of financial solutions also contributes to the strength of our platform. Our relationship-based approach to customer service is “high-touch,” but we also recognize that clients are increasingly demanding the kind of convenient, personalized, 24/7 services enabled by today’s advanced technology. Among our newer service offerings are mobile wallet services and mobile phone based transaction capabilities. Customers expect access to their accounts anytime, anywhere and they expect a seamless experience across all channels. We have invested in a comprehensive suite of digital banking solutions, offering a safe, easy and fast way for customers to access information and initiate transactions across multiple channels.
BNC employees collected cases of water that were then donated to nonprofit groups in their communities.
What enables us to deliver on these important commitments and grow our business, is the strong platform that BNC has built over many years.

BNCCORP, INC. Annual Report 20186
Delivering Strong Performance Our focus on building a robust community banking enterprise has generated strong financial results since 2011. We delivered double-digit returns on equity in five of the past eight years, a performance that compares well to our community bank peers. Book value per share increased more than fourfold from $5.35 at the end of 2011 to $22.26 at December 31, 2018.
In 2018, our performance did not match the performance metrics of several recent years. Nonetheless, we generated $1.93 diluted earnings per share in a rising rate environment that adversely impacted mortgage banking and increased the cost of deposits. Despite these challenges, we delivered an increase in net income, grew loans and leases held for investment by 9.4%, grew core deposits by 2.9%, and maintained solid asset quality.
Net income for 2018 increased by nearly $2.0 million to $6.8 million, compared to $4.9 million, or $1.38 per diluted share, for 2017. Our prior year net income and diluted earnings per share, adjusted for the impact of tax reform late in 2017, were $6.4 million and $1.81, respectively. Earnings growth in 2018 was primarily driven by higher net interest income due to increases in earning asset balances and yields on loans and investments, a decrease in non-interest expenses, and lower income tax expense. These factors were partly offset by a decrease in non-interest income as compared with 2017.
Total assets were $971.0 million at December 31, 2018, rising $24.9 million, or 2.6%, compared to 2017. Loans and leases held for investment were $468.5 million at year-end 2018, an increase of $40.1 million, or 9.4%, since 2017. Total deposits increased $30.8 million to $848.6 million at December 31, 2018.
Asset quality remained strong. Nonperforming assets were $1.7 million at December 31, 2018, down from $2.0 million a year earlier. The ratio of nonperforming assets to total assets was 0.17% at December 31, 2018, an improvement from 0.21% at December 31, 2017.
BNC’s relationship-oriented approach means that we not only provide financial solutions to individuals and businesses, but also become deeply engaged in the local communities.
20122011 2013
Return on Equity
2014 2015 2016 2017 2018
15.77%
76.77%
14.77% 11.91% 11.26% 9.48% 8.15% 9.00%
2017 ROE excludes the $1.5 million impact of the 2017 Tax Cut and Jobs Act. All ROE calculations include accumulated other comprehensive income.

7BNCCORP, INC. Annual Report 2018
Focus on Driving Improved Results It is worth noting that while many economic forces are not under our control, such as market interest rates, we continually work to improve our performance. Our team has a track record of taking actions – both large and small – to drive operating improvements and we are sharply focused on enhancing BNC’s performance in 2019 and beyond.
In recent years we have taken actions such as selling unprofitable peripheral branch offices, lowering costs in our mortgage banking business, exiting underperforming indirect lending in Arizona, and selling our tax practice to a third party to simplify and improve earnings. We have pursued technology initiatives to reduce the overall costs of our network, infrastructure, and applications, which have also resulted in improved efficiency and customer service.
Commitment to Our Communities BNC’s relationship-oriented approach means that we not only provide financial solutions to individuals and businesses, but also become deeply engaged in the local communities where we, and our customers, live and work. For this reason, we actively invest in arts, education, business development and youth programs that are vital to the well-being of our communities. Our team members also embrace this vision and devote their time and talent to a wide range of community activities. Here are just a few of the many community organizations across our market area in which we were involved in the past year:
• Sponsoring fund-raising walks for organizations such as the ALS Association of North Dakota and the American Heart Association.
• Working with The Banquet, helping to fund, prepare and serve meals for homeless, elderly and other needy populations in the Bismarck/Mandan area.
• Supporting organizations such as the United Way and Meals on Wheels in a number of communities.
• In Minnesota, supporting Hammers of Hope, an organization of volunteers who help community members who need home repairs.
• Participating in an event to assist Veterans in Business in Arizona.
• In Wichita, Kansas, members of our mortgage team volunteered for organizations such as Habitat for Humanity and a local food bank. And, in Kansas City our mortgage team participated in a drive to stock food pantries with bottled water during the summer.
Developing a Talented Team BNC actively supports the professional development of our employees, to ensure they have the skills and experience to thrive in a rapidly changing financial services industry. We encourage employee development in many ways, including working to identify and promote self-starters – those doers and thinkers who take responsibility, get involved, and find new solutions. Such team members are given opportunities to develop policies and programs, and then lead them. We also cultivate employees who take the initiative to learn, apply, and master new challenges by supporting and promoting those who can identify, research, and apply knowledge to the emerging needs of our organization.
Volunteers prepared and served a meatloaf dinner for over 400 attendees at The Banquet - a weekly, free community meal. This event has become an annual tradition for Bismarck-Mandan North Dakota staff.

BNCCORP, INC. Annual Report 20188
Forward-Looking Statements Statements included in this cover letter to our Annual Report which are not historical in nature are intended to be, and are hereby identified as “forward-looking statements” for purposes of the safe harbor provided by Section 27A of the Securities Act of 1933 and Section 21E of the Securities Exchange Act of 1934. We caution readers that these forward-looking statements, including without limitation, those relating to our future business prospects, revenues, working capital, liquidity, capital needs, interest costs, income and expenses, are subject to certain risks and uncertainties that could cause actual results to differ materially from those indicated in the forward-looking statements due to several important factors. Important factors that could cause our actual results and financial condition to differ materially from those indicated in the forward-looking statements include, but are not limited to: the impact of current and future regulation; the risks of loans and investments, including dependence on local and regional economic conditions; competition for our customers from other providers of financial services; possible adverse effects of changes in interest rates, including the effects of such changes on mortgage banking revenues and derivative contracts and associated accounting consequences; risks associated with our acquisition and growth strategies; and other risks which are difficult to predict and many of which are beyond our control. All statements in this news release, including forward-looking statements, speak only of the date they are made, and the Company undertakes no obligation to update any statement in light of new information or future events. In addition, we encourage readers to review the financial information included in this cover letter in conjunction with the Consolidated Financial Statements of BNCCORP, INC. and Subsidiaries included in the accompanying Annual Report.
Our talent development efforts are designed to reward those people who have the entrepreneurial spirit that is fundamental to BNC – and who demonstrate the drive and commitment we will need to serve our customers, advance our operational progress, and continue our growth and value creation.
Looking Ahead BNC’s results in 2018 reflected our determination to operate a community bank that is positioned to build strong relationships with customers and generate increased value for shareholders. While we are not satisfied with recent results, we are delivering earnings and asset growth, improving the effectiveness of our operations, and investing in talent. I want to thank everyone who contributed to our enterprise: our colleagues for their hard work and integrity, our board members for their guidance, our shareholders for their confidence, and our customers and community for their loyalty and trust.
As we look toward 2019 and beyond, we will strive to realize BNC’s potential by improving our mortgage operations, focusing on loan and deposit growth, and taking action to enhance sustainable core earnings. Our efforts will be aided by the solid platform we have constructed over the years – with a relationship-based approach to service, deposit-rich franchise, multi-regional loan generation capacity, and a diverse portfolio of financial solutions – delivered by a talented group of team members with a commitment to outstanding service. We are confident that BNC can continue to successfully execute on our strategic plans, enabling us to continue to grow profitably, serve our customers and community, and enhance shareholder value.
Sincerely,
Timothy J. Franz President and Chief Executive Officer

____________________________
Year End Financial Report____________________________
For the Year Ended December 31, 2018
BNCCORP, INC.(OTCQX: BNCC)
322 East MainBismarck, North Dakota 58501
(701) 250-3040
BNCCORP, INC. Annual Report 2018 9

BNCCORP, INC. Annual Report 201810
BNCCORP, INC.INDEX TO YEAR END FINANCIAL REPORT
December 31, 2018TABLE OF CONTENTS
Page
Selected Financial Data 9Operating Strategy 12Management’s Discussion and Analysis of Financial Condition and Results of Operations 13Quantitative and Qualitative Disclosures about Market Risk 32Consolidated Financial Statements 35

11BNCCORP, INC. Annual Report 2018
Selected Financial Data The selected consolidated financial data presented below should be read in conjunction with our consolidatedfinancial statements and the notes thereto (dollars in thousands, except share and per share data):
For the Years Ended December 31,
2018 2017 2016 2015 2014
Income Statement Data:Total interest income $ 34,478 $ 31,443 $ 29,346 $ 27,915 $ 29,264Total interest expense 6,108 3,578 3,343 2,570 3,308Net interest income 28,370 27,865 26,003 25,345 25,956Provision (reduction) for credit losses - 350 800 (400) (800)Non-interest income 19,017 19,499 25,777 24,950 20,454Non-interest expense 39,013 39,116 41,193 37,544 34,683Income tax expense (1) 1,538 3,020 2,631 3,945 4,071Net income (1) $ 6,836 $ 4,878 $ 7,156 $ 9,206 $ 8,456Preferred stock costs - - - 1,656 1,796Net income available to common shareholders $ 6,836 $ 4,878 $ 7,156 $ 7,550 $ 6,660
Balance Sheet Data: (at end of period)Total assets $ 971,027 $ 946,150 $ 910,400 $ 904,246 $ 934,419Investments securities available for sale 411,509 411,917 400,136 419,346 449,333Loans held for sale-mortgage banking 22,788 36,601 39,641 50,445 47,109Loans and leases held for investment, net of unearned income 468,468 428,325 414,673 379,903 360,789Allowance for credit losses (7,692) (7,861) (8,285) (8,611) (8,601)Total deposits 848,605 817,806 752,627 780,449 811,231Core deposits 860,099 835,850 765,138 760,937 773,279Short-term borrowings 11,494 18,043 12,510 13,851 16,002Federal Home Loan Bank advances - - 38,000 7,300 -Long-term borrowings 10,000 10,000 10,000 10,000 -Guaranteed preferred beneficial interests in Company’s subordinated
debentures 15,009 15,011 15,013 15,015 15,018Preferred stockholders’ equity - - - - 21,098Common stockholders’ equity 77,753 77,626 74,195 68,988 62,390Book value per common share outstanding $ 22.26 $ 22.40 $ 21.47 $ 20.12 $ 18.28Book value per common share outstanding, excluding accumulated other
comprehensive income $ 24.24 $ 22.38 $ 20.98 $ 18.93 $ 16.72Tangible common equity ratio 7.99% 8.18% 8.13% 7.62% 6.67%
Earnings Performance / Share Data:Return on average total assets (1) 0.70% 0.50% 0.78% 1.01% 0.94%Return on average common stockholders’ equity, excluding accumulated
other comprehensive income (1) 8.33% 6.45% 10.35% 12.21% 12.37%Efficiency ratio 82.33% 82.59% 79.55% 74.65% 74.73%Net interest margin 3.08% 3.05% 3.03% 2.96% 3.07%Net interest spread 2.90% 2.92% 2.93% 2.86% 2.97%Basic earnings per common share (1) $ 1.96 $ 1.40 $ 2.08 $ 2.23 $ 1.98Diluted earnings per common share (1) $ 1.93 $ 1.38 $ 2.03 $ 2.16 $ 1.91Average common shares outstanding 3,487,846 3,474,988 3,447,635 3,386,600 3,369,021Average common and common equivalent shares 3,539,755 3,540,698 3,520,818 3,497,740 3,491,254Shares outstanding at year end 3,493,298 3,465,992 3,456,008 3,428,416 3,413,854
Other Key Ratios Nonperforming assets to total assets 0.17% 0.21% 0.29% 0.09% 0.03%Nonperforming loans to total assets 0.17% 0.21% 0.27% 0.06% 0.01%Nonperforming loans to loans and leases held for investment 0.36% 0.46% 0.59% 0.15% 0.02%Allowance for credit losses to total loans 1.57% 1.69% 1.82% 2.00% 2.11%
(1) The 2017 results include amounts linked to tax reform legislation aggregating $1.515 million. Excluding the impact of these amounts, the Company would have reported income tax expense of $1.505 million and net income of $6.393 million. Return on average total assets would have been 0.66% and Return on average common stockholder’s equity would have been 8.46%. Basic and diluted earnings per share would be $1.84 and $1.81, respectively.

BNCCORP, INC. Annual Report 201812
Quarterly Financial Data
2018First
QuarterSecond Quarter
Third Quarter
Fourth Quarter YTD
Interest income $ 8,016 $ 8,520 $ 8,836 $ 9,106 $ 34,478
Interest expense 1,156 1,458 1,658 1,836 6,108
Net interest income 6,860 7,062 7,178 7,270 28,370
Provision for credit losses - - - - -
Net interest income after provision for credit losses 6,860 7,062 7,178 7,270 28,370
Non-interest income 5,881 5,727 3,979 3,430 19,017
Non-interest expense 9,768 10,014 9,806 9,425 39,013
Income before income taxes 2,973 2,775 1,351 1,275 8,374
Income tax expense 577 630 284 47 1,538
Net income $ 2,396 $ 2,145 $ 1,067 $ 1,228 $ 6,836
Basic earnings per common share $ 0.69 $ 0.61 $ 0.31 $ 0.35 $ 1.96
Diluted earnings per common share $ 0.68 $ 0.60 $ 0.30 $ 0.35 $ 1.93
Average common shares:
Basic 3,487,155 3,496,135 3,497,426 3,507,426 3,487,846
Diluted 3,547,427 3,548,350 3,549,793 3,550,207 3,539,755

13BNCCORP, INC. Annual Report 2018
2017First
QuarterSecond Quarter
Third Quarter
Fourth Quarter YTD
Interest income $ 7,314 $ 7,901 $ 8,219 $ 8,009 $ 31,443
Interest expense 781 862 962 973 3,578
Net interest income 6,533 7,039 7,257 7,036 27,865
Provision for credit losses - 150 100 100 350
Net interest income after provision for credit losses 6,533 6,889 7,157 6,936 27,515
Non-interest income 4,747 5,157 5,180 4,415 19,499
Non-interest expense 9,858 10,131 9,576 9,551 39,116
Income before income taxes 1,422 1,915 2,761 1,800 7,898
Income tax expense 361 480 708 1,471 3,020
Net income $ 1,061 $ 1,435 $ 2,053 $ 329 $ 4,878
Basic earnings per common share $ 0.31 $ 0.41 $ 0.59 $ 0.09 $ 1.40
Diluted earnings per common share $ 0.30 $ 0.41 $ 0.58 $ 0.09 $ 1.38
Average common shares:
Basic 3,472,401 3,473,025 3,477,916 3,482,527 3,474,988
Diluted 3,541,246 3,540,264 3,542,989 3,544,209 3,540,698

BNCCORP, INC. Annual Report 201814
Operating StrategyBNC is a community bank that focuses on business banking, mortgage banking, and wealth management. We build value for shareholders by providing relationship-based financial services to small and mid-sized businesses, business owners, their employees and professionals. The key elements of our strategy include:
Providing individualized, high-level customer service. We provide a high level of customer service to establish and maintain long-term relationships. We believe that many of our competitors emphasize retail banking or focus on large companies, leaving the small and mid-sized business market underserved. Our consistent focus on the needs of such small and mid-sized businesses allows us to compete effectively in this market segment.
Diversification of products and services. We offer banking, mortgage banking, and wealth managementproducts and services to meet the financial needs of our customers, establish new relationships and expand our business opportunities. We seek to leverage our existing relationships by cross-selling our products and services.
Expand opportunistically. We emphasize organic growth within the markets that we serve and look to opportunistically expand into new lines of business and attractive markets. Organic growth in North Dakota is an emphasis as we believe in the viability of the energy and agricultural industries over the long term. In Arizona, our organic loan growth focuses on small businesses and the SBA arena. We are also willing to opportunistically grow through acquisitions.
Managing risk. Community banking is faced with several forms of inherent risk. We strive to manage risk by balancing the potential costs of various risks and the various rewards of banking opportunities.
Emphasize deposit growth. Growing low-cost core deposits is a key strategy. Our platforms and technologyoffers us a strategic opportunity to deliver high level deposit services to the businesses and professionals we serve and permits us to attract funds at a low cost.

15BNCCORP, INC. Annual Report 2018
Management’s Discussion and Analysis of Financial Condition and Results of Operations
Overview
The following table summarizes selected income statement data and earnings per share data (in thousands, except per share data):
2018 2017Selected Income Statement Data
Interest income $ 34,478 $ 31,443Interest expense 6,108 3,578
Net interest income 28,370 27,865Provision for credit losses - 350Non-interest income 19,017 19,499Non-interest expense 39,013 39,116Income before income taxes 8,374 7,898Income tax expense 1,538 3,020
Net income $ 6,836 $ 4,878
Earnings Per Share DataBasic earnings per common share $ 1.96 $ 1.40Diluted earnings per common share $ 1.93 $ 1.38
The following is a brief comparison of 2018 to 2017 performance:
In 2018, net interest income increased 1.8% from 2017 as a result of higher balances and yields on loans held for investment coupled with higher yields on investments, partially offset by increased deposit costs.
Non-interest income decreased $482 thousand, or 2.5%, in 2018, compared to 2017. The decrease primarily relates to an 11.2% decrease in mortgage banking revenue, net, partially offset by gains on sale of securities.
Credit quality remained strong in 2018. At December 31, 2018, our non-performing assets improved to0.17% of total assets, compared to 0.21% at December 31, 2017.
Non-interest expense decreased by $103 thousand, or 0.3%, in 2018. Salaries and employee benefits decreased $420 thousand, or 2.0%. Professional services expense decreased $550 thousand, or 14.0%,primarily due to reduced mortgage banking volumes and reduced legal fees. Marketing and promotion expenses increased $765 thousand, or 22.2%, largely attributed to increased competition for mortgage banking leads.
In 2018, the effective tax rate decreased to 18.4% from 38.2% in 2017. The decrease in the effective tax rate is primarily due to the enactment of federal tax legislation in late 2017 that reduced the statutory federal tax rate effective beginning January 1, 2018. The 2017 effective tax rate included the impact of a $1.208million deferred tax asset revaluation.

BNCCORP, INC. Annual Report 201816
General
Net income in 2018 was $6.836 million compared to net income of $4.878 million in 2017. Earnings per diluted share was $1.93 in 2018 and $1.38 in 2017.
Net Interest Income The following table sets forth information relating to our average balance sheet, yields on interest-earning assets and costs on interest-bearing liabilities (dollars are in thousands):
For the Year ended December 31, For the Year ended December 31, For the Year ended December 31,2018 2017 2016Interest Average Interest Average Interest Average
Average earned yield or Average earned yield or Average earned yield orbalance or owed cost balance or owed cost balance or owed cost
AssetsFederal funds sold/interest-bearing due
from banks $ 14,992 $ 260 1.74% $ 38,367 $ 416 1.08% $ 1,937 $ 11 0.57%Taxable investments 371,177 9,233 2.49% 345,621 7,546 2.18% 324,350 6,127 1.89%Tax-exempt investments 63,049 1,699 2.69% 90,324 2,695 2.98% 91,431 2,704 2.96%Loans held for sale-mortgage banking 25,772 1,069 4.15% 27,271 1,009 3.70% 49,944 1,649 3.30%Loans and leases held for investment 454,215 22,217 4.89% 420,906 19,777 4.70% 399,669 18,855 4.72%Allowance for credit losses (7,792) - 0.00% (7,949) - 0.00% (8,562) - 0.00%
Total interest-earning assets 921,413 34,478 3.72% 914,540 31,443 3.42% 858,769 29,346 3.42%Non-interest-earning assets:
Cash and due from banks 8,961 8,901 8,774 Other 48,972 47,591 46,474 Total assets $ 979,346 $ 971,032 $ 914,017
Liabilities and Stockholders’ EquityDeposits:
Interest checking and money market accounts $ 486,754 $ 2,439 0.50% $ 487,063 $ 953 0.20% $ 424,393 $ 571 0.13%
Savings 35,276 19 0.05% 35,067 11 0.03% 32,146 10 0.03% Certificates of deposit 171,531 2,303 1.34% 158,266 1,545 0.98% 150,720 1,593 1.06%Total interest-bearing deposits 693,561 4,761 0.69% 680,396 2,509 0.37% 607,259 2,174 0.36%Borrowings:
Short-term borrowings 17,944 74 0.41% 14,732 27 0.18% 13,919 22 0.16% FHLB advances 4,662 95 2.04% 1,903 16 0.84% 36,942 198 0.54% Long-term borrowings 10,000 635 6.35% 10,000 635 6.35% 10,000 634 6.34% Subordinated debentures 15,010 543 3.62% 15,012 391 2.60% 15,013 315 2.10%
Total interest-bearing liabilities 741,177 6,108 0.82% 722,043 3,578 0.50% 683,133 3,343 0.49% Non-interest-bearing demand accounts
154,984 - 0.00% 163,603 - 0.00% 145,842 - 0.00% Total deposits and interest-bearing
liabilities 896,161 885,646 828,975Other non-interest-bearing liabilities 7,253 6,967 9,525 Total liabilities 903,414 892,613 838,500Stockholders’ equity 75,932 78,419 75,517 Total liabilities and
stockholders’ equity $ 979,346 $ 971,032 $ 914,017Net interest income $ 28,370 $ 27,865 $ 26,003
Net interest spread 2.90% 2.92% 2.93%Net interest margin 3.08% 3.05% 3.03%
Ratio of average interest-earning assets to average interest-bearing liabilities 124.32% 126.66% 125.71%

17BNCCORP, INC. Annual Report 2018
The following table allocates changes in our interest income and interest expense between the changes related to volume and interest rates (in thousands):
For the Years Ended December 31, For the Years Ended December 31,2018 Compared to 2017 2017 Compared to 2016
Change Due to Change Due toVolume Rate Total Volume Rate Total
Interest Earned on Interest-Earning Assets
Federal funds sold/interest-bearing due from banks $ (330) $ 174 $ (156) $ 388 $ 17 $ 405
Taxable investments 583 1,104 1,687 386 1,033 1,419Tax-exempt investments (754) (242) (996) (33) 24 (9)
Loans held for sale- mortgage banking (58) 117 59 (823) 183 (640)
Loans held for investment 1,657 784 2,441 946 (24) 922
Total increase in interest income 1,098 1,937 3,035 864 1,233 2,097
Interest Expense on Interest-Bearing Liabilities
Interest checking and money market accounts 1 1,485 1,486 141 241 382
Savings - 9 9 1 - 1Certificates of Deposit 296 461 757 8 (56) (48)Short-term borrowings 7 40 47 1 4 5FHLB advances 40 39 79 (254) 72 (182)Long-term borrowings - - - - 1 1Subordinated debentures - 152 152 - 76 76
Total increase (decrease) in interest expense 344 2,186 2,530 (103) 338 235
Increase (decrease) in net interest income $ 754 $ (249) $ 505 $ 967 $ 895 $ 1,862
Net interest income was $28.370 million in 2018 compared to $27.865 million in 2017, an increase of $505thousand, or 1.8%. The net interest margin increased to 3.08% for the year ended December 31, 2018 from 3.05%in 2017. Overall, yields on earning assets were 3.72% in 2018 and 3.42% in 2017. Average loans held for investment increased $33.3 million in 2018, or 7.9%, compared to 2017, while average loans held for sale decreased $1.5million and average investments decreased $1.7 million. The cost of interest bearing deposits was 0.69% in 2018and 0.37% in 2017. The cost of interest bearing liabilities increased to 0.82% in 2018 from 0.50% in 2017. After successfully managing rising interest rates in recent years, the Company enacted certain adjustments to deposit rates in response to the most recent rate increases.
Net interest income was $27.865 million in 2017 compared to $26.003 million in 2016, an increase of $1.862 million or 7.2%. The net interest margin increased to 3.05% for the year ended December 31, 2017 from 3.03% in 2016.Overall, yields on earning assets were 3.42% in 2017 and 2016. Average loans held for investment increased $21.2 million in 2017, or 5.3%, compared to 2016, while average loans held for sale decreased $22.7 million and average investments increased $21.6 million. The cost of interest bearing deposits was 0.37% in 2017 and 0.36% in 2016.The cost of interest bearing liabilities increased to 0.50% from 0.49%.

BNCCORP, INC. Annual Report 201818
Non-interest Income The following table presents the major categories of our non-interest income (dollars are in thousands):
For the Years Ended December 31, Increase (Decrease)
2018 2017 $ %Bank charges and service fees $ 2,687 $ 2,719 $ (32) (1) %Wealth management revenues 1,810 1,717 93 5 % (a)Mortgage banking revenues, net 10,032 11,301 (1,269) (11) % (b)
Gains on sales of loans, net 187 736 (549) (75) % (c)Gains on sales of securities, net 2,293 745 1,548 208 % (d)Other 2,008 2,281 (273) (12) % (e)Total non-interest income $ 19,017 $ 19,499 $ (482) (2) %
(a) Wealth management revenues increased as average assets under administration were higher during 2018. (b) Mortgage banking revenues were lower in 2018 as increasing rates resulted in lower mortgage production and
compressed margins. The rate of decline slowed from a 49% reduction from 2016 to 2017.(c) Gains on sale of loans can vary significantly from period to period. Recently, the Company has retained the
guaranteed portion of SBA loans as the premiums investors are willing to pay have compressed.(d) Gains and losses on sales of securities may vary significantly from period to period. 2017 included losses on sales of
securities intended to maximize the positive impact of tax reform. (e) Other income in 2018 included $1.442 million of income resulting from the divestiture of a portfolio company by one
of our SBIC Fund investments. Other income in 2017 included funds associated with a legal settlement, as well as a gain on the sale of a bank branch.
Non-interest Expense The following table presents the major categories of our non-interest expense (dollars are in thousands):
For the Years Ended December 31, Increase (Decrease)
2018 2017 $ %Salaries and employee benefits $ 20,074 $ 20,494 $ (420) (2) %Professional services 3,378 3,928 (550) (14) % (a)Data processing fees 4,027 3,716 311 8 % (b)Marketing and promotion 4,212 3,447 765 22 % (c)Occupancy 2,408 2,436 (28) (1) %Regulatory costs 540 556 (16) (3) %Depreciation and amortization 1,545 1,627 (82) (5) %Office supplies and postage 574 629 (55) (9) % (d)
Other real estate costs - (31) 31 (100) % (e)Other 2,255 2,314 (59) (3) %Total non-interest expense $ 39,013 $ 39,116 $ (103) - %Efficiency ratio 82.33% 82.59% (0.26)%
(a) Professional service expense is lower due to reduced mortgage banking activity and legal costs.(b) Data processing fees increased as standard core processing costs continue to increase along with additional
infrastructure expense to expand our current platform in response to continued customer growth.(c) Marketing and promotion increased primarily due increased competition for mortgage banking leads.(d) Office supplies and postage decreased as the Company continues to more efficiently distribute hardcopy data.(e) Other real estate costs will vary from period to period depending on valuation adjustments on our foreclosed
properties– see Note 6 of our Consolidated Financial Statements. At December 31, 2018, the Company held no property in other real estate.
19BNCCORP, INC. Annual Report 2018
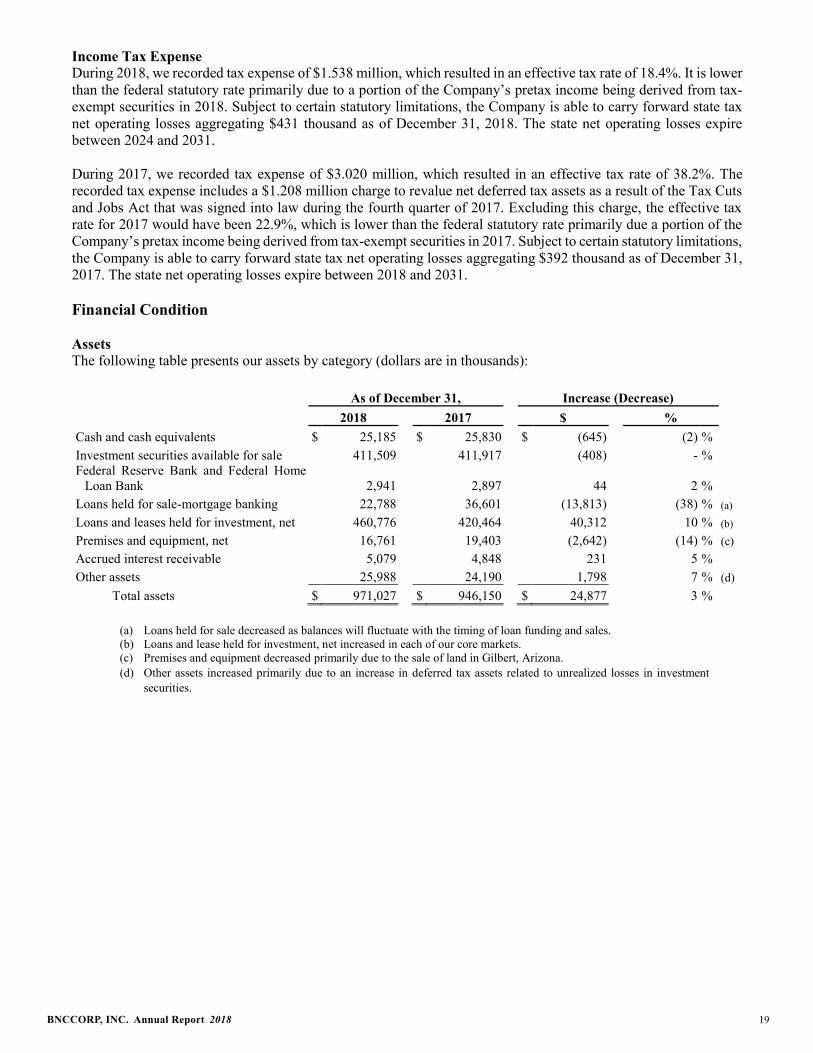
Income Tax ExpenseDuring 2018, we recorded tax expense of $1.538 million, which resulted in an effective tax rate of 18.4%. It is lower than the federal statutory rate primarily due to a portion of the Company’s pretax income being derived from tax-exempt securities in 2018. Subject to certain statutory limitations, the Company is able to carry forward state tax net operating losses aggregating $431 thousand as of December 31, 2018. The state net operating losses expire between 2024 and 2031.
During 2017, we recorded tax expense of $3.020 million, which resulted in an effective tax rate of 38.2%. The recorded tax expense includes a $1.208 million charge to revalue net deferred tax assets as a result of the Tax Cuts and Jobs Act that was signed into law during the fourth quarter of 2017. Excluding this charge, the effective tax rate for 2017 would have been 22.9%, which is lower than the federal statutory rate primarily due a portion of the Company’s pretax income being derived from tax-exempt securities in 2017. Subject to certain statutory limitations,the Company is able to carry forward state tax net operating losses aggregating $392 thousand as of December 31, 2017. The state net operating losses expire between 2018 and 2031.
Financial Condition
AssetsThe following table presents our assets by category (dollars are in thousands):
As of December 31, Increase (Decrease)2018 2017 $ %
Cash and cash equivalents $ 25,185 $ 25,830 $ (645) (2) %Investment securities available for sale 411,509 411,917 (408) - %Federal Reserve Bank and Federal Home
Loan Bank 2,941 2,897 44 2 %Loans held for sale-mortgage banking 22,788 36,601 (13,813) (38) % (a)
Loans and leases held for investment, net 460,776 420,464 40,312 10 % (b)Premises and equipment, net 16,761 19,403 (2,642) (14) % (c)Accrued interest receivable 5,079 4,848 231 5 %Other assets 25,988 24,190 1,798 7 % (d) Total assets $ 971,027 $ 946,150 $ 24,877 3 %
(a) Loans held for sale decreased as balances will fluctuate with the timing of loan funding and sales.(b) Loans and lease held for investment, net increased in each of our core markets. (c) Premises and equipment decreased primarily due to the sale of land in Gilbert, Arizona.(d) Other a ssets increased primarily due to an increase in deferred tax assets related to unrealized losses in investment
securities.
BNCCORP, INC. Annual Report 201820
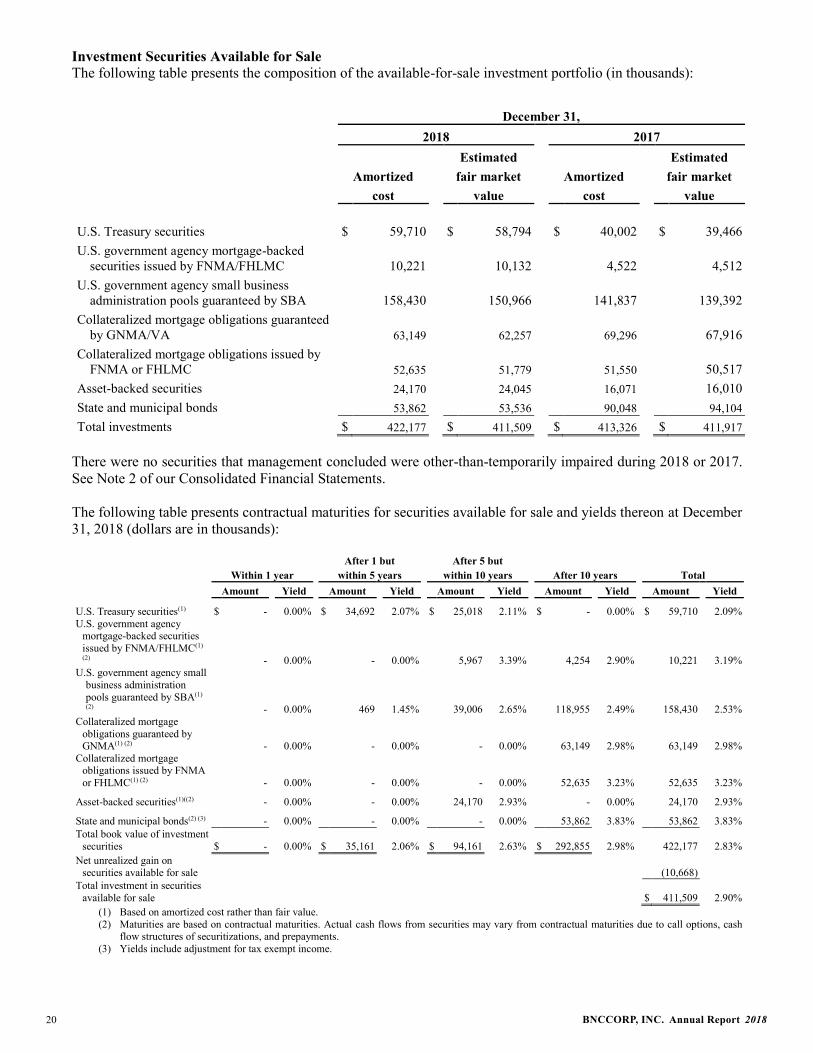
Investment Securities Available for SaleThe following table presents the composition of the available-for-sale investment portfolio (in thousands):
December 31,2018 2017
Estimated EstimatedAmortized fair market Amortized fair market
cost value cost value
U.S. Treasury securities $ 59,710 $ 58,794 $ 40,002 $ 39,466U.S. government agency mortgage-backed
securities issued by FNMA/FHLMC 10,221 10,132 4,522 4,512U.S. government agency small business
administration pools guaranteed by SBA 158,430 150,966 141,837 139,392Collateralized mortgage obligations guaranteed
by GNMA/VA 63,149 62,257 69,296 67,916Collateralized mortgage obligations issued by
FNMA or FHLMC 52,635 51,779 51,550 50,517Asset-backed securities 24,170 24,045 16,071 16,010State and municipal bonds 53,862 53,536 90,048 94,104Total investments $ 422,177 $ 411,509 $ 413,326 $ 411,917
There were no securities that management concluded were other-than-temporarily impaired during 2018 or 2017.See Note 2 of our Consolidated Financial Statements.
The following table presents contractual maturities for securities available for sale and yields thereon at December 31, 2018 (dollars are in thousands):
After 1 but After 5 butWithin 1 year within 5 years within 10 years After 10 years Total
Amount Yield Amount Yield Amount Yield Amount Yield Amount Yield
U.S. Treasury securities(1) $ - 0.00% $ 34,692 2.07% $ 25,018 2.11% $ - 0.00% $ 59,710 2.09%U.S. government agency
mortgage-backed securities issued by FNMA/FHLMC(1)
(2) - 0.00% - 0.00% 5,967 3.39% 4,254 2.90% 10,221 3.19%U.S. government agency small
business administration pools guaranteed by SBA(1)
(2) - 0.00% 469 1.45% 39,006 2.65% 118,955 2.49% 158,430 2.53%Collateralized mortgage
obligations guaranteed by GNMA(1) (2) - 0.00% - 0.00% - 0.00% 63,149 2.98% 63,149 2.98%
Collateralized mortgage obligations issued by FNMA or FHLMC(1) (2) - 0.00% - 0.00% - 0.00% 52,635 3.23% 52,635 3.23%
Asset-backed securities(1)((2) - 0.00% - 0.00% 24,170 2.93% - 0.00% 24,170 2.93%
State and municipal bonds(2) (3) - 0.00% - 0.00% - 0.00% 53,862 3.83% 53,862 3.83%Total book value of investment
securities $ - 0.00% $ 35,161 2.06% $ 94,161 2.63% $ 292,855 2.98% 422,177 2.83%Net unrealized gain on
securities available for sale (10,668)Total investment in securities
available for sale $ 411,509 2.90%(1) Based on amortized cost rather than fair value.(2) Maturities are based on contractual maturities. Actual cash flows from securities may vary from contractual maturities due to call options, cash
flow structures of securitizations, and prepayments.(3) Yields include adjustment for tax exempt income.

21BNCCORP, INC. Annual Report 2018
As of December 31, 2018, we had $411.5 million of available-for-sale securities in the investment portfolio compared to $411.9 million at December 31, 2017.
In 2018, available-for-sale investment securities were relatively unchanged as compared to 2017.
At December 31, 2018, all classifications of investment securities available for sale exceeded 10% of stockholders’ equity. A portion of our investment securities portfolio was pledged as collateral.
See Note 2 of our Consolidated Financial Statements for more information about investment securities.
Federal Reserve Bank and Federal Home Loan BankOur equity securities consisted of $1.8 million of Federal Reserve Bank (“FRB”) stock and $1.1 million of Federal Home Loan Bank (“FHLB”) stock as of December 31, 2018 and December 31, 2017.
LoansThe following table presents our loan portfolio as of December 31 (dollars are in thousands):
2018 2017 2016 2015 2014
Amount % Amount % Amount % Amount % Amount %
Loans held for sale-mortgage banking $ 22,788 100.0 $ 36,601 100.0 $ 39,641 100.0 $ 50,445 100.0 $ 47,109 100.0
Loans Held for Investment:
Commercial and industrial $ 149,886 32.0 $ 126,169 29.4 $ 123,604 29.8 $ 125,009 32.9 $ 132,229 36.6
Commercial real estate 174,868 37.3 177,429 41.4 171,972 41.5 149,099 39.3 108,122 30.0
SBA 32,505 6.9 25,064 5.9 31,518 7.6 25,860 6.8 26,972 7.5
Consumer 78,055 16.7 71,876 16.8 59,183 14.3 47,073 12.4 40,470 11.2
Land and land development 11,398 2.4 14,168 3.3 15,982 3.9 17,627 4.6 28,220 7.8
Construction 21,257 4.5 13,167 3.1 12,215 2.9 15,187 4.0 24,916 6.9
467,969 99.9 427,873 99.9 414,474 100.0 379,855 100.0 360,929 100.0 Unearned income and
net unamortized deferred fees and costs 499 0.1 452 0.1 199 - 48 - (140) -
Loans, net of unearned income and unamortized fees and costs $ 468,468 100.0 $ 428,325 100.0 $ 414,673 100.0 $ 379,903 100.0 $ 360,789 100.0

BNCCORP, INC. Annual Report 201822
The following table presents the change in our loan portfolio (dollars are in thousands):
December 31, Increase (Decrease)2018 2017 $ %
Loans held for sale-mortgage banking $ 22,788 $ 36,601 $ (13,813) (37.7) % (a)
Loans Held for Investment:Commercial and industrial $ 149,886 $ 126,169 $ 23,717 18.8 %Commercial real estate 174,868 177,429 (2,561) (1.4) %SBA 32,505 25,064 7,441 29.7 % (b)Consumer 78,055 71,876 6,179 8.6 % (c)Land and land development 11,398 14,168 (2,770) (19.6) %Construction 21,257 13,167 8,090 61.4 %
467,969 427,873 40,096 9.4 %Unearned income and net unamortized
deferred fees and costs 499 452 47 10.4 %Loans, net of unearned income and
unamortized fees and costs $ 468,468 $ 428,325 $ 40,143 9.4 % (d)
(a) Loans held for sale decreased as balances will fluctuate with the timing of loan funding and sales.(b) The Company has retained the guaranteed portion of SBA loans as the premiums investors are willing to pay have
compressed.(c) Consumer loans increased primarily due to North Dakota indirect vehicle lending.(d) Loans held for investment increased due to continued loan production in our core markets.
Loan ParticipationsPursuant to our lending policy, loans may not exceed 85% of the Bank’s legal lending limit (except to the extent collateralized by U.S. Treasury securities or Bank deposits and, accordingly, excluded from the Bank’s legal lending limit) unless the Chief Credit Officer and the Executive Credit Committee grant prior approval. To accommodate customers whose financing needs exceed lending limits and internal loan concentration limits, the Bank sells loan participations to outside participants without recourse.
Loan participations sold on a nonrecourse basis to outside financial institutions were as follows as of December 31 (in thousands):
2018 $ 166,2912017 176,7332016 182,2242015 176,4392014 180,192

23BNCCORP, INC. Annual Report 2018
Concentrations of CreditThe following table summarizes the location of our borrowers as of December 31 (dollars are in thousands):
2018 2017North Dakota $ 325,646 70 % $ 304,129 71 %Arizona 80,896 17 % 65,284 15 %Minnesota 32,215 7 % 24,144 6 %Other 29,212 6 % 34,316 8 %
Total gross loans held for investment $ 467,969 100 % $ 427,873 100 %
Our borrowers use loan proceeds for projects in various geographic areas. The following table summarizes the locations where our borrowers are using loan proceeds as of December 31 (dollars are in thousands):
2018 2017North Dakota $ 302,813 65 % $ 286,075 67 %Arizona 99,394 21 % 88,514 21 %Minnesota 25,870 5 % 16,697 4 %California 12,521 3 % 9,965 2 %Colorado 9,266 2 % 8,416 2 %Ohio 7,814 2 % 8,134 2 %South Dakota 5,331 1 % 3,824 1 %Other 4,960 1 % 6,248 1 %
Total gross loans held for investment $ 467,969 100 % $ 427,873 100 %
The following table presents loans by type as of December 31 (in thousands):
2018 2017Total Loans and Leases Held for
Investment
Total Loans and Leases Held for
InvestmentNorth Dakota
Commercial and industrial $ 45,241 $ 36,590Construction 4,439 4,747Agricultural 25,525 23,004Land and land development 7,932 8,494Owner-occupied commercial real estate 42,591 44,173Commercial real estate 109,829 108,191Small business administration 5,044 4,558Consumer 62,212 56,318
Subtotal $ 302,813 $ 286,075Consolidated
Commercial and industrial $ 66,545 $ 51,524Construction 21,257 13,167Agricultural 26,425 23,773Land and land development 11,398 14,168Owner-occupied commercial real estate 56,916 50,872Commercial real estate 174,868 177,429Small business administration 32,505 25,064Consumer 78,055 71,876
Subtotal $ 467,969 $ 427,873

BNCCORP, INC. Annual Report 201824
Loan Maturities (1)
The following table sets forth the remaining maturities of loans in our portfolio as of December 31, 2018 (in thousands):
TotalLoans and
LeasesHeld for
Investment
Over 1 yearthrough 5 years Over 5 years
One yearor less
FixedRate
IndexedRate
FixedRate
IndexedRate
Commercial and industrial $ 18,979 $ 6,792 $ 17,418 $ 52,447 $ 54,250 $ 149,886Commercial real estate 1,000 1,821 1,741 41,120 129,186 174,868SBA 1,778 600 4,440 3,331 22,356 32,505Consumer 1,468 427 3,848 63,581 8,731 78,055Land and land development 1,300 1,033 1,296 5,971 1,798 11,398Construction 2,434 3,590 15,233 - - 21,257Total principal amount of loans $ 26,959 $ 14,263 $ 43,976 $ 166,450 $ 216,321 $ 467,969
(1) Maturities are based on contractual maturities. Indexed rate loans include loans that would reprice prior to maturity if base rates change.
Actual maturities may differ from the contractual maturities shown above as a result of renewals and prepayments. Loan renewals are evaluated in substantially the same manner as new credit applications.
Provision for Credit LossesWe provide for credit losses to maintain our allowance for credit losses at a level adequate to cover estimated probable losses inherent in the portfolio as of each balance sheet date. In 2018, no provision for credit losses was recorded, compared to $350 thousand in 2017.
Allowance for Credit LossesSee Notes 1 and 5 of our Consolidated Financial Statements and “Significant Accounting Policies” for further information concerning accounting policies associated with the allowance for credit losses.

25BNCCORP, INC. Annual Report 2018
Analysis of Allowance for Credit Losses The following table summarizes activity in the allowance for credit losses and certain ratios (dollars are in thousands):
For the Years ended December 31,2018 2017 2016 2015 2014
Balance of allowance for credit losses, beginning of period $ 7,861 $ 8,285 $ 8,611 $ 8,601 $ 9,847
Charge-offs:Commercial and industrial (71) (84) (1,004) (47) -Commercial real estate (1) - - - (439)SBA (59) (566) (71) (145) (109)Consumer (129) (123) (99) (43) (42)Land and land development - (103) - - (190)Construction - - - - - Total charge-offs (260) (876) (1,174) (235) (780)
Recoveries:Commercial and industrial 40 - - 7 -Commercial real estate 16 12 13 551 8SBA 4 48 15 68 5Consumer 31 40 20 19 21Land and land development - 2 - - 300Construction - - - - -
91 102 48 645 334(169) (774) (1,126) 410 (446)
- 350 800 (400) (800)
$ 7,692 $ 7,861 $ 8,285 $ 8,611 $ 8,601
(0.035)% (0.173)% (0.250)% 0.103% (0.123)%
(0.037)% (0.184)% (0.282)% 0.117% (0.134)%
$ 454,215 $ 420,906 $ 399,669 $ 350,840 $ 331,982
1.64% 1.84% 2.00% 2.27% 2.38%1.57% 1.69% 1.82% 2.00% 2.11%
Total recoveries Net (charge-offs) recoveries Provision (reduction) for credit losses
charged to operations Balance of allowance for credit losses,
end of period Ratio of net (charge-offs) recoveries to
average total loans Ratio of net (charge-offs) recoveries to
average loans and leases held for investmentAverage gross loans and leases held for
investmentRatio of allowance for credit losses to loans
and leases held for investment Allowance for credit losses to total loans Ratio of nonperforming loans to total assets 0.17% 0.21% 0.27% 0.06% 0.01%

BNCCORP, INC. Annual Report 201826
Allocation of the Allowance for Loan Losses The table below presents an allocation of the allowance for credit losses among the various loan categories and sets forth the percentage of loans in each category to gross loans. The allocation of the allowance for credit losses as shown in the table should neither be interpreted as an indication of future charge-offs, nor as an indication that charge-offs in future periods will necessarily occur in these amounts or in the indicated proportions as of December 31 (dollars are in thousands).
2018 2017 2016 2015 2014
Allocation of Allowance
Loans as a % of Gross Loans Held
for Investment
Allocation of Allowance
Loans as a % of Gross Loans Held
for Investment
Allocation of Allowance
Loans as a % of Gross Loans Held
for Investment
Allocation of Allowance
Loans as a % of Gross Loans Held
for Investment
Allocation of Allowance
Loans as a % of Gross Loans Held
for Investment
Commercial and industrial $ 1,937 32% $ 2,158 30% $ 2,323 30% $ 3,205 33% $ 2,686 37%
Commercial real estate 3,558 37% 3,471 41% 3,231 41% 1,999 39% 2,496 30%
SBA 845 7% 834 6% 1,433 8% 1,578 7% 1,190 7%
Consumer 928 17% 914 17% 772 14% 640 12% 516 11%Land and land
development 225 2% 358 3% 413 4% 1,041 5% 1,436 8%
Construction 199 5% 126 3% 113 3% 148 4% 277 7%
Total $ 7,692 100% $ 7,861 100% $ 8,285 100% $ 8,611 100% $ 8,601 100%
The amount of the allowance for losses can vary depending on macroeconomic conditions and risk in the portfolio. The allocation of the allowance for losses can vary depending on relative volume of asset groups in the portfolio and risks therein.
Allowance for Credit Losses; Impact on EarningsWe have established the allowance for credit losses to cover probable losses inherent within the loan and leaseportfolio at the balance sheet dates. The allowance for credit losses is an estimate based upon several judgmental factors. We are not aware of known trends, commitments or other events that could reasonably occur that would materially affect our methodology or the assumptions used to estimate the allowance for credit losses. However, changes in qualitative and quantitative factors could occur at any time and such changes could be of a material nature. In addition, economic situations, financial conditions of borrowers, and other factors we consider in arriving at our estimates may change. To the extent that these matters have negative developments, our future earnings could be reduced by provisions for credit losses. See the Concentrations of Credit section within this report for additional information.

27BNCCORP, INC. Annual Report 2018
Nonperforming Loans and AssetsThe following table sets forth nonperforming assets, the allowance for credit losses and certain related ratios (dollars are in thousands):
As of December 31,2018 2017 2016 2015 2014
Nonperforming loans:
Loans 90 days or more delinquent and still accruing interest $ - $ 26 $ 20 $ 175 $ 5
Non-accrual loans 1,686 1,952 2,425 390 56 Total nonperforming loans 1,686 1,978 2,445 565 61Other real estate and repossessed assets, net - - 218 242 256 Total nonperforming assets $ 1,686 $ 1,978 $ 2,663 $ 807 $ 317Allowance for credit losses $ 7,692 $ 7,861 $ 8,285 $ 8,611 $ 8,601Ratio of total nonperforming loans to total loans 0.34% 0.43% 0.54% 0.13% 0.01%Ratio of total nonperforming loans to loans and
leases held for investment 0.36% 0.46% 0.59% 0.15% 0.02%Ratio of total nonperforming assets to total assets 0.17% 0.21% 0.29% 0.09% 0.03%Ratio of total nonperforming loans to total assets 0.17% 0.21% 0.27% 0.06% 0.01%Ratio of allowance for credit losses to total
nonperforming loans 456% 397% 339% 1,524% 14,100%
Nonperforming LoansThe following table sets forth information concerning our nonperforming loans as of December 31 (in thousands):
2018 2017Balance, beginning of period $ 1,978 $ 2,445Additions to nonperforming 349 938Charge-offs (194) (790)Reclassified back to performing (26) -Principal payments received (409) (551)Transferred to repossessed assets (12) (24)Transferred to other real estate owned - (40)Balance, end of period $ 1,686 $ 1,978
The following table indicates the effect on income if interest on non-accrual and restructured loans outstanding at year end had been recognized at original contractual rates during the year ended December 31 (in thousands):
2018 2017Interest income that would have been recorded $ 436 $ 372Interest income recorded 88 89Effect on interest income $ 348 $ 283
Loans 90 days or more delinquent and still accruing interest include loans over 90 days past due which we believe, based on our specific analysis of the loans, do not present doubt about the collection of interest and principal in accordance with the loan contract. Loans in this category must be well secured and in the process of collection.

BNCCORP, INC. Annual Report 201828
Non-accrual loans include loans on which the accrual of interest has been discontinued. Accrual of interest is discontinued when we believe that the borrower’s financial condition is such that the collection of interest is doubtful. A delinquent loan is generally placed on non-accrual status when it becomes 90 days or more past due unless the loan is well secured and in the process of collection. When a loan is placed on non-accrual status, accrued but uncollected interest income applicable to the current reporting period is reversed against interest income. Accrued but uncollected interest income applicable to previous reporting periods is charged against the allowance for credit losses. No additional interest is accrued on the loan balance until the collection of both principal and interest becomes reasonably certain.
Troubled Debt Restructuring (TDR)The table below summarizes the amounts of restructured loans as of December 31 (in thousands):
Total Accrual Non-accrual2018 $ 3,348 $ 1,779 $ 1,5692017 1,908 1,801 1072016 2,153 1,845 3082015 2,197 1,884 3132014 5,105 5,105 -
See Note 5 of our Consolidated Financial Statements for information on troubled debt restructuring.
Other real estate owned and repossessed assets represent properties and other assets acquired through, or in lieu of, loan foreclosure, and property transferred from premises and equipment. They are initially recorded at fair value less cost to sell at the date of acquisition establishing a new cost basis. Write-downs to fair value at the time of acquisition are charged to the allowance for credit losses. After foreclosure, we perform valuations periodically and the real estate is recorded at fair value less cost to sell. Reductions to other real estate owned and repossessed assets are considered valuation allowances. Expenses incurred to record valuation allowances subsequent to foreclosure are charged to non-interest expense.
See Note 6 of our Consolidated Financial Statements for information on other real estate owned.
Impaired loansSee Note 5 of our Consolidated Financial Statements for information on impaired loans.
Potential Problem LoansWe attempt to quantify potential problem loans with more immediate credit risk. The table below summarizes the amounts of potential problem loans as of December 31 (in thousands):
Watch List SubstandardImpaired Other Total Impaired Other Total
2018 $ - $ 5,206 $ 5,206 $ 106 $ 9,069 $ 9,1752017 - 1,730 1,730 52 9,062 9,1142016 - 8,125 8,125 6 10,511 10,5172015 - 7,945 7,945 11 9,398 9,4092014 1,587 473 2,060 56 9,077 9,133
A significant portion of these potential problem loans are not in default but may have characteristics such as recent adverse operating cash flows or general risk characteristics that the loan officer feels might jeopardize the future timely collection of principal and interest payments. The ultimate resolution of these credits is subject to changes in economic conditions and other factors. These loans are closely monitored to ensure that our position as creditor is protected to the fullest extent possible.
29BNCCORP, INC. Annual Report 2018
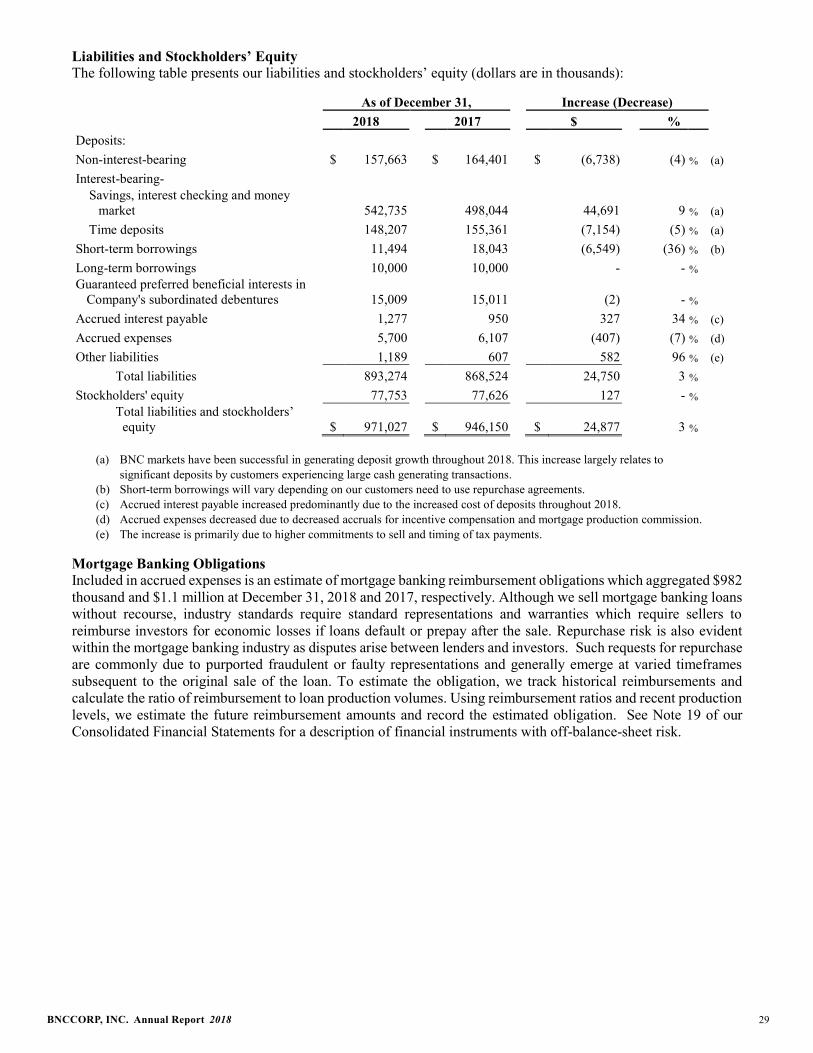
Liabilities and Stockholders’ EquityThe following table presents our liabilities and stockholders’ equity (dollars are in thousands):
As of December 31, Increase (Decrease)2018 2017 $ %
Deposits:Non-interest-bearing $ 157,663 $ 164,401 $ (6,738) (4) % (a)Interest-bearing-
Savings, interest checking and money market 542,735 498,044 44,691 9 % (a)
Time deposits 148,207 155,361 (7,154) (5) % (a)Short-term borrowings 11,494 18,043 (6,549) (36) % (b)Long-term borrowings 10,000 10,000 - - %Guaranteed preferred beneficial interests in
Company's subordinated debentures 15,009 15,011 (2) - %
Accrued interest payable 1,277 950 327 34 % (c)Accrued expenses 5,700 6,107 (407) (7) % (d)Other liabilities 1,189 607 582 96 % (e) Total liabilities 893,274 868,524 24,750 3 %
Stockholders' equity 77,753 77,626 127 - % Total liabilities and stockholders’
equity $ 971,027 $ 946,150 $ 24,877 3 %
(a) BNC markets have been successful in generating deposit growth throughout 2018. This increase largely relates to significant deposits by customers experiencing large cash generating transactions.
(b) Short-term borrowings will vary depending on our customers need to use repurchase agreements.(c) Accrued interest payable increased predominantly due to the increased cost of deposits throughout 2018. (d) Accrued expenses decreased due to decreased accruals for incentive compensation and mortgage production commission. (e) The increase is primarily due to higher commitments to sell and timing of tax payments.
Mortgage Banking ObligationsIncluded in accrued expenses is an estimate of mortgage banking reimbursement obligations which aggregated $982thousand and $1.1 million at December 31, 2018 and 2017, respectively. Although we sell mortgage banking loans without recourse, industry standards require standard representations and warranties which require sellers to reimburse investors for economic losses if loans default or prepay after the sale. Repurchase risk is also evident within the mortgage banking industry as disputes arise between lenders and investors. Such requests for repurchase are commonly due to purported fraudulent or faulty representations and generally emerge at varied timeframes subsequent to the original sale of the loan. To estimate the obligation, we track historical reimbursements and calculate the ratio of reimbursement to loan production volumes. Using reimbursement ratios and recent production levels, we estimate the future reimbursement amounts and record the estimated obligation. See Note 19 of our Consolidated Financial Statements for a description of financial instruments with off-balance-sheet risk.

BNCCORP, INC. Annual Report 201830
DepositsThe following table sets forth, for the periods indicated, the distribution of our average deposit account balances and average cost of funds rates on each category of deposits (dollars are in thousands):
For the Years Ended December 31,
2018 2017 2016Percent Wgtd. Percent Wgtd. Percent Wgtd.
Average of avg. Average of avg. Average of avg.balance deposits rate balance deposits rate balance deposits rate
Interest checking and MMDAs $ 486,754 57.4% 0.50% $ 487,063 57.7% 0.20% $ 424,393 56.4% 0.13%
Savings deposits 35,276 4.2% 0.05% 35,067 4.1% 0.03% 32,146 4.3% 0.03%Time deposits 171,531 20.2% 1.34% 158,266 18.8% 0.98% 150,720 20.0% 1.05%Total interest-bearing
deposits 693,561 81.7% 0.69% 680,396 80.6% 0.37% 607,259 80.7% 0.36%Non-interest-bearing
demand deposits 154,984 18.3% 0.00% 163,603 19.4% 0.00% 145,842 19.3% 0.00%
Total deposits (1) $ 848,545 100.0% 0.56% $ 843,999 100.0% 0.30% $ 753,101 100.0% 0.29%
(1) Included in average total deposits are $18.2 million, $0, and $11.7 million of average brokered deposits for the years ending 2018, 2017, and 2016,respectively.
During periods of higher energy prices our North Dakota deposits grew rapidly. In 2017, a ND Bakken branch with $14.0 million of deposits was sold for a gain of $864 thousand. Excluding the effect of the sold branch, ND Bakken deposits rose slightly compared to December 2016. In recent periods, deposits in North Dakota and Arizona have grown significantly. The table below shows total deposits since 2014 (in thousands):
As of December 31,2018 2017 2016 2015 2014
ND Bakken Branches $ 185,713 $ 168,981 $ 178,677 $ 190,670 $ 178,565ND Non-Bakken Branches 431,246 435,255 384,476 388,630 433,129Total ND Branches 616,959 604,236 563,153 579,300 611,694Brokered Time Deposits - - - 33,363 53,955Other 231,646 213,570 189,474 167,786 145,582Total Deposits $ 848,605 $ 817,806 $ 752,627 $ 780,449 $ 811,231
Time deposits, in denominations of $250,000 and over, totaled $34.2 million at December 31, 2018 as compared to $28.9 million at December 31, 2017. The following table sets forth the amount and maturities of time deposits of $250,000 and over as of December 31, 2018 (in thousands):
Maturing in:3 months or less $ 4,703Over 3 months through 6 months 4,734Over 6 months through 12 months 9,141
Over 12 months 15,634$ 34,212

31BNCCORP, INC. Annual Report 2018
Borrowed FundsThe following table provides a summary of our short-term borrowings and related cost information as of, or for the years ended, December 31 (dollars are in thousands):
2018 2017 2016Short-term borrowings outstanding at period end $ 11,494 $ 18,043 $ 12,510Weighted average interest rate at period end 0.84% 0.25% 0.15%Maximum month end balance during the period $ 19,955 $ 24,671 $ 16,901Average borrowings outstanding for the period $ 17,944 $ 14,732 $ 13,919Weighted average interest rate for the period 0.41% 0.18% 0.16%
Note 9 of our Consolidated Financial Statements summarizes the general terms of our short-term borrowings outstanding at December 31, 2018 and 2017.
FHLB advances totaled $0 at December 31, 2018 and December 31, 2017.
Notes 10, 11 and 12 of our Consolidated Financial Statements summarize the general terms of our FHLB advances,long-term borrowings and other borrowings at December 31, 2018 and 2017.
Guaranteed Preferred Beneficial Interests in Company’s Subordinated DebenturesSee Note 13 of our Consolidated Financial Statements for a description of the subordinated debentures.
Capital Resources
2018 2017 2016 2015 2014Tier 1 leverage (Consolidated) 9.97% 9.53% 9.47% 9.00% 9.94%Total risk based capital (Consolidated) 20.26% 19.98% 19.96% 20.07% 21.10%Common equity tier 1 risk based capital (Consolidated) 14.67% 14.15% 13.90% 13.57% N/ATier 1 risk based capital (Consolidated) 17.28% 16.90% 16.78% 16.72% 19.85%Tangible common equity (Consolidated) 7.99% 8.18% 8.13% 7.62% 6.67%Tier 1 leverage (BNC Bank) 9.92% 9.62% 9.67% 9.45% 9.13%Total risk based capital (BNC Bank) 18.44% 18.31% 18.41% 18.71% 19.73%Common equity tier 1 risk based capital (BNC Bank) 17.19% 17.06% 17.16% 17.45% N/ATier 1 risk based capital (BNC Bank) 17.19% 17.06% 17.16% 17.45% 18.48%
See Note 14 and Note 15 of our Consolidated Financial Statements for a discussion of stockholders equity and regulatory capital and the current operating environment.
The Common equity tier 1 (CET 1) ratio, which is generally a comparison of a bank’s core equity capital with its total risk weighted assets, is a measure of the current risk profile of our asset base from a regulatory perspective. The Tier 1 leverage ratio, which is calculated by dividing Tier 1 capital by average total assets, does not consider the mix of risk weighted assets. Regulators have required Tier 1 ratios that significantly exceed the “Well Capitalized” ratio levels. As such, we are managing our Tier 1 leverage ratio to levels significantly above the “Well Capitalized” thresholds. Although Tangible Common Equity (TCE) is not a regulatory capital measure, TCE is a ratio that is commonly used to assess the capital strength of banking entities. Accordingly, we have included the ratio in the regulatory capital table below.
The Company routinely evaluates the sufficiency of its capital in order to insure compliance with regulatory capital standards and be a source of strength for the Bank. We manage capital by assessing the composition of capital and amounts available for growth, risk or other purposes. Management will continue to evaluate capital requirements and prudent capital management opportunities. See Note 13 of our Consolidated Financial Statements for a detailed description of Subordinated Debentures.

BNCCORP, INC. Annual Report 201832
Off-Balance-Sheet ArrangementsIn the normal course of business, we are a party to various financial instruments with off-balance-sheet risk. These instruments include commitments to extend credit, standby and commercial letters of credit, and performance and financial standby letters of credit. Such instruments help us to meet the needs of our customers, manage our interest rate risk and effectuate various transactions. These instruments and commitments, which we enter into for purposes other than trading, carry varying degrees of credit, interest rate or liquidity risk. See Note 19 of our Consolidated Financial Statements for a detailed description of each of these instruments.
Contractual Obligations, Contingent Liabilities and CommitmentsWe are a party to financial instruments with risks that can be subdivided into three categories:
Cash financial instruments, generally characterized as on-balance-sheet items, include investments, loans, mortgage-backed securities, deposits and debt obligations.
Credit-related financial instruments, generally characterized as off-balance-sheet items, include such instruments as commitments to extend credit, commitments to sell mortgage loans, commercial letters of credit and performance and financial standby letters of credit. See Note 19 of our Consolidated Financial Statements.
Investment-related financial instruments, characterized as an off-balance-sheet item, include potential funding for investments in Small Business Investment Companies (SBIC). See Note 20 of our Consolidated FinancialStatements.
At December 31, 2018, the aggregate contractual obligations (excluding bank deposits) and commitments were as follows (in thousands):
Payments due by periodLess than 1
Contractual Obligations: year 1 to 3 years 3 to 5 years After 5 years Total
Total borrowings $ 11,494 $ - $ - $ 25,009 $ 36,503Commitments to sell loans 22,495 - - - 22,495Annual rental commitments under non-
cancelable operating leases 1,155 1,818 1,407 855 5,235Total $ 35,144 $ 1,818 $ 1,407 $ 25,864 $ 64,233
Amount of Commitment - Expiration by PeriodLess than 1
Other Commitments: year 1 to 3 years 3 to 5 years After 5 years Total
Commitments to originate loans $ 122,507 $ 19,587 $ 5,801 $ 1,230 $ 149,125Commitments to sell loans 93,319 - - - 93,319Standby and commercial letters of
credit 885 10 - - 895Commitments to fund SBIC 800 200 - 405 1,405Total $ 217,511 $ 19,797 $ 5,801 $ 1,635 $ 244,744

33BNCCORP, INC. Annual Report 2018
Liquidity Risk Management Liquidity risk is the possibility of being unable to meet all present and future financial obligations in a timely manner. Liquidity risk management encompasses our ability to meet all present and future financial obligations in a timely manner. The objectives of our liquidity management policies are to maintain adequate liquid assets, liability diversification among instruments, maturities and customers and a presence in both the wholesale purchased funds market and the retail deposit market.
The Consolidated Statements of Cash Flows in the Consolidated Financial Statements present data on cash and cash equivalents provided by and used in operating, investing and financing activities. In addition to liquidity from core deposit growth, together with repayments and maturities of loans and investments, we utilize brokered deposits, sell securities under agreements to repurchase and borrow overnight Federal funds. The Bank is a member of the FHLB. Advances from the FHLB are collateralized by the Bank’s mortgage loans and various investment securities. We have also obtained funding through the issuance of subordinated notes, subordinated debentures and long-term borrowings.
Our liquidity is defined by our ability to meet our cash and collateral obligations at a reasonable cost and with a minimum loss of income. Given the uncertain nature of our customers’ demands as well as our desire to take advantage of earnings enhancement opportunities, we must have adequate sources of on- and off-balance-sheetfunds that can be acquired in time of need.
We measure our liquidity position on an as needed basis, but no less frequently than monthly. We measure our liquidity position using the total of the following items:
1. Estimated liquid assets less estimated volatile liabilities using the aforementioned methodology ($143.2million as of December 31, 2018);
2. Borrowing capacity from the FHLB ($147.0 million as of December 31, 2018); and3. Capacity to issue brokered deposits with maturities of less than 12 months ($135.9 million as of
December 31, 2018).
On an on-going basis, we use a variety of factors to assess our liquidity position including, but not limited to, the following items:
Stability of our deposit base, Amount of pledged investments, Amount of unpledged investments, Liquidity of our loan portfolio, and Potential loan demand.
Our liquidity assessment process segregates our balance sheet into liquid assets and short-term liabilities assumed to be vulnerable to non-replacement over a 30 day horizon in abnormally stringent conditions. Assumptions for the vulnerable short-term liabilities are based upon historical factors. We have a targeted range for our liquidity position over this horizon and manage operations to achieve these targets.
We further project cash flows over a 12 month horizon based on our assets and liabilities and sources and uses of funds for anticipated events.
Pursuant to our contingency funding plan, we also estimate cash flows over a 12 month horizon under a variety of stressed scenarios to identify potential funding needs and funding sources. Our contingency plan identifies actions that could be taken in response to adverse liquidity events.
We believe this process, combined with our policies and guidelines, should provide for adequate levels of liquidity to fund the anticipated needs of on- and off- balance sheet items.

BNCCORP, INC. Annual Report 201834
Forward-Looking Statements Statements included in “Management’s Discussion and Analysis of Financial Condition and Results of Operations” which are not historical in nature are intended to be, and are hereby identified as “forward-looking statements” for purposes of the safe harbor provided by Section 27A of the Securities Act of 1933 and Section 21E of the Securities Exchange Act of 1934. We caution readers that these forward-looking statements, including without limitation, those relating to our future business prospects, revenues, working capital, liquidity, capital needs, interest costs, income and expenses, are subject to certain risks and uncertainties that could cause actual results to differ materially from those indicated in the forward-looking statements due to several important factors. These factors include, but are not limited to: risks of loans and investments, including dependence on local and regional economic conditions;the impact of lower oil prices in our major market; competition for our customers from other providers of financial services; possible adverse effects of changes in interest rates including the effects of such changes on derivative contracts and associated accounting consequences; risks associated with our acquisition and growth strategies; and other risks which are difficult to predict and many of which are beyond our control.
Recently Issued and Adopted Accounting Pronouncements Note 1 of our Consolidated Financial Statements includes a summary of recently issued and adopted accounting pronouncements and their related or anticipated impact on the Company.
Accounting PoliciesNote 1 of our Consolidated Financial Statements includes a summary of our accounting policies and their related impact on the Company.
Quantitative and Qualitative Disclosures About Market RiskMarket risk arises from changes in interest rates, exchange rates, and commodity prices and equity prices and represents the possibility that changes in future market rates or prices will have a negative impact on our earnings or value. Our principal market risk is interest rate risk.
Interest rate risk arises from changes in interest rates. Interest rate risk can result from: (1) Repricing risk – timing differences in the maturity/repricing of assets, liabilities, and off-balance-sheet contracts; (2) Options risk – the effect of embedded options, such as loan prepayments, interest rate caps/floors, and deposit withdrawals; (3) Basis risk – risk resulting from unexpected changes in the spread between two or more different rates of similar maturity, and the resulting impact on the behavior of lending and funding rates; and (4) Yield curve risk – risk resulting from unexpected changes in the spread between two or more rates of different maturities from the same type of instrument. We have risk management policies to monitor and limit exposure to interest rate risk. To date we have not conducted trading activities as a means of managing interest rate risk. Our asset/liability management process is utilized to manage our interest rate risk. The measurement of interest rate risk associated with financial instruments is meaningful only when all related and offsetting on-and off-balance-sheet transactions are aggregated, and the resulting net positions are identified.
Our interest rate risk exposure is actively managed with the objective of managing the level and potential volatility of net interest income in addition to the long-term growth of equity, bearing in mind that we will always be in the business of taking on rate risk and that rate risk immunization is not entirely possible. Also, it is recognized that as exposure to interest rate risk is reduced, so too may the overall level of net interest income and equity. In general, the assets and liabilities generated through ordinary business activities do not naturally create offsetting positions with respect to repricing or maturity characteristics. Access to the derivatives market can be an important element in maintaining our interest rate risk position within policy guidelines. Using derivative instruments, principally interest rate floors, caps, and interest rate swaps, the interest rate sensitivity of specific transactions, as well as pools of assets or liabilities, can be adjusted to maintain the desired interest rate risk profile. See Note 1 of our Consolidated Financial Statements for a summary of our accounting policies pertaining to such instruments.
Our primary tool for measuring and managing interest rate risk is net interest income simulation. This exercise includes our assumptions regarding the changes in interest rates and the impact on our current balance sheet. Interest rate caps and floors are included to the extent that they are exercised in the 12-month simulation period. Additionally, changes in prepayment behavior of the residential mortgage, CMOs, and mortgage-backed securities portfolios in each rate environment are captured using industry estimates of prepayment speeds for various coupon segments of the portfolio. For purposes of this simulation, projected month end balances of the various balance

35BNCCORP, INC. Annual Report 2018
sheet accounts are held constant at their December 31, 2018 levels. Cash flows from a given account are reinvested back into the same account so as to keep the month end balance constant at its December 31, 2018 level. The static balance sheet assumption is made so as to project the interest rate risk to net interest income embedded in the existing balance sheet. With knowledge of the balance sheet’s existing net interest income profile, more informed strategies and tactics may be developed as it relates to the structure/mix of growth.
We monitor the results of net interest income simulation on a regular basis. Net interest income is generally simulated for the upcoming 12-month horizon in seven interest rate scenarios. The scenarios generally modeled are parallel interest rate ramps of +/- 100bp, 200bp, and 300bp along with a rates unchanged scenario. The parallelmovement of interest rates means all projected market interest rates move up or down by the same amount. A ramp in interest rates means that the projected change in market interest rates occurs over the 12-month horizon on a pro-rata basis. For example, in the +100bp scenario, the projected Prime rate is projected to increase from 5.50% to 6.50% 12 months later. The Prime rate in this example will increase 1/12th of the overall increase of 100 basis points each month.
The net interest income simulation result for the 12-month horizon that covers the calendar year of 2019 is shown below:
Net Interest Income Simulation
Movement in interest rates -300bp -200bp -100bp Unchanged +100bp +200bp +300bpProjected 12-month net
interest income $ 28,264 $
29,011 $ 29,509 $
29,645 $ 29,302 $ 28,946 $ 28,746Dollar change from
unchanged scenario $ (1,381) $
(634) $ (136)
- $ (343) $ (699) $ (899)Percentage change from
unchanged scenario (4.66)% (2.14)% (0.46)%
- (1.16)% (2.36)% (3.03)%
Since there are limitations inherent in any methodology used to estimate the exposure to changes in market interest rates, these analyses are not intended to be a forecast of the actual effect of changes in market interest rates such as those indicated above on the Company. Further, these analyses are based on our assets and liabilities as of December 31, 2018 (without forward adjustments for planned growth and anticipated business activities) and do not contemplate any actions we might undertake in response to changes in market interest rates.
Static gap analysis is another tool that may be used for interest rate risk measurement. The net differences between the amount of assets, liabilities, equity and off-balance-sheet instruments repricing within a cumulative calendar period is typically referred to as the “rate sensitivity position” or “gap position.” The following table sets forth our rate sensitivity position as of December 31, 2018. Assets and liabilities are classified by the earliest possible repricing date or maturity, whichever occurs first.

BNCCORP, INC. Annual Report 201836
Interest Sensitivity Gap Analysis
Estimated maturity or repricing at December 31, 20180–3 4–12 1–5 Over
Months Months Years 5 years Total(dollars are in thousands)
Interest-earning assets: Interest-bearing deposits with banks $ 25,185 $ - $ - $ - $ 25,185 Investment securities (a) 143,393 14,245 94,970 132,604 385,212
FRB and FHLB stock 2,941 - - - 2,941 Loans held for sale-mortgage banking, fixed rate 22,788 - - - 22,788 Loans held for investment, fixed rate 13,875 33,081 118,075 25,221 190,252 Loans held for investment, indexed rate 94,785 26,518 153,273 3,640 278,216 Total interest-earning assets $ 302,967 $ 73,844 $ 366,318 $ 161,465 $ 904,594
Interest-bearing liabilities: Interest checking and money market accounts $ 507,011 $ - $ - $ - $ 507,011 Savings 35,724 - - - 35,724 Time deposits 20,554 57,296 70,165 192 148,207 Short-term borrowings 11,494 - - - 11,494 Long-term borrowings - - 10,000 - 10,000 Subordinated debentures - 15,000 - 9 15,009 Total interest-bearing liabilities $ 574,783 $ 72,296 $ 80,165 $ 201 $ 727,445
Interest rate gap $ (271,816) $ 1,548 $ 286,153 $ 161,264 $ 177,149
Cumulative interest rate gap at December 31, 2018 $ (271,816) $ (270,268) $ 15,885 $ 177,149
Cumulative interest rate gap to total assets (27.99%) (27.83%) 1.64% 18.24%
(a) Values for investment securities reflect the timing of the estimated principal cash flows from the securities based on par values, which vary from the amortized cost and fair value of our investments.
The table assumes that all savings and interest-bearing demand deposits reprice in the earliest period presented, however, we believe a significant portion of these accounts constitute a core component and are generally not rate sensitive. Our position is supported by the fact that reductions in interest rates paid on these deposits historically have not caused notable reductions in balances in net interest income because the repricing of certain assets and liabilities is discretionary and is subject to competitive and other pressures. As a result, assets and liabilities indicated as repricing within the same period may in fact reprice at different times and at different rate levels.
Static gap analysis does not fully capture the impact of embedded options, lagged interest rate changes, administered interest rate products, or certain off-balance-sheet sensitivities to interest rate movements. Therefore, this tool generally cannot be used in isolation to determine the level of interest rate risk exposure in banking institutions.
Since there are limitations inherent in any methodology used to estimate the exposure to changes in market interest rates, these analyses are not intended to be a forecast of the actual effect of changes in market interest rates such as those indicated above on the Company. Further, these analyses are based on our assets and liabilities as of December 31, 2018 and do not contemplate any actions we might undertake in response to changes in market interest rates.

37BNCCORP, INC. Annual Report 2018
BNCCORP, INC. AND SUBSIDIARIESConsolidated Financial Statements
December 31, 2018 and 2017(With Independent Auditors’ Report Thereon)
BNCCORP, INC. Annual Report 201838
INDEX TO CONSOLIDATED FINANCIAL STATEMENTS
Page
Independent Auditors’ Report 73
Consolidated Balance Sheets as of December 31, 2018 and 2017 83
Consolidated Statements of Income for the Years Ended December 31, 2018 and 2017 93
Consolidated Statements of Comprehensive (Loss) Income for the Years Ended December 31, 2018 and 2017 40
Consolidated Statements of Stockholders’ Equity for the Years Ended December 31, 2018 and 2017 41
Consolidated Statements of Cash Flows for the Years Ended December 31, 2018 and 2017 42
Notes to Consolidated Financial Statements 44

39BNCCORP, INC. Annual Report 2018
KPMG LLP is a Delaware limited liability partnership and the U.S. member firm of the KPMG network of independent member firms affiliated with KPMG International Cooperative (“KPMG International”), a Swiss entity.
KPMG LLPSuite 11001000 Walnut StreetKansas City, MO 64106-2162
Independent Auditors’ Report
The Board of Directors BNCCORP, INC.:
We have audited the accompanying consolidated financial statements of BNCCORP, INC. and subsidiaries,which comprise the consolidated balance sheets as of December 31, 2018 and 2017, and the related consolidated statements of income, comprehensive (loss) income, stockholders’ equity, and cash flows for the years then ended, and the related notes to the consolidated financial statements.
Management’s Responsibility for the Financial Statements Management is responsible for the preparation and fair presentation of these consolidated financial statements in accordance with U.S. generally accepted accounting principles; this includes the design, implementation, and maintenance of internal control relevant to the preparation and fair presentation of consolidated financial statements that are free from material misstatement, whether due to fraud or error.
Auditors’ Responsibility Our responsibility is to express an opinion on these consolidated financial statements based on our audits. We conducted our audits in accordance with auditing standards generally accepted in the United States of America. Those standards require that we plan and perform the audit to obtain reasonable assurance about whether the consolidated financial statements are free from material misstatement.
An audit involves performing procedures to obtain audit evidence about the amounts and disclosures in the consolidated financial statements. The procedures selected depend on the auditors’ judgment, including the assessment of the risks of material misstatement of the consolidated financial statements, whether due to fraud or error. In making those risk assessments, the auditor considers internal control relevant to the entity’spreparation and fair presentation of the consolidated financial statements in order to design audit procedures that are appropriate in the circumstances, but not for the purpose of expressing an opinion on the effectiveness of the entity’s internal control. Accordingly, we express no such opinion. An audit also includes evaluating the appropriateness of accounting policies used and the reasonableness of significant accounting estimates made by management, as well as evaluating the overall presentation of the consolidated financial statements.
We believe that the audit evidence we have obtained is sufficient and appropriate to provide a basis for our audit opinion.
Opinion
In our opinion, the consolidated financial statements referred to above present fairly, in all material respects, the financial position of BNCCORP, INC. and subsidiaries as of December 31, 2018 and 2017, and the results of their operations and their cash flows for the years then ended in accordance with U.S. generally accepted accounting principles.
March 26, 2019
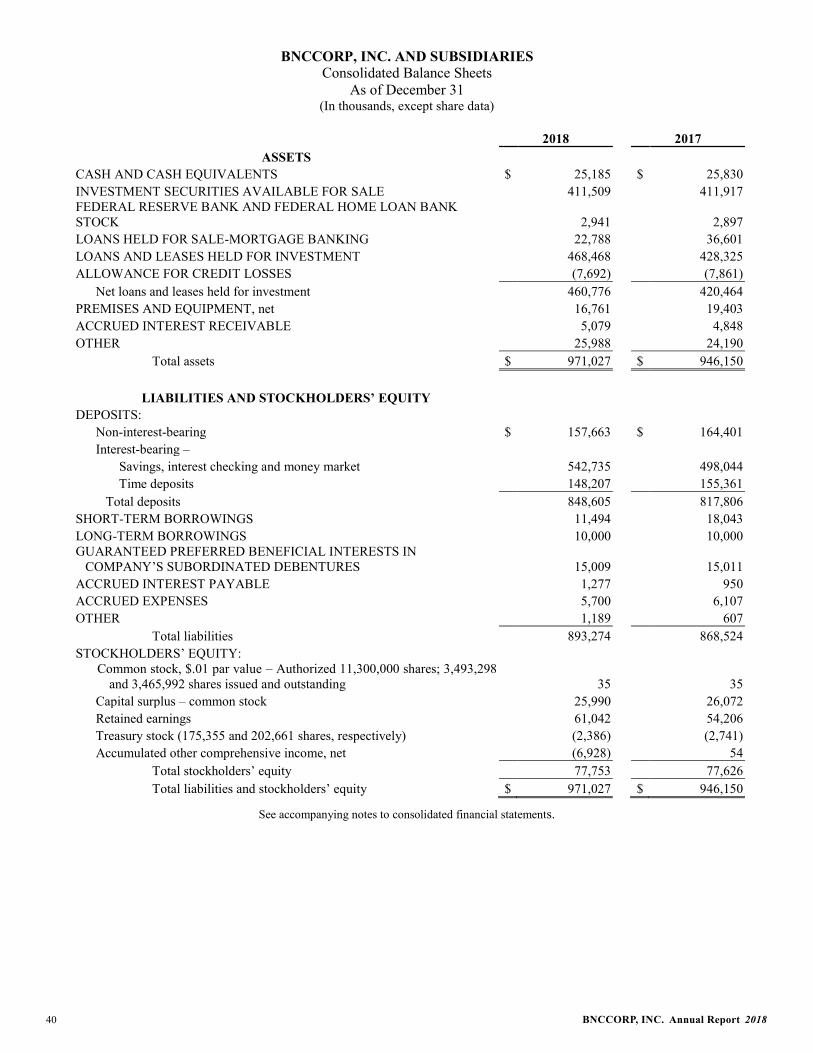
BNCCORP, INC. Annual Report 201840
BNCCORP, INC. AND SUBSIDIARIESConsolidated Balance Sheets
As of December 31(In thousands, except share data)
2018 2017ASSETS
CASH AND CASH EQUIVALENTS $ 25,185 $ 25,830INVESTMENT SECURITIES AVAILABLE FOR SALE 411,509 411,917FEDERAL RESERVE BANK AND FEDERAL HOME LOAN BANK STOCK 2,941 2,897LOANS HELD FOR SALE-MORTGAGE BANKING 22,788 36,601LOANS AND LEASES HELD FOR INVESTMENT 468,468 428,325ALLOWANCE FOR CREDIT LOSSES (7,692) (7,861)
Net loans and leases held for investment 460,776 420,464PREMISES AND EQUIPMENT, net 16,761 19,403ACCRUED INTEREST RECEIVABLE 5,079 4,848OTHER 25,988 24,190 Total assets $ 971,027 $ 946,150
LIABILITIES AND STOCKHOLDERS’ EQUITYDEPOSITS:
Non-interest-bearing $ 157,663 $ 164,401Interest-bearing –
Savings, interest checking and money market 542,735 498,044 Time deposits 148,207 155,361
Total deposits 848,605 817,806SHORT-TERM BORROWINGS 11,494 18,043LONG-TERM BORROWINGS 10,000 10,000GUARANTEED PREFERRED BENEFICIAL INTERESTS IN
COMPANY’S SUBORDINATED DEBENTURES 15,009 15,011ACCRUED INTEREST PAYABLE 1,277 950ACCRUED EXPENSES 5,700 6,107OTHER 1,189 607 Total liabilities 893,274 868,524STOCKHOLDERS’ EQUITY:
Common stock, $.01 par value – Authorized 11,300,000 shares; 3,493,298 and 3,465,992 shares issued and outstanding 35 35
Capital surplus – common stock 25,990 26,072Retained earnings 61,042 54,206Treasury stock (175,355 and 202,661 shares, respectively) (2,386) (2,741)Accumulated other comprehensive income, net (6,928) 54
Total stockholders’ equity 77,753 77,626 Total liabilities and stockholders’ equity $ 971,027 $ 946,150
See accompanying notes to consolidated financial statements.

41BNCCORP, INC. Annual Report 2018
BNCCORP, INC. AND SUBSIDIARIESConsolidated Statements of IncomeFor the Years Ended December 31
(In thousands, except per share data)
2018 2017INTEREST INCOME:
Interest and fees on loans $ 23,286 $ 20,786Interest and dividends on investments
Taxable 9,339 7,838Tax-exempt 1,699 2,695Dividends 154 124
Total interest income 34,478 31,443INTEREST EXPENSE:
Deposits 4,761 2,509Short-term borrowings 74 27Federal Home Loan Bank advances 95 16Long-term borrowings 635 635Subordinated debentures 543 391
Total interest expense 6,108 3,578 Net interest income 28,370 27,865PROVISION FOR CREDIT LOSSES - 350NET INTEREST INCOME AFTER PROVISION FOR CREDIT LOSSES 28,370 27,515NON-INTEREST INCOME:
Bank charges and service fees 2,687 2,719Wealth management revenues 1,810 1,717Mortgage banking revenues, net 10,032 11,301Gains on sales of loans, net 187 736Gains on sales of securities, net 2,293 745Other 2,008 2,281
Total non-interest income 19,017 19,499NON-INTEREST EXPENSE:
Salaries and employee benefits 20,074 20,494Professional services 3,378 3,928Data processing fees 4,027 3,716Marketing and promotion 4,212 3,447Occupancy 2,408 2,436Regulatory costs 540 556Depreciation and amortization 1,545 1,627Office supplies and postage 574 629Other real estate costs - (31)Other 2,255 2,314
Total non-interest expense 39,013 39,116Income before income taxes 8,374 7,898Income tax expense 1,538 3,020Net income $ 6,836 $ 4,878Basic earnings per common share $ 1.96 $ 1.40
Diluted earnings per common share $ 1.93 $ 1.38
See accompanying notes to consolidated financial statements.

BNCCORP, INC. Annual Report 201842
BNCCORP, INC. AND SUBSIDIARIESConsolidated Statements of Comprehensive (Loss) Income
For the Years Ended December 31(In thousands)
2018 2017NET INCOME $ 6,836 $ 4,878
Unrealized loss on investment securities available for sale $ (6,966) $ (1,857)
Reclassification adjustment for gains on sales of securities, net, included in net income (2,293) (745)
Other comprehensive loss before tax (9,259) (2,602)Income tax benefit related to items of other
comprehensive loss 2,277 973Other comprehensive loss $ (6,982) (6,982) $ (1,629) (1,629)TOTAL COMPREHENSIVE (LOSS) INCOME $ (146) $ 3,249
See accompanying notes to consolidated financial statements.

43BNCCORP, INC. Annual Report 2018
BNCCORP, INC. AND SUBSIDIARIESConsolidated Statements of Stockholders’ Equity
For the Years Ended December 31(In thousands, except share data)
Capital Accumulated
Surplus Other
Common Stock Common Retained Treasury Comprehensive
Shares Amount Stock Earnings Stock Income (Loss), net Total
BALANCE, December 31, 2016 3,456,008 $ 35 $ 25,996 $ 49,328 $ (2,847) $ 1,683 $ 74,195
Net income - - - 4,878 - - 4,878
Other comprehensive loss - - - - - (1,629) (1,629)
Share-based compensation 9,984 76 - 106 - 182
BALANCE, December 31, 2017 3,465,992 $ 35 $ 26,072 $ 54,206 $ (2,741) $ 54 $ 77,626
Net income - - - 6,836 - - 6,836
Other comprehensive loss - - - - - (6,982) (6,982)
Share-based compensation 27,306 - (82) - 355 - 273
BALANCE, December 31, 2018 3,493,298 $ 35 $ 25,990 $ 61,042 $ (2,386) $ (6,928) $ 77,753
See accompanying notes to consolidated financial statements.
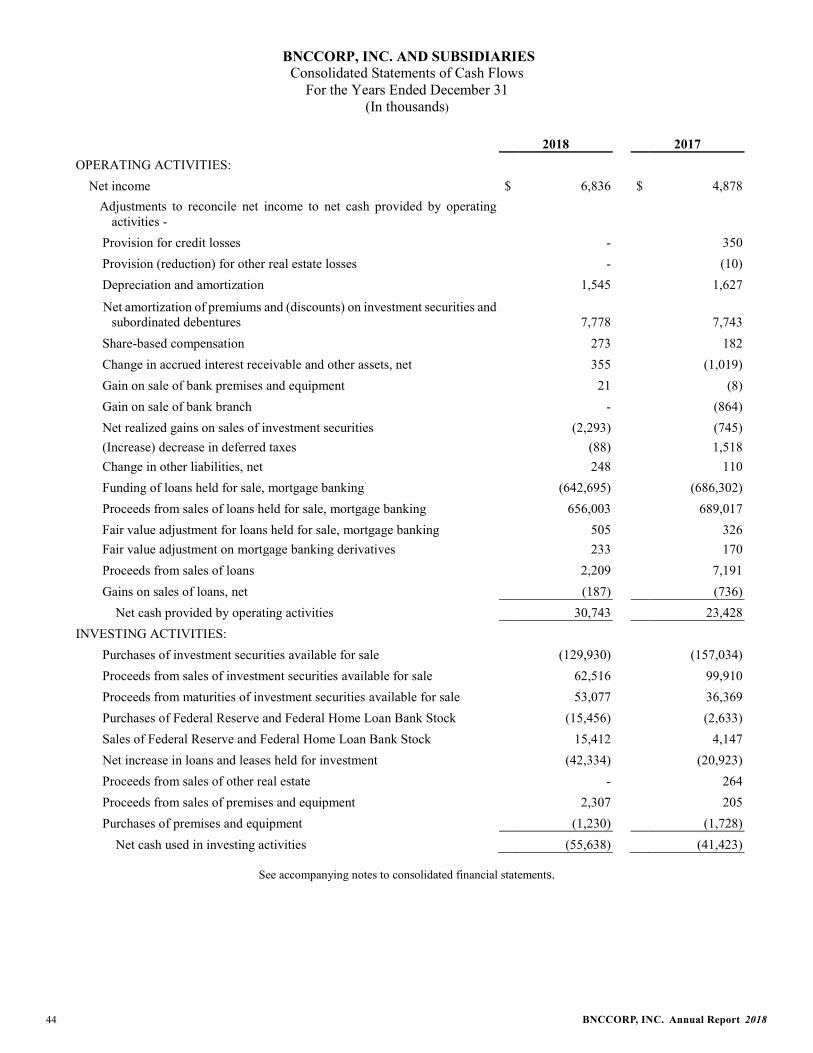
BNCCORP, INC. Annual Report 201844
BNCCORP, INC. AND SUBSIDIARIES Consolidated Statements of Cash Flows
For the Years Ended December 31(In thousands)
2018 2017OPERATING ACTIVITIES:
Net income $ 6,836 $ 4,878Adjustments to reconcile net income to net cash provided by operating
activities -Provision for credit losses - 350Provision (reduction) for other real estate losses - (10)Depreciation and amortization 1,545 1,627
Net amortization of premiums and (discounts) on investment securities and subordinated debentures 7,778 7,743
Share-based compensation 273 182Change in accrued interest receivable and other assets, net 355 (1,019)Gain on sale of bank premises and equipment 21 (8)Gain on sale of bank branch - (864)Net realized gains on sales of investment securities (2,293) (745)(Increase) decrease in deferred taxes (88) 1,518Change in other liabilities, net 248 110Funding of loans held for sale, mortgage banking (642,695) (686,302)Proceeds from sales of loans held for sale, mortgage banking 656,003 689,017Fair value adjustment for loans held for sale, mortgage banking 505 326Fair value adjustment on mortgage banking derivatives 233 170Proceeds from sales of loans 2,209 7,191Gains on sales of loans, net (187) (736)
Net cash provided by operating activities 30,743 23,428INVESTING ACTIVITIES:
Purchases of investment securities available for sale (129,930) (157,034)Proceeds from sales of investment securities available for sale 62,516 99,910Proceeds from maturities of investment securities available for sale 53,077 36,369Purchases of Federal Reserve and Federal Home Loan Bank Stock (15,456) (2,633)Sales of Federal Reserve and Federal Home Loan Bank Stock 15,412 4,147Net increase in loans and leases held for investment (42,334) (20,923)Proceeds from sales of other real estate - 264Proceeds from sales of premises and equipment 2,307 205Purchases of premises and equipment (1,230) (1,728)
Net cash used in investing activities (55,638) (41,423)
See accompanying notes to consolidated financial statements.

45BNCCORP, INC. Annual Report 2018
BNCCORP, INC. AND SUBSIDIARIESConsolidated Statements of Cash Flows, continued
For the Years Ended December 31(In thousands)
2018 2017FINANCING ACTIVITIES:
Net increase in deposits $ 30,799 $ 65,179
Net (decrease) increase in short-term borrowings (6,549) 5,533
Repayments of Federal Home Loan Bank advances (395,000) (101,450)
Proceeds from Federal Home Loan Bank advances 395,000 63,450
Net cash provided by financing activities 24,250 32,712
NET (DECREASE) INCREASE IN CASH AND CASH EQUIVALENTS (645) 14,717
CASH AND CASH EQUIVALENTS, beginning of period 25,830 11,113
CASH AND CASH EQUIVALENTS, end of period $ 25,185 $ 25,830
SUPPLEMENTAL CASH FLOW INFORMATION:
Interest paid $ 3,945 $ 3,405
Income taxes paid $ 1,102 $ 821
SUPPLEMENTAL DISCLOSURE OF NONCASH INVESTING AND FINANCING ACTIVITIES:
Additions to other real estate in the settlement of loans $ - $ 40
See accompanying notes to consolidated financial statements.

BNCCORP, INC. Annual Report 201846
BNCCORP, INC. AND SUBSIDIARIESNotes to Consolidated Financial Statements
NOTE 1. Description of Business and Significant Accounting PoliciesDescription of BusinessBNCCORP, INC. (BNCCORP or BNC) is a registered bank holding company incorporated under the laws of Delaware. It is the parent company of BNC National Bank (the Bank or BNC Bank). BNC Bank operates community banking and wealth management businesses in North Dakota, Arizona and Minnesota from 13 locations. The Bank also conducts mortgage banking through a consumer-direct channel complimented by retail channelsfrom 12 locations in Arizona, North Dakota, Illinois, Kansas and Missouri. The consumer direct channel emphasizes technology (internet leads and call center) to originate mortgage loans throughout the United States. The retail channel is primarily relationship driven and originations are generally near mortgage banking locations.
With respect to group concentrations of credit risk, most of the Company’s business activity is with customers in North Dakota. At December 31, 2018, the Company did not have any significant credit concentrations in any particular industry.
The consolidated financial statements included herein are for BNCCORP and subsidiaries. The accounting and reporting policies of BNCCORP and subsidiaries (collectively, the Company) conform to U.S. generally accepted accounting principles and general practices within the financial services industry. The more significant accounting policies are summarized below.
Principles of ConsolidationThe accompanying consolidated financial statements include the accounts of BNCCORP and its wholly owned subsidiaries. All significant intercompany transactions and balances have been eliminated in consolidation.
Use of EstimatesThe preparation of consolidated financial statements in conformity with U.S. generally accepted accounting principles requires management to make estimates and assumptions that affect the reported amounts of assets and liabilities and disclosure of contingent assets and liabilities at the date of the financial statements and the reported amounts of revenues and expenses during the reporting period. Significant items subject to such estimates and assumptions include the allowance for credit losses, valuation of other real estate, reserves for mortgage banking reimbursement obligations, fair value measurements for financial instruments (including derivatives), impairmentof long-lived assets, contingencies, and income taxes. Ultimate results could materially differ from those estimates.
SIGNIFICANT ACCOUNTING POLICIES
Cash and Cash EquivalentsCash and cash equivalents include cash on hand, cash due from banks and federal funds sold.
Investment SecuritiesInvestment securities that the Bank intends to hold indefinitely as part of its asset/liability strategy, or that may be sold in response to changes in interest rates or prepayment risk are classified as available for sale. Available for sale securities are carried at fair value. Net unrealized gains and losses, net of deferred income taxes, on securities available for sale are reported as a separate component of stockholders’ equity until realized (see Comprehensive(Loss) Income). All securities were classified as available for sale as of December 31, 2018 and 2017, except for Federal Reserve Bank (FRB) and Federal Home Loan Bank (FHLB) stocks, which have indeterminable maturities.
Premiums and discounts are amortized or accreted over the life of the related security as an adjustment to yield using the effective interest method. Dividend and interest income is recognized when earned. Realized gains and losses on the sale of investment securities are determined using the specific-identification method and recognized in non-interest income on the trade date.

47BNCCORP, INC. Annual Report 2018
Other-Than-Temporary ImpairmentDeclines in the fair value of individual available-for-sale securities below amortized cost, which are deemed other-than-temporary, result in a charge to earnings and establishment of a new cost basis. The Company assesses available information about its securities to determine whether impairment is other-than-temporary. The information the Company considers includes, but is not limited to, the following:
Recent and expected performance of the securities; Financial condition of issuers or guarantors; Recent cash flows; Seniority of invested tranches and subordinated credit support; Vintage of origination; Location of collateral; Ratings of securities; Value of underlying collateral; Delinquency and foreclosure data; Historical losses and estimated severity of future losses; Credit surveillance data which summarize retrospective performance; and Anticipated future cash flows and prospective performance assessments.
Determining whether other-than-temporary impairment has occurred requires judgment of factors that may indicate an impairment loss has incurred. The Company follows the guidance on other-than-temporary impairments Accounting Standards Codification (ASC) 320, Investments – Debt Securities. Any credit-related impairments are recognized through a charge to earnings. The amount of non-credit related impairments is recognized through comprehensive (loss) income, net of income taxes.
Note 2 to these consolidated financial statements includes a summary of investment securities in a loss position at December 31, 2018 and 2017.
Federal Reserve Bank and Federal Home Loan BankInvestments in Federal Reserve Bank and Federal Home Loan Bank stock are carried at cost, which approximates fair value.
Loans Held For Sale-Mortgage BankingLoans held for sale-mortgage banking are accounted for at fair value pursuant to the fair value option permitted by ASC 825, Financial Instruments. Gains and losses from the changes in fair value are included in mortgage banking revenues, net.
Loans and Leases Held For InvestmentLoans and leases held for investment are stated at their outstanding principal amount net of unearned income, unamortized deferred fees and costs, and an allowance for credit losses. Interest income is recognized on the accrual basis using the interest method prescribed in the loan agreement except when collectability is in doubt.
Loans and leases are reviewed regularly by management and are placed on non-accrual status when the collection of interest or principal is 90 days or more past due, unless the loan or lease is adequately secured and in the process of collection. When a loan or lease is placed on non-accrual status, uncollected interest accrued in prior years is charged off against the allowance for credit losses, unless collection of the principal and interest is assured. Interest accrued in the current year is reversed against interest income in the current period. Interest payments received on non-accrual loans and leases are generally applied to principal unless the remaining principal balance has been determined to be fully collectible. Accrual of interest may be resumed when it is determined that all amounts due are expected to be collected and the loan has exhibited a sustained level of performance, generally at least six months.
A loan is considered impaired when it is probable that a creditor will be unable to collect all amounts due according to the contractual terms of the loan agreement. Loans are reviewed for impairment on an individual basis. Impaired loans are measured at the present value of expected future cash flows discounted at the loan’s initial effective

BNCCORP, INC. Annual Report 201848
interest rate. The fair value of collateral of an impaired collateral-dependent loan or an observable market price of the loan is also used as an alternative to discounting cash flows. If the measure of the impaired loan is less than the recorded investment in the loan, impairment will be recognized as a charge-off through the allowance for credit losses or a valuation allowance is established for the difference.
Troubled debt restructured loans are loans for which concessions, including a reduced interest rate or a deferral of interest or principal, have been granted due to the borrower’s weakened financial condition. Once a loan is restructured, interest is accrued at the restructured rates when no loss of principal is anticipated. A loan that has performed in accordance with restructured terms for one year is no longer reported as a restructured loan, but will continue to be reported as impaired.
Loan Origination Fees and Costs; Other Lending FeesFor Loans and Leases Held for Investment, origination fees and costs incurred to extend credit are deferred and amortized over the term of the loan as an adjustment to yield using the interest method, except where the net amount is deemed to be immaterial.
The Company occasionally originates lines of credit where the customer is charged a non-usage fee if the line of credit is not used. In such instances, the Company periodically reviews use of lines on a retrospective basis and recognizes non-usage fees in non-interest income.
Loan Servicing and Transfers of Financial AssetsThe Bank sells commercial business loans to third parties. The loans are generally sold on a non-recourse basis. Sold loans are not included in the accompanying consolidated balance sheets.
The sales of loans are accounted for pursuant to ASC 860, Transfers and Servicing.
Allowance for Credit LossesThe Bank maintains its allowance for credit losses at a level considered adequate to provide for probable losses related to the loan and lease portfolio as of the consolidated balance sheet dates. The loan and lease portfolio and other credit exposures are reviewed regularly to evaluate the adequacy of the allowance for credit losses.
The methodology used to establish the allowance for credit losses incorporates quantitative and qualitative risk considerations. Quantitative factors include the Bank’s historical loss experience, delinquency information, charge-off trends, collateral values, changes in nonperforming loans and other factors. Quantitative factors also incorporate known information about individual borrowers, including sensitivity to interest rate movements or other quantifiable external factors.
Qualitative factors include the general economic environment, the state of certain industries and factors unique to the Bank’s market areas. Size, complexity of individual credits, loan structure, variances from loan policies and pace of portfolio growth are other qualitative factors that are considered when the Bank estimates the allowance for credit losses.
The Bank’s methodology has been consistently applied. However, the Bank enhances its methodology as circumstances dictate.
The allowance for credit losses has three components as follows:
Specific Reserves. The amount of specific reserves is determined through a loan-by-loan analysis of problematic loans over a minimum size. Included in problem loans are non-accrual or restructured loans that meet the impairment criteria in ASC 310, Receivables. A loan is impaired when, based on current information, it is probable that a creditor will be unable to collect all amounts due according to the contractual terms of the loan agreement. Any allowance on impaired loans is generally based on one of three methods: the present value of expected cash flows at the loan’s effective interest rate, the loan’s observable market price or the fair value of the collateral of the loan. Specific reserves may also be established for credits that have been internally classified as credits requiring management’s attention due to underlying problems in the borrower’s business or collateral concerns.

49BNCCORP, INC. Annual Report 2018
Reserves for Homogeneous Loan Pools. The Bank makes a significant number of loans and leases that, due to their underlying similar characteristics, are assessed for loss as “homogeneous” pools. Included in the homogeneous pools are loans which have been excluded from the specific reserve allocation. The Company’s methodology incorporates an estimated loss emergence period for each risk group. The loss emergence period is the period of time from when a borrower experiences a loss event and when the actual loss is recognized in the consolidated financial statements, generally at the time of initial charge-off of the loan balance.
Qualitative Reserve. Management also allocates reserves for other circumstances pertaining to the measurement period. The factors considered include, but are not limited to, prevailing trends, economic conditions, geographic influence, industry segments within the portfolio, management’s assessment of credit risk inherent in the loan portfolio, delinquency data, historical loss experience and peer-group information.
Monitoring loans and analysis of loss components are the principal means by which management determines estimated credit losses are reflected in the Bank’s allowance for credit losses on a timely basis. Management also considers regulatory guidance in addition to the Bank’s own experience. Various regulatory agencies, as an integral part of their examination process, periodically review the allowance for credit losses. Such agencies may require additions to the allowance based on their judgment about information available to them at the time of their examination.
Loans, leases and other extensions of credit deemed uncollectible are charged off against the allowance for credit losses. Subsequent recoveries, if any, are credited to the allowance.
The allowance for credit losses is highly dependent upon variables affecting valuation, including appraisals of collateral, evaluations of performance as well as the amounts and timing of future cash flows expected to be received on impaired loans. These variables are reviewed periodically. Actual credit losses may materially vary from the current estimated allowance for credit losses. For nonperforming or impaired loans, appraisals are generally performed annually or whenever circumstances warrant a new appraisal. Management regularly evaluates the appraised value and costs to liquidate in order to estimate fair value. A provision for credit losses is made to adjust the allowance for credit losses to the amount determined appropriate through application of the above processes.
Other Real Estate Owned and Repossessed Assets, netReal estate properties and other assets acquired through loan foreclosures are recorded at fair value less estimated costs to sell. If the carrying amount of an asset acquired through foreclosure is in excess of the fair value less estimated costs to sell, the excess amount is charged to the allowance for credit losses. Fair value is primarily determined based upon appraisals of the assets involved and management periodically assesses appraised values to ascertain continued relevancy of the valuation. Net operating income from and gains on disposition of these assetsare included in other non-interest income. Net operating expenses, losses on disposition, and subsequent declines in the estimated fair value of these assets are charged to other non-interest expense.
Premises and EquipmentLand is carried at cost. Premises and equipment are reported at cost less accumulated depreciation and amortization. Depreciation and amortization for financial reporting purposes is charged to non-interest expense using the straight-line method over the estimated useful lives of the assets. Estimated useful lives are up to 40 years for buildings and three to 10 years for furniture and equipment. Leasehold improvements are capitalized and amortized over the shorter of the lease term or the estimated useful life of the improvement. Maintenance and repairs, as well as gains and losses on dispositions of premises and equipment, are included in non-interest income or expense as incurred.
Impairment of Long-Lived Assets The Company reviews long-lived assets for impairment periodically or whenever events or changes in circumstances indicate that the carrying amount of any such asset may not be recoverable. The impairment review includes a comparison of future cash flows (undiscounted and without interest charges) expected to be generated by the assets to their current carrying value. If impairment is identified, the assets are written down to their fair value through a charge to non-interest expense.

BNCCORP, INC. Annual Report 201850
Securities Sold Under Agreements to RepurchaseFrom time to time, the Bank enters into sales of securities under agreements to repurchase, generally for periods of less than 90 days. These agreements are treated as financings, and the obligations to repurchase securities sold are reflected as a liability in the consolidated balance sheets as short-term borrowings. The costs of securities underlying the agreements remain in the asset accounts.
Fair ValueSeveral accounting standards require recording assets and liabilities based on their fair values. Determining the fair value of assets and liabilities can be highly subjective. The Company utilizes valuation techniques that maximize the use of observable inputs and minimize the use of unobservable inputs to the extent possible. The Company determines fair value based on assumptions that market participants would use in pricing an asset or liability in the principal or most advantageous market.
ASC 820, Fair Value Measurement, defines fair value and establishes a framework for measuring fair value of assets and liabilities using a hierarchy system consisting of three levels based on the markets in which the assets and liabilities are traded and the reliability of the assumptions used to determine fair value. These levels are:
Level 1: Valuation is based upon quoted prices for identical instruments traded in active markets that the Company has the ability to access.
Level 2: Valuation is based upon quoted prices for similar instruments in active markets, quoted prices for identical or similar instruments in markets that are less active, and model-based valuation techniques for which significant assumptions are observable in the market.
Level 3: Valuation is generated from model-based techniques that use significant assumptions not observable in the market and are used only to the extent that observable inputs are not available. These unobservable assumptions reflect the Company’s own estimates of assumptions that market participants would use in pricing the asset or liability.
Management assigns levels to assets and liabilities accounted for at fair value.
Fair Values of Financial Instruments The Company is required to disclose the estimated fair value of financial instruments. Fair value estimates are subjective in nature, involving uncertainties and matters of significant judgment, and therefore cannot be determined with precision. Changes in assumptions could significantly affect the estimates. The following methods and assumptions are used by the Company in estimating fair value disclosures for its financial instruments.
Investment Securities Available for Sale. The fair value of the Company’s securities, other than U.S. Treasury securities, are based upon quoted prices for similar instruments in active markets, quoted prices for identical or similar instruments in markets that are less active, and model-based valuation techniques for which significant assumptions are observable in the market. U.S. Treasury securities are based upon quoted prices for identical instruments traded in active markets.
Loans Held for Sale-Mortgage Banking. Loans held for sale-mortgage banking are accounted for at fair value pursuant to the fair value option permitted by ASC 825, Financial Instruments. Fair value measurements on loans held for sale are based on quoted market prices for similar loans in the secondary market, market quotes from anticipated sales contracts and commitments, or contract prices from firm sales commitments.
Derivative Financial Instruments. The fair value of the Company’s derivatives are based upon quoted prices for similar instruments in active markets, quoted prices for identical or similar instruments in markets that are less active, and model-based valuation techniques for which significant assumptions are observable in the market.
Financial Instruments with Off-Balance-Sheet Risk. The fair values of the Company’s commitments to extend credit and commercial and standby letters of credit are estimated using fees currently charged to enter into similar agreements.
51BNCCORP, INC. Annual Report 2018
Derivative Financial InstrumentsASC 815, Derivatives and Hedging, establishes accounting and reporting standards for derivative instruments, including certain derivative instruments embedded in other contracts, and for hedging activities. Accordingly, the Company records all derivatives at fair value.
The Company enters into interest rate lock commitments on certain mortgage loans related to mortgage banking operations on a best efforts basis, which are commitments to originate loans whereby the interest rate on the loan is determined prior to funding. The Company also has corresponding forward sales contracts related to these interest rate lock commitments. Both the mortgage loan commitments and the related forward sales contracts are accounted for as derivatives and carried at fair value in other assets with changes in fair value recorded in mortgage banking revenues, net.
The Company also commits to originate and sell certain loans related to mortgage banking operations on a mandatory delivery basis. To hedge interest rate risk the Company sells short positions in mortgage backed securities related to the loans sold on a mandatory delivery basis. The commitments to originate and short positions are accounted for as derivatives and carried at fair value in other liabilities with changes in fair value recorded in mortgage banking revenues, net.
Share-Based CompensationASC 718, Compensation – Stock Compensation, requires the Company to measure the cost of employee services received in exchange for an award of equity instruments based on the fair value of the award on the grant date.
At December 31, 2018, the Company had four stock-based compensation plans, which are described more fully in Note 24 and Note 25 to these consolidated financial statements.
Income TaxesThe Company files consolidated federal and unitary state income tax returns where allowed.
The determination of current and deferred income taxes is based on analyses of many factors including interpretation of federal and state income tax laws, differences between tax and financial reporting basis of assets and liabilities, expected reversals of temporary differences, estimates of amounts due or owed and current financial accounting standards. Actual results could differ significantly from the estimates and interpretations used in determining the current and deferred income taxes.
Deferred income taxes are accounted for using the asset and liability method. Under this method, deferred tax assets and liabilities are recognized for the future tax consequences attributable to differences between the financial statement carrying amounts of existing assets and liabilities and their respective tax bases. Deferred tax assets and liabilities are measured using enacted tax rates expected to apply to taxable income in the years in which those temporary differences are expected to be recovered or settled. The effects of changes in tax rates on deferred tax assets and liabilities are recognized in income in the period of enactment regardless of the balance sheet classification of the underlying deferred tax asset or liability.
Management evaluates deferred tax assets to determine whether they are realizable based upon accounting standards and specific facts and circumstances. A valuation allowance is established to reduce deferred tax assets to amounts that are more likely than not expected to be realized.
Earnings Per ShareBasic earnings per share (EPS) excludes dilution and is computed by dividing income available to common stockholders by the weighted average number of common shares outstanding during the applicable period. Diluted EPS reflects the potential dilution that could occur if securities or other contracts to issue common stock were exercised or converted into common stock or resulted in the issuance of common stock that then shared in the earnings of the Company. Such potential dilutive instruments include stock options and contingently issuable stock. Note 22 to these consolidated financial statements includes disclosure of the Company’s EPS calculations.

BNCCORP, INC. Annual Report 201852
Comprehensive (Loss) IncomeComprehensive income is the total of net income and other comprehensive (loss) income, which for the Company, is generally comprised of unrealized losses and gains on securities available for sale, net of corresponding tax effects.
RECENTLY ISSUED OR ADOPTED ACCOUNTING PRONOUNCEMENTS
The Company adopted Accounting Standards Update (ASU) No. 2016-01, Recognition and Measurement of Financial Assets and Financial Liabilities, on January 1, 2018 using the modified retrospective approach. This amendment addresses certain aspects of recognition, measurement, presentation, and disclosure of financial instruments. The adoption of this amended guidance did not materially impact the Company’s consolidated financial statements.
The Company adopted ASC 606, Revenue from Contracts with Customers (ASC 606), on January 1, 2018 using the full retrospective approach. ASC 606 amends the revenue recognition guidance for contracts with customers for goods and services and specifically excludes interest income, as well as other revenues associated with financial assets and liabilities, including loans, leases, and derivatives. The adoption of ASC 606 had no impact on the Company’s consolidated financial statements, except for additional consolidated financial statement disclosures, which are included in Note 16 to these consolidated financial statements.
In February 2016, the FASB issued ASU 2016-02, Leases. The amended guidance changes the accounting treatment of leases, in that lessees will recognize most leases on-balance sheet. This will increase reported assets and liabilities, as lessees will be required to recognize a right-of-use asset along with a lease liability, measured on a discounted basis. Lessees are allowed to account for short-term leases (those with a term of twelve months or less) off-balance sheet. The amendments in this update are effective for fiscal years beginning after December 15, 2018, including interim periods within those fiscal years. The amended guidance allows an entity to choose either the effective date, or the beginning of the earliest comparative period presented in the consolidated financial statements, as its date of initial application. The Company will adopt the amended guidance on January 1, 2019 and use the effective date as the date of initial application. The Company does not anticipate that there will be a cumulative effect adjustment made to retained earnings as a result of adopting the amended guidance. The most significant effects of the adoption of this guidance will be additional consolidated financial statement disclosures. The adoption of this accounting pronouncement did not have a material impact on the Company’s consolidated financial statements.
ASU No. 2016-13, Measurement of Credit Losses on Financial Instruments, replaces the current incurred loss methodology for recognizing credit losses with a current expected credit loss model, which requires the measurement of all expected credit losses for financial assets held at the reporting date based on historical experience, current conditions, and reasonable and supportable forecasts. This amended guidance broadens the information that an entity must consider in developing its expected credit loss estimates. Additionally, this update amends the accounting for credit losses for available-for-sale debt securities and purchased financial assets with a more-than-insignificant amount of credit deterioration since origination. This update requires enhanced disclosures to help investors and other financial statement users better understand significant estimates and judgments used in estimating credit losses, as well as the credit quality and underwriting standards of a company’s loan portfolio. This update is effective for fiscal years beginning after December 15, 2020, including interim periods within those fiscal years, and early adoption in fiscal years beginning after December 15, 2018 is permitted. This update requires the use of the modified retrospective adoption approach and the Company is currently evaluating the impact that this amended guidance will have on its consolidated financial statements and disclosures.

53BNCCORP, INC. Annual Report 2018
NOTE 2. Investment Securities Available For Sale
Investment securities have been classified in the consolidated balance sheets according to management’s intent. The Company had no securities designated as trading or held-to-maturity in its portfolio at December 31, 2018 or 2017. The carrying amount of investment securities available for sale securities and their estimated fair values were as follows as of December 31 (in thousands):
2018Gross Gross Estimated
Amortized Unrealized Unrealized FairCost Gains Losses Value
U.S. Treasury securities $ 59,710 $ - $ (916) $ 58,794U.S. government sponsored entity mortgage-backed securities issued by FNMA/FHLMC 10,221 32 (121) 10,132U.S. government agency small business administration pools guaranteed by SBA 158,430 - (7,464) 150,966Collateralized mortgage obligations guaranteed by GNMA 63,149 274 (1,166) 62,257Collateralized mortgage obligations issued by FNMA or FHLMC 52,635 47 (903) 51,779Asset-backed securities 24,170 - (125) 24,045State and municipal bonds 53,862 434 (760) 53,536
$ 422,177 $ 787 $ (11,455) $ 411,509
2017Gross Gross Estimated
Amortized Unrealized Unrealized FairCost Gains Losses Value
U.S. Treasury securities $ 40,002 $ - $ (536) $ 39,466U.S. government sponsored entity mortgage-backed securities issued by FNMA 4,522 - (10) 4,512U.S. government agency small business administration pools guaranteed by SBA 141,837 20 (2,465) 139,392Collateralized mortgage obligations guaranteed by GNMA/VA 69,296 337 (1,717) 67,916Collateralized mortgage obligations issued by FNMA or FHLMC 51,550 90 (1,123) 50,517Asset-backed securities 16,071 - (61) 16,010State and municipal bonds 90,048 4,220 (164) 94,104
$ 413,326 $ 4,667 $ (6,076) $ 411,917

BNCCORP, INC. Annual Report 201854
The amortized cost and estimated fair value of investment securities available for sale classified according to their contractual maturities at December 31, 2018, were as follows (in thousands):
Amortized EstimatedCost Fair Value
Due in one year or less $ - $ -Due after one year through five years 35,160 34,764Due after five years through ten years 94,162 92,269Due after ten years 292,855 284,476
Total $ 422,177 $ 411,509
The table above is not intended to reflect actual maturities, cash flows, or interest rate risk. Actual maturities may differ from the contractual maturities shown above as a result of prepayments.
Investment securities available for sale with estimated fair values of $113.9 million and $118.8 million at December 31, 2018 and 2017, respectively, were pledged as collateral for public and trust deposits and borrowings, including borrowings from the FHLB and repurchase agreements with customers.
Sales proceeds and gross realized gains and losses on available for sale securities were as follows for the years ended December 31 (in thousands):
2018 2017Sales proceeds $ 62,516 $ 99,910Gross realized gains 2,513 1,398Gross realized losses (220) (653)Net realized gains $ 2,293 $ 745

55BNCCORP, INC. Annual Report 2018
The following table shows the Company’s gross unrealized losses and fair value of investment securities available for sale aggregated by investment category and length of time that individual securities have been in a continuousunrealized loss position at December 31 (in thousands):
2018Less than 12 months 12 months or more Total
Description of Fair Unrealized Fair Unrealized Fair UnrealizedSecurities # Value Loss # Value Loss # Value Loss
U.S. Treasury securities 2 $ 19,652 $ (55) 2 $ 39,142 $ (861) 4 $ 58,794 $ (916)U.S. government sponsored entitymortgage-backed securities issued by FNMA/FHLMC - - - 3 4,132 (121) 3 4,132 (121)U.S. government agency small business administration pools guaranteed by SBA 5 28,836 (1,444) 40 122,130 (6,020) 45 150,966 (7,464)Collateralized mortgage obligations guaranteed by GNMA - - - 5 40,146 (1,166) 5 40,146 (1,166)Collateralized mortgage obligations issued by FNMA or FHLMC 3 13,965 (88) 8 34,583 (815) 11 48,548 (903)Asset-backed securities 4 14,752 (46) 4 9,293 (79) 8 24,045 (125)State and municipal bonds 9 30,441 (402) 6 16,575 (358) 15 47,016 (760)Total temporarily impaired securities 23 $ 107,646 $ (2,035) 68 $ 266,001 $ (9,420) 91 $ 373,647 $ (11,455)
2017Less than 12 months 12 months or more Total
Description of Fair Unrealized Fair Unrealized Fair UnrealizedSecurities # Value Loss # Value Loss # Value Loss
U.S. Treasury securities 2 $ 39,466 $ (536) - $ - $ - 2 $ 39,466 $ (536)U.S. government sponsored entity
mortgage-backed securities issued by FNMA 3 4,512 (10) - - - 3 4,512 (10)
U.S. government agency small business administration pools guaranteed by SBA 32 117,695 (1,870) 5 15,670 (595) 37 133,365 (2,465)
Collateralized mortgage obligations guaranteed by GNMA/VA 4 2,046 (15) 4 42,326 (1,702) 8 44,372 (1,717)
Collateralized mortgage obligations issued by FNMA or FHLMC 5 25,320 (630) 4 17,287 (493) 9 42,607 (1,123)
Asset-backed securities 4 16,010 (61) - - - 4 16,010 (61)State and municipal bonds 5 12,185 (164) - - - 5 12,185 (164)Total temporarily impaired
securities 55 $ 217,234 $ (3,286) 13 $ 75,283 $ (2,790) 68 $ 292,517 $ (6,076)
Management regularly evaluates each security with unrealized losses to determine whether losses are other-than-temporary. When determining whether a security is other-than-temporarily impaired, management assesses whether it has the intent to sell the security or whether it is more likely than not that it will be required to sell the security before a recovery of amortized cost. When evaluating a security, management considers several factors including, but not limited to, the amount of the unrealized loss, the length of time the security has been in a loss position, guarantees provided by third parties, ratings on the security, cash flow from the security, the level of credit support provided by subordinate tranches, and the collateral underlying the security.
There were no securities that management concluded were other-than-temporarily impaired during 2018 or 2017.

BNCCORP, INC. Annual Report 201856
NOTE 3. Federal Reserve Bank and Federal Home Loan Bank Stock
The carrying amounts of FRB and FHLB stock, which approximate their fair values, consisted of the following as of December 31 (in thousands):
2018 2017Federal Reserve Bank Stock, at cost $ 1,807 $ 1,807Federal Home Loan Bank, at cost 1,134 1,090
Total $ 2,941 $ 2,897
There is no contractual maturity on these investments; the investments are required by counterparties.
NOTE 4. Loans and Leases
The composition of loans and leases is as follows at December 31 (in thousands):
2018 2017
Loans held for sale-mortgage banking $ 22,788 $ 36,601
Commercial and industrial $ 149,886 $ 126,169Commercial real estate 174,868 177,429SBA 32,505 25,064Consumer 78,055 71,876Land and land development 11,398 14,168Construction 21,257 13,167
Gross loans and leases held for investment 467,969 427,873Unearned income and net unamortized deferred fees and costs 499 452Loans, net of unearned income and unamortized fees and costs 468,468 428,325Allowance for credit losses (7,692) (7,861)
Net loans and leases held for investment $ 460,776 $ 420,464
To accommodate customers whose financing needs exceed the Bank’s lending limits, BNC sells loan participations on a nonrecourse basis to outside financial institutions and derecognizes the portion of the loan balance sold. At December 31, 2018 and 2017, loan participations sold on a nonrecourse basis to outside financial institutions totaled $166.3 million and $176.7 million, respectively.
Loans to Related PartiesNote 23 to these consolidated financial statements includes information relating to loans to executive officers, directors, principal shareholders and associates of such persons.
Loans Pledged as CollateralThe table below present’s loans pledged as collateral to the FHLB, FRB, and the Bank of North Dakota as of December 31(in thousands):
2018 2017Commercial and industrial $ 43,130 $ 39,274Commercial real estate 97,788 98,647Consumer 32,357 33,123
$ 173,275 $ 171,044

57BNCCORP, INC. Annual Report 2018
NOTE 5. Allowance for Credit Losses
Transactions in the allowance for credit losses were as follows for the years ended December 31 (in thousands):
2018Commercial
and industrial
Commercial real estate SBA Consumer
Land and land
development Construction TotalBalance, beginning
of period $ 2,158 $ 3,471 $ 834 $ 914 $ 358 $ 126 $ 7,861Provision
(reduction) (190) 72 66 112 (133) 73 -Loans charged off (71) (1) (59) (129) - - (260)Loan recoveries 40 16 4 31 - - 91Balance, end of
period $ 1,937 $ 3,558 $ 845 $ 928 $ 225 $ 199 $ 7,692
2017Commercial
and industrial
Commercial real estate SBA Consumer
Land and land
development Construction TotalBalance, beginning
of period $ 2,323 $ 3,231 $ 1,433 $ 772 $ 413 $ 113 $ 8,285Provision
(reduction) (81) 228 (81) 225 46 13 350Loans charged off (84) - (566) (123) (103) - (876)Loan recoveries - 12 48 40 2 - 102Balance, end of
period $ 2,158 $ 3,471 $ 834 $ 914 $ 358 $ 126 $ 7,861
The following table shows the balance in the allowance for credit losses at December 31, 2018, and December 31, 2017, and the related loan balances, segregated on the basis of impairment methodology (in thousands). Impaired loans are loans on nonaccrual status and troubled debt restructurings, which are individually evaluated for impairment, and other loans deemed to have similar risk characteristics. All other loans are collectively evaluated for impairment.
Allowance For Credit Losses Gross Loans and Leases Held for InvestmentImpaired Other Total Impaired Other Total
December 31, 2018Commercial and industrial $ 246 $ 1,691 $ 1,937 $ 1,758 $ 148,128 $ 149,886Commercial real estate 73 3,485 3,558 1,496 173,372 174,868SBA 62 783 845 104 32,401 32,505Consumer 6 922 928 80 77,975 78,055Land and land development - 225 225 28 11,370 11,398Construction - 199 199 - 21,257 21,257Total $ 387 $ 7,305 $ 7,692 $ 3,466 $ 464,503 $ 467,969
December 31, 2017Commercial and industrial $ 407 $ 1,751 $ 2,158 $ 1,737 $ 124,432 $ 126,169Commercial real estate 87 3,384 3,471 1,510 175,919 177,429SBA 64 770 834 143 24,921 25,064Consumer 10 904 914 311 71,565 71,876Land and land development - 358 358 52 14,116 14,168Construction - 126 126 - 13,167 13,167Total $ 568 $ 7,293 $ 7,861 $ 3,753 $ 424,120 $ 427,873
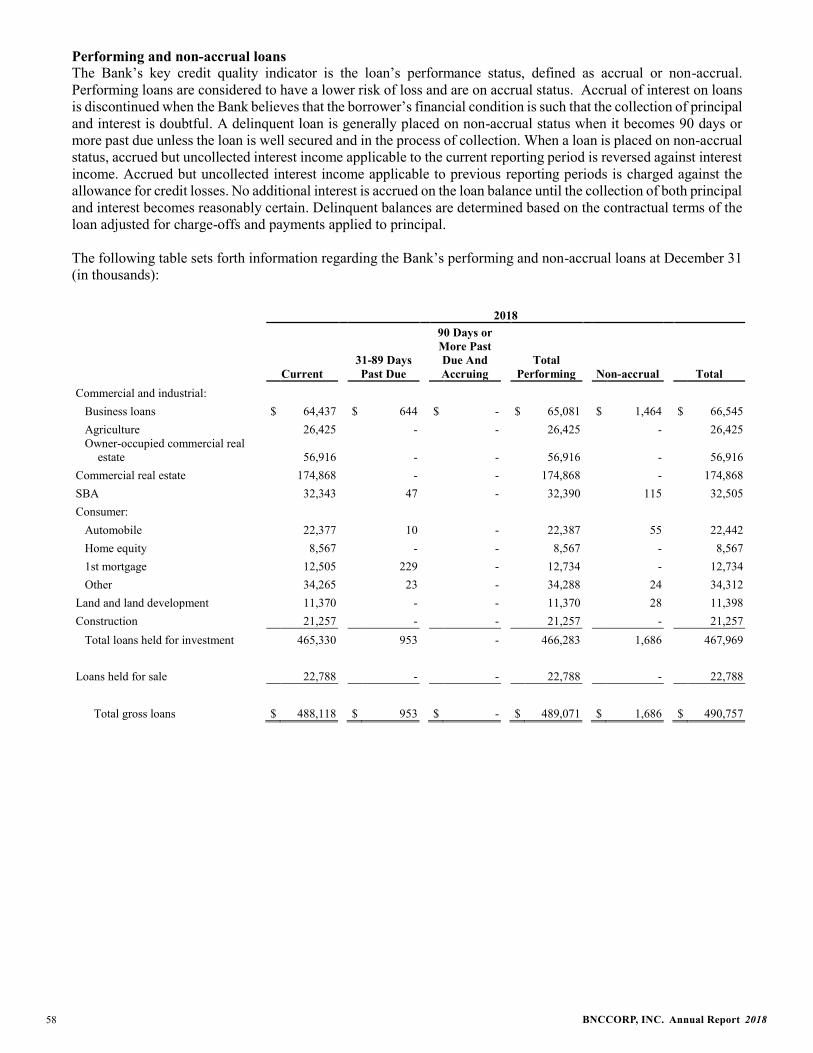
BNCCORP, INC. Annual Report 201858
Performing and non-accrual loans The Bank’s key credit quality indicator is the loan’s performance status, defined as accrual or non-accrual. Performing loans are considered to have a lower risk of loss and are on accrual status. Accrual of interest on loansis discontinued when the Bank believes that the borrower’s financial condition is such that the collection of principal and interest is doubtful. A delinquent loan is generally placed on non-accrual status when it becomes 90 days or more past due unless the loan is well secured and in the process of collection. When a loan is placed on non-accrual status, accrued but uncollected interest income applicable to the current reporting period is reversed against interest income. Accrued but uncollected interest income applicable to previous reporting periods is charged against the allowance for credit losses. No additional interest is accrued on the loan balance until the collection of both principal and interest becomes reasonably certain. Delinquent balances are determined based on the contractual terms of the loan adjusted for charge-offs and payments applied to principal.
The following table sets forth information regarding the Bank’s performing and non-accrual loans at December 31 (in thousands):
2018
Current31-89 DaysPast Due
90 Days or More Past Due AndAccruing
Total Performing Non-accrual Total
Commercial and industrial:Business loans $ 64,437 $ 644 $ - $ 65,081 $ 1,464 $ 66,545Agriculture 26,425 - - 26,425 - 26,425Owner-occupied commercial real
estate 56,916 - - 56,916 - 56,916Commercial real estate 174,868 - - 174,868 - 174,868SBA 32,343 47 - 32,390 115 32,505Consumer:
Automobile 22,377 10 - 22,387 55 22,442Home equity 8,567 - - 8,567 - 8,5671st mortgage 12,505 229 - 12,734 - 12,734Other 34,265 23 - 34,288 24 34,312
Land and land development 11,370 - - 11,370 28 11,398Construction 21,257 - - 21,257 - 21,257
Total loans held for investment 465,330 953 - 466,283 1,686 467,969
Loans held for sale 22,788 - - 22,788 - 22,788
Total gross loans $ 488,118 $ 953 $ - $ 489,071 $ 1,686 $ 490,757

59BNCCORP, INC. Annual Report 2018
2017
Current31-89 DaysPast Due
90 Days or More Past Due AndAccruing
Total Performing Non-accrual Total
Commercial and industrial:Business loans $ 49,686 $ 75 $ 26 $ 49,787 $ 1,737 $ 51,524Agriculture 23,773 - - 23,773 - 23,773Owner-occupied commercial real
estate 50,872 - - 50,872 - 50,872Commercial real estate 177,212 217 - 177,429 - 177,429SBA 24,505 416 - 24,921 143 25,064Consumer:
Automobile 16,631 11 - 16,642 20 16,662Home equity 9,276 14 - 9,290 - 9,2901st mortgage 14,401 - - 14,401 - 14,401Other 31,474 49 - 31,523 - 31,523
Land and land development 14,116 - - 14,116 52 14,168Construction 13,167 - - 13,167 - 13,167
Total loans held for investment 425,113 782 26 425,921 1,952 427,873
Loans held for sale 36,600 1 - 36,601 - 36,601
Total gross loans $ 461,713 $ 783 $ 26 $ 462,522 $ 1,952 $ 464,474
The following table indicates the effect on interest income on loans if interest on non-accrual loans outstanding at year end had been recognized at original contractual rates during the year ended December 31 (in thousands):
2018 2017Interest income that would have been recorded $ 123 $ 161Interest income recorded - -Effect on interest income on loans $ 123 $ 161
Credit Risk by Internally Assigned GradeThe Company maintains an internal risk rating process in order to increase the precision and effectiveness of credit risk management. Loans are assigned one of the following four internally assigned grades: pass, watch list, substandard, and doubtful.
At December 31, 2018, the Company had $452.0 million of loans categorized as pass rated loans. This compares to $415.1 million at December 31, 2017.
Loans designated as watch list are loans that possess some credit deficiency that deserves close attention due to emerging problems. Such loans pose unwarranted financial risk that, if left uncorrected, may result in deterioration of the repayment prospects for the asset or in the Bank’s credit position at some future date. At December 31, 2018,the Company had $5.2 million of loans categorized as watch list loans compared to $1.7 million at December 31, 2017.
Loans graded as Substandard or Doubtful are considered “Classified” loans for regulatory purposes. Loans classified as substandard are loans that are generally inadequately protected by the current net worth and paying capacity of the obligor, or by the collateral pledged, if any. Loans classified as substandard have a well-defined weakness or weaknesses that jeopardize the liquidation of the loan. Substandard loans are characterized by the distinct possibility that the Bank will sustain some loss if the deficiencies are not corrected. Loans classified as doubtful have the weaknesses of those classified as substandard, with additional characteristics that make collection

BNCCORP, INC. Annual Report 201860
in full on the basis of currently existing facts, conditions and values questionable, and there is a higher probabilityof loss. At December 31, 2018, the Company had $9.2 million of substandard loans and $1.6 million of doubtful loans. This compares to $9.1 million of substandard loans and $1.9 million doubtful loans as of December 31, 2017.
Impaired loansImpaired loans include loans the Bank will not be able to collect all amounts due in accordance with the terms of the loan agreement. Impaired loans include non-accrual loans and loans that have been modified in a troubled debt restructuring. All loans are individually reviewed for impairment.
The following table summarizes impaired loans and related allowances as of and for the years ended December 31, 2018 and 2017 (in thousands):
2018
Unpaid Principal
Recorded Investment
Related Allowance
Average Recorded Balance
InterestIncome
Recognized(12 months)
Impaired loans with an allowance recorded:Commercial and industrial:
Business loans $ 1,996 $ 1,454 $ 246 $ 1,484 $ -Agriculture - - - - -Owner-occupied commercial real estate - - - - -
Commercial real estate 1,795 1,496 73 1,497 76SBA 143 115 62 117 -Consumer:
Automobile 16 12 6 15 -Home equity - - - - -1st mortgage - - - - -Other - - - - -
Land and land development - - - - -Construction - - - - -Loans held for sale - - - - -
Total impaired loans with an allowance recorded $ 3,950 $ 3,077 $ 387 $ 3,113 $ 76
Impaired loans without an allowance recorded:Commercial and industrial:
Business loans $ 1,915 $ 294 $ - $ 305 $ 12Agriculture - - - - -Owner-occupied commercial real estate - - - - -
Commercial real estate - - - - -SBA - - - - -Consumer:
Automobile 62 43 - 44 -Home equity - - - - -1st mortgage - - - - -Other 45 24 - 26 -
Land and land development 150 28 - 40 -Construction - - - - -Loans held for sale - - - - -
Total impaired loans without an allowance recorded $ 2,172 $ 389 $ - $ 415 $ 12
TOTAL IMPAIRED LOANS $ 6,122 $ 3,466 $ 387 $ 3,528 $ 88

61BNCCORP, INC. Annual Report 2018
2017
Unpaid Principal
Recorded Investment
Related Allowance
Average Recorded Balance
InterestIncome
Recognized(12 months)
Impaired loans with an allowance recorded:Commercial and industrial:
Business loans $ 2,678 $ 1,737 $ 407 $ 1,821 $ -Agriculture - - - - -Owner-occupied commercial real estate - - - - -
Commercial real estate 1,809 1,510 87 1,526 77SBA 121 107 64 111 -Consumer:
Automobile 23 20 10 24 -Home equity - - - - -1st mortgage - - - - -Other - - - - -
Land and land development - - - - -Construction - - - - -Loans held for sale - - - - -
Total impaired loans with an allowance recorded $ 4,631 $ 3,374 $ 568 $ 3,482 $ 77
Impaired loans without an allowance recorded:Commercial and industrial:
Business loans $ - $ - $ - $ - $ -Agriculture - - - - -Owner-occupied commercial real estate - - - - -
Commercial real estate - - - - -SBA 134 36 - 108 -Consumer:
Automobile - - - - -Home equity - - - - -1st mortgage 1,878 291 - 295 12Other - - - - -
Land and land development 155 52 - 52 -Construction - - - - -Loans held for sale - - - - -
Total impaired loans without an allowance recorded $ 2,167 $ 379 $ - $ 455 $ 12
TOTAL IMPAIRED LOANS $ 6,798 $ 3,753 $ 568 $ 3,937 $ 89

BNCCORP, INC. Annual Report 201862
Troubled Debt Restructuring (TDR)Included in net loans and leases held for investment, are certain loans that have been modified in order to maximize collection of loan balances. If the Company, for legal or economic reasons related to the borrower’s financial difficulties, grants a concession that would not otherwise be considered, compared to the original terms and conditions of the loan, the modified loan is considered a troubled debt restructuring.
The table below summarizes the amounts of restructured loans as of December 31 (in thousands):
2018Accrual Non-accrual Total Allowance
Commercial and industrial:Business loans $ 284 $ 1,454 $ 1,738 $ 244Agriculture - - - -Owner-occupied commercial real estate - - - -
Commercial real estate 1,496 - 1,496 73SBA - 115 115 63Consumer:
Automobile - - - -Home equity - - - -1st mortgage - - - -Other - - - -
Land and land development - - - -Construction - - - -Loans held for sale - - - -
$ 1,780 $ 1,569 $ 3,349 $ 380
2017Accrual Non-accrual Total Allowance
Commercial and industrial:Business loans $ - $ - $ - $ -Agriculture - - - -Owner-occupied commercial real estate - - - -
Commercial real estate 1,510 - 1,510 87SBA - 107 107 64Consumer:
Automobile - - - -Home equity - - - -1st mortgage 291 - 291 -Other - - - -
Land and land development - - - -Construction - - - -Loans held for sale - - - -
$ 1,801 $ 107 $ 1,908 $ 151
TDR concessions can include reduction of interest rates, extension of maturity dates, forgiveness of principal and/or interest due, or acceptance of real estate or other assets in full or partial satisfaction of the debt. Loan modifications are not reported as TDR’s after 12 months if the loan was modified at a market rate of interest for comparable risk loans, and the loan is performing in accordance with the terms of the restructured agreement for at least six months.
When a loan is modified as a TDR, there may be a direct, material impact on the loan balances, as principal balances may be partially forgiven. For the year ended December 31, 2018, there were three new TDRs with a pre-

63BNCCORP, INC. Annual Report 2018
modification and post modification balance of $1.5 million. For the year ended December 31, 2017, there were nonew TDRs.
Loans that were non-accrual prior to modification remain on non-accrual for at least six months following modification. Non-accrual TDR loans that have performed according to the modified terms for six months may be returned to accruing status. Loans that were accruing prior to modification remain on accrual status after the modification as long as the loan continues to perform under the new terms.
The following table indicates the effect on interest income on loans if interest on restructured loans outstanding at year end had been recognized at original contractual rates during the year ended December 31 (in thousands):
2018 2017Interest income that would have been recorded $ 313 $ 211Interest income recorded 88 89Effect on interest income on loans $ 225 $ 122
There were no additional funds committed to borrowers who are in TDR status at December 31, 2018 and December31, 2017.
TDRs are evaluated separately in the Bank’s allowance methodology based on the expected cash flows or collateral values for loans in this status.
As of December 31, 2018 and December 31, 2017, the Bank had no restructured loans that were modified in a troubled-debt restructuring within the previous 12 months for which there was a payment default (i.e. 90 days delinquent).
NOTE 6. Other Real Estate, net
Other real estate (ORE), net includes property acquired through foreclosure, property in judgment and in-substance foreclosures. ORE is carried at fair value less estimated selling costs. Each property is evaluated regularly and the amounts provided to decrease the carrying amount are included in non-interest expense. A summary of the activity related to ORE is presented below for the years ended December 31 (in thousands):
2018 2017Balance, beginning of period $ - $ 214Transfers from nonperforming loans - 40Real estate sold - (264)Net gains on sale of assets - -(Provision) reduction - 10Balance, end of period $ - $ -
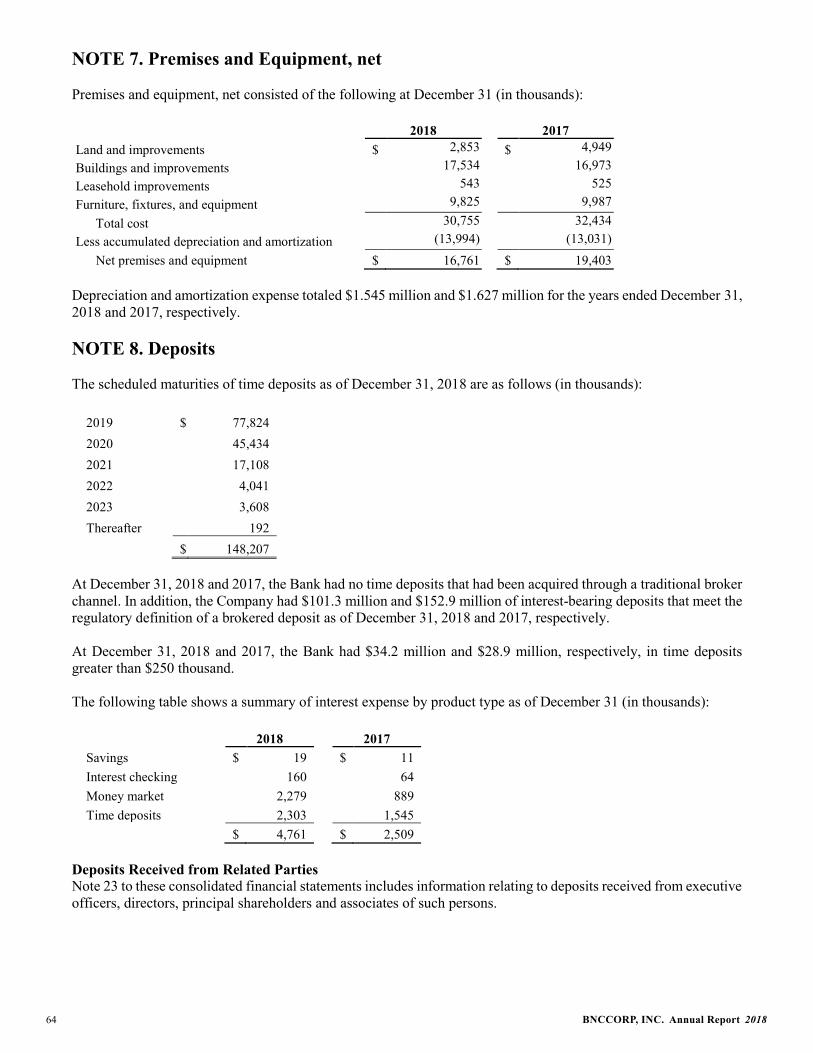
BNCCORP, INC. Annual Report 201864
NOTE 7. Premises and Equipment, net
Premises and equipment, net consisted of the following at December 31 (in thousands):
2018 2017Land and improvements $ 2,853 $ 4,949Buildings and improvements 17,534 16,973Leasehold improvements 543 525Furniture, fixtures, and equipment 9,825 9,987
Total cost 30,755 32,434Less accumulated depreciation and amortization (13,994) (13,031)
Net premises and equipment $ 16,761 $ 19,403
Depreciation and amortization expense totaled $1.545 million and $1.627 million for the years ended December 31, 2018 and 2017, respectively.
NOTE 8. Deposits
The scheduled maturities of time deposits as of December 31, 2018 are as follows (in thousands):
2019 $ 77,8242020 45,4342021 17,1082022 4,0412023 3,608Thereafter 192
$ 148,207
At December 31, 2018 and 2017, the Bank had no time deposits that had been acquired through a traditional brokerchannel. In addition, the Company had $101.3 million and $152.9 million of interest-bearing deposits that meet the regulatory definition of a brokered deposit as of December 31, 2018 and 2017, respectively.
At December 31, 2018 and 2017, the Bank had $34.2 million and $28.9 million, respectively, in time depositsgreater than $250 thousand.
The following table shows a summary of interest expense by product type as of December 31 (in thousands):
2018 2017Savings $ 19 $ 11Interest checking 160 64Money market 2,279 889Time deposits 2,303 1,545
$ 4,761 $ 2,509
Deposits Received from Related PartiesNote 23 to these consolidated financial statements includes information relating to deposits received from executive officers, directors, principal shareholders and associates of such persons.

65BNCCORP, INC. Annual Report 2018
NOTE 9. Short-Term Borrowings
The following table sets forth selected information for short-term borrowings (borrowings with an original maturity of less than one year) as of December 31 (in thousands):
2018 2017
Federal reserve borrowings $ - $ -Repurchase agreements with customers, renewable daily, interest payable monthly,
rates ranging from 0.20% to 1.50% and 0.10% to 0.40%, respectively, secured byU.S. Treasury securities and general obligations of municipalities 11,494 18,043
$ 11,494 $ 18,043
The weighted average interest rate on short-term borrowings outstanding as of December 31, 2018 and 2017 was 0.84% and 0.25%, respectively.
Customer repurchase agreements are used by the Bank to acquire funds from customers where the customers are required, or desire, to have their funds supported by collateral consisting of U.S. government, U.S. government agency or other types of securities. The repurchase agreement is a promise to sell these securities to a customer at a certain price and repurchase them at a future date at that same price plus interest accrued at an agreed upon rate. The Bank uses customer repurchase agreements in its liquidity plan as well as an accommodation to customers. At December 31, 2018, $11.5 million of securities sold under repurchase agreements, with a weighted average interest rate of 0.84%, were collateralized by U.S. Treasury securities having a fair value of $32.0 million and unamortized principal balances of $32.7 million. At December 31, 2017, $18.0 million of securities sold under repurchase agreements, with a weighted average interest rate of 0.25%, were collateralized by U.S. Treasury securities and general obligations of municipalities having a fair value of $32.1 million and unamortized principal balances of $31.3 million.
NOTE 10. Federal Home Loan Bank Advances
As of December 31, 2018, the Bank had no FHLB advances outstanding. At December 31, 2018, the Bank hadloans with unamortized principal balances of approximately $170.3 million and securities with unamortized principal balances of approximately $32.9 million pledged as collateral to the FHLB.
As of December 31, 2017, the Bank had no FHLB advances outstanding. At December 31, 2017, the Bank hadloans with unamortized principal balances of approximately $168.5 million and securities with unamortized principal balances of approximately $35.5 million pledged as collateral to the FHLB.
As of December 31, 2018, the Bank has the ability to draw advances up to approximately $147.0 million based upon the aggregate collateral that is currently pledged, subject to a requirement to purchase additional FHLB stock,based upon collateral pledged.
NOTE 11. Long-Term Borrowings
The following table sets forth selected information for long-term borrowings (borrowings with an original maturity of greater than one year) as of December 31 (in thousands):
2018 2017
Note payable, interest due quarterly, beginning on April 1, 2016 ending October 19, 2025, interest payable at a fixed rate of 6.35% $ 10,000 $ 10,000
The long term borrowing is subordinated debt that qualifies as Tier 2 capital for the Company and the borrowing may be repaid by the Company at par in whole or in part beginning October 19, 2020. The loan agreement includes

BNCCORP, INC. Annual Report 201866
various covenants that are primarily financial in nature. As of December 31, 2018, the Company was in compliance with these covenants.
NOTE 12. Other Borrowings
The following table presents selected information regarding other borrowings at December 31 (in thousands):
2018Unsecured Borrowing Lines:
Line Outstanding Available
BNC National Bank Lines (1) $ 34,500 $ - $ 34,500
Secured Borrowing Lines:CollateralPledged Line Outstanding Available
BNC National Bank Line $ 2,377 $ 2,162 $ - $ 2,162BNC Line 92,633 10,000 - 10,000
Total $ 95,010 $ 12,162 $ - $ 12,162(1) The unsecured BNC National Bank Lines consists of three separate lines with three institutions in individual amounts of $12.5 million, $10
million, and $12 million.
At December 31, 2018, the pledged collateral for the secured BNC National Bank Line was comprised of collateralized mortgage obligations and the pledged collateral for the secured BNC Line is the common stock of BNC National Bank.
2017Unsecured Borrowing Lines:
Line Outstanding AvailableBNC National Bank Lines (1) $ 34,500 $ - $ 34,500
Secured Borrowing Lines:CollateralPledged Line Outstanding Available
BNC Line $ 93,838 $ 10,000 $ - $ 10,000Total $ 93,838 $ 10,000 $ - $ 10,000
(1) The unsecured BNC National Bank Lines consists of three separate lines with three institutions in individual amounts of $12.5 million, $10 million, and $12 million.
At December 31, 2017, the pledged collateral for the secured BNC Line is the common stock of BNC National Bank.

67BNCCORP, INC. Annual Report 2018
NOTE 13. Guaranteed Preferred Beneficial Interests in Company’s Subordinated Debentures
In July 2007, BNC issued $15.0 million of floating rate subordinated debentures. The interest rate paid on the securities is equal to the three month LIBOR plus 1.40%. The interest rate at December 31, 2018 and 2017 was 3.80% and 2.74%, respectively. The subordinated debentures mature on October 1, 2037. The subordinated debentures may be redeemed at par and the corresponding debentures may be prepaid at the option of BNC, subject to approval by the Federal Reserve Board. The payment of interest and ultimate redemption of these debentures is primarily dependent upon the ability of the Bank to transfer funds to BNC in the form of cash dividends, which are subject to regulatory restrictions disclosed in Note 14 to these consolidated financial statements. Pursuant to the subordinated debentures agreement, BNC may defer the payment of interest on the subordinated debentures for up to 20 consecutive quarterly periods. BNC did not defer the payment of interest on the subordinated debentures during the years ended December 31, 2018 and 2017.
BNC fully and unconditionally guarantees the Company’s subordinated debentures.
NOTE 14. Stockholders’ Equity
Regulatory restrictions exist regarding the ability of the Bank to transfer funds to BNCCORP in the form of cash dividends. Approval of the Office of the Comptroller of the Currency (OCC), the Bank’s principal regulator, is required for the Bank to pay dividends to BNCCORP in excess of the Bank’s net profits from the current year plus retained net profits for the preceding two years.
On May 30, 2001, BNCCORP’s Board of Directors adopted a rights plan intended to protect stockholder interests in the event BNCCORP becomes the subject of a takeover initiative that BNCCORP’s Board believes could deny BNCCORP’s stockholders the full value of their investment. This plan does not prohibit the Board from considering any offer that it deems advantageous to its stockholders.
Pursuant to the rights plan, the rights are issued to each common stockholder of record, and are exercisable only if a person acquires, or announces a tender offer, that would result in ownership of 15% or more of BNCCORP’s outstanding common stock. The rights plan was amended in 2011 such that it now expires on May 30, 2021.
NOTE 15. Regulatory Capital and Current Operating Environment
BNC and BNC Bank are subject to various regulatory capital requirements administered by the federal bankingagencies. Failure to meet capital requirements mandated by regulators can trigger certain mandatory and discretionary actions by regulators. Such actions, if undertaken, could have a direct material adverse effect on the Company’s financial condition and results of operations. Under capital adequacy guidelines and the regulatory framework for prompt corrective action, BNC and BNC Bank must meet specific capital guidelines that involve quantitative measures of their assets, liabilities and certain off-balance-sheet items as calculated under regulatory accounting practices. Regulators continue to impose capital requirements that are specific to individual institutions. The requirements are generally above the statutory ratios.
At December 31, 2018, the capital ratios exceeded all regulatory capital thresholds and maintained sufficient capital conservation buffers to avoid limitations on certain types of capital distributions.

BNCCORP, INC. Annual Report 201868
The capital amounts and ratios presented below for December 31, 2018 and December 31, 2017 were as follows (dollars in thousands):
ActualFor Capital Adequacy
Purposes To be Well CapitalizedAmount in Excess of
Well CapitalizedAmount Ratio Amount Ratio Amount Ratio Amount Ratio
2018Total Risk Based Capital:
Consolidated $ 116,734 20.26 % $ 46,091 ≥8.00 % $ N/A N/A % $ N/A N/A%BNC National Bank 106,154 18.44 46,053 ≥8.00 57,566 10.00 48,588 8.44
Tier 1 Risk Based Capital:Consolidated 99,527 17.28 34,568 ≥6.00 N/A N/A N/A N/ABNC National Bank 98,952 17.19 34,540 ≥6.00 46,053 8.00 52,899 9.19
Common Equity Tier 1 Risk Based Capital:
Consolidated 84,518 14.67 25,926 ≥4.50 N/A N/A N/A N/ABNC National Bank 98,952 17.19 25,905 ≥4.50 37,418 6.50 61,534 10.69
Tier 1 Leverage Capital:Consolidated 99,527 9.97 39,930 ≥4.00 N/A N/A N/A N/ABNC National Bank 98,952 9.92 39,890 ≥4.00 49,862 5.00 49,090 4.92
Tangible Common Equity(to total assets): (a)
Consolidated 77,611 7.99 N/A N/A N/A N/A N/A N/ABNC National Bank 92,490 9.53 N/A N/A N/A N/A N/A N/A
2017Total Risk Based Capital:
Consolidated $ 109,187 19.98% $ 43,717 ≥8.00% $ N/A N/A% $ N/A N/A%BNC National Bank 99,933 18.31 43,657 ≥8.00 54,572 10.00 45,361 8.31
Tier 1 Risk Based Capital:Consolidated 92,344 16.90 32,788 ≥6.00 N/A N/A N/A N/ABNC National Bank 93,098 17.06 32,743 ≥6.00 43,657 8.00 49,441 9.06
Common Equity Tier 1 Risk Based Capital:
Consolidated 77,333 14.15 24,591 ≥4.50 N/A N/A N/A N/ABNC National Bank 93,098 17.06 24,557 ≥4.50 35,472 6.50 57,626 10.56
Tier 1 Leverage Capital:Consolidated 92,344 9.53 38,749 ≥4.00 N/A N/A N/A N/ABNC National Bank 93,098 9.62 38,713 ≥4.00 48,392 5.00 44,706 4.62
Tangible Common Equity(to total assets): (a)
Consolidated 77,407 8.18 N/A N/A N/A N/A N/A N/ABNC National Bank 93,618 9.91 N/A N/A N/A N/A N/A N/A(a) Tangible common equity is calculated by dividing common equity, less intangible assets, by total period end assets.
The most recent notifications from the OCC categorized the Bank as well capitalized under the regulatory framework for prompt corrective action. Management believes the Bank remains well capitalized through the date for which subsequent events have been evaluated.

69BNCCORP, INC. Annual Report 2018
NOTE 16. Revenue from Contracts with Customers
Accounting for revenue within the scope of ASC 606 is consistent with the policies and practices prior to adoption of ASC 606. The majority of the Company’s performance obligations for revenue from contracts with customers are satisfied at a point in time and are typically collected from customers at the time of the transaction or shortly thereafter.
The following is a description of the principal activities from which the Company generates revenue that are within the scope of ASC 606:
Service charges on deposits – Service charges on deposit accounts represent daily and monthly analysis fees recognized for the services related to customer deposit accounts, including account maintenance, overdraft fees, and depository transactions processing fees. Depository accounts charge fees in accordance with the customer’s pricing schedule or may be assessed a flat service fee per month. The Company satisfies the performance obligation related to providing depository accounts daily as transactions are processed and deposit service charge revenue is recognized daily.
Bankcard fees – Bankcard fees primarily represent income earned from interchange revenue from Visa for the Company’s processing of debit card transactions. The performance obligation for interchange revenue is the processing of each transaction through the Company’s access to the banking system. This performance obligation is completed for each individual transaction and revenue is recognized per transaction in accordance with interchange rates established by Visa.
Wealth management revenue – Wealth management revenue consists of fees earned on personal trust accounts, retirement plan administration, and wealth management services. The performance obligations related to this revenue include items such as performing trustee service administration, investment management services, custody and record-keeping services, retirement plan administration, and tax services. These fees are part of contractual agreements and the performance obligations are satisfied upon completion of services. The fees are generally a fixed flat annual rate or based on a percentage of the account’s market value per the contract with the customer and revenue is recognized over time as earned.
Other income – The Company recognizes other miscellaneous income through a variety of other revenue streams, the most material of which include revenue from investments in Small Business Investment Companies (SBIC), gains on sales of financial assets, and bank-owned life insurance income. These revenue streams are outside of the scope of ASC 606 and are recognized in accordance with the applicable U.S. generally accepted accounting principles. The remainder of Other income is primarily earned through transactions with personal banking customers, including stop payment charges and fees for cashier’s checks. The performance obligations of these types of fees are satisfied as transactions are completed and revenue is recognized upon transaction execution according to established fee schedules with the customers.
The Company had no material contract assets or remaining performance obligations as of December 31, 2018. Total receivables from revenue recognized under the scope of ASC 606 were $417 thousand and $393 thousand as of December 31, 2018 and December 31, 2017, respectively. These receivables are included as part of the Other assets line on the Company’s Consolidated Balance Sheets.

BNCCORP, INC. Annual Report 201870
The following table disaggregates non-interest income subject to ASC 606 (in thousands):
2018 2017
Service charges on deposits $ 727 $ 775Bankcard fees 1,031 950Bank charges and service fees not within scope of ASC 606 929 994
Total bank charges and service fees 2,687 2,719
Wealth management revenue 1,810 1,697Wealth management revenue not within the scope of ASC 606 - 20
Total wealth management revenues 1,810 1,717
Other 53 55Other not within the scope of ASC 606 (a) 1,955 2,226
Total other 2,008 2,281
Other non-interest income not within the scope of ASC 606 (a) 12,512 12,782 Total non-interest income $ 19,017 $ 19,499
(a) This revenue is not within the scope of ASC 606, and includes fees related to mortgage banking operations, gains on sale of loans, gains on sale of securities, revenue from investments in SBIC, and various other transactions.
NOTE 17. Fair Value Measurements
The following table summarizes the financial assets and liabilities of the Company for which fair values are determined on a recurring basis as of December 31 (in thousands):
Carrying Value at December 31, 2018
Twelve Months Ended
December 31, 2018Total Level 1 Level 2 Level 3 Total gains/(losses)
ASSETSInvestment securities available for sale $ 411,509 $ 58,794 $ 352,715 $ - $ 2,293Loans held for sale 22,788 - 22,788 - (505)Commitments to originate mortgage loans 1,479 - 1,479 - 71Total assets at fair value $ 435,776 $ 58,794 $ 376,982 $ - $ 1,859
LIABILITIESCommitments to sell mortgage loans $ 148 $ - $ 148 $ - $ (198)Mortgage banking short positions 210 - 210 - (106)Total liabilities at fair value $ 358 $ - $ 358 $ - $ (304)

71BNCCORP, INC. Annual Report 2018
Carrying Value at December 31, 2017
Twelve Months Ended
December 31, 2017Total Level 1 Level 2 Level 3 Total gains/(losses)
ASSETSInvestment securities available for sale $ 411,917 $ 39,466 $ 372,451 $ - $ 745Loans held for sale 36,601 - 36,601 - (326)Commitments to originate mortgage loans 1,457 - 1,457 - 90Total assets at fair value $ 449,975 $ 39,466 $ 410,509 $ - $ 509
LIABILITIESCommitments to sell mortgage loans $ 42 $ - $ 42 $ - $ (301)Mortgage banking short positions 12 - 12 - 41
Total liabilities at fair value $ 54 $ - $ 54 $ - $ (260)
The Company sells short positions in mortgage-backed securities to manage interest rate risk on the loans committed for mandatory delivery. The commitments to originate and sell mortgage banking loans and the short positions are derivatives and are recorded at fair value.
For the periods presented, U.S. Treasury Securities were considered to be Level 1 while all other assets and liabilities recorded at fair value were considered to be Level 2. There were no transfers into or out of the respective levels during the periods presented.
The Company may also be required from time to time to measure certain other assets at fair value on a nonrecurring basis in accordance with U.S. generally accepted accounting principles. These adjustments to fair value usually result from the application of the lower of cost or market accounting or write-down of individual assets. For assets measured at fair value on a nonrecurring basis the following table provides the level of valuation assumptions used to determine the carrying value at December 31 (in thousands):
2018Total Level 1 Level 2 Level 3 Total gains/(losses)
Impaired loans(1) $ 3,079 $ - $ 3,079 $ - $ 36Other real estate(2) - - - - -Total $ 3,079 $ - $ 3,079 $ - $ 36
2017Total Level 1 Level 2 Level 3 Total gains/(losses)
Impaired loans(1) $ 3,185 $ - $ 3,185 $ - $ (20)Other real estate(2) - - - - 10Total $ 3,185 $ - $ 3,185 $ - $ (10)
(1) The carrying value represents the book value less allocated reserves. The gain or loss reported is the change in the reserve balances allocated on individual impaired loans in addition to the actual write-downs for the period presented.
(2) The carrying value represents the fair value of the collateral less estimated selling costs and is based upon appraised values. The gain or loss reported is a combination of gains and/or losses on sales of other real estate and provisions for other real estate losses.
At the beginning of the period, all assets and liabilities valued at fair value on a nonrecurring basis were considered to be Level 2. There were no transfers into or out of Level 2 during the periods presented.
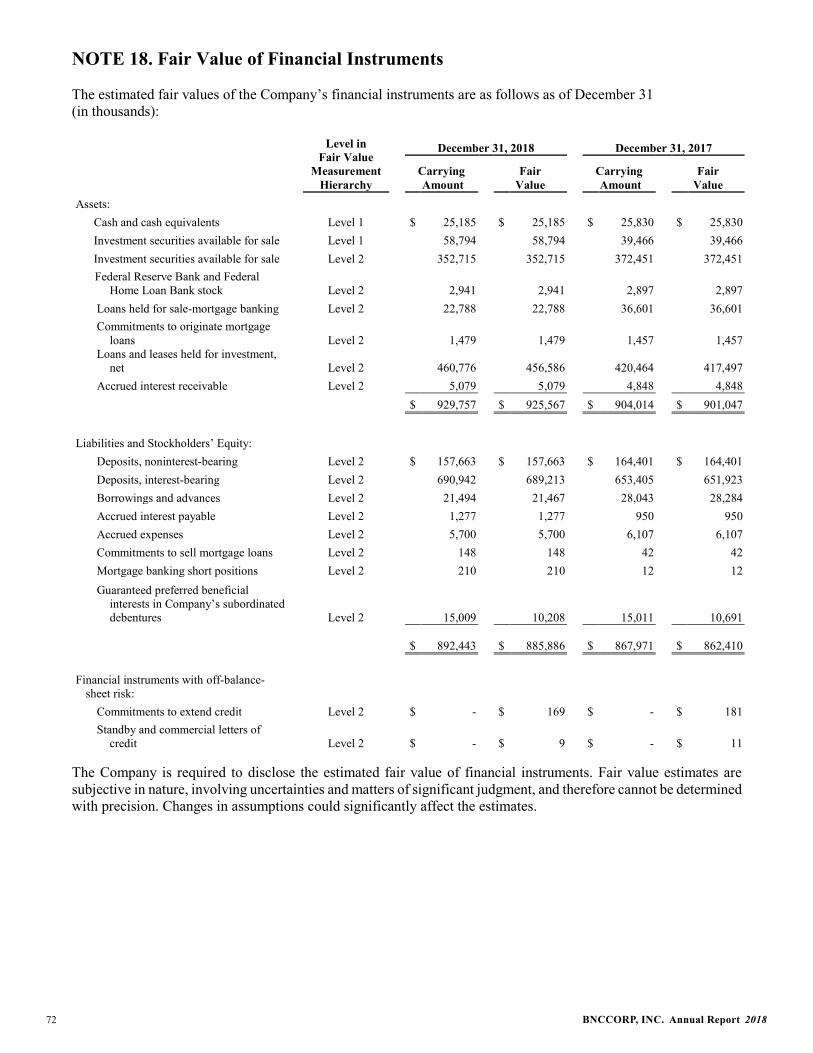
BNCCORP, INC. Annual Report 201872
NOTE 18. Fair Value of Financial Instruments
The estimated fair values of the Company’s financial instruments are as follows as of December 31 (in thousands):
Level in Fair Value
Measurement Hierarchy
December 31, 2018 December 31, 2017
CarryingAmount
FairValue
CarryingAmount
FairValue
Assets:Cash and cash equivalents Level 1 $ 25,185 $ 25,185 $ 25,830 $ 25,830Investment securities available for sale Level 1 58,794 58,794 39,466 39,466Investment securities available for sale Level 2 352,715 352,715 372,451 372,451
Federal Reserve Bank and Federal Home Loan Bank stock Level 2 2,941 2,941 2,897 2,897
Loans held for sale-mortgage banking Level 2 22,788 22,788 36,601 36,601 Commitments to originate mortgage
loans Level 2 1,479 1,479 1,457 1,457 Loans and leases held for investment,
net Level 2 460,776 456,586 420,464 417,497 Accrued interest receivable Level 2 5,079 5,079 4,848 4,848
$ 929,757 $ 925,567 $ 904,014 $ 901,047
Liabilities and Stockholders’ Equity: Deposits, noninterest-bearing Level 2 $ 157,663 $ 157,663 $ 164,401 $ 164,401 Deposits, interest-bearing Level 2 690,942 689,213 653,405 651,923 Borrowings and advances Level 2 21,494 21,467 28,043 28,284 Accrued interest payable Level 2 1,277 1,277 950 950 Accrued expenses Level 2 5,700 5,700 6,107 6,107 Commitments to sell mortgage loans Level 2 148 148 42 42 Mortgage banking short positions Level 2 210 210 12 12 Guaranteed preferred beneficial
interests in Company’s subordinated debentures Level 2 15,009 10,208 15,011 10,691
$ 892,443 $ 885,886 $ 867,971 $ 862,410
Financial instruments with off-balance-sheet risk:
Commitments to extend credit Level 2 $ - $ 169 $ - $ 181 Standby and commercial letters of
credit Level 2 $ - $ 9 $ - $
11
The Company is required to disclose the estimated fair value of financial instruments. Fair value estimates are subjective in nature, involving uncertainties and matters of significant judgment, and therefore cannot be determined with precision. Changes in assumptions could significantly affect the estimates.
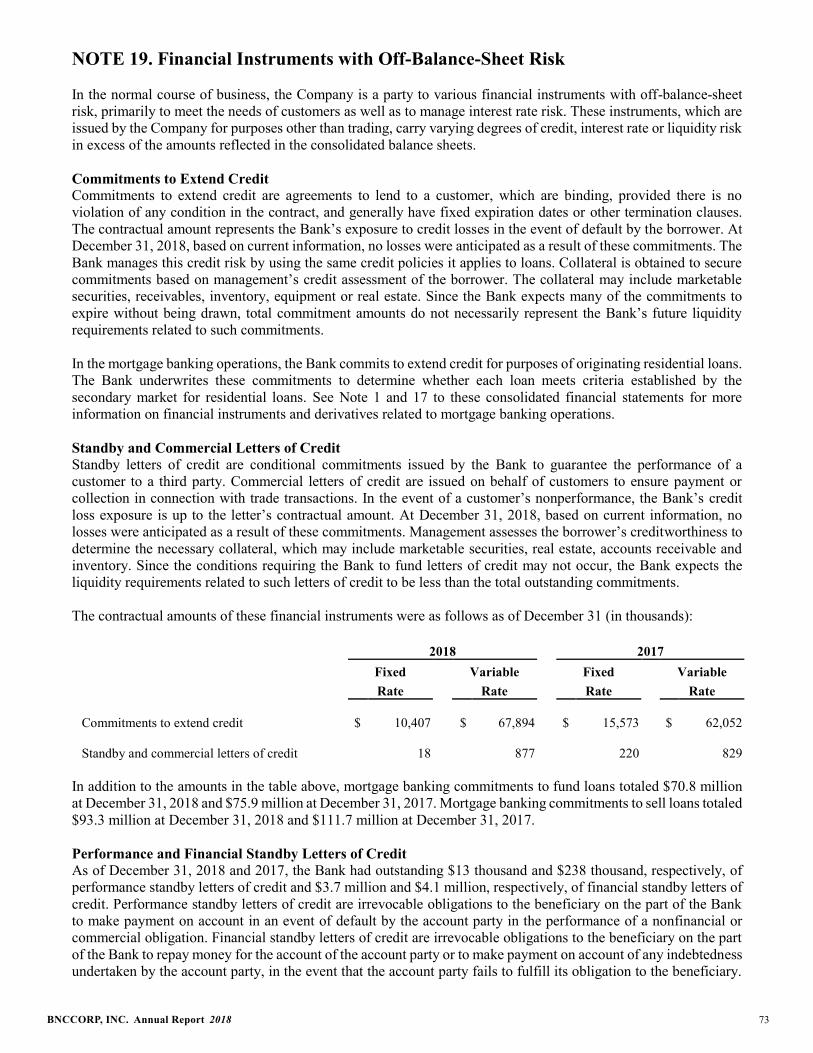
73BNCCORP, INC. Annual Report 2018
NOTE 19. Financial Instruments with Off-Balance-Sheet Risk
In the normal course of business, the Company is a party to various financial instruments with off-balance-sheet risk, primarily to meet the needs of customers as well as to manage interest rate risk. These instruments, which are issued by the Company for purposes other than trading, carry varying degrees of credit, interest rate or liquidity risk in excess of the amounts reflected in the consolidated balance sheets.
Commitments to Extend CreditCommitments to extend credit are agreements to lend to a customer, which are binding, provided there is no violation of any condition in the contract, and generally have fixed expiration dates or other termination clauses. The contractual amount represents the Bank’s exposure to credit losses in the event of default by the borrower. At December 31, 2018, based on current information, no losses were anticipated as a result of these commitments. The Bank manages this credit risk by using the same credit policies it applies to loans. Collateral is obtained to secure commitments based on management’s credit assessment of the borrower. The collateral may include marketable securities, receivables, inventory, equipment or real estate. Since the Bank expects many of the commitments to expire without being drawn, total commitment amounts do not necessarily represent the Bank’s future liquidity requirements related to such commitments.
In the mortgage banking operations, the Bank commits to extend credit for purposes of originating residential loans. The Bank underwrites these commitments to determine whether each loan meets criteria established by the secondary market for residential loans. See Note 1 and 17 to these consolidated financial statements for more information on financial instruments and derivatives related to mortgage banking operations.
Standby and Commercial Letters of CreditStandby letters of credit are conditional commitments issued by the Bank to guarantee the performance of a customer to a third party. Commercial letters of credit are issued on behalf of customers to ensure payment or collection in connection with trade transactions. In the event of a customer’s nonperformance, the Bank’s credit loss exposure is up to the letter’s contractual amount. At December 31, 2018, based on current information, no losses were anticipated as a result of these commitments. Management assesses the borrower’s creditworthiness to determine the necessary collateral, which may include marketable securities, real estate, accounts receivable and inventory. Since the conditions requiring the Bank to fund letters of credit may not occur, the Bank expects theliquidity requirements related to such letters of credit to be less than the total outstanding commitments.
The contractual amounts of these financial instruments were as follows as of December 31 (in thousands):
2018 2017Fixed Variable Fixed VariableRate Rate Rate Rate
Commitments to extend credit $ 10,407 $ 67,894 $ 15,573 $ 62,052
Standby and commercial letters of credit
18
877
220
829
In addition to the amounts in the table above, mortgage banking commitments to fund loans totaled $70.8 million at December 31, 2018 and $75.9 million at December 31, 2017. Mortgage banking commitments to sell loans totaled $93.3 million at December 31, 2018 and $111.7 million at December 31, 2017.
Performance and Financial Standby Letters of CreditAs of December 31, 2018 and 2017, the Bank had outstanding $13 thousand and $238 thousand, respectively, of performance standby letters of credit and $3.7 million and $4.1 million, respectively, of financial standby letters of credit. Performance standby letters of credit are irrevocable obligations to the beneficiary on the part of the Bank to make payment on account in an event of default by the account party in the performance of a nonfinancial or commercial obligation. Financial standby letters of credit are irrevocable obligations to the beneficiary on the part of the Bank to repay money for the account of the account party or to make payment on account of any indebtedness undertaken by the account party, in the event that the account party fails to fulfill its obligation to the beneficiary.

BNCCORP, INC. Annual Report 201874
Under these arrangements, the Bank could, in the event of the account party’s nonperformance, be required to pay a maximum of the amount of issued letters of credit. The Bank has recourse against the account party up to and including the amount of the performance standby letter of credit. The Bank evaluates each account party’s creditworthiness on a case-by-case basis and the amount of collateral obtained varies and is based on management’s credit evaluation of the account party.
Mortgage Banking ObligationsThrough its mortgage banking operations, the Company originates and sells residential mortgage loans servicing released to third parties. These loans are sold without recourse to the Company. Although the Company sellsmortgage banking loans without recourse, industry standards require standard representations and warranties which require sellers to reimburse investors for economic losses if loans default or prepay after the sale. Repurchase risk is also evident within the mortgage banking industry as continued disputes arise between lenders and investors. Such requests for repurchase are commonly due to faulty representation and generally emerge at varied timeframes subsequent to the original sale of the loan. To estimate the contingent obligation, the Company trackshistorical reimbursements and calculates the ratio of reimbursement to loan production volumes. Using reimbursement ratios and recent production levels, the Company estimates the future reimbursement amounts and records the estimated obligation. The following is a summary of activity related to mortgage banking reimbursement obligations at December 31 (in thousands):
2018 2017Balance, beginning of period $ 1,103 $ 1,339Provision - -Write offs, net (121) (236)Balance, end of period $ 982 $ 1,103
NOTE 20. Commitments and Contingencies
LeasesThe Bank has entered into operating lease agreements for certain facilities and equipment used in its operations. Rent expense for the years ended December 31, 2018 and 2017 was $1.3 million and $1.2 million, respectively, forfacilities, and $20 thousand and $25 thousand, respectively, for equipment and other items. At December 31, 2018,the total minimum annual base lease payments for operating leases were as follows (in thousands):
2019 $ 1,1552020 9982021 8202022 7252023 682Thereafter 855
Small Business Investment Companies (SBIC)The Bank has made investments in the Small Business Administration’s SBIC program to enhance small business access to venture capital. At December 31, 2018, the Bank may be required to fund $1.4 million of additional capital calls related to its SBIC investments.
Legal Proceedings From time to time, the Company may be a party to legal proceedings arising from lending, deposit operations or other activities. While the Company is not aware of any such actions or allegations that should reasonably give rise to any material adverse effect, it is possible that the Company could be subject to such a claim in an amount that could be material. Based upon a review with legal counsel, the Company believes that the ultimate disposition of any such litigation will not have a material effect on the Company’s financial condition, results of operations or cash flows.
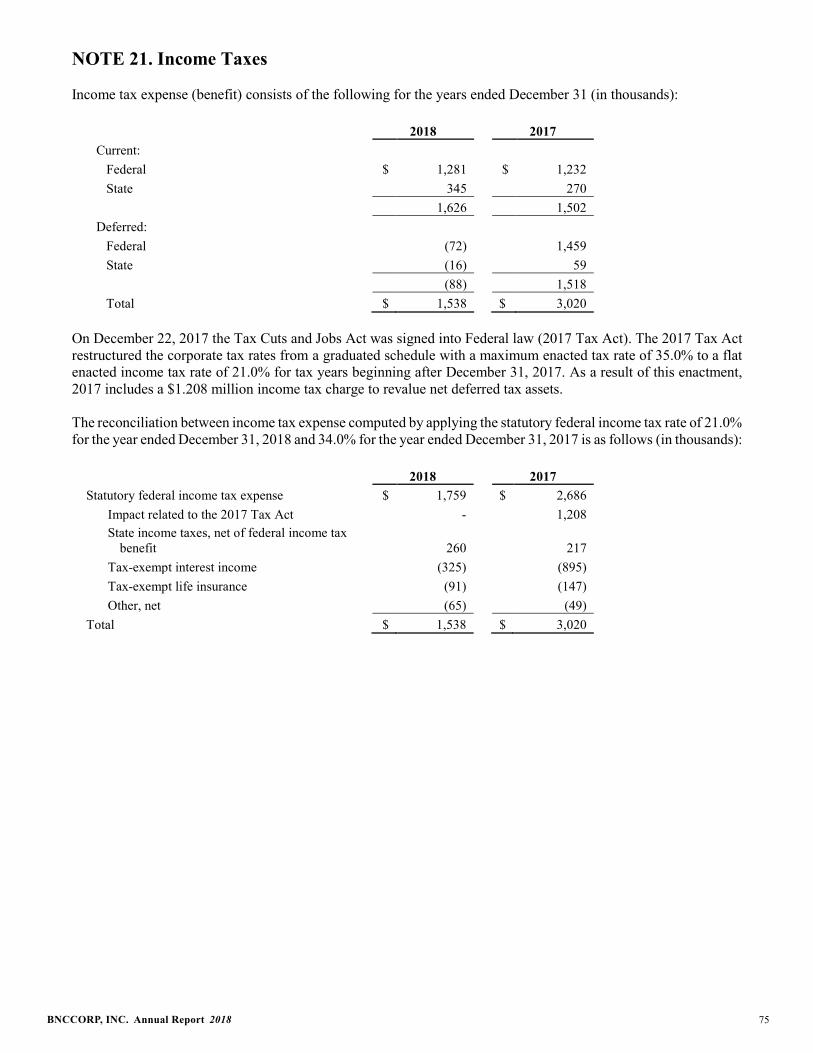
75BNCCORP, INC. Annual Report 2018
NOTE 21. Income Taxes
Income tax expense (benefit) consists of the following for the years ended December 31 (in thousands):
2018 2017Current:
Federal $ 1,281 $ 1,232State 345 270
1,626 1,502Deferred:
Federal (72) 1,459State (16) 59
(88) 1,518Total $ 1,538 $ 3,020
On December 22, 2017 the Tax Cuts and Jobs Act was signed into Federal law (2017 Tax Act). The 2017 Tax Actrestructured the corporate tax rates from a graduated schedule with a maximum enacted tax rate of 35.0% to a flat enacted income tax rate of 21.0% for tax years beginning after December 31, 2017. As a result of this enactment, 2017 includes a $1.208 million income tax charge to revalue net deferred tax assets.
The reconciliation between income tax expense computed by applying the statutory federal income tax rate of 21.0% for the year ended December 31, 2018 and 34.0% for the year ended December 31, 2017 is as follows (in thousands):
2018 2017Statutory federal income tax expense $ 1,759 $ 2,686
Impact related to the 2017 Tax Act - 1,208State income taxes, net of federal income tax
benefit 260 217Tax-exempt interest income (325) (895)Tax-exempt life insurance (91) (147)Other, net (65) (49)
Total $ 1,538 $ 3,020
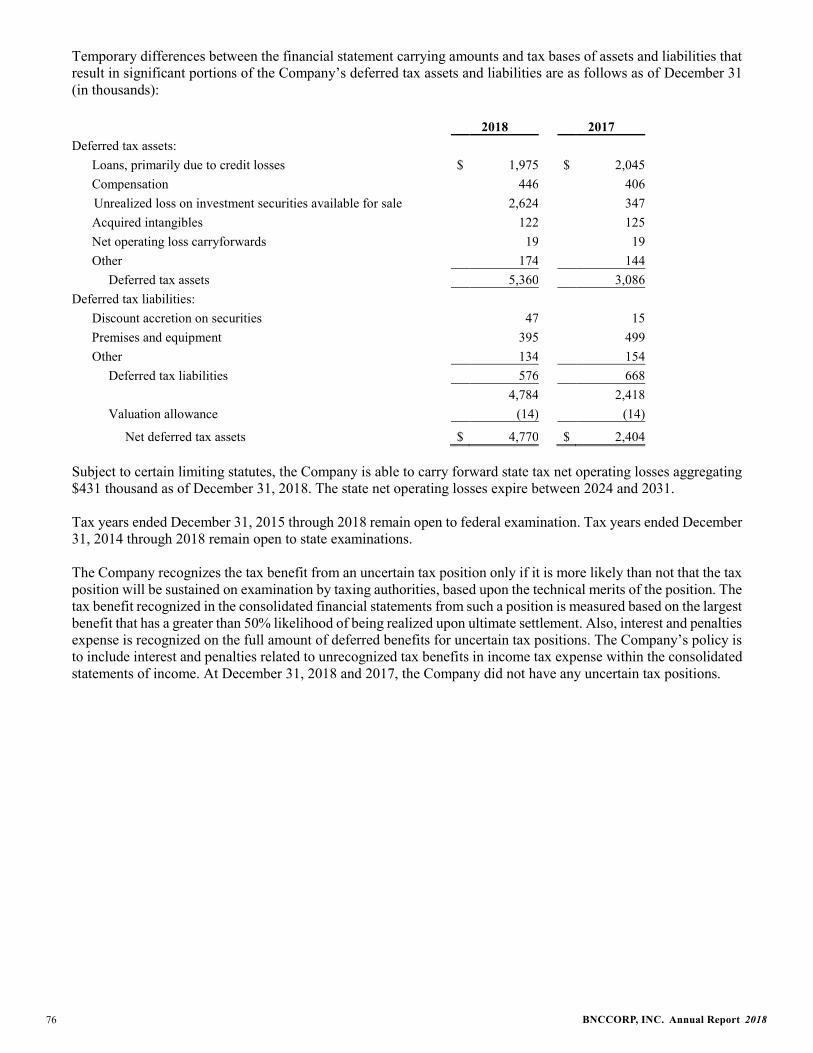
BNCCORP, INC. Annual Report 201876
Temporary differences between the financial statement carrying amounts and tax bases of assets and liabilities that result in significant portions of the Company’s deferred tax assets and liabilities are as follows as of December 31 (in thousands):
2018 2017Deferred tax assets:
Loans, primarily due to credit losses $ 1,975 $ 2,045Compensation 446 406Unrealized loss on investment securities available for sale 2,624 347Acquired intangibles 122 125Net operating loss carryforwards 19 19Other 174 144
Deferred tax assets 5,360 3,086Deferred tax liabilities:
Discount accretion on securities 47 15Premises and equipment 395 499Other 134 154
Deferred tax liabilities 576 6684,784 2,418
Valuation allowance (14) (14)
Net deferred tax assets $ 4,770 $ 2,404
Subject to certain limiting statutes, the Company is able to carry forward state tax net operating losses aggregating $431 thousand as of December 31, 2018. The state net operating losses expire between 2024 and 2031.
Tax years ended December 31, 2015 through 2018 remain open to federal examination. Tax years ended December 31, 2014 through 2018 remain open to state examinations.
The Company recognizes the tax benefit from an uncertain tax position only if it is more likely than not that the tax position will be sustained on examination by taxing authorities, based upon the technical merits of the position. The tax benefit recognized in the consolidated financial statements from such a position is measured based on the largest benefit that has a greater than 50% likelihood of being realized upon ultimate settlement. Also, interest and penalties expense is recognized on the full amount of deferred benefits for uncertain tax positions. The Company’s policy is to include interest and penalties related to unrecognized tax benefits in income tax expense within the consolidated statements of income. At December 31, 2018 and 2017, the Company did not have any uncertain tax positions.

77BNCCORP, INC. Annual Report 2018
NOTE 22. Earnings Per Share
The following table shows the amounts used in computing per share results (in thousands, except share and per share data):
2018 2017Denominator for basic earnings per share:
Average common shares outstanding 3,487,846 3,474,988Dilutive effect of share-based compensation 51,909 65,710Denominator for diluted earnings per share 3,539,755 3,540,698
Numerator (in thousands):Net income $ 6,836 $ 4,878
Basic earnings per common share $ 1.96 $ 1.40
Diluted earnings per common share $ 1.93 $ 1.38
NOTE 23. Related-Party Transactions
The Bank has entered into transactions with related parties, such as opening deposit accounts for and extending credit to employees of the Company. The related party transactions have been made under terms substantially the same as those offered by the Bank to unrelated parties.
In the normal course of business, loans are granted to, and deposits are received from, executive officers, directors, principal stockholders and associates of such persons. The aggregate dollar amount of these loans was $897 thousand and $1.1 million at December 31, 2018 and 2017, respectively. Advances of loans to related parties in 2018 and 2017 totaled $247 thousand and $170 thousand, respectively. Loan pay downs and other reductions by related parties in 2018 and 2017 were $475 thousand and $561 thousand, respectively. Commitments to extend credit to related parties increased to $289 thousand at December 31, 2018 from $239 thousand at December 31, 2017. The total amount of deposits received from these parties was $1.0 million at December 31, 2018 and $930thousand at December 31, 2017. Loans to, and deposits received from, these parties were made on substantially the same terms, including interest rates and collateral, as those prevailing at the time for comparable transactions with unrelated persons and do not involve more than the normal risk of collection.
In 2017, the Company purchased a $500 thousand death benefit right on a split dollar life insurance policy from a director for $250 thousand.
The Federal Reserve Act limits amounts of, and requires collateral on, extensions of credit by the Bank to BNCCORP, and with certain exceptions, its non-bank affiliates. There are also restrictions on the amounts of investment by the Bank in stocks and other subsidiaries of BNCCORP and such affiliates and restrictions on the acceptance of their securities as collateral for loans by the Bank. As of December 31, 2018, BNCCORP and its affiliates were in compliance with these requirements.
NOTE 24. Benefit Plans
BNCCORP has a qualified 401(k) savings plan covering all employees of BNCCORP and subsidiaries who meet specified age and service requirements. Under the plan, eligible employees may elect to defer up to 75% of compensation each year not to exceed the dollar limits set by law. At their discretion, BNCCORP and its subsidiaries may provide matching contributions to the plan. In 2018 and 2017, BNCCORP and subsidiaries made matching contributions of up to 50% of eligible employee deferrals up to a maximum employer contribution of 5% of employee compensation. Generally, all participant contributions and earnings are fully and immediately vested. The Company makes its matching contribution during the first calendar quarter following the last day of each calendar year and an employee must be employed by the Company on the last day of the calendar year in order to receive

BNCCORP, INC. Annual Report 201878
the current year’s employer matching contribution. The anticipated matching contribution is expensed monthly over the course of the calendar year based on employee contributions made throughout the year. The Company made matching contributions of $646,000 and $620,000 for 2018 and 2017, respectively. Under the investment options available under the 401(k) savings plan, prior to January 28, 2008, employees could elect to invest their salary deferrals in BNCCORP common stock. At December 31, 2018, the assets in the plan totaled $25.4 million and included $544,000 (27,000 shares) invested in BNCCORP common stock. At December 31, 2017, the assets in the plan totaled $26.2 million and included $869,000 (28,000 shares) invested in BNCCORP common stock. On January 28, 2008, the Company voluntarily delisted from the NASDAQ Global Market and deregistered its common stock under the Securities Exchange Act of 1934 (as amended). As a result, the participants are prohibited from making new investments of the Company’s common stock in the plan.
During 2015, the Company adopted a non-qualified deferred compensation plan for the benefit of select employees. The plan structure permits the Company to make discretionary awards into an in-service account or a retirement account of a plan participant established under the plan. BNC recognizes the expense for discretionary awards in the period it commits to such awards. Additionally, plan participants may defer some or all of their annual cash incentive awards into their in-service accounts. Company discretionary awards to the participant’s in-service account are generally vested 50% upon initial participation with the remainder vesting ratably over 5 years. Aparticipant’s retirement account generally vests 50% upon an initial contribution and ratably thereafter over 10 years. Participants may allocate their in-service account balance among a fixed number of investment options. The value of the payout from the in-service account will depend on the performance of such investment options. Company discretionary awards into a participant’s retirement account are denominated in shares of BNC common stock and upon retirement, the plan participant will receive the number of shares of BNC common stock credited to the participant’s retirement account at that time. A separate Rabbi Trust has been established by the Company to offset the change in value of this liability. Assets in the trust offsetting in-service liabilities are recorded in other assets. BNC common stock held in the trust related to the Company’s retirement account obligation is recorded in treasury stock and equates to 27,192 shares as of December 31, 2018 and 22,800 shares as of December 31, 2017.As of December 31, 2018, the plan obligation totaled $985 thousand and $878 thousand as of December 31, 2017.
In December of 2015, the Company adopted a non-qualified deferred compensation plan for directors of BNCCORP. Effective with 2016 service, a director may voluntarily make contributions of earned director compensation to a deferred account that is ultimately payable with BNC common stock at the time of separation from service with the Company. The deferred shares of BNC common stock were 8,298 shares and 6,464 shares as of December 31, 2018 and 2017, respectively.
NOTE 25. Share-Based Compensation
The Company has four share-based plans for certain key employees and directors whereby shares of BNC common stock have been reserved for awards in the form of stock options, restricted stock, or common stock equivalent awards. Pursuant to each plan, the compensation committee may grant options at prices equal to the fair value of BNC common stock at the grant date. The company generally issues shares held in treasury when options are exercised and restricted stock is granted.
Total shares in plan and total shares available as of December 31, 2018 are as follows:
1995 2002 2010 2015 TotalTotal Shares in Plan 250,000 125,000 250,000 50,000 675,000Total Shares Available 45,951 - 250,000 39,415 335,366
The Company recognized share-based compensation expense of $21,000 and $18,000 for the years ended December 31, 2018 and 2017, respectively, related to restricted stock.
The tax benefits associated with share-based compensation was approximately $7,000 for the year ended December 31, 2018 and was approximately $26,000 for the year ended December 31, 2017.

79BNCCORP, INC. Annual Report 2018
At December 31, 2018, the Company had $60,000 of unamortized restricted stock compensation, which is expected to be recognized over a period of three years. Restricted shares of stock granted generally have vesting and amortization periods of at least three years.
Following is a summary of restricted stock activities for the years ended December 31:
2018 2017Number Weighted Number Weighted
Restricted Average Restricted AverageStock Grant Date Stock Grant Date
Shares Fair Value Shares Fair ValueNon-vested, beginning of year 3,467 $ 26.45 3,334 $ 14.57Granted - - 2,800 28.78Vested (1,367) 22.86 (2,667) 14.06Forfeited - - - -Non-vested, end of year 2,100 28.78 3,467 26.45
Following is a summary of vested stock options and options expected to vest as of December 31, 2018:
Stock Options Stock OptionsStock Options Currently Vested and Outstanding Exercisable Expected to Vest
Number 42,600 42,600 42,600Weighted-average exercise price $3.00 $3.00 $3.00 Weighted-average remaining contractual term 1.20 years 1.20 years 1.20 years
Following is a summary of stock option transactions for the years ended December 31:
2018 2017Options to Weighted Options to WeightedPurchase Average Purchase Average
Shares Exercise Price Shares Exercise PriceOutstanding, beginning of year 68,600 $ 3.00 75,600 $ 3.00Granted - - - -Exercised (26,000) 3.00 (7,000) 3.00Forfeited - - - -Outstanding, end of year 42,600 3.00 68,600 3.00Exercisable, end of year 42,600 3.00 68,600 3.00
The total intrinsic value of options exercised during the year ended December 31, 2018 and 2017 was $585 thousand and $171 thousand, respectively. The aggregate intrinsic value of options exercisable as of December 31, 2018 was $746 thousand.
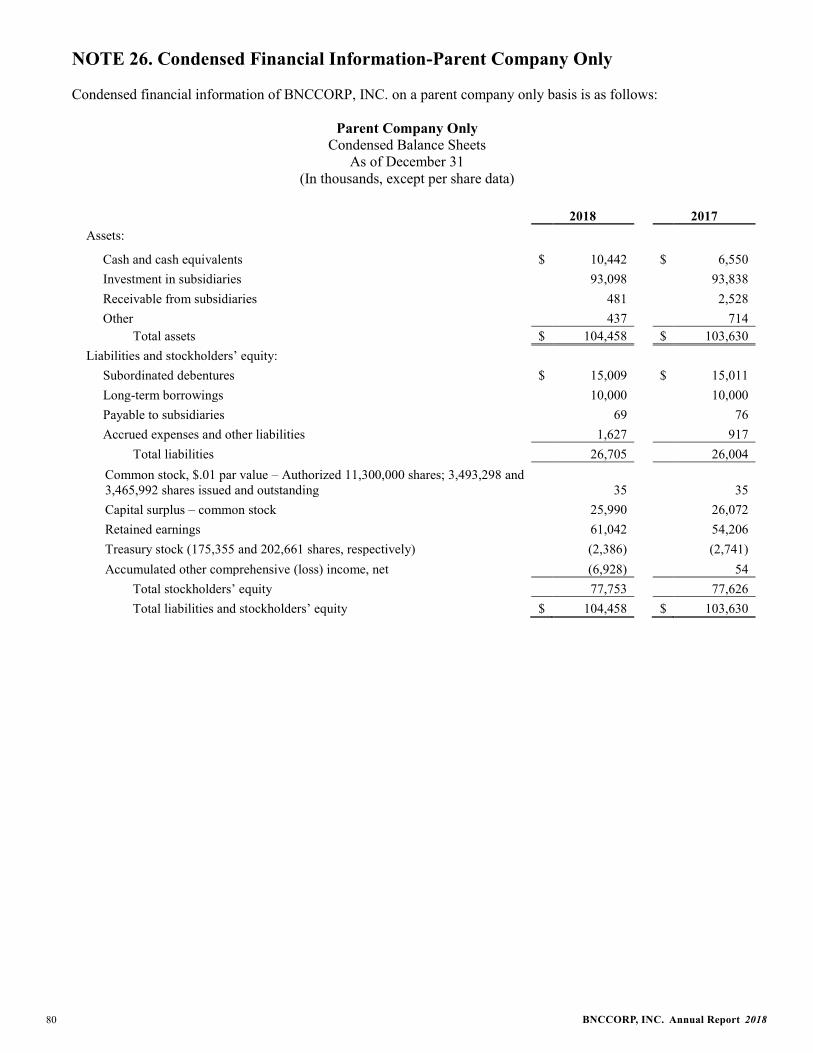
BNCCORP, INC. Annual Report 201880
NOTE 26. Condensed Financial Information-Parent Company Only
Condensed financial information of BNCCORP, INC. on a parent company only basis is as follows:
Parent Company OnlyCondensed Balance Sheets
As of December 31(In thousands, except per share data)
2018 2017Assets:
Cash and cash equivalents $ 10,442 $ 6,550Investment in subsidiaries 93,098 93,838Receivable from subsidiaries 481 2,528Other 437 714
Total assets $ 104,458 $ 103,630Liabilities and stockholders’ equity:
Subordinated debentures $ 15,009 $ 15,011Long-term borrowings 10,000 10,000Payable to subsidiaries 69 76Accrued expenses and other liabilities 1,627 917
Total liabilities 26,705 26,004Common stock, $.01 par value – Authorized 11,300,000 shares; 3,493,298 and 3,465,992 shares issued and outstanding 35 35Capital surplus – common stock 25,990 26,072Retained earnings 61,042 54,206Treasury stock (175,355 and 202,661 shares, respectively) (2,386) (2,741)Accumulated other comprehensive (loss) income, net (6,928) 54
Total stockholders’ equity 77,753 77,626 Total liabilities and stockholders’ equity $ 104,458 $ 103,630

81BNCCORP, INC. Annual Report 2018
Parent Company OnlyCondensed Statements of IncomeFor the Years Ended December 31
(In thousands)
2018 2017Income:
Management fee income $ 1,990 $ 2,075Interest 24 8Other 4 28
Total income 2,018 2,111Expenses:
Interest 1,195 1,038Salaries and benefits 1,345 1,388Legal and other professional 678 729Other 718 757
Total expenses 3,936 3,912Loss before income tax benefit and equity in earnings of subsidiaries (1,918) (1,801)Income tax benefit 476 649Loss before equity in earnings of subsidiaries (1,442) (1,152)Equity in earnings of subsidiaries 8,278 6,030
Net income $ 6,836 $ 4,878

BNCCORP, INC. Annual Report 201882
Parent Company OnlyCondensed Statements of Cash Flows
For the Years Ended December 31(In thousands)
2018 2017Operating activities:
Net income $ 6,836 $ 4,878Adjustments to reconcile net income to net cash provided by operating
activities - Equity in earnings of subsidiaries (8,278) (6,030) Dividend paid by subsidiaries 2,500 2,000 Share-based compensation 273 182 Change in other assets 2,325 1,199 Change in other liabilities 236 156 Net cash provided by operating activities 3,892 2,385Net increase in cash and cash equivalents 3,892 2,385Cash and cash equivalents, beginning of year 6,550 4,165Cash and cash equivalents, end of year $ 10,442 $ 6,550
Supplemental cash flow information:Interest paid $ 1,151 $ 1,019
Income taxes paid $ 990 $ 707

83BNCCORP, INC. Annual Report 2018
NOTE 27. Subsequent Events
The Company has evaluated subsequent events from December 31, 2018 through March 26, 2019, which is the date the consolidated financial statements were issued, and determined there are no other items to record or discloserelated to subsequent events.

BNCCORP, INC. Annual Report 201884
This page intentionally left blank.

85BNCCORP, INC. Annual Report 2018
This page intentionally left blank.

BNCCORP, INC. Annual Report 201886
This page intentionally left blank.

BNCCORP, INC. (BNCCORP or the Company) is a bank holding company registered under the Bank Holding Company Act of 1956 headquartered in Bismarck, North Dakota. It is the parent company of BNC National Bank (the Bank). The Company operates community banking and wealth management businesses in North Dakota, Arizona and Minnesota from 13 locations. BNC also conducts mortgage banking from 12 locations in Arizona, North Dakota, Illinois, Kansas, and Missouri.
CORPORATE DATAInvestor Relations
E-mail Inquiries: [email protected]
General Inquiries:BNCCORP, INC.322 East Main Avenue, Bismarck, North Dakota 58501Telephone (701) 250-3040 | Facsimile (701) 222-3653
Daniel J. CollinsChief Financial Officer612-305-2210
Timothy J. Franz President/CEO612-305-2213
Annual MeetingThe 2018 annual meeting of stockholders will be held on Wednesday, June 19, 2019 at 8:30 a.m. (Central Daylight Time) at BNC National Bank, Second Floor Conference Room, 322 East Main Avenue, Bismarck, ND 58501.
Independent Public AccountantsKPMG LLPSuite 1100 1000 Walnut StreetKansas City, MO 64106-2162
Securities ListingBNCCORP, INC.’s common stock is traded on the OTCQX Markets under the symbol: “BNCC.”
Common Stock PricesFor the Years Ended December 31,
2018(1) 2017(1)
High Low High LowFirst Quarter $31.00 $26.00 $27.25 $25.50Second Quarter $27.25 $25.41 $26.49 $25.30Third Quarter $28.10 $25.66 $27.70 $25.26Fourth Quarter $27.90 $19.20 $31.00 $26.90
(1) The quotes represent the high and low closing sales prices as reported by OTCQX Markets.
Stock Transfer Agent and RegistrarAmerican Stock Transfer & Trust Company, LLC 6201 15th AvenueBrooklyn, NY 11219(800) 937-5449
Corporate Broker D. A. Davidson Community Banking and Wealth Management Group1-800-288-2811 | [email protected]
Directors, BNCCORP, INC.Tracy Scott
Chairman of the Board andRetired Co-Founder of BNCCORP, INC.
Timothy J. FranzPresident andChief Executive Officer of BNCCORP, INC.
Nathan P. BrennaOwner, Brenna Farm and RanchFormer Attorney
Directors, BNC National BankDoug BrendelShawn ClevelandDaniel J. Collins Timothy J. Franz Dave Hoekstra Mark E. PeilerScott SpillmanCheryl A. Stanton
Gaylen GhylinRetired EVP, Secretary and CFO ofTiller Corporation d/b/a Barton Sand &Gravel Co., Commercial Asphalt Co. andBarton Enterprises, Inc.
Michael M. VekichCEO, Vekich Chartered
Tom RedmannRetired- Loan Manager, Bank of North Dakota
BNC National Bank Bank Branches – North Dakota:
Bismarck Main(2)
322 East Main AvenueBismarck, ND 58501
Bismarck South219 South 3rd StreetBismarck, ND 58504
Bismarck North(2)
801 East Century AvenueBismarck, ND 58503
Bismarck Sunrise(2)
3000 Yorktown DriveBismarck, ND 58503
Primrose Assisted Living Apartments1144 College DriveBismarck, ND 58501
Crosby206 South Main StreetCrosby, ND 58730
Bank Branches - ArizonaGlendale – Charter Address20175 North 67th AveGlendale, AZ 85308
Mortgage Banking Offices:Glendale6685 W. Beardsley Glendale, AZ 85383
Wichita8558 W 21st Street N Wichita, KS 67205
Wichita12031 East 13th Street Wichita, KS 67206
Andover1718 N Webb RoadAndover, KS 67206
(2) Bank branches offering mortgage banking services.
Garrison92 North MainGarrison, ND 58540 Linton104 North BroadwayLinton, ND 58552
Stanley210 South MainStanley, ND 58784
Watford City205 North MainWatford City, ND 58854
Mandan(2)
2711 Sunset Drive NWMandan, ND 58554
Bank Branches - MinnesotaGolden Valley650 North Douglas DriveGolden Valley, MN 55422
Overland Park7007 College BoulevardOverland Park, KS 66211
Moline800 36th AvenueMoline, IL 61265
Lebanon1403 West Elm StreetLebanon, Missouri 65336