Embed Size (px)
Citation preview
TURKEY
Publication Date: April 21, 2017 “Global Knowledge supported by Local Experience” Copyright © 2007 by JCR Eurasia Rating. 19 Mayıs Mah., 19 Mayıs Cad., Nova Baran Plaza No:4 Kat: 12 Şişli-İSTANBUL Telephone: +90.212.352.56.73 Fax: +90 (212) 352.56.75
Reproduction is prohibited except by permission. All rights reserved. All information has been obtained from sources JCR Eurasia Rating believes to be reliable. However, JCR
Eurasia Rating does not guarantee the truth, accuracy and adequacy of this information. JCR Eurasia Rating ratings are objective and independent opinions as to the creditworthiness
of a security and issuer and not to be considered a recommendation to buy, hold or sell any security or to issue a loan. This rating report has been composed within the methodologies
registered with and certified by the SPK (CMB-Capital Markets Board of Turkey), BDDK (BRSA-Banking Regulation and Supervision Agency) and internationally accepted rating
principles and guidelines but is not covered by NRSRO regulations. http://www.jcrer.com.tr
Corporate Credit Rating (Update)
Factoring
*Affirmed by Japan Credit Rating Agency, JCR on October 7, 2016
Analyst: Özgür Fuad ENGIN/+90 212 352 56 74
Long
Term
Short
Term
Inte
rnational
Foreign Currency BBB- A-3
Local Currency BBB- A-3
Outlook FC BBB- A-3
LC Stable Stable
Issue Rating n.a. n.a.
National Local Rating A- (Trk) A–1 (Trk)
Outlook Stable Stable
Issue Rating A- (Trk) A-1 (Trk)
Sponsor Support 2 -
Stand Alone B -
Sove
reig
n*
Foreign Currency BBB- -
Local Currency BBB- -
Outlook FC Stable -
LC Stable -
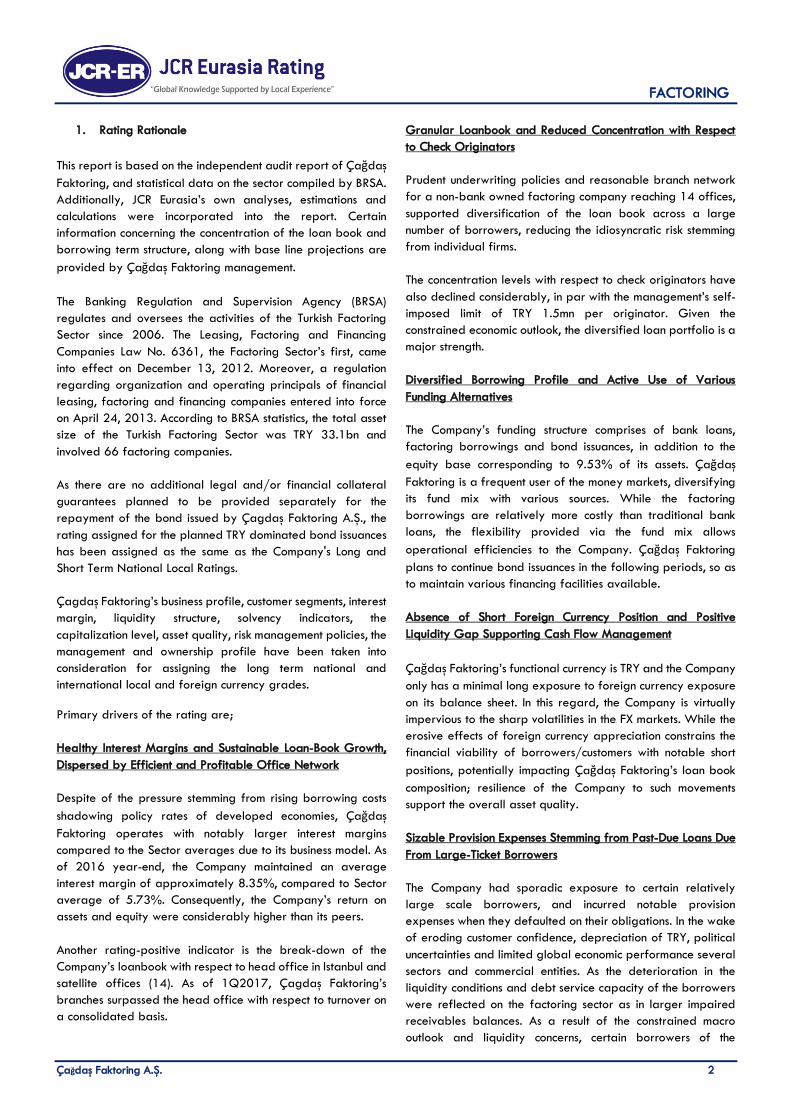
ÇAĞDAŞ FAKTORİNG A.Ş.
F i n a n c i a l D a t a 2016* 2015* 2014* 2013* 2012*
Total Assets (000 USD) 201,556 200,891 197,897 94,781 106,626
Total Assets (000 TRY) 711,854 584,110 458,904 201,921 189,538
Equity (000 TRY) 67,823 54,231 47,531 35,489 38,597
Net Profit (000 TRY) 12,706 13,426 14,407 3,657 2,079
Market Share (%)
(by asset size) 2.15 2.19 1.74 0.93 1.04
ROAA (%) 1.90 3.32 5.59 3.29 1.37
ROAE (%) 20.21 34.07 44.46 17.36 5.20
Equity/Assets (%) 9.53 9.28 10.36 17.58 20.36
NPL (%) 4.92 5.33 3.31 7.11 7.90
Growth Rate (%) 21.87 27.28 127.27 6.53 46.61
*Audited, Year-End
Overview
Çağdaş Faktoring A.Ş. (hereinafter referred to as Çağdaş Faktoring or the Company),
is one of the prominent non-bank owned factoring companies with its average market
share qualifying for the 2% bracket in the highly fragmented market. Founded in 1994,
the Company’s is among the first factoring companies in Turkey. Since 2006, the Turkish
Factoring Sector is regulated and supervised by the Banking Regulation and
Supervision Agency (BRSA).
The Company is owned by the Gülmezgil and Barokas Families, with 80% and 20%
respective shares and several projects to improve its corporate governance policies
and standards have been undertaken in the recent years.
Çağdaş Faktoring provides funding to its customer portfolio based in Turkey via
financing their invoiced/documented receivables. The Company is headquartered in
Istanbul and operates through 14 branches located in major cities. As of FYE2016, the
Company had 156 employees.
Strengths
• Sustainable loanbook and turnover growth, supported with healthy
interest margin
• Notable improvement in the borrower and check underwriter
concentration ratios, granulating the bulk loans and reducing
idiosyncratic credit risk
• Experienced and well-functioning management team with an
emphasis on adoption of corporate governance best practices &
efficient internal control mechanisms
• Favourable positive liquidity gap and absence of short foreign
currency exposure
Constraints
• Provision expenses stemming from sporadic impaired loans granted to
large-ticket size customers, a terminated practice looking forward
• Upward pressure on the borrowing rates, and preference to overweight
less risky hence lower margin customers on the profitability,
• Highly competitive and fragmented market structure,
• Persisting economic pressures and uncertainties pertaining to the
economic and political reform agenda
2.22.21.70.91.0
0.00
5.00
Market Share (%)
21.927.3
127.3
6.546.6
0
200
Growth Rate (%)
1.93.3
5.63.3
1.4
0.00
10.00
ROAA (%)
20.234.1
44.5
17.45.2
0
50
ROAE (%)
9.59.310.417.620.4
0
50
20162015201420132012
Equity/Assets (%) 4.95.3
3.3
7.17.9
0.00
10.00
20162015201420132012
NPL (%)
FACTORING
Çağdaş Faktoring A.Ş. 2
1. Rating Rationale
This report is based on the independent audit report of Çağdaş
Faktoring, and statistical data on the sector compiled by BRSA.
Additionally, JCR Eurasia’s own analyses, estimations and
calculations were incorporated into the report. Certain
information concerning the concentration of the loan book and
borrowing term structure, along with base line projections are
provided by Çağdaş Faktoring management.
The Banking Regulation and Supervision Agency (BRSA)
regulates and oversees the activities of the Turkish Factoring
Sector since 2006. The Leasing, Factoring and Financing
Companies Law No. 6361, the Factoring Sector’s first, came
into effect on December 13, 2012. Moreover, a regulation
regarding organization and operating principals of financial
leasing, factoring and financing companies entered into force
on April 24, 2013. According to BRSA statistics, the total asset
size of the Turkish Factoring Sector was TRY 33.1bn and
involved 66 factoring companies.
As there are no additional legal and/or financial collateral
guarantees planned to be provided separately for the
repayment of the bond issued by Çagdaş Faktoring A.Ş., the
rating assigned for the planned TRY dominated bond issuances
has been assigned as the same as the Company's Long and
Short Term National Local Ratings.
Çagdaş Faktoring’s business profile, customer segments, interest
margin, liquidity structure, solvency indicators, the
capitalization level, asset quality, risk management policies, the
management and ownership profile have been taken into
consideration for assigning the long term national and
international local and foreign currency grades.
Primary drivers of the rating are;
Healthy Interest Margins and Sustainable Loan-Book Growth,
Dispersed by Efficient and Profitable Office Network
Despite of the pressure stemming from rising borrowing costs
shadowing policy rates of developed economies, Çağdaş
Faktoring operates with notably larger interest margins
compared to the Sector averages due to its business model. As
of 2016 year-end, the Company maintained an average
interest margin of approximately 8.35%, compared to Sector
average of 5.73%. Consequently, the Company’s return on
assets and equity were considerably higher than its peers.
Another rating-positive indicator is the break-down of the
Company’s loanbook with respect to head office in Istanbul and
satellite offices (14). As of 1Q2017, Çagdaş Faktoring’s
branches surpassed the head office with respect to turnover on
a consolidated basis.
Granular Loanbook and Reduced Concentration with Respect
to Check Originators
Prudent underwriting policies and reasonable branch network
for a non-bank owned factoring company reaching 14 offices,
supported diversification of the loan book across a large
number of borrowers, reducing the idiosyncratic risk stemming
from individual firms.
The concentration levels with respect to check originators have
also declined considerably, in par with the management’s self-
imposed limit of TRY 1.5mn per originator. Given the
constrained economic outlook, the diversified loan portfolio is a
major strength.
Diversified Borrowing Profile and Active Use of Various
Funding Alternatives
The Company’s funding structure comprises of bank loans,
factoring borrowings and bond issuances, in addition to the
equity base corresponding to 9.53% of its assets. Çağdaş
Faktoring is a frequent user of the money markets, diversifying
its fund mix with various sources. While the factoring
borrowings are relatively more costly than traditional bank
loans, the flexibility provided via the fund mix allows
operational efficiencies to the Company. Çağdaş Faktoring
plans to continue bond issuances in the following periods, so as
to maintain various financing facilities available.
Absence of Short Foreign Currency Position and Positive
Liquidity Gap Supporting Cash Flow Management
Çağdaş Faktoring’s functional currency is TRY and the Company
only has a minimal long exposure to foreign currency exposure
on its balance sheet. In this regard, the Company is virtually
impervious to the sharp volatilities in the FX markets. While the
erosive effects of foreign currency appreciation constrains the
financial viability of borrowers/customers with notable short
positions, potentially impacting Çağdaş Faktoring’s loan book
composition; resilience of the Company to such movements
support the overall asset quality.
Sizable Provision Expenses Stemming from Past-Due Loans Due
From Large-Ticket Borrowers
The Company had sporadic exposure to certain relatively
large scale borrowers, and incurred notable provision
expenses when they defaulted on their obligations. In the wake
of eroding customer confidence, depreciation of TRY, political
uncertainties and limited global economic performance several
sectors and commercial entities. As the deterioration in the
liquidity conditions and debt service capacity of the borrowers
were reflected on the factoring sector as in larger impaired
receivables balances. As a result of the constrained macro
outlook and liquidity concerns, certain borrowers of the
FACTORING
Çağdaş Faktoring A.Ş. 3
Company defaulted on their obligations. Consequently, the NPL
ratios displayed an increase in 2016, after accounting for the
impaired loans written-off and transferred.
Sizable Leverage Level, Partly Offset by Retained Earnings
The Company has achieved CAGR of 40.66% in the last 5
years, boosting the need for external funding. The leverage
distribution of the Sector is not normally distributed due the
funding profile of several bank-owned and sporadic yet
sizable equity financed companies. On the other side, the
Company’s shareholders maintain a retention ratio of above
50% and systematically increase the paid-in capital via
internal funds, supporting the equity base to a certain extent.
The decision of management to increase paid-in capital to TRY
40mn in 2016 supports the owners’ view to support the
Company.
Constrained Global and Regional Economic Outlook with Persistent Uncertainties Related with the Monetary Policies of Developed Economies
Factoring sector is sensitive to the economic prospects and the
consumer confidence due to the fast-paced nature of the
business. Deterioration in inflation and current account deficit,
unrest in the Middle East, policy actions and developments
following the constitutional referendum in April 2017, possible
increases in the future cost of borrowing due to rate hikes by
the Federal Reserve, subsequent reduction of inflows into
emerging economies as well as rising levels of unemployment
and regional tensions are expected to lead to a slowdown in
economic growth throughout 2017. Pressurized economic
outlook and investment sentiment might limit growth.
Accounting for the aforementioned factors, affirmed Çağdaş
Faktoring’s Long Term National Grade as ‘A- (Trk)’. The
Company’s Long Term International Foreign and Currency
ratings are affirmed at the country ceiling, “BBB-”.
2. Outlook
JCR Eurasia Rating has affirmed the ‘Stable’ outlook on the
National Long Term Rating of Çağdaş Faktoring A.Ş. based on
the global projections and domestic macroeconomic
expectations of Turkey, normalizing yield curve spearheaded
by the US Fed, the Sector’s growth projections, financial
leverage of the Company and the corporate governance
structure. The outstanding and planned debt instruments
issuances are also evaluated in the determination of the
outlook.
JCR Eurasia Rating evaluated The Company’s International
Long and Short Term Local Currency Ratings in line with the
Long Term Sovereign Rating outlook of the Republic of Turkey.
Potential rating drivers for upward revision;
Further amelioration of profitability indicators particularly due
to healthy loanbook growth and wider interest margin
premium, solid asset quality, reduction in the financing costs and
robust economic growth in the domestic and international
markets are possible factors a positive rating outlook.
Potential rating drivers for negative revision; Continuous transfers to the non-performing loan accounts,
potential loss of flexibility in financing, deteriorating asset
quality and liquidity profile, concentration of the loan portfolio,
failure to achieve the pro-forma targets by a notable
discrepancy, decreasing investor appetite and growing turmoil
in the domestic and international markets, inability to preserve
interest margins are evaluated as potential factor necessitating
downward pressure on the outlook.
3. Sponsor Support & Stand Alone Assessment
The willingness and the capacity of the shareholders to provide
support to the Company in case of need is evaluated with
respect to the financial strength of the key shareholders, the
long track record of the Company, the historical profitability
performance and dividend payout & retention policy. In this
regard, the Sponsor Support Grade is affirmed as ‘2’ reflecting
an adequate financial and operational support by the
shareholders.
Çağdaş Faktoring’s ability to service its obligations and
commitments without resorting to external support is reflected
in its Stand Alone rating affirmed as ‘B’. This level underlines
the Company’s strong cash flows, internal resource generation
capacity, sizable interest margin and funding structure.
4. Company Profile
a) History & Activities
Founded in 1994, Çağdaş Faktoring is one of the first factoring
companies in Turkey, founded as Çağdaş Finans Faktoring
Hizmetleri A.Ş. in early 1994. It is renamed as Çağdaş
Faktoring in 2012. The Company’s capital base is supported
with internally generated revenues and earnings retained
within the Company.
Çağdaş Faktoring mainly provides recourse financing of
invoiced/documented receivables stemming from domestic
sales or services. The majority of the Company’s business is
generated in Istanbul, while its branch network is extending to
cover prominent cities in Turkey.
b) Organization & Employees
Çağdaş Faktoring is organized as a head office and branches
across country, reporting to the head office. The general
FACTORING
Çağdaş Faktoring A.Ş. 4
management of the Company is divided into core functions such
as Public Relations & Legal Affairs, Credit Risk Monitoring &
Financial Analysis, Fund Management, Financial Affairs,
Operations and Human Resources, Information Technologies,
Corporate Marketing and SME Marketing. In addition to these
executive functions and units, the Company has an Internal
Audit Department, reporting to the Board of Directors.
As of FYE2016, Cagdaş Faktoring had 14 branches in 10 cities,
including Istanbul, Ankara, Bursa, Izmir, Gaziantep, Samsun,
Adana, Antalya, Konya, Kocaeli. The Group’s physical network
growth plans account for macroeconomic outlook and focuses
on break-even profitability analysis.
The Board of Directors of Çağdaş Faktoring comprises 5
members, two of which are independent. The Company’s
general manager is a member as well, while the largest
shareholder Dikran GÜLMEZGİL chairs the Board. As of
December 2016, the Company employed 155.
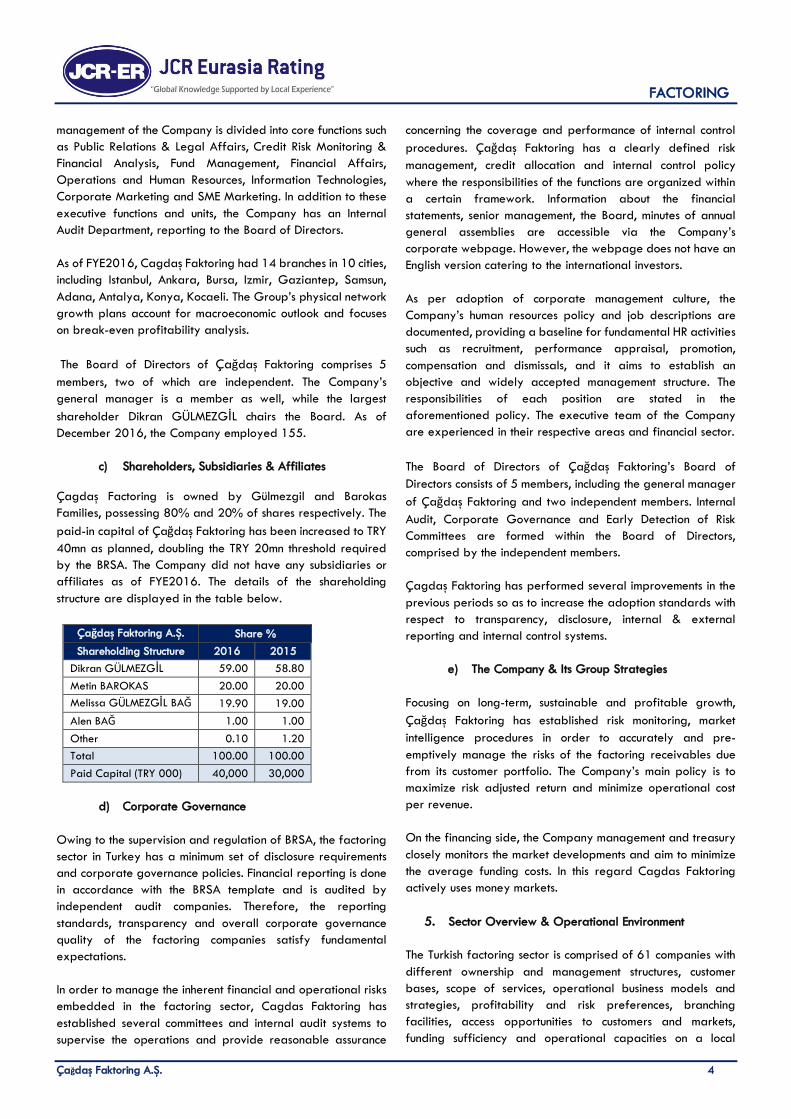
c) Shareholders, Subsidiaries & Affiliates
Çagdaş Factoring is owned by Gülmezgil and Barokas
Families, possessing 80% and 20% of shares respectively. The
paid-in capital of Çağdaş Faktoring has been increased to TRY
40mn as planned, doubling the TRY 20mn threshold required
by the BRSA. The Company did not have any subsidiaries or
affiliates as of FYE2016. The details of the shareholding
structure are displayed in the table below.
Çağdaş Faktoring A.Ş. Share %
Shareholding Structure 2016 2015
Dikran GÜLMEZGİL 59.00 58.80
Metin BAROKAS 20.00 20.00
Melissa GÜLMEZGİL BAĞ 19.90 19.00
Alen BAĞ 1.00 1.00
Other 0.10 1.20
Total 100.00 100.00
Paid Capital (TRY 000) 40,000 30,000
d) Corporate Governance
Owing to the supervision and regulation of BRSA, the factoring
sector in Turkey has a minimum set of disclosure requirements
and corporate governance policies. Financial reporting is done
in accordance with the BRSA template and is audited by
independent audit companies. Therefore, the reporting
standards, transparency and overall corporate governance
quality of the factoring companies satisfy fundamental
expectations.
In order to manage the inherent financial and operational risks
embedded in the factoring sector, Cagdas Faktoring has
established several committees and internal audit systems to
supervise the operations and provide reasonable assurance
concerning the coverage and performance of internal control
procedures. Çağdaş Faktoring has a clearly defined risk
management, credit allocation and internal control policy
where the responsibilities of the functions are organized within
a certain framework. Information about the financial
statements, senior management, the Board, minutes of annual
general assemblies are accessible via the Company’s
corporate webpage. However, the webpage does not have an
English version catering to the international investors.
As per adoption of corporate management culture, the
Company’s human resources policy and job descriptions are
documented, providing a baseline for fundamental HR activities
such as recruitment, performance appraisal, promotion,
compensation and dismissals, and it aims to establish an
objective and widely accepted management structure. The
responsibilities of each position are stated in the
aforementioned policy. The executive team of the Company
are experienced in their respective areas and financial sector.
The Board of Directors of Çağdaş Faktoring’s Board of
Directors consists of 5 members, including the general manager
of Çağdaş Faktoring and two independent members. Internal
Audit, Corporate Governance and Early Detection of Risk
Committees are formed within the Board of Directors,
comprised by the independent members.
Çagdaş Faktoring has performed several improvements in the
previous periods so as to increase the adoption standards with
respect to transparency, disclosure, internal & external
reporting and internal control systems.
e) The Company & Its Group Strategies
Focusing on long-term, sustainable and profitable growth,
Çağdaş Faktoring has established risk monitoring, market
intelligence procedures in order to accurately and pre-
emptively manage the risks of the factoring receivables due
from its customer portfolio. The Company’s main policy is to
maximize risk adjusted return and minimize operational cost
per revenue.
On the financing side, the Company management and treasury
closely monitors the market developments and aim to minimize
the average funding costs. In this regard Cagdas Faktoring
actively uses money markets.
5. Sector Overview & Operational Environment
The Turkish factoring sector is comprised of 61 companies with
different ownership and management structures, customer
bases, scope of services, operational business models and
strategies, profitability and risk preferences, branching
facilities, access opportunities to customers and markets,
funding sufficiency and operational capacities on a local
FACTORING
Çağdaş Faktoring A.Ş. 5
and/or international scale. As of FYE2016, the sector reached
a total asset size of TRY 33bn and an equity of TRY 5bn.
Providing guarantees, financing and collection services faster
than banks in return for the assignment of spot and deferred
receivables arising from the sale of products and services
domestically and overseas, the sector continued its
institutionalization, branching and extension of customer base
activities in 2016. However, a significant number of companies
operating in the sector do not possess the necessary capabilities
to provide ‘collection’ services and export factoring. The
certification of part of the assignment claims via post-dated
checks has transformed the business model of some factoring
companies into one which is predominantly occupied with the
discount of small volume checks.
The practice of selling non-performing receivables to asset
management companies is increasingly utilized by factoring
companies in a similar fashion to that of banks. The Factoring
Sector displays a higher level of sensitivity to changes in
economic conjecture in comparison to banks, while regulatory
pressures from the Banking Regulation and Supervision Agency
(BRSA) continues to create difficulties in management policies
across the sector.
Demand for Factoring Sector services result from the
predominance of Small and Medium Sized Enterprises (SME) in
production activities. The sector mainly concentrates on
transportation, energy, textile, main metal and machinery
industries. Although the energy sector, covering nuclear fuel,
petroleum and coal products, dominated the factoring sector in
2015, the energy sector’s share fell to second place and
transportation sector took the pole position in 2016.
Although the non-performing loans, collections and diminishing
returns created a handicap for Factoring Sector, agile and
fast-responsive structure of factoring companies is expected
them to adapt to the current conjuncture. Growth in both
customer numbers and operational volume is expected to
continue at an increased pace in 2017.
A significant number of factoring companies operate as
subsidiaries of banks or bank affiliated firms. The principal
feature of such factoring companies is their ability to carry out
operations with lower equity, higher external resources, access
to large loans and customers, large asset levels and possession
of risks with lower profile and lower levels of profitability. On
the other hand, non-bank subsidiary factoring companies are
characterized by low asset and high NPL levels, high interest
margins, low external financing and high equity and
profitability levels along with narrow opportunities for access
to loans and customers.
The establishment and working conditions of factoring
companies are regulated by the BRSA and are organized
under the Financial Institutions Union. The employment of
managers with good education and sufficient vocational
experience, establishment of sound information systems and the
identification and evaluation of risks remain legal requirements
of the sector. Following the adoption of a centralized billing
system, the duplicate assignment of receivables arising from the
sale of products and services have been prevented and thus
transparency increased. A law introducing the establishment of
a Centralized Billing Recording System under the ‘Financial
Institutions Union’ and enhanced opportunities to gather data
from the Risk Center under the Turkish Banking Union is
expected to improve the sector’s ability to access higher quality
data, contributing to its asset quality.
In line with the undertaken reforms, the sector’s legal
infrastructure has been improved with regards to effective
surveillance and control. As such, the mandatory installation of
information, risk measurement and internal control systems
made a positive contribution to the improvement of the sector’s
institutional set-up, and the quality, standardization and
transparency of financial reporting practices and facilitated
fair competition. Greater progress than the current
achievements regarding the sector’s effectiveness and
standardization will be in line with the performance expected
from the ‘Financial Institutions Union’.
The Turkish bond market has provided Turkish factoring
companies with opportunities to diversify their funding streams
since 2010. However, the principal sources of funding for non-
banking financial institutions are external and are provided
through the Turkish Banking System, while the trend to access
funds from capital markets via debt instruments remains rather
weak.
Turkey is currently ranked 13th in the world and 8th in Europe in
terms of the size of its factoring sector. Turkey is also ranked
2nd on a global basis in export factoring transactions after
China. The shareholder structure and management teams of
factoring companies are subject to rapid changes due to a
comparatively large market entry and exits derived from the
intensely competitive environment in which they operate.
The Factoring Sector exhibits one of the highest levels of
vulnerability to fluctuations in macroeconomic circumstances and
instability. Management policies in the sector become more
difficult mainly due to changes in economic conjuncture and
regulatory pressures from the BRSA.
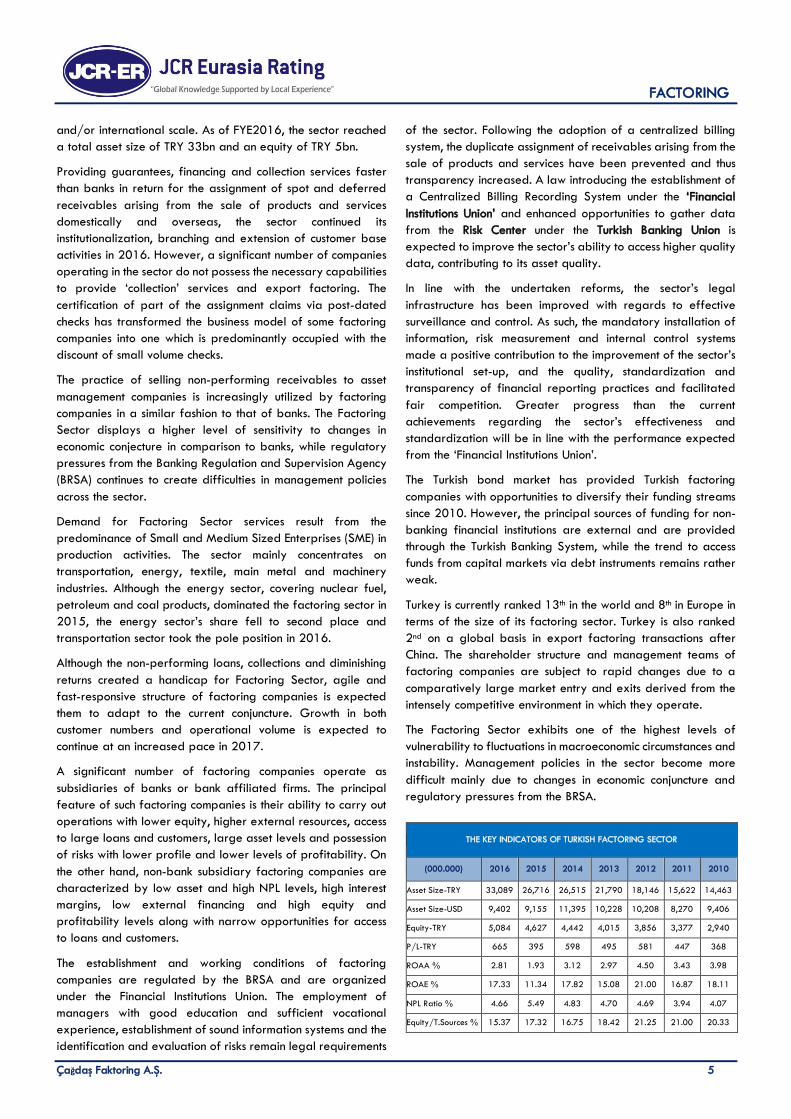
THE KEY INDICATORS OF TURKISH FACTORING SECTOR
(000.000) 2016 2015 2014 2013 2012 2011 2010
Asset Size-TRY 33,089 26,716 26,515 21,790 18,146 15,622 14,463
Asset Size-USD 9,402 9,155 11,395 10,228 10,208 8,270 9,406
Equity-TRY 5,084 4,627 4,442 4,015 3,856 3,377 2,940
P/L-TRY 665 395 598 495 581 447 368
ROAA % 2.81 1.93 3.12 2.97 4.50 3.43 3.98
ROAE % 17.33 11.34 17.82 15.08 21.00 16.87 18.11
NPL Ratio % 4.66 5.49 4.83 4.70 4.69 3.94 4.07
Equity/T.Sources % 15.37 17.32 16.75 18.42 21.25 21.00 20.33
FACTORING
Çağdaş Faktoring A.Ş. 6
The Factoring Sector has a relatively low free floating rate and
enjoys a small share across the wider Turkish financial services
sector. 60 of the companies are located in Istanbul while only
1 is based in the capital, Ankara.
Funds obtained by the Factoring Sector largely belong to
companies that are subsidiaries of banks or ones that have
banks among the wider group, making it more difficult for non-
bank affiliated factoring companies to carry out their
intermediary function.
As of FYE2016, the total asset size of Turkish factoring
companies was TRY 33,089mn, with an equity of TRY 5,084mn.
Throughout its 27-year history, the Turkish Factoring Sector has
maintained a consistent growth trend with the exception of
1994 and 2001 during which the sector underwent contractions
of 10.31% and 40.23%, respectively. Between 2006 and
2016, the Factoring Sector exhibited a cumulative growth rate
of 524.3%. The growth rate for the last financial year was
23.85%.
Factoring receivables constitute the largest item among the
sector’s assets with a share of 94.64%, whilst loans enjoyed the
largest share among its resources with a 71.03% share. The
sector primarily utilizes short-term bank loans in order to meet
its funding requirements and its inability to diversify its resource
base remains an inherent feature of the sector. However, bond
issues began to slowly gather momentum since 2008 and
accelerated in 2012, but experienced a slowdown in 2016. As
a result, bond issuances comprised 10.27% of the sector’s total
resources in 2016. The share of equity among total resources
of the sector stood at 15.37% and displayed a downward
trend within total liabilities. In line with the new regulations,
factoring companies are obliged to have a standard ratio
which dictates that the share of equity to total assets shall not
fall below 3%.
In 2016, the risk concentration of factoring companies primarily
focused on the manufacturing industry with a share of 47.33%,
the largest sectors being nuclear fuel, oil and coal products,
textile and textile products, metal industry, processed material
products and transportation vehicles. Across the services sector,
the largest levels of concentration were observed in the sectors
of wholesale and retail trade, motor vehicle services,
construction, logistics, storage and communications.
The sector’s non-performing receivables to total receivables
ratio decreased from 5.49% in 2015 to 4.66% in 2016.
However, speculation in the market exists regarding the level
of additional non-performing receivables that have not yet
been recorded to the balance sheets of the sector. The ratio of
non-performing receivables to equity of the sector declined to
29.92% from 31.5% in 2016. Provisions made regarding the
non-performing receivables increased from 80.46% in 2015 to
85.36% in 2016.
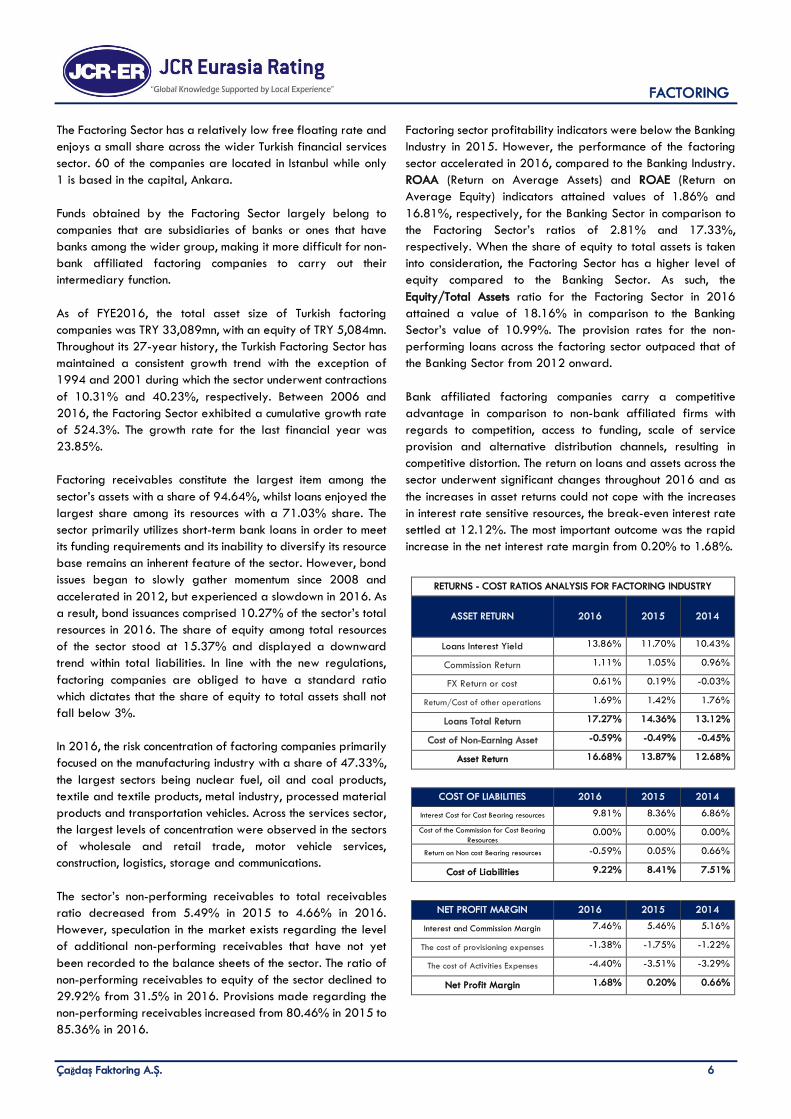
Factoring sector profitability indicators were below the Banking
Industry in 2015. However, the performance of the factoring
sector accelerated in 2016, compared to the Banking Industry.
ROAA (Return on Average Assets) and ROAE (Return on
Average Equity) indicators attained values of 1.86% and
16.81%, respectively, for the Banking Sector in comparison to
the Factoring Sector’s ratios of 2.81% and 17.33%,
respectively. When the share of equity to total assets is taken
into consideration, the Factoring Sector has a higher level of
equity compared to the Banking Sector. As such, the
Equity/Total Assets ratio for the Factoring Sector in 2016
attained a value of 18.16% in comparison to the Banking
Sector’s value of 10.99%. The provision rates for the non-
performing loans across the factoring sector outpaced that of
the Banking Sector from 2012 onward.
Bank affiliated factoring companies carry a competitive
advantage in comparison to non-bank affiliated firms with
regards to competition, access to funding, scale of service
provision and alternative distribution channels, resulting in
competitive distortion. The return on loans and assets across the
sector underwent significant changes throughout 2016 and as
the increases in asset returns could not cope with the increases
in interest rate sensitive resources, the break-even interest rate
settled at 12.12%. The most important outcome was the rapid
increase in the net interest rate margin from 0.20% to 1.68%.
RETURNS - COST RATIOS ANALYSIS FOR FACTORING INDUSTRY
ASSET RETURN 2016 2015 2014
Loans Interest Yield 13.86% 11.70% 10.43%
Commission Return 1.11% 1.05% 0.96%
FX Return or cost 0.61% 0.19% -0.03%
Return/Cost of other operations 1.69% 1.42% 1.76%
Loans Total Return 17.27% 14.36% 13.12%
Cost of Non-Earning Asset -0.59% -0.49% -0.45%
Asset Return 16.68% 13.87% 12.68%
COST OF LIABILITIES 2016 2015 2014
Interest Cost for Cost Bearing resources 9.81% 8.36% 6.86%
Cost of the Commission for Cost Bearing
Resources 0.00% 0.00% 0.00%
Return on Non cost Bearing resources -0.59% 0.05% 0.66%
Cost of Liabilities 9.22% 8.41% 7.51%
NET PROFIT MARGIN 2016 2015 2014
Interest and Commission Margin 7.46% 5.46% 5.16%
The cost of provisioning expenses -1.38% -1.75% -1.22%
The cost of Activities Expenses -4.40% -3.51% -3.29%
Net Profit Margin 1.68% 0.20% 0.66%
FACTORING
Çağdaş Faktoring A.Ş. 7
Break-evens 2016 2015 2014
Break-even point in Terms of
Interest 12.12% 12.87% 12.03%
Break-even point in Terms of
Loan size-TRY 25,264.54 25,275.78 21,513.82
Growth of the factoring sector in 2017 will be strictly related
with macroeconomic conjuncture, new regulations, technological
advances, better collection services, and the success in export
factoring subsector. In particular, the ‘decline in transaction
costs of investment environment’ and ‘removal of unparalleled
practices between different financial institutions’ will positively
affect the performance of the sector.
6. Financial Foundation
a) Financial Indicators & Performance
• Indices Relating to Size
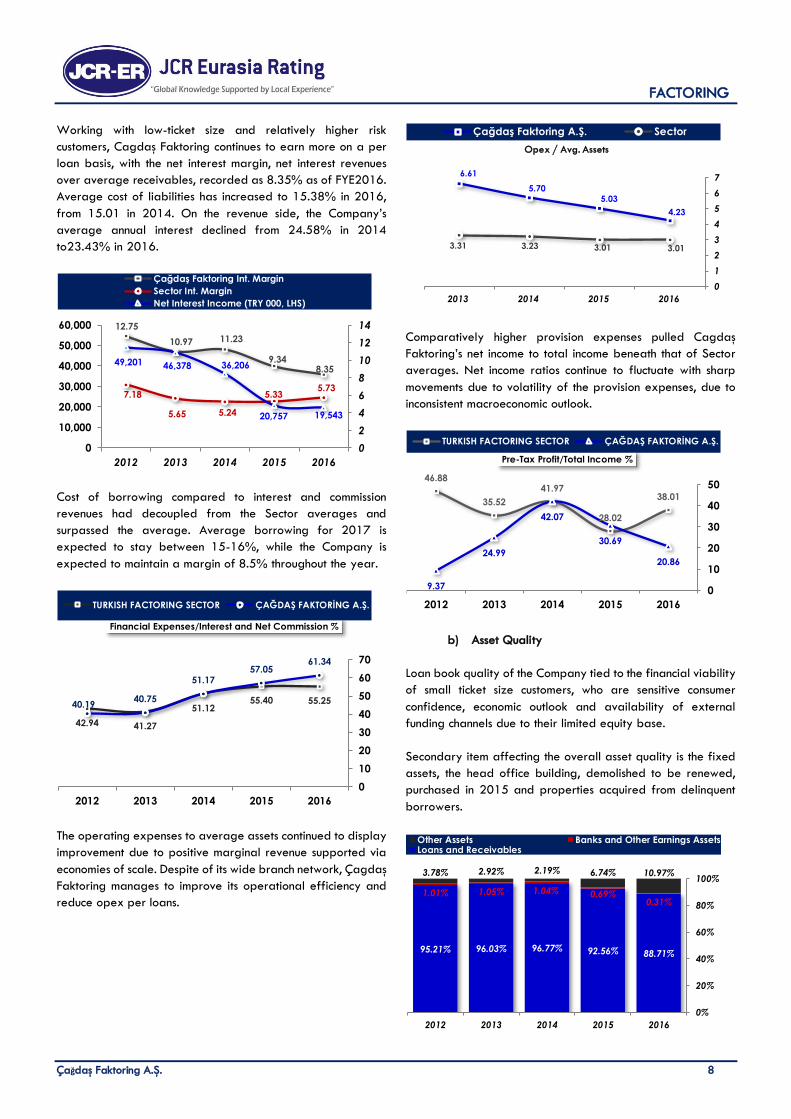
The Company’s asset (21.87%) and loan book (17.33%)
growth was lower compared to the Sector average in 2016,
even though the average growth is still in excess of the Sector.
Loan book developments in 2016 were slightly better than the
forecasts in the previous year. The main driver of the asset
growth in the sector and for the Company however, was the
increase in the average loan maturity, from 103 to 116 for
Cagdas Factoring.
In a hi storical persective, Çağdaş Faktoring posted a CAGR of
40.66%, compared to Sector CAGR of 16.20%. Deceleration
of growth is partly due to the constrained macro outlook,
evidenced by slowing downs Sector growth and leading
industry indicators.
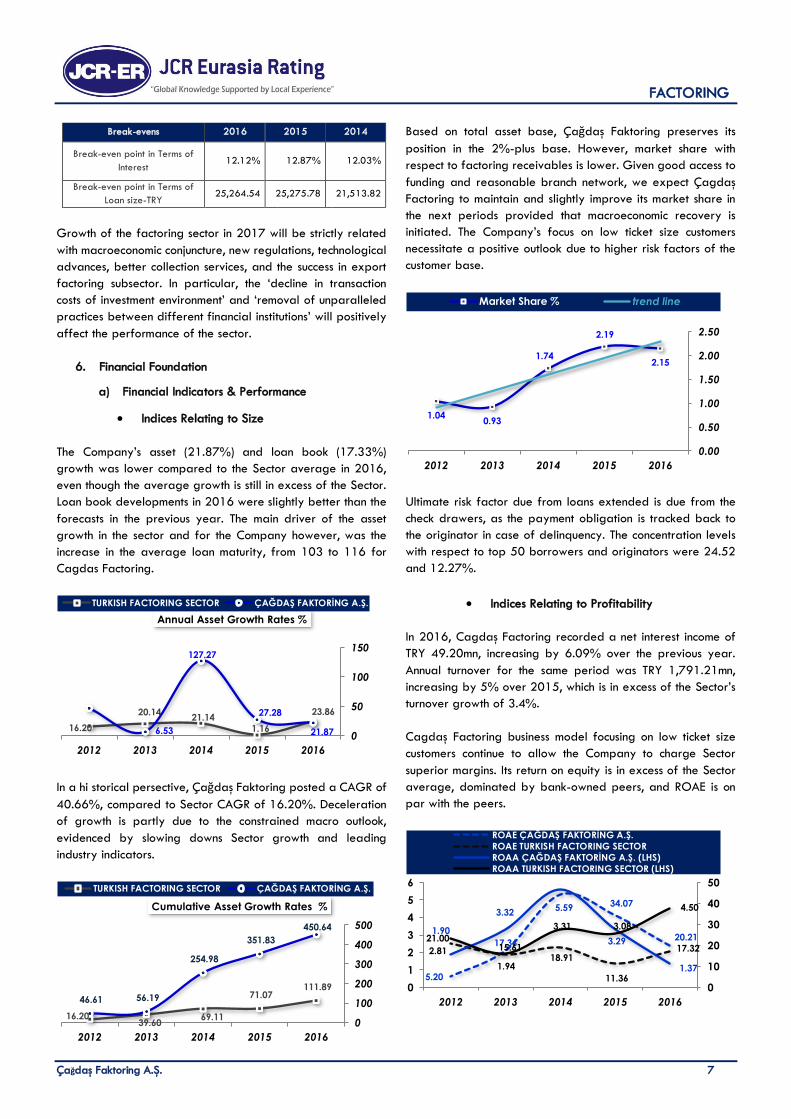
Based on total asset base, Çağdaş Faktoring preserves its
position in the 2%-plus base. However, market share with
respect to factoring receivables is lower. Given good access to
funding and reasonable branch network, we expect Çagdaş
Factoring to maintain and slightly improve its market share in
the next periods provided that macroeconomic recovery is
initiated. The Company’s focus on low ticket size customers
necessitate a positive outlook due to higher risk factors of the
customer base.
Ultimate risk factor due from loans extended is due from the
check drawers, as the payment obligation is tracked back to
the originator in case of delinquency. The concentration levels
with respect to top 50 borrowers and originators were 24.52
and 12.27%.
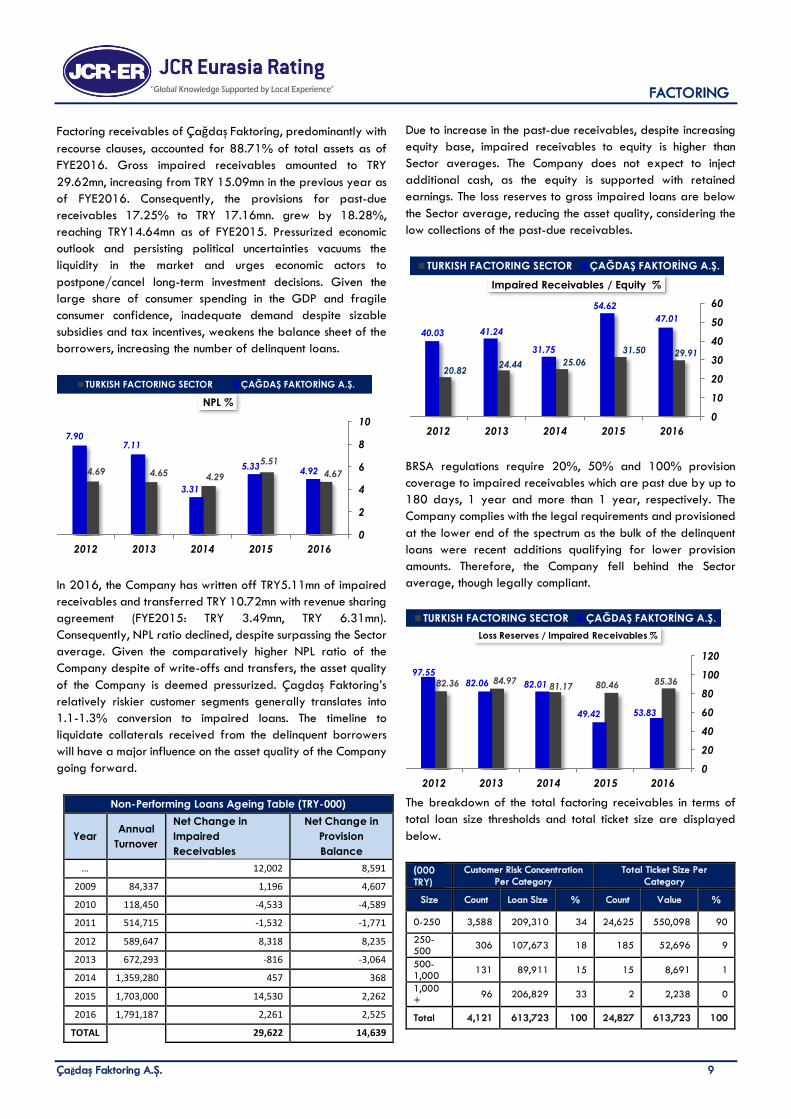
• Indices Relating to Profitability
In 2016, Cagdaş Factoring recorded a net interest income of
TRY 49.20mn, increasing by 6.09% over the previous year.
Annual turnover for the same period was TRY 1,791.21mn,
increasing by 5% over 2015, which is in excess of the Sector’s
turnover growth of 3.4%.
Cagdaş Factoring business model focusing on low ticket size
customers continue to allow the Company to charge Sector
superior margins. Its return on equity is in excess of the Sector
average, dominated by bank-owned peers, and ROAE is on
par with the peers.
23.86
1.16
21.14 20.14
16.20 21.87
27.28
127.27
6.530
50
100
150
20162015201420132012
Annual Asset Growth Rates %
TURKISH FACTORING SECTOR ÇAĞDAŞ FAKTORİNG A.Ş.
111.89 71.07
69.11 39.60
16.20
450.64
351.83
254.98
56.19 46.61
0
100
200
300
400
500
20162015201420132012
Cumulative Asset Growth Rates %
TURKISH FACTORING SECTOR ÇAĞDAŞ FAKTORİNG A.Ş.
2.15
2.19
1.74
0.931.04
0.00
0.50
1.00
1.50
2.00
2.50
20162015201420132012
Market Share % trend line
20.21
34.07
44.46
17.36
5.20
17.32
11.36
18.9115.61
21.001.90
3.325.59
3.29
1.37
2.81
1.94
3.31 3.08
4.50
0
1
2
3
4
5
6
0
10
20
30
40
50
20162015201420132012
ROAE ÇAĞDAŞ FAKTORİNG A.Ş.
ROAE TURKISH FACTORING SECTOR
ROAA ÇAĞDAŞ FAKTORİNG A.Ş. (LHS)
ROAA TURKISH FACTORING SECTOR (LHS)
FACTORING
Çağdaş Faktoring A.Ş. 8
Working with low-ticket size and relatively higher risk
customers, Cagdaş Faktoring continues to earn more on a per
loan basis, with the net interest margin, net interest revenues
over average receivables, recorded as 8.35% as of FYE2016.
Average cost of liabilities has increased to 15.38% in 2016,
from 15.01 in 2014. On the revenue side, the Company’s
average annual interest declined from 24.58% in 2014
to23.43% in 2016.
Cost of borrowing compared to interest and commission
revenues had decoupled from the Sector averages and
surpassed the average. Average borrowing for 2017 is
expected to stay between 15-16%, while the Company is
expected to maintain a margin of 8.5% throughout the year.
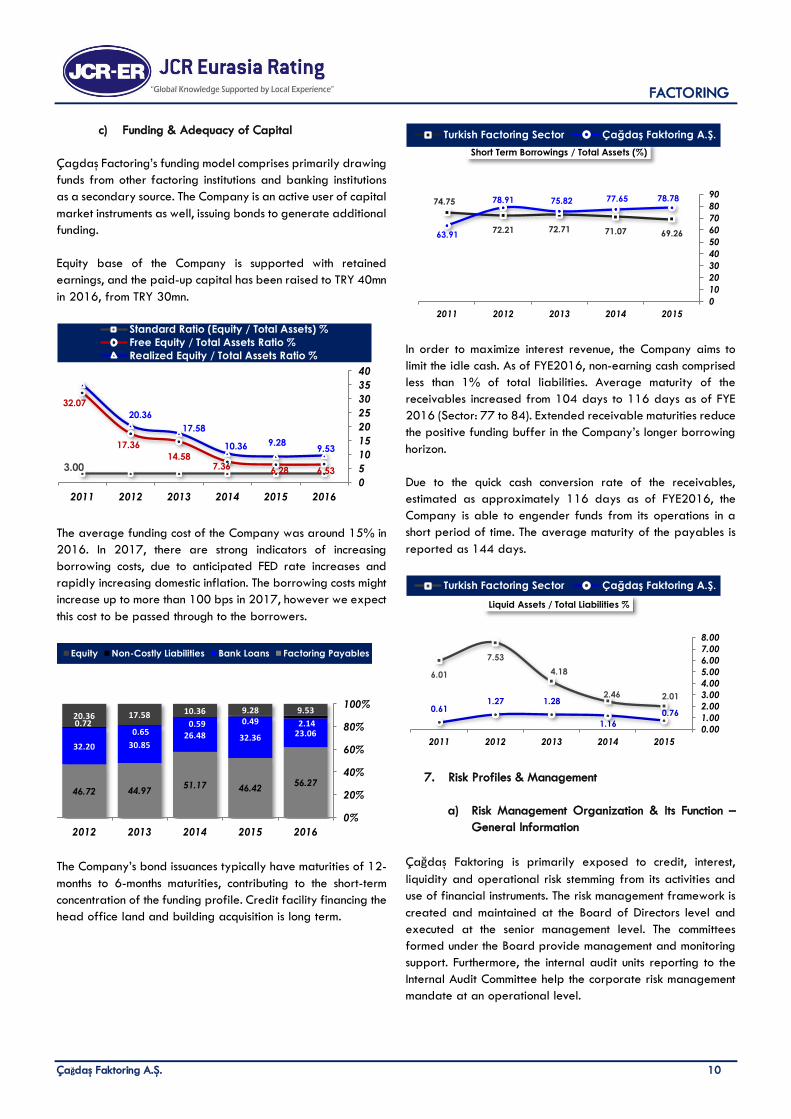
The operating expenses to average assets continued to display
improvement due to positive marginal revenue supported via
economies of scale. Despite of its wide branch network, Çagdaş
Faktoring manages to improve its operational efficiency and
reduce opex per loans.
Comparatively higher provision expenses pulled Cagdaş
Faktoring’s net income to total income beneath that of Sector
averages. Net income ratios continue to fluctuate with sharp
movements due to volatility of the provision expenses, due to
inconsistent macroeconomic outlook.
b) Asset Quality
Loan book quality of the Company tied to the financial viability
of small ticket size customers, who are sensitive consumer
confidence, economic outlook and availability of external
funding channels due to their limited equity base.
Secondary item affecting the overall asset quality is the fixed
assets, the head office building, demolished to be renewed,
purchased in 2015 and properties acquired from delinquent
borrowers.
8.359.34
11.2310.97
12.75
5.735.33
5.245.65
7.18
49,201 46,378 36,206
20,757 19,543
0
10,000
20,000
30,000
40,000
50,000
60,000
0
2
4
6
8
10
12
14
20162015201420132012
Çağdaş Faktoring Int. Margin
Sector Int. Margin
Net Interest Income (TRY 000, LHS)
55.2555.4051.12
41.2742.94
61.3457.05
51.17
40.7540.19
0
10
20
30
40
50
60
70
20162015201420132012
Financial Expenses/Interest and Net Commission %
TURKISH FACTORING SECTOR ÇAĞDAŞ FAKTORİNG A.Ş.
4.23
5.03
5.70
6.61
3.013.013.233.31
0
1
2
3
4
5
6
7
2016201520142013
Opex / Avg. Assets
Çağdaş Faktoring A.Ş. Sector
38.01
28.02
41.97
35.52
46.88
20.86
30.69
42.07
24.99
9.37 0
10
20
30
40
50
20162015201420132012
Pre-Tax Profit/Total Income %
TURKISH FACTORING SECTOR ÇAĞDAŞ FAKTORİNG A.Ş.
88.71%92.56%96.77%96.03%95.21%
0.31%0.69%1.04%1.05%1.01%
10.97%6.74%2.19%2.92%3.78%
0%
20%
40%
60%
80%
100%
20162015201420132012
Other Assets Banks and Other Earnings AssetsLoans and Receivables
FACTORING
Çağdaş Faktoring A.Ş. 9
Factoring receivables of Çağdaş Faktoring, predominantly with
recourse clauses, accounted for 88.71% of total assets as of
FYE2016. Gross impaired receivables amounted to TRY
29.62mn, increasing from TRY 15.09mn in the previous year as
of FYE2016. Consequently, the provisions for past-due
receivables 17.25% to TRY 17.16mn. grew by 18.28%,
reaching TRY14.64mn as of FYE2015. Pressurized economic
outlook and persisting political uncertainties vacuums the
liquidity in the market and urges economic actors to
postpone/cancel long-term investment decisions. Given the
large share of consumer spending in the GDP and fragile
consumer confidence, inadequate demand despite sizable
subsidies and tax incentives, weakens the balance sheet of the
borrowers, increasing the number of delinquent loans.
In 2016, the Company has written off TRY5.11mn of impaired
receivables and transferred TRY 10.72mn with revenue sharing
agreement (FYE2015: TRY 3.49mn, TRY 6.31mn).
Consequently, NPL ratio declined, despite surpassing the Sector
average. Given the comparatively higher NPL ratio of the
Company despite of write-offs and transfers, the asset quality
of the Company is deemed pressurized. Çagdaş Faktoring’s
relatively riskier customer segments generally translates into
1.1-1.3% conversion to impaired loans. The timeline to
liquidate collaterals received from the delinquent borrowers
will have a major influence on the asset quality of the Company
going forward.
Non-Performing Loans Ageing Table (TRY-000)
Year Annual
Turnover
Net Change in
Impaired
Receivables
Net Change in
Provision
Balance
… 12,002 8,591
2009 84,337 1,196 4,607
2010 118,450 -4,533 -4,589
2011 514,715 -1,532 -1,771
2012 589,647 8,318 8,235
2013 672,293 -816 -3,064
2014 1,359,280 457 368
2015 1,703,000 14,530 2,262
2016 1,791,187 2,261 2,525
TOTAL 29,622 14,639
Due to increase in the past-due receivables, despite increasing
equity base, impaired receivables to equity is higher than
Sector averages. The Company does not expect to inject
additional cash, as the equity is supported with retained
earnings. The loss reserves to gross impaired loans are below
the Sector average, reducing the asset quality, considering the
low collections of the past-due receivables.
BRSA regulations require 20%, 50% and 100% provision
coverage to impaired receivables which are past due by up to
180 days, 1 year and more than 1 year, respectively. The
Company complies with the legal requirements and provisioned
at the lower end of the spectrum as the bulk of the delinquent
loans were recent additions qualifying for lower provision
amounts. Therefore, the Company fell behind the Sector
average, though legally compliant.
The breakdown of the total factoring receivables in terms of
total loan size thresholds and total ticket size are displayed
below.
(000
TRY) Customer Risk Concentration
Per Category
Total Ticket Size Per
Category
Size Count Loan Size % Count Value %
0-250 3,588 209,310 34 24,625 550,098 90
250-500
306 107,673 18 185 52,696 9
500-1,000
131 89,911 15 15 8,691 1
1,000
+ 96 206,829 33 2 2,238 0
Total 4,121 613,723 100 24,827 613,723 100
4.67
5.51
4.29 4.65 4.69 4.92 5.33
3.31
7.11 7.90
0
2
4
6
8
10
20162015201420132012
NPL %
TURKISH FACTORING SECTOR ÇAĞDAŞ FAKTORİNG A.Ş.
29.91 31.50
25.06 24.44 20.82
47.01
54.62
31.75
41.24 40.03
0
10
20
30
40
50
60
20162015201420132012
Impaired Receivables / Equity %
TURKISH FACTORING SECTOR ÇAĞDAŞ FAKTORİNG A.Ş.
85.36 80.46 81.17 84.97 82.36
53.83 49.42
82.01 82.06 97.55
0
20
40
60
80
100
120
20162015201420132012
Loss Reserves / Impaired Receivables %
TURKISH FACTORING SECTOR ÇAĞDAŞ FAKTORİNG A.Ş.
FACTORING
Çağdaş Faktoring A.Ş. 10
c) Funding & Adequacy of Capital
Çagdaş Factoring’s funding model comprises primarily drawing
funds from other factoring institutions and banking institutions
as a secondary source. The Company is an active user of capital
market instruments as well, issuing bonds to generate additional
funding.
Equity base of the Company is supported with retained
earnings, and the paid-up capital has been raised to TRY 40mn
in 2016, from TRY 30mn.
The average funding cost of the Company was around 15% in
2016. In 2017, there are strong indicators of increasing
borrowing costs, due to anticipated FED rate increases and
rapidly increasing domestic inflation. The borrowing costs might
increase up to more than 100 bps in 2017, however we expect
this cost to be passed through to the borrowers.
The Company’s bond issuances typically have maturities of 12-
months to 6-months maturities, contributing to the short-term
concentration of the funding profile. Credit facility financing the
head office land and building acquisition is long term.
In order to maximize interest revenue, the Company aims to
limit the idle cash. As of FYE2016, non-earning cash comprised
less than 1% of total liabilities. Average maturity of the
receivables increased from 104 days to 116 days as of FYE
2016 (Sector: 77 to 84). Extended receivable maturities reduce
the positive funding buffer in the Company’s longer borrowing
horizon.
Due to the quick cash conversion rate of the receivables,
estimated as approximately 116 days as of FYE2016, the
Company is able to engender funds from its operations in a
short period of time. The average maturity of the payables is
reported as 144 days.
7. Risk Profiles & Management
a) Risk Management Organization & Its Function –
General Information
Çağdaş Faktoring is primarily exposed to credit, interest,
liquidity and operational risk stemming from its activities and
use of financial instruments. The risk management framework is
created and maintained at the Board of Directors level and
executed at the senior management level. The committees
formed under the Board provide management and monitoring
support. Furthermore, the internal audit units reporting to the
Internal Audit Committee help the corporate risk management
mandate at an operational level.
3.00 6.536.287.3614.58
17.36
32.07
9.53 9.28 10.36
17.58
20.36
35.07
0
5
10
15
20
25
30
35
40
201620152014201320122011
Standard Ratio (Equity / Total Assets) %
Free Equity / Total Assets Ratio %
Realized Equity / Total Assets Ratio %
56.2746.4251.17
44.9746.72
23.0632.3626.4830.8532.20
2.140.490.590.65
0.72
9.539.2810.3617.5820.36
0%
20%
40%
60%
80%
100%
20162015201420132012
Equity Non-Costly Liabilities Bank Loans Factoring Payables
69.2671.0772.7172.21
74.75 78.7877.6575.8278.91
63.91
0
10
20
30
40
50
60
70
80
90
20152014201320122011
Short Term Borrowings / Total Assets (%)
Turkish Factoring Sector Çağdaş Faktoring A.Ş.
2.012.46
4.18
7.53
6.01
0.76
1.16
1.281.270.61
0.00
1.00
2.00
3.00
4.00
5.00
6.00
7.00
8.00
20152014201320122011
Liquid Assets / Total Liabilities %
Turkish Factoring Sector Çağdaş Faktoring A.Ş.
FACTORING
Çağdaş Faktoring A.Ş. 11
b) Credit Risk
The credit risk exposed by the Company is monitored daily and
managed according to certain standards, thresholds and limits.
The Company aims to minimize size and number of loans
exceeding TRY 5mn per customer and TRY 1.5mn per check
originator. The Company management has predefined
concentration limits with respect to customers, cheque drawers
and sectors. The Board of Directors has the ultimate authority
in credit allocation decisions. The credit lines committed to
borrowers are reviewed periodically and revised upwards or
downwards in case of acquisition of material information
concerning the creditworthiness of the borrower.
As of 2016 year-end, the concentration of top 10, 20 and 50
customers were 10.36%, 15.12% and 24.52% respectively
(FYE2015: 14.17%, 21.82%, 33.49%). The cheque drawer
concentration levels were 5.95%, 8.05% and 12.27% as of
FYE2016. Both of the metrics have improved significantly
compred to the previous, as the Company has limited bulk loans
to large groups.
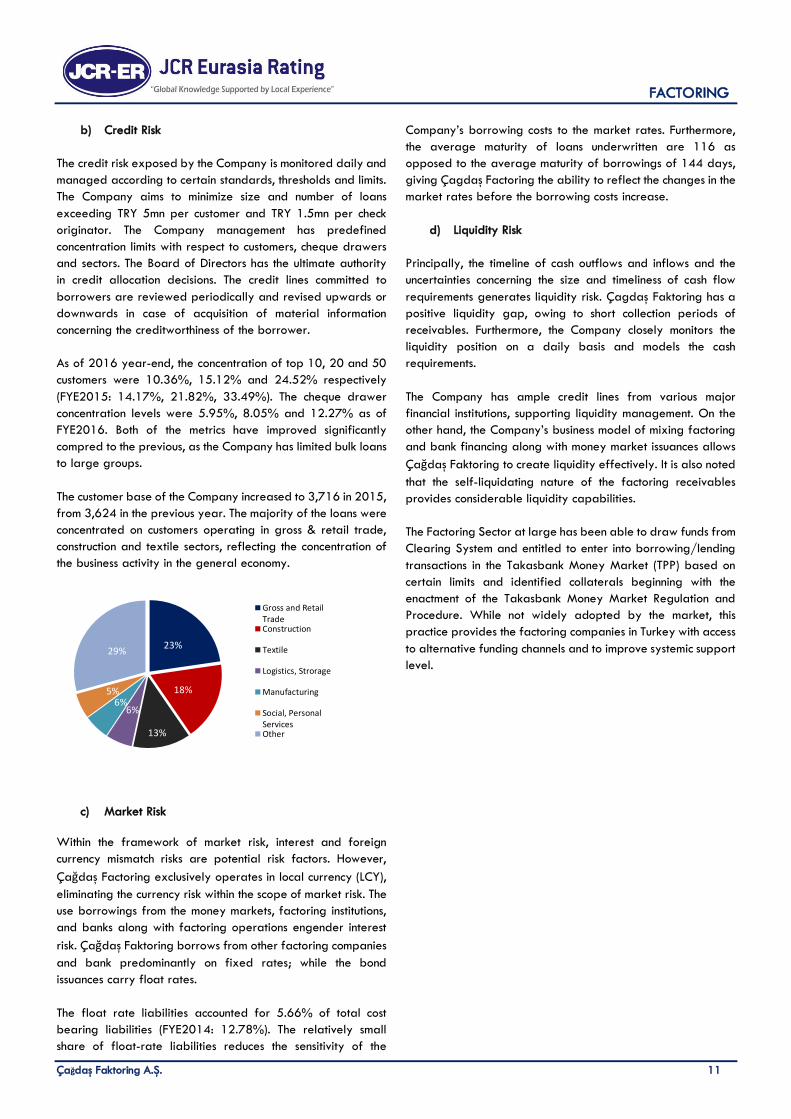
The customer base of the Company increased to 3,716 in 2015,
from 3,624 in the previous year. The majority of the loans were
concentrated on customers operating in gross & retail trade,
construction and textile sectors, reflecting the concentration of
the business activity in the general economy.
c) Market Risk
Within the framework of market risk, interest and foreign
currency mismatch risks are potential risk factors. However,
Çağdaş Factoring exclusively operates in local currency (LCY),
eliminating the currency risk within the scope of market risk. The
use borrowings from the money markets, factoring institutions,
and banks along with factoring operations engender interest
risk. Çağdaş Faktoring borrows from other factoring companies
and bank predominantly on fixed rates; while the bond
issuances carry float rates.
The float rate liabilities accounted for 5.66% of total cost
bearing liabilities (FYE2014: 12.78%). The relatively small
share of float-rate liabilities reduces the sensitivity of the
Company’s borrowing costs to the market rates. Furthermore,
the average maturity of loans underwritten are 116 as
opposed to the average maturity of borrowings of 144 days,
giving Çagdaş Factoring the ability to reflect the changes in the
market rates before the borrowing costs increase.
d) Liquidity Risk
Principally, the timeline of cash outflows and inflows and the
uncertainties concerning the size and timeliness of cash flow
requirements generates liquidity risk. Çagdaş Faktoring has a
positive liquidity gap, owing to short collection periods of
receivables. Furthermore, the Company closely monitors the
liquidity position on a daily basis and models the cash
requirements.
The Company has ample credit lines from various major
financial institutions, supporting liquidity management. On the
other hand, the Company’s business model of mixing factoring
and bank financing along with money market issuances allows
Çağdaş Faktoring to create liquidity effectively. It is also noted
that the self-liquidating nature of the factoring receivables
provides considerable liquidity capabilities.
The Factoring Sector at large has been able to draw funds from
Clearing System and entitled to enter into borrowing/lending
transactions in the Takasbank Money Market (TPP) based on
certain limits and identified collaterals beginning with the
enactment of the Takasbank Money Market Regulation and
Procedure. While not widely adopted by the market, this
practice provides the factoring companies in Turkey with access
to alternative funding channels and to improve systemic support
level.
23%
18%
13%
6%6%
5%
29%
Gross and RetailTradeConstruction
Textile
Logistics, Strorage
Manufacturing
Social, PersonalServicesOther
FACTORING
Çağdaş Faktoring A.Ş. 12
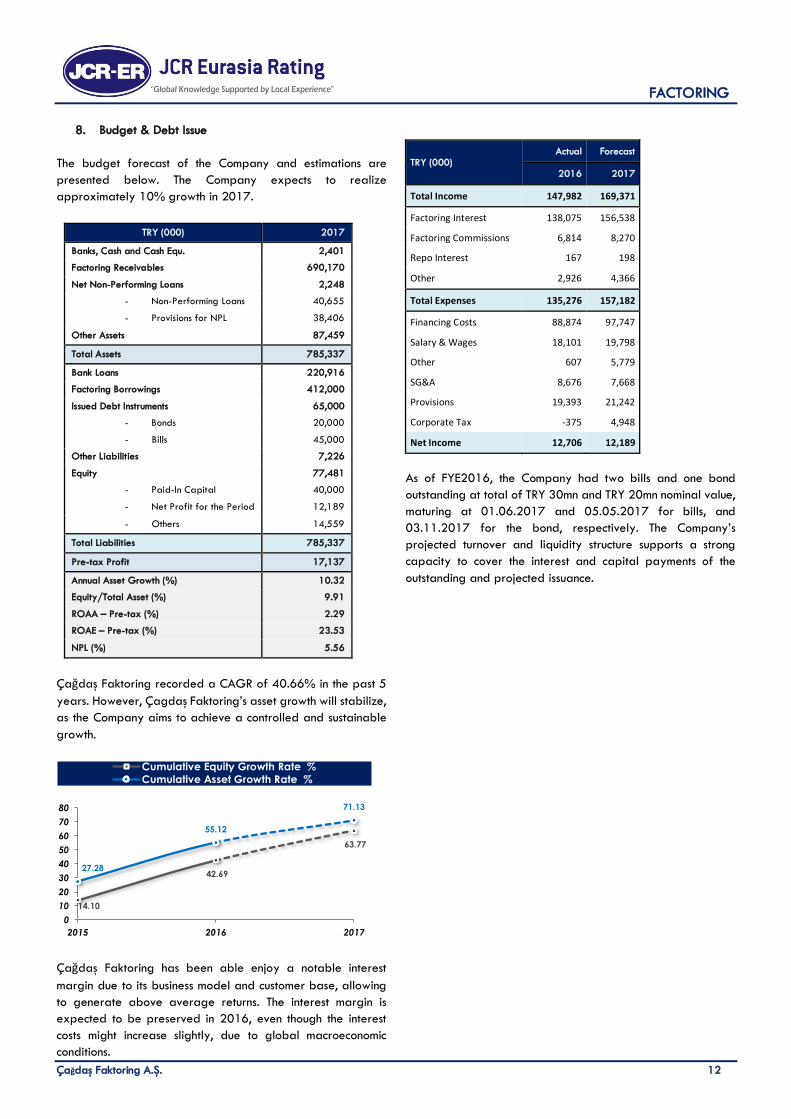
8. Budget & Debt Issue
The budget forecast of the Company and estimations are
presented below. The Company expects to realize
approximately 10% growth in 2017.
TRY (000) 2017
Banks, Cash and Cash Equ. 2,401
Factoring Receivables 690,170
Net Non-Performing Loans 2,248
- Non-Performing Loans 40,655
- Provisions for NPL 38,406
Other Assets 87,459
Total Assets 785,337
Bank Loans 220,916
Factoring Borrowings 412,000
Issued Debt Instruments 65,000
- Bonds 20,000
- Bills 45,000
Other Liabilities 7,226
Equity 77,481
- Paid-In Capital 40,000
- Net Profit for the Period 12,189
- Others 14,559
Total Liabilities 785,337
Pre-tax Profit 17,137
Annual Asset Growth (%) 10.32
Equity/Total Asset (%) 9.91
ROAA – Pre-tax (%) 2.29
ROAE – Pre-tax (%) 23.53
NPL (%) 5.56
Çağdaş Faktoring recorded a CAGR of 40.66% in the past 5
years. However, Çagdaş Faktoring’s asset growth will stabilize,
as the Company aims to achieve a controlled and sustainable
growth.
Çağdaş Faktoring has been able enjoy a notable interest
margin due to its business model and customer base, allowing
to generate above average returns. The interest margin is
expected to be preserved in 2016, even though the interest
costs might increase slightly, due to global macroeconomic
conditions.
TRY (000) Actual Forecast
2016 2017
Total Income 147,982 169,371
Factoring Interest 138,075 156,538
Factoring Commissions 6,814 8,270
Repo Interest 167 198
Other 2,926 4,366
Total Expenses 135,276 157,182
Financing Costs 88,874 97,747
Salary & Wages 18,101 19,798
Other 607 5,779
SG&A 8,676 7,668
Provisions 19,393 21,242
Corporate Tax -375 4,948
Net Income 12,706 12,189
As of FYE2016, the Company had two bills and one bond
outstanding at total of TRY 30mn and TRY 20mn nominal value,
maturing at 01.06.2017 and 05.05.2017 for bills, and
03.11.2017 for the bond, respectively. The Company’s
projected turnover and liquidity structure supports a strong
capacity to cover the interest and capital payments of the
outstanding and projected issuance.
14.10
42.69
63.77
27.28
55.12
71.13
0
10
20
30
40
50
60
70
80
2015 2016 2017
Cumulative Equity Growth Rate %
Cumulative Asset Growth Rate %
FACTORING
Çağdaş Faktoring A.Ş. 13
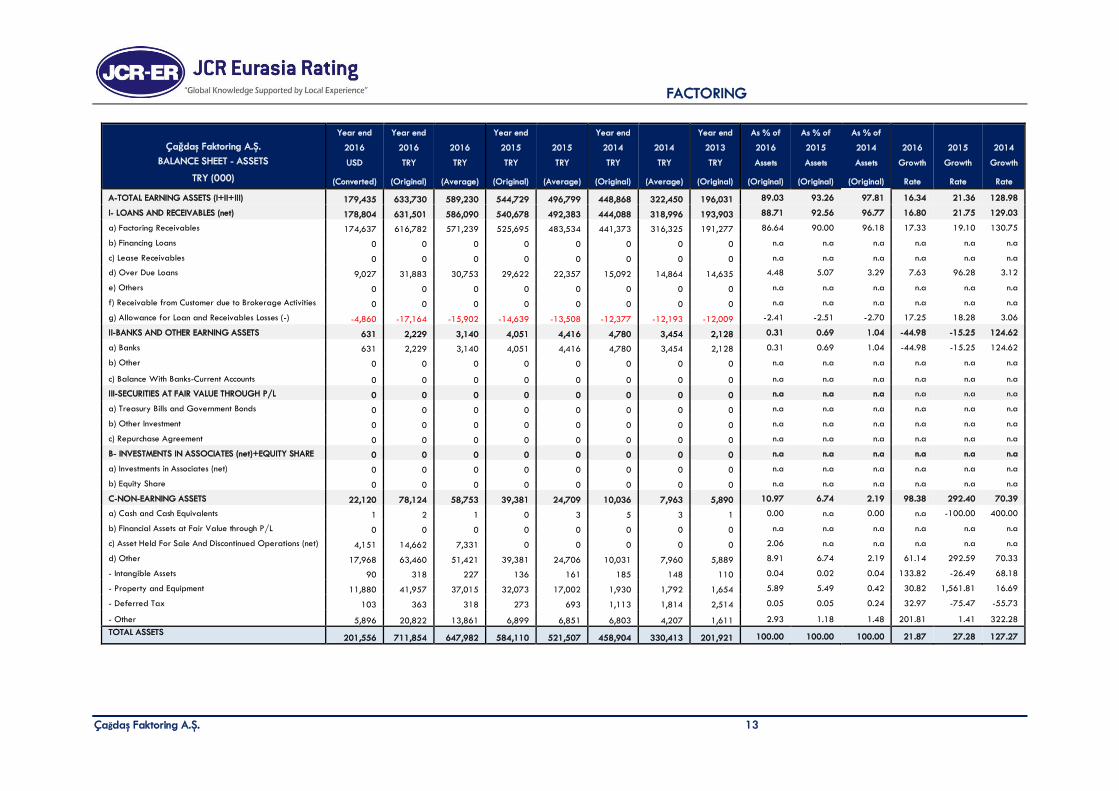
Year end Year end Year end Year end Year end As % of As % of As % of
Çağdaş Faktoring A.Ş. 2016 2016 2016 2015 2015 2014 2014 2013 2016 2015 2014 2016 2015 2014
BALANCE SHEET - ASSETS USD TRY TRY TRY TRY TRY TRY TRY Assets Assets Assets Growth Growth Growth
TRY (000) (Converted) (Original) (Average) (Original) (Average) (Original) (Average) (Original) (Original) (Original) (Original) Rate Rate Rate
A-TOTAL EARNING ASSETS (I+II+III) 179,435 633,730 589,230 544,729 496,799 448,868 322,450 196,031 89.03 93.26 97.81 16.34 21.36 128.98
I- LOANS AND RECEIVABLES (net) 178,804 631,501 586,090 540,678 492,383 444,088 318,996 193,903 88.71 92.56 96.77 16.80 21.75 129.03
a) Factoring Receivables 174,637 616,782 571,239 525,695 483,534 441,373 316,325 191,277 86.64 90.00 96.18 17.33 19.10 130.75
b) Financing Loans 0 0 0 0 0 0 0 0 n.a n.a n.a n.a n.a n.a
c) Lease Receivables 0 0 0 0 0 0 0 0 n.a n.a n.a n.a n.a n.a
d) Over Due Loans 9,027 31,883 30,753 29,622 22,357 15,092 14,864 14,635 4.48 5.07 3.29 7.63 96.28 3.12
e) Others 0 0 0 0 0 0 0 0 n.a n.a n.a n.a n.a n.a
f) Receivable from Customer due to Brokerage Activities 0 0 0 0 0 0 0 0 n.a n.a n.a n.a n.a n.a
g) Allowance for Loan and Receivables Losses (-) -4,860 -17,164 -15,902 -14,639 -13,508 -12,377 -12,193 -12,009 -2.41 -2.51 -2.70 17.25 18.28 3.06
II-BANKS AND OTHER EARNING ASSETS 631 2,229 3,140 4,051 4,416 4,780 3,454 2,128 0.31 0.69 1.04 -44.98 -15.25 124.62
a) Banks 631 2,229 3,140 4,051 4,416 4,780 3,454 2,128 0.31 0.69 1.04 -44.98 -15.25 124.62
b) Other 0 0 0 0 0 0 0 0 n.a n.a n.a n.a n.a n.a
c) Balance With Banks-Current Accounts 0 0 0 0 0 0 0 0 n.a n.a n.a n.a n.a n.a
III-SECURITIES AT FAIR VALUE THROUGH P/L 0 0 0 0 0 0 0 0 n.a n.a n.a n.a n.a n.a
a) Treasury Bills and Government Bonds 0 0 0 0 0 0 0 0 n.a n.a n.a n.a n.a n.a
b) Other Investment 0 0 0 0 0 0 0 0 n.a n.a n.a n.a n.a n.a
c) Repurchase Agreement 0 0 0 0 0 0 0 0 n.a n.a n.a n.a n.a n.a
B- INVESTMENTS IN ASSOCIATES (net)+EQUITY SHARE 0 0 0 0 0 0 0 0 n.a n.a n.a n.a n.a n.a
a) Investments in Associates (net) 0 0 0 0 0 0 0 0 n.a n.a n.a n.a n.a n.a
b) Equity Share 0 0 0 0 0 0 0 0 n.a n.a n.a n.a n.a n.a
C-NON-EARNING ASSETS 22,120 78,124 58,753 39,381 24,709 10,036 7,963 5,890 10.97 6.74 2.19 98.38 292.40 70.39
a) Cash and Cash Equivalents 1 2 1 0 3 5 3 1 0.00 n.a 0.00 n.a -100.00 400.00
b) Financial Assets at Fair Value through P/L 0 0 0 0 0 0 0 0 n.a n.a n.a n.a n.a n.a
c) Asset Held For Sale And Discontinued Operations (net) 4,151 14,662 7,331 0 0 0 0 0 2.06 n.a n.a n.a n.a n.a
d) Other 17,968 63,460 51,421 39,381 24,706 10,031 7,960 5,889 8.91 6.74 2.19 61.14 292.59 70.33
- Intangible Assets 90 318 227 136 161 185 148 110 0.04 0.02 0.04 133.82 -26.49 68.18
- Property and Equipment 11,880 41,957 37,015 32,073 17,002 1,930 1,792 1,654 5.89 5.49 0.42 30.82 1,561.81 16.69
- Deferred Tax 103 363 318 273 693 1,113 1,814 2,514 0.05 0.05 0.24 32.97 -75.47 -55.73
- Other 5,896 20,822 13,861 6,899 6,851 6,803 4,207 1,611 2.93 1.18 1.48 201.81 1.41 322.28
TOTAL ASSETS 201,556 711,854 647,982 584,110 521,507 458,904 330,413 201,921 100.00 100.00 100.00 21.87 27.28 127.27
FACTORING
Çağdaş Faktoring A.Ş. 14
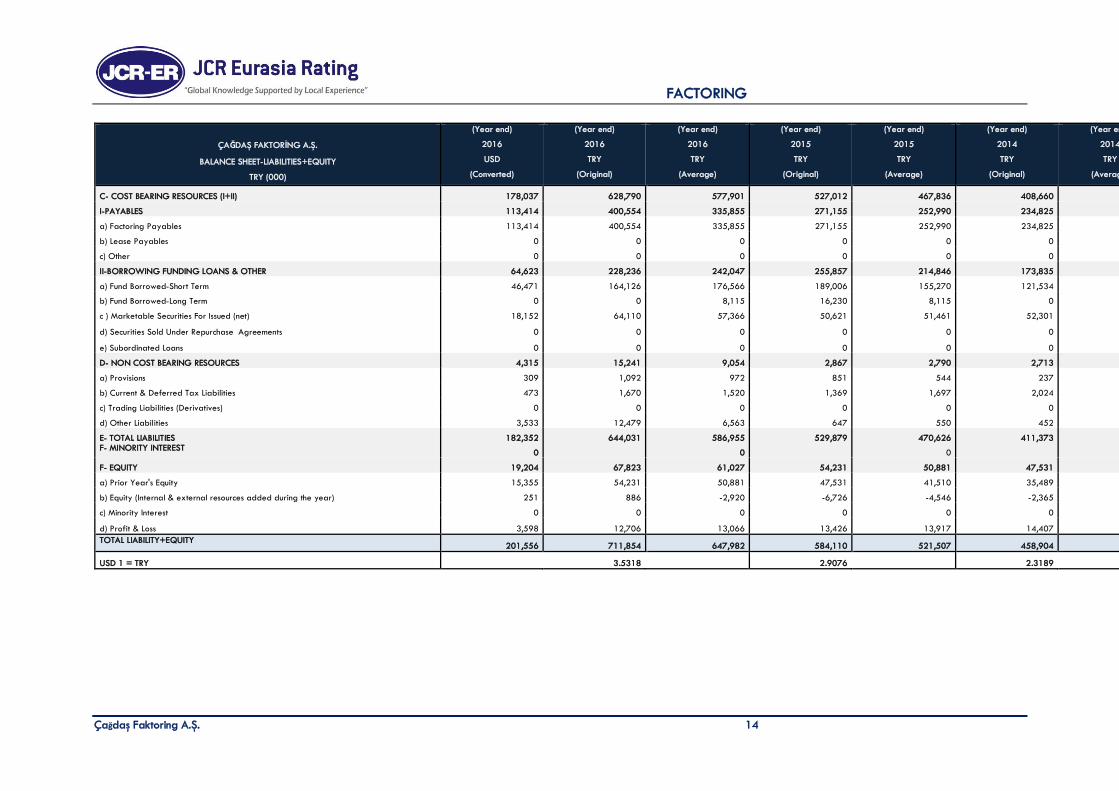
(Year end) (Year end) (Year end) (Year end) (Year end) (Year end) (Year end)
ÇAĞDAŞ FAKTORİNG A.Ş. 2016 2016 2016 2015 2015 2014 2014
BALANCE SHEET-LIABILITIES+EQUITY USD TRY TRY TRY TRY TRY TRY
TRY (000) (Converted) (Original) (Average) (Original) (Average) (Original) (Average)
C- COST BEARING RESOURCES (I+II) 178,037 628,790 577,901 527,012 467,836 408,660 286,885
I-PAYABLES 113,414 400,554 335,855 271,155 252,990 234,825 162,817
a) Factoring Payables 113,414 400,554 335,855 271,155 252,990 234,825 162,817
b) Lease Payables 0 0 0 0 0 0 0
c) Other 0 0 0 0 0 0 0
II-BORROWING FUNDING LOANS & OTHER 64,623 228,236 242,047 255,857 214,846 173,835 124,069
a) Fund Borrowed-Short Term 46,471 164,126 176,566 189,006 155,270 121,534 91,913
b) Fund Borrowed-Long Term 0 0 8,115 16,230 8,115 0 0
c ) Marketable Securities For Issued (net) 18,152 64,110 57,366 50,621 51,461 52,301 32,156
d) Securities Sold Under Repurchase Agreements 0 0 0 0 0 0 0
e) Subordinated Loans 0 0 0 0 0 0 0
D- NON COST BEARING RESOURCES 4,315 15,241 9,054 2,867 2,790 2,713 2,018
a) Provisions 309 1,092 972 851 544 237 229
b) Current & Deferred Tax Liabilities 473 1,670 1,520 1,369 1,697 2,024 1,296
c) Trading Liabilities (Derivatives) 0 0 0 0 0 0 0
d) Other Liabilities 3,533 12,479 6,563 647 550 452 494
E- TOTAL LIABILITIES 182,352 644,031 586,955 529,879 470,626 411,373 288,903 F- MINORITY INTEREST
0 0 0 0
F- EQUITY 19,204 67,823 61,027 54,231 50,881 47,531 41,510
a) Prior Year's Equity 15,355 54,231 50,881 47,531 41,510 35,489 37,043
b) Equity (Internal & external resources added during the year) 251 886 -2,920 -6,726 -4,546 -2,365 -4,565
c) Minority Interest 0 0 0 0 0 0 0
d) Profit & Loss 3,598 12,706 13,066 13,426 13,917 14,407 9,032
TOTAL LIABILITY+EQUITY 201,556 711,854 647,982 584,110 521,507 458,904 330,413
USD 1 = TRY 3.5318 2.9076 2.3189
FACTORING
Çağdaş Faktoring A.Ş. 15
Çağdaş Faktoring A.Ş.
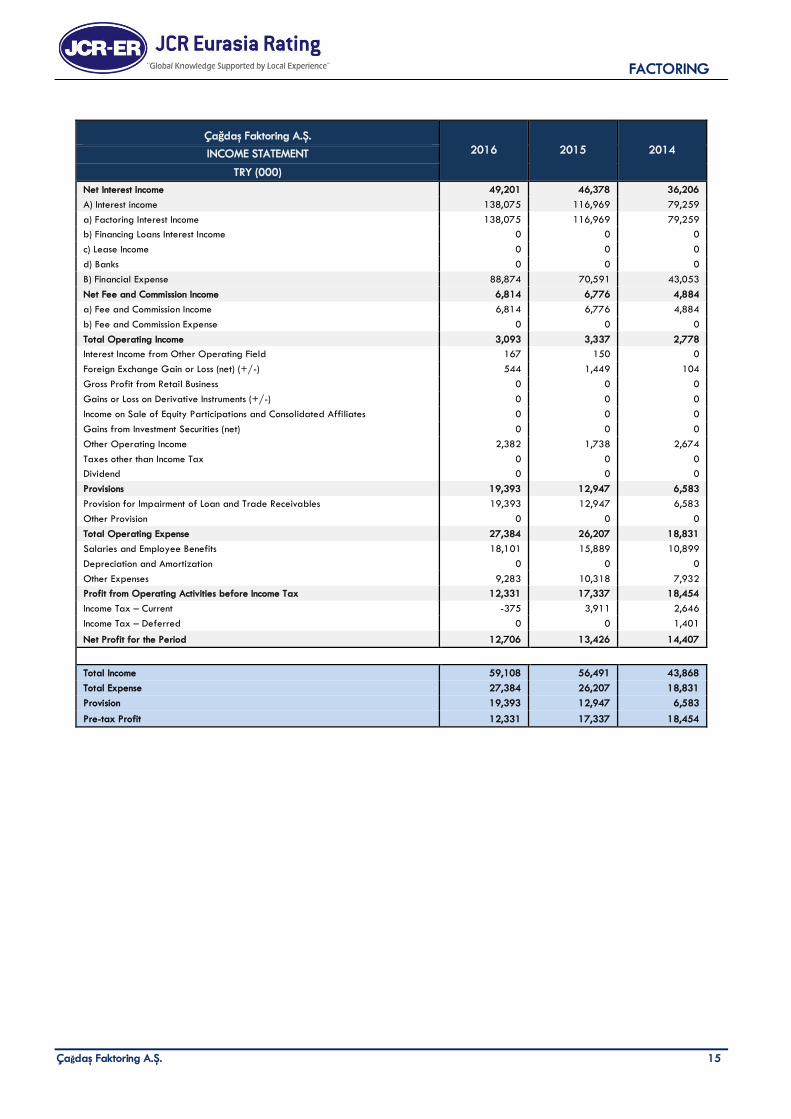
2016 2015 2014 INCOME STATEMENT
TRY (000)
Net Interest Income 49,201 46,378 36,206
A) Interest income 138,075 116,969 79,259
a) Factoring Interest Income 138,075 116,969 79,259
b) Financing Loans Interest Income 0 0 0
c) Lease Income 0 0 0
d) Banks 0 0 0
B) Financial Expense 88,874 70,591 43,053
Net Fee and Commission Income 6,814 6,776 4,884
a) Fee and Commission Income 6,814 6,776 4,884
b) Fee and Commission Expense 0 0 0
Total Operating Income 3,093 3,337 2,778
Interest Income from Other Operating Field 167 150 0
Foreign Exchange Gain or Loss (net) (+/-) 544 1,449 104
Gross Profit from Retail Business 0 0 0
Gains or Loss on Derivative Instruments (+/-) 0 0 0
Income on Sale of Equity Participations and Consolidated Affiliates 0 0 0
Gains from Investment Securities (net) 0 0 0
Other Operating Income 2,382 1,738 2,674
Taxes other than Income Tax 0 0 0
Dividend 0 0 0
Provisions 19,393 12,947 6,583
Provision for Impairment of Loan and Trade Receivables 19,393 12,947 6,583
Other Provision 0 0 0
Total Operating Expense 27,384 26,207 18,831
Salaries and Employee Benefits 18,101 15,889 10,899
Depreciation and Amortization 0 0 0
Other Expenses 9,283 10,318 7,932
Profit from Operating Activities before Income Tax 12,331 17,337 18,454
Income Tax – Current -375 3,911 2,646
Income Tax – Deferred 0 0 1,401
Net Profit for the Period 12,706 13,426 14,407
Total Income 59,108 56,491 43,868
Total Expense 27,384 26,207 18,831
Provision 19,393 12,947 6,583
Pre-tax Profit 12,331 17,337 18,454
FACTORING
Çağdaş Faktoring A.Ş. 16
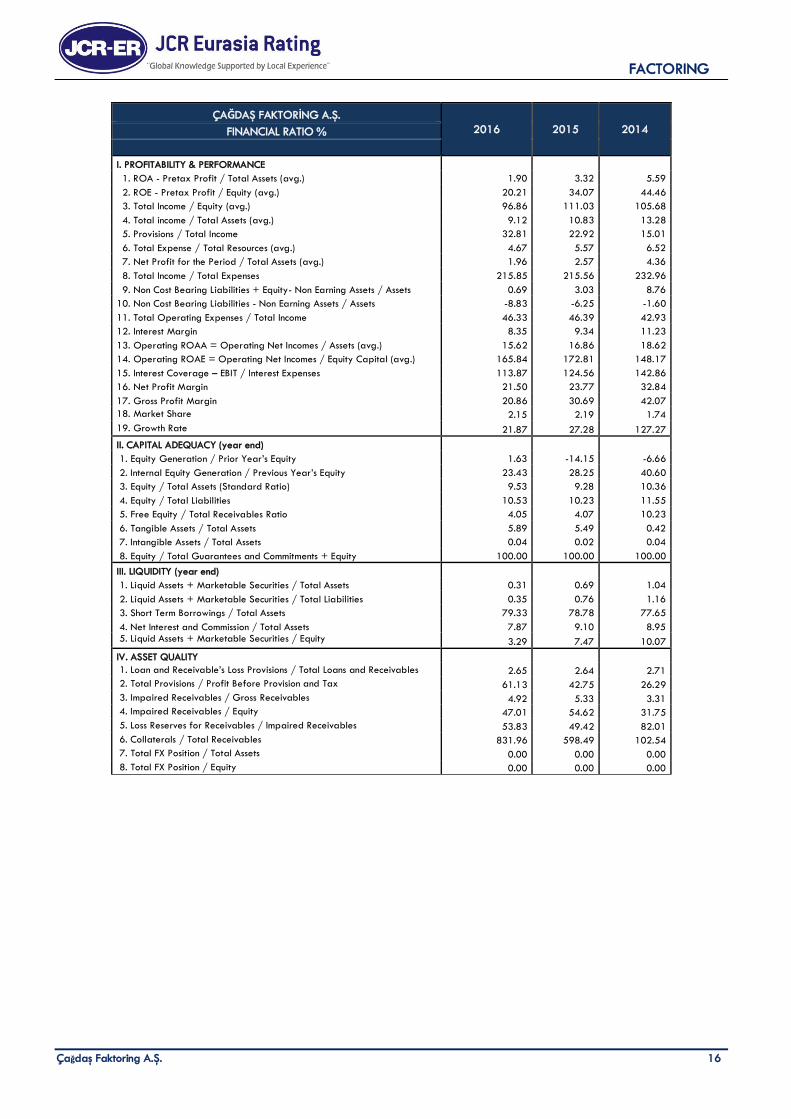
ÇAĞDAŞ FAKTORİNG A.Ş.
2016 2015 2014 FINANCIAL RATIO %
I. PROFITABILITY & PERFORMANCE
1. ROA - Pretax Profit / Total Assets (avg.) 1.90 3.32 5.59
2. ROE - Pretax Profit / Equity (avg.) 20.21 34.07 44.46
3. Total Income / Equity (avg.) 96.86 111.03 105.68
4. Total income / Total Assets (avg.) 9.12 10.83 13.28
5. Provisions / Total Income 32.81 22.92 15.01
6. Total Expense / Total Resources (avg.) 4.67 5.57 6.52
7. Net Profit for the Period / Total Assets (avg.) 1.96 2.57 4.36
8. Total Income / Total Expenses 215.85 215.56 232.96
9. Non Cost Bearing Liabilities + Equity- Non Earning Assets / Assets 0.69 3.03 8.76
10. Non Cost Bearing Liabilities - Non Earning Assets / Assets -8.83 -6.25 -1.60
11. Total Operating Expenses / Total Income 46.33 46.39 42.93
12. Interest Margin 8.35 9.34 11.23
13. Operating ROAA = Operating Net Incomes / Assets (avg.) 15.62 16.86 18.62
14. Operating ROAE = Operating Net Incomes / Equity Capital (avg.) 165.84 172.81 148.17
15. Interest Coverage – EBIT / Interest Expenses 113.87 124.56 142.86
16. Net Profit Margin 21.50 23.77 32.84
17. Gross Profit Margin 20.86 30.69 42.07
18. Market Share 2.15 2.19 1.74
19. Growth Rate 21.87 27.28 127.27
II. CAPITAL ADEQUACY (year end)
1. Equity Generation / Prior Year’s Equity 1.63 -14.15 -6.66
2. Internal Equity Generation / Previous Year’s Equity 23.43 28.25 40.60
3. Equity / Total Assets (Standard Ratio) 9.53 9.28 10.36
4. Equity / Total Liabilities 10.53 10.23 11.55
5. Free Equity / Total Receivables Ratio 4.05 4.07 10.23
6. Tangible Assets / Total Assets 5.89 5.49 0.42
7. Intangible Assets / Total Assets 0.04 0.02 0.04
8. Equity / Total Guarantees and Commitments + Equity 100.00 100.00 100.00
III. LIQUIDITY (year end)
1. Liquid Assets + Marketable Securities / Total Assets 0.31 0.69 1.04
2. Liquid Assets + Marketable Securities / Total Liabilities 0.35 0.76 1.16
3. Short Term Borrowings / Total Assets 79.33 78.78 77.65
4. Net Interest and Commission / Total Assets 7.87 9.10 8.95 5. Liquid Assets + Marketable Securities / Equity 3.29 7.47 10.07
IV. ASSET QUALITY
1. Loan and Receivable’s Loss Provisions / Total Loans and Receivables 2.65 2.64 2.71
2. Total Provisions / Profit Before Provision and Tax 61.13 42.75 26.29
3. Impaired Receivables / Gross Receivables 4.92 5.33 3.31
4. Impaired Receivables / Equity 47.01 54.62 31.75
5. Loss Reserves for Receivables / Impaired Receivables 53.83 49.42 82.01
6. Collaterals / Total Receivables 831.96 598.49 102.54
7. Total FX Position / Total Assets 0.00 0.00 0.00
8. Total FX Position / Equity 0.00 0.00 0.00
FACTORING
Çağdaş Faktoring A.Ş. 17
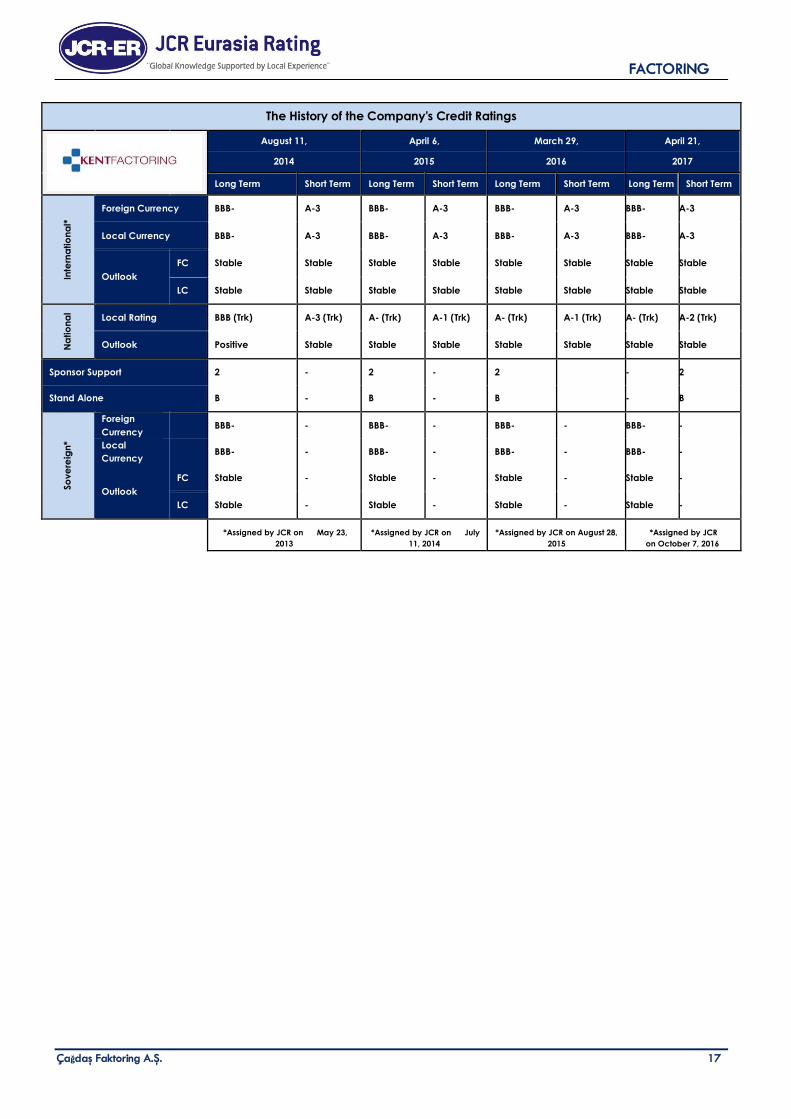
The History of the Company's Credit Ratings
August 11, April 6, March 29, April 21,
2014 2015 2016 2017
Long Term Short Term Long Term Short Term Long Term Short Term Long Term Short Term
Inte
rna
tio
na
l*
Foreign Currency BBB- A-3 BBB- A-3 BBB- A-3 BBB- A-3
Local Currency BBB- A-3 BBB- A-3 BBB- A-3 BBB- A-3
Outlook
FC Stable Stable Stable Stable Stable Stable Stable Stable
LC Stable Stable Stable Stable Stable Stable Stable Stable
Na
tio
na
l
Local Rating BBB (Trk) A-3 (Trk) A- (Trk) A-1 (Trk) A- (Trk) A-1 (Trk) A- (Trk) A-2 (Trk)
Outlook Positive Stable Stable Stable Stable Stable Stable Stable
Sponsor Support 2 - 2 - 2 - 2
Stand Alone B - B - B - B
So
ve
reig
n*
Foreign
Currency BBB- - BBB- - BBB- - BBB- -
Local
Currency BBB- - BBB- - BBB- - BBB- -
Outlook
FC Stable - Stable - Stable - Stable -
LC Stable - Stable - Stable - Stable -
*Assigned by JCR on May 23,
2013
*Assigned by JCR on July
11, 2014
*Assigned by JCR on August 28,
2015
*Assigned by JCR
on October 7, 2016