Embed Size (px)
Citation preview
TURKEY
Corporate Credit Rating (Updated)
Banking
Long-Term
Short-Term
Inte
rnat
iona
l Foreign currency BB B
Local currency BB B
Outlook Stable Stable
Nat
iona
l Local Rating A- (Trk) A–1 (Trk)
Outlook Positive Stable
Sponsored Support 2 -
Stand-alone B -
Sove
reig
n* Foreign currency BB B
Local currency BB B
Outlook Stable Stable
*Assigned by Japan Credit Rating Agency, JCR on February 1, 2010 Analyst: Şevket GÜLEÇ/ +90 212 352 56 73
AKTİF YATIRIM BANKASI A.Ş.
F i n a n c i a l D a t a 2009* 2008* 2007* 2006* Total Assets (000 USD) 383,248 171,337 96,912 49,589 Total Assets (000 TL) 577,057 260,090 113,242 66,819 Equity (000 TL) 173,193 164,441 65,346 61,234 Net Profit (000 TL) 3,155 4,953 4,112 5,229 Market Share (%) 0.07 0.04 0.02 0.01 Gross ROAA (%) 1.05 2.48 5.70 10.15 Gross ROAE (% ) 2.61 4.02 8.11 11.38 Equity/Assets (%) 30.01 63.22 57.70 91.64 CAR-Capital Adequacy Ratio (%) 21.29 35.64 42.19 61.40 Growth Rate (%) 121.87 129.68 69.48 4.12
*End of year
Overview
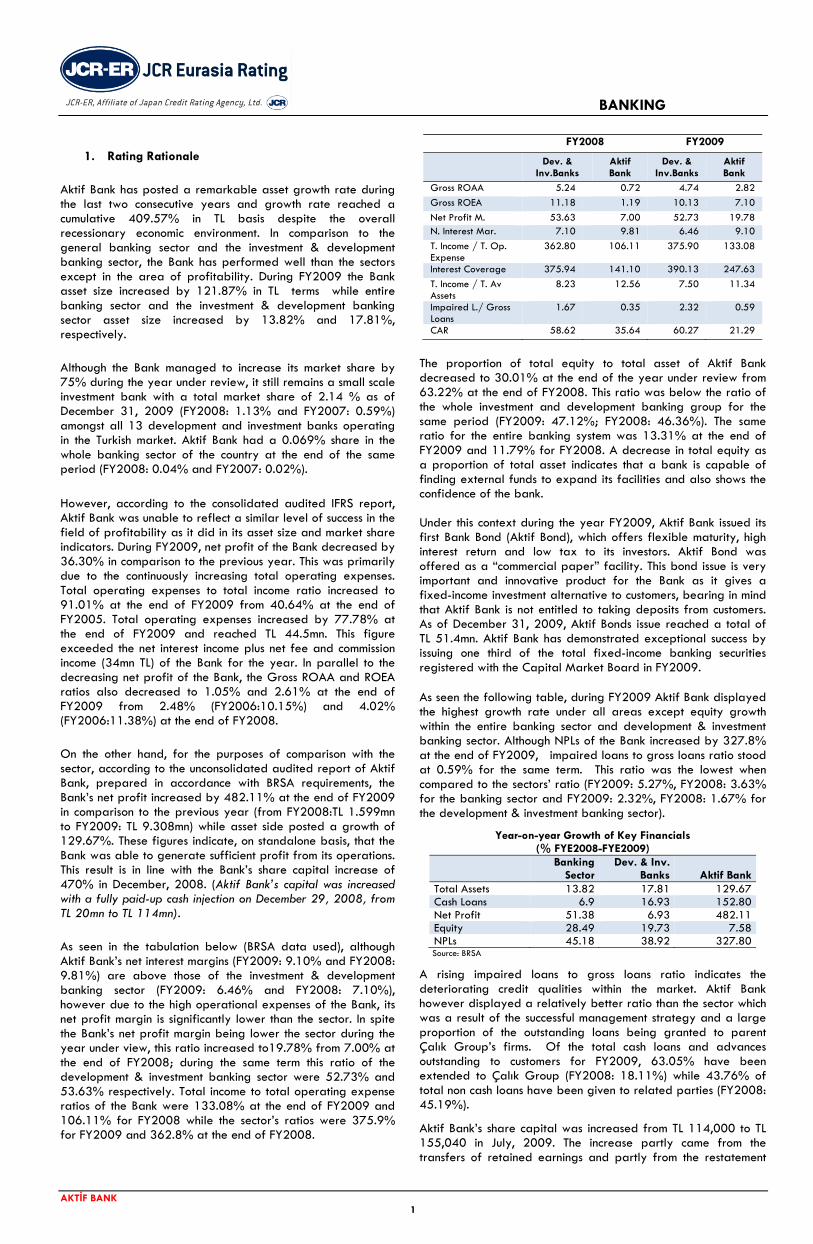
Aktif Yatırım Bankası A.Ş. (hereinafter “Aktif Bank” or the “Bank”), a licensed investment bank, operates with a network of 6 branches (two in İstanbul, one each in Bursa, Kayseri, Gaziantep and Sakarya) as of June 10, 2010. It was incorporated under the name of Çalık Yatırım Bankası A.Ş. (ÇALIKBANK) in July, 1999. On August 1, 2008, the trade name of Çalık Yatırım Bankası A.Ş. was changed to Aktif Yatırım Bankası A.Ş. The Bank was set up as a subsidiary of Çalık Holding and presently operates in the corporate banking, retail banking, leasing, factoring, trade finance and consulting avenues. However the Bank is not authorized to accept deposits from its customers. Aktif Bank, a small scale investment Bank, posted an impressive growth during the last two years as its asset size growth reached a cumulative 409.57% in TL basis despite the recessionary environment. Furthermore its market share also increased by 75% during FY2009, however it comprising only 0.07% share of the entire banking system. The Bank has planned to expand its branch network by opening two new branches in Düzce and Kütahya during the current year. As for the cooperation and online integration with PTT, which has nearly 4,000 branches, the Bank increased its geographical outreach to areas where its own branch network has not yet been established.
Strengths • Has considerable low level of impaired loans, both in absolutes
and proportions • Has an adequate liquidity level • Well balanced maturity profile of assets & liabilities • Develops new financing tools to diversify its funding base • Has started to use innovative alternative delivery channels such
as PTT branches in addition to its branch network • Indirect participation in Banka Kombetare Tregtare (BKT) has a
potential to contribute value and profit sharing to the Bank • Parent is a leading conglomerate of Turkey
Constraints • Large proportion of cash and non-cash loans given to the group
companies • Due to high operating expenses, ROAA, ROAE, Net/Gross Profit
Margins and other profitability ratios are low compared to the sector averages
• Commitments and contingencies as a proportion of equity are well above the development and investment banking sectors ratio
• Low market presence
Publication Date: July 9, 2010 “Global Knowledge supported by Local Experience” Copyright © 2010 by JCR ER Eurasia Rating. Nispetiye Cad.Firuze Sok. Ceylan Aprt. No:1-D:8 Akatlar/İSTANBUL Telephone: +90.212.352.56.73 Fax: +90 (212) 352.56.75 Reproduction of any part or contain of this report is not allowed without prior permission. All rights are reserved. All of the information has been obtained from the client and other sources which JCR ER believes are reliable, however, JCR ER does not guaranty the truth, accuracy or the adequacy of this information. This report is JCR ER independent opinion in the creditworthiness of a security and issuer. It’s not a recommendation to buy, hold or sell any security and neither to issue a loan. www.jcrer.com.tr
BANKING
AKTİF BANK
1
1. Rating Rationale
Aktif Bank has posted a remarkable asset growth rate during the last two consecutive years and growth rate reached a cumulative 409.57% in TL basis despite the overall recessionary economic environment. In comparison to the general banking sector and the investment & development banking sector, the Bank has performed well than the sectors except in the area of profitability. During FY2009 the Bank asset size increased by 121.87% in TL terms while entire banking sector and the investment & development banking sector asset size increased by 13.82% and 17.81%, respectively. Although the Bank managed to increase its market share by 75% during the year under review, it still remains a small scale investment bank with a total market share of 2.14 % as of December 31, 2009 (FY2008: 1.13% and FY2007: 0.59%) amongst all 13 development and investment banks operating in the Turkish market. Aktif Bank had a 0.069% share in the whole banking sector of the country at the end of the same period (FY2008: 0.04% and FY2007: 0.02%). However, according to the consolidated audited IFRS report, Aktif Bank was unable to reflect a similar level of success in the field of profitability as it did in its asset size and market share indicators. During FY2009, net profit of the Bank decreased by 36.30% in comparison to the previous year. This was primarily due to the continuously increasing total operating expenses. Total operating expenses to total income ratio increased to 91.01% at the end of FY2009 from 40.64% at the end of FY2005. Total operating expenses increased by 77.78% at the end of FY2009 and reached TL 44.5mn. This figure exceeded the net interest income plus net fee and commission income (34mn TL) of the Bank for the year. In parallel to the decreasing net profit of the Bank, the Gross ROAA and ROEA ratios also decreased to 1.05% and 2.61% at the end of FY2009 from 2.48% (FY2006:10.15%) and 4.02% (FY2006:11.38%) at the end of FY2008. On the other hand, for the purposes of comparison with the sector, according to the unconsolidated audited report of Aktif Bank, prepared in accordance with BRSA requirements, the Bank’s net profit increased by 482.11% at the end of FY2009 in comparison to the previous year (from FY2008:TL 1.599mn to FY2009: TL 9.308mn) while asset side posted a growth of 129.67%. These figures indicate, on standalone basis, that the Bank was able to generate sufficient profit from its operations. This result is in line with the Bank’s share capital increase of 470% in December, 2008. (Aktif Bank’s capital was increased with a fully paid-up cash injection on December 29, 2008, from TL 20mn to TL 114mn). As seen in the tabulation below (BRSA data used), although Aktif Bank’s net interest margins (FY2009: 9.10% and FY2008: 9.81%) are above those of the investment & development banking sector (FY2009: 6.46% and FY2008: 7.10%), however due to the high operational expenses of the Bank, its net profit margin is significantly lower than the sector. In spite the Bank’s net profit margin being lower the sector during the year under view, this ratio increased to19.78% from 7.00% at the end of FY2008; during the same term this ratio of the development & investment banking sector were 52.73% and 53.63% respectively. Total income to total operating expense ratios of the Bank were 133.08% at the end of FY2009 and 106.11% for FY2008 while the sector’s ratios were 375.9% for FY2009 and 362.8% at the end of FY2008.
FY2008 FY2009 Dev. &
Inv.Banks Aktif Bank
Dev. & Inv.Banks
Aktif Bank
Gross ROAA 5.24 0.72 4.74 2.82 Gross ROEA 11.18 1.19 10.13 7.10 Net Profit M. 53.63 7.00 52.73 19.78 N. Interest Mar. 7.10 9.81 6.46 9.10 T. Income / T. Op. Expense
362.80 106.11 375.90 133.08
Interest Coverage 375.94 141.10 390.13 247.63 T. Income / T. Av Assets
8.23 12.56 7.50 11.34
Impaired L./ Gross Loans
1.67 0.35 2.32 0.59
CAR 58.62 35.64 60.27 21.29
The proportion of total equity to total asset of Aktif Bank decreased to 30.01% at the end of the year under review from 63.22% at the end of FY2008. This ratio was below the ratio of the whole investment and development banking group for the same period (FY2009: 47.12%; FY2008: 46.36%). The same ratio for the entire banking system was 13.31% at the end of FY2009 and 11.79% for FY2008. A decrease in total equity as a proportion of total asset indicates that a bank is capable of finding external funds to expand its facilities and also shows the confidence of the bank. Under this context during the year FY2009, Aktif Bank issued its first Bank Bond (Aktif Bond), which offers flexible maturity, high interest return and low tax to its investors. Aktif Bond was offered as a “commercial paper” facility. This bond issue is very important and innovative product for the Bank as it gives a fixed-income investment alternative to customers, bearing in mind that Aktif Bank is not entitled to taking deposits from customers. As of December 31, 2009, Aktif Bonds issue reached a total of TL 51.4mn. Aktif Bank has demonstrated exceptional success by issuing one third of the total fixed-income banking securities registered with the Capital Market Board in FY2009. As seen the following table, during FY2009 Aktif Bank displayed the highest growth rate under all areas except equity growth within the entire banking sector and development & investment banking sector. Although NPLs of the Bank increased by 327.8% at the end of FY2009, impaired loans to gross loans ratio stood at 0.59% for the same term. This ratio was the lowest when compared to the sectors’ ratio (FY2009: 5.27%, FY2008: 3.63% for the banking sector and FY2009: 2.32%, FY2008: 1.67% for the development & investment banking sector).
Year-on-year Growth of Key Financials (% FYE2008-FYE2009)
Banking
Sector Dev. & Inv.
Banks Aktif Bank Total Assets 13.82 17.81 129.67 Cash Loans 6.9 16.93 152.80 Net Profit 51.38 6.93 482.11 Equity 28.49 19.73 7.58 NPLs 45.18 38.92 327.80
Source: BRSA
A rising impaired loans to gross loans ratio indicates the deteriorating credit qualities within the market. Aktif Bank however displayed a relatively better ratio than the sector which was a result of the successful management strategy and a large proportion of the outstanding loans being granted to parent Çalık Group’s firms. Of the total cash loans and advances outstanding to customers for FY2009, 63.05% have been extended to Çalık Group (FY2008: 18.11%) while 43.76% of total non cash loans have been given to related parties (FY2008: 45.19%).
Aktif Bank’s share capital was increased from TL 114,000 to TL 155,040 in July, 2009. The increase partly came from the transfers of retained earnings and partly from the restatement
BANKING
AKTİF BANK
2
effect on share capital. This capital increase will therefore not affect the strength of the balance sheet strength as there was no cash injection.
For this assignment, JCR-ER has utilized the independent consolidated audit report of Aktif Bank, based on the guidelines of International Financial Reporting Standards (IFRS) along with the unconsolidated report which has been submitted to the Banking Regulation and Supervisory Authority (BRSA).
2. Outlook
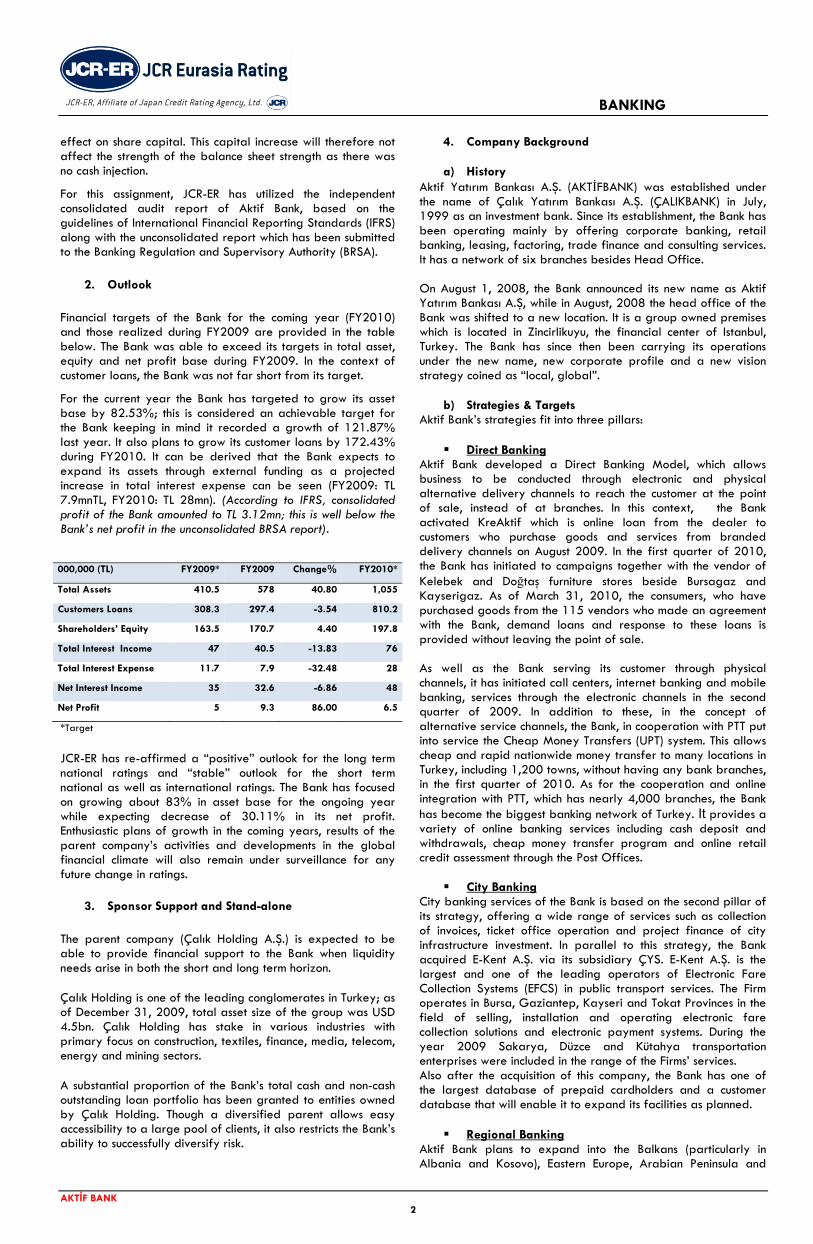
Financial targets of the Bank for the coming year (FY2010) and those realized during FY2009 are provided in the table below. The Bank was able to exceed its targets in total asset, equity and net profit base during FY2009. In the context of customer loans, the Bank was not far short from its target.
For the current year the Bank has targeted to grow its asset base by 82.53%; this is considered an achievable target for the Bank keeping in mind it recorded a growth of 121.87% last year. It also plans to grow its customer loans by 172.43% during FY2010. It can be derived that the Bank expects to expand its assets through external funding as a projected increase in total interest expense can be seen (FY2009: TL 7.9mnTL, FY2010: TL 28mn). (According to IFRS, consolidated profit of the Bank amounted to TL 3.12mn; this is well below the Bank’s net profit in the unconsolidated BRSA report). 000,000 (TL) FY2009* FY2009 Change% FY2010*
Total Assets 410.5 578 40.80 1,055
Customers Loans 308.3 297.4 -3.54 810.2
Shareholders’ Equity 163.5 170.7 4.40 197.8
Total Interest Income 47 40.5 -13.83 76
Total Interest Expense 11.7 7.9 -32.48 28
Net Interest Income 35 32.6 -6.86 48
Net Profit 5 9.3 86.00 6.5
*Target
JCR-ER has re-affirmed a “positive” outlook for the long term national ratings and “stable” outlook for the short term national as well as international ratings. The Bank has focused on growing about 83% in asset base for the ongoing year while expecting decrease of 30.11% in its net profit. Enthusiastic plans of growth in the coming years, results of the parent company’s activities and developments in the global financial climate will also remain under surveillance for any future change in ratings.
3. Sponsor Support and Stand-alone The parent company (Çalık Holding A.Ş.) is expected to be able to provide financial support to the Bank when liquidity needs arise in both the short and long term horizon. Çalık Holding is one of the leading conglomerates in Turkey; as of December 31, 2009, total asset size of the group was USD 4.5bn. Çalık Holding has stake in various industries with primary focus on construction, textiles, finance, media, telecom, energy and mining sectors. A substantial proportion of the Bank’s total cash and non-cash outstanding loan portfolio has been granted to entities owned by Çalık Holding. Though a diversified parent allows easy accessibility to a large pool of clients, it also restricts the Bank’s ability to successfully diversify risk.
4. Company Background a) History
Aktif Yatırım Bankası A.Ş. (AKTİFBANK) was established under the name of Çalık Yatırım Bankası A.Ş. (ÇALIKBANK) in July, 1999 as an investment bank. Since its establishment, the Bank has been operating mainly by offering corporate banking, retail banking, leasing, factoring, trade finance and consulting services. It has a network of six branches besides Head Office. On August 1, 2008, the Bank announced its new name as Aktif Yatırım Bankası A.Ş, while in August, 2008 the head office of the Bank was shifted to a new location. It is a group owned premises which is located in Zincirlikuyu, the financial center of Istanbul, Turkey. The Bank has since then been carrying its operations under the new name, new corporate profile and a new vision strategy coined as “local, global”.
b) Strategies & Targets Aktif Bank’s strategies fit into three pillars:
Direct Banking Aktif Bank developed a Direct Banking Model, which allows business to be conducted through electronic and physical alternative delivery channels to reach the customer at the point of sale, instead of at branches. In this context, the Bank activated KreAktif which is online loan from the dealer to customers who purchase goods and services from branded delivery channels on August 2009. In the first quarter of 2010, the Bank has initiated to campaigns together with the vendor of Kelebek and Doğtaş furniture stores beside Bursagaz and Kayserigaz. As of March 31, 2010, the consumers, who have purchased goods from the 115 vendors who made an agreement with the Bank, demand loans and response to these loans is provided without leaving the point of sale. As well as the Bank serving its customer through physical channels, it has initiated call centers, internet banking and mobile banking, services through the electronic channels in the second quarter of 2009. In addition to these, in the concept of alternative service channels, the Bank, in cooperation with PTT put into service the Cheap Money Transfers (UPT) system. This allows cheap and rapid nationwide money transfer to many locations in Turkey, including 1,200 towns, without having any bank branches, in the first quarter of 2010. As for the cooperation and online integration with PTT, which has nearly 4,000 branches, the Bank has become the biggest banking network of Turkey. It provides a variety of online banking services including cash deposit and withdrawals, cheap money transfer program and online retail credit assessment through the Post Offices.
City Banking City banking services of the Bank is based on the second pillar of its strategy, offering a wide range of services such as collection of invoices, ticket office operation and project finance of city infrastructure investment. In parallel to this strategy, the Bank acquired E-Kent A.Ş. via its subsidiary ÇYS. E-Kent A.Ş. is the largest and one of the leading operators of Electronic Fare Collection Systems (EFCS) in public transport services. The Firm operates in Bursa, Gaziantep, Kayseri and Tokat Provinces in the field of selling, installation and operating electronic fare collection solutions and electronic payment systems. During the year 2009 Sakarya, Düzce and Kütahya transportation enterprises were included in the range of the Firms’ services. Also after the acquisition of this company, the Bank has one of the largest database of prepaid cardholders and a customer database that will enable it to expand its facilities as planned.
Regional Banking Aktif Bank plans to expand into the Balkans (particularly in Albania and Kosovo), Eastern Europe, Arabian Peninsula and
BANKING
AKTİF BANK
3
North Africa while also aiming to transfer banking knowledge to less developed countries. These regional locations are operating areas of Çalık Holding and therefore accessible countries under this strategy. In the financial arena, BKT, a subsidiary of Aktif Bank, operates with a network of 56 branches/agencies in Albania and 12 branches in Kosovo at the end of FY2009. Aktif Bank plans to become the financial intermediary for all trade between Albania, Kosovo and Turkey.
Other Major Service Area of Aktif Bank The Bank offers corporate banking services to its group companies and third party clients with a focus on trade finance solutions between Turkey, Albania, and Kosovo beside other near region countries. Within this scope, the Bank has expanded its branch network to respond to needs of its customers with the opening of Kayseri, Gaziantep and Bursa branches. The Bank Management opened a new branch in Sakarya during June 2010 while others in Düzce and Kütahya are planned for later during the current year, serving in the fields of corporate and SME banking. Through its expertise in project and corporate finance, the Bank provides services of mergers & acquisitions, advisory on energy efficiency, strategic partnership, restructuring, regional development and industrial strategies. Project feasibilities, business plans and investment evaluations are also areas covered under this pillar. In parallel to its Regional Banking strategy in the corporate banking field, Aktif Bank become the local and regional agent of the ITFC and ICIEC, both subsidiaries of the Islamic Development Bank in FY2009. As a consequence of this cooperation, the Bank was able to widen product diversity, offering “Export, Investment and Documentary Credit Insurance” products to investors. It also gave the Bank an opportunity to play an important role in the development trade of Turkey beside Azerbaijan, Kyrgyzstan, Tajikistan, Turkmenistan, Uzbekistan and Albania through services in marketing, operations, credits, treasury and etc. For companies operating in foreign countries with interests in Turkey, the Bank intends to offer country, sector and company research reports along with technical project analysis, logistics support and consulting services under the name of Act office. The Bank has initiated to offer its customers with a new cash management service, under the proposed name of Integrated Receivables Management (B.A.Y.). This will facilitate management of the collection processes of its customers’ deferred receivables. Service offering includes cheque collections, card collection systems, subscriber collection systems, salary and bill payments, briefly covering the needs of cash flow structure.
c) Organization & Employees Aktif Bank began its restructurings efforts 2.5 years ago starting in the second half of FY2007. During this period, the Bank shifted its head office to a new location in Zincirlikuyu, made large investment in technological and organizational infrastructure by setting up new departments and employing a new, experienced management team in line with its healthy and strong growth strategies. The Bank employed 236 employees at the end of FY2009 (FY2008:160) and the average age of the employees was 32 years. Thus, total workforce of the Bank has expanded by 47.5% year-on-year during FY2009. Of the total employed staff, 152 were university graduates, 35 master degree holders and 2 PhDs. Aktif Bank’s staff average service duration is 1.6 years while their averages banking experience is 6.3
years. As of March 31, 2010 the total workforce numbers increased to 244. Aktif Bank grants crucial importance to enhancing the knowledge and ability of its employees, and provided a total of 7,286 hours of employee training during the year FY2009 (FY2008: 3,864 hours). This translates into an average of 37 hours of training to each employee of the organization per annum. As of December 31, 2009, the Bank operated with a total network of 5 branches; two located in İstanbul, one each in Bursa, Kayseri and Gaziantep. The management plans to expand its network by opening a total of two new branches in Düzce, and Kütahya during the year while another branch in Sakarya was inaugurated on June 9, 2010. The Board of Aktif Bank consists of seven members of which two are non-executive. The top management team of the Bank comprises of nine executive vice presidents and the CEO. All these managers are highly educated in their respective fields and have relevant prior work experience making them highly competent to manage the affairs of the Bank. The executive management of the Bank is organized under 9 Group Heads and 5 Division Heads. The ‘Internal System Group’ operates under the Audit Committee, and this comprises of the Internal Control, Internal Audit and Risk Management Departments. The Bank set up four committees, namely: Credit Committee (consisting of CEO and two of the Bard Members), Asset and Liability Committee (consisting of total 16 members), Audit Committee (consisting of two Board Members) and Promotion Committee (consisting of 14 members).
d) Shareholders, Subsidiaries and Affiliates Aktif Bank is a directly owned subsidiary of the Çalık Holding A.S., having 98.51% share of the Bank while the remaining 1.49% share are owned by GAP Güneydoğu Tekstil A.Ş., Ahmet ÇALIK, Başak Enerji Elektrik Üretim San.ve Tic. A.Ş. and Irmak Enerji Elektrik Üretim Madencilik A.Ş. During the year FY2009, 0.36% of the shares ownership was altered and Başak Enerji Elektrik Üretim San. ve Tic. A.Ş. and Irmak Enerji Elektrik Üretim Madencilik A.Ş. became shareholders from Mahmut ÇALIK and Ali AKBULUT. The shareholding pattern is detailed in the following table.
Shareholding Structure
2008 2009 Share (%)
Share (%)
Çalık Holding A.Ş. 98.51 98.51 GAP Güneydoğu Tekstil Sanayi ve Tic .A.Ş. 0.78 0.78 Ahmet ÇALIK 0.35 0.35 Başak Enerji Elektrik Üretim San.ve Tic. A.Ş. - 0.18 Irmak Enerji Elektrik Üretim Madencilik A.Ş. - 0.18 Mahmut ÇALIK 0.18 - Ali AKBULUT 0.18 - Total 100 100 Paid Capital-TL (000) 114,000 155,040
Çalık Finansal Hizmetler A.Ş was formed under the name of Çalık-Şeker Konsorsiyum Yatırım A.Ş. in FY2003 by Turkish investors; i.e., Çalık Holding Company, SekerBank and Çalık Yatırım Bankası A.Ş. (the previous name of Aktif Yatırım Bankası A.Ş.). As of November 25, 2008, Şekerbank sold its entire interest in the consortium to Çalık Holding A.Ş. From January 16, 2009 onwards the name of Çalık-Şeker Konsorsiyum Yatırım A.Ş. was changed to Çalık Finansal Hizmetler A.Ş.

BANKING
AKTİF BANK
4
Aktif Bank has a direct participation of 24% in Çalık Finansal Hizmetler A.Ş. while remaining 76% is held by Çalık Group.
Subsidiary & Dir. or Ind. Participating Shares %
Çalık Finansal Hizmetler A.Ş. 24.0 Banka KombetareTregtare 24.0 Çalık Yönetim Sistemleri A.Ş. 75.0 E-Kent Elektronik Ücret Toplama A.Ş. 75.0 E-Tik Elektronik Transfer Kup.Ltd.Şti. 73.5
Çalık Finansal Hizmetler A.Ş. is now sole owner of BKT which is the second largest corporate and commercial banking institute in Albania. During FY2009, the Company bought 40% shares of BKT, previously owned by International Finance Corporation (IFC) (20%) and European Bank for Reconstruction and Development (EBRD) (20%). BKT operates as a commercial bank, with a network of 56 branches/agencies in Albania and 12 branches in Kosovo at the end of FY2009. BKT is the second largest bank among 16 banks in Albania in terms of total assets with a worth USD 1.34bn at the end of the same period. BKT has also been assigned an outstanding long term credit rating by JCR-ER as of May 5, 2010 (International: Foreign Currency BB+, Local Currency BB. National: Local Rating AAA (Alb)).
Çalık Yönetim Sistemleri A.Ş. (ÇYS) was established on May 8, 2008 by Aktif Bank with a 75% share and Gap İnşaat participating to the extent of 25%. ÇYS operates in the field of consultancy services such as organization, evaluations, strategic planning, risk management, and other services. E-Kent was established in 2002 and acquired on May 30, 2008 by ÇYS for an amount of TL 17mn. E-Kent sells, installs and operates electronic fare collection solutions and electronic payment systems as well as provides consulting services for planning and efficiency of public transport services. The company operates in Bursa, Gaziantep, Kayseri, Tokat, Düzce, Kütahya and Sakarya. E-Kent provides system solutions to meet customers’ requirements of municipalities, public transport companies, public entertainment areas, car parks and even railway networks in major cities of Turkey.
The company manages three million smart transportation cards, 500 light rail system entrance-exit toll gates, 3000 validators on the municipality and public buses, 950 smart card/magnetic paper ticket sale/charging offices in its operating provinces. The company, in collaboration with Aktif Bank, is working on delivery and collection of electricity, water and natural gas bills through utilizing its city cards program. The company is a member of the International Association of Public Transport (UITP) and revenue of TL 800mn had been generated during FY2009 (FY2008: TL 500mn).
After the acquisition of E-Kent A.Ş., Aktif Bank has 73.5% stake in E-Tik Elektronik Transfer Kup. Ltd. Şti, while E-Kent A.Ş. has 98% ownership of E-Tik. The company was founded in November, 2004 in Bursa aiming to provide electronic ticket trade and tollbooth facilities in the automatic fare collection system.
5. Financial Foundation
a) Stability of the Financial System Turkish Banking Sector, with its contribution of 184,204 staff to the civil employment sector, constituting 79.6% of the financial system. With its ratio of total assets to GDP at 87.43% as of FY2009 (FY2008: 77.10%), it is essentially receptive to global interactions through its high level of integration with the world economies. The sector, with 49 banking institutions with 9,585 branches, succeeded in shielding itself well from the global crisis. Further progress of the crisis has been impeded as the local lenders have refrained from apprehensions which may
have constrained the liquidity levels of the banks. The Central Bank was also able to cultivate a sense of mutual confidence among banks by providing potential liquidity means through the crisis period.
DECEMBER, 2009
NUMBER OF BANKS
NUMBER OF BRANCHES
NUMBER OF STAFF
DEPOSIT BANKS 32 8,983 167,063
State Banks 3 2,530 44,856 Private Banks 11 4,390 82,270 SDIF Bank 1 1 261
Foreign Banks 17 2,062 39,676
DEVELOPMENT & INVESTMENT BANKS 13 44 5,339
PARTICIPATION BANKS 4 558 11,802
TOTAL 49 9,585 184,204
TURKISH BANKING SECTOR
Financial Data 2009* 2008* 2007* 2006*
Total Assets (000,000 USD) 554,641 481,502 501,687 355,527
Total Assets (000,000 TL) 834,013 732,749 581,606 499,729
Equity (000,000 TL) 110,987 86,375 75,850 59,535
Net Profit (000,000 TL) 20,182 13,332 14,859 11,364
Interest Margin (%) 5.87 5.23 5.03 4.81
ROAA (%) 3.21 2.54 3.13 3.20
ROAE (% ) 25.49 20.56 26.90 25.36
Equity/Assets (%) 13.31 11.79 13.04 11.91
CAR-Capital Adequacy Ratio (%)
20.47 17.98 18.94 21.90
Net Profit Margin (%) 33.20 27.83 35.82 32.01
Furthermore, regulatory, supervisory and monitoring activities have disciplined the sector. In recent years, the appetite for the rational budget, flow of funds, scoring, internal collateral generation and risk methodologies has aroused; more realistic pricing policies have been initiated, and objective lending criteria have been developed. The level of infection of the banking sector from the crisis has been kept to a minimum due to the exclusion of long term holdings such as mortgage loans (being the foremost problematic credit) and securitization based on synthetic instruments such as those in developed economies. The Turkish banking system, with its high capital adequacy ratio, is still lagging behind the EU banking sector averages in terms of the ratio of deposits and loans to GDP and the ratio of loans to deposits. These are the accepted indicators of the intermediary function. In 2009, some of the large financial institutions influential on the world economies have collapsed or came to the verge of bankruptcy in many countries. The financial anxiety borne by regulatory authorities in developed countries has still not eased off. The retraction of bailouts by the governments where the banks still have not found sufficient length of time to restore their financial powers is an ongoing issue at the present moment. Overregulation, political intervention, macroeconomic complications, liquidity and capital requirements, derivative instruments, quality of risk management, credit allocation, exchange rates, corporate governance, interest rates, payment systems, money laundering and appetite for mergers have been still attributed as risk elements on the international scale.
BANKING
AKTİF BANK
As a result of consecutive interest rate reductions Turkish banking sector has generated considerable profits and improved in market values. However, with the abandonment of this policy toward the end of 2009, these high profit figures shall not be attained in 2010. It is forecasted that the year 2010 shall witness the beginning of competitive forces in loans, retail and housing loans, and the channeling of the excess liquidity into the real economy with the removal of uncertainty. Turkish banking sector with a sound and sustainable profitability structure, high levels of customer satisfaction and focus on service quality shall display a successful performance in 2010, given that it is able to curb its expenses.
b) Financial Indicators
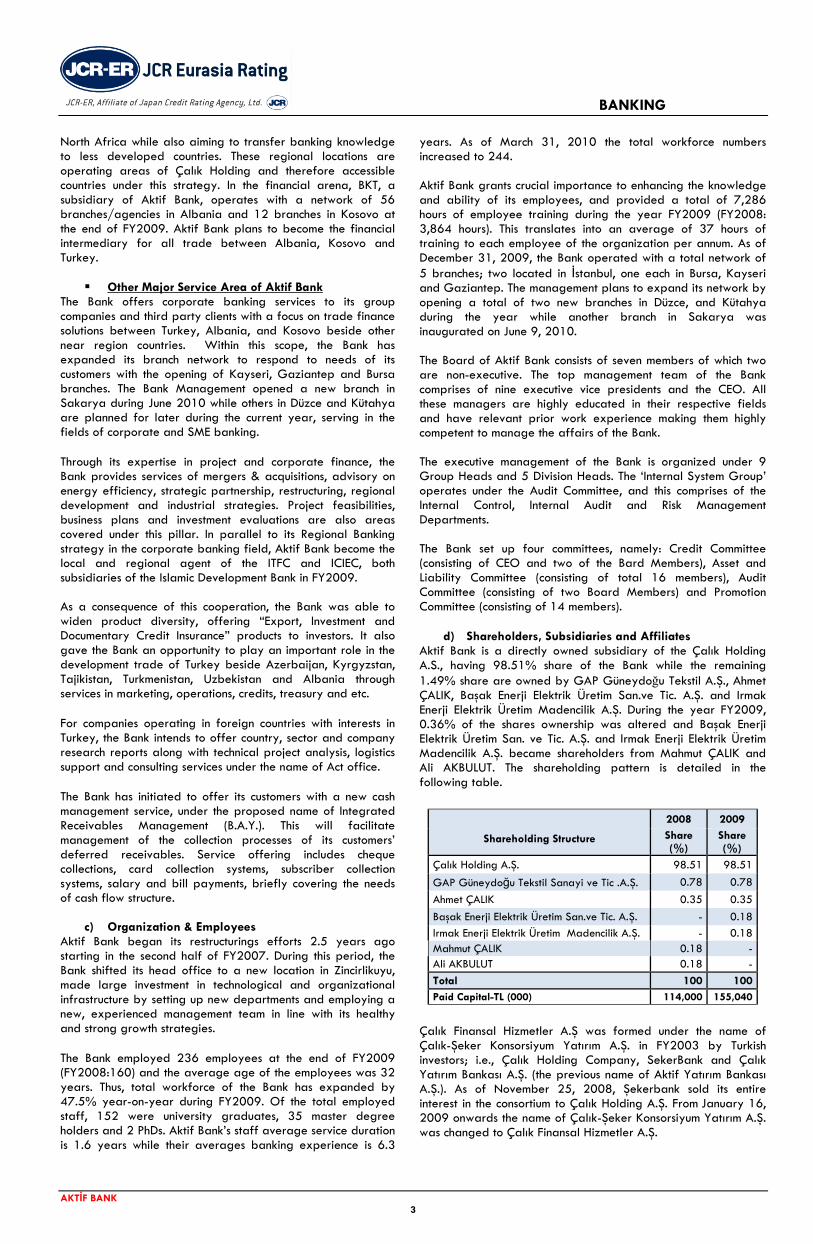
• Indices relating to size Aktif Bank has posted an impressive asset growth rate during the last two consecutive years. During the year under view, the asset growth rate was recorded at 121.87% (FY2008: 129.68%, FY2007: 69.48%, FY2006: 4.12%) which was significantly above the development and investment banking sector growth rate for the same period at 17.81% (FY2009) and 21.47% for the year before. The cumulative growth rates of the banking sector and Aktif Bank are given in the chart below. As a result of the rapid growth exhibited by the Bank, it’s cumulative growth was more than two times of the banking sector in comparison.
The growth rate of 121.87% primarily has taken its root from 105.06% increase in costly liabilities, 13.45% in non-costly liabilities and 3.36% from equity increases. This result indicates that the Bank recorded its growth by depending mainly on costly liabilities. In these context costly liabilities, increased from TL 88mn in FY2008 to TL 361mn in FY2009, indicates a growth 311.16% while non-costly liabilities increased by a growth 446.39% from TL 8mn in FY2008 to TL 43mn in FY2009.
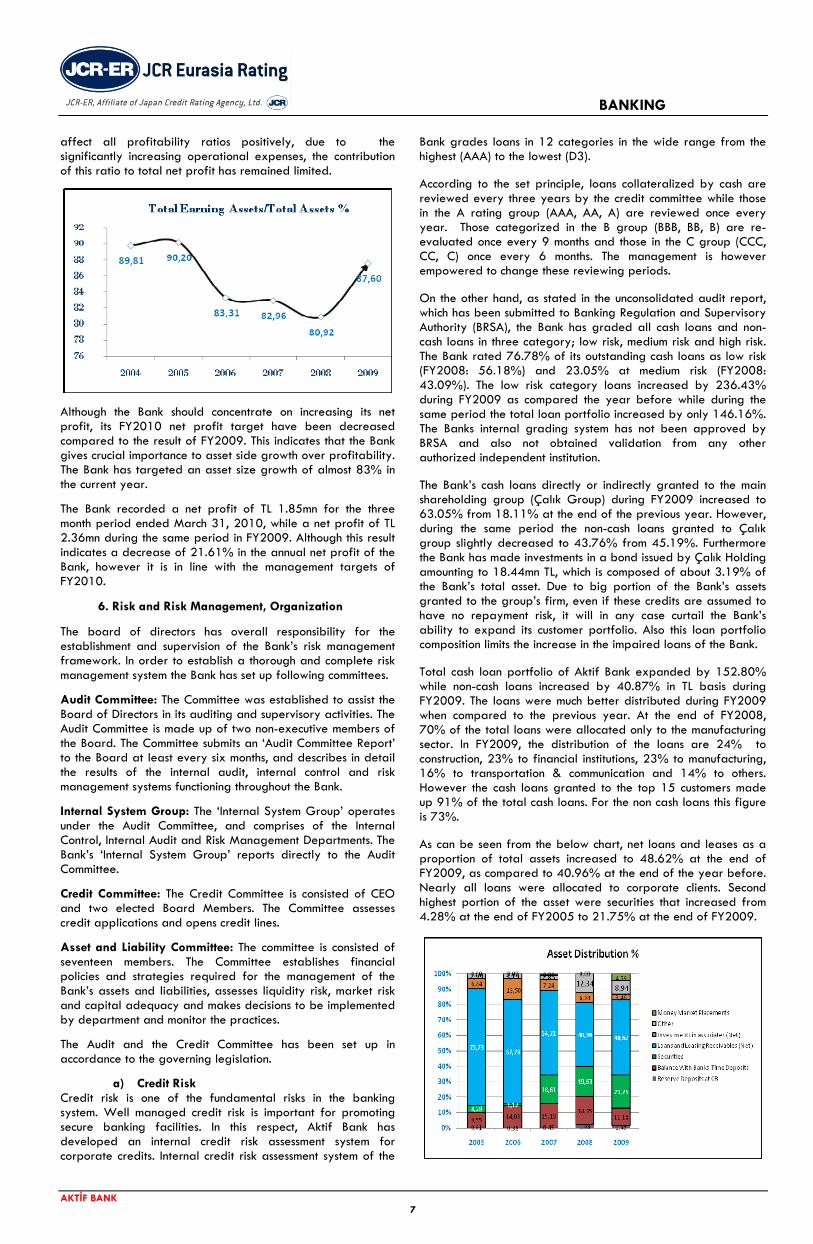
As seen from the graph below, 87.60% (505mn TL) of total assets was directed towards the earning asset categories (FY2008: 80.92%), while 12.40% (72mn TL) was kept in non-earning assets categories (FY2008: 19.08%). Increase in the proportion of earning assets in the total assets during the year under review has affected the Bank profitability in a positive manner; however with a 77.78% increase in total operating expense, the advantage of a high asset growth especially earning assets was unable to be transferred into profitability before taxation. Profit before tax contracted by 4.78% at the end of FY2009 compared to the previous year.
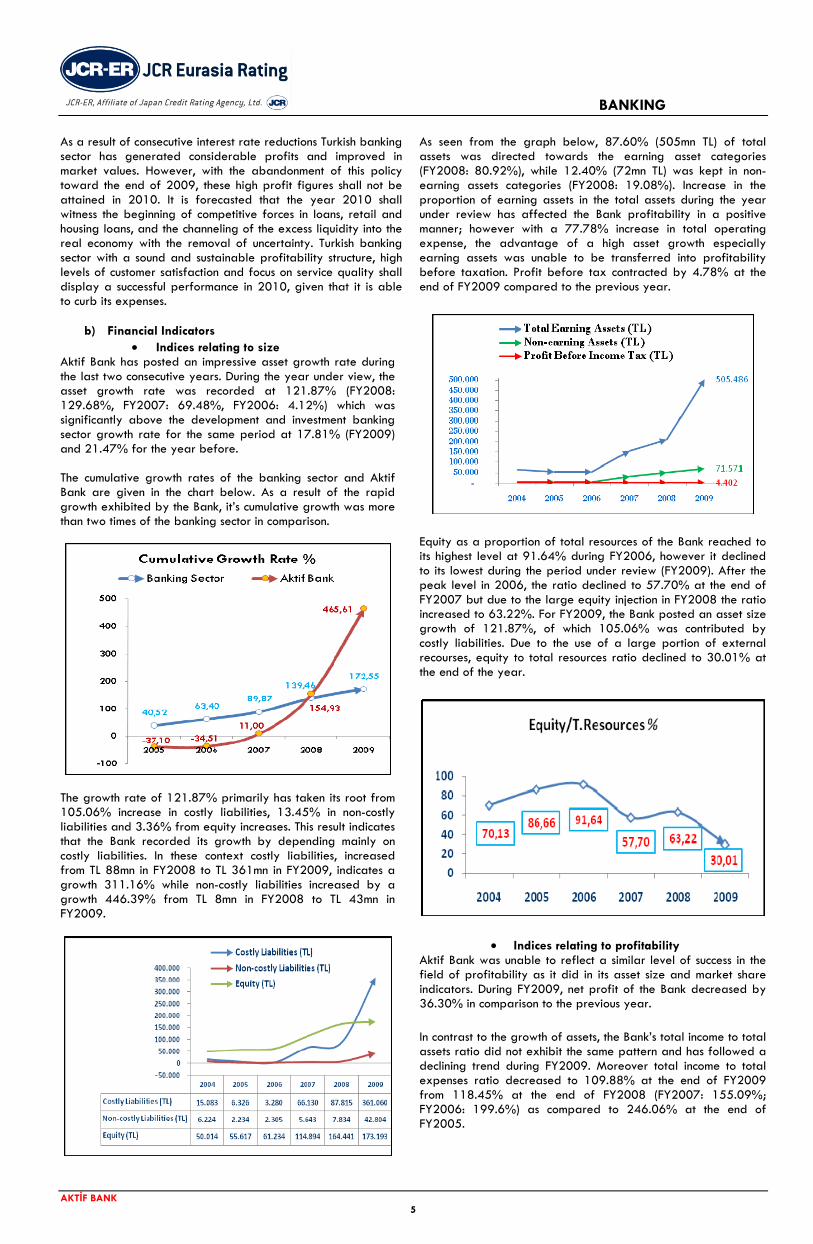
Equity as a proportion of total resources of the Bank reached to its highest level at 91.64% during FY2006, however it declined to its lowest during the period under review (FY2009). After the peak level in 2006, the ratio declined to 57.70% at the end of FY2007 but due to the large equity injection in FY2008 the ratio increased to 63.22%. For FY2009, the Bank posted an asset size growth of 121.87%, of which 105.06% was contributed by costly liabilities. Due to the use of a large portion of external recourses, equity to total resources ratio declined to 30.01% at the end of the year.
• Indices relating to profitability Aktif Bank was unable to reflect a similar level of success in the field of profitability as it did in its asset size and market share indicators. During FY2009, net profit of the Bank decreased by 36.30% in comparison to the previous year. In contrast to the growth of assets, the Bank’s total income to total assets ratio did not exhibit the same pattern and has followed a declining trend during FY2009. Moreover total income to total expenses ratio decreased to 109.88% at the end of FY2009 from 118.45% at the end of FY2008 (FY2007: 155.09%; FY2006: 199.6%) as compared to 246.06% at the end of FY2005.
5
BANKING
AKTİF BANK
Total operating expenses as a proportion of total income has been showing a steady increase over the past five years and reached 91.01% at the end of FY2009 (FY2008: 84.43%; FY2007: 64.23%; FY2006: 50.11%; FY2005: 40.64%). This is above the average market indicator for all mentioned periods, creating a pressure on the profitability of the Bank. This ratio in the development and investment banking sector was 26.22% at the end of FY2009 (FY2008: 27.56% and FY2007: 27.49%).
As seen from the following graph below, between FY2005 and FY2009, the ratio of pre-tax profit to total income steadily decreased and reached a low level 8.99% (FY2008: 15.57%) at the end of the year under review. This ratio was 63.20% for the investment and development banking sector at the end of the same period (FY2008: 63.60%; FY2007: 66.36%). Aktif Bank’s profitability margin is therefore significantly low in comparison to the sector. Furthermore, in the same term the ratio of the entire banking sector was 41.37% (FY2008: 34.81% and FY2007: 43.90%). These figures indicate that the Bank should concentrate on its profitability indicators.
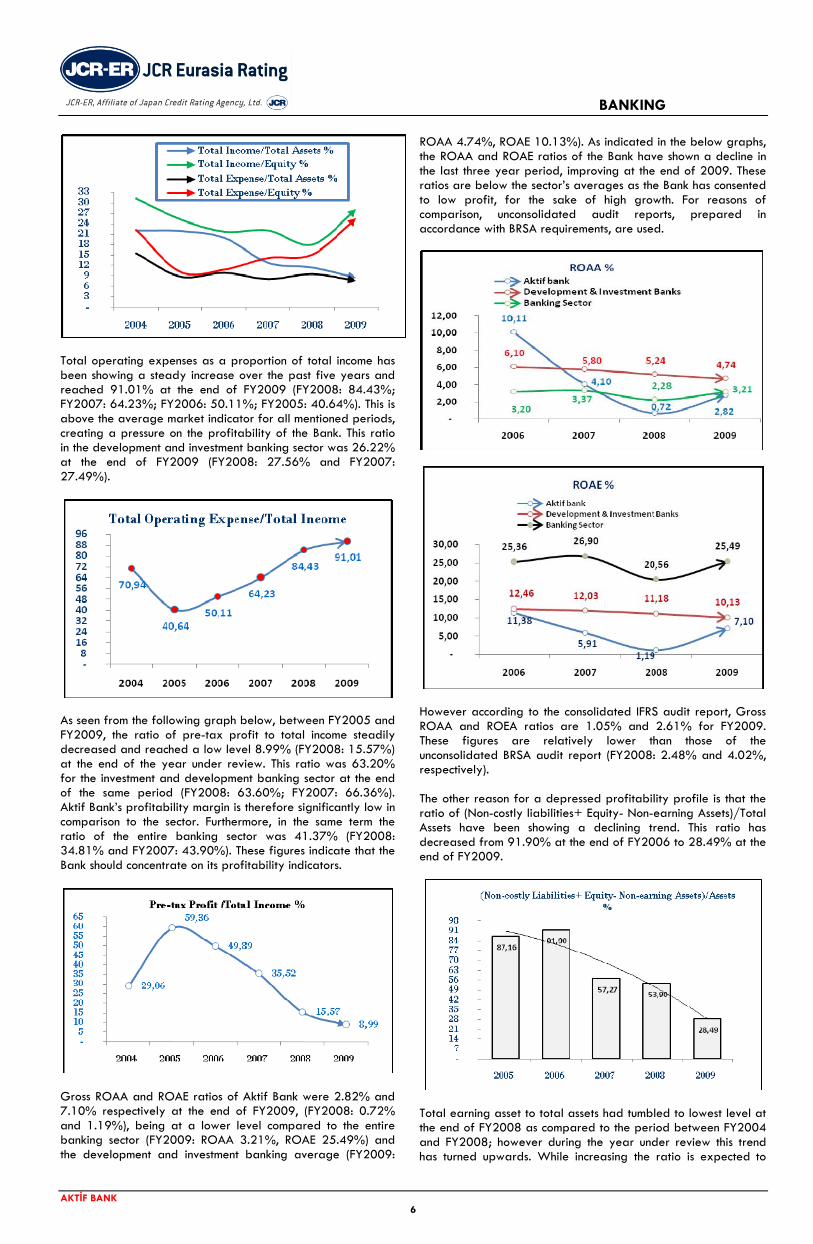
Gross ROAA and ROAE ratios of Aktif Bank were 2.82% and 7.10% respectively at the end of FY2009, (FY2008: 0.72% and 1.19%), being at a lower level compared to the entire banking sector (FY2009: ROAA 3.21%, ROAE 25.49%) and the development and investment banking average (FY2009:
ROAA 4.74%, ROAE 10.13%). As indicated in the below graphs, the ROAA and ROAE ratios of the Bank have shown a decline in the last three year period, improving at the end of 2009. These ratios are below the sector’s averages as the Bank has consented to low profit, for the sake of high growth. For reasons of comparison, unconsolidated audit reports, prepared in accordance with BRSA requirements, are used.
However according to the consolidated IFRS audit report, Gross ROAA and ROEA ratios are 1.05% and 2.61% for FY2009. These figures are relatively lower than those of the unconsolidated BRSA audit report (FY2008: 2.48% and 4.02%, respectively). The other reason for a depressed profitability profile is that the ratio of (Non-costly liabilities+ Equity- Non-earning Assets)/Total Assets have been showing a declining trend. This ratio has decreased from 91.90% at the end of FY2006 to 28.49% at the end of FY2009.
Total earning asset to total assets had tumbled to lowest level at the end of FY2008 as compared to the period between FY2004 and FY2008; however during the year under review this trend has turned upwards. While increasing the ratio is expected to
6
BANKING
AKTİF BANK
affect all profitability ratios positively, due to the significantly increasing operational expenses, the contribution of this ratio to total net profit has remained limited.
Although the Bank should concentrate on increasing its net profit, its FY2010 net profit target have been decreased compared to the result of FY2009. This indicates that the Bank gives crucial importance to asset side growth over profitability. The Bank has targeted an asset size growth of almost 83% in the current year. The Bank recorded a net profit of TL 1.85mn for the three month period ended March 31, 2010, while a net profit of TL 2.36mn during the same period in FY2009. Although this result indicates a decrease of 21.61% in the annual net profit of the Bank, however it is in line with the management targets of FY2010.
6. Risk and Risk Management, Organization The board of directors has overall responsibility for the establishment and supervision of the Bank’s risk management framework. In order to establish a thorough and complete risk management system the Bank has set up following committees. Audit Committee: The Committee was established to assist the Board of Directors in its auditing and supervisory activities. The Audit Committee is made up of two non-executive members of the Board. The Committee submits an ‘Audit Committee Report’ to the Board at least every six months, and describes in detail the results of the internal audit, internal control and risk management systems functioning throughout the Bank. Internal System Group: The ‘Internal System Group’ operates under the Audit Committee, and comprises of the Internal Control, Internal Audit and Risk Management Departments. The Bank’s ‘Internal System Group’ reports directly to the Audit Committee. Credit Committee: The Credit Committee is consisted of CEO and two elected Board Members. The Committee assesses credit applications and opens credit lines.
Asset and Liability Committee: The committee is consisted of seventeen members. The Committee establishes financial policies and strategies required for the management of the Bank’s assets and liabilities, assesses liquidity risk, market risk and capital adequacy and makes decisions to be implemented by department and monitor the practices. The Audit and the Credit Committee has been set up in accordance to the governing legislation.
a) Credit Risk Credit risk is one of the fundamental risks in the banking system. Well managed credit risk is important for promoting secure banking facilities. In this respect, Aktif Bank has developed an internal credit risk assessment system for corporate credits. Internal credit risk assessment system of the
Bank grades loans in 12 categories in the wide range from the highest (AAA) to the lowest (D3). According to the set principle, loans collateralized by cash are reviewed every three years by the credit committee while those in the A rating group (AAA, AA, A) are reviewed once every year. Those categorized in the B group (BBB, BB, B) are re-evaluated once every 9 months and those in the C group (CCC, CC, C) once every 6 months. The management is however empowered to change these reviewing periods. On the other hand, as stated in the unconsolidated audit report, which has been submitted to Banking Regulation and Supervisory Authority (BRSA), the Bank has graded all cash loans and non-cash loans in three category; low risk, medium risk and high risk. The Bank rated 76.78% of its outstanding cash loans as low risk (FY2008: 56.18%) and 23.05% at medium risk (FY2008: 43.09%). The low risk category loans increased by 236.43% during FY2009 as compared the year before while during the same period the total loan portfolio increased by only 146.16%. The Banks internal grading system has not been approved by BRSA and also not obtained validation from any other authorized independent institution. The Bank’s cash loans directly or indirectly granted to the main shareholding group (Çalık Group) during FY2009 increased to 63.05% from 18.11% at the end of the previous year. However, during the same period the non-cash loans granted to Çalık group slightly decreased to 43.76% from 45.19%. Furthermore the Bank has made investments in a bond issued by Çalık Holding amounting to 18.44mn TL, which is composed of about 3.19% of the Bank’s total asset. Due to big portion of the Bank’s assets granted to the group’s firm, even if these credits are assumed to have no repayment risk, it will in any case curtail the Bank’s ability to expand its customer portfolio. Also this loan portfolio composition limits the increase in the impaired loans of the Bank. Total cash loan portfolio of Aktif Bank expanded by 152.80% while non-cash loans increased by 40.87% in TL basis during FY2009. The loans were much better distributed during FY2009 when compared to the previous year. At the end of FY2008, 70% of the total loans were allocated only to the manufacturing sector. In FY2009, the distribution of the loans are 24% to construction, 23% to financial institutions, 23% to manufacturing, 16% to transportation & communication and 14% to others. However the cash loans granted to the top 15 customers made up 91% of the total cash loans. For the non cash loans this figure is 73%. As can be seen from the below chart, net loans and leases as a proportion of total assets increased to 48.62% at the end of FY2009, as compared to 40.96% at the end of the year before. Nearly all loans were allocated to corporate clients. Second highest portion of the asset were securities that increased from 4.28% at the end of FY2005 to 21.75% at the end of FY2009.
7
BANKING
AKTİF BANK
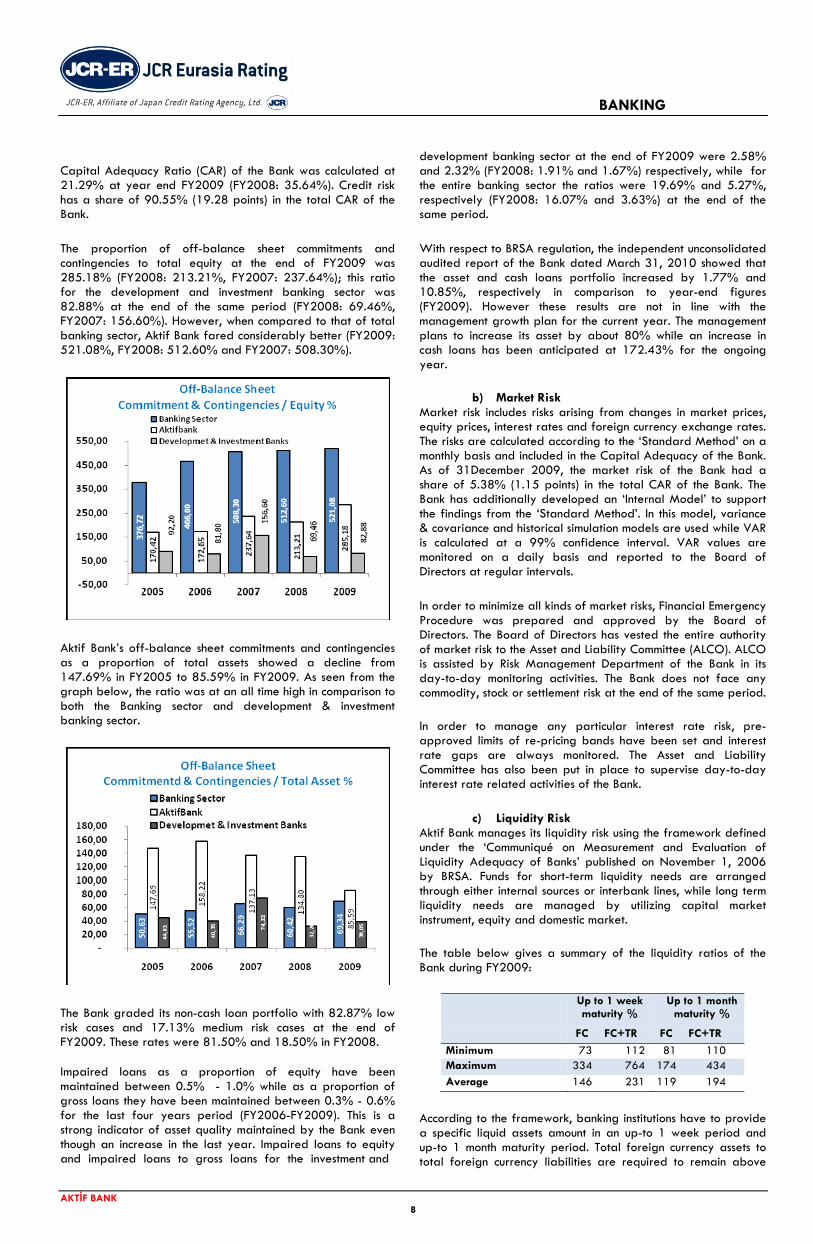
Capital Adequacy Ratio (CAR) of the Bank was calculated at 21.29% at year end FY2009 (FY2008: 35.64%). Credit risk has a share of 90.55% (19.28 points) in the total CAR of the Bank. The proportion of off-balance sheet commitments and contingencies to total equity at the end of FY2009 was 285.18% (FY2008: 213.21%, FY2007: 237.64%); this ratio for the development and investment banking sector was 82.88% at the end of the same period (FY2008: 69.46%, FY2007: 156.60%). However, when compared to that of total banking sector, Aktif Bank fared considerably better (FY2009: 521.08%, FY2008: 512.60% and FY2007: 508.30%).
Aktif Bank’s off-balance sheet commitments and contingencies as a proportion of total assets showed a decline from 147.69% in FY2005 to 85.59% in FY2009. As seen from the graph below, the ratio was at an all time high in comparison to both the Banking sector and development & investment banking sector.
8
The Bank graded its non-cash loan portfolio with 82.87% low risk cases and 17.13% medium risk cases at the end of FY2009. These rates were 81.50% and 18.50% in FY2008. Impaired loans as a proportion of equity have been maintained between 0.5% - 1.0% while as a proportion of gross loans they have been maintained between 0.3% - 0.6% for the last four years period (FY2006-FY2009). This is a strong indicator of asset quality maintained by the Bank even though an increase in the last year. Impaired loans to equity and impaired loans to gross loans for the investment and
development banking sector at the end of FY2009 were 2.58% and 2.32% (FY2008: 1.91% and 1.67%) respectively, while for the entire banking sector the ratios were 19.69% and 5.27%, respectively (FY2008: 16.07% and 3.63%) at the end of the same period. With respect to BRSA regulation, the independent unconsolidated audited report of the Bank dated March 31, 2010 showed that the asset and cash loans portfolio increased by 1.77% and 10.85%, respectively in comparison to year-end figures (FY2009). However these results are not in line with the management growth plan for the current year. The management plans to increase its asset by about 80% while an increase in cash loans has been anticipated at 172.43% for the ongoing year.
b) Market Risk Market risk includes risks arising from changes in market prices, equity prices, interest rates and foreign currency exchange rates. The risks are calculated according to the ‘Standard Method’ on a monthly basis and included in the Capital Adequacy of the Bank. As of 31December 2009, the market risk of the Bank had a share of 5.38% (1.15 points) in the total CAR of the Bank. The Bank has additionally developed an ‘Internal Model’ to support the findings from the ‘Standard Method’. In this model, variance & covariance and historical simulation models are used while VAR is calculated at a 99% confidence interval. VAR values are monitored on a daily basis and reported to the Board of Directors at regular intervals. In order to minimize all kinds of market risks, Financial Emergency Procedure was prepared and approved by the Board of Directors. The Board of Directors has vested the entire authority of market risk to the Asset and Liability Committee (ALCO). ALCO is assisted by Risk Management Department of the Bank in its day-to-day monitoring activities. The Bank does not face any commodity, stock or settlement risk at the end of the same period. In order to manage any particular interest rate risk, pre-approved limits of re-pricing bands have been set and interest rate gaps are always monitored. The Asset and Liability Committee has also been put in place to supervise day-to-day interest rate related activities of the Bank.
c) Liquidity Risk Aktif Bank manages its liquidity risk using the framework defined under the ‘Communiqué on Measurement and Evaluation of Liquidity Adequacy of Banks’ published on November 1, 2006 by BRSA. Funds for short-term liquidity needs are arranged through either internal sources or interbank lines, while long term liquidity needs are managed by utilizing capital market instrument, equity and domestic market.
The table below gives a summary of the liquidity ratios of the Bank during FY2009:
Up to 1 week maturity %
Up to 1 month maturity %
FC FC+TR FC FC+TR Minimum 73 112 81 110 Maximum 334 764 174 434 Average 146 231 119 194
According to the framework, banking institutions have to provide a specific liquid assets amount in an up-to 1 week period and up-to 1 month maturity period. Total foreign currency assets to total foreign currency liabilities are required to remain above

BANKING
AKTİF BANK
80% during all periods while Total TL and FC Assets to Total TL and FC Liabilities need to remain above 100% at all times. The Bank’s FC liquidity ratio in up-to 1 week period had fallen only in January 2009 under the minimum level of liquidity as set out in accordance with the regulation. Once the Bank rectified this adequacy ratio, it has managed to maintain a level of liquidity far in access of the minimum required.
d) Operational Risk The Bank calculates the amount of capital required to cover operational risk through the ‘Basic Indicator Approach’ according to the ‘Communiqué on Measurement and Evaluation of Liquidity Adequacy of Banks’. This takes into account the gross income of the Bank for the previous three years. Operational risk had a share of 4.07% at the end of FY2009 (0.87 points) in the total CAR of the Bank. The Bank seeks to minimize operational risk and its potential impact by strictly implementing the human resources, network security, back up and disaster recovery policies. The Bank has additionally set-up an ‘Internal Systems Group’ to ensure that the activities of the Bank remain within the framework of the designated banking laws. During the year 2009, the Bank had to pay a total of TL 29,000 in fines for the initiation of certain operational risks.
e) Asset Quality The Bank’s impaired loans as a proportion of its equity and impaired loans to gross loans ratios are well below the average of the investment and development banking sector. This indicates that the Bank has been able to maintain strong asset quality and also reflects the successful risk management system of the Bank. Non-performing loans as a proportion of total gross outstanding loans and non-performing loans as a proportion of equity rose to 0.62% and 1.01% over the year under review from 0.42% and 0.27% at the end of the year 2008, respectively. The Bank granted a large proportion of both its cash and non-cash loans portfolio to group firms allowing for relatively low level of non-performing loans. The Bank’s internal credit rating system also confirms this view. When the ratings of the group’s firms are excluded, the ratings given by the Bank are concentrated in the “C” grade that indicates weak ratings as already discussed previously in the report.
Total earning assets to total assets ratio increased to 87.60% from 80.92%, while non-earning assets to total assets ratio decreased to 12.40% from 19.08%. Due to increase in the share of earning asset, the profit generating capacity of the Bank is expected to increase in FY2010.
Under different points of views, the table below indicates that total earning-assets increased by 140.18% at the end of FY2009 as compared to the previous year, while non-earning assets increased by 44.20% during the same period.
f) Funding and Adequacy of Capital As the Bank is not entitled to collect customer deposits, its funding sources are restricted to its own equity base, loans from domestic & international institutions and debt securities issues (Aktif Bonds), current balances of its loan customer as well as obligations under repurchase agreement.
As seen from the chart above, current balances of loan customers comprise the second largest share (22%) of the Bank’s total resources after its equity share (30%). Funds borrowed from other banking organizations are the third largest fund sources as foreign currency funds borrowed from domestic and international banks accounted for 97.74% of the Bank’s total borrowed funds at the end of FY2009 (FY2008: 96.78%). Nearly all of the domestic and international loans have been deployed on short term basis, which means that the Bank may faces loan renewal risk on the short term horizon. However 87.16% of the customer loans are granted in the less than 3 month maturity bucket and the Bank easily matches its obligation
9
BANKING
AKTİF BANK
due to compliance with its loans. Nevertheless, it is believed that this situation does not pose any meaningful risk to the operations of the Bank, given its asset quality and equity base.
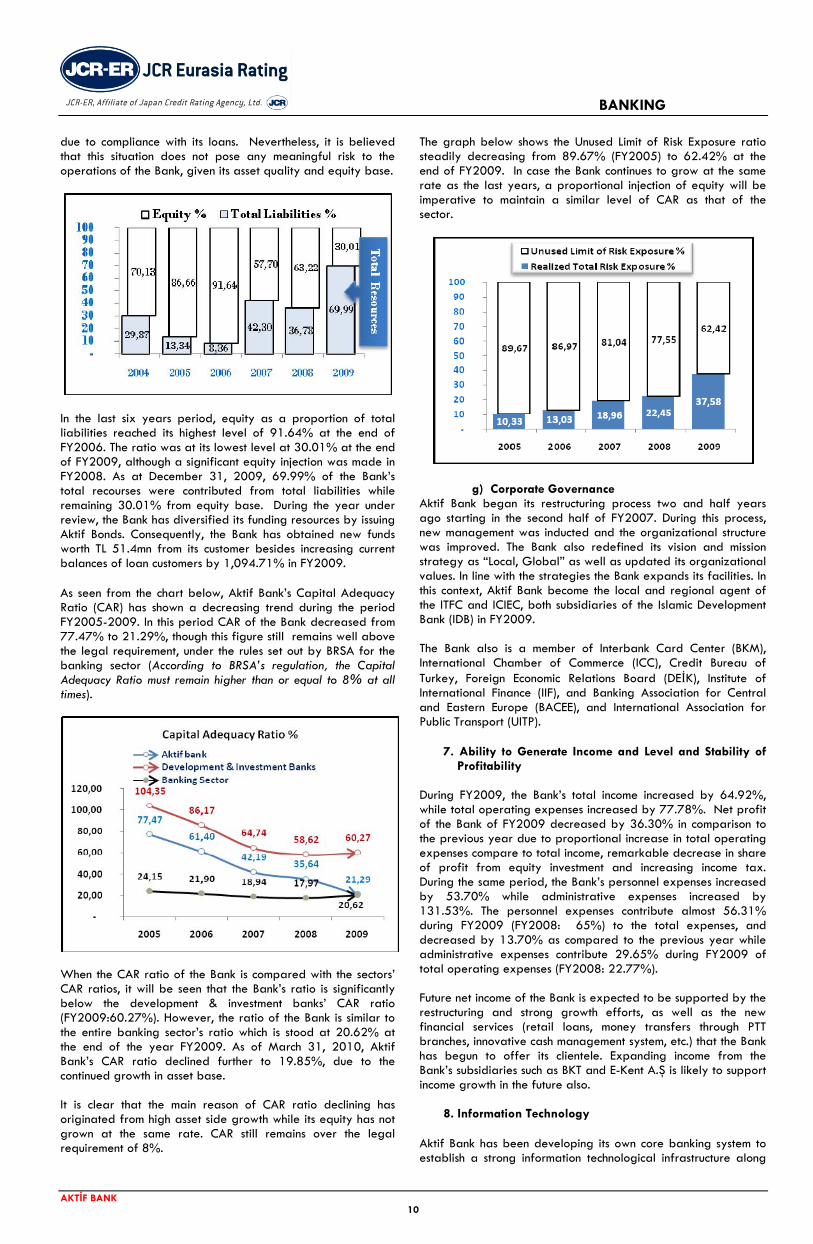
In the last six years period, equity as a proportion of total liabilities reached its highest level of 91.64% at the end of FY2006. The ratio was at its lowest level at 30.01% at the end of FY2009, although a significant equity injection was made in FY2008. As at December 31, 2009, 69.99% of the Bank’s total recourses were contributed from total liabilities while remaining 30.01% from equity base. During the year under review, the Bank has diversified its funding resources by issuing Aktif Bonds. Consequently, the Bank has obtained new funds worth TL 51.4mn from its customer besides increasing current balances of loan customers by 1,094.71% in FY2009. As seen from the chart below, Aktif Bank’s Capital Adequacy Ratio (CAR) has shown a decreasing trend during the period FY2005-2009. In this period CAR of the Bank decreased from 77.47% to 21.29%, though this figure still remains well above the legal requirement, under the rules set out by BRSA for the banking sector (According to BRSA’s regulation, the Capital Adequacy Ratio must remain higher than or equal to 8% at all times).
When the CAR ratio of the Bank is compared with the sectors’ CAR ratios, it will be seen that the Bank’s ratio is significantly below the development & investment banks’ CAR ratio (FY2009:60.27%). However, the ratio of the Bank is similar to the entire banking sector’s ratio which is stood at 20.62% at the end of the year FY2009. As of March 31, 2010, Aktif Bank’s CAR ratio declined further to 19.85%, due to the continued growth in asset base. It is clear that the main reason of CAR ratio declining has originated from high asset side growth while its equity has not grown at the same rate. CAR still remains over the legal requirement of 8%.
The graph below shows the Unused Limit of Risk Exposure ratio steadily decreasing from 89.67% (FY2005) to 62.42% at the end of FY2009. In case the Bank continues to grow at the same rate as the last years, a proportional injection of equity will be imperative to maintain a similar level of CAR as that of the sector.
g) Corporate Governance
Aktif Bank began its restructuring process two and half years ago starting in the second half of FY2007. During this process, new management was inducted and the organizational structure was improved. The Bank also redefined its vision and mission strategy as “Local, Global” as well as updated its organizational values. In line with the strategies the Bank expands its facilities. In this context, Aktif Bank become the local and regional agent of the ITFC and ICIEC, both subsidiaries of the Islamic Development Bank (IDB) in FY2009. The Bank also is a member of Interbank Card Center (BKM), International Chamber of Commerce (ICC), Credit Bureau of Turkey, Foreign Economic Relations Board (DEİK), Institute of International Finance (IIF), and Banking Association for Central and Eastern Europe (BACEE), and International Association for Public Transport (UITP).
7. Ability to Generate Income and Level and Stability of Profitability
During FY2009, the Bank’s total income increased by 64.92%, while total operating expenses increased by 77.78%. Net profit of the Bank of FY2009 decreased by 36.30% in comparison to the previous year due to proportional increase in total operating expenses compare to total income, remarkable decrease in share of profit from equity investment and increasing income tax. During the same period, the Bank’s personnel expenses increased by 53.70% while administrative expenses increased by 131.53%. The personnel expenses contribute almost 56.31% during FY2009 (FY2008: 65%) to the total expenses, and decreased by 13.70% as compared to the previous year while administrative expenses contribute 29.65% during FY2009 of total operating expenses (FY2008: 22.77%). Future net income of the Bank is expected to be supported by the restructuring and strong growth efforts, as well as the new financial services (retail loans, money transfers through PTT branches, innovative cash management system, etc.) that the Bank has begun to offer its clientele. Expanding income from the Bank’s subsidiaries such as BKT and E-Kent A.Ş is likely to support income growth in the future also.
8. Information Technology Aktif Bank has been developing its own core banking system to establish a strong information technological infrastructure along
10
BANKING
AKTİF BANK
11
with purchasing all necessary operational modules. The Bank gives crucial importance to research & development activities in line with its strategy of “bringing innovation to the sector”. In this scope some of the applications are listed; the “Chip Application” was developed for card payment system, “Aktif Nokta“ (Kiosk) machines were designed and made ready for use, the AKS (Aktif Card System) was designed, the Individual Loan NBSM Integration (credit factory) was built. The Bank has brought internet banking, mobile banking and call centers into services during the year 2009. In addition to electronic channel services, to respond for the customer’s needs Alternative Delivery Channels (ADC) have also been setup. In this context, Aktif Bank put into service the Cheap Money Transfer (UPT) system which allows nationwide money transfer to nearly all location of Turkey through the 4,000 online PTT branches. Also the Bank has activated “KreAktif” in August 2009, which offers online and instant loans through the dealers. Furthermore the Bank also joined the E-Pledge system and applied for the E-Tender system within the scope of E-Government services. Aktif Bank's IT hot site is located in Gebze, which is an area situated approximately thirty minutes drive from the headquarters and copies data on real time basis. In the event of any local disaster (such as hardware malfunctioning, fire, prolonged power failure, terrorist attacks, and/or communication failure), this site will enable top management and senior staff to continue their work without any disturbance. The off-site disaster recovery center is located in Ankara. This site has been set-up in case any major natural disaster takes place in Istanbul; data is also copied on real time basis at this site. The Bank has outsourced Cash Transportation Services, Archiving Services, Document Collection and Document Delivery Services, Call Center Software Development and System Maintenance Services, Factoring and Receivables Management System Services, Management of Securities System Services.

BANKING
AKTİF BANK
12
AKTİFBANK FYE2009 FYE2009 FYE2009 FYE2008 FYE2008 FYE2007 FYE2007 2006
As % of Assets Growth % BALANCE SHEET USD TL TL TL TL TL TL TL
ASSETS (000) (Converted) (Original) (Average) (Original) (Average) (Original) (Average) (Original) 2009 2008 2007 2009 2008 2007 A-TOTAL EARNING ASSETS (I+II+III) 335,715 505,486 357,972 210,458 154,862 99,266 77,467 55,668 87.60 80.92 87.66 140.18 112.01 78.32
I- LOANS AND LEASING RECEIVABLES (NET) 186,323 280,546 193,535 106,523 91,160 75,796 60,543 45,290 48.62 40.96 66.93 163.37 40.54 67.36
a) Short Term Loans 180,584 271,906 188,540 105,174 90,181 75,188 59,470 43,751 47.12 40.44 66.40 158.53 39.88 71.85
b) Lease Assets 4,831 7,274 3,812 349 479 608 1,074 1,539 1.26 0.13 0.54 1,984.24 -42.60 -60.49
c) Medium & Long Term Loans - - - - - - - - n.a. n.a. n.a. n.a. n.a. n.a.
d) Over Due Loan 1,165 1,754 1,102 450 380 310 310 310 0.30 0.17 0.27 289.78 45.16 0.00
e) Receivable from Customer Due to Brokerage Activities 907 1,366 1,214 1,062 531 - - - 0.24 0.41 n.a. 28.63 n.a. n.a.
f) Allowance for Loan Losses (-) -1,165 -1,754 -1,133 -512 -411 -310 -310 -310 -0.30 -0.20 -0.27 242.58 65.16 0.00
II-OTHER EARNING ASSESTS 66,044 99,442 76,163 52,884 37,925 22,965 16,299 9,632 17.23 20.33 20.28 88.04 130.28 138.42
a) Balance With Banks-Time Deposits 42,865 64,542 56,265 47,987 34,517 21,046 15,211 9,375 11.18 18.45 18.58 34.50 128.01 124.49
b) Money Market Placements 17,603 26,505 13,253 - 650 1,300 650 - 4.59 n.a. 1.15 n.a. -100.00 n.a.
c) Reserve Deposits at CB 5,575 8,395 6,646 4,897 2,758 619 438 257 1.45 1.88 0.55 71.43 691.11 140.86
d) Balance With CB- Demand Deposits - - - - - - - - n.a. n.a. n.a. n.a. n.a. n.a.
III-SECURITIES AT FAIR VALUE THROUGH P/L 83,349 125,498 88,275 51,051 25,778 505 626 746 21.75 19.63 0.45 145.83 10,009.11 -32.31
a) Treasury Bills and Government Bonds 71,104 107,061 71,466 35,871 18,169 467 607 746 18.55 13.79 0.41 198.46 7,581.16 -37.40
b) Other Investment 12,245 18,437 16,809 15,180 7,609 38 19 - 3.20 5.84 0.03 21.46 39,847.37 n.a.
c) Repurchase Agreement - - - - - - - - n.a. n.a. n.a. n.a. n.a. n.a.
B- INVESTMENTS IN ASSOCIATES (NET)+EQUITY SHARE 13,255 19,958 18,750 17,542 13,785 10,028 9,524 9,020 3.46 6.74 8.86 13.77 74.93 11.18
a) Investments in Associates (Net) 13,255 19,958 18,750 17,542 13,785 10,028 9,524 9,020 3.46 6.74 8.86 13.77 74.93 11.18
b) Equity Share - - - - - - - - n.a. n.a. n.a. n.a. n.a. n.a.
C-NON-EARNING ASSETS 34,278 51,613 41,852 32,090 18,019 3,948 3,040 2,131 8.94 12.34 3.49 60.84 712.82 85.27
a) Cash and Cash Equivalents 1,026 1,545 1,171 797 506 214 107 - 0.27 0.31 0.19 93.85 272.43 n.a.
b) Balance With Banks-Current Accounts 5,524 8,317 6,980 5,643 3,040 436 581 725 1.44 2.17 0.39 47.39 1,194.27 -39.86
c) Other 27,729 41,751 33,701 25,650 14,474 3,298 2,352 1,406 7.24 9.86 2.91 62.77 677.74 134.57
ea- Intangible Assets 14,512 21,850 19,827 17,803 9,087 371 228 84 3.79 6.84 0.33 22.73 4,698.65 341.67
eb- Property and Equipment 9,329 14,047 8,310 2,572 1,583 593 707 821 2.43 0.99 0.52 446.15 333.73 -27.77
ec- Deferred Tax - - 115 230 115 - 16 31 n.a. 0.09 n.a. -100.00 n.a. -100.00
ed- Other 3,888 5,854 5,450 5,045 3,690 2,334 1,402 470 1.01 1.94 2.06 16.04 116.15 396.60
TOTAL ASSETS (A + B + C) 383,248 577,057 418,574 260,090 186,666 113,242 90,031 66,819 100.00 100.00 100.00 121.87 129.68 69.48
USD/TL 1.5057 1.5180 1.1685
BANKING
AKTİF BANK
13
AKTİFBANK FYE2009 FYE2009 FYE2009 FYE2008 FYE2008 FYE2007 FYE2007 2006
As % of Assets Growth % BALANCE SHEET USD TL TL TL TL TL TL TL
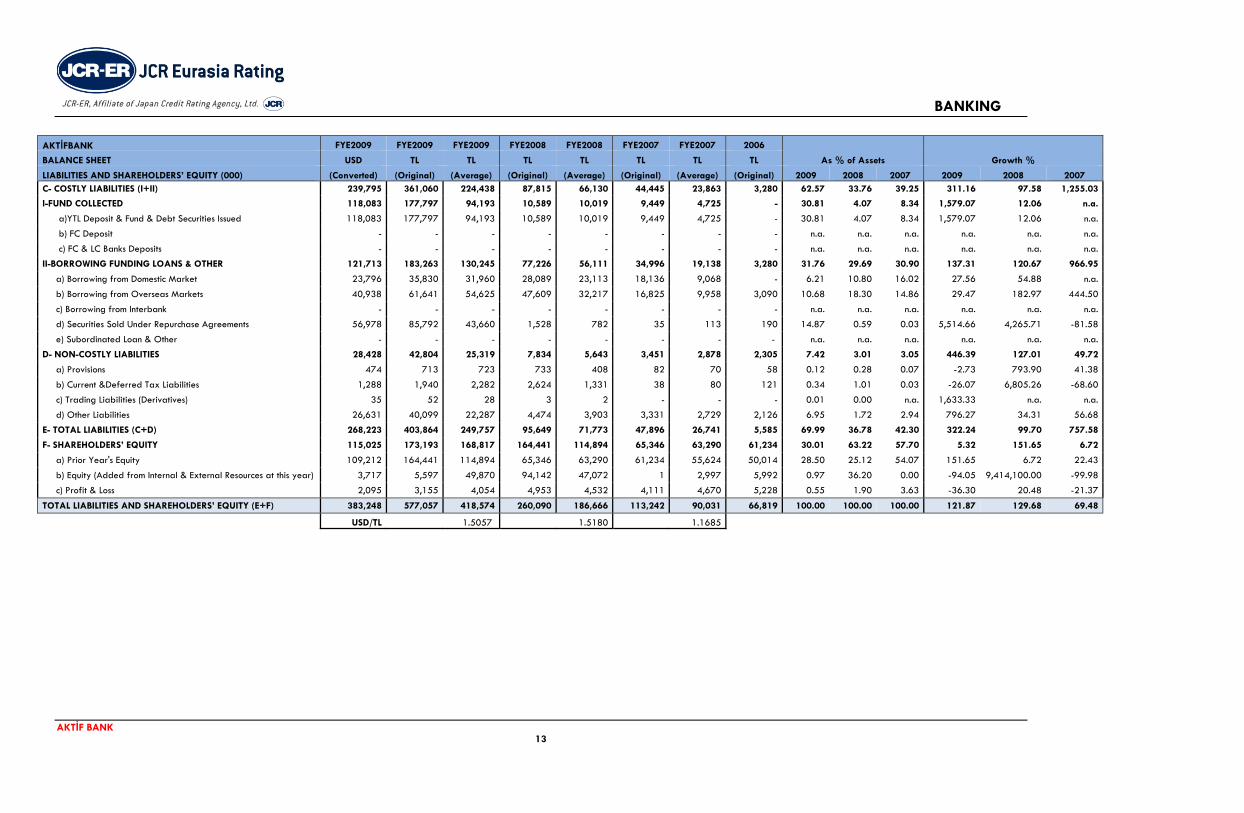
LIABILITIES AND SHAREHOLDERS’ EQUITY (000) (Converted) (Original) (Average) (Original) (Average) (Original) (Average) (Original) 2009 2008 2007 2009 2008 2007 C- COSTLY LIABILITIES (I+II) 239,795 361,060 224,438 87,815 66,130 44,445 23,863 3,280 62.57 33.76 39.25 311.16 97.58 1,255.03
I-FUND COLLECTED 118,083 177,797 94,193 10,589 10,019 9,449 4,725 - 30.81 4.07 8.34 1,579.07 12.06 n.a.
a)YTL Deposit & Fund & Debt Securities Issued 118,083 177,797 94,193 10,589 10,019 9,449 4,725 - 30.81 4.07 8.34 1,579.07 12.06 n.a.
b) FC Deposit - - - - - - - - n.a. n.a. n.a. n.a. n.a. n.a.
c) FC & LC Banks Deposits - - - - - - - - n.a. n.a. n.a. n.a. n.a. n.a.
II-BORROWING FUNDING LOANS & OTHER 121,713 183,263 130,245 77,226 56,111 34,996 19,138 3,280 31.76 29.69 30.90 137.31 120.67 966.95
a) Borrowing from Domestic Market 23,796 35,830 31,960 28,089 23,113 18,136 9,068 - 6.21 10.80 16.02 27.56 54.88 n.a.
b) Borrowing from Overseas Markets 40,938 61,641 54,625 47,609 32,217 16,825 9,958 3,090 10.68 18.30 14.86 29.47 182.97 444.50
c) Borrowing from Interbank - - - - - - - - n.a. n.a. n.a. n.a. n.a. n.a.
d) Securities Sold Under Repurchase Agreements 56,978 85,792 43,660 1,528 782 35 113 190 14.87 0.59 0.03 5,514.66 4,265.71 -81.58
e) Subordinated Loan & Other - - - - - - - - n.a. n.a. n.a. n.a. n.a. n.a.
D- NON-COSTLY LIABILITIES 28,428 42,804 25,319 7,834 5,643 3,451 2,878 2,305 7.42 3.01 3.05 446.39 127.01 49.72
a) Provisions 474 713 723 733 408 82 70 58 0.12 0.28 0.07 -2.73 793.90 41.38
b) Current &Deferred Tax Liabilities 1,288 1,940 2,282 2,624 1,331 38 80 121 0.34 1.01 0.03 -26.07 6,805.26 -68.60
c) Trading Liabilities (Derivatives) 35 52 28 3 2 - - - 0.01 0.00 n.a. 1,633.33 n.a. n.a.
d) Other Liabilities 26,631 40,099 22,287 4,474 3,903 3,331 2,729 2,126 6.95 1.72 2.94 796.27 34.31 56.68
E- TOTAL LIABILITIES (C+D) 268,223 403,864 249,757 95,649 71,773 47,896 26,741 5,585 69.99 36.78 42.30 322.24 99.70 757.58
F- SHAREHOLDERS’ EQUITY 115,025 173,193 168,817 164,441 114,894 65,346 63,290 61,234 30.01 63.22 57.70 5.32 151.65 6.72
a) Prior Year's Equity 109,212 164,441 114,894 65,346 63,290 61,234 55,624 50,014 28.50 25.12 54.07 151.65 6.72 22.43
b) Equity (Added from Internal & External Resources at this year) 3,717 5,597 49,870 94,142 47,072 1 2,997 5,992 0.97 36.20 0.00 -94.05 9,414,100.00 -99.98
c) Profit & Loss 2,095 3,155 4,054 4,953 4,532 4,111 4,670 5,228 0.55 1.90 3.63 -36.30 20.48 -21.37
TOTAL LIABILITIES AND SHAREHOLDERS’ EQUITY (E+F) 383,248 577,057 418,574 260,090 186,666 113,242 90,031 66,819 100.00 100.00 100.00 121.87 129.68 69.48
USD/TL 1.5057 1.5180 1.1685
BANKING
AKTİF BANK
14
AKTİFBANK
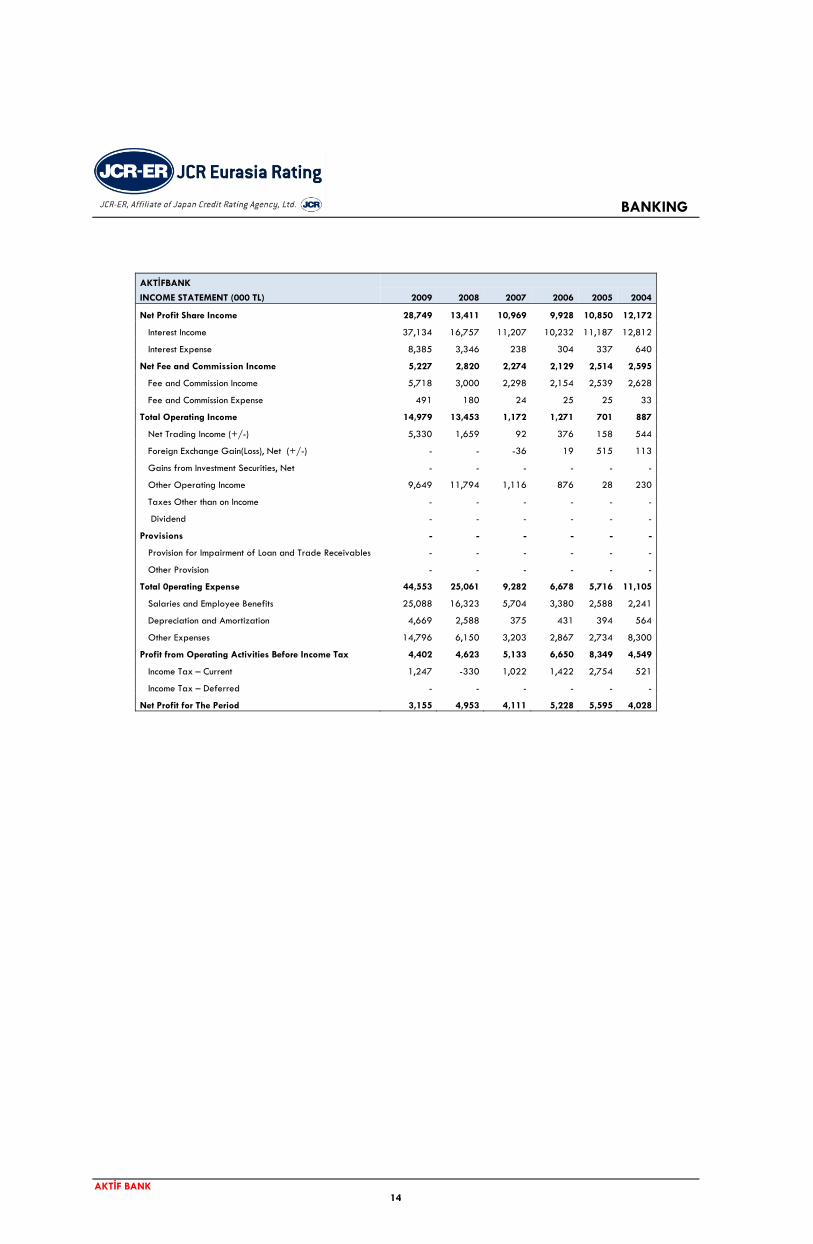
INCOME STATEMENT (000 TL) 2009 2008 2007 2006 2005 2004
Net Profit Share Income 28,749 13,411 10,969 9,928 10,850 12,172
Interest Income 37,134 16,757 11,207 10,232 11,187 12,812
Interest Expense 8,385 3,346 238 304 337 640
Net Fee and Commission Income 5,227 2,820 2,274 2,129 2,514 2,595
Fee and Commission Income 5,718 3,000 2,298 2,154 2,539 2,628
Fee and Commission Expense 491 180 24 25 25 33
Total Operating Income 14,979 13,453 1,172 1,271 701 887
Net Trading Income (+/-) 5,330 1,659 92 376 158 544
Foreign Exchange Gain(Loss), Net (+/-) - - -36 19 515 113
Gains from Investment Securities, Net - - - - - -
Other Operating Income 9,649 11,794 1,116 876 28 230
Taxes Other than on Income - - - - - -
Dividend - - - - - -
Provisions - - - - - -
Provision for Impairment of Loan and Trade Receivables - - - - - -
Other Provision - - - - - -
Total 0perating Expense 44,553 25,061 9,282 6,678 5,716 11,105
Salaries and Employee Benefits 25,088 16,323 5,704 3,380 2,588 2,241
Depreciation and Amortization 4,669 2,588 375 431 394 564
Other Expenses 14,796 6,150 3,203 2,867 2,734 8,300
Profit from Operating Activities Before Income Tax 4,402 4,623 5,133 6,650 8,349 4,549
Income Tax – Current 1,247 -330 1,022 1,422 2,754 521
Income Tax – Deferred - - - - - -
Net Profit for The Period 3,155 4,953 4,111 5,228 5,595 4,028

BANKING
AKTİF BANK
15
AKTİF BANK FINANCIAL RATIOS (%) 2009 2008 2007
I. PROFITABILITY & PERFORMANCE
1. ROA - Pre-Tax Profit / Total Assets (avg.) 1.05 2.48 5.70
2. ROE- Pre-Tax Profit/Equity (avg.) 2.61 4.02 8.11
3. Total Income/Equity (avg.) 29.00 25.84 22.83
4. Total Income /Total Assets (avg.) 11.70 15.90 16.05
5. Provision/Total Income 0.00 0.00 0.00
6. (Total Expense/Total Liabilities (avg.) 10.64 13.43 10.35
7.Net Profit for The Period/Total Assets (avg.) 0.75 2.65 4.57
8.Total Income/ Total Expense 109.88 118.45 155.09
9.(Non-Costly Liabilities + Equity – Non-Earning Assets)/Assets 28.49 53.90 57.27
10.(Non-Costly Liabilities - Non-Earning Assets)/Assets -1.53 -9.33 -0.44
11.Total Operating Expense/Total Income 91.01 84.43 64.23
12. Interest Margin 8.03 8.66 14.16
13. Operating ROAA = Operating Net Income/Assets (avg.) 3.05 4.27 5.97
14. Operating ROAE = Operating Net Income/Equity Capital (avg.) 7.57 6.94 8.49
15. Interest Coverage (EBIT)/Interest Expense) 152.50 238.16 2.256.72
16. Net Profit Margin 6.44 16.69 28.45
17. Gross Profit Margin 8.99 15.57 35.52
II. CAPITAL ADEQUACY
1. Equity Generation/Prior Year’s Equity 3.40 144.07 0.00
2. Internal Equity Generation/Prior Year’s Equity 1.92 7.58 6.71
3. Equity/Total Assets 30.01 63.22 57.70
4. Core Capital/Total Assets 27.30 60.95 55.56
5. Supplementary Capital/Total Assets 0.98 0.69 0.76
6. Tier 3/Total Assets 0.00 0.00 0.00
7. Capital/Total Assets 28.27 61.64 56.33
8. Own Fund/Total Assets 25.50 56.13 48.06
9. Standard Capital Adequacy Ratio 21.29 35.64 42.19
10. Surplus Own Fund % 62.42 77.55 81.04
11. Free Equity/Total Assets 20.33 48.65 48.00
III. LIQUIDITY
1. Liquidity Management Success (On Demand) 97.74 98.55 97.06
2. Liquidity Management Success (Up to 1 Month) 87.85 84.99 77.86
3. Liquidity Management Success (1to 3 Months) 95.23 93.24 95.88
4. Liquidity Management Success ( 3to 6 Months ) 97.35 97.28 99.61
5. Liquidity Management Success (6 to 12 Months) 97.36 90.18 99.85
6. Liquidity Management Success (Over 1 Year & Unallocated) 75.53 72.58 76.14
IV. ASSET QUALITY
1. Loan Loss Provisions/Total Loans 0.62 0.48 0.41
2. Total Provisions/Profit Before Provision and Tax 0.00 0.00 0.00
3. Impaired Loans/Gross Loans 0.62 0.42 0.41
4. Impaired Loans/Equity % 1.01 0.27 0.47
5. Loan Loss Reserves/Impaired Loans 100.00 113.78 100.00
V. OTHER
1.Assets / (Total Guarantees and Commitments + Assets) 53.88 42.59 42.17
2.Equity/(Total Guarantees and Commitments + Equity) 25.96 31.93 29.62
3.Own Fund/(Total Guarantees and Commitments + Own Fund) 22.96 29.40 25.95
4.Total Foreign Currency Position/Assets 0.44 0.25 0.16
5.Total Foreign Currency Position/Equity 1.48 0.40 0.27
6.Total Foreign Currency Position/Own Equity 1.74 0.45 0.33
7.Market Share 0.07 0.04 0.02
8.Growing Rate 121.87 129.68 69.48