Embed Size (px)
Citation preview

pp 12-43
12 | P a g e
Journal of Corporate Governance, Insurance, and Risk Management (JCGIRM) 2020, Volume 1, Series 1
Corporate Accruals Practices of Listed Companies in Bangladesh**
Md. Shamimul Hasan1*, Rashidah Abdul Rahman1, Syed Zabid Hossain2 1Accounting Research Institute, University Teknologi MARA, Shah Alam, Malaysia 2Department of Accounting and Information Systems, University of Rajshahi, Bangladesh A B S T R A C T A R T I C L E I N F O Corporate accounting scandal is not a new phenomenon and it is the outcome of corporate accruals i.e., accruals by management choice. This study investigated the use of corporate accruals in the financial statements of the listed companies in Dhaka Stock Exchange (DSE) through segregating total accruals into corporate (discretionary) and accounting (non-discretionary) accruals. The average rate of corporate accruals was 35 percent and in many cases, cash flow from operation exceeded the net income, the growth in accounts receivable was faster than sales growth, and inventory growth was not consistent with sales growth. In this context, this study may create awareness of the risk factors of corporate accruals among external users’ of accounting information especially analysts, regulator, policy makers, existing and potential shareholders, lenders, trade creditors, external auditors, researchers, financial advisors, and stock brokers. Consequently, it may reduce the use of management discretion in preparing the financial statements.
Keywords: Corporate Accruals, Discretionary Accruals, Accounting Scandal, Accounting Accruals, Non-Discretionary Accruals, DSE, Bangladesh Corresponding author: [email protected] (Dr.Md. Shamimul Hasan) Article Submitted 12-01-2014 Article Accepted 23-02-2014 **Article previously published in EJEM 2014, vol 1, No. 1
1. INTRODUCTION
Corporate swindle has subjugated the financial news in recent years. The scandal at Waste Management
(1998), Enron Corporation (2001), Tyco International (2002), WorldCom (2002), Health-South (2003),
Freddil Mac (2003), American International Group (2005), Lehman Brothers (2008), Bernie Madoff
(2008), and Satyam (2009) to name but a few, emphasizing the will and ability of unscrupulous
managers to defraud investors and other stakeholders. These scandals call into the question of reliability
of reported earnings. The recent wave of corporate governance failures has raised concerns about the
integrity of the accounting information provided to investors and resulted in a drop in investor
confidence (Jain et al, 2003; Rezaee 2004; Jain & Rezaee 2006). These failures were highly exposed
and ultimately led to the drop of investors’ confidence on accounting information. In Bangladesh,
investors’ do not have strong confidence on information provided in annual report (Razzaque 2004).
PAGE 13| Journal of Corporate Governance, Insurance, and Risk Management | 2014, VOL. 1, Series. 1
The recent wave of corporate scandals in the United States and elsewhere has dramatized, once again,
the severity of the agency problems that may arise between managers and shareholders (Joseph et al,
2004). A principal concern of many users of financial statements has been whether or not earnings are
overstated. Companies may be motivated to increase earnings in a particular period to meet analysts’
earnings expectations, to meet debt covenants, or to improve incentive compensation. Importantly,
management also may have incentives to lower reported earnings in a particular period.
In the United States, the SEC study (2002), Report Pursuant in Section 704 of Sarbanes-Oxley Act of
2002, reviews 515 enforcement actions between July 31, 1997 and July 30, 2002. The study classified
improper accounting practices into four categories: (i) Improper revenue recognition (126 cases)
including reporting revenue in advance through techniques, such as holding the accounting period open,
billing without shipping (bill and hold), fictitious revenue, and improper valuation of revenue; (ii)
Improper expenses recognition (101cases) including improper capitalization, overstating inventory,
understating bad debts/loan losses, improper use of restructuring reserves, and failure to record asset
impairments; (iii) Improper accounting in connection with business combination (23 cases); and, (iv)
Other accounting and reporting issues (130 cases) including inadequate disclosures, failure to disclose
related party transactions, inappropriate accounting for non-monetary and round-trip transactions,
improper accounting for foreign payments in violation of the Foreign Corrupt Practice Act, improper
use of off-balance sheet arrangements, and improper use of non-GAAP financial measures (CFA:2011).
In Bangladesh, the stock market had been crashed twice- one in 1996 and the other in 2010-2011. In
1996, the cause of crash was speculative bubble and in 2010-2011 the cause was asset pricing bubble.
In DSE it is observed that, the stock price moves up if the earning per share is higher than that of the
same quarter of the previous year. It is an indication of earnings manipulation in order to move up the
price or better performance of their stock in the capital market. A probe committee was formed by the
government to find out the real causes behind the crash of the capital market in 2010-2011. The probe
committee digs out various ways to manipulate the capital market. Among those ways, accounting
manipulation was important one which is somewhat responsible for creating asset pricing bubble in the
capital market (Probe Committee Report: 2011).
The Institute of Chartered Accountants of Bangladesh (ICAB) provided their opinion and
recommendations to the probe committee in 2011. Quality of financial statements of the issuers was one
of the concerned issues. Major areas of concern were as follows:
• Quality of earnings
• Non-compliance of accounting standards
• Revaluation of fixed assets
• Poor quality of work of some audit firms that are in the SEC panel of auditors
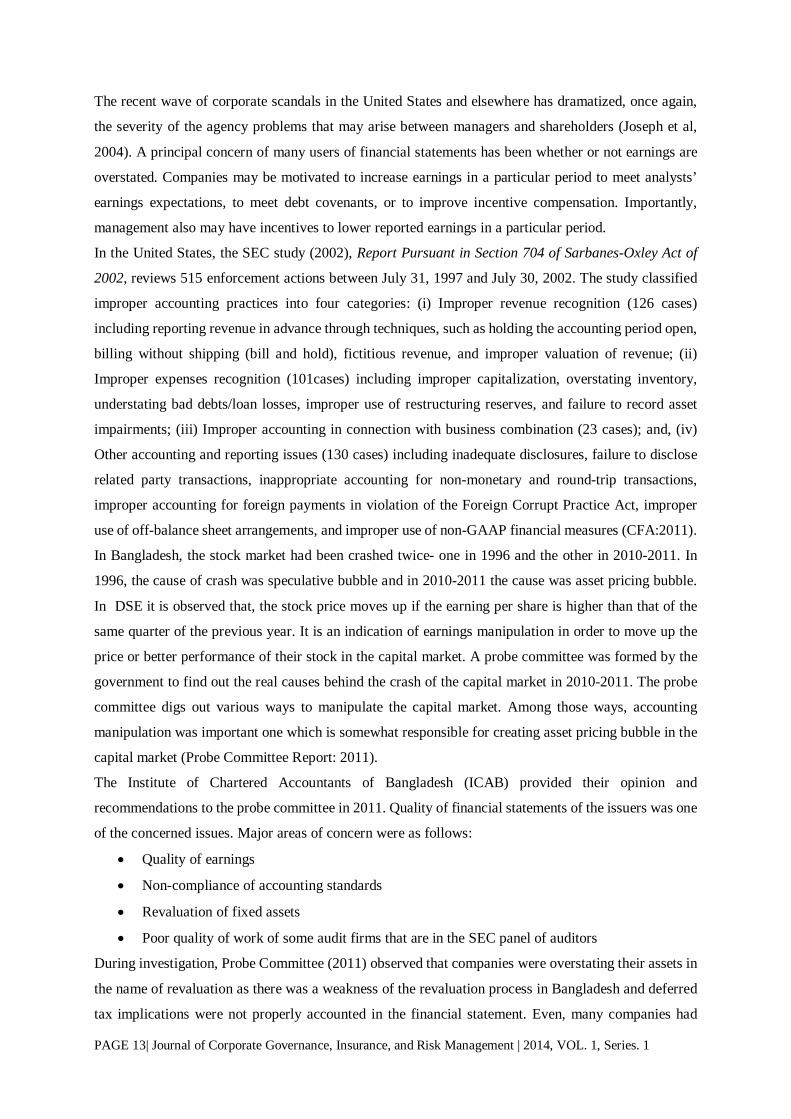
During investigation, Probe Committee (2011) observed that companies were overstating their assets in
the name of revaluation as there was a weakness of the revaluation process in Bangladesh and deferred
tax implications were not properly accounted in the financial statement. Even, many companies had
PAGE 14| Journal of Corporate Governance, Insurance, and Risk Management | 2014, VOL. 1, Series. 1
issued bonus shares against such unrealized gains which were not legal. The probe committee provides
the following information to observe the scenario of the revaluation of assets.
Table 1: Test Case of Overvaluation of Assets
Name
NAV per share in Taka
Before
revaluation
After
revaluation
%
change
Libra Infusions 438 15667 3472
Sonali Aansh Industries 297 2156 626
Rahim Textile 127 785 518
BD Thai Aluminum 142 566 298
Orion Infusion Ltd 20 101 413
Ocean Containers Ltd. 13 50 296
Shine Pukur Ceramic 12 26 120
Eastern Insurance 151 309 104 Source: Probe Committee Report, 2011; NAV = Net Assets Value
Earnings per share (EPS) is an important indicator to justify the share price of a company. In Bangladesh,
earnings per share of companies are manipulated in order to hike the offer price in the stock market.
Institute of Chartered Accountants of Bangladesh (ICAB) mentioned the manipulating strategies as
follows:
1. Annualizing EPS computation – There were instances where issuers annualized the latest quarterly
or semi-annual EPS without using latest available full year EPS. Such quarterly/semi annually EPS
figures were significantly higher than historical EPS which is most likely to be “managed”
2. Manipulation related to weighted average number of shares in computing EPS- There were instances
where issuers had issued a large number of shares closer to the balance sheet date so that such new
shares would have lesser impact in computing weighted average number of shares.
3. Issue of shares subsequent to the balance sheet date – There were instances where new shares issued
subsequent to the balance sheet date and impact of such new shares were not taken into account in
computing EPS in pricing the IPO.
4. Inclusion of exceptional non-recurring income into the EPS computation (example: capital gains).
(Source: Probe Committee Report, 2011)
Management has a unique ability to commit fraud because it often is in a position to directly or indirectly
manipulate accounting records and present deceitful financial information. Fraudulent financial
reporting often involves management override of controls that otherwise may appear to be operating
effectively. Management can either direct employees to perpetrate fraud or solicit help in carrying it out.
In addition, management personnel as a component of the entity may be in a position to manipulate the
PAGE 15| Journal of Corporate Governance, Insurance, and Risk Management | 2014, VOL. 1, Series. 1
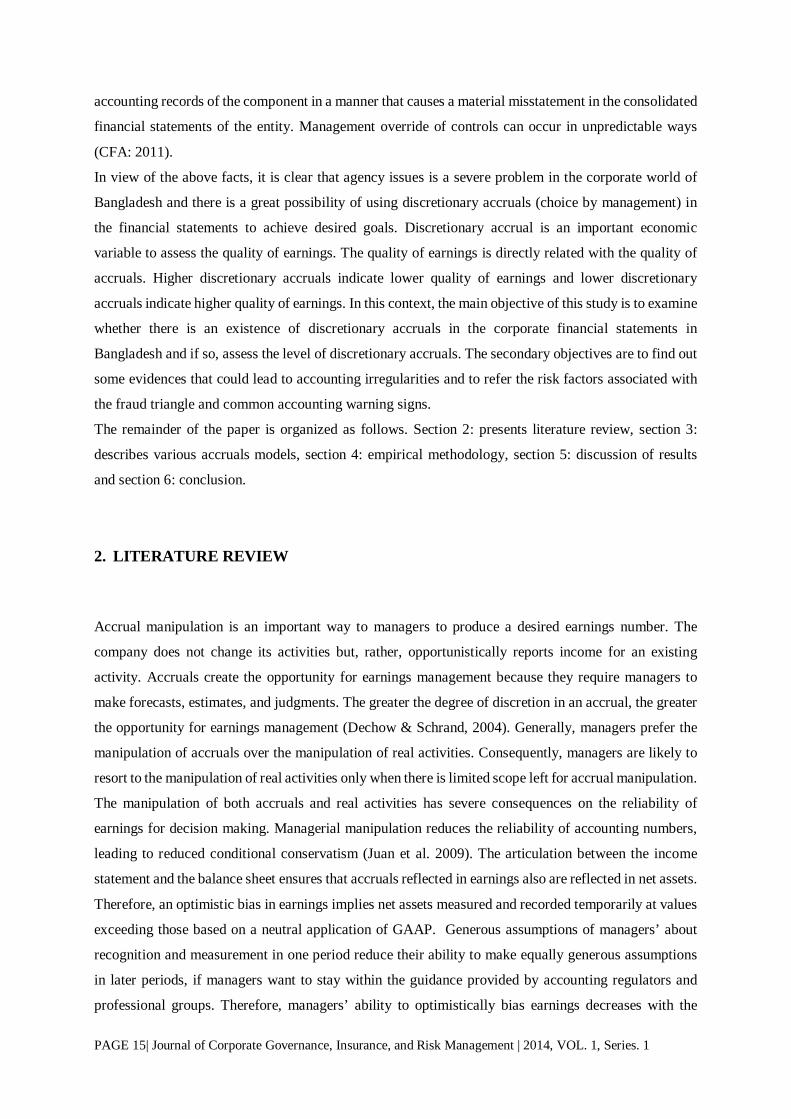
accounting records of the component in a manner that causes a material misstatement in the consolidated
financial statements of the entity. Management override of controls can occur in unpredictable ways
(CFA: 2011).
In view of the above facts, it is clear that agency issues is a severe problem in the corporate world of
Bangladesh and there is a great possibility of using discretionary accruals (choice by management) in
the financial statements to achieve desired goals. Discretionary accrual is an important economic
variable to assess the quality of earnings. The quality of earnings is directly related with the quality of
accruals. Higher discretionary accruals indicate lower quality of earnings and lower discretionary
accruals indicate higher quality of earnings. In this context, the main objective of this study is to examine
whether there is an existence of discretionary accruals in the corporate financial statements in
Bangladesh and if so, assess the level of discretionary accruals. The secondary objectives are to find out
some evidences that could lead to accounting irregularities and to refer the risk factors associated with
the fraud triangle and common accounting warning signs.
The remainder of the paper is organized as follows. Section 2: presents literature review, section 3:
describes various accruals models, section 4: empirical methodology, section 5: discussion of results
and section 6: conclusion.
2. LITERATURE REVIEW
Accrual manipulation is an important way to managers to produce a desired earnings number. The
company does not change its activities but, rather, opportunistically reports income for an existing
activity. Accruals create the opportunity for earnings management because they require managers to
make forecasts, estimates, and judgments. The greater the degree of discretion in an accrual, the greater
the opportunity for earnings management (Dechow & Schrand, 2004). Generally, managers prefer the
manipulation of accruals over the manipulation of real activities. Consequently, managers are likely to
resort to the manipulation of real activities only when there is limited scope left for accrual manipulation.
The manipulation of both accruals and real activities has severe consequences on the reliability of
earnings for decision making. Managerial manipulation reduces the reliability of accounting numbers,
leading to reduced conditional conservatism (Juan et al. 2009). The articulation between the income
statement and the balance sheet ensures that accruals reflected in earnings also are reflected in net assets.
Therefore, an optimistic bias in earnings implies net assets measured and recorded temporarily at values
exceeding those based on a neutral application of GAAP. Generous assumptions of managers’ about
recognition and measurement in one period reduce their ability to make equally generous assumptions
in later periods, if managers want to stay within the guidance provided by accounting regulators and
professional groups. Therefore, managers’ ability to optimistically bias earnings decreases with the

PAGE 16| Journal of Corporate Governance, Insurance, and Risk Management | 2014, VOL. 1, Series. 1
extent to which net assets are already overstated (Barton & Simko, 2002). Discretionary accruals are
accounting adjustments to cash flows that managers can choose within the flexibility of GAAP. Since
GAAP allows certain discretion over financial reporting, there is a possibility that accruals contain
management’s intention to manipulate information (Beneish 1997; Dechow & Skinner 2000). Previous
studies detected earnings management behavior through various methods including the changing of
accounting policies (Balsam et al., 1998), discretionary accruals (Jones 1991), real transactions (Barber
et al. 1991; Bushee 1998; Cheng 2005), and earnings distribution (Burgstahler and Dichev 1997). Since
the middle of 1980s, discretionary accruals have become the primarily focus on detecting earnings
management. There are two main reasons. Firstly, accrual is a generally accepted accounting principle.
Accruals are used to reduce inconsistencies encountered as a result of difference in timing of the
recognition (Dechow & Skinner 2000). Secondly, the accrual technique is less visible and hard to detect
compare to the changing of accounting policies or real transactions. As such, accruals open a door for
opportunistic earnings management within the requirement of GAAP. Managers believe that accrual
technique is a desirable vehicle to achieve their objectives (Dechow 1994; Beneish 2001).
The accrual method began with Healy (1985) and DeAngelo (1986), who used total accruals and changes
in total accruals as a proxy for discretionary accruals respectively. These models capture either income-
increasing or income-reducing techniques that managers have incentives to employ, however, they
misclassified all accruals as discretionary which lead to biased test if earnings management stimulus is
correlated to non-discretionary accruals to overcome this limitation. Jones (1991) introduced a linear
regression approach to control non-discretionary determinants of accruals. She used change in sales
control for non-discretionary accruals of current assets and liabilities; property, plant and equipment
control for the non-discretionary component of depreciation expense. The rationale is that a firm’s
working capital requirements depend on sales, while its depreciation accruals depend on the level of
property, plant and equipment. Then, she uses the residual for regression of total accruals on non-
discretionary determinants of accruals as discretionary accrual proxy. However, this model misclassified
all revenue as non-discretionary accruals. Dechow et al. (1995) introduced a Modified Jones Model,
they adjusted the Jones model by removing credit sales from revenues. However, the modified Jones
Model could still yield biased results if no earnings management occurs in credit sales. In the literature,
both Jones Model and Modified Jones Model have been widely used in estimating discretionary accruals
the proxy for earnings management. Since earnings management is not observable, the validity and
reliability of Jones and Modified Jones empirical models have been often criticized (Bernard & Skinner
1996; Wilson 1996; Guay et al. 1996; Beneish 1997; Healy & Wahlen 1999; Thomas & Zhang 2000;
Peasnell et al. 2000; Xie 2001; Leuz et al. 2003). Researchers argued that model misspecification
problem at least reduces the power of detecting earnings management, and at worst causes researchers
to conclude that there is earnings management when none actually exist (e.g., McNichols & Wilson
1988; Dechow et al. 1995). Moreover, it is more likely to detect income increasing earnings management
for higher profitable firms and income –decreasing earnings management for lower profitable firms.

PAGE 17| Journal of Corporate Governance, Insurance, and Risk Management | 2014, VOL. 1, Series. 1
Likewise, researchers are more likely to detect income-increasing earnings management for lower cash
flow firms and income –decreasing earnings management for higher cash flow firms. Accruals are
correlated with a firm’s contemporaneous and past performance. Jones and Modified Jones models
attempt to control for contemporaneous performance but ignore the past performance. Empirical
assessments suggest that estimated discretionary accruals are significantly influenced by a firm’s
contemporaneous and past performance. If a firm experiences an unusual performance, for example, has
one-time extreme high or low sales; or a fast growth stock exhibit momentum for a period of time, then
there is a danger of a false detection of earnings management unless discretionary accruals models can
adequately filter out the component that affected by firm performance (Kothari et al. 2005).
So far a few studies on discretionary accruals might have yet been conducted in Bangladesh. The
researcher found only one study entitled ‘Earnings Management: An Analysis on Textile Sector of
Bangladesh’ (Razzaque et al., 2006). The study was conducted long back (period 1992-2002) using the
Modified Jones Model (1995) and confined to the textile industry only. The study did not provide any
information about the level of discretionary accruals. Besides, the study did not use separate models for
non-discretionary and discretionary accruals. They define discretionary accruals as residuals of total
accruals model.
In light of the above, the researchers feel that an in-depth study is urgently needed to measure the level
of discretionary accruals in the corporate financial statements in Bangladesh so as to find out the clues
that could lead to accounting irregularities. The researchers also feel that the external stakeholders
should be acquainted with the risk factors for each condition of the fraud triangle and common
accounting warning signs that may lead to reduce the use of management discretion in preparing
financial statement.
3. MODELS OF NON-DISCRETIONARY ACCRUALS (ACCOUNTING ACCRUALS)
A wide variety of non-discretionary accrual models have been employed by previous researchers.
Estimating the non-discretionary component of accruals typically involves a regression model. We
termed non-discretionary accruals as accounting accruals and discretionary accruals as corporate
accruals in the study. The common variants of the most popular models are discussed below:
3.1 The Jones Model (1991)
Jones offers a new and potentially more effective way to estimate non-discretionary accruals in her
model. She uses a property, plant and equipment variable (PPE) to control for any changes in non-

PAGE 18| Journal of Corporate Governance, Insurance, and Risk Management | 2014, VOL. 1, Series. 1
discretionary accruals arising from the depreciation charge and hence resulting from changes in business
activities of the firm. Using the same idea, a sales revenue variable is used to control changes in non-
discretionary accruals related to working capital accounts arising from changes in the economic
environment of the firm. However, revenues, according to Jones, are not completely exogenous; for
example, shipments for merchandise could be postponed in order to postpone recognition of revenue
until the next year. The regression is estimated for each sample firm as follows: 𝑇𝑇𝑇𝑇𝐿𝐿𝑇𝑇𝑇𝑇
= 𝛽𝛽1 �1𝐿𝐿𝑇𝑇𝑇𝑇
�+ 𝛽𝛽2 �∆ 𝑅𝑅𝑅𝑅𝑅𝑅𝐿𝐿𝑇𝑇𝑇𝑇
� + 𝛽𝛽3 �𝑃𝑃𝑃𝑃𝑅𝑅𝐿𝐿𝑇𝑇𝑇𝑇
�+ 𝜀𝜀
Where:
TA = Total Accruals
∆ REV = Change in Revenues from the preceding year
PPE = Gross Value of Property , Plant & Equipment
LTA = Lagged Total Assets
All variables in her model are scaled by lagged assets to reduce heteroscedasticity. Discretionary
accruals (DA), as shown below are computed as the difference between total accruals and non-
discretionary components of accruals.
𝐷𝐷𝑇𝑇 = 𝑇𝑇𝑇𝑇𝐿𝐿𝑇𝑇𝑇𝑇 − [ 𝛽𝛽1 �
1𝐿𝐿𝑇𝑇𝑇𝑇
� + 𝛽𝛽2 �∆ 𝑅𝑅𝑅𝑅𝑅𝑅𝐿𝐿𝑇𝑇𝑇𝑇
� + 𝛽𝛽3 �𝑃𝑃𝑃𝑃𝑅𝑅𝐿𝐿𝑇𝑇𝑇𝑇
�]
Looking at the Jones model, it is clear that the idea of using two variables (∆ REV and ∆ PPE) to control
for changes in non-discretionary accruals makes this model potentially more accurate for an analysis of
earnings manipulations. However, the assumption that coefficient estimates are stationary over time
would create survivorship bias. As well, sales manipulation that can be managed by managers is
completely ignored since this model assumes that all revenues in the period are non-discretionary.
3.2 The Modified Jones Model (1995)
Dechow et al. (1995) modify the original Jones model to eliminate the conjectured tendency to measure
discretionary accruals with error when discretion is exercised over revenues. The change in revenues is
adjusted for the change in receivables in the event period. They assume that all changes in credit sales
in the event period proceed from earnings management. They conclude that managing earnings by
exercising discretion over the recognition of revenue on credit sales is easier than managing earnings by
exercising discretion over the recognition of revenue on cash sales. The regression for the sample is
estimated as follows: 𝑇𝑇𝑇𝑇𝐿𝐿𝑇𝑇𝑇𝑇
= 𝛽𝛽1 �1𝐿𝐿𝑇𝑇𝑇𝑇
� + 𝛽𝛽2 �∆ 𝑅𝑅𝑅𝑅𝑅𝑅 − ∆ 𝑇𝑇𝑅𝑅
𝐿𝐿𝑇𝑇𝑇𝑇�+ 𝛽𝛽3 �
𝑃𝑃𝑃𝑃𝑅𝑅𝐿𝐿𝑇𝑇𝑇𝑇
�+ 𝜀𝜀
Where:
TA = Total Accruals

PAGE 19| Journal of Corporate Governance, Insurance, and Risk Management | 2014, VOL. 1, Series. 1
∆ REV = Change in Revenues from the preceding year
∆ AR = Change in Accounts Receivable from the preceding year
PPE = Gross Value of Property , Plant & Equipment
LTA = Lagged Total Assets
Discretionary accruals (DA), as shown below, are computed as the difference between total accruals and
the non-discretionary components of accruals.
𝐷𝐷𝑇𝑇 = �𝑇𝑇𝑇𝑇𝐿𝐿𝑇𝑇𝑇𝑇
� − [𝛽𝛽1 �1𝐿𝐿𝑇𝑇𝑇𝑇
�+ 𝛽𝛽2 �∆ 𝑅𝑅𝑅𝑅𝑅𝑅 − ∆ 𝑇𝑇𝑅𝑅
𝐿𝐿𝑇𝑇𝑇𝑇� + 𝛽𝛽3 �
𝑃𝑃𝑃𝑃𝑅𝑅𝐿𝐿𝑇𝑇𝑇𝑇
�]
3.3. The Extended Jones Cash Flow Model (1999)
Kasznik (1999) adds to modified Jones model changes in operating cash flow as an explanatory variable
to explain the negative correlation between cash flow from operations and total accruals. He finds that
managers use income-increasing discretionary accruals to manage reported earnings toward their
forecast numbers when they have overestimated earnings. In contrast, he finds no evidence that
managers use income-decreasing discretionary accruals to manage reported earnings downward when
they have underestimated earnings in their forecasts. The regression for the sample is estimated as
follows:
�𝑁𝑁𝐷𝐷𝑇𝑇𝐿𝐿𝑇𝑇𝑇𝑇
� = 𝛼𝛼0 + 𝛼𝛼1 �1𝐿𝐿𝑇𝑇𝑇𝑇
�+ 𝛼𝛼2 �∆ 𝑅𝑅𝑅𝑅𝑅𝑅 − ∆ 𝑇𝑇𝑅𝑅
𝐿𝐿𝑇𝑇𝑇𝑇�+ 𝛼𝛼3 �
𝑃𝑃𝑃𝑃𝑅𝑅𝐿𝐿𝑇𝑇𝑇𝑇
�+ 𝛼𝛼4 �∆𝐶𝐶𝐶𝐶𝐶𝐶𝐿𝐿𝑇𝑇𝑇𝑇
�+ 𝜀𝜀
Where:
NDA = Non-Discretionary Accruals
∆ REV = Change in Revenues from the preceding year
∆ AR = Change in Accounts Receivable from the preceding year
PPE = Gross Value of Property , Plant & Equipment
∆CFO = Change in cash flows from operation
LTA = Lagged Total Assets
3.4 Modified Jones Model with Book-to-Market Ratio and Cash Flows (2004)
Larcker and Richardson (2004) add the book-to-market ratio (BM) and operating cash flows (CFO) to
modified Jones model to mitigate measurement error associated with the discretionary accruals. BM
controls for expected growth in operations and if left uncontrolled, growth will be picked up as
discretionary accruals. CFO controls for current operating performance. Controlling for performance is
important because Dechow et al. (1995) find that discretionary accruals are likely to be misspecified for
firms with extreme levels of performance. Larcker and Richardson (2004) note that their model is
PAGE 20| Journal of Corporate Governance, Insurance, and Risk Management | 2014, VOL. 1, Series. 1
superior to the modified Jones model in several ways: it has far greater explanatory power, identifies
unexpected accruals that are less persistent than other components of earnings, the estimated
discretionary accruals detect earnings management identified in SEC enforcement actions, and identifies
discretionary accruals that are associated with lower future earnings and lower future stock returns. The
regression for the sample is estimated as follows:
�𝑇𝑇𝑇𝑇𝐿𝐿𝑇𝑇𝑇𝑇
� = 𝛽𝛽1 �1𝐿𝐿𝑇𝑇𝑇𝑇
�+ 𝛽𝛽2 �∆ 𝑅𝑅𝑅𝑅𝑅𝑅 − ∆ 𝑇𝑇𝑅𝑅
𝐿𝐿𝑇𝑇𝑇𝑇� + 𝛽𝛽3 �
𝑃𝑃𝑃𝑃𝑅𝑅𝐿𝐿𝑇𝑇𝑇𝑇
�+ 𝛽𝛽4 �𝐵𝐵𝐵𝐵𝐿𝐿𝑇𝑇𝑇𝑇
�+ 𝛽𝛽5 �𝐶𝐶𝐶𝐶𝐶𝐶𝐿𝐿𝑇𝑇𝑇𝑇
�+ 𝜀𝜀
Where:
TA = Total Accruals
∆ REV = Change in Revenues from the preceding year
∆ AR = Change in Accounts Receivable from the preceding year
PPE = Gross Value of Property , Plant & Equipment
BM = Book-to-Market Ratio
CFO = Cash Flows from Operations
LTA = Lagged Total Assets
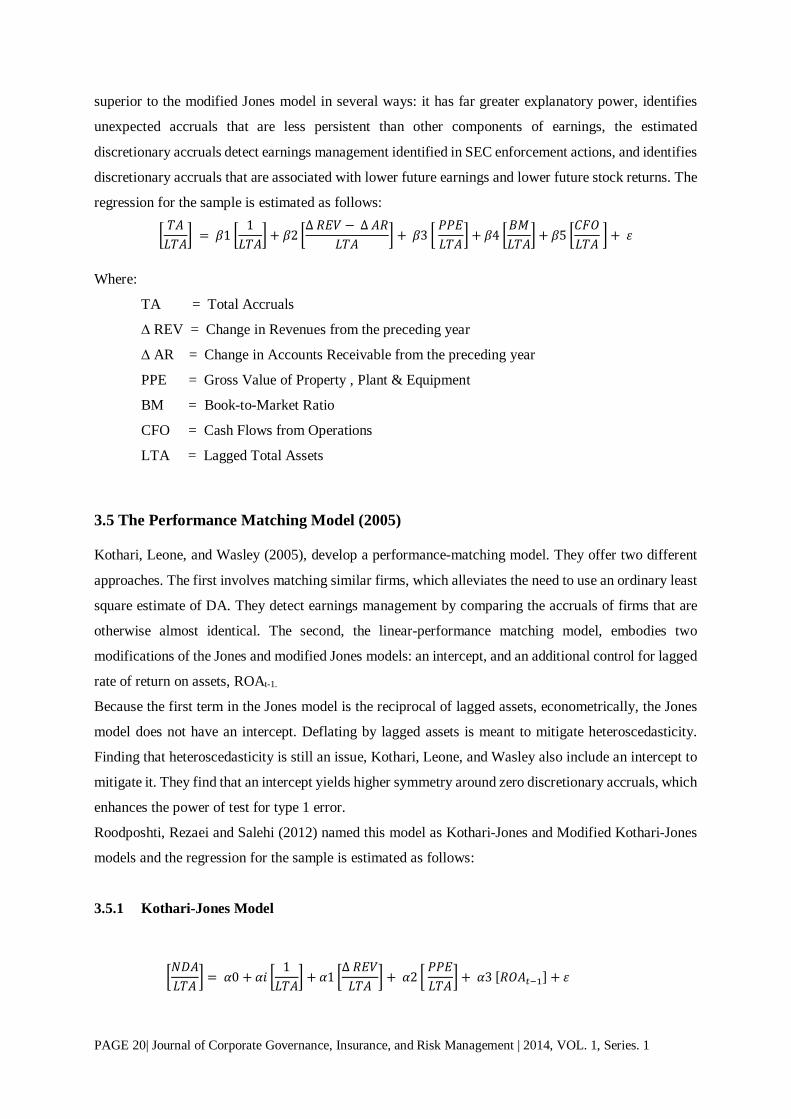
3.5 The Performance Matching Model (2005)
Kothari, Leone, and Wasley (2005), develop a performance-matching model. They offer two different
approaches. The first involves matching similar firms, which alleviates the need to use an ordinary least
square estimate of DA. They detect earnings management by comparing the accruals of firms that are
otherwise almost identical. The second, the linear-performance matching model, embodies two
modifications of the Jones and modified Jones models: an intercept, and an additional control for lagged
rate of return on assets, ROAt-1.
Because the first term in the Jones model is the reciprocal of lagged assets, econometrically, the Jones
model does not have an intercept. Deflating by lagged assets is meant to mitigate heteroscedasticity.
Finding that heteroscedasticity is still an issue, Kothari, Leone, and Wasley also include an intercept to
mitigate it. They find that an intercept yields higher symmetry around zero discretionary accruals, which
enhances the power of test for type 1 error.
Roodposhti, Rezaei and Salehi (2012) named this model as Kothari-Jones and Modified Kothari-Jones
models and the regression for the sample is estimated as follows:
3.5.1 Kothari-Jones Model
�𝑁𝑁𝐷𝐷𝑇𝑇𝐿𝐿𝑇𝑇𝑇𝑇
� = 𝛼𝛼0 + 𝛼𝛼𝛼𝛼 �1𝐿𝐿𝑇𝑇𝑇𝑇
� + 𝛼𝛼1 �∆ 𝑅𝑅𝑅𝑅𝑅𝑅𝐿𝐿𝑇𝑇𝑇𝑇
� + 𝛼𝛼2 � 𝑃𝑃𝑃𝑃𝑅𝑅𝐿𝐿𝑇𝑇𝑇𝑇
�+ 𝛼𝛼3 [𝑅𝑅𝐶𝐶𝑇𝑇𝑡𝑡−1] + 𝜀𝜀
PAGE 21| Journal of Corporate Governance, Insurance, and Risk Management | 2014, VOL. 1, Series. 1
Where:
NDA = Non-Discretionary Accruals
∆ REV = Change in Revenues from the preceding year
PPE = Gross Value of Property , Plant & Equipment
ROA t-1 = Lagged Rate of Return on Assets
LTA = Lagged Total Assets
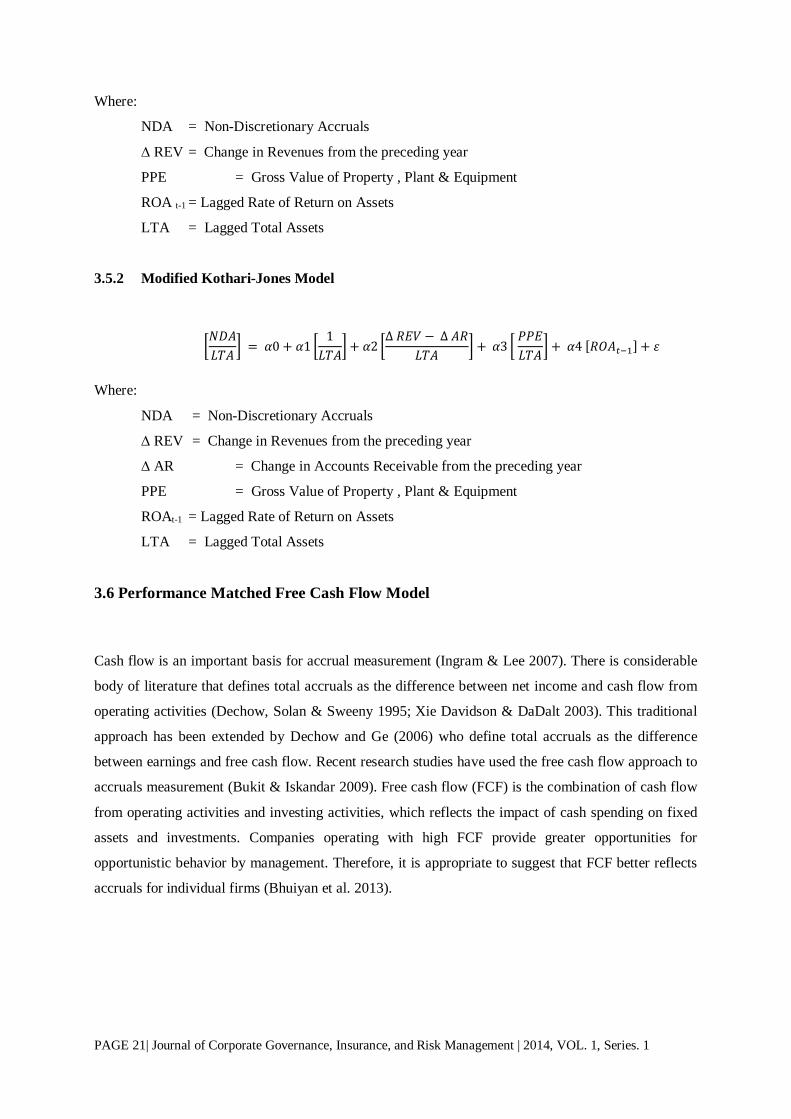
3.5.2 Modified Kothari-Jones Model
�𝑁𝑁𝐷𝐷𝑇𝑇𝐿𝐿𝑇𝑇𝑇𝑇
� = 𝛼𝛼0 + 𝛼𝛼1 �1𝐿𝐿𝑇𝑇𝑇𝑇
�+ 𝛼𝛼2 �∆ 𝑅𝑅𝑅𝑅𝑅𝑅 − ∆ 𝑇𝑇𝑅𝑅
𝐿𝐿𝑇𝑇𝑇𝑇� + 𝛼𝛼3 �
𝑃𝑃𝑃𝑃𝑅𝑅𝐿𝐿𝑇𝑇𝑇𝑇
�+ 𝛼𝛼4 [𝑅𝑅𝐶𝐶𝑇𝑇𝑡𝑡−1] + 𝜀𝜀
Where:
NDA = Non-Discretionary Accruals
∆ REV = Change in Revenues from the preceding year
∆ AR = Change in Accounts Receivable from the preceding year
PPE = Gross Value of Property , Plant & Equipment
ROAt-1 = Lagged Rate of Return on Assets
LTA = Lagged Total Assets
3.6 Performance Matched Free Cash Flow Model
Cash flow is an important basis for accrual measurement (Ingram & Lee 2007). There is considerable
body of literature that defines total accruals as the difference between net income and cash flow from
operating activities (Dechow, Solan & Sweeny 1995; Xie Davidson & DaDalt 2003). This traditional
approach has been extended by Dechow and Ge (2006) who define total accruals as the difference
between earnings and free cash flow. Recent research studies have used the free cash flow approach to
accruals measurement (Bukit & Iskandar 2009). Free cash flow (FCF) is the combination of cash flow
from operating activities and investing activities, which reflects the impact of cash spending on fixed
assets and investments. Companies operating with high FCF provide greater opportunities for
opportunistic behavior by management. Therefore, it is appropriate to suggest that FCF better reflects
accruals for individual firms (Bhuiyan et al. 2013).

PAGE 22| Journal of Corporate Governance, Insurance, and Risk Management | 2014, VOL. 1, Series. 1
𝐷𝐷𝑇𝑇 = �𝑇𝑇𝑇𝑇𝐿𝐿𝑇𝑇𝑇𝑇
� − [ 𝛼𝛼0 + 𝛼𝛼1 �1𝐿𝐿𝑇𝑇𝑇𝑇
�+ 𝛼𝛼2 �∆ 𝑅𝑅𝑅𝑅𝑅𝑅 − ∆ 𝑇𝑇𝑅𝑅
𝐿𝐿𝑇𝑇𝑇𝑇� + 𝛼𝛼3 �
𝑃𝑃𝑃𝑃𝑅𝑅𝐿𝐿𝑇𝑇𝑇𝑇
�+ 𝛼𝛼4 [𝑅𝑅𝐶𝐶𝑇𝑇𝑡𝑡−1] + 𝜀𝜀]
Where:
TA = Total Accruals ( Net Income before extraordinary items less free cash flow from
operating activities and cash flow from investing activities)
∆ REV = Change in Revenues from the preceding year
∆ AR = Change in Accounts Receivable from the preceding year
PPE = Gross Value of Property , Plant & Equipment
ROAt-1 = Lagged Rate of Return on Assets
LTA = Lagged Total Assets
4. METHODOLOGY
4.1 Data and sample description
As on June 30, 2012 total listed securities of Dhaka Stock Exchange (DSE) were 511, of which 273
were securities (3 corporate bonds, 8 debentures, 41 mutual funds, & 221 treasury bonds) and 238 were
companies. Again, 30 companies were banks, 22 were financial institutions and 45 were insurance
companies out of 238 listed companies. Annual reports of 68 listed companies of 2010-2011 out of 141
listed non financial companies were taken as sample in the current study. The relevant data were
collected through the survey of financial statements of annual report for the year 2010-2011 of each firm
of the sample companies. The relevant pages of the annual report were statement of income (for revenue,
net income), statement of cash flow (cash flow from operation), statement of financial position (for
accounts receivable, total assets), and schedule of fixed assets (for gross value of fixed assets).
4.2 Measurement of accounting accruals manipulation
Earnings management is predominantly a function of manipulating accruals, so it is intuitive to use the
magnitude of accruals as a proxy for earnings quality: the higher the total accruals as a percentage of
assets, the greater the likelihood that earnings quality is low. The size of accruals can be used as a rough
measure for earnings manipulation, especially in high-accrual firms (Tim Keefe: 2013). Three steps are
involved in deriving discretionary accruals i.e., Step-1: Total accruals, Step-2: Accounting accruals
(Non-discretionary accruals) and Step-3: Corporate accruals (Discretionary accruals).
PAGE 23| Journal of Corporate Governance, Insurance, and Risk Management | 2014, VOL. 1, Series. 1
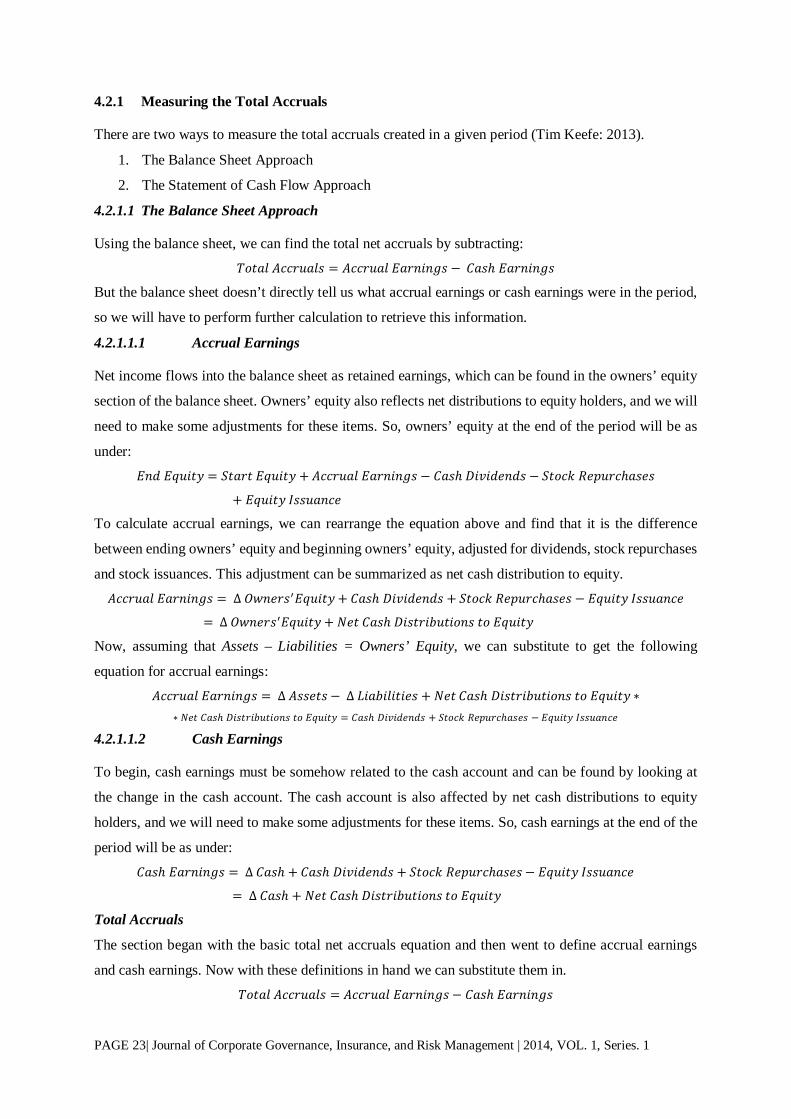
4.2.1 Measuring the Total Accruals
There are two ways to measure the total accruals created in a given period (Tim Keefe: 2013).
1. The Balance Sheet Approach
2. The Statement of Cash Flow Approach
4.2.1.1 The Balance Sheet Approach
Using the balance sheet, we can find the total net accruals by subtracting: 𝑇𝑇𝑇𝑇𝑇𝑇𝑇𝑇𝑇𝑇 𝑇𝑇𝐴𝐴𝐴𝐴𝐴𝐴𝐴𝐴𝑇𝑇𝑇𝑇𝐴𝐴 = 𝑇𝑇𝐴𝐴𝐴𝐴𝐴𝐴𝐴𝐴𝑇𝑇𝑇𝑇 𝑅𝑅𝑇𝑇𝐴𝐴𝐸𝐸𝛼𝛼𝐸𝐸𝐸𝐸𝐴𝐴 − 𝐶𝐶𝑇𝑇𝐴𝐴ℎ 𝑅𝑅𝑇𝑇𝐴𝐴𝐸𝐸𝛼𝛼𝐸𝐸𝐸𝐸𝐴𝐴
But the balance sheet doesn’t directly tell us what accrual earnings or cash earnings were in the period,
so we will have to perform further calculation to retrieve this information.
4.2.1.1.1 Accrual Earnings
Net income flows into the balance sheet as retained earnings, which can be found in the owners’ equity
section of the balance sheet. Owners’ equity also reflects net distributions to equity holders, and we will
need to make some adjustments for these items. So, owners’ equity at the end of the period will be as
under: 𝑅𝑅𝐸𝐸𝐸𝐸 𝑅𝑅𝐸𝐸𝐴𝐴𝛼𝛼𝑇𝑇𝐸𝐸 = 𝑆𝑆𝑇𝑇𝑇𝑇𝐴𝐴𝑇𝑇 𝑅𝑅𝐸𝐸𝐴𝐴𝛼𝛼𝑇𝑇𝐸𝐸 + 𝑇𝑇𝐴𝐴𝐴𝐴𝐴𝐴𝐴𝐴𝑇𝑇𝑇𝑇 𝑅𝑅𝑇𝑇𝐴𝐴𝐸𝐸𝛼𝛼𝐸𝐸𝐸𝐸𝐴𝐴 − 𝐶𝐶𝑇𝑇𝐴𝐴ℎ 𝐷𝐷𝛼𝛼𝐷𝐷𝛼𝛼𝐸𝐸𝑒𝑒𝐸𝐸𝐸𝐸𝐴𝐴 − 𝑆𝑆𝑇𝑇𝑇𝑇𝐴𝐴𝑆𝑆 𝑅𝑅𝑒𝑒𝑅𝑅𝐴𝐴𝐴𝐴𝐴𝐴ℎ𝑇𝑇𝐴𝐴𝑒𝑒𝐴𝐴
+ 𝑅𝑅𝐸𝐸𝐴𝐴𝛼𝛼𝑇𝑇𝐸𝐸 𝐼𝐼𝐴𝐴𝐴𝐴𝐴𝐴𝑇𝑇𝐸𝐸𝐴𝐴𝑒𝑒
To calculate accrual earnings, we can rearrange the equation above and find that it is the difference
between ending owners’ equity and beginning owners’ equity, adjusted for dividends, stock repurchases
and stock issuances. This adjustment can be summarized as net cash distribution to equity. 𝑇𝑇𝐴𝐴𝐴𝐴𝐴𝐴𝐴𝐴𝑇𝑇𝑇𝑇 𝑅𝑅𝑇𝑇𝐴𝐴𝐸𝐸𝛼𝛼𝐸𝐸𝐸𝐸𝐴𝐴 = ∆ 𝐶𝐶𝑂𝑂𝐸𝐸𝑒𝑒𝐴𝐴𝐴𝐴′𝑅𝑅𝐸𝐸𝐴𝐴𝛼𝛼𝑇𝑇𝐸𝐸+ 𝐶𝐶𝑇𝑇𝐴𝐴ℎ 𝐷𝐷𝛼𝛼𝐷𝐷𝛼𝛼𝐸𝐸𝑒𝑒𝐸𝐸𝐸𝐸𝐴𝐴 + 𝑆𝑆𝑇𝑇𝑇𝑇𝐴𝐴𝑆𝑆 𝑅𝑅𝑒𝑒𝑅𝑅𝐴𝐴𝐴𝐴𝐴𝐴ℎ𝑇𝑇𝐴𝐴𝑒𝑒𝐴𝐴 − 𝑅𝑅𝐸𝐸𝐴𝐴𝛼𝛼𝑇𝑇𝐸𝐸 𝐼𝐼𝐴𝐴𝐴𝐴𝐴𝐴𝑇𝑇𝐸𝐸𝐴𝐴𝑒𝑒
= ∆ 𝐶𝐶𝑂𝑂𝐸𝐸𝑒𝑒𝐴𝐴𝐴𝐴′𝑅𝑅𝐸𝐸𝐴𝐴𝛼𝛼𝑇𝑇𝐸𝐸+ 𝑁𝑁𝑒𝑒𝑇𝑇 𝐶𝐶𝑇𝑇𝐴𝐴ℎ 𝐷𝐷𝛼𝛼𝐴𝐴𝑇𝑇𝐴𝐴𝛼𝛼𝐷𝐷𝐴𝐴𝑇𝑇𝛼𝛼𝑇𝑇𝐸𝐸𝐴𝐴 𝑇𝑇𝑇𝑇 𝑅𝑅𝐸𝐸𝐴𝐴𝛼𝛼𝑇𝑇𝐸𝐸
Now, assuming that Assets – Liabilities = Owners’ Equity, we can substitute to get the following
equation for accrual earnings: 𝑇𝑇𝐴𝐴𝐴𝐴𝐴𝐴𝐴𝐴𝑇𝑇𝑇𝑇 𝑅𝑅𝑇𝑇𝐴𝐴𝐸𝐸𝛼𝛼𝐸𝐸𝐸𝐸𝐴𝐴 = ∆ 𝑇𝑇𝐴𝐴𝐴𝐴𝑒𝑒𝑇𝑇𝐴𝐴 − ∆ 𝐿𝐿𝛼𝛼𝑇𝑇𝐷𝐷𝛼𝛼𝑇𝑇𝛼𝛼𝑇𝑇𝛼𝛼𝑒𝑒𝐴𝐴 + 𝑁𝑁𝑒𝑒𝑇𝑇 𝐶𝐶𝑇𝑇𝐴𝐴ℎ 𝐷𝐷𝛼𝛼𝐴𝐴𝑇𝑇𝐴𝐴𝛼𝛼𝐷𝐷𝐴𝐴𝑇𝑇𝛼𝛼𝑇𝑇𝐸𝐸𝐴𝐴 𝑇𝑇𝑇𝑇 𝑅𝑅𝐸𝐸𝐴𝐴𝛼𝛼𝑇𝑇𝐸𝐸 ∗
∗ 𝑁𝑁𝑒𝑒𝑇𝑇 𝐶𝐶𝑇𝑇𝐴𝐴ℎ 𝐷𝐷𝛼𝛼𝐴𝐴𝑇𝑇𝐴𝐴𝛼𝛼𝐷𝐷𝐴𝐴𝑇𝑇𝛼𝛼𝑇𝑇𝐸𝐸𝐴𝐴 𝑇𝑇𝑇𝑇 𝑅𝑅𝐸𝐸𝐴𝐴𝛼𝛼𝑇𝑇𝐸𝐸 = 𝐶𝐶𝑇𝑇𝐴𝐴ℎ 𝐷𝐷𝛼𝛼𝐷𝐷𝛼𝛼𝐸𝐸𝑒𝑒𝐸𝐸𝐸𝐸𝐴𝐴 + 𝑆𝑆𝑇𝑇𝑇𝑇𝐴𝐴𝑆𝑆 𝑅𝑅𝑒𝑒𝑅𝑅𝐴𝐴𝐴𝐴𝐴𝐴ℎ𝑇𝑇𝐴𝐴𝑒𝑒𝐴𝐴 − 𝑅𝑅𝐸𝐸𝐴𝐴𝛼𝛼𝑇𝑇𝐸𝐸 𝐼𝐼𝐴𝐴𝐴𝐴𝐴𝐴𝑇𝑇𝐸𝐸𝐴𝐴𝑒𝑒
4.2.1.1.2 Cash Earnings
To begin, cash earnings must be somehow related to the cash account and can be found by looking at
the change in the cash account. The cash account is also affected by net cash distributions to equity
holders, and we will need to make some adjustments for these items. So, cash earnings at the end of the
period will be as under: 𝐶𝐶𝑇𝑇𝐴𝐴ℎ 𝑅𝑅𝑇𝑇𝐴𝐴𝐸𝐸𝛼𝛼𝐸𝐸𝐸𝐸𝐴𝐴 = ∆ 𝐶𝐶𝑇𝑇𝐴𝐴ℎ + 𝐶𝐶𝑇𝑇𝐴𝐴ℎ 𝐷𝐷𝛼𝛼𝐷𝐷𝛼𝛼𝐸𝐸𝑒𝑒𝐸𝐸𝐸𝐸𝐴𝐴 + 𝑆𝑆𝑇𝑇𝑇𝑇𝐴𝐴𝑆𝑆 𝑅𝑅𝑒𝑒𝑅𝑅𝐴𝐴𝐴𝐴𝐴𝐴ℎ𝑇𝑇𝐴𝐴𝑒𝑒𝐴𝐴 − 𝑅𝑅𝐸𝐸𝐴𝐴𝛼𝛼𝑇𝑇𝐸𝐸 𝐼𝐼𝐴𝐴𝐴𝐴𝐴𝐴𝑇𝑇𝐸𝐸𝐴𝐴𝑒𝑒
= ∆ 𝐶𝐶𝑇𝑇𝐴𝐴ℎ + 𝑁𝑁𝑒𝑒𝑇𝑇 𝐶𝐶𝑇𝑇𝐴𝐴ℎ 𝐷𝐷𝛼𝛼𝐴𝐴𝑇𝑇𝐴𝐴𝛼𝛼𝐷𝐷𝐴𝐴𝑇𝑇𝛼𝛼𝑇𝑇𝐸𝐸𝐴𝐴 𝑇𝑇𝑇𝑇 𝑅𝑅𝐸𝐸𝐴𝐴𝛼𝛼𝑇𝑇𝐸𝐸
Total Accruals
The section began with the basic total net accruals equation and then went to define accrual earnings
and cash earnings. Now with these definitions in hand we can substitute them in. 𝑇𝑇𝑇𝑇𝑇𝑇𝑇𝑇𝑇𝑇 𝑇𝑇𝐴𝐴𝐴𝐴𝐴𝐴𝐴𝐴𝑇𝑇𝑇𝑇𝐴𝐴 = 𝑇𝑇𝐴𝐴𝐴𝐴𝐴𝐴𝐴𝐴𝑇𝑇𝑇𝑇 𝑅𝑅𝑇𝑇𝐴𝐴𝐸𝐸𝛼𝛼𝐸𝐸𝐸𝐸𝐴𝐴 − 𝐶𝐶𝑇𝑇𝐴𝐴ℎ 𝑅𝑅𝑇𝑇𝐴𝐴𝐸𝐸𝛼𝛼𝐸𝐸𝐸𝐸𝐴𝐴

PAGE 24| Journal of Corporate Governance, Insurance, and Risk Management | 2014, VOL. 1, Series. 1
= [∆ 𝑇𝑇𝐴𝐴𝐴𝐴𝑒𝑒𝑇𝑇𝐴𝐴 − ∆ 𝐿𝐿𝛼𝛼𝑇𝑇𝐷𝐷𝛼𝛼𝑇𝑇𝛼𝛼𝑇𝑇𝛼𝛼𝑒𝑒𝐴𝐴 + 𝑁𝑁𝐶𝐶𝐷𝐷𝑅𝑅 ∗] − [∆ 𝐶𝐶𝑇𝑇𝐴𝐴ℎ + 𝑁𝑁𝐶𝐶𝐷𝐷𝑅𝑅 ∗]
𝑇𝑇𝑇𝑇𝑇𝑇𝑇𝑇𝑇𝑇 𝑇𝑇𝐴𝐴𝐴𝐴𝐴𝐴𝐴𝐴𝑇𝑇𝑇𝑇𝐴𝐴 = ∆ 𝑇𝑇𝐴𝐴𝐴𝐴𝑒𝑒𝑇𝑇𝐴𝐴 − ∆ 𝐿𝐿𝛼𝛼𝑇𝑇𝐷𝐷𝛼𝛼𝑇𝑇𝛼𝛼𝑇𝑇𝛼𝛼𝑒𝑒𝐴𝐴 − ∆ 𝐶𝐶𝑇𝑇𝐴𝐴ℎ
∗ 𝑁𝑁𝐶𝐶𝐷𝐷𝑅𝑅 = 𝑁𝑁𝑒𝑒𝑇𝑇 𝐶𝐶𝑇𝑇𝐴𝐴ℎ 𝐷𝐷𝛼𝛼𝐴𝐴𝑇𝑇𝐴𝐴𝛼𝛼𝐷𝐷𝐴𝐴𝑇𝑇𝛼𝛼𝑇𝑇𝐸𝐸 𝑇𝑇𝑇𝑇 𝑅𝑅𝐸𝐸𝐴𝐴𝛼𝛼𝑇𝑇𝐸𝐸
4.2.1.2 The Statement of Cash Flow Approach
Using the statement of cash flow, we can find total accruals with the same basic equation as stated
before: 𝑇𝑇𝑇𝑇𝑇𝑇𝑇𝑇𝑇𝑇 𝑇𝑇𝐴𝐴𝐴𝐴𝐴𝐴𝐴𝐴𝑇𝑇𝑇𝑇𝐴𝐴 = 𝑇𝑇𝐴𝐴𝐴𝐴𝐴𝐴𝐴𝐴𝑇𝑇𝑇𝑇 𝑅𝑅𝑇𝑇𝐴𝐴𝐸𝐸𝛼𝛼𝐸𝐸𝐸𝐸𝐴𝐴 − 𝐶𝐶𝑇𝑇𝐴𝐴ℎ 𝑅𝑅𝑇𝑇𝐴𝐴𝐸𝐸𝛼𝛼𝐸𝐸𝐸𝐸𝐴𝐴
4.2.1.2.1 Accrual Earnings
Calculating total accruals from the statement of cash flow is a bit more straightforward. This is because
we don’t need to pull out accrual earnings, because net income is stated right on the report. 𝑇𝑇𝐴𝐴𝐴𝐴𝐴𝐴𝐴𝐴𝑇𝑇𝑇𝑇 𝑅𝑅𝑇𝑇𝐴𝐴𝐸𝐸𝛼𝛼𝐸𝐸𝐸𝐸𝐴𝐴 = 𝑁𝑁𝑒𝑒𝑇𝑇 𝐼𝐼𝐸𝐸𝐴𝐴𝑇𝑇𝐼𝐼𝑒𝑒 (𝑁𝑁𝐼𝐼)
4.2.1.2.2 Cash Earnings
Cash earnings can be found from statement of cash flow. Cash flow from operating activities is treated
as cash earnings. 𝐶𝐶𝑇𝑇𝐴𝐴ℎ 𝑅𝑅𝑇𝑇𝐴𝐴𝐸𝐸𝛼𝛼𝐸𝐸𝐸𝐸𝐴𝐴 = 𝐶𝐶𝑇𝑇𝐴𝐴ℎ 𝑓𝑓𝑇𝑇𝑇𝑇𝑂𝑂 𝑓𝑓𝐴𝐴𝑇𝑇𝐼𝐼 𝐶𝐶𝑅𝑅𝑒𝑒𝐴𝐴𝑇𝑇𝑇𝑇𝛼𝛼𝐸𝐸𝐸𝐸 𝑇𝑇𝐴𝐴𝑇𝑇𝛼𝛼𝐷𝐷𝛼𝛼𝑇𝑇𝛼𝛼𝑒𝑒𝐴𝐴 (𝐶𝐶𝐶𝐶𝐶𝐶)
Total Accruals 𝑇𝑇𝑇𝑇𝑇𝑇𝑇𝑇𝑇𝑇 𝑇𝑇𝐴𝐴𝐴𝐴𝐴𝐴𝐴𝐴𝑇𝑇𝑇𝑇𝐴𝐴 = 𝑇𝑇𝐴𝐴𝐴𝐴𝐴𝐴𝐴𝐴𝑇𝑇𝑇𝑇 𝑅𝑅𝑇𝑇𝐴𝐴𝐸𝐸𝛼𝛼𝐸𝐸𝐸𝐸𝐴𝐴 − 𝐶𝐶𝑇𝑇𝐴𝐴ℎ 𝑅𝑅𝑇𝑇𝐴𝐴𝐸𝐸𝛼𝛼𝐸𝐸𝐸𝐸𝐴𝐴
= 𝑁𝑁𝐼𝐼 − 𝐶𝐶𝐶𝐶𝐶𝐶
In this study, due to non-articulation issues, the cash flow approach has been used to measure total
accruals for each of sample companies by following equation:
𝑇𝑇𝑇𝑇 �1𝐿𝐿𝑇𝑇𝑇𝑇
� = � 1𝐿𝐿𝑇𝑇𝑇𝑇
� [𝑁𝑁𝐼𝐼 − 𝐶𝐶𝐶𝐶𝐶𝐶]
Where,
TA = Total Accruals
NI = Net Income for the current period
CFO = Cash Flow from Operations for the current period
LTA = Lagged Total Assets [Total assets of the last year] *Both items in the equation are scaled by lagged total assets in order to reduce heteroscedasticity.
4.2.2 Measuring Accounting Accruals (Non-Discretionary Accruals)
Using the raw accrual amounts as a proxy for earnings management is a simple method to evaluate
earnings quality because firms can have high accruals for legitimate business reasons, such as sales
growth. A more complicated proxy can be created by attempting to categorize total accruals into
accounting accruals and corporate accruals. The accounting accruals component reflects business
conditions such as growth and the length of the operating cycle that naturally create and destroy accruals,
PAGE 25| Journal of Corporate Governance, Insurance, and Risk Management | 2014, VOL. 1, Series. 1
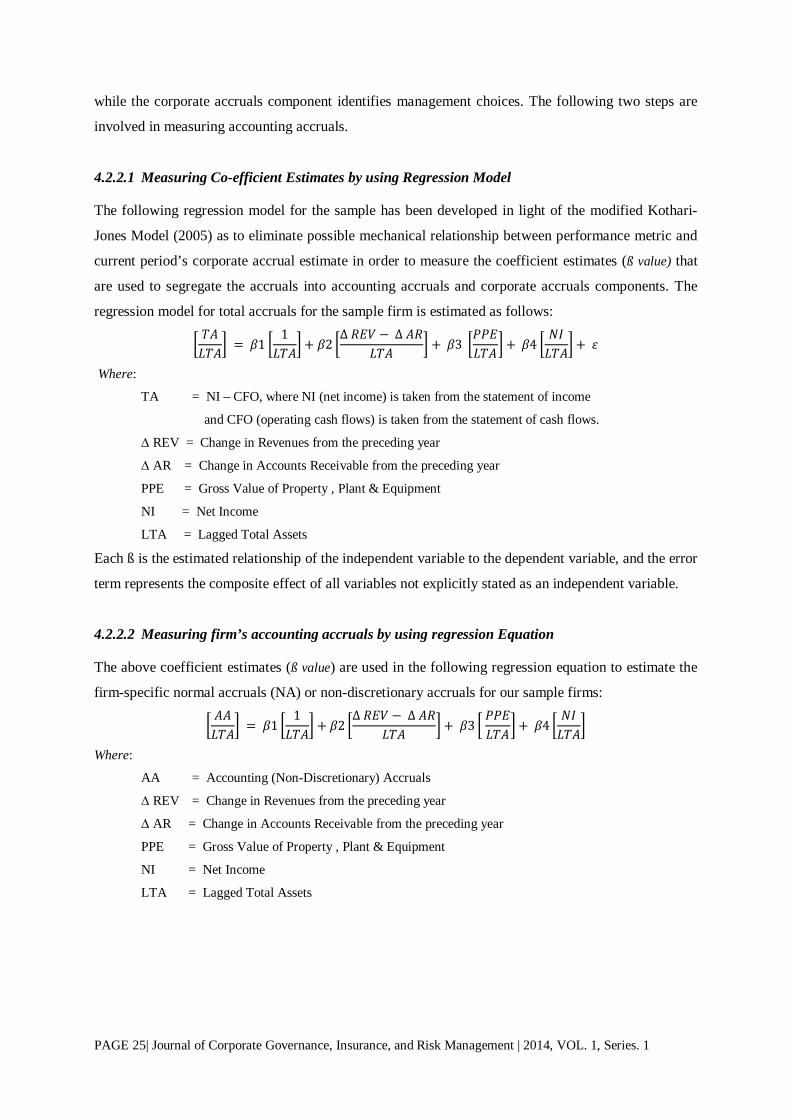
while the corporate accruals component identifies management choices. The following two steps are
involved in measuring accounting accruals.
4.2.2.1 Measuring Co-efficient Estimates by using Regression Model
The following regression model for the sample has been developed in light of the modified Kothari-
Jones Model (2005) as to eliminate possible mechanical relationship between performance metric and
current period’s corporate accrual estimate in order to measure the coefficient estimates (ß value) that
are used to segregate the accruals into accounting accruals and corporate accruals components. The
regression model for total accruals for the sample firm is estimated as follows:
�𝑇𝑇𝑇𝑇𝐿𝐿𝑇𝑇𝑇𝑇
� = 𝛽𝛽1 �1𝐿𝐿𝑇𝑇𝑇𝑇
�+ 𝛽𝛽2 �∆ 𝑅𝑅𝑅𝑅𝑅𝑅 − ∆ 𝑇𝑇𝑅𝑅
𝐿𝐿𝑇𝑇𝑇𝑇� + 𝛽𝛽3 �
𝑃𝑃𝑃𝑃𝑅𝑅𝐿𝐿𝑇𝑇𝑇𝑇
�+ 𝛽𝛽4 �𝑁𝑁𝐼𝐼𝐿𝐿𝑇𝑇𝑇𝑇
�+ 𝜀𝜀
Where:
TA = NI – CFO, where NI (net income) is taken from the statement of income
and CFO (operating cash flows) is taken from the statement of cash flows.
∆ REV = Change in Revenues from the preceding year
∆ AR = Change in Accounts Receivable from the preceding year
PPE = Gross Value of Property , Plant & Equipment
NI = Net Income
LTA = Lagged Total Assets
Each ß is the estimated relationship of the independent variable to the dependent variable, and the error
term represents the composite effect of all variables not explicitly stated as an independent variable.
4.2.2.2 Measuring firm’s accounting accruals by using regression Equation
The above coefficient estimates (ß value) are used in the following regression equation to estimate the
firm-specific normal accruals (NA) or non-discretionary accruals for our sample firms:
�𝑇𝑇𝑇𝑇𝐿𝐿𝑇𝑇𝑇𝑇
� = 𝛽𝛽1 �1𝐿𝐿𝑇𝑇𝑇𝑇
� + 𝛽𝛽2 �∆ 𝑅𝑅𝑅𝑅𝑅𝑅 − ∆ 𝑇𝑇𝑅𝑅
𝐿𝐿𝑇𝑇𝑇𝑇�+ 𝛽𝛽3 �
𝑃𝑃𝑃𝑃𝑅𝑅𝐿𝐿𝑇𝑇𝑇𝑇
�+ 𝛽𝛽4 �𝑁𝑁𝐼𝐼𝐿𝐿𝑇𝑇𝑇𝑇
�
Where:
AA = Accounting (Non-Discretionary) Accruals
∆ REV = Change in Revenues from the preceding year
∆ AR = Change in Accounts Receivable from the preceding year
PPE = Gross Value of Property , Plant & Equipment
NI = Net Income
LTA = Lagged Total Assets
PAGE 26| Journal of Corporate Governance, Insurance, and Risk Management | 2014, VOL. 1, Series. 1
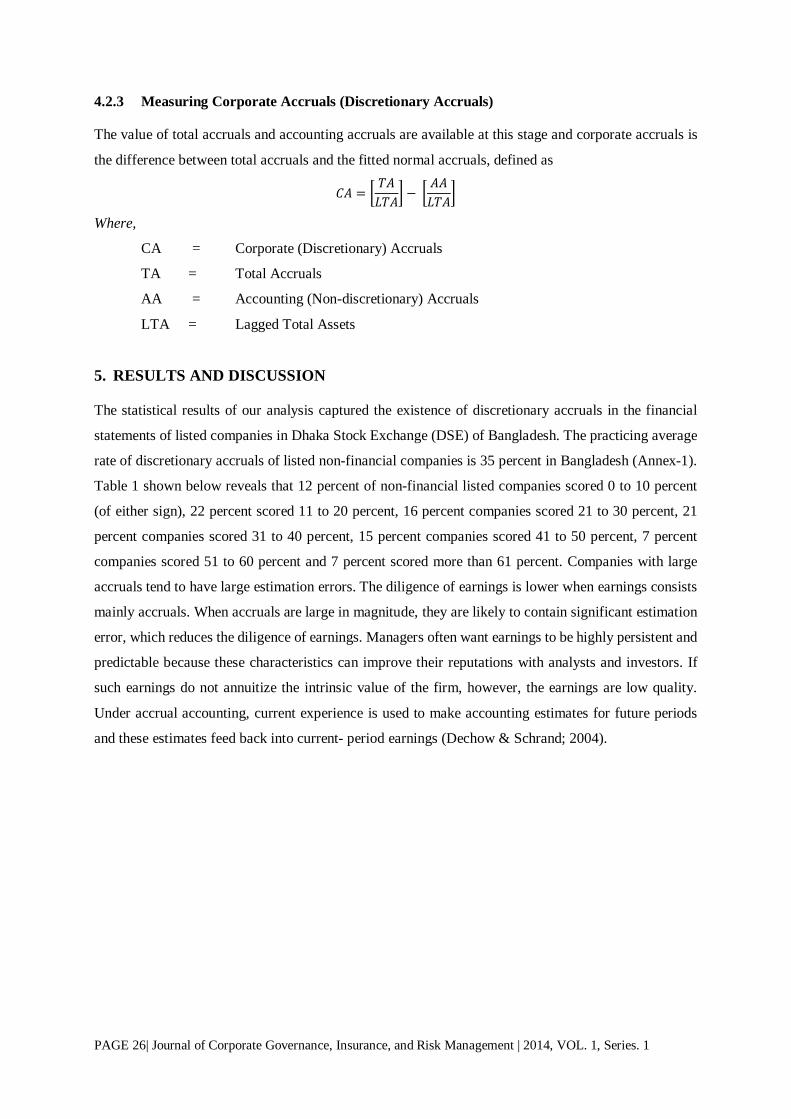
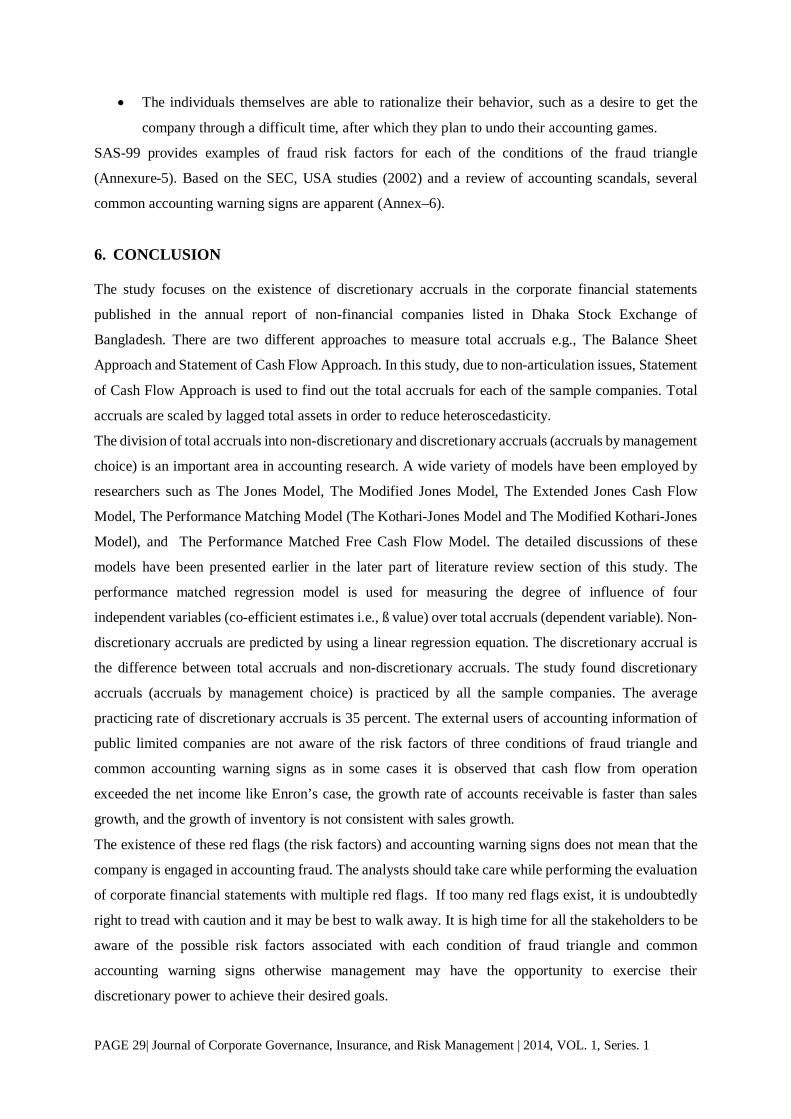
4.2.3 Measuring Corporate Accruals (Discretionary Accruals)
The value of total accruals and accounting accruals are available at this stage and corporate accruals is
the difference between total accruals and the fitted normal accruals, defined as
𝐶𝐶𝑇𝑇 = �𝑇𝑇𝑇𝑇𝐿𝐿𝑇𝑇𝑇𝑇
� − �𝑇𝑇𝑇𝑇𝐿𝐿𝑇𝑇𝑇𝑇
�
Where,
CA = Corporate (Discretionary) Accruals
TA = Total Accruals
AA = Accounting (Non-discretionary) Accruals
LTA = Lagged Total Assets
5. RESULTS AND DISCUSSION
The statistical results of our analysis captured the existence of discretionary accruals in the financial
statements of listed companies in Dhaka Stock Exchange (DSE) of Bangladesh. The practicing average
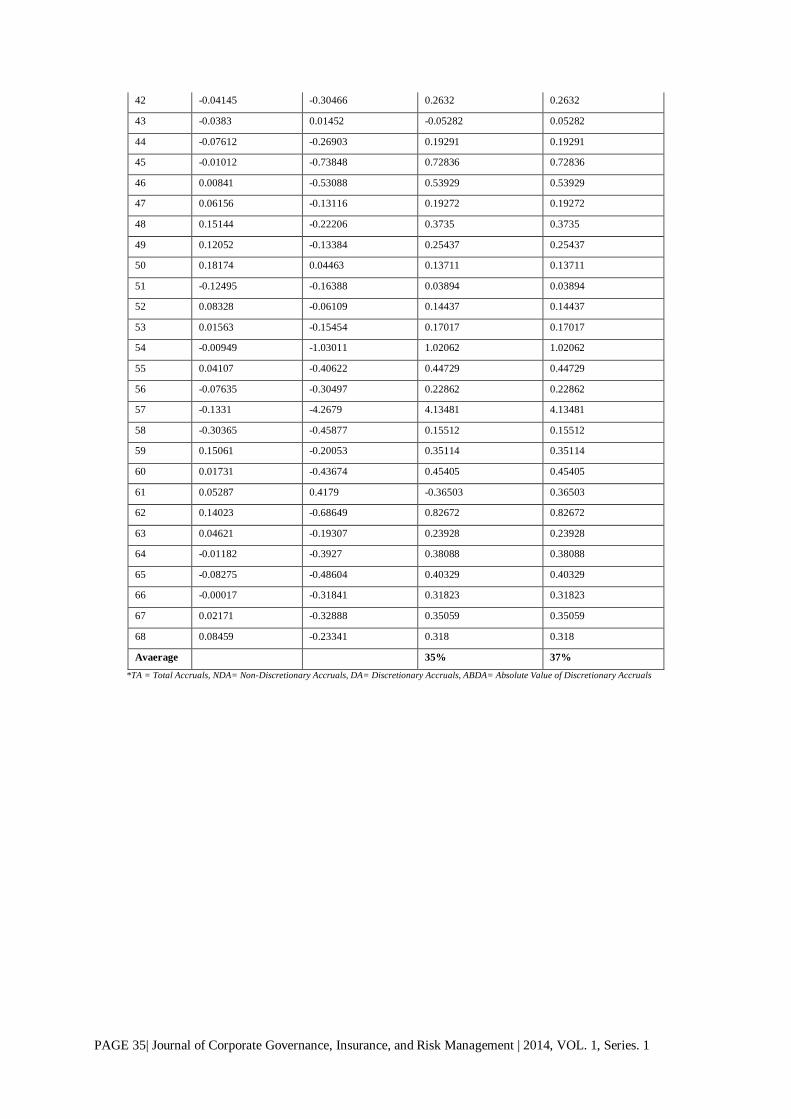
rate of discretionary accruals of listed non-financial companies is 35 percent in Bangladesh (Annex-1).
Table 1 shown below reveals that 12 percent of non-financial listed companies scored 0 to 10 percent
(of either sign), 22 percent scored 11 to 20 percent, 16 percent companies scored 21 to 30 percent, 21
percent companies scored 31 to 40 percent, 15 percent companies scored 41 to 50 percent, 7 percent
companies scored 51 to 60 percent and 7 percent scored more than 61 percent. Companies with large
accruals tend to have large estimation errors. The diligence of earnings is lower when earnings consists
mainly accruals. When accruals are large in magnitude, they are likely to contain significant estimation
error, which reduces the diligence of earnings. Managers often want earnings to be highly persistent and
predictable because these characteristics can improve their reputations with analysts and investors. If
such earnings do not annuitize the intrinsic value of the firm, however, the earnings are low quality.
Under accrual accounting, current experience is used to make accounting estimates for future periods
and these estimates feed back into current- period earnings (Dechow & Schrand; 2004).

PAGE 27| Journal of Corporate Governance, Insurance, and Risk Management | 2014, VOL. 1, Series. 1
Table 2 :Distribution of Corporate Accruals
Class interval of
discretionary
accruals, (%)
Frequency (No of companies)
No of companies (%)
< 10 8 12%
11 – 20 15 22%
21 – 30 11 16%
31 – 40 14 21%
41 – 50 10 15%
51 – 60 5 7%
61 < 5 7%
68 100%
The quality of accruals can vary among companies as a function of accruals even in the absence of
intentional earnings manipulation. The determination of earnings requires estimations and judgments
and some companies require more forecasts and estimates than others. For example, companies in
growing industries will typically have high accruals, which raises a question about reliability because
accruals are likely to contain estimation errors. Estimation errors reduce earnings persistence (because
they must be corrected in future earnings) and are irrelevant for valuation. Therefore, large accruals (of
either sign) can indicate great underlying volatility in the company’s operations and low-quality
earnings. Accrual accounting opens the door to opportunistic short-run income smoothing that can lead
to future restatements and write-downs. In this method, the company does not change its activities but,
rather, opportunistically reports income for an existing activity. Examples, increase in income is
reducing the allowance for doubtful accounts, capitalizing rather than expensing costs, and avoiding
write-offs of assets. Accruals create the opportunity for earnings management because they require
managers to make forecasts, estimates, and judgments. Many studies found that high accruals, in
absolute magnitude, are a potential “red flag” that indicates companies are engaged in earnings
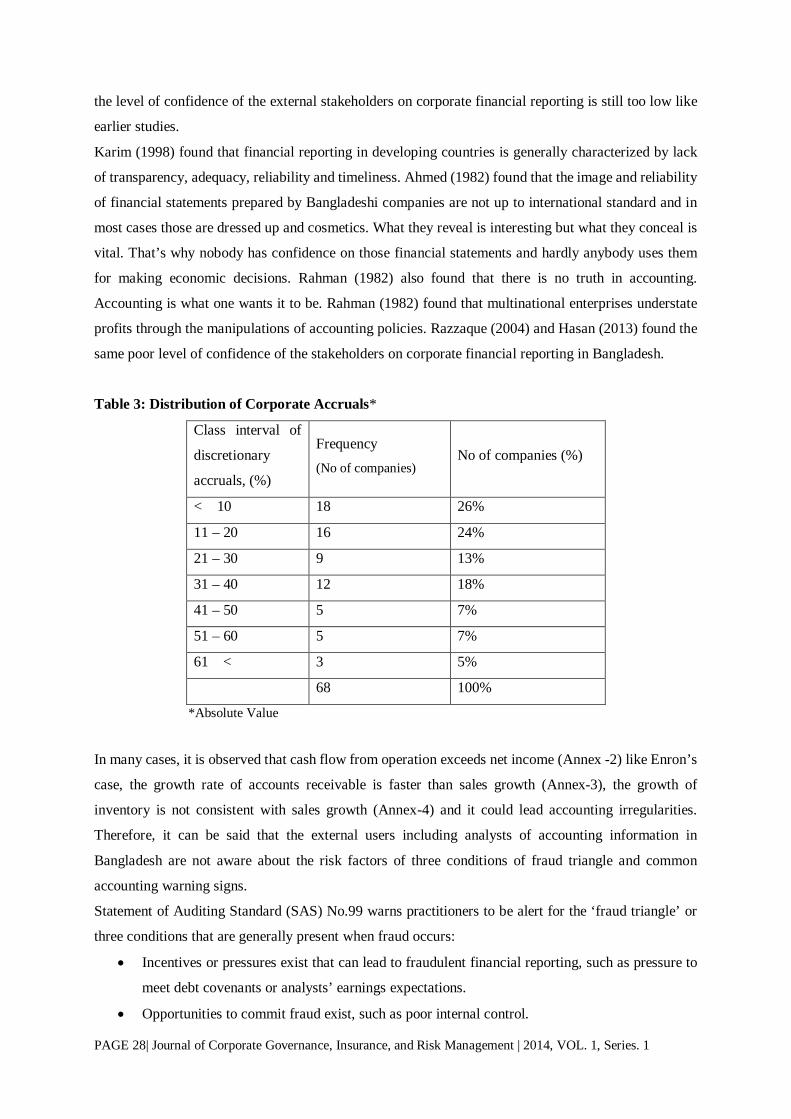
management. In absolute magnitude, the result shows that the average rate of practicing discretionary
accruals of listed non-financial companies in Bangladesh is 37 percent (Annex-1). Table 2 reveals that
26 percent of sample companies scored 0 to 10 percent, 24 percent of sample companies scored 11 to
20 percent, 13 percent of sample companies scored 21 to 30 percent, 18 percent of sample companies
scored 31 to 40 percent, 7 percent of sample companies scored 41 to 50 percent, 7 percent of sample
companies scored 51 to 60 percent and 5 percent of sample companies scored more than 61 percent
respectively. Thus, on the whole, 74 percent of the sample companies scored more than 10 percent,
which is clearly a ‘red flag’ for all the stakeholders both internal and external. It is also evident that
management is abusing their discretionary power through manipulating accounting accruals. As a result,
PAGE 28| Journal of Corporate Governance, Insurance, and Risk Management | 2014, VOL. 1, Series. 1
the level of confidence of the external stakeholders on corporate financial reporting is still too low like
earlier studies.
Karim (1998) found that financial reporting in developing countries is generally characterized by lack
of transparency, adequacy, reliability and timeliness. Ahmed (1982) found that the image and reliability
of financial statements prepared by Bangladeshi companies are not up to international standard and in
most cases those are dressed up and cosmetics. What they reveal is interesting but what they conceal is
vital. That’s why nobody has confidence on those financial statements and hardly anybody uses them
for making economic decisions. Rahman (1982) also found that there is no truth in accounting.
Accounting is what one wants it to be. Rahman (1982) found that multinational enterprises understate
profits through the manipulations of accounting policies. Razzaque (2004) and Hasan (2013) found the
same poor level of confidence of the stakeholders on corporate financial reporting in Bangladesh.
Table 3: Distribution of Corporate Accruals*
Class interval of
discretionary
accruals, (%)
Frequency (No of companies)
No of companies (%)
< 10 18 26%
11 – 20 16 24%
21 – 30 9 13%
31 – 40 12 18%
41 – 50 5 7%
51 – 60 5 7%
61 < 3 5%
68 100%
*Absolute Value
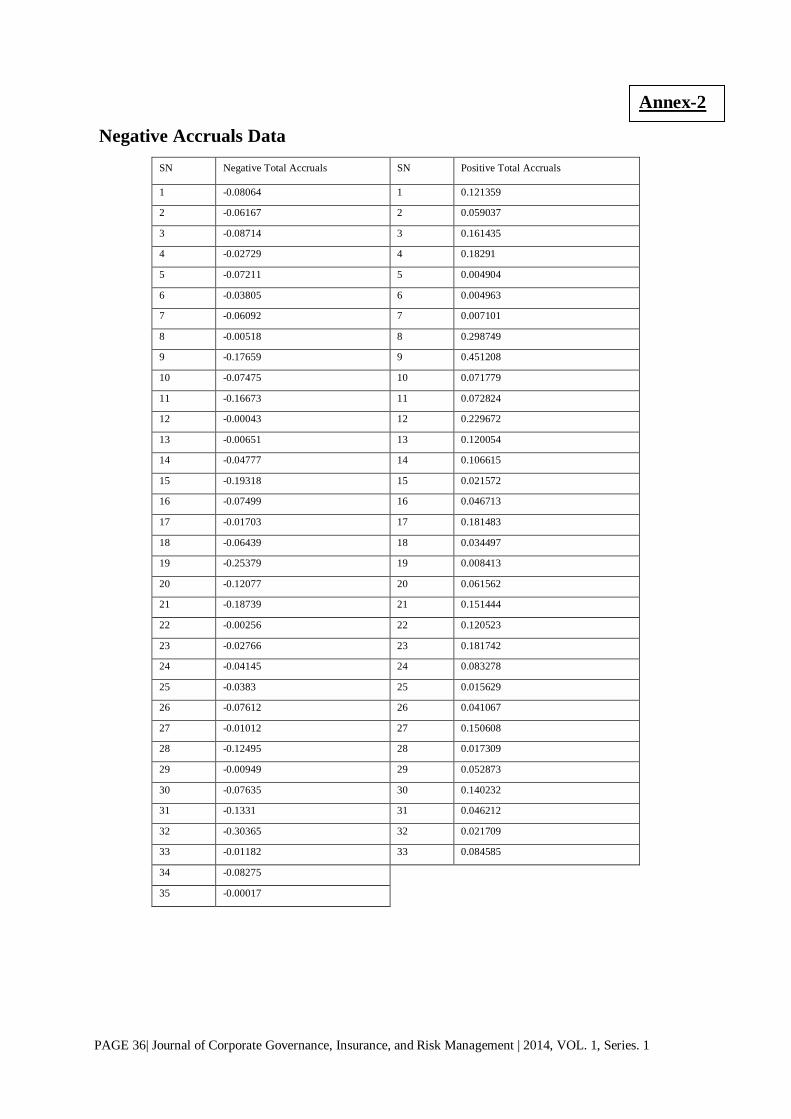
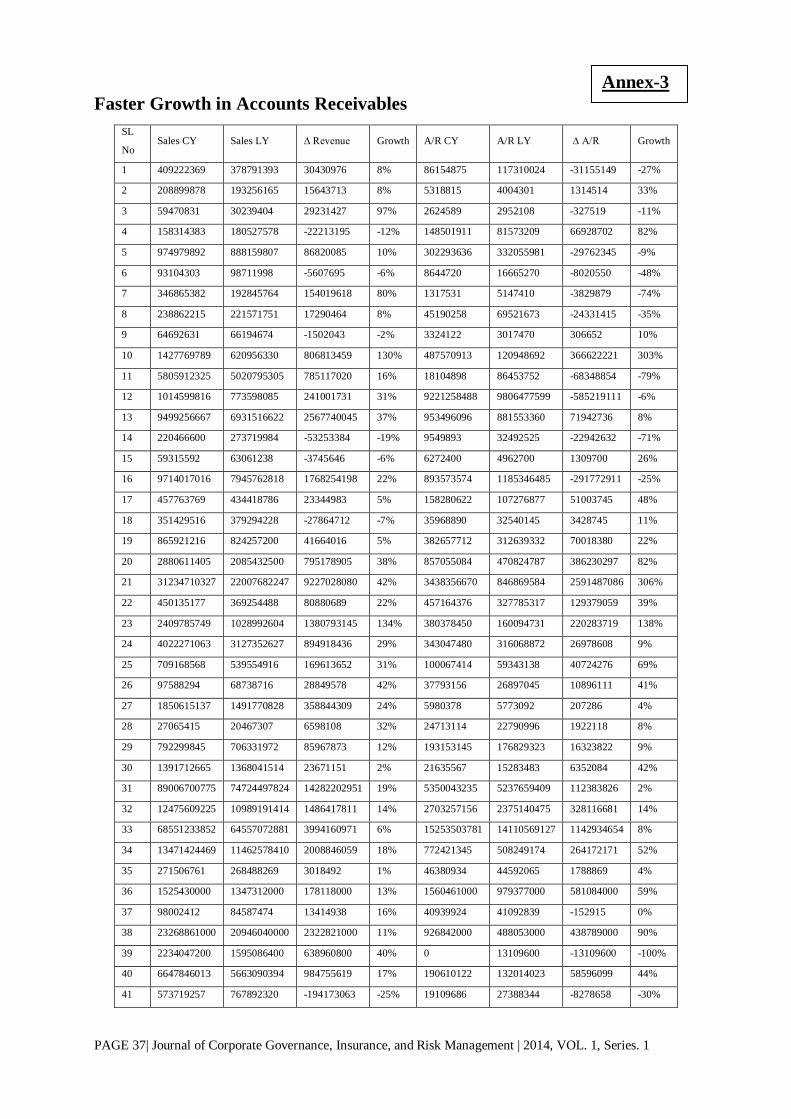
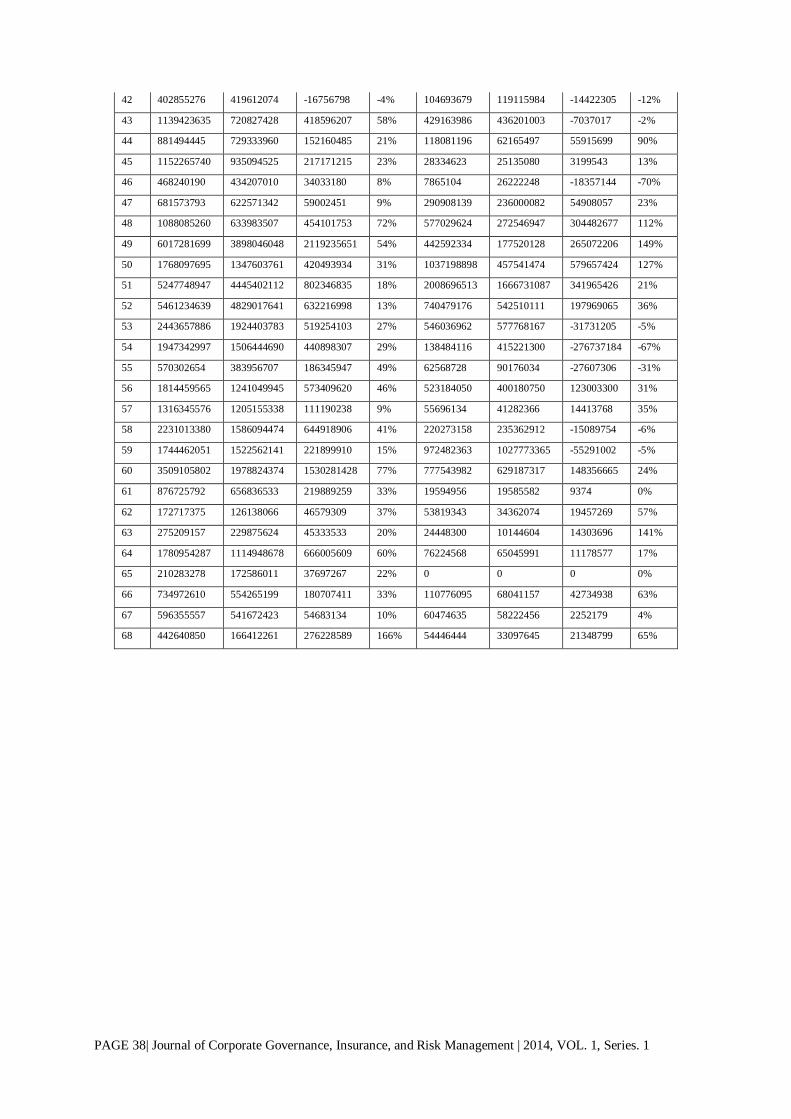
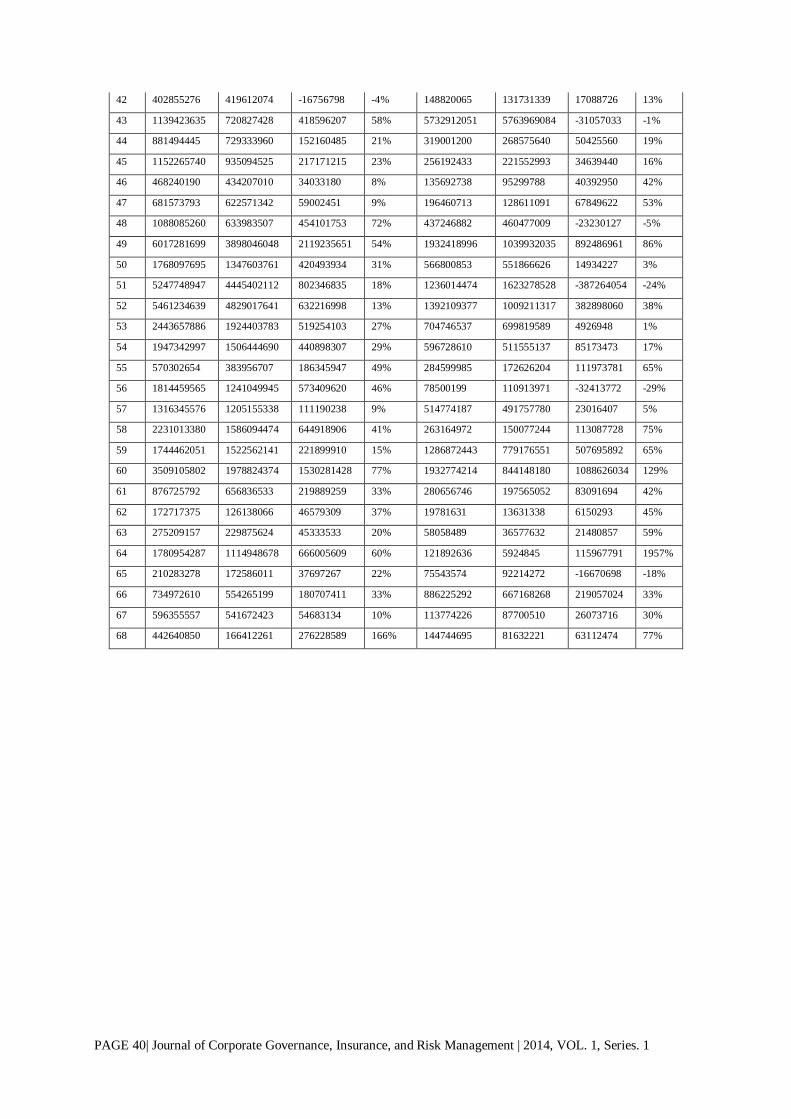
In many cases, it is observed that cash flow from operation exceeds net income (Annex -2) like Enron’s
case, the growth rate of accounts receivable is faster than sales growth (Annex-3), the growth of
inventory is not consistent with sales growth (Annex-4) and it could lead accounting irregularities.
Therefore, it can be said that the external users including analysts of accounting information in
Bangladesh are not aware about the risk factors of three conditions of fraud triangle and common
accounting warning signs.
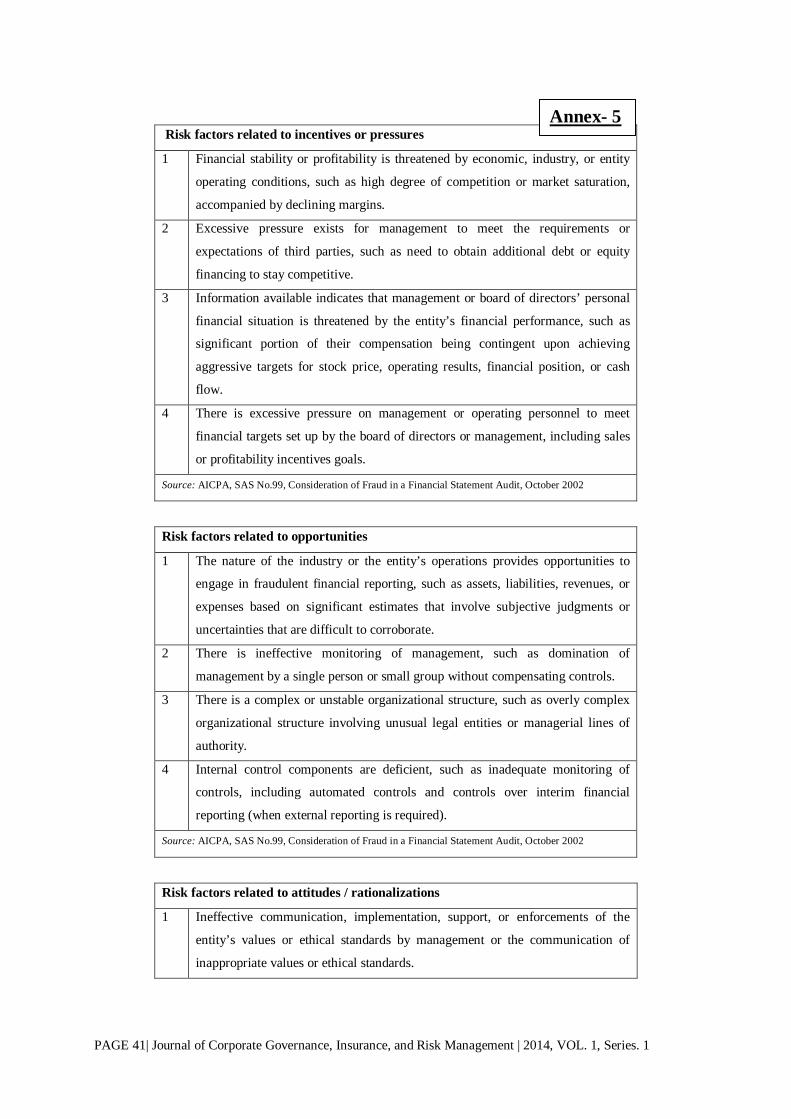
Statement of Auditing Standard (SAS) No.99 warns practitioners to be alert for the ‘fraud triangle’ or
three conditions that are generally present when fraud occurs:
• Incentives or pressures exist that can lead to fraudulent financial reporting, such as pressure to
meet debt covenants or analysts’ earnings expectations.
• Opportunities to commit fraud exist, such as poor internal control.
PAGE 29| Journal of Corporate Governance, Insurance, and Risk Management | 2014, VOL. 1, Series. 1
• The individuals themselves are able to rationalize their behavior, such as a desire to get the
company through a difficult time, after which they plan to undo their accounting games.
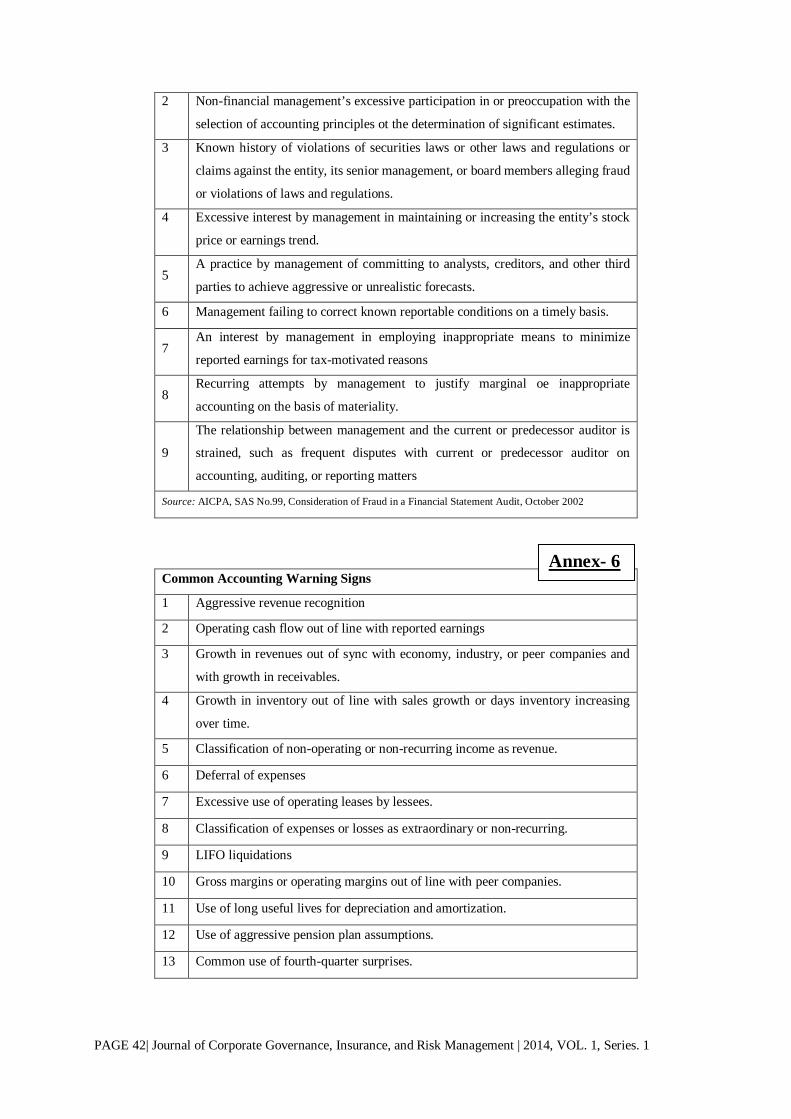
SAS-99 provides examples of fraud risk factors for each of the conditions of the fraud triangle
(Annexure-5). Based on the SEC, USA studies (2002) and a review of accounting scandals, several
common accounting warning signs are apparent (Annex–6).
6. CONCLUSION
The study focuses on the existence of discretionary accruals in the corporate financial statements
published in the annual report of non-financial companies listed in Dhaka Stock Exchange of
Bangladesh. There are two different approaches to measure total accruals e.g., The Balance Sheet
Approach and Statement of Cash Flow Approach. In this study, due to non-articulation issues, Statement
of Cash Flow Approach is used to find out the total accruals for each of the sample companies. Total
accruals are scaled by lagged total assets in order to reduce heteroscedasticity.
The division of total accruals into non-discretionary and discretionary accruals (accruals by management
choice) is an important area in accounting research. A wide variety of models have been employed by
researchers such as The Jones Model, The Modified Jones Model, The Extended Jones Cash Flow
Model, The Performance Matching Model (The Kothari-Jones Model and The Modified Kothari-Jones
Model), and The Performance Matched Free Cash Flow Model. The detailed discussions of these
models have been presented earlier in the later part of literature review section of this study. The
performance matched regression model is used for measuring the degree of influence of four
independent variables (co-efficient estimates i.e., ß value) over total accruals (dependent variable). Non-
discretionary accruals are predicted by using a linear regression equation. The discretionary accrual is
the difference between total accruals and non-discretionary accruals. The study found discretionary
accruals (accruals by management choice) is practiced by all the sample companies. The average
practicing rate of discretionary accruals is 35 percent. The external users of accounting information of
public limited companies are not aware of the risk factors of three conditions of fraud triangle and
common accounting warning signs as in some cases it is observed that cash flow from operation
exceeded the net income like Enron’s case, the growth rate of accounts receivable is faster than sales
growth, and the growth of inventory is not consistent with sales growth.
The existence of these red flags (the risk factors) and accounting warning signs does not mean that the
company is engaged in accounting fraud. The analysts should take care while performing the evaluation
of corporate financial statements with multiple red flags. If too many red flags exist, it is undoubtedly
right to tread with caution and it may be best to walk away. It is high time for all the stakeholders to be
aware of the possible risk factors associated with each condition of fraud triangle and common
accounting warning signs otherwise management may have the opportunity to exercise their
discretionary power to achieve their desired goals.
PAGE 30| Journal of Corporate Governance, Insurance, and Risk Management | 2014, VOL. 1, Series. 1
Findings of this study warrant further investigation on decomposition of discretionary components of
accruals for each of the listed companies in DSE.
ACKNOWLEDGEMENT
The authors acknowledge the involvements and comments of the following well-known researchers:
Ahsan Habib, Auckland University of Technology, New Zealand; Asheq Rahman, Massey University,
New Zealand; Zahirul Hoque and Jahangir Alam, La Trobe University, Australia; Jim Rooney,
University of Sydney, Australia; Mohammed Omran, University of Queensland, Australia; Helen
Samujh, University of Waikato, New Zealand
BIBLIOGRAPHY
Ahmed, M. (1982), Evaluation of financial statement as a communication device in Bangladesh,
Institute of Chartered Accountants of Bangladesh, Dhaka.
Ashbagh, H., Lafond, R. and Mayhew, B. W. (2003), “Do non-audit services comprise auditor
independence? Further evidence”, The Accounting Review, Vol. 78, pp. 611- 639.
Ball, R. and Shivkumar, L. (2008), “Earnings quality at initial public offerings”, Journal of
Accounting and Economics, Vol. 45, No.2-3, pp. 324-349.
Balsam, S. (1998) “Discretionary accounting choices and CEO compensation”, Contemporary
Accounting Research, Vol. 15, No. 3, pp. 229-252.
Barber, W. R. and Fairfield, P.M. (1991), “The effect of concern about reported income on
discretionary spending decisions: The case of research and development”, The Accounting
Review, Vol. 66, No.4, pp. 818-829.
Barton, J. and Simko, P. J. (2002), “The balance sheet as an earnings management constraint” The
Accounting Review , Vol. 77, pp. 1-27.
Beneish, M. D. (1997), “Detecting GAAP violation: Implications for assessing earnings
management among firms with extreme financial performance”, Journal of Accounting and
Public Policy, Vol. 16, No.3, pp. 271-309.
Beneish, M.D. (2001), “Earnings management: A perspective” Managerial Finance, Vol. 27, No.
12, p. 3.
Bernard, V. L. and Skinner, D. J. (1996), “What motivates manager’ choice of discretionary
accruals?”, Journal of Accounting and Economics, Vol. 22 (August- December), pp. 313-325.
Bhuiyan, U. B. M., Jamal, R. and Clark, M. (2013), “Corporate governance compliance and
discretionary accruals: New Zealand evidence”, Australasian Accounting Business and
Finance Journal, Vol. 7, No. 2, pp. 87-109.
PAGE 31| Journal of Corporate Governance, Insurance, and Risk Management | 2014, VOL. 1, Series. 1
Bukit, B.R. and Iskandar, M.T. (2009), “Surplus free cash flow, earnings management and audit
committee”, International Journal of Economics and Management, Vol. 3, No. 1,
pp.204-223.
Burgstahler, D. and Dichev, I. (1997,” Earning management to avoid earnings decreases and losses”,
Journal of Accounting and Economics, Vol. 24, No.1, pp. 99-126.
Bushee, B. J. (1998), “The influence of institutional investors in myopic R & D investment behavior”,
The Accounting Review , Vol. 73, No. 3, p. 305.
Cheng, Q. and Warfield, T. D. (2005), “ Equity incentives and earnings management”,
TheAccounting Review, Vol. 80, No. 2, pp. 441-476.
CFA Program Curriculum (2012), Financial reporting and analysis, financial reporting quality: Red
flags and accounting warning signs, Reading 33, pp. 587-608.
DeAnglo, L. (1986), “Accounting numbers as market valuation substitutes: A study of
management buyouts of public shareholders”, The Accounting Review, Vol. 61, No. 3, pp. 400-420.
Dechow, P. M., Solan, R. G., and Sweeney, A. P. (1995), “Detecting earnings management’,
The Accounting Review, Vol. 70, pp. 193-225.
Dechow, M. P. and Schrand, M.C. (2004), Earnings quality, Monograph, Research
Foundation of CFA Institute.
Dechow, P. M. (1994), “Accounting earnings and cash flows as measures of firm performance: The
role of accounting accruals”, Journal of Accounting and Economics, Vol. 18, pp. 3-42.
Dechow, P. M., and Skinner, D. J. (2000), “Earnings management: Reconciling the views
of accounting academics, practitioners, and regulators’, Accounting Horizons 14 (2), 235-250.
Dechow, P.M., and Ge, W. 2006. The persistence of earnings and cash flows and the role of
special items: Implications for the accrual anomaly. Review of Accounting Studies 11, 253-
296.
Dechow, P., Ge, W. and Schrand, C. (2010), “Understanding earnings quality: A review of the
proxies, their determinants and their consequences”, Journal of Accounting and Economics,
Vol. 50, No. 2, pp. 344 – 401.
Ecker, F., Francis, J., Olsson, P. and Schipper, K. (2012), Estimation sample selection for
discretionary accruals models, Fuqua School of Business, Duke University, Durham.
Hasan, M.S. (2013), Corporate financial reporting in developing countries: Evidence
from Bangladesh, Scholars’ Press, Germany
Healy, P.M. (1985), “The effect of bonus schemes on accounting decisions”, Journal of Accounting &
Economics”, Vol. 7, No. 1-3, pp. 85-107.
Healy, P.M. and Wahlen, J.M. (1999), “A review of the earnings management literature and its
implications for standard setting”, Accounting Horizons, Vol. 13, No. 4, pp. 365-383.
Ingram, R.W. and Lee, T. A. (2007), “Information provided by accrual and cash flow measures of
operating activities” ABACUS, Vol. 33, No. 2, pp. 168-185.
PAGE 32| Journal of Corporate Governance, Insurance, and Risk Management | 2014, VOL. 1, Series. 1
Islam, A.M., Ruhani, A. and Zamri, A.(2011), “ Is modified Jones model effective in detecting
earnings management? Evidence from a developing economy”, International Journal of
Economics and Finance, Vol. 3, No. 2, pp. 116-125.
Jain, P.K., Kim, J. and Rezaee, Z. (2003),”Have the Sarbanes-Oxley Act of 2002 and the CEO
certifications made the market participants more informed? “, Working Paper, University of
Memphis.
_____ (2006), “The Sarbanes-Oxley Act of 2002 and capital market behavior: Early evidence”,
Contemporary Accounting Research, Vol. 23, No. 3, pp. 629-654.
Jeter, C. D. and Shivakumar, L. (1999), “Cross-sectional estimation of abnormal accruals using
quarterly and annual data: Effectiveness in detecting event-specific earnings management”,
Accounting and Business Research, Vol. 29, No. 4.
Jones, J. J. (1991), Earnings management during import relief investigations. Journal of Accounting
Research, Vol. 29, No. 2, pp. 193-228.
Joseph, H. and Norman, W. (2004), “What can the history of state-run enterprises teach us in the post-
Enron era?”, Journal of Business Ethics, Vol. 53, pp. 247-265.
Karim, A.K.M. Waresul, M. A. Islam and Chowdhury, A. (1998), “Financial reporting in Bangladesh:
The regulatory framework”, Journal of Business Administration, Vol. 24, No. 1 & 2, p. 58.
Kasznik, R. (1999), “On the association between voluntary disclosure and earnings Management”,
Journal of Accounting Research, Vol. 37, No.1, pp. 57-81.
Keefe, T. (2013), “Earnings quality” Investopedia, available at
http://www.investopedia.com/university/accounting-earnings-quality/
Kothari, S., Leone, A. and Wasley, C. (2005), “Performance matched discretionary accrual
Measures”, Journal of Accounting and Economics, Vol. 39, pp. 163–197.
Lara, M. J., Beatriz, G. O. and Neophytou, E., (2009), “Earnings quality in ex-post failed
firms. Accounting and Business Research”, Vol. 39, pp.119-138.
Larcker, D. and Richardson, S. (2004), “Fees paid to audit firms, accrual choices, and
corporate governance”, Journal of Accounting Literature, Vol. 42, p. 3, pp. 625-658.
Leuz, C., Nanda, D. and Wysocki, P. D. (2003), “Earnings management and investor
protection: An international comparison”, Journal of Financial Economics, Vol. 69, No. 3, pp. 505-527.
McNichols, M. and Wilson, G.P. (1988), “Evidence of earnings management from the
provision for bad debts”, Journal of Accounting Research, Vol. 26, No. 3, pp. 1-31.
Pae, J. (2011), “A synthesis of accrual quality and abnormal accrual models: An empirical
implementation”, Asia-Pacific Journal of Accounting & Economics, Vol.18, pp. 27-44.
Peasnell, K. V. Pope, P. F. and Young, S. (2000), “Detecting earnings management using cross-
sectional abnormal accruals models”, Accounting & Business Research, Vol. 30, No.4,
pp. 313-326.
Rahman, M. A. (1978), “A note on controls and accounting in nationalized corporations in
PAGE 33| Journal of Corporate Governance, Insurance, and Risk Management | 2014, VOL. 1, Series. 1
Bangladesh”, The Journal of Management, Business and Economics, Vol. 4, No. 1, p. 77.
Rahman, M. Z. (1982), “The paradox of low profitability of multinationals in less
developed countries: A case study of Bangladesh” Working Paper, Series No. 8211,
University of Manchester, UK, p. 34.
Razzaque, S.I.M.A. (2004), Financial reporting and corporate governance in Bangladesh: A
study on some manufacturing companies listed In The Dhaka Stock Exchange Ltd., Unpublished
PhD Thesis. University of Rajshahi, Bangladesh.
Rezaee, Z. (2004), Corporate governance role in financial reporting. Research in
Accounting Regulation, Vol. 17, pp. 107-149.
Roodposhti, F. R., Rezaei, B. B. S, and Salehi, A. (2012), Analysis of power and specification of
accruals-based models to detect earnings management. Journal of Basic and Applied Scientific
Research, Vol. 2, No.10, pp. 9961-69.
Thomas, J. and Zhang, X. (1999), “Identifying unexpected accruals: A comparison of
current approaches”, Journal of Accounting and Public Policy, Vol. 19 (Winter), p.347.
Xie, H. (2001), “The mispricing of abnormal accruals”, The Accounting Review, Vol. 76, No.3, p.
357.
Xie, B., Davidson, W. N. and DaDalt, P. J. (2003), “Earnings management and corporate governance:
The role of the board and the audit committee”, Journal of Corporate Finance, Vol. 9, No. 3,
pp. 295-316.
Wilson, P. (1996), “Discussion: Write-offs: Manipulation of impairment? Journal of Accounting
Research, Vol. 34(June), pp.171-177.

PAGE 34| Journal of Corporate Governance, Insurance, and Risk Management | 2014, VOL. 1, Series. 1
Accruals Data
SN TA AA/NDA CA/DA AVDA/AVCA
1 -0.08064 -0.43823 0.35759 0.35759
2 -0.06167 -0.63757 0.5759 0.5759
3 -0.08714 -0.54974 0.46261 0.46261
4 0.12136 -0.44044 0.5618 0.5618
5 -0.02729 -0.29067 0.26338 0.26338
6 -0.07211 -0.62908 0.55697 0.55697
7 -0.03805 -0.54223 0.50417 0.50417
8 -0.06092 -0.45033 0.38941 0.38941
9 -0.00518 -0.22245 0.21727 0.21727
10 0.05904 -0.09688 0.15592 0.15592
11 0.16143 0.11607 0.04537 0.04537
12 -0.17659 0.00203 -0.17862 0.17862
13 0.18291 -0.18828 0.37119 0.37119
14 -0.07475 -0.21653 0.14179 0.14179
15 0.0049 -0.2444 0.2493 0.2493
16 -0.16673 -0.30526 0.13853 0.13853
17 -0.00043 -0.37041 0.36998 0.36998
18 0.00496 -0.41305 0.41801 0.41801
19 0.0071 -0.57176 0.57887 0.57887
20 0.29875 -0.42375 0.7225 0.7225
21 0.45121 -0.01746 0.46866 0.46866
22 0.07178 -0.0875 0.15928 0.15928
23 0.07282 -0.22029 0.29311 0.29311
24 0.22967 -0.1882 0.41788 0.41788
25 0.12005 -0.30653 0.42658 0.42658
26 0.10662 -0.3451 0.45172 0.45172
27 0.02157 -0.16724 0.18881 0.18881
28 -0.00651 -0.17183 0.16532 0.16532
29 0.04671 -0.34473 0.39144 0.39144
30 -0.04777 -0.13801 0.09024 0.09024
31 -0.19318 -0.37667 0.18349 0.18349
32 -0.07499 -0.17008 0.09509 0.09509
33 0.18148 -0.0916 0.27309 0.27309
34 -0.01703 -0.24259 0.22556 0.22556
35 -0.06439 -0.17536 0.11097 0.11097
36 -0.25379 -0.00165 -0.25214 0.25214
37 -0.12077 -0.50041 0.37964 0.37964
38 -0.18739 -0.18977 0.00238 0.00238
39 -0.00256 0.00186 -0.00442 0.00442
40 -0.02766 -0.10096 0.0733 0.0733
41 0.0345 -0.42143 0.45593 0.45593
Annex-1
PAGE 35| Journal of Corporate Governance, Insurance, and Risk Management | 2014, VOL. 1, Series. 1
42 -0.04145 -0.30466 0.2632 0.2632
43 -0.0383 0.01452 -0.05282 0.05282
44 -0.07612 -0.26903 0.19291 0.19291
45 -0.01012 -0.73848 0.72836 0.72836
46 0.00841 -0.53088 0.53929 0.53929
47 0.06156 -0.13116 0.19272 0.19272
48 0.15144 -0.22206 0.3735 0.3735
49 0.12052 -0.13384 0.25437 0.25437
50 0.18174 0.04463 0.13711 0.13711
51 -0.12495 -0.16388 0.03894 0.03894
52 0.08328 -0.06109 0.14437 0.14437
53 0.01563 -0.15454 0.17017 0.17017
54 -0.00949 -1.03011 1.02062 1.02062
55 0.04107 -0.40622 0.44729 0.44729
56 -0.07635 -0.30497 0.22862 0.22862
57 -0.1331 -4.2679 4.13481 4.13481
58 -0.30365 -0.45877 0.15512 0.15512
59 0.15061 -0.20053 0.35114 0.35114
60 0.01731 -0.43674 0.45405 0.45405
61 0.05287 0.4179 -0.36503 0.36503
62 0.14023 -0.68649 0.82672 0.82672
63 0.04621 -0.19307 0.23928 0.23928
64 -0.01182 -0.3927 0.38088 0.38088
65 -0.08275 -0.48604 0.40329 0.40329
66 -0.00017 -0.31841 0.31823 0.31823
67 0.02171 -0.32888 0.35059 0.35059
68 0.08459 -0.23341 0.318 0.318
Avaerage 35% 37%
*TA = Total Accruals, NDA= Non-Discretionary Accruals, DA= Discretionary Accruals, ABDA= Absolute Value of Discretionary Accruals
PAGE 36| Journal of Corporate Governance, Insurance, and Risk Management | 2014, VOL. 1, Series. 1
Negative Accruals Data
SN Negative Total Accruals SN Positive Total Accruals
1 -0.08064 1 0.121359
2 -0.06167 2 0.059037
3 -0.08714 3 0.161435
4 -0.02729 4 0.18291
5 -0.07211 5 0.004904
6 -0.03805 6 0.004963
7 -0.06092 7 0.007101
8 -0.00518 8 0.298749
9 -0.17659 9 0.451208
10 -0.07475 10 0.071779
11 -0.16673 11 0.072824
12 -0.00043 12 0.229672
13 -0.00651 13 0.120054
14 -0.04777 14 0.106615
15 -0.19318 15 0.021572
16 -0.07499 16 0.046713
17 -0.01703 17 0.181483
18 -0.06439 18 0.034497
19 -0.25379 19 0.008413
20 -0.12077 20 0.061562
21 -0.18739 21 0.151444
22 -0.00256 22 0.120523
23 -0.02766 23 0.181742
24 -0.04145 24 0.083278
25 -0.0383 25 0.015629
26 -0.07612 26 0.041067
27 -0.01012 27 0.150608
28 -0.12495 28 0.017309
29 -0.00949 29 0.052873
30 -0.07635 30 0.140232
31 -0.1331 31 0.046212
32 -0.30365 32 0.021709
33 -0.01182 33 0.084585
34 -0.08275
35 -0.00017
Annex-2
PAGE 37| Journal of Corporate Governance, Insurance, and Risk Management | 2014, VOL. 1, Series. 1
Faster Growth in Accounts Receivables SL
No Sales CY Sales LY ∆ Revenue Growth A/R CY A/R LY ∆ A/R Growth
1 409222369 378791393 30430976 8% 86154875 117310024 -31155149 -27%
2 208899878 193256165 15643713 8% 5318815 4004301 1314514 33%
3 59470831 30239404 29231427 97% 2624589 2952108 -327519 -11%
4 158314383 180527578 -22213195 -12% 148501911 81573209 66928702 82%
5 974979892 888159807 86820085 10% 302293636 332055981 -29762345 -9%
6 93104303 98711998 -5607695 -6% 8644720 16665270 -8020550 -48%
7 346865382 192845764 154019618 80% 1317531 5147410 -3829879 -74%
8 238862215 221571751 17290464 8% 45190258 69521673 -24331415 -35%
9 64692631 66194674 -1502043 -2% 3324122 3017470 306652 10%
10 1427769789 620956330 806813459 130% 487570913 120948692 366622221 303%
11 5805912325 5020795305 785117020 16% 18104898 86453752 -68348854 -79%
12 1014599816 773598085 241001731 31% 9221258488 9806477599 -585219111 -6%
13 9499256667 6931516622 2567740045 37% 953496096 881553360 71942736 8%
14 220466600 273719984 -53253384 -19% 9549893 32492525 -22942632 -71%
15 59315592 63061238 -3745646 -6% 6272400 4962700 1309700 26%
16 9714017016 7945762818 1768254198 22% 893573574 1185346485 -291772911 -25%
17 457763769 434418786 23344983 5% 158280622 107276877 51003745 48%
18 351429516 379294228 -27864712 -7% 35968890 32540145 3428745 11%
19 865921216 824257200 41664016 5% 382657712 312639332 70018380 22%
20 2880611405 2085432500 795178905 38% 857055084 470824787 386230297 82%
21 31234710327 22007682247 9227028080 42% 3438356670 846869584 2591487086 306%
22 450135177 369254488 80880689 22% 457164376 327785317 129379059 39%
23 2409785749 1028992604 1380793145 134% 380378450 160094731 220283719 138%
24 4022271063 3127352627 894918436 29% 343047480 316068872 26978608 9%
25 709168568 539554916 169613652 31% 100067414 59343138 40724276 69%
26 97588294 68738716 28849578 42% 37793156 26897045 10896111 41%
27 1850615137 1491770828 358844309 24% 5980378 5773092 207286 4%
28 27065415 20467307 6598108 32% 24713114 22790996 1922118 8%
29 792299845 706331972 85967873 12% 193153145 176829323 16323822 9%
30 1391712665 1368041514 23671151 2% 21635567 15283483 6352084 42%
31 89006700775 74724497824 14282202951 19% 5350043235 5237659409 112383826 2%
32 12475609225 10989191414 1486417811 14% 2703257156 2375140475 328116681 14%
33 68551233852 64557072881 3994160971 6% 15253503781 14110569127 1142934654 8%
34 13471424469 11462578410 2008846059 18% 772421345 508249174 264172171 52%
35 271506761 268488269 3018492 1% 46380934 44592065 1788869 4%
36 1525430000 1347312000 178118000 13% 1560461000 979377000 581084000 59%
37 98002412 84587474 13414938 16% 40939924 41092839 -152915 0%
38 23268861000 20946040000 2322821000 11% 926842000 488053000 438789000 90%
39 2234047200 1595086400 638960800 40% 0 13109600 -13109600 -100%
40 6647846013 5663090394 984755619 17% 190610122 132014023 58596099 44%
41 573719257 767892320 -194173063 -25% 19109686 27388344 -8278658 -30%
Annex-3
PAGE 38| Journal of Corporate Governance, Insurance, and Risk Management | 2014, VOL. 1, Series. 1
42 402855276 419612074 -16756798 -4% 104693679 119115984 -14422305 -12%
43 1139423635 720827428 418596207 58% 429163986 436201003 -7037017 -2%
44 881494445 729333960 152160485 21% 118081196 62165497 55915699 90%
45 1152265740 935094525 217171215 23% 28334623 25135080 3199543 13%
46 468240190 434207010 34033180 8% 7865104 26222248 -18357144 -70%
47 681573793 622571342 59002451 9% 290908139 236000082 54908057 23%
48 1088085260 633983507 454101753 72% 577029624 272546947 304482677 112%
49 6017281699 3898046048 2119235651 54% 442592334 177520128 265072206 149%
50 1768097695 1347603761 420493934 31% 1037198898 457541474 579657424 127%
51 5247748947 4445402112 802346835 18% 2008696513 1666731087 341965426 21%
52 5461234639 4829017641 632216998 13% 740479176 542510111 197969065 36%
53 2443657886 1924403783 519254103 27% 546036962 577768167 -31731205 -5%
54 1947342997 1506444690 440898307 29% 138484116 415221300 -276737184 -67%
55 570302654 383956707 186345947 49% 62568728 90176034 -27607306 -31%
56 1814459565 1241049945 573409620 46% 523184050 400180750 123003300 31%
57 1316345576 1205155338 111190238 9% 55696134 41282366 14413768 35%
58 2231013380 1586094474 644918906 41% 220273158 235362912 -15089754 -6%
59 1744462051 1522562141 221899910 15% 972482363 1027773365 -55291002 -5%
60 3509105802 1978824374 1530281428 77% 777543982 629187317 148356665 24%
61 876725792 656836533 219889259 33% 19594956 19585582 9374 0%
62 172717375 126138066 46579309 37% 53819343 34362074 19457269 57%
63 275209157 229875624 45333533 20% 24448300 10144604 14303696 141%
64 1780954287 1114948678 666005609 60% 76224568 65045991 11178577 17%
65 210283278 172586011 37697267 22% 0 0 0 0%
66 734972610 554265199 180707411 33% 110776095 68041157 42734938 63%
67 596355557 541672423 54683134 10% 60474635 58222456 2252179 4%
68 442640850 166412261 276228589 166% 54446444 33097645 21348799 65%

PAGE 39| Journal of Corporate Governance, Insurance, and Risk Management | 2014, VOL. 1, Series. 1
Inconsistent Growth in Inventory SL
No Sales CY Sales LY ∆ Revenue Growth Inventory CY Inventory LY ∆ Inventory Growth
1 409222369 378791393 30430976 8% 46923572 35845349 11078223 31%
2 208899878 193256165 15643713 8% 8426124 7089406 1336718 19%
3 59470831 30239404 29231427 97% 11952326 11826266 126060 1%
4 158314383 180527578 -22213195 -12% 4512329 3321090 1191239 36%
5 974979892 888159807 86820085 10% 317376043 313815439 3560604 1%
6 93104303 98711998 -5607695 -6% 23189309 12461762 10727547 86%
7 346865382 192845764 154019618 80% 143522819 131175686 12347133 9%
8 238862215 221571751 17290464 8% 72618415 62840545 9777870 16%
9 64692631 66194674 -1502043 -2% 9347000 10152000 -805000 -8%
10 1427769789 620956330 806813459 130% 263226755 193502758 69723997 36%
11 5805912325 5020795305 785117020 16% 646758251 534237582 112520669 21%
12 1014599816 773598085 241001731 31% 4746305762 5223057730 -476751968 -9%
13 9499256667 6931516622 2567740045 37% 2828333227 2239199979 589133248 26%
14 220466600 273719984 -53253384 -19% 134880791 118560778 16320013 14%
15 59315592 63061238 -3745646 -6% 40165720 36377090 3788630 10%
16 9714017016 7945762818 1768254198 22% 1040056908 814059612 225997296 28%
17 457763769 434418786 23344983 5% 34268049 20207289 14060760 70%
18 351429516 379294228 -27864712 -7% 75681214 74711893 969321 1%
19 865921216 824257200 41664016 5% 408931379 347461213 61470166 18%
20 2880611405 2085432500 795178905 38% 850885939 450055441 400830498 89%
21 31234710327 22007682247 9227028080 42% 6452929268 3649002576 2803926692 77%
22 450135177 369254488 80880689 22% 459900004 417199584 42700420 10%
23 2409785749 1028992604 1380793145 134% 807801205 240085542 567715663 236%
24 4022271063 3127352627 894918436 29% 587645695 352650104 234995591 67%
25 709168568 539554916 169613652 31% 100367939 63978805 36389134 57%
26 97588294 68738716 28849578 42% 7639356 6955268 684088 10%
27 1850615137 1491770828 358844309 24% 719482437 680748217 38734220 6%
28 27065415 20467307 6598108 32% 172806531 175495791 -2689260 -2%
29 792299845 706331972 85967873 12% 314515290 295080069 19435221 7%
30 1391712665 1368041514 23671151 2% 349148687 347471297 1677390 0%
31 89006700775 74724497824 14282202951 19% 331379759 834355326 -502975567 -60%
32 12475609225 10989191414 1486417811 14% 4026231885 4671791624 -645559739 -14%
33 68551233852 64557072881 3994160971 6% 1815003716 1819262670 -4258954 0%
34 13471424469 11462578410 2008846059 18% 2541688329 2207078082 334610247 15%
35 271506761 268488269 3018492 1% 120593022 117206304 3386718 3%
36 1525430000 1347312000 178118000 13% 8651382000 7360493000 1290889000 18%
37 98002412 84587474 13414938 16% 19181562 17103892 2077670 12%
38 23268861000 20946040000 2322821000 11% 5373033000 4366664000 1006369000 23%
39 2234047200 1595086400 638960800 40% 12283726500 12039800600 243925900 2%
40 6647846013 5663090394 984755619 17% 1756397259 1701382223 55015036 3%
41 573719257 767892320 -194173063 -25% 168634337 155881884 12752453 8%
Annex-4
PAGE 40| Journal of Corporate Governance, Insurance, and Risk Management | 2014, VOL. 1, Series. 1
42 402855276 419612074 -16756798 -4% 148820065 131731339 17088726 13%
43 1139423635 720827428 418596207 58% 5732912051 5763969084 -31057033 -1%
44 881494445 729333960 152160485 21% 319001200 268575640 50425560 19%
45 1152265740 935094525 217171215 23% 256192433 221552993 34639440 16%
46 468240190 434207010 34033180 8% 135692738 95299788 40392950 42%
47 681573793 622571342 59002451 9% 196460713 128611091 67849622 53%
48 1088085260 633983507 454101753 72% 437246882 460477009 -23230127 -5%
49 6017281699 3898046048 2119235651 54% 1932418996 1039932035 892486961 86%
50 1768097695 1347603761 420493934 31% 566800853 551866626 14934227 3%
51 5247748947 4445402112 802346835 18% 1236014474 1623278528 -387264054 -24%
52 5461234639 4829017641 632216998 13% 1392109377 1009211317 382898060 38%
53 2443657886 1924403783 519254103 27% 704746537 699819589 4926948 1%
54 1947342997 1506444690 440898307 29% 596728610 511555137 85173473 17%
55 570302654 383956707 186345947 49% 284599985 172626204 111973781 65%
56 1814459565 1241049945 573409620 46% 78500199 110913971 -32413772 -29%
57 1316345576 1205155338 111190238 9% 514774187 491757780 23016407 5%
58 2231013380 1586094474 644918906 41% 263164972 150077244 113087728 75%
59 1744462051 1522562141 221899910 15% 1286872443 779176551 507695892 65%
60 3509105802 1978824374 1530281428 77% 1932774214 844148180 1088626034 129%
61 876725792 656836533 219889259 33% 280656746 197565052 83091694 42%
62 172717375 126138066 46579309 37% 19781631 13631338 6150293 45%
63 275209157 229875624 45333533 20% 58058489 36577632 21480857 59%
64 1780954287 1114948678 666005609 60% 121892636 5924845 115967791 1957%
65 210283278 172586011 37697267 22% 75543574 92214272 -16670698 -18%
66 734972610 554265199 180707411 33% 886225292 667168268 219057024 33%
67 596355557 541672423 54683134 10% 113774226 87700510 26073716 30%
68 442640850 166412261 276228589 166% 144744695 81632221 63112474 77%
PAGE 41| Journal of Corporate Governance, Insurance, and Risk Management | 2014, VOL. 1, Series. 1
Risk factors related to incentives or pressures
1 Financial stability or profitability is threatened by economic, industry, or entity
operating conditions, such as high degree of competition or market saturation,
accompanied by declining margins.
2 Excessive pressure exists for management to meet the requirements or
expectations of third parties, such as need to obtain additional debt or equity
financing to stay competitive.
3 Information available indicates that management or board of directors’ personal
financial situation is threatened by the entity’s financial performance, such as
significant portion of their compensation being contingent upon achieving
aggressive targets for stock price, operating results, financial position, or cash
flow.
4 There is excessive pressure on management or operating personnel to meet
financial targets set up by the board of directors or management, including sales
or profitability incentives goals.
Source: AICPA, SAS No.99, Consideration of Fraud in a Financial Statement Audit, October 2002
Risk factors related to opportunities
1 The nature of the industry or the entity’s operations provides opportunities to
engage in fraudulent financial reporting, such as assets, liabilities, revenues, or
expenses based on significant estimates that involve subjective judgments or
uncertainties that are difficult to corroborate.
2 There is ineffective monitoring of management, such as domination of
management by a single person or small group without compensating controls.
3 There is a complex or unstable organizational structure, such as overly complex
organizational structure involving unusual legal entities or managerial lines of
authority.
4 Internal control components are deficient, such as inadequate monitoring of
controls, including automated controls and controls over interim financial
reporting (when external reporting is required).
Source: AICPA, SAS No.99, Consideration of Fraud in a Financial Statement Audit, October 2002
Risk factors related to attitudes / rationalizations
1 Ineffective communication, implementation, support, or enforcements of the
entity’s values or ethical standards by management or the communication of
inappropriate values or ethical standards.
Annex- 5
PAGE 42| Journal of Corporate Governance, Insurance, and Risk Management | 2014, VOL. 1, Series. 1
2 Non-financial management’s excessive participation in or preoccupation with the
selection of accounting principles ot the determination of significant estimates.
3 Known history of violations of securities laws or other laws and regulations or
claims against the entity, its senior management, or board members alleging fraud
or violations of laws and regulations.
4 Excessive interest by management in maintaining or increasing the entity’s stock
price or earnings trend.
5 A practice by management of committing to analysts, creditors, and other third
parties to achieve aggressive or unrealistic forecasts.
6 Management failing to correct known reportable conditions on a timely basis.
7 An interest by management in employing inappropriate means to minimize
reported earnings for tax-motivated reasons
8 Recurring attempts by management to justify marginal oe inappropriate
accounting on the basis of materiality.
9
The relationship between management and the current or predecessor auditor is
strained, such as frequent disputes with current or predecessor auditor on
accounting, auditing, or reporting matters
Source: AICPA, SAS No.99, Consideration of Fraud in a Financial Statement Audit, October 2002
Common Accounting Warning Signs
1 Aggressive revenue recognition
2 Operating cash flow out of line with reported earnings
3 Growth in revenues out of sync with economy, industry, or peer companies and
with growth in receivables.
4 Growth in inventory out of line with sales growth or days inventory increasing
over time.
5 Classification of non-operating or non-recurring income as revenue.
6 Deferral of expenses
7 Excessive use of operating leases by lessees.
8 Classification of expenses or losses as extraordinary or non-recurring.
9 LIFO liquidations
10 Gross margins or operating margins out of line with peer companies.
11 Use of long useful lives for depreciation and amortization.
12 Use of aggressive pension plan assumptions.
13 Common use of fourth-quarter surprises.
Annex- 6

PAGE 43| Journal of Corporate Governance, Insurance, and Risk Management | 2014, VOL. 1, Series. 1
14 Equity method of accounting / frequent use of off-balance sheet SPEs or variable-
interest entities.
15 Other off-balance sheet financing or guarantees.
Source: Financial Reporting and Analysis, CFA Institute, Level 1, Reading 33, 2011