Embed Size (px)
Citation preview
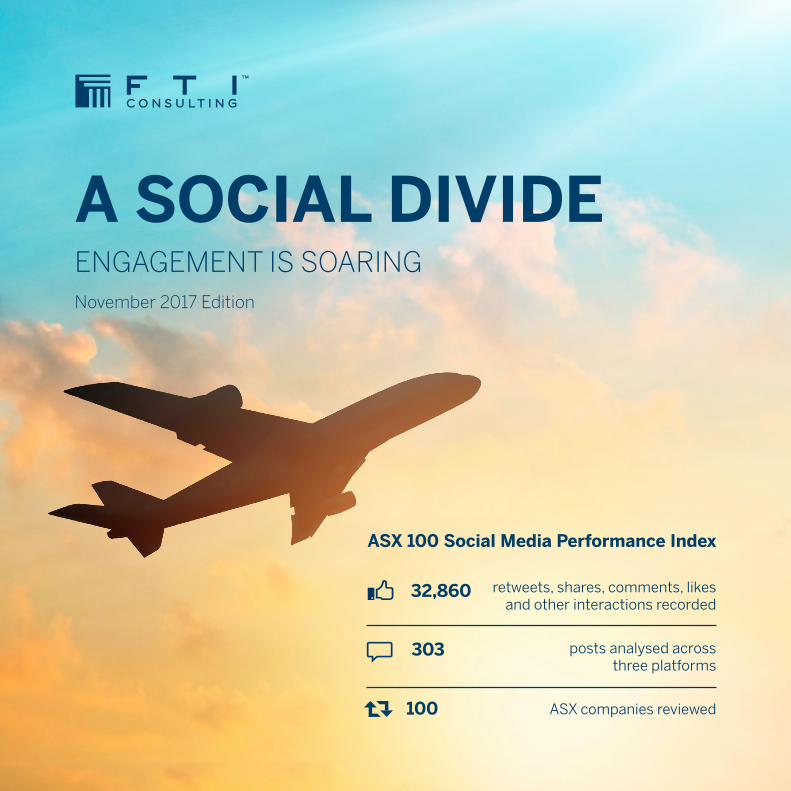
A SOCIAL DIVIDEENGAGEMENT IS SOARINGNovember 2017 Edition
retweets, shares, comments, likes and other interactions recorded
posts analysed across three platforms
ASX companies reviewed
ASX 100 Social Media Performance Index
32,860
303
100
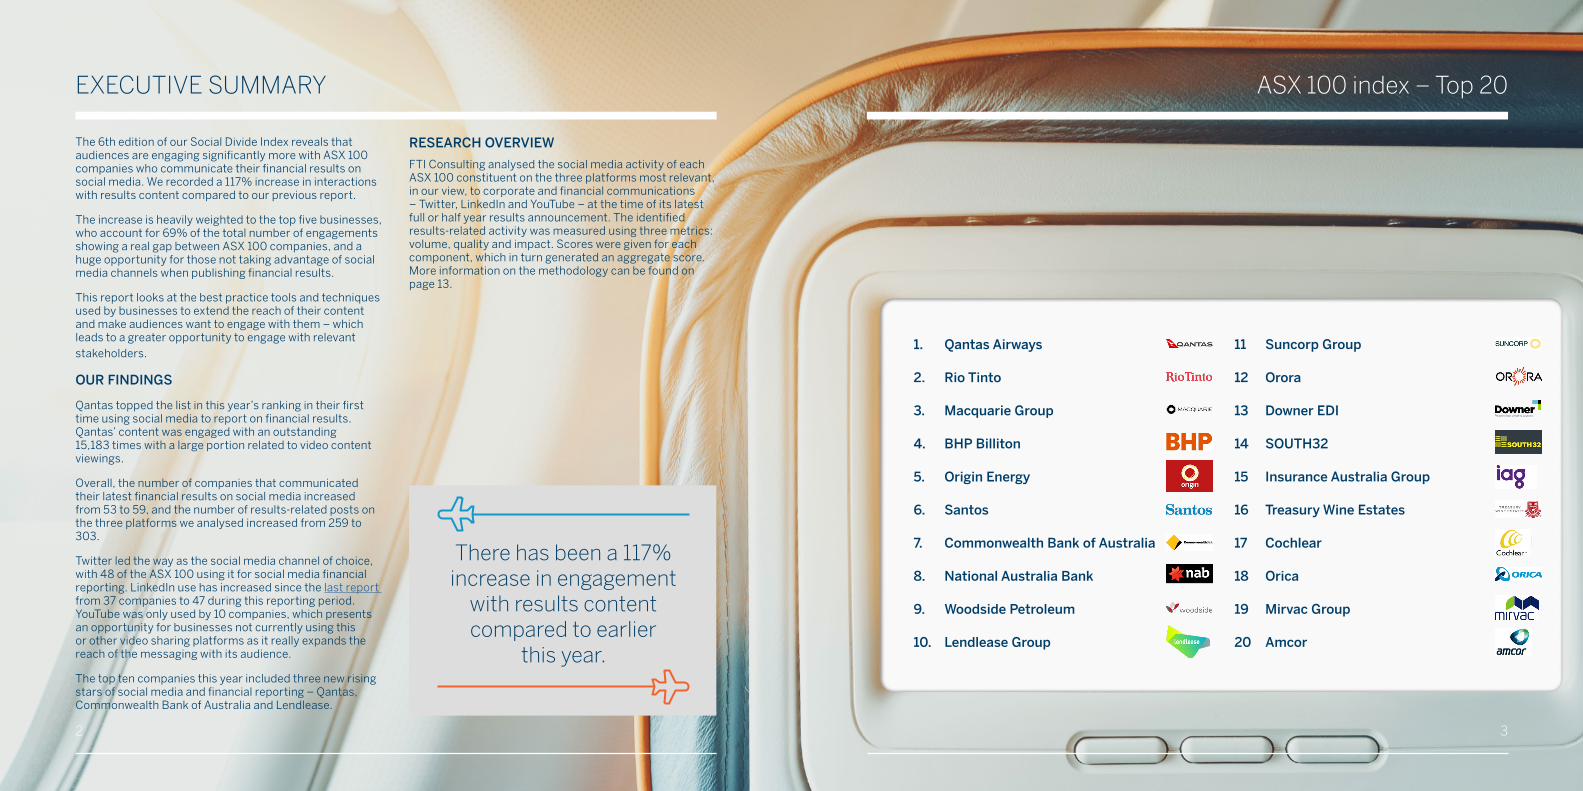
The 6th edition of our Social Divide Index reveals that audiences are engaging significantly more with ASX 100 companies who communicate their financial results on social media. We recorded a 117% increase in interactions with results content compared to our previous report.
The increase is heavily weighted to the top five businesses, who account for 69% of the total number of engagements showing a real gap between ASX 100 companies, and a huge opportunity for those not taking advantage of social media channels when publishing financial results.
This report looks at the best practice tools and techniques used by businesses to extend the reach of their content and make audiences want to engage with them – which leads to a greater opportunity to engage with relevant stakeholders.
OUR FINDINGS
Qantas topped the list in this year’s ranking in their first time using social media to report on financial results. Qantas’ content was engaged with an outstanding 15,183 times with a large portion related to video content viewings.
Overall, the number of companies that communicated their latest financial results on social media increased from 53 to 59, and the number of results-related posts on the three platforms we analysed increased from 259 to 303.
Twitter led the way as the social media channel of choice, with 48 of the ASX 100 using it for social media financial reporting. LinkedIn use has increased since the last report from 37 companies to 47 during this reporting period. YouTube was only used by 10 companies, which presents an opportunity for businesses not currently using this or other video sharing platforms as it really expands the reach of the messaging with its audience.
The top ten companies this year included three new rising stars of social media and financial reporting – Qantas, Commonwealth Bank of Australia and Lendlease.
RESEARCH OVERVIEW
FTI Consulting analysed the social media activity of each ASX 100 constituent on the three platforms most relevant, in our view, to corporate and financial communications – Twitter, LinkedIn and YouTube – at the time of its latest full or half year results announcement. The identified results-related activity was measured using three metrics: volume, quality and impact. Scores were given for each component, which in turn generated an aggregate score. More information on the methodology can be found on page 13.
There has been a 117% increase in engagement
with results content compared to earlier
this year.
11 Suncorp Group
12 Orora
13 Downer EDI
14 SOUTH32
15 Insurance Australia Group
16 Treasury Wine Estates
17 Cochlear
18 Orica
19 Mirvac Group
20 Amcor
1. Qantas Airways
2. Rio Tinto
3. Macquarie Group
4. BHP Billiton
5. Origin Energy
6. Santos
7. Commonwealth Bank of Australia
8. National Australia Bank
9. Woodside Petroleum
10. Lendlease Group
2 3
EXECUTIVE SUMMARY ASX 100 index – Top 20
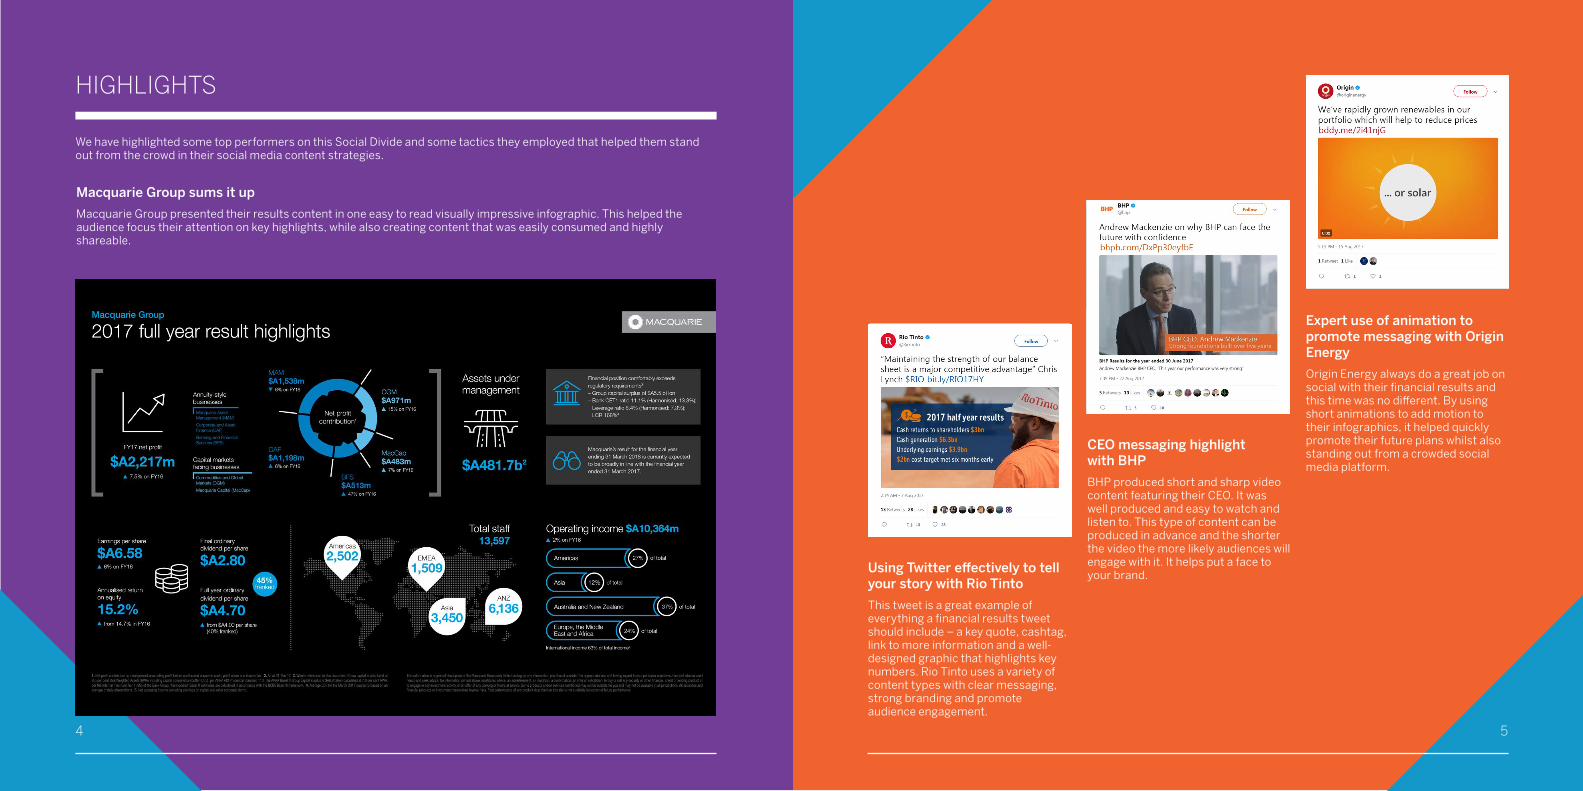
Macquarie Group sums it up
Macquarie Group presented their results content in one easy to read visually impressive infographic. This helped the audience focus their attention on key highlights, while also creating content that was easily consumed and highly shareable.
We have highlighted some top performers on this Social Divide and some tactics they employed that helped them stand out from the crowd in their social media content strategies.
CEO messaging highlight with BHP
BHP produced short and sharp video content featuring their CEO. It was well produced and easy to watch and listen to. This type of content can be produced in advance and the shorter the video the more likely audiences will engage with it. It helps put a face to your brand.
Using Twitter effectively to tell your story with Rio Tinto
This tweet is a great example of everything a financial results tweet should include – a key quote, cashtag, link to more information and a well-designed graphic that highlights key numbers. Rio Tinto uses a variety of content types with clear messaging, strong branding and promote audience engagement.
Expert use of animation to promote messaging with Origin Energy
Origin Energy always do a great job on social with their financial results and this time was no different. By using short animations to add motion to their infographics, it helped quickly promote their future plans whilst also standing out from a crowded social media platform.
4 5
HIGHLIGHTS
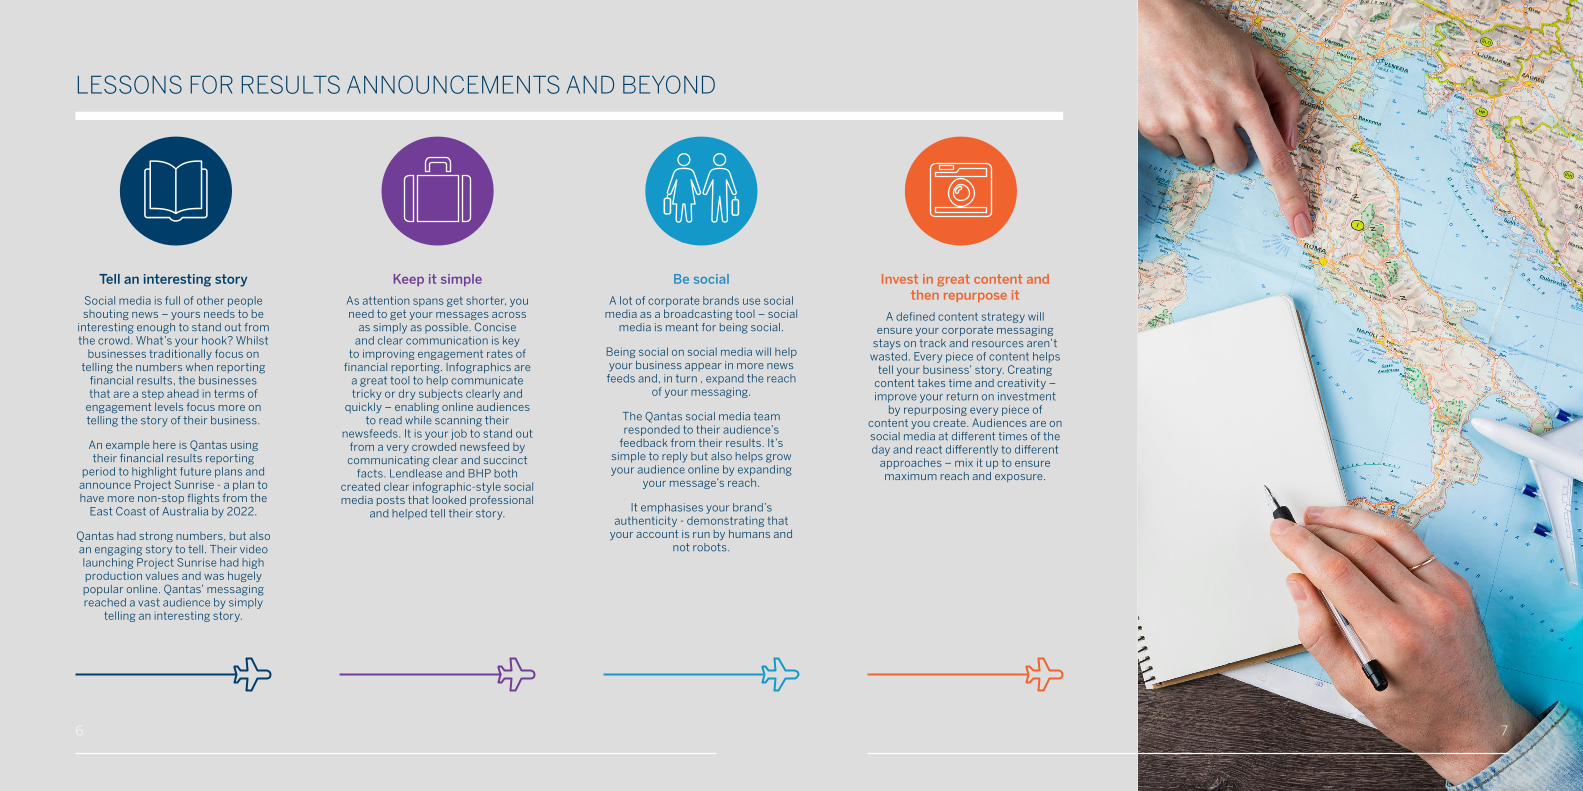
Be social
A lot of corporate brands use social media as a broadcasting tool – social
media is meant for being social.
Being social on social media will help your business appear in more news feeds and, in turn , expand the reach
of your messaging.
The Qantas social media team responded to their audience’s
feedback from their results. It’s simple to reply but also helps grow your audience online by expanding
your message’s reach.
It emphasises your brand’s authenticity - demonstrating that
your account is run by humans and not robots.
Keep it simple
As attention spans get shorter, you need to get your messages across
as simply as possible. Concise and clear communication is key
to improving engagement rates of financial reporting. Infographics are
a great tool to help communicate tricky or dry subjects clearly and
quickly – enabling online audiences to read while scanning their
newsfeeds. It is your job to stand out from a very crowded newsfeed by communicating clear and succinct
facts. Lendlease and BHP both created clear infographic-style social media posts that looked professional
and helped tell their story.
Tell an interesting story
Social media is full of other people shouting news – yours needs to be
interesting enough to stand out from the crowd. What’s your hook? Whilst
businesses traditionally focus on telling the numbers when reporting
financial results, the businesses that are a step ahead in terms of
engagement levels focus more on telling the story of their business.
An example here is Qantas using their financial results reporting
period to highlight future plans and announce Project Sunrise - a plan to have more non-stop flights from the
East Coast of Australia by 2022.
Qantas had strong numbers, but also an engaging story to tell. Their video launching Project Sunrise had high production values and was hugely popular online. Qantas’ messaging reached a vast audience by simply
telling an interesting story.
Invest in great content and then repurpose it
A defined content strategy will ensure your corporate messaging
stays on track and resources aren’t wasted. Every piece of content helps
tell your business’ story. Creating content takes time and creativity – improve your return on investment
by repurposing every piece of content you create. Audiences are on social media at different times of the day and react differently to different
approaches – mix it up to ensure maximum reach and exposure.
6 7
LESSONS FOR RESULTS ANNOUNCEMENTS AND BEYOND
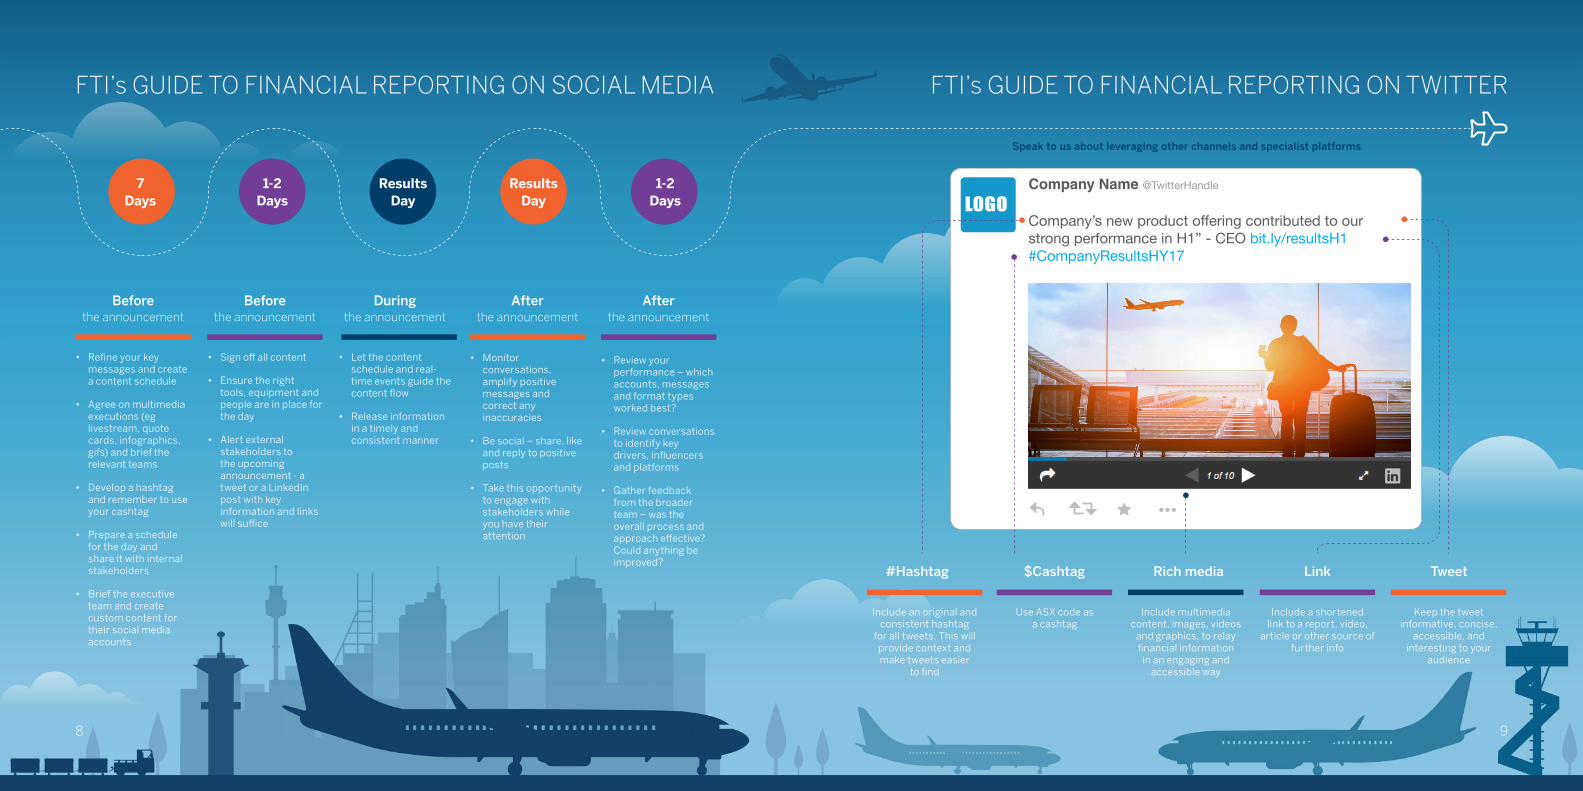
• Refine your key messages and create a content schedule
• Agree on multimedia executions (eg livestream, quote cards, infographics, gifs) and brief the relevant teams
• Develop a hashtag and remember to use your cashtag
• Prepare a schedule for the day and share it with internal stakeholders
• Brief the executive team and create custom content for their social media accounts
Before the announcement
Before the announcement
During the announcement
After the announcement
After the announcement
• Sign off all content
• Ensure the right tools, equipment and people are in place for the day
• Alert external stakeholders to the upcoming announcement - a tweet or a LinkedIn post with key information and links will suffice
• Let the content schedule and real-time events guide the content flow
• Release information in a timely and consistent manner
• Review your performance – which accounts, messages and format types worked best?
• Review conversations to identify key drivers, influencers and platforms
• Gather feedback from the broader team – was the overall process and approach effective? Could anything be improved?
• Monitor conversations, amplify positive messages and correct any inaccuracies
• Be social – share, like and reply to positive posts
• Take this opportunity to engage with stakeholders while you have their attention
Results Day
Results Day
1-2 Days
1-2 Days
7 Days
Company Name @TwitterHandle
Company’s new product offering contributed to our strong performance in H1” - CEO bit.ly/resultsH1 #CompanyResultsHY17
LOGO
Speak to us about leveraging other channels and specialist platforms
FTI’s GUIDE TO FINANCIAL REPORTING ON TWITTER
Include multimedia content, images, videos
and graphics, to relay financial information
in an engaging and accessible way
Keep the tweet informative, concise,
accessible, and interesting to your
audience
Include an original and consistent hashtag
for all tweets. This will provide context and make tweets easier
to find
Include a shortened link to a report, video,
article or other source of further info
Use ASX code as a cashtag
#Hashtag $Cashtag Rich media Link Tweet
8 9
FTI’s GUIDE TO FINANCIAL REPORTING ON SOCIAL MEDIA
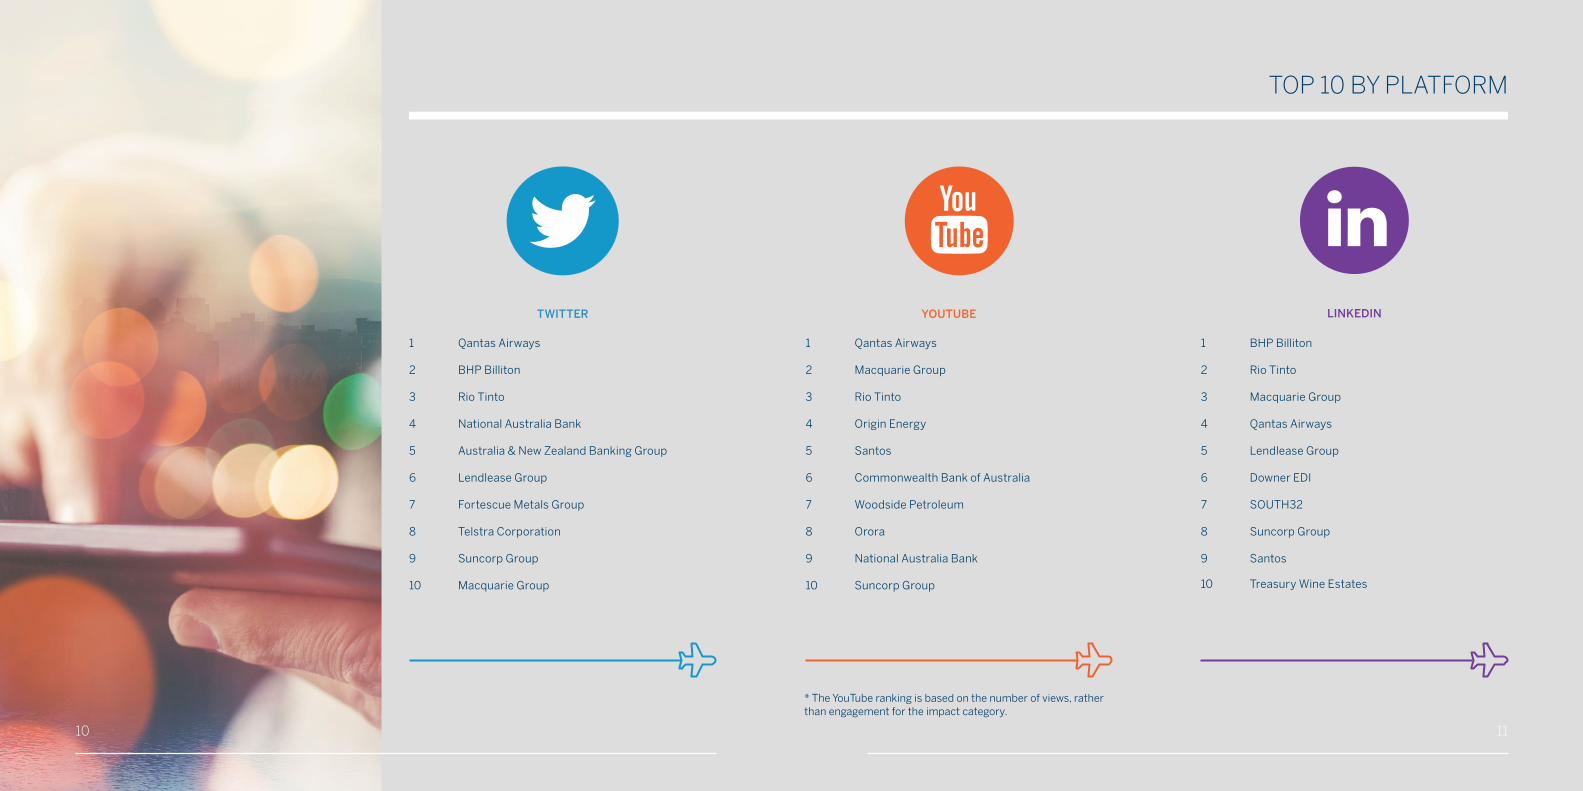
1 Qantas Airways
2 BHP Billiton
3 Rio Tinto
4 National Australia Bank
5 Australia & New Zealand Banking Group
6 Lendlease Group
7 Fortescue Metals Group
8 Telstra Corporation
9 Suncorp Group
10 Macquarie Group
1 Qantas Airways
2 Macquarie Group
3 Rio Tinto
4 Origin Energy
5 Santos
6 Commonwealth Bank of Australia
7 Woodside Petroleum
8 Orora
9 National Australia Bank
10 Suncorp Group
* The YouTube ranking is based on the number of views, rather than engagement for the impact category.
YOUTUBE
1 BHP Billiton
2 Rio Tinto
3 Macquarie Group
4 Qantas Airways
5 Lendlease Group
6 Downer EDI
7 SOUTH32
8 Suncorp Group
9 Santos
10 Treasury Wine Estates
10 11
TOP 10 BY PLATFORM
Rank Name
1 Qantas Airways
2 Rio Tinto
3 Macquarie Group
4 BHP Billiton
5 Origin Energy
6 Santos
7 Commonwealth Bank of Australia
8 National Australia Bank
9 Woodside Petroleum
10 Lendlease Group
11 Suncorp Group
12 Orora
13 Downer EDI
14 SOUTH32
15 Insurance Australia Group
16 Treasury Wine Estates
17 Cochlear
18 Orica
19 Mirvac Group
20 Amcor
21 CSL
22 Fortescue Metals Group
23 Australia & New Zealand Banking Group
24 Stockland
25 Telstra Corporation
26 CYBG PLC
27 Cimic Group
28 Link Administration Holdings
29 Caltex Australia
30 Goodman Group
Rank Name
31 Scentre Group
32 APA Group
33 Bendigo And Adelaide Bank
34 Oil Search
35 AGL Energy
36 Ansell
37 AMP
38 Vicinity Centres
39 Dexus Property Group
40 Oz Minerals
41 Coca-Cola Amatil
42 CSR
43 Perpetual
44 Primary Health Care
45 Challenger
46 Tabcorp Holdings
47 Transurban Group
48 Wesfarmers
49 Bank of Queensland
50 Incitec Pivot
51 Brambles
52 Westfield Corporation
53 Aurizon Holdings
54 Graincorp
55 QBE Insurance Group
56 ASX
57 Iluka Resources
58 Medibank Private
59 Tatts Group
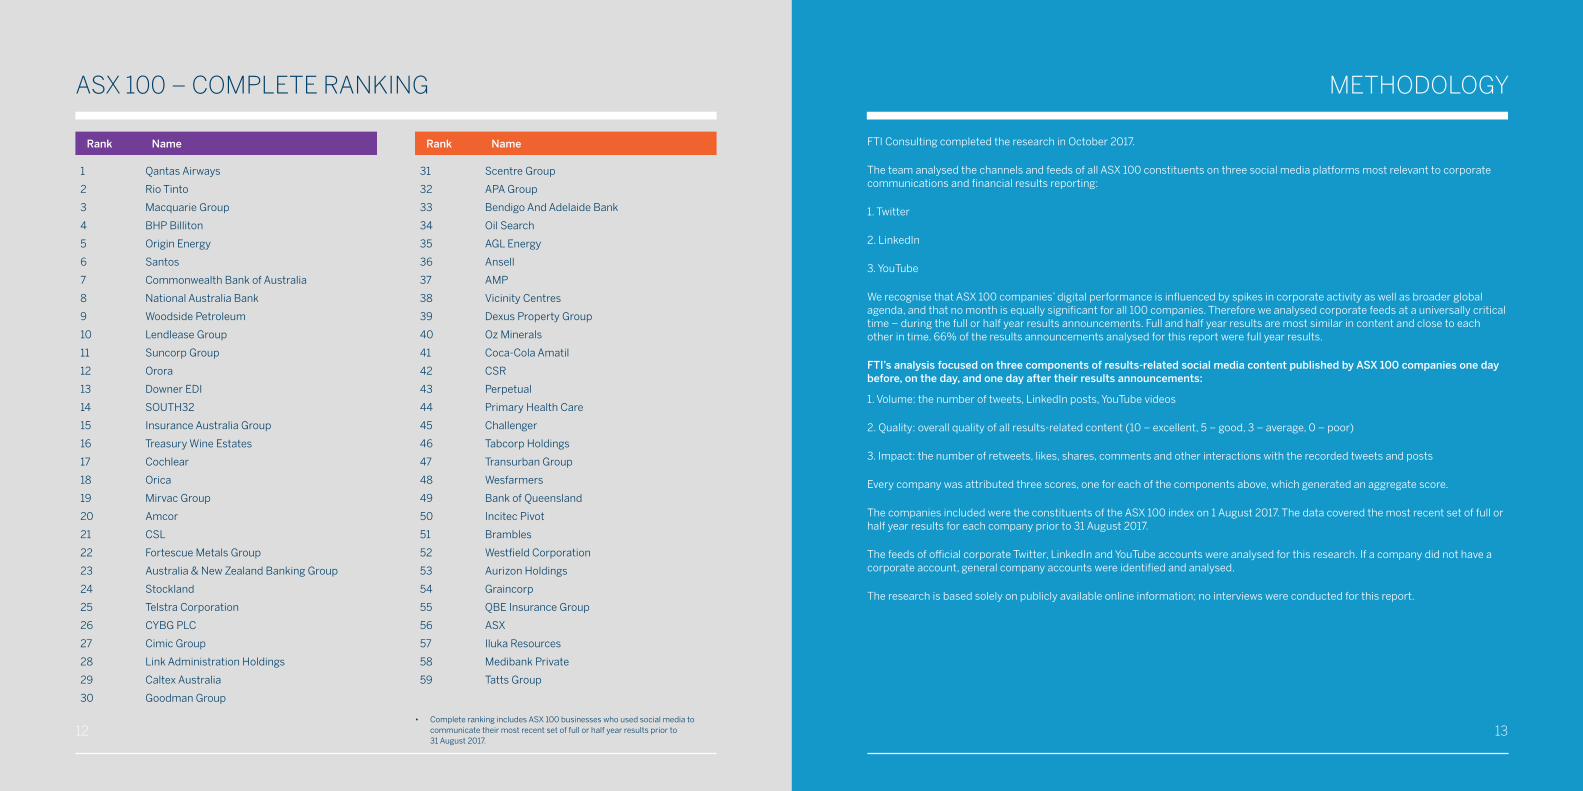
• Complete ranking includes ASX 100 businesses who used social media to communicate their most recent set of full or half year results prior to 31 August 2017.
FTI Consulting completed the research in October 2017.
The team analysed the channels and feeds of all ASX 100 constituents on three social media platforms most relevant to corporate communications and financial results reporting:
1. Twitter
2. LinkedIn
3. YouTube
We recognise that ASX 100 companies’ digital performance is influenced by spikes in corporate activity as well as broader global agenda, and that no month is equally significant for all 100 companies. Therefore we analysed corporate feeds at a universally critical time – during the full or half year results announcements. Full and half year results are most similar in content and close to each other in time. 66% of the results announcements analysed for this report were full year results.
FTI’s analysis focused on three components of results-related social media content published by ASX 100 companies one day before, on the day, and one day after their results announcements:
1. Volume: the number of tweets, LinkedIn posts, YouTube videos
2. Quality: overall quality of all results-related content (10 – excellent, 5 – good, 3 – average, 0 – poor)
3. Impact: the number of retweets, likes, shares, comments and other interactions with the recorded tweets and posts
Every company was attributed three scores, one for each of the components above, which generated an aggregate score.
The companies included were the constituents of the ASX 100 index on 1 August 2017. The data covered the most recent set of full or half year results for each company prior to 31 August 2017.
The feeds of official corporate Twitter, LinkedIn and YouTube accounts were analysed for this research. If a company did not have a corporate account, general company accounts were identified and analysed.
The research is based solely on publicly available online information; no interviews were conducted for this report.
12 13
ASX 100 – COMPLETE RANKING METHODOLOGY
ABOUT US
FTI Consulting’s Strategic Communications Sydney-based digital experts partner with ASX 100 and other large corporate brands across Australia to design effective online reputation management strategies, covering issues and crisis communications, influencer identification and outreach, content and channel strategy, paid and creative campaigning. We work with clients at all stages of digital maturity, from early stage set up, requiring governance, social media architecture and content planning, to expert in-house digital teams requiring contingency or specialist support.
To learn more about FTI Digital, please contact
Celia Heffernan Senior Director 02 8298 6100 [email protected]
The views expressed herein are those of the author(s) and not necessarily the views of FTI Consulting, Inc., its management, its subsidiaries, its affiliates, or its other professionals.