Embed Size (px)
Citation preview

Page 1 of 40
CORPORACION AMERICA AIRPORTS ANNOUNCES 2Q19 RESULTS Passenger traffic up 3.8% with growth of 12.3% YoY in Argentina and 8.9% in Armenia further supported by increases
in Ecuador and Peru, despite declines in Brazil and Uruguay
Luxembourg, August 23, 2019— Corporación América Airports S.A. (NYSE: CAAP), (“CAAP” or the “Company”) the largest private sector airport
operator based on the number of airports under management and the tenth largest private sector airport operator worldwide based on
passenger traffic, reported today its unaudited, consolidated results for the three- and six- month periods ended June 30, 2019. Financial results
are expressed in millions of U.S. dollars and are prepared in accordance with International Accounting Standard 34 “Interim Financial Reporting”
(“IAS 34”) as issued by the International Accounting Standards Board.
Commencing 3Q18, the Company began reporting results of its Argentinean subsidiaries applying Hyperinflation Accounting, in accordance to
IFRS rule IAS 29 (“IAS 29”), as detailed on Section “Hyperinflation Accounting in Argentina” on page 20.
Second Quarter 2019 Highlights Consolidated revenues of $412.6 million, up 3.9% YoY. Excluding the impact of IFRS rule IAS 29, revenues remained stable at $395.5, mainly
due to higher construction service revenue in Argentina reflecting higher capex in the period.
Performance of key operating metrics:
Passenger traffic up 3.8% YoY to 19.8 million
Cargo volume increased 6.6% to 104.7 thousand tons
Aircraft movements declined 4.0% to 206.9 thousand
Operating Income declined 18.7% YoY, to $76.5, mainly impacted by IAS 29, and the operating margin contracted to 18.5% from 23.7% in
2Q18
Adjusted EBITDA was $118.5 million, down 2.2% YoY, with Adjusted EBITDA margin Ex-IFRIC12 expanding 53 bps to 37.7%
Ex-IAS 29, Adjusted EBITDA declined 6.6% YoY, to $113.1 million, and Adjusted EBITDA margin Ex-IFRIC12 expanded 19 bps to 37.4%
CEO Message Commenting on second quarter 2019 results, Mr. Martín Eurnekian, CEO of Corporación América Airports, noted: “The quarter was characterized by ongoing headwinds, particularly in Argentina, our largest market, and to a lesser extent in Brazil. We also experienced a continued mix shift towards more affordable domestic traffic and weaker commercial revenues. At the same time, traffic at our Brazilian airports was impacted by the cessation of operations of Avianca Brasil. Despite these challenges, comparable Adjusted EBITDA margin Ex-IFRIC12 was flat at 37% year-on-year. Better margins this quarter in Italy and Uruguay, were more than offset by margin contraction in Argentina, Ecuador and Armenia. Over 20 million passengers travelled through our airport network in 2Q19 – up approximately 4% year-on-year as we continue to add new routes and airlines. This growth reflects domestic traffic increasing 9% partially offset by international traffic which was down in the low single digits.
Looking towards the second half of the year, weak macro conditions and heightened volatility in Argentina surrounding the presidential election add another layer of uncertainty. In Brazil, we expect Avianca’s former capacity at Brasilia Airport to be gradually restored by the three other carriers with domestic operations at this airport commencing by year-end, while in Italy, as we continue to monitor the evolution of Alitalia and the development of Brexit, we are expecting a good summer travel season. Despite these near-term challenges, we have a successful track record of operating in Argentina for over 20 years, many of which were under uncertain scenarios. Our business model is resilient with nearly 80% of revenues generated in US dollars. Furthermore, our solid balance sheet also provides flexibility and support for our strategy of advancing on investment projects as we modernize and expand capacity to meet overall growing demand. In turn, the Company will be better positioned for growth as volatility in Argentina recedes and the macro environment improves.” Operating & Financial Highlights (In millions of U.S. dollars, unless otherwise noted)
2Q18 2Q19 ex IAS 29
IAS 29 2Q19 as reported
% Var as reported
% Var ex IAS 29
Passenger Traffic (Million Passengers) 19.1 19.8 19.8 3.8% 3.8%
Revenue 397.1 395.5 17.1 412.6 3.9% -0.4%
Aeronautical Revenues 185.6 178.7 6.7 185.4 -0.1% -3.7%
Non-Aeronautical Revenues 211.4 216.8 10.4 227.2 7.4% 2.5%
Revenue excluding construction service 324.4 301.0 11.6 312.6 -3.6% -7.2%

Page 2 of 40
2Q18 2Q19 ex IAS 29
IAS 29 2Q19 as reported
% Var as reported
% Var ex IAS 29
Operating Income 94.1 87.7 -11.1 76.5 -18.7% -6.8%
Operating Margin 23.7% 22.2% -65.0% 18.5% -514 -153
Net (Loss) / Income Attributable to Owners of the Parent
-22.7 39.9 9.2 49.1 -316.6% -275.9%
EPS (US$) -0.14 0.25 0.06 0.31 -316.6% -275.9%
Adjusted EBITDA 121.1 113.1 5.4 118.5 -2.2% -6.6%
Adjusted EBITDA Margin 30.5% 28.6% 0.0% 28.7% -179 -191
Adjusted EBITDA Margin excluding Construction Service
37.2% 37.4% 0.0% 37.7% 53 19
Net Debt to LTM EBITDA 1.98 - - 2.16 1,808 -
Note: Figures in historical dollars (excluding IAS29) are included for comparison purposes. Operating & Financial Highlights (In millions of U.S. dollars, unless otherwise noted)
6M18 6M19 ex
IAS 29 IAS 29
6M19 as reported
% Var as reported
% Var ex IAS 29
Passenger Traffic (Million Passengers) 38.7 40.2 40.2 3.9% 3.9%
Revenue 787.9 771.1 27.7 798.8 1.4% -2.1%
Aeronautical Revenues 390.4 371.1 11.6 382.7 -2.0% -5.0%
Non-Aeronautical Revenues 397.5 400.0 16.1 416.2 4.7% 0.6%
Revenue excluding construction service 668.7 612.1 19.5 631.6 -5.5% -8.5%
Operating Income 203.7 182.0 -22.1 159.9 -21.5% -10.6%
Operating Margin 25.9% 23.6% -79.7% 20.0% -583 -224
Net (Loss) / Income Attributable to Owners of the Parent
3.8 73.6 10.6 84.2 2103.0% 1826.4%
EPS (US$) 0.02 0.46 0.07 0.53 2070.4% 1797.9%
Adjusted EBITDA 257.9 235.0 9.5 244.5 -5.2% -8.9%
Adjusted EBITDA Margin 32.7% 30.5% 0.0% 30.6% -213 -225
Adjusted EBITDA Margin excluding Construction Service
38.4% 38.2% 0.0% 38.5% 7 -25
Net Debt to LTM EBITDA 1.98 - - 2.16 1,808 -
Note: Figures in historical dollars (excluding IAS29) are included for comparison purposes.
Operating Performance
Passenger Traffic Total passenger traffic increased 3.8% YoY to 19.8 million, principally driven by YoY increases of 12.3% in Argentina and 8.9% in Armenia, which
contributed an additional 1.1 and 0.1 million passengers, respectively, and was partially offset by traffic declines in Brazil and Uruguay. In
addition, the Company faced easier comps in 2Q19 as the Easter holidays this year fell in April, while in 2018 they fell in March.
Traffic dynamics in Argentina remained impacted by the challenging macro environment and the 86.6% quarterly average currency depreciation,
resulting in slower growth in overall travel demand and a mix-shift from international to domestic traffic. Domestic traffic increased 22.1% YoY,
while international traffic declined 5.5%. During the quarter, low cost carrier Flybondi continued to add new domestic routes and Chilean low-
cost airline JetSmart begun domestic operations. In addition, American Airlines opened a new international route from Córdoba Airport to Miami,
United States.
In Brazil, passenger traffic declined 9.8% YoY, mainly impacted by the cessation of operations by a Brazilian carrier, and the reduction in less
profitable frequencies by a Latin American international airline. Domestic and transit traffic declined 10.4% and 10.3% respectively, offset by a
12.2% increase in international traffic, according to the new traffic count methodology applied by ANAC since June 2018. Based on the prior
methodology, international traffic would have increased 34.7% YoY at Brasilia airport.

Page 3 of 40
Traffic in Italy remained stable YoY in 2Q19, with total passenger traffic at Florence Airport increasing by 5.2%, reflecting easier comps as last
year traffic was impacted by Air France pilots’ strike. In addition, traffic benefited from the good performance of TAP’s connecting flight to Lisbon
and additional flights to Madrid by Iberia. This was partially offset by a 2.5% decline in passenger traffic at Pisa Airport, mainly reflecting the
reduction of operations by Pobeda. In addition, SAS airlines started operations at Florence airport, with three weekly flights to Copenhagen and
Eurowings opened a new route to Dusseldorf, Germany.
Passenger traffic in Uruguay declined 2.1% YoY, although showing an improvement from the 6.2% decline in the previous quarter, mainly
reflecting the combination of easier comps from the Easter holidays effect as discussed above, lower passenger traffic from Argentina reflecting
weak macro conditions, and the cancellation of Avianca Colombia’s daily route to Bogotá, Colombia.
In Armenia, passenger traffic increased 8.9% YoY mainly due to the addition of several new routes and frequencies during 2018 and 2019,
primarily to destinations in Russia, along with improved political conditions since 2H18. In Ecuador, traffic increased 2.1%, reflecting the start of
operations of Jet Blue and Aeroméxico in Guayaquil, with seven weekly flights to Fort Lauderdale and three weekly flights to Ciudad de México,
respectively. Moreover, COPA Airlines also increased frequencies at Guayaquil Airport. In Peru, passenger traffic increased 4.5% YoY.
Domestic passenger traffic, which accounted for 56.2% of total traffic, increased 8.7% YoY principally driven by growth of 22.1%, or 1.2 million
passengers in Argentina, which more than offset the 10.4% decline in Brazil. International passenger traffic, which represented 34.3% of total
traffic, posted a slight decline in the period, as increases of 8.9% in Armenia and, 7.6% in Ecuador, were offset by a decline of 5.5% in Argentina.
Cargo Volume Cargo volume increased 6.6% YoY in 2Q19 mainly as a result of higher cargo volume in Brazil, which more than offset lower cargo in Argentina.
Aircraft Movements Total aircraft movements declined 4.0% YoY, reflecting declines of 18.9% in Brazil and 8.5% in Uruguay, partially offset by growth of 1.8% in Italy
and 1.3% in Ecuador.
Tables with detailed passenger traffic, cargo volume and aircraft movement information for each airport can be found on page 23 of this report.
Operational Statistics: Passenger Traffic, Cargo Volume and Aircraft Movements
2Q19 2Q18 % Var
Domestic Passengers (in millions) 11.1 10.2 8.7%
International Passengers (in millions) 6.8 6.9 -0.9%
Transit Passengers (in millions) 1.9 2.0 -5.2%
Total Passengers (in millions) 19.8 19.1 3.8%
Cargo Volume (in thousands of tons) 104.7 98.2 6.6%
Total Aircraft Movements (in thousands) 206.9 215.5 -4.0%
Passenger Traffic Breakdown
Cargo
Aircraft Movements
Country 2Q19 2Q18 % Var. 2Q19 2Q18 % Var. 2Q19 2Q18 % Var.
(in millions) (in thousands of tons) (in thousands)
Argentina 9.9 8.8 12.3% 54.8 56.6 -3.3% 106.0 105.9 0.1%
Italy 2.4 2.4 0.0% 3.4 3.0 13.2% 22.4 22.0 1.8%
Brazil 4.3 4.7 -9.8% 23.9 15.7 52.0% 37.6 46.4 -18.9%
Uruguay 0.5 0.5 -2.1% 6.8 6.8 0.8% 6.5 7.1 -8.5%
Ecuador (1) 1.1 1.1 2.1% 9.8 10.5 -6.2% 20.3 20.1 1.3%
Armenia 0.7 0.7 8.9% 4.7 4.3 9.5% 6.0 6.0 0.2%
Peru (2) 0.9 0.8 4.5% 1.2 1.2 -1.9% 7.9 8.0 -1.1%
TOTAL 19.8 19.1 3.8% 104.7 98.2 6.6% 206.9 215.5 -4.0%
1) CAAP owns 99.9% of ECOGAL which operates and maintains the Galapagos Airport, but due to the terms of the concession agreement, ECOGAL’s results are accounted
for by the equity method. However, 100% of ECOGAL’s passenger traffic and aircraft movements are included in this table.
2) CAAP owns 50.0% of AAP and accounts for its results by the equity method. However, 100% of AAP’s passenger traffic and aircraft movements are included in this
table.

Page 4 of 40
Review of Consolidated Results Results for AAP Airports, the five airports CAAP operates in Peru, and ECOGAL which operates the Galapagos Airport in Ecuador, are accounted
for under the equity method.
Commencing 3Q18, the Company began reporting results of its Argentinean subsidiaries applying Hyperinflation Accounting, in accordance to
IFRS rule IAS 29, as detailed on Section “Hyperinflation Accounting in Argentina” on page 20.
Revenues Consolidated Revenues increased 3.9% YoY, or $15.5 million, to $412.6 million in 2Q19, while consolidated revenues excluding the impact of IAS
29 would have remained stable at $395.5 million. Growth of 16.5%, or $4.6 million, in Armenia resulted from higher fuel demand and increased
construction service revenue due to runway infrastructure works. In Ecuador, revenues increased 12.8% YoY, or $2.8 million, mainly due to
higher international passenger traffic and higher construction service revenues. By contrast, in Argentina, revenues were down 1.5% YoY, or
$3.6 million, impacted by the 3.7% decline in aeronautical revenues and 11.7% in commercial revenues, reflecting lower passenger traffic and
demand, partially offset by higher construction service revenues as a result of significant capex in the period. In Italy, revenues declined 7.0%,
or $2.9 million, reflecting lower construction service revenues. In Brazil, revenues declined 6.2%, or $1.9 million, due to a 9.8% decline in
passenger traffic, and to a lesser extent due to the 8.8% depreciation of the Brazilian real against the US dollar in the period.
Revenues in Argentina were down 1.5% YoY, or $3.6 million, (excluding IAS29) mainly impacted by: i) a mix-shift from international to domestic
traffic which is linked to the local currency depreciation, and ii) a decline in commercial revenues, mainly due to lower cargo revenues from the
drop in higher-margin imports together with lower Duty Free revenues from the decline in international traffic and overall lower demand.
Revenues were also negatively impacted by the FX translation effect on local currency revenues resulting from the 86.6% Argentine peso average
depreciation in the period, which more than offset higher overall passenger traffic. This was partially offset by a 32.1% YoY increase in
construction service revenue reflecting higher capex in the period.
Revenues in Italy declined 7.0% YoY reflecting lower construction service revenues in the period. Excluding IFRIC 12, revenues in Italy remained
stable at $36.9 million, primarily due to the positive results from commercial initiatives, partially offset by the 5.7% average depreciation of the
euro against the US dollar in the period.
In Brazil, revenues declined 6.2%, or $1.9 million, impacted by the 8.8% quarterly average Brazilian real depreciation. By contrast, local currency
revenues increased 2.2%, due to higher commercial revenues mainly from VIP lounges and advertising agreements, coupled with the increase
in aeronautical fees granted in August 2018. This was partially offset by the 9.8% decline in passenger traffic due to the cancellation of operations
by a Brazilian airline.
Revenues in Uruguay reached $27.1 million, mainly driven by the 4.0% in YoY traffic growth to international destinations other than Buenos
Aires city airport (Aeroparque) at Carrasco Airport, coupled with the increase in passenger fees implemented in August 2018. This was offset the
19.0% YoY decline in lower-margin shuttle (“Puente aéreo”) passengers to Aeroparque, in Buenos Aires, and the decline in Duty Free shop
revenues.
By contrast, in Armenia, revenues increased 16.5% YoY mainly driven by higher fuel demand, together with higher construction service revenues
in the period, partially offset by the FX currency translation impact on aeronautical revenues from the 5.7% average depreciation of the euro
against the US dollar. Revenues in Ecuador increased 12.8% YoY as a result of higher traffic in the period and the increase in aeronautical fees
starting January 1, 2019, coupled with higher construction service revenue in the period.
Excluding construction services, consolidated revenues would have declined 3.6% YoY to $312.6 million on an ‘As Reported’ basis, and 7.2% to
$301.0 million when also excluding the impact of IAS 29.
Revenues by Segment (in US$ million)
Country 2Q18 2Q19 ex IAS
29 IAS 29
2Q19 as reported
% Var as reported
% Var ex IAS 29
Argentina 246.7 243.1 17.1 260.2 5.5% -1.5%
Italy 42.0 39.1 - 39.1 -7.0% -7.0%
Brazil 30.3 28.4 - 28.4 -6.2% -6.2%
Uruguay 27.0 27.1 - 27.1 0.2% 0.2%
Armenia 28.1 32.7 - 32.7 16.5% 16.5%
Ecuador (1) 22.1 24.9 - 24.9 12.8% 12.8%

Page 5 of 40
Country 2Q18 2Q19 ex IAS
29 IAS 29
2Q19 as reported
% Var as reported
% Var ex IAS 29
Unallocated 0.9 0.2 - 0.2 -77.2% -77.2%
Total consolidated revenue (2) 397.1 395.5 17.1 412.6 3.9% -0.4%
1 Only includes Guayaquil Airport. 2 Excluding Construction Service revenue, revenue decreased 7.2% YoY in Argentina and 7.0% in Italy, but increased 0.2% in Uruguay, 6.7% in Ecuador and 8.7%
in Armenia.
Revenue Breakdown (in US$ million)
2Q18 2Q19 ex IAS 29
IAS 29 2Q19 as reported
% Var as reported
% Var ex IAS 29
Aeronautical Revenue 185.6 178.7 6.7 185.4 -0.1% -3.7%
Non-aeronautical Revenue 211.4 216.8 10.4 227.2 7.4% 2.5%
Commercial revenue 138.1 121.9 4.9 126.7 -8.2% -11.7%
Construction service revenue (1) 72.7 94.4 5.5 99.9 37.5% 29.9%
Other revenue 0.7 0.5 0.0 0.5 -28.4% -28.4%
Total Consolidated Revenue 397.1 395.5 17.1 412.6 3.9% -0.4%
Total Revenue excluding Construction Service revenue (2)
324.4 301.0 11.6 312.6 -3.6% -7.2%
1 Construction Service revenue equals the construction or upgrade costs plus a reasonable margin.
2 Excludes Construction Service revenue.
Aeronautical revenue accounted for 44.9% of total revenues and remained stable YoY at $185.4 million. Had IAS 29 not been applied,
Aeronautical Revenues would have decreased 3.7% YoY, or $6.9 million, mainly reflecting declines of:
7.3%, or $7.4 million, in Argentina as a result of the mix-shift from international to domestic traffic and the currency translation effect on
domestic traffic from the 86.6% average currency devaluation in the period.
7.3%, or $1.0 million in Brazil, impacted by the decline in passenger traffic, coupled with 8.8% quarterly average depreciation of the Brazilian
real against the US dollar. In local currency, revenues increased 0.6% mainly reflecting the increase in aeronautical fees granted in August
2018, which more than offset the decline in passenger traffic.
By contrast, aeronautical revenues in Ecuador increased 9.7% YoY, or $1.6 million, primarily driven by growth in international passenger traffic
at Guayaquil Airport.
Non-Aeronautical revenues accounted for 55.1% of total revenues, and increased 7.4% YoY, or $15.7 million, to $227.2 million. Had IAS 29 not
been applied, Non-aeronautical revenues would have increased 2.5% YoY, or $5.3 million, mainly driven by:
A 29.9%, or $21.7 million, increase in Construction Service revenue, mainly reflecting investments by $86.5 million in Argentina, and, to a
lesser extent, investments in Armenia and Ecuador of $2.4 million and $1.4 million, respectively, partially offset by lower revenues in Italy.
An 11.7%, or $16.2 million, decline in Commercial Revenues, to $121.9 million, mainly reflecting a decline of 21.7%, or $17.2 million, in
Argentina as a result of lower cargo imports due to macro conditions, lower passenger demand, particularly in duty free, and the FX
translation effect on domestic revenues from the Argentine peso depreciation. In addition, Brazil reported a 5.4%, or $0.9 million, decline
in Commercial Revenues mainly reflecting currency depreciation, but increased 3.5% YoY in local currency, primarily due to an increase in
VIP lounges and advertising revenues. By contrast, Commercial Revenues in Armenia increased 19.0%, or $2.6 million, mainly from higher
fuel demand.
Excluding Construction Service revenue, non-aeronautical revenues would have declined 8.3% YoY to $127.2 million. Had IAS 29 not been
applied, Non-aeronautical revenues excluding Construction Service revenue would have declined 11.8% YoY to $122.4 million.

Page 6 of 40
Consolidated Operating Costs and Expenses
During 2Q19, Consolidated Operating Costs and Expenses increased 10.7% YoY, or $32.8 million, to $340.4 million. Had IAS 29 not been applied,
Consolidated Operating Costs and Expenses would have increased 1.4% YoY, or $4.3 million, to $311.8 million, mainly reflecting higher
construction service costs from capital investments in Argentina, Ecuador and Armenia, and, to a lesser extent, higher fuel costs in Armenia,
which more than offset the effect of currency depreciation against the US dollar in Argentina, Brazil and Uruguay, and the decline in concession
fees in both Argentina and Brazil.
Cost of Services rose 15.0% YoY, or $39.5 million, to $303.1 million. Excluding the IAS 29 impact in Argentina and a one-time $2.2 million gain in
Italy from the positive outcome of a claim against the Ministry of Transport, Cost of services would have increased 5.6% YoY, or $14.6 million,
reflecting the following increases:
A 30.0%, or $21.7 million, increase in construction service costs, primarily due to an increase in Argentina of 32.1%, or $21.0 million, and,
to a lower degree, increases of $2.3 million and $1.4 million in Armenia and Ecuador, respectively, reflecting higher capex in the period,
partially offset by a $3.0 million decline in Italy.
A 22.8%, or $1.9 million, increase in cost of fuel sold, reflecting higher fuel demand in Armenia.
A 15.4%, or $2.2 million, in services and fees, primarily reflecting higher administrative fees in Ecuador arising from the concession extension
granted in July 2018, and higher tariffs on utilities in Argentina.
This more than offset declines of:
14.9%, or $6.9 million, in concession fees, mainly the result of a 13.4%, or $3.6 million, drop in Argentina related to the decline in revenues,
and a decline of 31.8%, or $2.4 million, in concession fees in Brazil due to the depreciation of the Brazilian real against the US dollar, together
with the impact of the change in the passenger curve by which the concession fee is calculated. By contrast, concession fees in Ecuador
increased by 20.7%, or $1.5 million, reflecting the 5% increase in the concession fee agreed in July 2018.
13.1%, or $4.6 million, in maintenance expenses, mainly as a result of lower expenses in Argentina and Brazil due to currency depreciation,
and lower maintenance expenses due to easier comps at Ecuador and Uruguay, as 2Q18 was impacted by refurbishing and SISCA costs,
respectively.
4.5%, or $2.3 million, in salaries principally due to the benefit from the depreciation of the Argentine peso against the US dollar, partially
offset by the additions made to the employee base to further enhance the passenger experience at the airports in Argentina, and, to a
lesser extent, the depreciation of the Brazilian real and the Euro against the US dollar.
Excluding Construction Service cost, Cost of Services would have increased 6.4% YoY, or $12.3 million. When also excluding the impact of IAS29, Cost of services would have declined 4.8%, or $9.3 million. When also excluding the one-time benefit from the Fire Protection Fund claim, Cost of services would have declined 3.7%, or $7.0 million YoY.
Selling, General and Administrative Expenses (“SG&A”) declined 14.6% YoY, or $6.4 million, to $37.2 million in 2Q19 on an ‘As reported’ basis,
and 17.8%, or $7.7 million, when excluding the impact of IAS 29, primarily reflecting the following declines:
An 18.3%, or $2.3 million in taxes, mainly resulting from lower sales taxes due to lower revenues in Argentina;
17.2%, or $1.8 million, in services and fees, reflecting a $0.8 million reduction in costs at the holding level due to legal fees in connection
with the IPO and fees associated with sale of 25% of Corporación América Italia to Investment Corporation of Dubai in 2Q18;
A 20.3%, or $1.7 million, in salaries and social security contributions mainly reflecting currency depreciation; and
A $1.1 million in office expenses.
This more than offset a $1.6 million increase in bad debts, principally attributed to an increase of $1.0 million in Argentina, mainly reflecting
higher bad debts from certain commercial tenants. In addition, CAAP’s Brazilian subsidiaries recorded a $0.5 million charge in connection with
past due receivables related to commercial tenants.
Excluding Construction Service cost and the one-time benefit in 2Q19, Operating Costs and Expenses would have increased 3.3%, or $7.9 million, to $243.3 million. Had IAS 29 not been applied, comparable Operating Costs and Expenses Ex-IFRIC12 would have declined 6.4%, or $15.1 million YoY, to $220.3 million.

Page 7 of 40
Costs and Expenses (in US$ million)
2Q18 2Q19 ex IAS 29
IAS 29 2Q19 as reported
% Var as reported
% Var ex IAS 29
Cost of Services 263.5 275.9 27.1 303.1 15.0% 4.7%
Salaries and social security contributions 51.7 49.3 1.7 51.0 -1.3% -4.5%
Concession fees 46.1 39.3 1.7 41.0 -11.2% -14.8%
Construction service cost 72.1 93.8 5.5 99.3 37.7% 30.0%
Maintenance expenses 35.4 30.8 2.2 33.0 -6.8% -13.1%
Amortization and depreciation 24.9 23.7 16.1 39.8 60.3% -4.4%
Other 33.3 39.0 0.0 38.9 16.9% 17.0%
Cost of Services Excluding Construction Service cost 191.4 182.1 21.6 203.7 6.4% -4.8%
Selling, general and administrative expenses 43.5 35.8 1.4 37.2 -14.6% -17.8%
Other expenses 0.5 0.1 0.0 0.1 -70.5% -75.2%
Total Costs and Expenses 307.5 311.8 28.5 340.4 10.7% 1.4%
Total Costs and Expenses Excluding Construction Service cost
235.4 218.0 23.0 241.0 2.4% -7.4%
Adjusted EBITDA and Adjusted EBITDA excluding Construction Service Adjusted EBITDA in 2Q19 declined 2.2% YoY to $118.5 million, with Adjusted EBITDA margin contracting 179 bps to 28.7% from 30.5% in 2Q18.
Excluding Construction service margin, Adjusted EBITDA margin contracted 53 bps to 37.7%, from 37.2% in 2Q18.
Excluding the impact of IAS 29 in 2Q19, Adjusted EBITDA would have declined 6.6% YoY, or $8.0 million, to $113.1 million, mainly reflecting a
15.2%, or $12.0 million decline in Argentina, partially offset by a $3.2 million increase in Italy. Adjusted EBITDA margin contracted 191 bps YoY
to 28.6%. Excluding both the impact from IAS 29 and construction service margin, Adjusted EBITDA margin would have expanded 19 bps to
37.4%, from 37.2% in 2Q18.
Adjusted EBITDA in 2Q19 was impacted by a one-time $2.2 million gain in Italy from the positive outcome of a claim against the Ministry of
Transport. Excluding IAS29 and this one-time item, Adjusted EBITDA ex-IFRIC12 would have declined 8.6% YoY, or $10.4 million, to $110.2 million,
and the margin would have contracted 56 bps to 36.6%. Margin contraction in Argentina, Ecuador and Armenia more than offset better margins
in Italy and Uruguay.
Adjusted EBITDA by Segment (in US$ million)
2Q18 2Q19 ex IAS
29 IAS 29
2Q19 as reported
% Var as reported
% Var ex IAS 29
Argentina 78.9 67.0 5.4 72.3 -8.4% -15.2%
Italy 10.7 13.9 - 13.9 29.6% 29.6%
Brazil 2.6 3.0 - 3.0 18.0% 18.0%
Uruguay 11.9 12.1 - 12.1 2.2% 2.2%
Armenia 12.1 12.1 - 12.1 0.0% 0.0%
Ecuador 6.8 6.5 - 6.5 -4.1% -4.1%
Unallocated -1.3 -1.2 - -1.2 -11.9% -11.9%
Perú -0.6 -0.4 - -0.4 -27.8% -27.8%
Total segment EBITDA 121.1 113.1 5.4 118.5 -2.2% -6.6%

Page 8 of 40
Adjusted EBITDA Reconciliation to Income from Continuing Operations (in US$ million)
2Q18 2Q19 ex IAS 29
IAS 29 2Q19 as reported
% Var as reported
% Var ex IAS 29
Income from Continuing Operations -34.9 46.1 9.2 55.4 -258.5% -232.0%
Financial Income -49.6 -10.8 -1.0 -11.8 -76.3% -78.3%
Financial Loss 198.9 39.4 -27.2 12.3 -93.8% -80.2%
Inflation adjustment 0.0 0.4 6.8 7.2 - -
Income Tax Expense -20.1 12.1 1.0 13.1 -165.3% -160.3%
Amortization and Depreciation 26.9 25.8 16.5 42.3 57.2% -4.1%
Adjusted EBITDA 121.1 113.1 5.4 118.5 -2.2% -6.6%
Adjusted EBITDA Margin 30.5% 28.6% 0.0% 28.7% -179 -191
Adjusted EBITDA excluding Construction Service 120.6 112.5 5.4 117.8 -2.3% -6.7%
Adjusted EBITDA Margin excluding Construction Service
37.2% 37.4% 0.0% 37.7% 53 19
Financial Income and Loss CAAP reported a Net financial loss of $7.7 million in 2Q19 compared to a loss of $149.2 million in 2Q18. Financial income declined 76.3% to
$11.8 million. Had IAS 29 not been applied, Financial income would have declined by 78.3%, or $37.9 million, to $10.8 million, mainly related to
a decline of $33.3 million in Argentina, reflecting more difficult comps as in 2Q18 AA2000 recorded a gain due to the depreciation of the
Argentine peso against the US dollar over assets held in US dollars.
During 2Q19, CAAP reported a “Financial Loss” of $12.3 million on an ‘As reported’ basis, or a loss of $39.4 million when excluding IAS 29 impact,
compared with a loss of $198.9 million in the year-ago quarter, mainly attributed to foreign exchange expenses of $148.3 million in Argentina in
the year-ago quarter, due to depreciation of the peso against the US dollar, in connection with its $400 million AA2000 bond.
2Q18 2Q19 ex IAS
29 IAS 29
2Q19 as reported
% Var as reported
% Var ex IAS 29
Financial Income 49.6 10.8 1.0 11.8 -76.3% -78.3%
Interest income 9.0 9.8 0.6 10.4 15.0% 8.8%
Foreign exchange income 39.5 0.9 -0.4 0.4 -99.0% -97.8%
Other 1.1 1.0 0.0 1.0 -10.8% -10.8%
Financial Loss -198.9 -39.4 27.2 -12.3 -93.8% -80.2%
Interest Expenses -20.2 -22.4 -0.6 -23.0 13.7% 10.8%
Foreign exchange transaction expenses -148.2 3.4 28.6 32.0 -121.6% -102.3%
Leases financial cost 0.0 -0.1 0.0 -0.1 - -
Changes in liability for Brazilian concessions -28.8 -20.1 0.0 -20.1 -30.0% -30.0%
Other expenses -1.6 -1.0 0.0 -1.0 -39.2% -39.2%
Inflation adjustment 0.0 -0.4 -6.8 -7.2 - -
Inflation adjustment 0.0 -0.4 -6.8 -7.2 - -
Financial Results, Net -149.2 -29.0 21.3 -7.7 -94.9% -80.6%
See “Use of Non-IFRS Financial Measures” on page 21.
Income Tax Expense During 2Q19, the Company reported a tax expense of $13.1 million, mainly due to a $6.2 million expense in Argentina together with expenses
of $3.4 million in Uruguay and $ 2.5 million in Armenia.

Page 9 of 40
Net Income and Net Income Attributable to Owners of the Parent During 2Q19, CAAP reported Net Income for the Period of $55.4 million compared to a loss of $34.9 million in 2Q18. While Operating Income
declined $17.6 million YoY, higher net income reflects lower financial expenses of $141.6 million and a $33.2 million decrease in income tax
expense.
During 2Q19, the Company reported a Net Income Attributable to Owners of the Parent of $49.1 million and income per common share of $0.31,
compared with a Net Loss Attributable to Owners of the Parent of $22.7 million in 2Q18 equivalent to loss per common share of $0.14 for the
same period last year.
Consolidated Financial Position As of June 30, 2019, cash and cash equivalents amounted to $221.5 million, a 13.2% decline from $255.0 million as of March 31, 2019. Total
Debt at the close of the quarter declined to $1,136.2, from $1,137.3 million as of March 31, 2019. An amount of $665.3 million, or 57.7% of total
debt is denominated in U.S. dollars, while $306.1, or 26.9%, is denominated in Brazilian reals and $174.8, or 15.4%, is in Euros.
The Net Debt to LTM EBITDA ratio stood at 2.12x as of June 2019, compared with Net Debt to EBITDA of 2.04x as of March 2019.
Consolidated Debt Indicators (in US$ million)
As of Jun 30, 2019 As of Mar 31, 2019 As of Dec 31, 2018
Leverage
Total Debt / LTM Adjusted EBITDA (Times)1,3 2.63x 2.63x 2.53x
Total Net Debt / LTM Adjusted EBITDA (Times) 2,3 2.12x 2.04x 1.98x
Total Debt 1,136.2 1,137.3 1,126.7
Short-Term Debt 149.6 121.2 98.9
Long-Term Debt 986.7 1,016.1 1,027.8
Cash & Cash Equivalents 221.5 255.0 244.9
Total Net Debt4 914.8 882.3 881.8
1 The Total Debt to EBITDA Ratio is calculated as CAAP’s interest-bearing liabilities divided by its EBITDA. 2 The Total Net Debt to EBITDA Ratio is calculated as CAAP’s interest-bearing liabilities minus Cash & Cash Equivalents, divided by its EBITDA.
3 The Total Net Debt is calculated as Total Debt minus Cash & Cash Equivalents.
Total Debt by Segment (in US$ million) As of Jun 30, 2019
Argentina 398.6
Italy (1) 133.2
Brazil (2) 315.2
Uruguay 204.6
Armenia 82.3
Ecuador 2.4
Total 1,136.2
1 Of which approximately $66.7 million remain at the subsidiary level.
2 Of which approximately $293.8 remain at Inframérica Concessionaria do Aeroporto de Brasilia level.
CAPEX During 2Q19, CAAP made capital expenditures excluding IAS 29, totaling $107.5 million, a 37.3% YoY increase from $78.3 million in 2Q18, mainly
reflecting higher capex in Argentina. The most significant investments in 2Q19 include:
$86.8 million, invested in Argentina primarily for the construction of the new departure terminal building and multilevel parking at Ezeiza
Airport, the landfill and construction of a new park on Costanera Avenue at Aeroparque Airport, the construction of new terminal buildings
at Comodoro Rivadavia Iguazú and Jujuy airports, the refurbishment and lighting of the runway and taxiways at Córdoba Airport, the

Page 10 of 40
expansion of the terminal building at Bariloche, Mar del Plata and Esquel airports, as well as various capex programs across other airports
of the concession;
$6.8 million invested in Armenia, mainly in relation to runway improvement and lightning system, and perimeter security system; and
$3.1 million invested in Ecuador, primarily on initial works stemming from the new capex program resulting from extension of the Guayaquil
concession agreement last year.

Page 11 of 40
Review of Segment Results
Argentina The Company’s main concession in Argentina, AA2000, accounted for approximately 9.5 million passengers, or 48.0%, of CAAP’s 19.8 million
total passengers worldwide served during the quarter. Aeroparque and Ezeiza, the country’s two largest airports, had approximately 2.7 million
and 2.8 million passengers in 2Q19, respectively.
Starting in 3Q18, reported numbers are presented applying Hyperinflation accounting for the Company’s Argentinean subsidiaries, in accordance
with IAS 29, as explained above.
Argentina represented 61.5% of the Company’s 2Q19 consolidated revenues and 59.2% of its adjusted EBITDA, excluding the effect of IAS 29.
The following table presents the impact from Hyperinflation accounting on 2Q19 under the column ‘IAS 29’, while the column “2Q19 ex IAS 29”
presents 2Q19 results calculated without the impact from Hyperinflation accounting. The impact of IAS 29 is presented only for AA2000, the
Company’s largest subsidiary in Argentina which accounted for 96.0%, 98.6% and 99.2% of passenger traffic, revenues and Adjusted EBITDA of
the Argentina segment in 2Q19.
2Q18 2Q19 ex IAS 29
IAS 29 2Q19 as reported
% Var as reported
% Var ex IAS 29
OPERATING STATISTICS
Domestic Passengers (in millions) 5.4 6.6 - 6.6 22.1% 22.1%
International Passengers (in millions) 3.2 3.0 - 3.0 -5.5% -5.5%
Transit Passengers (in millions) 0.3 0.3 - 0.3 27.9% 27.9%
Total Passengers (in millions) 8.8 9.9 - 9.9 12.3% 12.3%
Cargo Volume (in thousands of tons) 56.6 54.8 - 54.8 -3.3% -3.3%
Total Aircraft Movements (in thousands) 105.9 106.0 - 106.0 0.1% 0.1%
FINANCIAL HIGHLIGHTS
Aeronautical Revenue 102.0 94.6 6.7 101.3 -0.7% -7.3%
Non-aeronautical revenue 144.7 148.5 10.4 158.9 9.8% 2.7%
Commercial revenue 79.2 62.0 4.9 66.8 -15.6% -21.7%
Construction service revenue 65.5 86.5 5.5 92.1 40.6% 32.1%
Total Revenue 246.7 243.1 17.1 260.2 5.5% -1.5%
Total Revenue Excluding IFRIC12(1) 181.2 156.5 11.6 168.1 -7.2% -13.6%
Cost of Services 158.8 173.5 27.1 200.6 26.4% 9.3%
Selling, general and administrative expenses 20.6 14.9 1.4 16.2 -21.0% -27.7%
Other expenses 0.1 0.3 0.0 0.4 142.7% 127.4%
Total Costs and Expenses 179.5 188.7 28.5 217.2 21.0% 5.1%
Total Costs and Expenses Excluding IFRIC12(2) 114.0 102.2 23.0 125.2 9.8% -10.4%
Adjusted Segment EBITDA 78.9 67.0 5.4 72.3 -8.4% -15.2%
Adjusted Segment EBITDA Mg 32.0% 27.5% 27.8% -420 -445
Adjusted EBITDA Margin excluding IFRIC 12(3) 43.5% 42.7% 43.0% -55 -80
Capex 65.8 86.8 5.5 92.3 40.2% 31.9%
1 Excludes Construction Service revenue.
2 Excludes Construction Service cost.
3 Excludes the effect of IFRIC 12 with respect to the construction or improvements to concessioned assets, and is calculated by dividing EBITDA by total revenues
less Construction Service revenue.

Page 12 of 40
6M18 6M19 ex
IAS 29 IAS 29
6M19 as reported
% Var as reported
% Var ex IAS 29
OPERATING STATISTICS
Domestic Passengers (in millions) 11.3 13.5 - 13.5 18.8% 18.8%
International Passengers (in millions) 7.1 6.7 - 6.7 -5.8% -5.8%
Transit Passengers (in millions) 0.6 0.7 - 0.7 13.4% 13.4%
Total Passengers (in millions) 19.1 20.9 - 20.9 9.4% 9.4%
Cargo Volume (in thousands of tons) 117.0 110.8 - 110.8 -5.3% -5.3%
Total Aircraft Movements (in thousands) 219.3 221.9 - 221.9 1.2% 1.2%
FINANCIAL HIGHLIGHTS
Aeronautical Revenue 224.1 207.1 11.6 218.7 -2.4% -7.6%
Non-aeronautical revenue 270.9 271.3 16.1 287.4 6.1% 0.2%
Commercial revenue 160.9 125.0 7.9 132.9 -17.4% -22.3%
Construction service revenue 110.0 146.3 8.2 154.5 40.4% 33.0%
Total Revenue 495.0 478.3 27.7 506.1 2.2% -3.4%
Total Revenue Excluding IFRIC12(1) 385.0 332.1 19.5 351.6 -8.7% -13.7%
Cost of Services 303.6 320.8 47.8 368.6 21.4% 5.7%
Selling, general and administrative expenses 42.7 33.0 2.5 35.5 -16.9% -22.7%
Other expenses 0.5 0.4 0.0 0.5 0.7% -3.4%
Total Costs and Expenses 346.7 354.2 50.3 404.5 16.7% 2.2%
Total Costs and Expenses Excluding IFRIC12(2) 236.8 208.1 42.1 250.1 5.6% -12.1%
Adjusted Segment EBITDA 172.0 150.5 9.5 159.9 -7.0% -12.5%
Adjusted Segment EBITDA Mg 34.7% 31.5% - 31.6% -314 -328
Adjusted EBITDA Margin excluding IFRIC 12(3) 44.6% 45.3% - 45.5% 82 64
Capex 110.3 146.3 8.2 154.5 40.0% 32.6%
1 Excludes Construction Service revenue.
2 Excludes Construction Service cost.
3 Excludes the effect of IFRIC 12 with respect to the construction or improvements to concessioned assets, and is calculated by dividing EBITDA by total revenues
less Construction Service revenue.
Passenger Traffic in Argentina rose 12.3% YoY in 2Q19, with domestic traffic increasing 22.1%, partially offset by a 5.5% decline in international
traffic reflecting continued challenging macro conditions in the country, although showed an improvement from the 6.6% decline reported in
the previous quarter. Domestic traffic benefitted from the addition of new routes, low cost carriers and higher promotional activity.
During the quarter, low cost carrier Flybondi continued to add new domestic routes connecting Neuquén Airport with Mendoza and Córdoba
airports, Salta Airport with Córdoba and Rosario airports, and Tucumán Airport with Rosario Airport. In addition, low cost airline JetSmart begun
domestic operations with routes from El Palomar Airport to Mendoza, Córdoba, Tucumán, Iguazú and Salta airports and from Salta Airport to
Neuquén, Córdoba and Mendoza airports, from Mendoza Airport with Tucumán Airport, and from Neuquén Airport to Córdoba and Salta
airports, further increasing connectivity in the country. In addition, American Airlines opened a new international route from Córdoba Airport
to Miami, United States.
By contrast, cargo volume was down 3.3% YoY, reflecting the continued challenging macro environment, although showed an improvement
when compared to 1Q19, while total aircraft movements remained stable during the period.
Revenues increased 5.5% YoY, or $13.5 million, to $260.2 million in 2Q19. Excluding the impact of IAS 29, revenues would have been
$243.1 million, down 1.5%, or $3.6 million YoY, primarily reflecting higher construction revenue in the quarter due to higher capex, partially
offset by a decline in aeronautical and commercial revenues, mainly due to a mix-shift from international to domestic traffic, the FX translation
effect on local currency revenues from the sharp Argentine peso depreciation that took place last year (which resulted in a 86.6% average peso
depreciation in the period), and lower commercial demand.

Page 13 of 40
Aeronautical revenue remained stable YoY on an ‘As reported’ basis, but declined 7.3%, or $7.4 million, when excluding the impact of IAS
29, primarily reflecting the continued mix-shift from international to domestic traffic, together with and the currency translation effect on
the share of local currency denominated revenues.
Commercial revenues fell 15.6%, or $12.4 million on an ‘As reported’ basis, and 21.7%, or 17.2 million, excluding the impact of IAS 29, as
the difficult macro environment resulted in lower cargo activity and a decline in duty free shop sales, together with the impact of the
Argentine peso depreciation on the share of local currency denominated revenues.
Construction Service revenue increased 40.6% YoY, or $26.6 million, mainly reflecting higher capex in the period. Had IAS 29 not been
adopted, Construction Service Revenue would have increased 32.1%, or $21.0 million YoY, in line with the capex program announced for
2019.
Excluding construction service revenue, total Argentina revenue in 2Q19 decreased 7.2% YoY, or $13.1 million, to $168.1 million, with a decrease
of 13.6%, or $24.7 million, had IAS 29 rule not been adopted in the period.
Cost of services increased 26.4% YoY, or $41.8 million, to $200.6 million. Had IAS 29 not been adopted, cost of services would have increased
9.3%, or $14.7 million, primarily due to an increase of 32.1%, or $21.0 million, in Construction Service costs reflecting significantly higher capex
in the quarter. Excluding construction service costs and IAS29 impact, Cost of services would have declined 6.8% YoY, or $6.3 million, driven
mainly by the following:
A 13.4%, or $3.6 million, decline in concession fees resulting from lower revenues, and
A 12.5%, or $3.3 million, decline in maintenance expenses, mainly denominated in local currency, reflecting currency depreciation in the
quarter,
An 11.2%, or $2.8 million, decline in salaries and social security contributions which benefitted from the Argentine peso depreciation,
partially offset by the additions made to the employee base to further enhance the passenger experience at the airports.
A 48.2%, or $1.2 million, increase in office expenses, reflecting the classification of IATA and SITA expenses as Cost of services, instead of
SG&A.
SG&A declined by 21.0% YoY, or $4.3 million, to $16.2 million in 2Q19. Had IAS29 not been implemented, SG&A would have declined 27.7%, or
$5.7 million, mainly due to reductions of:
19.1%, or $2.2 million, in turnover taxes related to the decline in revenues coupled with lower banking transaction taxes,
49.1%, or $1.8 million in salaries and social contributions, mainly benefitting from currency depreciation, and
$1.3 million in office expenses reflecting the classification of IATA and SITA expenses as Cost of services, instead of SG&A.
These declines were partially offset by an increase of $1.0 million in bad debts, reflecting higher past due receivables, mainly from commercial
tenants.
Adjusted Segment EBITDA in Argentina declined 8.4% YoY, or $6.6 million, to $72.3 million in 2Q19, with Adjusted Segment EBITDA margin Ex-
IFRIC12 down by 55 bps to 43.0%. Had IAS 29 not been adopted, Adjusted Segment EBITDA would have declined 15.2%, or $12.0 million, with
Adjusted EBITDA margin EX-IFRIC12 contracting 80 bps to 42.7% in 2Q19.
During 2Q19 CAAP made capital expenditures ex-IAS 29 of $86.8 million primarily for the construction of the new departure terminal building
and multilevel parking at Ezeiza Airport, the landfill and construction of a new park on Costanera Avenue at Aeroparque Airport. Investments
also include the construction of new terminal buildings at Comodoro Rivadavia Iguazú and Jujuy airports, the refurbishment and lighting of the
runway and taxiways at Córdoba Airport, the expansion of the terminal building at Bariloche, Mar del Plata and Esquel airports, as well as various
capex programs across other airports of the concession.

Page 14 of 40
Italy CAAP’s Italian segment represented 9.9% of consolidated 2Q19 revenues and 12.3% of adjusted EBITDA, excluding the effect of IAS 29. Pisa
Airport had approximately 1.6 million passengers while Florence Airport held 0.8 million passengers in 2Q19.
2Q19 2Q18 % Var. 6M19 6M18 % Var.
OPERATING STATISTICS
Domestic Passengers (in millions) 0.5 0.5 -2.1% 0.9 0.9 -2.2%
International Passengers (in millions) 1.9 1.9 0.5% 2.9 2.9 1.4%
Transit Passengers (in millions) 0.0 0.0 104.0% 0.0 0.0 88.3%
Total Passengers (in millions) 2.4 2.4 0.0% 3.8 3.8 0.6%
Cargo Volume (in thousands of tons) 3.4 3.0 13.2% 6.5 5.7 14.5%
Total Aircraft Movements (in thousands) 22.4 22.0 1.8% 36.6 35.9 1.9%
FINANCIAL HIGHLIGHTS
Aeronautical Revenue 26.6 26.7 -0.2% 43.5 47.2 -7.7%
Non-aeronautical revenue 12.5 15.3 -18.7% 22.3 26.5 -15.7%
Commercial revenue 9.9 9.5 3.7% 17.5 16.9 3.4%
Construction service revenue 2.2 5.2 -57.9% 4.0 6.7 -40.8%
Other revenue 0.4 0.6 -34.2% 0.9 2.9 -69.7%
Total Revenue 39.1 42.0 -7.0% 65.9 73.7 -10.6%
Total Revenue Excluding IFRIC12(1) 36.9 36.8 0.2% 61.9 67.0 -7.6%
Cost of Services 24.9 30.7 -19.0% 49.1 55.5 -11.6%
Selling, general and administrative expenses 3.4 3.5 -3.1% 6.9 6.8 0.3%
Total Costs and Expenses 28.3 34.2 -17.4% 55.9 62.4 -10.3%
Total Costs and Expenses Excluding IFRIC12(2) 26.5 29.5 -10.0% 53.0 56.5 -6.1%
Adjusted Segment EBITDA 13.9 10.7 29.6% 16.1 17.3 -7.0%
Adjusted Segment EBITDA Mg 35.6% 25.5% 1,003 24.4% 23.5% 96
Adjusted EBITDA Margin excluding IFRIC 12(3) 36.5% 28.0% 857 24.3% 24.6% -32
Capex 4.7 5.9 -21.2% 7.7 8.2 -7.2%
1 Excludes Construction Service revenue.
2 Excludes Construction Service cost.
3 Excludes the effect of IFRIC 12 with respect to the construction or improvements to concessioned assets, and is calculated by dividing EBITDA by total revenues
less Construction Service revenue.
Passenger Traffic in Italy remained stable YoY in 2Q19. Traffic at Florence Airport increased 5.2% reflecting easier comps as last year traffic was
impacted by Air France pilots’ strike. In addition, traffic benefited from the Easter Holiday effect together with the good performance of TAP’s
connecting flight to Lisbon and the additional flights to Madrid by Iberia. This was partially offset by a 2.5% decline in passenger traffic at Pisa
Airport, mainly reflecting the reduction of operations by Pobeda, offsetting increased traffic by newly opened route by Air Arabia Maroc to
Casablanca, Morocco. In addition, SAS airlines started operations at Florence airport, with three weekly flights to Copenhagen, and Eurowings
opened a new route to Dusseldorf, Germany. Cargo volume was up 1.8%, while total aircraft movements increased 1.9% YoY.
Revenues in 2Q19 declined 7.0% YoY, or $2.9 million, to $39.1 million, principally reflecting a decline in construction service revenue, due to
lower capex in the quarter. Excluding construction service revenue, revenues remained relatively flat YoY at $36.9 million.
Aeronautical revenues remained stable at $26.6 million, mainly due to the effect of the depreciation of the Euro against the US dollar during
the period. In local currency, aeronautical revenues were up 5.8% despite flat traffic volume, primarily reflecting lower marketing support
expenses in the quarter due to lower passenger traffic and a new agreement with a dominant airline at Pisa Airport, coupled with higher
revenues from the increase in the Passenger with Reduced Mobility fee granted in February 2019 and the increase in passenger use fees at
Pisa Airport in April 2019.

Page 15 of 40
Commercial revenues increased 3.7%, or $0.3 million in an ‘As reported’ basis, and 10.0% when measured in local currency, mainly due to
higher revenues from new agreements with car rentals at Pisa Airport together with VIP lounge and F&B revenues, benefitting from new
tenants at both Pisa and Florence airports.
Construction service revenue declined $3.0 million, due to lower capex in the quarter.
Cost of services declined 19.0% YoY, or $5.8 million, impacted by a one-time benefit of $2.2 million, reflecting the positive outcome of a claim
against the Ministry of Transport regarding the Fire Brigade Protection Fund dispute. Excluding this one-time item, cost of services would have
declined 11.7%, or $3.6 million, due to lower construction service cost and currency depreciation in the quarter.
SG&A declined 3.1% YoY, or $0.1 million, mainly as of the depreciation of the Euro against the US dollar. In local currency, SG&A increased 2.8%,
or $0.1 million, primarily reflecting the recognition of the amortization of leased assets under IFRS16 lease accounting standard.
Adjusted Segment EBITDA in Italy increased 29.6% YoY, or $3.2 million. Excluding construction services and the abovementioned one-time item,
Adjusted Segment EBITDA would have increased 8.6% YoY, or $0.9 million, to $11.7 million, with Adjusted Segment EBITDA margin ex-IFRIC12
expanding 247 basis points to 30.4% from 28.0% in 2Q18.
During 2Q19 CAAP made capital expenditures for $4.7 million in Italy, primarily on Master plan development in Florence Airport and new equipment at Pisa Airport.

Page 16 of 40
Brazil Brazil represented 7.2% of the Company’s consolidated 2Q19 revenues and 2.7% of its adjusted EBITDA, excluding IAS 29. Brasilia Airport and
Natal Airport had approximately 3.8 million and 0.5 million passengers in 2Q19, respectively.
2Q19 2Q18 % Var. 6M19 6M18 % Var.
OPERATING STATISTICS
Domestic Passengers (in millions) 2.6 2.9 -10.4% 5.5 5.8 -4.3%
International Passengers (in millions) 0.1 0.1 12.2% 0.3 0.3 -0.3%
Transit Passengers (in millions) 1.5 1.7 -10.3% 3.4 3.6 -5.8%
Total Passengers (in millions) 4.3 4.7 -9.8% 9.3 9.7 -4.8%
Cargo Volume (in thousands of tons) 23.9 15.7 52.0% 47.4 29.8 59.1%
Total Aircraft Movements (in thousands) 37.6 46.4 -18.9% 78.4 91.2 -14.0%
FINANCIAL HIGHLIGHTS
Aeronautical Revenue 12.8 13.8 -7.3% 27.4 30.5 -10.3%
Non-aeronautical revenue 15.6 16.5 -5.4% 30.7 31.8 -3.5%
Commercial revenue 15.6 16.5 -5.4% 30.7 31.8 -3.5%
Total Revenue 28.4 30.3 -6.2% 58.1 62.4 -6.8%
Cost of Services 24.3 27.2 -10.6% 48.9 55.5 -12.0%
Selling, general and administrative expenses 4.4 4.6 -4.5% 9.3 8.3 11.0%
Other expenses -0.4 0.1 -720.0% 0.1 0.2 -56.7%
Total Costs and Expenses 28.3 31.9 -11.2% 58.3 64.1 -9.1%
Adjusted Segment EBITDA 3.0 2.6 18.0% 6.1 6.8 -10.3%
Adjusted Segment EBITDA Mg 10.7% 8.5% 220 10.5% 10.9% -40
Capex 0.8 1.9 -59.9% 2.1 3.2 -36.6%
Note: This segment does not include the effects of IFRIC 12 with respect to the construction or improvements to concessioned assets.
Passenger Traffic in Brazil declined 9.8% YoY, to 4.3 million passengers in 2Q19, primarily reflecting the cessation of operations of Avianca Brasil
and the reduction in less profitable frequencies by a Latin American international Airline, as it seeks to optimize domestic operations at Brasilia
Airport. Domestic and transit traffic declined 10.4% and 10.3% respectively, offset by a 12.2% increase in international traffic, according to the
new traffic count methodology applied by ANAC since June 2018. Based on the prior methodology, international traffic would have increased
34.7% YoY at Brasilia airport, reflecting the routes to Miami and Orlando opened by Gol Airlines in November 2018 and the new direct flight to
Buenos Aires opened in December 2018. In addition, in June 2019 Gol airlines started a direct flight to Cancún, Mexico, departing from Brasilia
airport. Importantly, Gol airlines announced the addition of several frequencies over the coming months, in line with its strategy of expanding
operations at Brasilia airport, while LATAM Airlines announced the opening of new international routes from Brasilia Airport to Lima, Perú;
Asunción, Paraguay and Santiago de Chile, Chile, starting October 2019. Cargo volume was up 52%, while total aircraft movements declined
18.9% YoY.
Revenues in 2Q19 declined 6.2% YoY, or $1.9 million, impacted by the 8.8% depreciation of the Brazilian real during the period. In local currency,
however, revenues increased 2.0%.
Aeronautical revenues declined 7.3% YoY, or $1.0 million, but were up 0.6% in local currency, driven by a 5.8% YoY increase in tariffs at
Brasilia Airport starting August 2018 coupled with higher revenues from the 34.7% increase in international passengers, which more than
offset the decline in passenger traffic.
Commercial revenues declined 5.4%, or $0.9 million, impacted by the depreciation of the Brazilian Real against the US dollar, which more
than offset higher commercial tenants revenues together with higher cargo volume and an increase in VIP lounge revenues reflecting the
new agreements with airlines and Bradesco entered into during 4Q18.
Cost of services declined 10.6% YoY, or $2.9 million, to $24.3 million, mainly due to the depreciation of the Brazilian real against the US dollar.
Lower concession fee charges resulting from a change in the passenger curve used to calculate the amortization of the intangible asset
introduced in September 2018 also contributed to the decline in cost of services.

Page 17 of 40
SG&A declined 4.5% YoY, or $0.2 million, mainly reflecting the depreciation of the Brazilian real, but increased 3.0% in local currency, impacted
by higher bad debt provisions in connection with certain commercial tenants.
Adjusted Segment EBITDA in Brazil increased 18.0% YoY, or $0.5 million, to $3.0 million in the quarter, mainly reflecting the reduction in the
concession fee amount. Adjusted EBITDA margin expanded 220 bps to 10.7% from 8.5% in the year-ago quarter.

Page 18 of 40
Uruguay Uruguay represented 6.8% of the Company’s consolidated 2Q19 revenues and 10.7% of its adjusted EBITDA, excluding IAS 29. CAAP operates
two airports in Uruguay, General Cesáreo Berisso International Airport (“Carrasco Airport”) and Carlos A. Curbelo Airport (“Punta del Este
Airport”). During 2Q19, our Uruguayan airports had approximately 0.5 million passengers.
2Q19 2Q18 % Var. 6M19 6M18 % Var.
OPERATING STATISTICS
Domestic Passengers (in millions) 0.0 0.0 -16.3% 0.0 0.0 -34.6%
International Passengers (in millions) 0.5 0.5 -1.8% 1.1 1.2 -4.2%
Transit Passengers (in millions) 0.0 0.0 -47.7% 0.0 0.0 -41.0%
Total Passengers (in millions) 0.5 0.5 -2.1% 1.1 1.2 -4.4%
Cargo Volume (in thousands of tons) 6.8 6.8 0.8% 12.9 13.6 -4.5%
Total Aircraft Movements (in thousands) 6.5 7.1 -8.5% 15.9 18.1 -12.3%
FINANCIAL HIGHLIGHTS
Aeronautical Revenue 14.6 14.3 2.1% 34.9 33.7 3.6%
Non-aeronautical revenue 12.4 12.7 -2.0% 26.9 28.1 -4.5%
Commercial revenue 12.2 12.5 -2.0% 26.0 27.8 -6.4%
Construction service revenue 0.2 0.2 -4.5% 0.8 0.3 148.8%
Other revenue 0.0 0.0 9.6% 0.0 0.0 2.1%
Total Revenue 27.1 27.0 0.2% 61.8 61.8 -0.1%
Total Revenue Excluding IFRIC12(1) 26.9 26.8 0.2% 60.9 61.5 -0.9%
Cost of Services 13.5 14.4 -6.1% 29.1 28.8 0.8%
Selling, general and administrative expenses 3.8 3.5 6.8% 7.6 7.6 -0.5%
Other expenses 0.1 0.1 -18.3% 0.1 0.1 -8.4%
Total Costs and Expenses 17.4 18.0 -3.7% 36.7 36.6 0.5%
Total Costs and Expenses Excluding IFRIC12(1) 17.2 17.8 -3.6% 35.9 36.2 -0.8%
Adjusted Segment EBITDA 12.1 11.9 2.2% 30.9 31.2 -0.9%
Adjusted Segment EBITDA Mg 44.9% 44.0% 92 50.1% 50.5% -40
Adjusted EBITDA Margin excluding IFRIC 12 45.2% 44.3% 91 50.7% 50.7% -1
Capex 5.3 1.1 377.7% 6.2 1.7 272.3%
1 Excludes Construction Service revenue.
2 Excludes Construction Service cost.
3 Excludes the effect of IFRIC 12 with respect to the construction or improvements to concessioned assets, and is calculated by dividing EBITDA by total revenues
less Construction Service revenue.
Passenger Traffic in Uruguay declined 2.1% YoY, although showing a sequential improvement from the 6.2% decline in the previous quarter,
mainly reflecting easier comps from the Easter holidays effect discussed above, coupled with Winter holidays, which this year started in June
while last year started in July. In addition, lower passenger traffic from Argentina reflecting macro conditions, and the cancellation of Avianca
Colombia’s daily route to Bogotá, Colombia, since March 2019, also contributed to the reduction.
Revenues in 2Q19 remained flat YoY at $27.1 million.
Aeronautical revenues increased 2.1% YoY, or $0.3 million, mainly driven by an increase of 4.0% in traffic to international destinations other
than Aeroparque, in Buenos Aires, at Carrasco Airport, further supported by an increase to the passenger fees implemented in August 2018.
This more than offset the 19.0% decline in lower-margin shuttle (“Puente aéreo”) passengers to Aeroparque, in Buenos Aires, Argentina.
Commercial revenues declined 2.0%, or $0.2 million, reflecting an 8.3%, or $0.2 million, decline in Duty Free revenues, related to lower
passenger traffic and demand, and a decline in Parking revenues of 16.9%, or $0.1 million, due to lower demand, particularly by Argentine

Page 19 of 40
passengers, and the impact of the 15.9% average depreciation of the Uruguayan peso against the US dollar. This was partially offset by a
12%, or $0.1 million, increase in VIP lounge revenues, benefiting from new agreements signed during the quarter.
Cost of services were down 6.1% YoY, or $0.9 million, to $13.5 million, driven by declines of $1.0 million in maintenance, primarily reflecting the
temporary suspension of SISCA expenses, and $0.5 million in amortization and depreciation in the period, since assets from the Punta del Este
Airport were completely amortized as of March 2019, prior to the subsequent extension of this Concession. This was partially offset by an 11.0%,
or $0.5 million, YoY increase in salaries and social security contributions, reflecting the impact of the new variable compensation policy, which
more than offset the depreciation of the Uruguayan peso against the US dollar.
SG&A increased 6.8% YoY, or $0.2 million, to $3.8 million YoY, due to higher salaries resulting from the introduction of the new variable
compensation policy, further supported by with the depreciation of the Uruguayan peso against the US dollar and a $0.3 million bad debt at
Punta del Este airport, reflecting past due aircraft fees receivables. This was partially offset by lower services and fees, reflecting easier comps
as in 2Q18 was impacted by a $0.1 million charge related to a corporate governance project, together with lower utilities fees, resulting from
the implementation of a solar energy generation system.
Adjusted Segment EBITDA in Uruguay increased 2.2%, or $0.3 million, to $12.1 million, with Adjusted Segment EBITDA margin Ex-IFRIC12
expanding 91 bps to 45.2% from 44.3% in the year-ago quarter.
During 2Q19 CAAP made capital expenditures for $5.3 million in Uruguay, primarily to upgrade to LED lighting systems to take advantage of fiscal benefits and perimeter security at Carrasco Airport.

Page 20 of 40
Key Events for the Quarter Corporación América Airports Announces Extension of the Punta del Este Airport Concession Agreement On April 4, 2019, CAAP announced that the Uruguayan Executive Power approved the amendment of the concession agreement (the “Punta del Este Concession Agreement”) with CAAP’s fully-owned subsidiary Consorcio Aeropuertos Internacionales S.A. (“CAISA”), which operates and maintains the Punta del Este Airport in the city of Maldonado, by Punta del Este, Uruguay, and authorized the Ministry of Defense to grant the modification of the aforementioned contract. The amendment includes the extension of the term of the Punta del Este Concession Agreement for a fourteen–year period from 2019 through 2033. Terms of the Punta del Este Concession Agreement extension also include a minimum annual concession fee of $500,000 and CAISA’s commitment to make incremental capital expenditures of over US$35.0 million, including the construction of a new general aviation terminal building, repaving of runways and taxiways, remodeling of boarding areas and a new VIP lounge, together with implementation of technology and innovation to improve the passenger experience.
Corporación América Airports held its Annual General Shareholders Meeting
On May 22, 2019, Corporación América Airports held its annual general meeting of shareholders in Luxembourg. The Company’s shareholders
approved and adopted all matters submitted to them at the Meeting.
Subsequent Events Appeal Lodged Against the Judgement by the Regional Administrative Court of Tuscany with the Council of State
On July 25, 2019 Toscana Aeroporti S.p.A. announced that it lodged an appeal with the Council of State against judgement No.793 rendered by the Regional Administrative Court of Tuscany, Section I, on May 27, 2019, that overturned the favorable Environmental Impact Assessment (VIA) decree issued on December 28, 2017, for the project outlined in 2014-2029 Master Plan for Florence Airport.
Corporación América Airports Approves Contributions in Subsidiaries
On July 18, 2019, CAAP has subscribed and paid for new issuance of shares by Inframérica Participacões S.A. (that in turn has subscribed and
paid for new issuance of shares by Inframerica Concessionária do Aeroporto de Brasilia S.A.) in an amount of R$ 107.5 million, or $28.7 million.
(Infraero has also subscribed and paid for new issuance of shares by Inframerica Concessionária do Aeroporto de Brasilia S.A., pro-rata to its
stake i.e. 49% or R$ 102.9 million). Proceeds were used to pay the annual payment of concession fee.
Aeropuertos Argentina 2000 S.A. announced shareholders meeting’s results
On July 25, 2019, our subsidiary Aeropuertos Argentina 2000 S.A. held a shareholders meeting which unanimously resolved the payment of cash
dividends between the shareholders classes A, B, C and D, according to their holdings, for an amount of $50.0 million, or its equivalent in
Argentine pesos (which at the date of the shareholders meeting amounted to AR$ 2,143.5 million). Additionally, the payment of dividends on
the preferred shares for the amount of AR$ 118.3 million was approved, payable in additional preferred shares. The value was calculated based
on the value of the preferred shares, as adjusted by inflation, which amounted to AR$ 5,914.0 million. The Company will file an administrative
claim in order to adjust the economic-financial equation of the Concession Agreement, taking into account the higher value of the preferred
shares.
Aeropuertos Argentina 2000 S.A. announced two credit facility agreements
On August 9, 2019, CAAP’s subsidiary Aeropuertos Argentina 2000 S.A. entered into two credit facilities for a total principal amount of $120
million dollars: (a) the “onshore” credit facility agreement for a principal amount of US$85.0 million, and (b) the “offshore” credit facility
agreement for a principal amount of US$35.0 million. The term for the credit facility agreements shall be of thirty six months as from the
borrowing date. The principal amount under the credit facility agreements shall be repaid in nine quarterly equal and regular installments, the
first one being payed as from twelve months from the borrowing date. Proceeds shall be applied to the construction of infrastructure works in
the airports under the AA2000 concession.
Hyperinflation Accounting in Argentina Following the categorization of Argentina as a country with a three-year cumulative inflation rate greater than 100%, the country is considered
highly inflationary in accordance with IFRS. Consequently, starting July 1, 2018, the Company reports results of its Argentinean subsidiaries
applying IFRS rule IAS 29. IAS 29 requires that results of operations in hyperinflationary economies are reported as if these economies were
highly inflationary as of January 1, 2018, and thus year-to-date results should be restated adjusting for the change in general purchasing power
of the local currency, using official indices, before converting the local amounts at the closing rate of the period (i.e. December 31, 2018 closing
rate for 2018 results). For comparison purposes, the impact of adopting IAS 29 in Aeropuertos Argentina 2000 (“AA2000”), the Company’s largest
subsidiary in Argentina which accounted for 96.0%, 98.6% and 99.2% of passenger traffic, revenues and Adjusted EBITDA, respectively, of the
Argentina segment in 1Q19, is presented separately in each of the applicable sections of this earnings release, in a column denominated “IAS
29”.

Page 21 of 40
2Q19 EARNINGS CONFERENCE CALL
When: 9:00 a.m. Eastern time, August 23, 2019
Who: Mr. Martín Eurnekian, Chief Executive Officer
Mr. Raúl Francos, Chief Financial Officer
Ms. Gimena Albanesi, Head of Investor Relations
Dial-in: 1-888-347-6492 (U.S. domestic); 1-412-317-5258 (international)
Webcast: https://services.choruscall.com/links/caap190823.html
Replay: Participants can access the replay through August 30, 2019 by dialing:
1-877-344-7529 (U.S. domestic) and 1-412-317-0088 (international). Replay ID: 10134225.
Use of Non-IFRS Financial Measures This announcement includes certain references to Adjusted EBITDA, Adjusted EBITDA Margin, Adjusted EBITDA excluding Construction Service
and Adjusted EBITDA Margin excluding Construction service, as well as Net Debt:
Adjusted EBITDA is defined as income for the period before financial income, financial loss, income tax expense, depreciation and amortization.
Adjusted EBITDA Margin is calculated by dividing Adjusted EBITDA by total revenues.
Adjusted EBITDA excluding Construction Service (“Adjusted EBITDA ex-IFRIC”) is defined as income for the period before construction services
revenue and cost, financial income, financial loss, income tax expense, depreciation and amortization.
Adjusted EBITDA Margin excluding Construction Service (“Adjusted EBITDA Margin ex-IFRIC12”) excludes the effect of IFRIC 12 with respect to
the construction or improvements to concessioned assets and is calculated by dividing Adjusted EBITDA excluding Construction Service revenue
and cost, by total revenues less Construction service revenue.
Adjusted EBITDA, Adjusted EBITDA Margin, Adjusted EBITDA excluding Construction Service and Adjusted EBITDA Margin excluding Construction Service are not measures recognized under IFRS and should not be considered as an alternative to, or more meaningful than, consolidated net income for the year as determined in accordance with IFRS or as indicators of our operating performance from continuing operations. Accordingly, readers are cautioned not to place undue reliance on this information and should note that these measures as calculated by the Company, may differ materially from similarly titled measures reported by other companies. We believe that the presentation of Adjusted EBITDA and Adjusted EBITDA excluding Construction Service enhances an investor’s understanding of our performance and are useful for investors to assess our operating performance by excluding certain items that we believe are not representative of our core business. In addition, Adjusted EBITDA and Adjusted EBITDA excluding Construction Service are useful because they allow us to more effectively evaluate our operating performance and compare the results of our operations from period to period without regard to our financing methods, capital structure or income taxes and construction services (when applicable). Net debt is calculated by deducting “Cash and cash equivalents” from total financial debt.
Figures ex-IAS 29 result from dividing nominal Argentine pesos for the Argentine Segment, by the average foreign exchange rate of the Argentine
Peso against the US Dollar in the period. Percentage variations ex-IAS 29 figures compare results as presented in the prior year quarter before
IAS 29 came into effect, against ex-IAS 29 results for this quarter as described above. For comparison purposes the impact of adopting IAS 29 in
Aeropuertos Argentina 2000, the Company’s largest subsidiary in Argentina, is presented separately in each of the applicable sections of this
earnings release, in a column denominated “IAS 29”. The impact from “Hyperinflation Accounting in Argentina” is described in more detail page
20 of this report.
Definitions and Concepts Commercial Revenues: CAAP derives commercial revenue principally from fees resulting from warehouse usage (which includes cargo storage,
stowage and warehouse services and related international cargo services), services and retail stores, duty free shops, car parking facilities,
catering, hangar services, food and beverage services, retail stores, including royalties collected from retailers’ revenue, and rent of space,
advertising, fuel, airport counters, VIP lounges and fees collected from other miscellaneous sources, such as telecommunications, car rentals
and passenger services.

Page 22 of 40
Construction Service revenue and cost: Investments related to improvements and upgrades to be performed in connection with concession
agreements are treated under the intangible asset model established by IFRIC 12. As a result, all expenditures associated with investments
required by the concession agreements are treated as revenue generating activities given that they ultimately provide future benefits, and
subsequent improvements and upgrades made to the concession are recognized as intangible assets based on the principles of IFRIC 12. The
revenue and expense are recognized as profit or loss when the expenditures are performed. The cost for such additions and improvements to
concession assets is based on actual costs incurred by CAAP in the execution of the additions or improvements, considering the investment
requirements in the concession agreements. Through bidding processes, the Company contracts third parties to carry out such construction or
improvement services. The amount of revenues for these services is equal to the amount of costs incurred plus a reasonable margin, which is
estimated at an average of 3.0% to 5.0%.
About Corporación América Airports Corporación América Airports acquires, develops and operates airport concessions. The Company is the largest private airport operator in the
world based on the number of airports and the tenth largest based on passenger traffic. Currently, the Company operates 52 airports in 7
countries across Latin America and Europe (Argentina, Brazil, Uruguay, Peru, Ecuador, Armenia and Italy). In 2018, Corporación América Airports
served 81.3 million passengers. The Company is listed on the New York Stock Exchange where it trades under the ticker “CAAP”. For more
information, visit http://investors.corporacionamericaairports.com
Forward Looking Statements Statements relating to our future plans, projections, events or prospects are forward-looking statements within the meaning of the Private
Securities Litigation Reform Act of 1995. Forward-looking statements include all statements that are not historical facts and can be identified by
terms such as “believes,” “continue,” “could,” “potential,” “remain,” “will,” “would” or similar expressions and the negatives of those terms.
Forward-looking statements involve known and unknown risks, uncertainties and other factors that may cause our actual results, performance
or achievements to be materially different from any future results, performance or achievements expressed or implied by the forward-looking
statements. Many factors could cause our actual activities or results to differ materially from the activities and results anticipated in forward-
looking statements, including, but not limited to: delays or unexpected casualties related to construction under our investment plan and master
plans, our ability to generate or obtain the requisite capital to fully develop and operate our airports, general economic, political, demographic
and business conditions in the geographic markets we serve, decreases in passenger traffic, changes in the fees we may charge under our
concession agreements, inflation, depreciation and devaluation of the AR$, EUR, BRL, UYU, AMD or the PEN against the U.S. dollar, the early
termination, revocation or failure to renew or extend any of our concession agreements, the right of the Argentine Government to buy out the
AA2000 Concession Agreement, changes in our investment commitments or our ability to meet our obligations thereunder, existing and future
governmental regulations, natural disaster-related losses which may not be fully insurable, terrorism in the international markets we serve,
epidemics, pandemics and other public health crises and changes in interest rates or foreign exchange rates. The Company encourages you to
review the ‘Cautionary Statement’ and the ‘Risk Factor’ sections of our annual report on Form 20-F for the year ended December 31, 2018 and
any of CAAP’s other applicable filings with the Securities and Exchange Commission for additional information concerning factors that could
cause those differences.
Investor Relations Contact Gimena Albanesi
Head of Investor Relations
Email: [email protected]
Phone: +5411 4852-6411

Page 23 of 40
-- Operational & Financial Tables Follow –
Operating Statistics by Segment: Traffic, Cargo and Aircraft Movement
2Q19 2Q18 % Var. 6M19 6M18 % Var.
Argentina
Domestic Passengers (in millions) 6.6 5.4 22.1% 13.5 11.3 18.8%
International Passengers (in millions) 3.0 3.2 -5.5% 6.7 7.1 -5.8%
Transit passengers (in millions) 0.3 0.3 27.9% 0.7 0.6 13.4%
Total passengers (in millions) 9.9 8.8 12.3% 20.9 19.1 9.4%
Cargo volume (in thousands of tons) 54.8 56.6 -3.3% 110.8 117.0 -5.3%
Aircraft movements (in thousands) 106.0 105.9 0.1% 221.9 219.3 1.2%
Italy
Domestic Passengers (in millions) 0.5 0.5 -2.1% 0.9 0.9 -2.2%
International Passengers (in millions) 1.9 1.9 0.5% 2.9 2.9 1.4%
Transit passengers (in millions) 0.0 0.0 104.0% 0.0 0.0 88.3%
Total passengers (in millions) 2.4 2.4 0.0% 3.8 3.8 0.6%
Cargo volume (in thousands of tons) 3.4 3.0 13.2% 6.5 5.7 14.5%
Aircraft movements (in thousands) 22.4 22.0 1.8% 36.6 35.9 1.9%
Brazil
Domestic Passengers (in millions) 2.6 2.9 -10.4% 5.5 5.8 -4.3%
International Passengers (in millions) 0.1 0.1 12.2% 0.3 0.3 -0.3%
Transit passengers (in millions) 1.5 1.7 -10.3% 3.4 3.6 -5.8%
Total passengers (in millions) 4.3 4.7 -9.8% 9.3 9.7 -4.8%
Cargo volume (in thousands of tons) 23.9 15.7 52.0% 47.4 29.8 59.1%
Aircraft movements (in thousands) 37.6 46.4 -18.9% 78.4 91.2 -14.0%
Uruguay
Domestic Passengers (in millions) 0.0 0.0 -16.3% 0.0 0.0 -34.6%
International Passengers (in millions) 0.5 0.5 -1.8% 1.1 1.2 -4.2%
Transit passengers (in millions) 0.0 0.0 -47.7% 0.0 0.0 -41.0%
Total passengers (in millions) 0.5 0.5 -2.1% 1.1 1.2 -4.4%
Cargo volume (in thousands of tons) 6.8 6.8 0.8% 12.9 13.6 -4.5%
Aircraft movements (in thousands) 6.5 7.1 -8.5% 15.9 18.1 -12.3%
Ecuador(1)
Domestic Passengers (in millions) 0.6 0.6 -2.6% 1.2 1.2 0.6%
International Passengers (in millions) 0.5 0.5 7.6% 1.0 0.9 9.7%
Transit passengers (in millions) 0.0 0.0 7.3% 0.0 0.0 6.0%
Total passengers (in millions) 1.1 1.1 2.1% 2.2 2.1 4.7%
Cargo volume (in thousands of tons) 9.8 10.5 -6.2% 21.2 20.5 3.0%
Aircraft movements (in thousands) 20.3 20.1 1.3% 40.9 38.0 7.6%
Armenia
Domestic Passengers (in millions) 0.0 0.0 - 0.0 0.0 -
International Passengers (in millions) 0.7 0.7 8.9% 1.3 1.2 9.5%
Transit passengers (in millions) 0.0 0.0 - 0.0 0.0 -
Total passengers (in millions) 0.7 0.7 8.9% 1.3 1.2 9.5%

Page 24 of 40
2Q19 2Q18 % Var. 6M19 6M18 % Var.
Cargo volume (in thousands of tons) 4.7 4.3 9.5% 8.3 7.8 6.3%
Aircraft movements (in thousands) 6.0 6.0 0.2% 11.4 11.0 3.9%
Peru(2)
Domestic Passengers (in millions) 0.9 0.8 3.9% 1.6 1.6 -0.7%
International Passengers (in millions) 0.0 0.0 5376.5% 0.0 0.0 546.4%
Transit passengers (in millions) 0.0 0.0 - 0.0 0.0 -
Total passengers (in millions) 0.9 0.8 4.5% 1.6 1.6 -0.5%
Cargo volume (in thousands of tons) 1.2 1.2 -1.9% 2.4 2.4 0.1%
Aircraft movements (in thousands) 7.9 8.0 -1.1% 14.5 15.4 -5.9%
(1) ECOGAL’s operational data included in this table, although its results of operations are not consolidated.
(2) AAP’s operational data included in this table, although its results of operations are not consolidated.

Page 25 of 40
Foreign Exchange Rate
Country 2Q19 2Q18 2Q19 2Q18 1Q19 1Q18 1Q19 1Q18
Avg Avg EoP EoP Avg Avg EoP EoP
Argentine Peso 44.01 23.58 42.46 28.85 39.01 19.68 43.35 20.15
Euro 0.89 0.84 0.88 0.86 0.88 0.81 0.89 0.81
Brazilian Real 3.92 3.61 3.83 3.86 3.77 3.24 3.90 3.32
Uruguayan Peso 34.86 30.09 35.18 31.47 32.81 30.15 33.48 28.39
Amounts provided by units of local currency per US dollar
Aeronautical Breakdown (in US$ million)
2Q18 2Q19 ex IAS
29 IAS 29
2Q19 as reported
% Var as reported
% Var ex IAS 29
Aeronautical Revenue 185.6 178.7 6.7 185.4 -0.1% -3.7%
Passenger use fees 146.5 139.1 5.8 144.9 -1.1% -5.0%
Aircraft fees 36.0 31.2 0.9 32.1 -10.9% -13.4%
Other 3.2 8.4 0.0 8.4 167.0% 167.0%
Commercial Revenue Breakdown (in US$ million)
2Q18 2Q19 ex IAS
29 IAS 29
2Q19 as reported
% Var as reported
% Var ex IAS 29
Commercial revenue 138.1 121.9 4.9 126.7 -8.2% -11.7%
Warehouse use fees 49.2 39.2 2.3 41.5 -15.6% -20.3%
Duty free shops 15.9 12.2 0.4 12.6 -20.6% -23.1%
Rental of space (including hangars) 8.4 8.6 0.3 8.8 5.5% 2.3%
Parking facilities 9.7 7.5 0.3 7.7 -20.0% -22.8%
Fuel 13.1 15.0 0.1 15.2 16.1% 15.1%
Food and beverage services 6.5 5.1 0.2 5.3 -18.6% -21.0%
Advertising 5.1 4.6 0.1 4.8 -5.8% -8.6%
Services and retail stores 4.6 4.2 0.1 4.3 -7.5% -8.9%
Catering 3.5 2.8 0.2 2.9 -16.1% -20.9%
VIP lounges 6.0 7.1 0.4 7.6 26.6% 19.2%
Walkway services 2.2 2.3 0.1 2.4 9.4% 3.8%
Other 14.1 13.3 0.4 13.7 -3.2% -5.7%

Page 26 of 40
Revenues by Segment (in US$ million)
Country 6M18 6M19 ex IAS
29 IAS 29
6M19 as reported
% Var as reported
% Var ex IAS 29
Argentina 495.0 478.3 27.7 506.1 2.2% -3.4%
Italy 73.7 65.9 0.0 65.9 -10.6% -10.6%
Brazil 62.4 58.1 0.0 58.1 -6.8% -6.8%
Uruguay 61.8 61.8 0.0 61.8 -0.1% -0.1%
Armenia 49.8 58.0 0.0 58.0 16.5% 16.5%
Ecuador (1) 43.6 48.6 0.0 48.6 11.5% 11.5%
Unallocated 1.7 0.4 0.0 0.4 -76.0% -76.0%
Total consolidated revenue (2) 787.9 771.1 27.7 798.8 1.4% -2.1%
1 Only includes Guayaquil Airport. 2 Excluding Construction Service revenue, revenue decreased 7.2% YoY in Argentina and 7.0% in Italy, but increased 0.2% in Uruguay, 6.7% in Ecuador and 8.7%
in Armenia.
Revenue Breakdown (in US$ million)
6M18 6M19 ex
IAS 29 IAS 29
6M19 as reported
% Var as reported
% Var ex IAS 29
Aeronautical Revenue 390.4 371.1 11.6 382.7 -2.0% -5.0%
Non-aeronautical Revenue 397.5 400.0 16.1 416.2 4.7% 0.6%
Commercial revenue 275.3 240.1 7.9 248.0 -9.9% -12.8%
Construction service revenue (1) 119.3 159.0 8.2 167.2 40.2% 33.3%
Other revenue 2.9 1.0 0.0 1.0 -66.5% -66.5%
Total Consolidated Revenue 787.9 771.1 27.7 798.8 1.4% -2.1%
Total Revenue excluding Construction Service revenue (2)
668.7 612.1 19.5 631.6 -5.5% -8.5%
1 Construction Service revenue equals the construction or upgrade costs plus a reasonable margin.
2 Excludes Construction Service revenue.
Aeronautical Breakdown (in US$ million)
6M18 6M19 ex
IAS 29 IAS 29
6M19 as reported
% Var as reported
% Var ex IAS 29
Aeronautical Revenue 390.4 371.1 11.6 382.7 -2.0% -5.0%
Passenger use fees 305.8 292.5 10.1 302.6 -1.1% -4.4%
Aircraft fees 69.6 62.3 1.5 63.8 -8.3% -10.4%
Other 15.0 16.2 0.0 16.2 8.5% 8.5%

Page 27 of 40
Commercial Revenue Breakdown (in US$ million)
6M18 6M19 ex IAS
29 IAS 29
6M19 as reported
% Var as reported
% Var ex IAS 29
Commercial revenue 275.3 240.1 7.9 248.0 -9.9% -12.8%
Warehouse use fees 96.3 77.6 3.7 81.3 -15.6% -19.5%
Duty free shops 32.0 24.9 0.7 25.5 -20.2% -22.3%
Rental of space (including hangars) 17.0 17.9 0.4 18.4 7.9% 5.2%
Parking facilities 20.1 14.2 0.4 14.6 -27.4% -29.5%
Fuel 24.3 27.2 0.2 27.4 12.8% 12.0%
Food and beverage services 13.7 10.6 0.3 10.8 -20.9% -22.9%
Advertising 10.1 9.8 0.2 10.0 -0.5% -2.6%
Services and retail stores 9.0 8.3 0.1 8.4 -7.2% -8.6%
Catering 7.3 5.6 0.3 5.9 -19.0% -22.8%
VIP lounges 12.2 14.2 0.7 15.0 22.5% 16.5%
Walkway services 4.7 4.8 0.2 5.0 5.9% 1.5%
Other 28.5 25.1 0.7 25.7 -9.8% -12.1%
Total Expenses Breakdown (in US$ million)
2Q18 2Q19 ex IAS 29
IAS 29 2Q19 as reported
% Var as reported
% Var ex IAS 29
Cost of services 263.5 275.9 27.1 303.1 15.0% 4.7%
Selling, general and administrative expenses 43.5 35.8 1.4 37.2 -14.6% -17.8%
Financial loss 198.9 39.4 -27.2 12.3 -93.8% -80.2%
Inflation adjustment 0.0 0.4 6.8 7.2 - -
Other expenses 0.5 0.1 0.0 0.1 -70.5% -75.2%
Income tax expense -20.1 12.1 1.0 13.1 -165.3% -160.3%
Total expenses 486.3 363.7 9.2 372.9 -23.3% -25.2%
Cost of Services (in US$ million)
2Q18 2Q19 ex IAS 29
IAS 29 2Q19 as reported
% Var as reported
% Var ex IAS 29
Cost of Services 263.5 275.9 27.1 303.1 15.0% 4.7%
Salaries and social security contributions 51.7 49.3 1.7 51.0 -1.3% -4.5%
Concession fees 46.1 39.3 1.7 41.0 -11.2% -14.8%
Construction service cost 72.1 93.8 5.5 99.3 37.7% 30.0%
Maintenance expenses 35.4 30.8 2.2 33.0 -6.8% -13.1%
Amortization and depreciation 24.9 23.7 16.1 39.8 60.3% -4.4%
Services and fees 14.6 16.8 -0.4 16.4 12.9% 15.4%
Cost of fuel 8.4 10.3 0.0 10.3 22.8% 22.8%
Taxes 4.2 4.2 0.1 4.2 1.8% 0.5%
Office expenses 3.3 3.8 0.2 4.1 23.9% 16.6%
Provision for maintenance cost 0.1 0.2 0.0 0.2 152.9% 152.9%
Others 2.8 3.6 0.0 3.7 30.1% 29.0%

Page 28 of 40
Selling, General and Administrative Expenses (in US$ million)
2Q18 2Q19 ex IAS 29
IAS 29 2Q19 as reported
% Var as reported
% Var ex IAS 29
SG&A 43.5 35.8 1.4 37.2 -14.6% -17.8%
Taxes 12.3 10.1 0.6 10.7 -13.0% -18.3%
Salaries and social security contributions 8.5 6.7 0.0 6.8 -19.8% -20.3%
Services and fees 10.7 8.9 0.0 8.9 -16.8% -17.2%
Office expenses 2.9 1.7 0.1 1.8 -36.3% -39.5%
Amortization and depreciation 2.1 2.0 0.4 2.5 20.0% -0.6%
Maintenance expenses 0.4 0.4 0.0 0.4 -13.8% -12.4%
Advertising 1.4 0.4 0.0 0.4 -68.7% -70.2%
Insurances 0.8 0.5 0.0 0.5 -34.2% -34.3%
Charter services 0.2 0.2 0.0 0.2 -0.2% -0.2%
Bad debts recovery 0.0 -0.3 0.0 -0.3 - -
Bad debts 0.8 2.5 0.1 2.6 202.8% 190.8%
Others 3.5 2.7 0.0 2.7 -23.8% -23.8%
Expenses by Segment (in US$ million)
Country 2Q18 2Q19 ex IAS 29
IAS 29 2Q19 as reported
% Var as reported
% Var ex IAS 29
Argentina 179.5 188.7 28.5 217.2 21.0% 5.1%
Italy 34.2 28.3 0.0 28.3 -17.4% -17.4%
Brazil 31.9 28.3 0.0 28.3 -11.2% -11.2%
Uruguay 18.0 17.4 0.0 17.4 -3.7% -3.7%
Armenia 19.0 23.9 0.0 23.9 26.1% 26.1%
Ecuador 16.5 18.8 0.0 18.8 14.1% 14.1%
Unallocated 8.4 6.4 0.0 6.4 -23.7% -23.7%
Total consolidated expenses (1) (2) 307.5 311.8 28.5 340.4 10.7% 1.4%
(1) Excludes income tax and financial loss (2) We account for the results of operations of ECOGAL and AAP using the equity method
Costs and Expenses (in US$ million)
6M18 6M19 ex
IAS 29 IAS 29
6M19 as reported
% Var as reported
% Var ex IAS 29
Cost of Services 504.6 521.6 47.8 569.4 12.8% 3.4%
Salaries and social security contributions 103.2 96.7 2.6 99.3 -3.8% -6.3%
Concession fees 95.1 83.4 2.8 86.2 -9.3% -12.3%
Construction service cost 118.3 157.6 8.2 165.8 40.2% 33.2%
Maintenance expenses 71.9 61.1 3.1 64.2 -10.8% -15.1%
Amortization and depreciation 49.9 49.3 30.7 80.0 60.3% -1.2%
Other 66.3 73.5 0.4 73.9 11.5% 10.9%
Cost of Services Excluding Construction Service cost 386.4 364.0 39.5 403.5 4.5% -5.8%
Selling, general and administrative expenses 87.5 75.2 2.5 77.7 -11.3% -14.1%
Other expenses 1.7 0.9 0.0 0.9 -45.0% -46.1%
Total Costs and Expenses 593.9 597.7 50.3 648.0 9.1% 0.6%
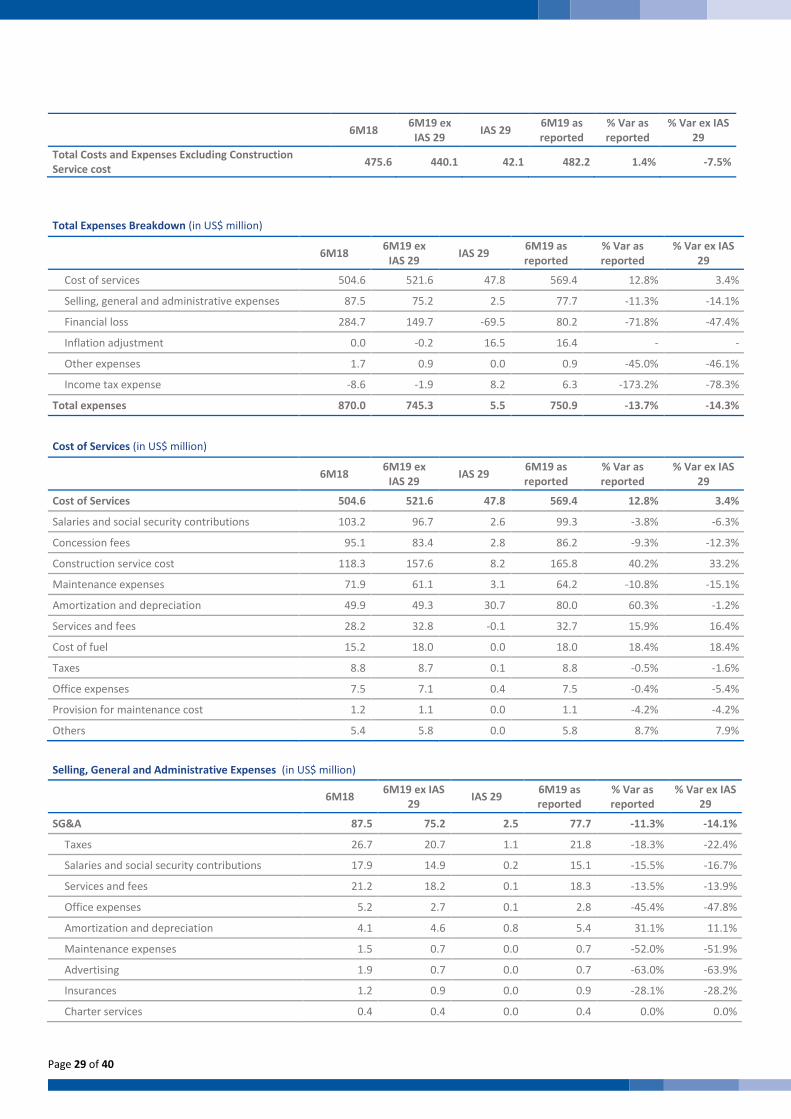
Page 29 of 40
6M18 6M19 ex
IAS 29 IAS 29
6M19 as reported
% Var as reported
% Var ex IAS 29
Total Costs and Expenses Excluding Construction Service cost
475.6 440.1 42.1 482.2 1.4% -7.5%
Total Expenses Breakdown (in US$ million)
6M18 6M19 ex
IAS 29 IAS 29
6M19 as reported
% Var as reported
% Var ex IAS 29
Cost of services 504.6 521.6 47.8 569.4 12.8% 3.4%
Selling, general and administrative expenses 87.5 75.2 2.5 77.7 -11.3% -14.1%
Financial loss 284.7 149.7 -69.5 80.2 -71.8% -47.4%
Inflation adjustment 0.0 -0.2 16.5 16.4 - -
Other expenses 1.7 0.9 0.0 0.9 -45.0% -46.1%
Income tax expense -8.6 -1.9 8.2 6.3 -173.2% -78.3%
Total expenses 870.0 745.3 5.5 750.9 -13.7% -14.3%
Cost of Services (in US$ million)
6M18 6M19 ex
IAS 29 IAS 29
6M19 as reported
% Var as reported
% Var ex IAS 29
Cost of Services 504.6 521.6 47.8 569.4 12.8% 3.4%
Salaries and social security contributions 103.2 96.7 2.6 99.3 -3.8% -6.3%
Concession fees 95.1 83.4 2.8 86.2 -9.3% -12.3%
Construction service cost 118.3 157.6 8.2 165.8 40.2% 33.2%
Maintenance expenses 71.9 61.1 3.1 64.2 -10.8% -15.1%
Amortization and depreciation 49.9 49.3 30.7 80.0 60.3% -1.2%
Services and fees 28.2 32.8 -0.1 32.7 15.9% 16.4%
Cost of fuel 15.2 18.0 0.0 18.0 18.4% 18.4%
Taxes 8.8 8.7 0.1 8.8 -0.5% -1.6%
Office expenses 7.5 7.1 0.4 7.5 -0.4% -5.4%
Provision for maintenance cost 1.2 1.1 0.0 1.1 -4.2% -4.2%
Others 5.4 5.8 0.0 5.8 8.7% 7.9%
Selling, General and Administrative Expenses (in US$ million)
6M18 6M19 ex IAS
29 IAS 29
6M19 as reported
% Var as reported
% Var ex IAS 29
SG&A 87.5 75.2 2.5 77.7 -11.3% -14.1%
Taxes 26.7 20.7 1.1 21.8 -18.3% -22.4%
Salaries and social security contributions 17.9 14.9 0.2 15.1 -15.5% -16.7%
Services and fees 21.2 18.2 0.1 18.3 -13.5% -13.9%
Office expenses 5.2 2.7 0.1 2.8 -45.4% -47.8%
Amortization and depreciation 4.1 4.6 0.8 5.4 31.1% 11.1%
Maintenance expenses 1.5 0.7 0.0 0.7 -52.0% -51.9%
Advertising 1.9 0.7 0.0 0.7 -63.0% -63.9%
Insurances 1.2 0.9 0.0 0.9 -28.1% -28.2%
Charter services 0.4 0.4 0.0 0.4 0.0% 0.0%

Page 30 of 40
Bad debts recovery 0.0 -0.4 0.0 -0.4 - -
Bad debts 1.8 6.9 0.2 7.1 298.1% 288.8%
Others 5.8 4.9 0.0 4.9 -15.1% -15.1%
Expenses by Segment (in US$ million)
Country 6M18 6M19 ex
IAS 29 IAS 29
6M19 as reported
% Var as reported
% Var ex IAS 29
Argentina 346.7 354.2 50.3 404.5 16.7% 2.2%
Italy 62.4 55.9 0.0 55.9 -10.3% -10.3%
Brazil 64.1 58.3 0.0 58.3 -9.1% -9.1%
Uruguay 36.6 36.7 0.0 36.7 0.5% 0.5%
Armenia 34.5 43.3 0.0 43.3 25.4% 25.4%
Ecuador 33.0 36.8 0.0 36.8 11.6% 11.6%
Unallocated 16.7 12.5 0.0 12.5 -25.0% -25.0%
Total consolidated expenses (1) (2) 593.9 597.7 50.3 648.0 9.1% 0.6%
(1) Excludes income tax and financial loss (2) We account for the results of operations of ECOGAL and AAP using the equity method
Adjusted EBITDA by Segment (in US$ million)
6M18 6M19 ex
IAS 29 IAS 29
6M19 as reported
% Var as reported
% Var ex IAS 29
Argentina 172.0 150.5 9.5 159.9 -7.0% -12.5%
Italy 17.3 16.1 0.0 16.1 -7.0% -7.0%
Brazil 6.8 6.1 0.0 6.1 -10.3% -10.3%
Uruguay 31.2 30.9 0.0 30.9 -0.9% -0.9%
Armenia 21.2 21.1 0.0 21.1 -0.4% -0.4%
Ecuador 13.7 12.7 0.0 12.7 -7.5% -7.5%
Unallocated -3.8 -1.5 0.0 -1.5 -60.5% -60.5%
Perú -0.4 -0.9 0.0 -0.9 99.6% 99.6%
Total segment EBITDA 257.9 235.0 9.5 244.5 -5.2% -8.9%
Adjusted EBITDA Reconciliation to Income from Continuing Operations (in US$ million)
6M18 6M19 ex
IAS 29 IAS 29
6M19 as reported
% Var as reported
% Var ex IAS 29
Income from Continuing Operations -8.6 74.6 10.7 85.3 -1089.8% -966.0%
Financial Income -63.5 -41.1 12.1 -29.0 -54.3% -35.3%
Financial Loss 0.0 -0.2 16.5 16.4 - -
Inflation adjustment -8.6 -1.9 8.2 6.3 -173.2% -78.3%
Income Tax Expense 284.7 149.7 -69.5 80.2 -71.8% -47.4%
Amortization and Depreciation 54.0 53.8 31.5 85.4 58.1% -0.3%
Adjusted EBITDA 257.9 235.0 9.5 244.5 -5.2% -8.9%
Adjusted EBITDA Margin 32.7% 30.5% 0.0% 30.6% -213 -225
Adjusted EBITDA excluding Construction Service 256.9 233.7 9.5 243.1 -5.4% -9.1%
Adjusted EBITDA Margin excluding Construction Service
38.4% 38.2% 0.0% 38.5% 7 -25

Page 31 of 40
6M18 6M19 ex
IAS 29 IAS 29
6M19 as reported
% Var as reported
% Var ex IAS 29
Financial Income 63.5 41.1 -12.1 29.0 -54.3% -35.3%
Interest income 11.7 19.4 1.0 20.4 74.4% 65.9%
Foreign exchange income 49.7 19.7 -14.0 5.7 -88.5% -60.4%
Other 2.1 2.9 0.0 2.9 38.6% 38.6%
Financial Loss -284.7 -149.7 69.5 -80.2 -71.8% -47.4%
Interest Expenses -46.1 -45.3 -0.9 -46.2 0.2% -1.8%
Foreign exchange transaction expenses -180.9 -56.1 71.2 15.1 -108.4% -69.0%
Leases financial cost 0.0 -0.3 0.0 -0.3 - -
Changes in liability for Brazilian concessions -50.4 -46.9 0.0 -46.9 -6.9% -6.9%
Other expenses -7.3 -2.0 0.0 -2.0 -72.8% -72.8%
Inflation adjustment 0.0 0.2 -16.5 -16.4 - -
Inflation adjustment 0.0 0.2 -16.5 -16.4 - -
Financial Results, Net -221.1 -108.4 40.8 -67.6 -69.5% -51.0%
% Ownership by Concession
Aeropuertos Argentina 2000 Argentina 81.3%
Neuquén Argentina 74.1%
Bahía Blanca Argentina 81.1%
Toscana Aeroporti (Florence and Pisa airports) Italy 46.7%
ICAB (Brasilia Airport) Brasil 51.0%
ICASGA (Natal Airport) Brasil 99.9%
Puerta del Sur (Carrasco Airport) Uruguay 100.0%
CAISA (Punta del Este Airport) Uruguay 100.0%
AIA (Armenian airports) Armenia 100.0%
TAGSA (Guayaquil Airport) Ecuador 50.0%
ECOGAL (Galápagos Airport) Ecuador 99.9%
Aeropuertos Andinos del Peru Peru 50.0%
Selected Income Statement Data (in US$ million)
2Q19 2Q18 % Var. 6M19 6M18 % Var.
Argentina
Total Revenue 260.2 246.7 5.5% 506.1 495.0 2.2%
Total Revenue Excluding IFRIC12(1) 168.1 181.2 -7.2% 351.6 385.0 -8.7%
Operating Income 47.1 71.7 -34.2% 110.3 157.7 -30.0%
Adjusted Segment EBITDA 72.3 78.9 -8.4% 159.9 172.0 -7.0%
Adjusted Segment EBITDA Mg 27.8% 32.0% -420 31.6% 34.7% -314
Adjusted EBITDA Margin excluding IFRIC 12(1) 43.0% 43.5% -55 45.5% 44.6% 82
Italy
Total Revenue 39.1 42.0 -7.0% 65.9 73.7 -10.6%
Total Revenue Excluding IFRIC12(1) 36.9 36.8 0.2% 61.9 67.0 -7.6%

Page 32 of 40
2Q19 2Q18 % Var. 6M19 6M18 % Var.
Operating Income 10.8 7.8 38.8% 9.9 11.4 -12.5%
Adjusted Segment EBITDA 13.9 10.7 29.6% 16.1 17.3 -7.0%
Adjusted Segment EBITDA Mg 35.6% 25.5% 1003 24.4% 23.5% 96
Adjusted EBITDA Margin excluding IFRIC 12(1) 36.5% 28.0% 857 24.3% 24.6% -32
Brazil
Total Revenue 28.4 30.3 -6.2% 58.1 62.4 -6.8%
Operating Income 0.2 -1.6 -113.2%
Adjusted segment EBITDA 3.0 2.6 18.0% 6.1 6.8 -10.3%
Adjusted Segment EBITDA Mg 10.7% 8.5% 220 10.5% 10.9% -40
Uruguay
Total Revenue 27.1 27.0 0.2% 61.8 61.8 -0.1%
Total Revenue Excluding IFRIC12(1) 26.9 26.8 0.2% 60.9 61.5 -0.9%
Operating Income 9.1 8.5 7.8% 23.9 24.2 -1.3%
Adjusted Segment EBITDA 12.1 11.9 2.2% 30.9 31.2 -0.9%
Adjusted Segment EBITDA Mg 44.9% 44.0% 92 50.1% 50.5% -40
Adjusted EBITDA Margin excluding IFRIC 12(1) 45.2% 44.3% 91 50.7% 50.7% -1
Ecuador
Total Revenue 24.9 22.1 12.8% 48.6 43.6 11.5%
Total Revenue Excluding IFRIC12(1) 23.5 22.1 6.7% 47.2 43.6 8.3%
Operating Income 5.3 4.9 8.8% 10.4 10.0 4.2%
Adjusted Segment EBITDA 6.5 6.8 -4.1% 12.7 13.7 -7.5%
Adjusted Segment EBITDA Mg 26.1% 30.7% -460 26.1% 31.4% -535
Adjusted EBITDA Margin excluding IFRIC 12(1) 27.6% 30.7% -310 26.8% 31.4% -460
Armenia
Total Revenue 32.7 28.1 16.5% 58.0 49.8 16.5%
Total Revenue Excluding IFRIC12(1) 28.6 26.3 8.7% 51.5 47.5 8.2%
Operating Income 8.9 9.1 -2.9% 14.7 15.3 -3.6%
Adjusted Segment EBITDA 12.1 12.1 0.0% 21.1 21.2 -0.4%
Adjusted Segment EBITDA Mg 37.0% 43.2% -611 36.4% 42.6% -620
Adjusted EBITDA Margin excluding IFRIC 12(1) 42.0% 45.9% -390 40.7% 44.5% -380
Unallocated
Total revenue 0.2 0.9 -77.2% 0.0 0.0 -
Operating income -4.9 -6.3 -21.7% 0.0 0.0 -
Adjusted segment EBITDA -1.2 -1.3 -11.9% -0.9 -0.4 99.6%
Adjusted Segment EBITDA Mg N/A N/A N/A N/A N/A N/A
1 Excludes Construction Service revenue.
2 Excludes the effect of IFRIC 12 with respect to the construction or improvements to concessioned assets.
3 Starting in 3Q18, reported numbers are presented applying Hyperinflation accounting for our Argentinean subsidiaries, in accordance with IAS 29, as explained
above. Please refer to Review of Segments – Argentina to see the effect of this rule in our Argentinean subsidiaries.

Page 33 of 40
Operating Statistics by Airport: Traffic, Cargo and Aircraft Movements
Domestic Passenger Traffic
(in thousands) International Passenger Traffic
(in thousands) Transit Passengers
(in thousands) Total Passenger Traffic
(in thousands) Cargo volume
(in tons) Aircraft movements
2Q'19 2Q'18 % Var. 2Q'19 2Q'18 % Var. 2Q'19 2Q'18 % Var. 2Q'19 2Q'18 % Var. 2Q'19 2Q'18 % Var. 2Q'19 2Q'18 % Var.
Argentina
Aeroparque (1) 2,508 2,274 10% 57 512 -89% 184 147 25% 2,749 2,933 -6% 335 515 -35% 25,190 31,054 -19%
Bariloche 308 241 28% 2 1 302% 1 1 -44% 310 242 28% 0 71 -100% 2,456 2,429 1%
Catamarca 17 17 4% 0 0 - 1 0 533% 19 17 10% 27 33 -18% 646 510 27%
C. Rivadavia 158 152 4% 0 0 - 2 0 570% 160 152 5% 265 152 75% 2,463 2,484 -1%
Córdoba 671 533 26% 158 242 -35% 34 34 -1% 862 809 7% 436 420 4% 7,515 8,377 -10%
El Palomar (2) 345 148 134% 52 0 - 0 0 - 398 148 170% 0 0 - 2,899 1,486 95%
Esquel 11 11 7% 0 0 - 0 0 30% 11 11 7% 0 0 - 239 191 25%
Ezeiza (1) 197 134 47% 2,575 2,210 17% 54 38 43% 2,826 2,382 19% 51,428 53,198 -3% 20,970 17,719 18%
Formosa 27 28 -6% 0 0 -69% 0 0 - 27 28 -6% 43 35 23% 483 463 4%
General Pico 1 1 -10% 0 0 - 0 0 150% 1 1 -9% 0 0 - 1,050 1,176 -11%
Iguazú 353 147 141% 0 0 51% 1 0 4794% 354 147 141% 0 0 - 2,990 1,569 91%
Jujuy 94 115 -19% 0 2 -96% 0 0 -87% 94 117 -20% 30 29 3% 1,157 1,485 -22%
La Rioja 18 18 -2% 0 0 - 1 0 766% 19 18 4% 31 38 -18% 482 421 14%
Malargüe 0 0 153% 0 0 50% 0 0 - 0 0 148% 0 0 - 52 56 -7%
Mar del Plata 77 92 -16% 0 0 141% 6 4 39% 83 96 -14% 41 48 -15% 1,694 1,949 -13%
Mendoza 460 324 42% 120 157 -24% 6 6 3% 586 487 20% 158 414 -62% 5,588 5,120 9%
Paraná 16 20 -19% 0 0 -35% 0 0 1600% 16 20 -19% 0 0 - 635 742 -14%
Posadas 85 72 18% 0 0 11% 0 0 364% 86 72 19% 80 102 -21% 1,215 1,091 11%
Pto Madryn 21 21 -1% 0 0 - 0 2 -100% 21 23 -12% 0 0 - 181 240 -25%
Reconquista 0 0 157% 0 0 0% 0 0 45% 0 0 141% 0 0 - 1,031 698 48%
Resistencia 76 77 -1% 0 0 -85% 12 0 18173% 88 78 14% 120 116 4% 1,211 1,244 -3%
Río Cuarto 10 9 14% 0 0 - 0 0 - 10 9 14% 17 3 441% 197 192 3%
Río Gallegos 59 51 17% 0 0 0% 2 1 78% 62 52 18% 119 149 -20% 805 745 8%
Río Grande 35 35 3% 0 0 - 0 0 - 36 35 4% 75 62 20% 566 754 -25%
Salta 316 179 76% 16 14 16% 12 2 632% 344 194 77% 244 262 -7% 3,463 2,149 61%

Page 34 of 40
San Fernando 3 6 -52% 2 2 0% 0 0 - 5 9 -38% 0 0 - 10,157 8,953 13%
San Juan 17 52 -68% 0 5 -100% 0 0 -100% 17 57 -71% 0 0 - 176 709 -75%
San Luis 20 23 -12% 0 0 - 0 0 - 20 23 -12% 27 21 31% 303 423 -28%
San Rafael 12 12 0% 0 0 - 0 0 - 12 12 0% 383 0 - 1,039 1,147 -9%
Santa Rosa 13 12 4% 0 0 - 0 0 25% 13 12 4% 1 0 - 557 793 -30%
Santiago del Estero 39 24 67% 0 0 - 0 0 -100% 39 24 67% 37 53 -30% 776 674 15%
Tucumán 218 204 7% 11 24 -54% 4 8 -51% 233 235 -1% 606 514 18% 2,324 2,609 -11%
Viedma 10 7 37% 0 0 - 0 0 - 10 7 37% 0 0 - 165 192 -14%
Villa Mercedes 0 0 -63% 0 0 - 0 0 -33% 0 0 -62% 0 0 - 456 344 33%
Termas de Río Hondo 5 9 -51% 0 0 -100% 0 0 - 5 9 -51% 3 4 -28% 129 233 -45%
Bahía Blanca 93 111 -16% 0 0 - 5 6 -11% 99 117 -16% 88 102 -14% 1,318 1,657 -20%
Neuquén 291 235 24% 8 10 -17% 3 7 -51% 302 251 20% 190 309 -38% 3,459 3,834 -10%
Total Argentina 6,583 5,391 22% 3,003 3,179 -6% 329 257 28% 9,914 8,826 12% 54,786 56,650 -3% 106,037 105,912 0%
Italy
Pisa 374 380 -2% 1,178 1,212 -3% 1 1 112% 1,553 1,593 -3% 3,361 2,917 15% 12,226 12,379 -1%
Florence 100 104 -4% 706 662 7% 0 0 -24% 806 766 5% 67 112 -40% 10,218 9,666 6%
Total Italy 474 484 -2% 1,884 1,874 0% 1 1 104% 2,359 2,359 0% 3,428 3,029 13% 22,444 22,045 2%
Brazil
Brasilia 2,150 2,424 -11% 125 109 14% 1,527 1,702 -10% 3,801 4,235 -10% 20,743 11,826 75% 33,874 42,182 -20%
Natal 465 496 -6% 18 18 2% 0 0 - 483 514 -6% 3,112 3,872 -20% 3,750 4,224 -11%
Total Brazil 2,615 2,920 -10% 143 127 12% 1,527 1,702 -10% 4,285 4,749 -10% 23,855 15,698 52% 37,624 46,406 -19%
Uruguay
Carrasco 0 0 -21% 482 489 -1% 2 3 -48% 483 492 -2% 6,848 6,795 1% 5,571 6,146 -9%
Punta del Este 0 0 22% 16 18 -13% 0 0 - 16 18 -13% 0 0 - 943 976 -3%
Total Uruguay 0 0 -16% 497 507 -2% 2 3 -48% 499 510 -2% 6,848 6,795 1% 6,514 7,122 -9%

Page 35 of 40
Ecuador
Guayaquil 451 462 -2% 521 484 8% 18 17 7% 991 963 3% 8,541 9,198 -7% 18,800 18,523 1%
Galápagos 135 139 -3% 0 0 - 0 0 - 135 139 -3% 1,297 1,290 0% 1,504 1,528 -2%
Total Ecuador 586 601 -3% 521 484 8% 18 17 7% 1,125 1,103 2% 9,837 10,488 -6% 20,304 20,051 1%
Armenia
Zvartnots 0 0 - 706 637 11% 0 0 - 706 637 11% 4,736 4,325 9% 5,837 5,764 1%
Shirak 0 0 - 36 44 -19% 0 0 - 36 44 -19% 0 0 - 212 272 -22%
Total Armenia 0 0 - 742 681 9% 0 0 - 742 681 9% 4,736 4,325 9% 6,049 6,036 0%
Perú
Arequipa 503 470 7% 5 0 n.m. 0 0 - 507 471 8% 526 554 -5% 4,160 4,017 4%
Juliaca 109 115 -5% 0 0 n.m. 0 0 - 109 115 -5% 212 242 -13% 1,006 1,068 -6%
Puerto Maldonado 80 84 -5% 0 0 n.m. 0 0 - 80 84 -5% 162 181 -11% 770 841 -8%
Tacna 118 109 9% 0 0 n.m. 0 0 - 118 109 9% 224 201 11% 1,108 1,159 -4%
Ayacucho 64 63 1% 0 0 n.m. 0 0 - 64 63 1% 48 16 200% 845 890 -5%
Total Perú 873 840 4% 5 0 n.m. 0 0 - 878 841 4% 1,171 1,194 -2% 7,889 7,975 -1%
Total CAAP 11,131 10,236 9% 6,794 6,853 -1% 1,876 1,980 -5% 19,802 19,069 4% 104,660 98,179 7% 206,861 215,547 -4%
1) Starting May 3, 2018, 50% of international air traffic in Aeroparque Airport, other than flight to and from Uruguay, was reassigned to Ezeiza Airport, and the remaining 50% will be reassigned on April 1st,
2019.
2) El Palomar commenced operations in February 2018

Page 36 of 40
Income Statement (in US$ thousands)
2Q19 2Q18 %Var. 1H19 1H18 %Var.
Continuing operations
Revenue 412,563 397,052 3.9% 798,806 787,936 1.4%
Cost of services (303,070) (263,543) 15.0% (569,365) (504,645) 12.8%
Gross profit 109,493 133,509 -18.0% 229,441 283,291 -19.0%
Selling, general and administrative expenses (37,150) (43,511) -14.6% (77,695) (87,544) -11.3%
Other operating income 4,326 4,565 -5.2% 9,146 9,643 -5.2%
Other operating expense (143) (485) -70.5% (943) (1,716) -45.0%
Operating income 76,526 94,078 -18.7% 159,949 203,674 -21.5%
Share of (loss) / income in associates (371) 127 -392.1% (831) 257 -423.3%
Income before financial results and income tax 76,155 94,205 -19.2% 159,118 203,931 -22.0%
Financial income 11,764 49,632 -76.3% 29,019 63,519 -54.3%
Financial loss (12,271) (198,868) -93.8% (80,211) (284,656) -71.8%
Inflation adjustment (7,175) - - (16,365) - -
Income / (Loss) before income tax expense 68,473 (55,031) -224.4% 91,561 (17,206) -632.1%
Income tax expense (13,122) 20,109 -165.3% (6,292) 8,591 -173.2%
Income / (Loss) for the period 55,351 (34,922) -258.5% 85,269 (8,615) -1089.8%
Attributable to:
Owners of the parent 49,123 (22,674) -316.6% 84,175 3,821 2103.0%
Non-controlling interest 6,228 (12,248) -150.8% 1,094 (12,436) -108.8%

Page 37 of 40
Balance Sheet (in US$ thousands) Jun 30, 2019 Dec 31, 2018 Jun 30, 2019
ASSETS
Non-current assets
Intangible assets, net 3,110,291 2,933,542 2,463,317
Property, plant and equipment, net 77,340 74,299 72,966
Right-of-use asset 10,213 - -
Investments in associates 13,425 10,886 14,856
Other financial assets at fair value through profit or loss
3,352 3,372 -
Other financial assets at amortized cost 2,418 2,339 -
Deferred tax assets 154,326 153,486 135,116
Other receivables 144,614 133,193 136,472
Trade receivables 1,288 1,419 4,135
Total Non-current assets 3,517,267 3,312,536 2,826,862
Current assets
Inventories 7,588 9,769 8,686
Other financial assets at fair value through profit or loss
31,376 38,007 27,146
Other financial assets at amortized cost 10,176 42,972 2,691
Other receivables 92,410 66,531 62,520
Current tax assets 320 13,701 11,915
Trade receivables 134,440 116,897 107,850
Cash and cash equivalents 221,464 244,865 220,130
Total Current assets 497,774 532,742 440,938
Total assets 4,015,041 3,845,278 3,267,800
EQUITY
Share capital 160,022 160,022 160,022
Share premium 180,486 180,486 180,486
Free distributable reserve 385,055 385,055 385,055
Non-distributable reserve 1,351,883 1,351,883 1,351,883
Currency translation adjustment -341,668 -378,803 -337,760
Legal reserves 176 176 176
Other reserves -1,324,993 -1,324,731 -1,351,962
Retained earnings 478,331 394,156 144,037
Total attributable to owners of the parent 889,292 768,244 531,937
Non-controlling interests 460,380 454,453 278,409
Total equity 1,349,672 1,222,697 810,346
LIABILITIES
Non-current liabilities
Borrowings 986,661 1,027,751 1,065,689
Deferred tax liabilities 242,283 271,175 141,954
Other liabilities 924,981 871,596 909,151
Lease liabilities 9,416 -
Trade payables 1,167 1,508 3,145
Total Non-current liabilities 2,164,508 2,172,030 2,119,939

Page 38 of 40
Jun 30, 2019 Dec 31, 2018 Jun 30, 2019
Current liabilities
Borrowings 149,567 98,907 95,846
Derivative financial instruments 405 - -
Other liabilities 213,048 225,448 136,611
Lease liabilities 1,642 - -
Current tax liabilities 8,532 11,555 6,413
Trade payables 127,667 114,641 98,645
Total Current liabilities 500,861 450,551 337,515
Total liabilities 2,665,369 2,622,581 2,457,454

Page 39 of 40
Statement of Cash Flow (in US$ thousands)
Jun 30, 2019 Jun 30, 2018
Cash flows from operating activities
Income / (Loss) for the period 85,269 (8,615)
Adjustments for:
Amortization and depreciation 95,259 68,112
Deferred income tax (39,248) (27,123)
Income tax accrued 45,540 18,532
Share of income / (loss) in associates 831 (257)
Loss on disposals of property, plant and equipment - 173
Unpaid concession fees 30,116 28,637
Low value, short term and variable lease payments (1,278) -
Changes in liability for Brazil concessions 46,868 50,364
Interest expense 46,210 46,134
Other financial results, net (20,942) (6,368)
Net foreign exchange (20,862) 131,132
Leases financial cost 292 -
Other accruals 1,146 1,512
Inflation adjustment 24,921 -
Acquisition of Intangible assets (167,829) (115,022)
Income tax paid (29,418) (30,720)
Changes in working capital (99,956) (79,552)
Net cash (used in) / provided by operating activities (3,081) 76,939
Cash flows from investing activities
Cash contribution in associates (3,179) (1,689)
Acquisition of other financial assets (4,321) (10,390)
Disposals of other financial assets 42,229 24,313
Purchase of Property, plant and equipment (8,817) (4,952)
Acquisition of Intangible assets (411) (178)
Loans with related parties 3,672 221
Advance payments of Property, plant and equipment (766) -
"Piana di Castello" land advance - (4,504)
Other 650 (88)
Net cash provided by investing activities 29,057 2,733
Cash flows from financing activities
Proceeds from cash contributions - 43,703
Additional acquisitions in subsidiaries - (40,731)
Proceeds from borrowings 36,612 196,790
Initial Public Offering - 195,601
Initial Public Offering expenses paid - (4,253)
Release of guarantee deposits - 92,913
Leases payments (2,772) -
Loans paid (32,631) (477,766)
Interest paid (40,475) (43,134)

Page 40 of 40
Jun 30, 2019 Jun 30, 2018
Dividends paid (7,992) (15,403)
Net cash (used in) / provided by financing activities (47,258) (52,280)
(Decrease) / Increase in cash and cash equivalents (21,282) 27,392
Movements in cash and cash equivalents
At the beginning of the period 244,865 221,601
Exchange rate (loss) / income and inflation adjustment on cash and cash equivalents (2,119) (28,863)
Increase in cash and cash equivalents -21,282 27,392
At the end of the period 221,464 220,130