Embed Size (px)
Citation preview
Cornwall Local Plan
Local Aggregate Assessment
for 2013
prepared by Cornwall Council
in December 2014
2
Contents
1 Executive Summary ................................................................. 5
2 Introduction ............................................................................ 7
3 Geology of Cornwall ................................................................. 7
4 Primary Aggregates ................................................................. 9
4.1 Crushed Rock...................................................................... 11
4.1.1 Primary Crushed Rock Sub-Regional Apportionment ........... 12
4.1.2 Exports and Imports ...................................................... 14
4.1.3 Future Supply/Landbank ................................................. 14
4.2 High Specification Aggregates (HSA) ...................................... 15
4.2.1 Sales of High Specification Aggregates ............................. 16
4.2.2 Exports and Imports of High Specification Aggregates ........ 17
4.2.3 Future Supply of High Specification Aggregates ................. 17
4.3 Sand and Gravel ................................................................. 18
4.3.1 Sales ............................................................................ 18
4.3.2 Imports and Exports ...................................................... 19
4.3.3 Primary Sand and Gravel Sub-Regional Apportionment ....... 19
4.3.4 Future Supply/Landbank ................................................. 20
4.4 China Clay By-Products and Other Mineral By-Products ............ 20
4.4.1 Sales ............................................................................ 20
4.4.2 Imports and Exports ...................................................... 21
4.4.3 Alternative Materials Regional Apportionment .................... 21
4.4.4 Future Supply/Landbank ................................................. 21
4.5 Recycled Aggregates ............................................................ 23
5 Regional Context.................................................................... 24
6 National Planning Policy and Guidance for Aggregates .......... 25
6.1 National Planning Policy Framework ....................................... 25
3
6.2 Planning Practice Guidance ................................................... 26
7 History of Local Planning Policy in Cornwall for Aggregates .. 27
7.1 Cornwall Minerals Local Plan ................................................. 27
7.2 Cornwall Minerals Development Framework ............................ 27
7.3 Emerging Cornwall Local Plan ............................................... 28
7.4 Minerals Safeguarding DPD ................................................... 28
8 Future Issues for Aggregates Planning policy ........................ 29
8.1 New Sites ........................................................................... 29
8.2 Provision of Particular Grades of Material ................................ 29
8.3 Secondary Aggregate Opportunities from China Clay By-Products 29
8.4 Aggregates Levy Exemptions ................................................ 29
8.5 Mothballed and Dormant Sites .............................................. 30
8.6 Transportation .................................................................... 30
8.7 Future Construction Rates .................................................... 30
Appendix 1: Minutes from South West Aggregates Working Party concerning sub-regional apportionment of aggregate provision . 31
Appendix 2: Letter from SWAWP to DCLG dated 28 September 2010 ............................................................................................ 32
Appendix 3: Extract from ‘Devon Minerals Plan: Review of Cross-boundary Minerals Issues – Scoping Report’ ............................... 35
4
Table 1.1 Primary aggregate landbanks in Cornwall .............................. 5
Table 4.1 Active primary crushed rock quarries in Cornwall .................. 11
Table 4.2 Primary crushed rock landbank .......................................... 15
Table 4.3 High specification aggregate sites in Cornwall (lower PSV sites
shaded) ......................................................................................... 16
Table 4.4 Landbank of sites which include high specification aggregates (57+ PSV) ..................................................................................... 18
Table 4.5 Active Primary Sand and Gravel Quarries in Cornwall ............ 18
Table 4.6 Sites processing recycled aggregates .................................. 23
Table 5.1 LAA and apportionment (using 2010 technical advice) by south west mineral planning authority area ................................................ 24
Table 5.2 Secondary aggregate production in the south west ............... 25
Figure 1.1 Overview of aggregate production in Cornwall against the annualised sub-regional apportionment (sub-regional apportionment
based on 2010 technical advice) ......................................................... 5
Figure 3.1 Cornwall Mineral Resources Map, BGS 1997 .......................... 8
Figure 4.1 Geology of Cornwall and Permitted Aggregate Quarries ........ 10
Figure 4.2 Crushed rock production 2004–2013 and Cornwall’s apportionment since 2005 ............................................................... 13
Figure 4.3 Cornwall's annualised crushed rock apportionment and average annual production 2004–2013 .......................................................... 14
Figure 4.4 High specification aggregate production (57+ PSV Sites) 2004–2013 ............................................................................................. 17
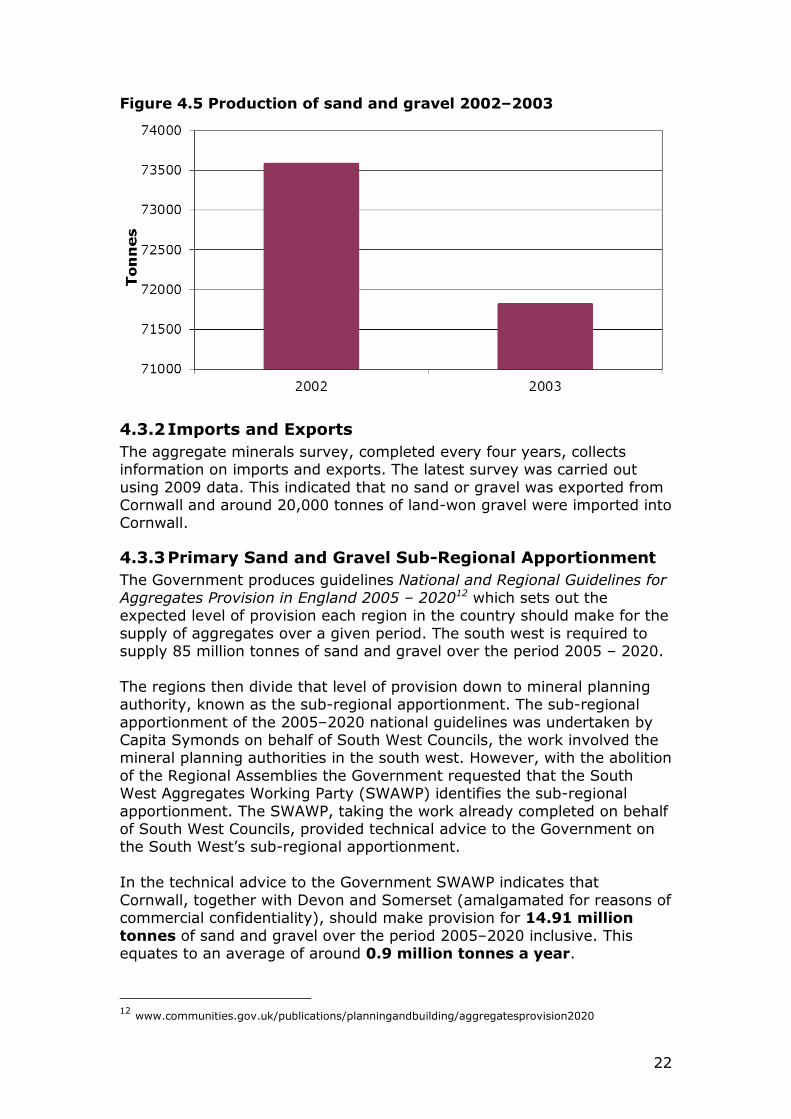
Figure 4.5 Production of sand and gravel 2002–2003 .......................... 19
Figure 4.6 Secondary aggregate production 2004–2013 ...................... 21
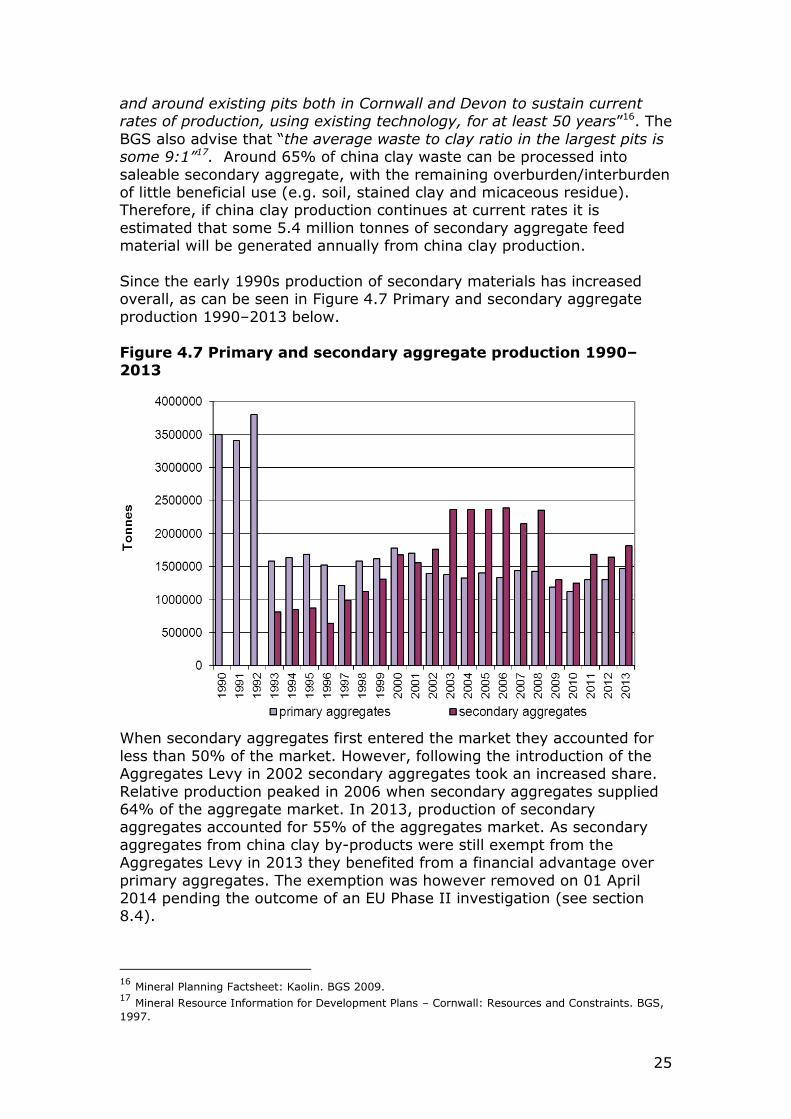
Figure 4.7 Primary and secondary aggregate production 1990–2013 ..... 22

5
1 Executive Summary The National Planning Framework (2012) requires Mineral Planning Authorities to prepare a Local Aggregate Assessment providing
information on primary, secondary and recycled aggregate sales.
An overview of the primary production levels and resultant aggregate landbanks are set out below at Figure 1.1 and Error! Reference source
not found..
Figure 1.1 Overview of aggregate production in Cornwall against the annualised sub-regional apportionment (sub-regional
apportionment based on 2010 technical advice)
Table 1.1 Primary aggregate landbanks in Cornwall
Primary crushed rock landbank
Production level (tonnes) Reserve
(tonnes)
Landbank
(years)
10 year past production average 1,330,224
148,096,011
111.3
3 year past production average 1,361,497 108.8
2013 production 1,476,028 100.3
Primary crushed rock landbank – just sites which include high specification aggregates (57+
PSV)*
Production level (tonnes) Reserves
(tonnes)
Landbank
(years)
10 year past production data 634,340
65,722,069
103.6
3 year past production data 745,030 88.21
2013 production data 868,344 75.7

6
*NB This includes production of all aggregate at the site and not just material
sold as high PSV material.
Despite the crushed rock ten year average production being lower than the sub-regional annualised apportionment, Cornwall has sufficient
permitted reserves in active quarries to meet its sub-regional apportionment (sub-regional apportionment based on the 2010 technical
advice – see Appendices 1 and 2). Whilst sites which include high specification aggregate (using a 57+ psv
threshold) have been identified, it is not clear what proportion of the aggregate produced from these quarries is high specification aggregate.
Production of sand and gravel in Cornwall stopped in 2009. Furthermore, any future Cornish sand and gravel production is to be reported
collectively in Devon County Council’s Local Aggregate Assessment along with Somerset’s production for reasons of commercial confidentiality.
In 2013 production of secondary aggregates accounted for 55% of the aggregates market. By far the largest source of secondary aggregate in
Cornwall is from china clay by-products (98%), the remainder being slate waste. Sales of secondary aggregates during 2013 totalled approximately
1.81 million tonnes. There is in excess of 230 million tonnes of secondary aggregates feed material embodied in china clay waste tips in Cornwall. If china clay production continues at current rates it is estimated that some
5.4 million tonnes of secondary aggregate feed material will be generated annually from china clay production.
It has been estimated, that in 2008, the re-use of construction, demolition
and excavation waste amounted to 696,310 tonnes.

7
2 Introduction The National Planning Policy Framework (NPPF)1 published in March 2012 requires Mineral Planning Authorities to ensure a steady and adequate
supply of aggregates and to prepare a Local Aggregate Assessment (LAA). National Minerals Planning Practice Guidance2 was subsequently published
in March 2014 setting out further details on how LAAs should be prepared. The LAA should contain information on sales of aggregates – both primary
and those from secondary and recycled materials – based on a 10-year rolling average of sales data, relevant local information and an
assessment of supply options. Information should also be considered on sales of aggregates over the last three years, which will enable trends to
be identified to help establish whether it might be appropriate to increase supply.
LAAs for Cornwall are prepared by Cornwall Council, the Mineral Planning Authority for the area. The first LAA was completed in March 2013 for the
year 2011. The second LAA was completed in May 2014 for the year 2012. This is the third LAA for the year 2013. LAAs will continue to be prepared on an annual basis in the future.
The 2013 primary and secondary aggregate sales data set out in this
report reflect the returns to the Annual Minerals Raised Inquiry – which is issued to the operators by Cornwall Council each year – and subsequent updates from the industry.
This LAA has been the subject of consultation with the members of the
South West Aggregates Working Party (SWAWP), with consultation with representatives of the industry running from 22 September to 31 October 2014. SWAWP approved the document on 28 November 2014 with minor
amendments.
3 Geology of Cornwall Cornwall has a complex and diverse geology which has been exploited for hundreds of years for different materials. Igneous rock and sandstone are worked for primary aggregate in Cornwall. China clay by-products and
other mineral by-products are used as secondary aggregates.
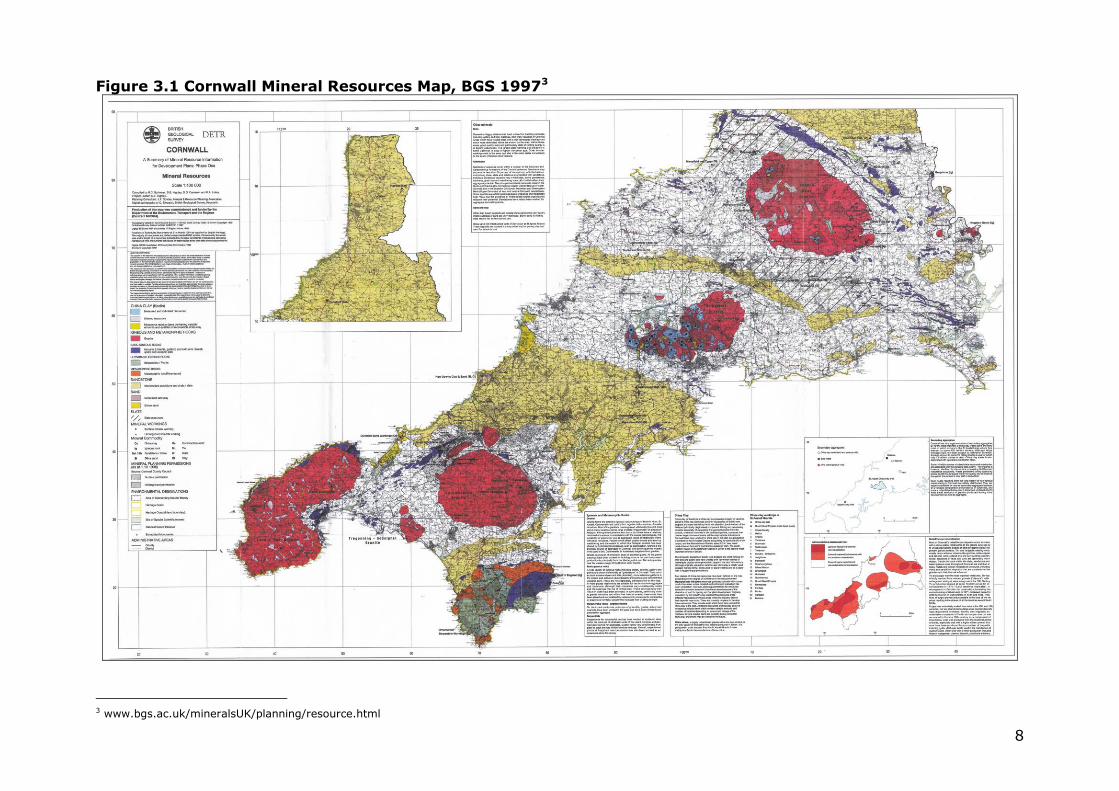
Figure 3.1 Cornwall Mineral Resources Map, BGS 1997 shows the extent of igneous and sandstone resources in Cornwall, as well as other mineral resources.
1 www.gov.uk/government/uploads/system/uploads/attachment_data/file/6077/2116950.pdf
2 http://planningguidance.planningportal.gov.uk/blog/guidance/minerals
8
Figure 3.1 Cornwall Mineral Resources Map, BGS 19973
3 www.bgs.ac.uk/mineralsUK/planning/resource.html

Granites are the most extensive igneous rocks in Cornwall and occur as four large intrusions together with a number of smaller bodies. Granite
accounts for the major proportion of the crushed rock output.
A variety of basic igneous rock occurs in Cornwall; basalt, dolerite, gabbro and picrite. They occur within the Devonian and Lower Carboniferous slate and sandstone sequences as variably sized bodies of extrusive (volcanic)
material or intrusive (dolerite) sills and dykes. They tend to form positive features in the landscape, being harder than the host rock. Considerable
variation in lithology exists – the coarsely crystalline gabbros of the Lizard contrast with microcrystalline lavas of east Cornwall. They may be relatively unaltered or show extreme alteration.
Many sedimentary rock formations in Cornwall contain sandstone and in
some cases sandstone is thickly bedded. Elsewhere it is interbedded with slate, shale or siltstone in variable proportions. Thick beds are found in the Late Carboniferous Bude Formation (north Cornwall) and parts of the
Devonian Staddon Grit. Interbedded sandstones are found in the late Carboniferous Crackington Formation (north Cornwall) and the late
Devonian Portscatho Formation. Most of the sandstones are technically ‘greywackes’ (finely-grained or medium-grained sandstones with a matrix
of clay and silt). Individual sandstones vary in thickness, lateral persistence, grain size and strength (depending upon the degree of metamorphism and state of weathering).
Cornwall has very limited resources of natural sand and gravel from
naturally occurring primary deposits. Small outcrops of Tertiary and Quaternary sediments (on the Lizard and around St Agnes Head) have been worked in the past. Beach and dune sands have also been worked in
the past, mainly as an alkaline soil conditioner. This material is not suitable for use as building sand.
4 Primary Aggregates In Cornwall primary aggregates are extracted from granite, sandstone and basic igneous rocks. There are limited resources of primary sand and
gravel in Cornwall. The permitted aggregate quarries are shown in Figure 4.1 Geology of Cornwall and Permitted Aggregate Quarries.

Figure 4.1 Geology of Cornwall and Permitted Aggregate Quarries
4.1 Crushed Rock Crushed rock aggregates are derived from granite, igneous rock or sandstone resources.
The types of granite worked for aggregate vary considerably in their texture and appearance, but most are coarse-grained biotite or
biotite/muscovite granites, with some prominent large potassium feldspar crystals. Fine-grained granites are less common. According to technical
data there is considerable variation in the strength of rocks from one site to another, where resistance to polishing is relatively low. This suggests that the strength and polished stone value are independent of granite
variety and texture, and instead, reflect local variations in weathering and secondary alteration.
The technical properties of the basic igneous rocks also vary and therefore so do their suitability for use as aggregate.
Variations in the sandstones have a bearing on the physical properties and
therefore the aggregate potential of sandstone. Despite apparently extensive resources, relatively little sandstone is produced in Cornwall. This perhaps reflects the high cost of working and competition from
igneous rock. Some high specification sandstones occur in the late Carboniferous Culm Measures of north Cornwall, which have shown
considerable resistance to polishing and wear. In both the Bude Formation and Crackington Formation the presence of interbedded shales reduces
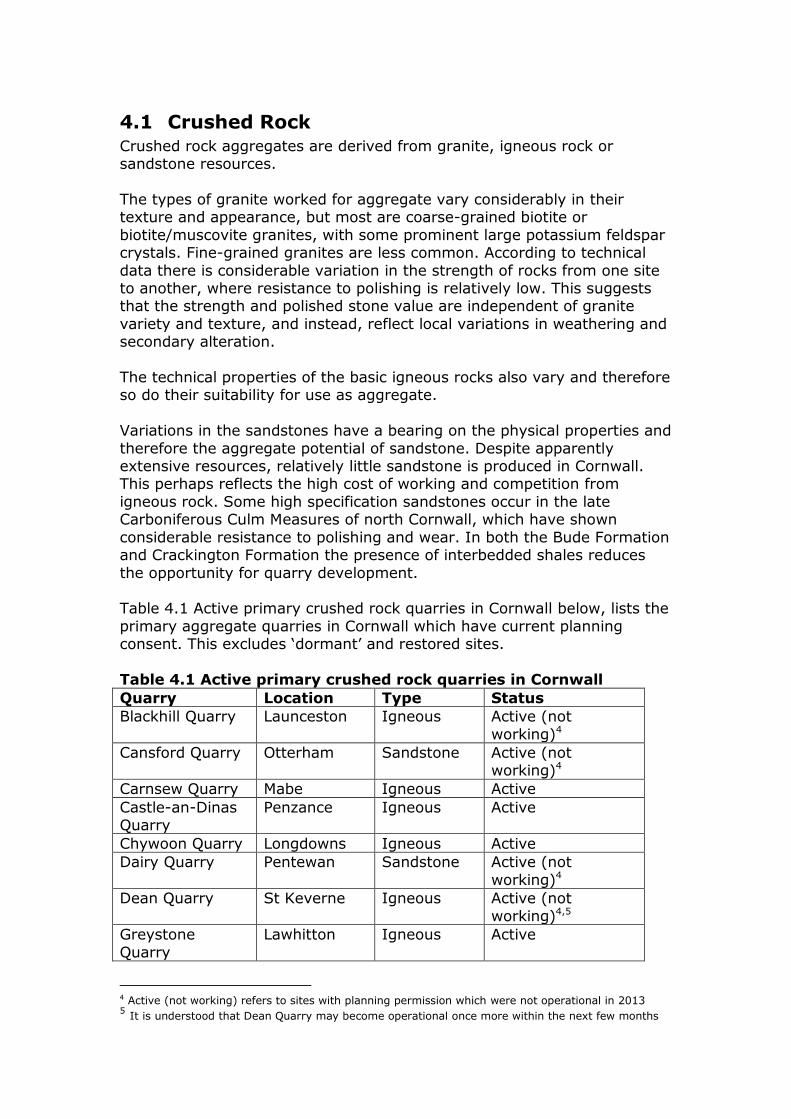
the opportunity for quarry development. Table 4.1 Active primary crushed rock quarries in Cornwall below, lists the
primary aggregate quarries in Cornwall which have current planning consent. This excludes ‘dormant’ and restored sites.
Table 4.1 Active primary crushed rock quarries in Cornwall
Quarry Location Type Status
Blackhill Quarry Launceston Igneous Active (not
working)4
Cansford Quarry Otterham Sandstone Active (not working)4
Carnsew Quarry Mabe Igneous Active
Castle-an-Dinas Quarry
Penzance Igneous Active
Chywoon Quarry Longdowns Igneous Active
Dairy Quarry Pentewan Sandstone Active (not
working)4
Dean Quarry St Keverne Igneous Active (not
working)4,5
Greystone
Quarry
Lawhitton Igneous Active
4 Active (not working) refers to sites with planning permission which were not operational in 2013 5 It is understood that Dean Quarry may become operational once more within the next few months

12
Quarry Location Type Status
Hingston Down Quarry
Gunnislake Igneous Active
Kessel Downs Quarry
Mabe Igneous Active (not working)4
Luxulyan Quarry Luxulyan Igneous Active (not working)4
Penlee Quarry Newlyn Igneous Active (not working)4
Pigsdon Quarry Launcells Sandstone Active
Pilsamoor Quarry Egloskerry Sandstone Active
Tredinnick Quarry
Grampound Sandstone Active (not working)4
Trevassack Helston Metamorphic Active (not working)4,6
West of England Quarry
Porthoustock Igneous Active
4.1.1 Primary Crushed Rock Sub-Regional Apportionment
The Government has produced guidelines ‘National and Regional
Guidelines for Aggregates Provision in England 2005–2020’ 7 which sets out the expected level of provision each region in the country should make for the supply of aggregates. The south west is required to supply
412 million tonnes of crushed rock over the period 2005–2020; this is known as the aggregates apportionment.
The regions then divide that level of provision down to mineral planning
authority level – a process known as the sub-regional apportionment. The sub-regional apportionment of the 2005–2020 national guidelines was undertaken by Capita Symonds on behalf of South West Councils,
involving the mineral planning authorities. However, with the abolition of the Regional Assemblies the Government requested that the South West
Aggregates Working Party (SWAWP) identifies the sub-regional apportionment. The SWAWP, taking the work already completed on behalf of South West Councils, provided technical advice to the Government on
the South West’s sub-regional apportionment.
In the technical advice to the Government the SWAWP indicates that Cornwall should plan for 26.9 million tonnes of crushed rock over the period 2005–2020 inclusive (see
6 Planning permission was relinquished upon implementation of planning permission
(APP/D0840/A/12/2170731) for eco-lodges in 2013 – a material start was recorded as of 19 June 2013 7 www.communities.gov.uk/publications/planningandbuilding/aggregatesprovision2020

13
Appendix 1: Minutes from South West Aggregates Working Party concerning sub-regional apportionment of aggregate provision and
Appendix 2: Letter from SWAWP to DCLG dated 28 September 2010). This equates to an average of around 1.7 million tonnes a year.
A requirement of the National Planning Policy Framework is that information is collected on the production of aggregates over a ten-year
period. The data collected by Cornwall Council reflects the returns to the Annual Minerals Raised Inquiry which is issued to the operators each year.
Figure 4.2 Crushed rock production 2004–2013 and Cornwall’s apportionment since 2005 shows aggregate production based on sales data, alongside Cornwall’s sub-regional apportionment (2005–2020).
Figure 4.2 Crushed rock production 2004–2013 and Cornwall’s
apportionment since 2005
It can be seen that production during the last 10 years was around the
same level until 2009 when there was a decrease in production for a couple of years. Production is below the advised apportionment.
Taking the 10-year period 2004–2013, average annual production of primary crushed rock aggregate was 1.3 million tonnes. The 2014
Minerals Planning Practice Guidance advises that Mineral Planning Authorities should also consider average sales over three years so as to
enable demand trends to be identified for the purpose of determining whether it might be appropriate to increase supply. The average annual production over the last three years (2011, 2012 and 2013) was
1.3 million tonnes.
14
Figure 4.3 Cornwall's annualised crushed rock apportionment and average annual production 2004–2013 shows a comparison of the level of crushed
rock apportionment advised by the SWAWP and the average annual production in Cornwall from 2004–2013.

15
Figure 4.3 Cornwall's annualised crushed rock apportionment and average annual production 2004–2013
It can be seen that average production is lower than Cornwall’s sub-regional annualised apportionment. However, as set out in section 4.1.3 below, Cornwall has sufficient permitted reserves in active quarries to
meet its sub-regional apportionment.
4.1.2 Exports and Imports
Every four years a national survey of aggregate minerals8 is undertaken, which in addition to sales and reserves information collects data on exports and imports. The last such survey was undertaken using 2009
data. This indicated that just under 320,000 tonnes of primary aggregate were exported from Cornwall. The 2009 survey also indicated that
approximately 57,000 tonnes of crushed rock were imported into Cornwall. It is anticipated that the next survey will take place in 2015.
4.1.3 Future Supply/Landbank
The aggregate landbank is the tonnage of permitted reserves with extant planning permission, including sites not currently working. However, the
landbank excludes those sites with ‘dormant’ or ‘inactive’ planning
8 www.communities.gov.uk/planningandbuilding/planningbuilding/planningresearch/research
reports/mineralswasteresearch/aggregatemineralssurveys/

16
permission9. The total permitted reserves of primary crushed rock aggregate from ‘active’ quarries in Cornwall amounts to over 148 million
tonnes.
Cornwall can therefore easily meet the sub-regional apportionment, of 26.9 million tonnes up to 2020. However, the Cornwall Local Plan covers a longer time period, up to 2030, and it is important to also consider
provision of primary crushed rock aggregate until that time.
In Cornwall, the primary crushed rock aggregates landbank is between 100 and 111 years depending upon the average annual production used to calculate the landbank. This greatly exceeds the
national policy requirement of a for crushed rock landbank of at least 10 years to be maintained. Table 4.2 Primary crushed rock landbank shows
how the range of landbanks has been calculated. Table 4.2 Primary crushed rock landbank
Production level (tonnes) Reserve (tonnes) Landbank (years)
10 year past production average
1,330,224
148,096,011
111.3
3 year past production
average
1,361,497
108.8
2013
production
1,476,028
100.3
Cornwall Council does not hold data on the productive capacity of
individual workings but there are no known issues in this regard.
4.2 High Specification Aggregates (HSA) High specification aggregates (HSAs) are noted (in a report by Capita Symonds ‘The sustainable use of high specification aggregates for skid
resistant road surfacing in England’10) as being relatively rare and highly specialised with limited geological distribution. HSAs are resistant to polishing and abrasion and are therefore important in road construction.
The study by Capita Symonds set out the thresholds used to define HSAs
as having the following qualities: Polished stone value (PSV) of more than 58; Aggregate abrasion value of less than 16;
Los Angeles coefficient of less than 30; and Magnesium sulphate value of more than 25.
The study went on to categorise quarries throughout England and identify those that are considered to be producing HSAs:
Category 1: 58+ PSV active and able to supply
9 As defined under the Planning and Compensation Act 1991 and the Environment Act 1995 10 www.sustainableaggregates.com/library/docs/samp/l0057_samp_1_039

17
Category 2: 58+ PSV inactive/dormant some potential for future supply
Category 3: 58+ PSV low potential for future supply Category 4/5: 55-57 PSV some potential for future supply
Category 6: 55-57 PSV potential suppliers but not to England It was identified in the study that in Cornwall only two sites were
identified as being in category 1 (Blackhill Quarry and Lean Quarry) – both of which have now closed. Since the study, Pigsdon Quarry has become
operational and new information supplied by the operators indicates that the site would fall into category 1. Table 4.3 High specification aggregate sites in Cornwall shows the permitted sites in Cornwall alongside their PSV
value, planning status and category.
Table 4.3 High specification aggregate sites in Cornwall (lower PSV sites shaded)
Site PSV Planning Status Category
Pigsdon Quarry 68 Active 1
Tredinnick Quarry (Grampound)
63 Active (not working)4 3
Greystone Quarry 57 Active 4
Castle-an-Dinas Quarry 57 Active 4
Carnsew Quarry 57 Active 6
De Lank Quarry 54 Active (only operating as
a building stone quarry)
7
Dean Quarry 54 Active (not working)4 7
Hingston Down Quarry 53 Active 7
Penlee Quarry 44 Active (not working)4 7
4.2.1 Sales of High Specification Aggregates
It is not possible to publish sales data for just those sites with a PSV of 58 or higher since there are only two such sites and the information is
commercially sensitive. A threshold of 57 or higher has therefore been used.
Between 2004–2013 production from sites with a PSV of 57 or higher amounted to 6,343,398 tonnes, however, it is unclear from the
data collected the proportion of high specification aggregate relative to other products.

18
Figure 4.4 High specification aggregate production (57+ PSV Sites) shows production from sites with a PSV of 57 or higher over the last decade.

19
Figure 4.4 High specification aggregate production (57+ PSV Sites) 2004–2013
4.2.2 Exports and Imports of High Specification Aggregates
From the data collected, it is not possible to report exports or imports of high specification aggregates in isolation from primary crushed rock
aggregates. However, this information would be useful and consideration will be given as to whether this information could be obtained in the future.
4.2.3 Future Supply of High Specification Aggregates
The Capita Symonds study into the sustainable use of high specification
aggregates went on to assess reserves for high specification aggregates but in doing so only considered those reserves with a PSV of 58 or higher.
In Cornwall it is not possible to report the equivalent reserves, as there are only two sites in Cornwall where PSV is at least 58.
However, it is possible to report that total reserves of sites with a PSV of 57 or higher identified in Table 4.3 High specification aggregate sites in
Cornwall above amount to around 65 million tonnes. The quality of that reserve may however vary as it is often interbedded with other lower grade materials.
The Capita Symonds study recommended that mineral planning
authorities identify a separate landbank for high specification aggregates. The National Planning Policy Framework also states the need to “calculate and maintain separate landbanks for any aggregate materials of a specific
type or quality which have a distinct and separate market”.
The landbank for high specification aggregates sites (57 or higher PSV) ranges between 75 years and 103 years. Table 4.4 Landbank of
sites which include high specification aggregates (57+ PSV) shows how

20
this landbank range has been calculated. However, this does not take into account the proportion of that production which is high specification
aggregates or indeed the quality of the resource. Therefore it is not possible, at present, to identify with any confidence a landbank of high
specification aggregates. Table 4.4 Landbank of sites which include high specification
aggregates (57+ PSV)
Production levels (tonnes)* Reserves
(tonnes)
Landbank
(years)
10 year past
production data 634,340
65,722,069
103.6
3 year past
production data 745,030 88.21
2013 production
data 868,344 75.7
*This includes production of all aggregate at the site and not just material sold as
high PSV material.
In addition, it is understood that Cansford Quarry (re-opened in 2011) has the potential to supply high specification aggregates, including for road
surface dressing.
Cornwall Council does not hold data on the productive capacity of individual workings but there are no known issues in this regard.
4.3 Sand and Gravel Cornwall has limited resources of primary sand and gravel. Table 4.5
Active Primary Sand and Gravel Quarries in Cornwall lists the active sand and gravel quarries in Cornwall.
Table 4.5 Active Primary Sand and Gravel Quarries in Cornwall
Quarry Type Status
Trewint Marsh Sand Active (not working)11
4.3.1 Sales
Production of sand and gravel in Cornwall stopped in 2009 however, it is only possible to report sales from 2002 and 2003 as after that time fewer
than three operators produced sand and gravel. Sales are shown in
11 Trewint Marsh has been restored but still has an active planning permission.

21
Figure 4.5 Production of sand and gravel 2002–2003.
22
Figure 4.5 Production of sand and gravel 2002–2003
4.3.2 Imports and Exports
The aggregate minerals survey, completed every four years, collects information on imports and exports. The latest survey was carried out
using 2009 data. This indicated that no sand or gravel was exported from Cornwall and around 20,000 tonnes of land-won gravel were imported into Cornwall.
4.3.3 Primary Sand and Gravel Sub-Regional Apportionment
The Government produces guidelines National and Regional Guidelines for
Aggregates Provision in England 2005 – 202012 which sets out the expected level of provision each region in the country should make for the
supply of aggregates over a given period. The south west is required to supply 85 million tonnes of sand and gravel over the period 2005 – 2020.
The regions then divide that level of provision down to mineral planning authority, known as the sub-regional apportionment. The sub-regional
apportionment of the 2005–2020 national guidelines was undertaken by Capita Symonds on behalf of South West Councils, the work involved the mineral planning authorities in the south west. However, with the abolition
of the Regional Assemblies the Government requested that the South West Aggregates Working Party (SWAWP) identifies the sub-regional
apportionment. The SWAWP, taking the work already completed on behalf of South West Councils, provided technical advice to the Government on the South West’s sub-regional apportionment.
In the technical advice to the Government SWAWP indicates that
Cornwall, together with Devon and Somerset (amalgamated for reasons of commercial confidentiality), should make provision for 14.91 million
tonnes of sand and gravel over the period 2005–2020 inclusive. This equates to an average of around 0.9 million tonnes a year.
12 www.communities.gov.uk/publications/planningandbuilding/aggregatesprovision2020

23
4.3.4 Future Supply/Landbank
National policy requires a landbank of at least seven years to be maintained for sand and gravel.
It is acknowledged that there are limited resources of natural sand and gravel in Cornwall13 and it is therefore unlikely to be able to contribute to
the shared sub-regional apportionment from primary resources (see Appendix 3). Devon’s Local Aggregate Assessment is available online14 and reports on Devon’s sand and gravel production collectively with the
production figures for Somerset and Cornwall due to low production and therefore commercial confidentiality issues in Somerset and Cornwall. The
combined reporting also reflects the co-operative approach between the respective Mineral Planning Authorities for these counties, which is underpinned by the 2014 Memorandum of Understanding on “Steady and
Adequate Supply of Sand and Gravel” (initiated by Somerset County Council and also signed by Cornwall Council, Devon County Council,
Dorset County Council, Exmoor National Park Authority, Gloucestershire County Council and Wiltshire County Council) as well as discussions held as part of the Duty to Co-operate liaison.
It is also worth noting that china clay products (sand and crushed rock)
provide potential substitute materials to sand and gravel.
4.4 China Clay By-Products and Other Mineral By-
Products By far the largest source of secondary aggregate in Cornwall is from china clay by-products. This can be used for a range of purposes including block making, concreting sand and bulk fill in highway schemes in Cornwall and
is frequently regarded as an equivalent material to quarried primary aggregate. In the case of concreting sand, in many areas there is no
commercially available alternative. Other mineral extraction also produces by-products which can be used as secondary aggregate; in particular slate is sold for use as construction fill and sub-base material.
There is potential for greater exploitation of the estimated 230 million
tonnes of useable secondary aggregate resources in the St Austell China Clay Area (embedded in china clay waste tips). The introduction of the Aggregates Levy, payable on sales of primary aggregates, had resulted in
greater use of this secondary resource. The rate of Aggregates Levy on primary aggregates is £2.00 per tonne; this levy was not payable on
secondary aggregates until 01 April 2014 (see section 8.4).
4.4.1 Sales
A requirement of the National Planning Policy Framework is that information is collected on the production of aggregates over a ten-year period. The data collected by Cornwall Council reflects the returns to the
13 ‘Mineral Resource Information for Development Plans - Cornwall: Resources and Constraints’ BGS 1997 14
www.devon.gov.uk/laa

24
Annual Minerals Raised Inquiry which is issued to the operators each year as well as subsequent updates from the industry.
Sales of secondary aggregates during 2013 totalled approximately
1.81 million tonnes compared with a peak of 2.39 million tonnes in 2006. In 2013 nearly all (over 98%) of the secondary aggregate material sold was china clay waste, the remainder being slate waste. Figure 4.6
Secondary aggregate production 2004–2013 shows the production of secondary aggregate from china clay by-products and other mineral by-
products since 2004. Figure 4.6 Secondary aggregate production 2004–2013
4.4.2 Imports and Exports
The aggregate minerals survey, completed every four years, collects information on imports and exports. The latest survey was carried out in
2009 although this data has not been published.
4.4.3 Alternative Materials Regional Apportionment
The Government produces guidelines National and Regional Guidelines for Aggregates Provision in England 2005–202015 which sets out the expected level of provision each region in the country should make for the supply of
aggregates over a given period. The South West is expected to supply 142 million tonnes of alternative materials over the period 2005–2020.
This equates to an average of around 8.9 million tonnes per year.
4.4.4 Future Supply/Landbank
There is in excess of 230 million tonnes of secondary aggregates feed material embodied in china clay waste tips in Cornwall. Whilst it is not possible to provide a verified total of china clay reserves for commercial
reasons, the BGS advise that “sufficient proved reserves of kaolin exist in
15
www.communities.gov.uk/publications/planningandbuilding/aggregatesprovision2020
25
and around existing pits both in Cornwall and Devon to sustain current rates of production, using existing technology, for at least 50 years”16. The
BGS also advise that “the average waste to clay ratio in the largest pits is some 9:1”17. Around 65% of china clay waste can be processed into
saleable secondary aggregate, with the remaining overburden/interburden of little beneficial use (e.g. soil, stained clay and micaceous residue). Therefore, if china clay production continues at current rates it is
estimated that some 5.4 million tonnes of secondary aggregate feed material will be generated annually from china clay production.
Since the early 1990s production of secondary materials has increased overall, as can be seen in Figure 4.7 Primary and secondary aggregate
production 1990–2013 below.
Figure 4.7 Primary and secondary aggregate production 1990–2013
When secondary aggregates first entered the market they accounted for
less than 50% of the market. However, following the introduction of the Aggregates Levy in 2002 secondary aggregates took an increased share.
Relative production peaked in 2006 when secondary aggregates supplied 64% of the aggregate market. In 2013, production of secondary aggregates accounted for 55% of the aggregates market. As secondary
aggregates from china clay by-products were still exempt from the Aggregates Levy in 2013 they benefited from a financial advantage over
primary aggregates. The exemption was however removed on 01 April 2014 pending the outcome of an EU Phase II investigation (see section 8.4).
16 Mineral Planning Factsheet: Kaolin. BGS 2009. 17 Mineral Resource Information for Development Plans – Cornwall: Resources and Constraints. BGS,
1997.

26
Secondary aggregates are also due to be derived from the incinerator bottom ash that will be generated from the Cornwall Energy Recovery
Centre. Cornwall Council will seek to monitor the extent of production once the facility is operational.
4.5 Recycled Aggregates Recycled aggregates are derived from construction, demolition and
excavation waste which has been re-processed. There is limited data available on the level of recycled aggregates produced in Cornwall and
even the location of that production, as it often takes place on site during any demolition or construction work.
Some primary aggregate quarries in Cornwall have planning permission to process construction, demolition and excavation waste as well as
infrastructure to produce recycled aggregates from that waste. Those sites which have planning permission to process recycled aggregates are set out below in Table 4.6 Sites processing recycled aggregates.
Table 4.6 Sites processing recycled aggregates
Site Company Location/Grid Reference
Blackhill Quarry R S & R Aggregates Ltd SY 055832
Carnsew Quarry Colas SW 761 346
Castle Gate M Leah SW 485 339
De Lank Quarry Ennstone Johnston Ltd SX 101 755
Dean Quarry Cemex Ltd SW 802 205
Dinscott Farm Bude Skip Hire SS 234 108
Domellick Manor DRS Demolition SW 943 586
Forth Kegyn Keith Ozzard Skip Hire Ltd SW 665 406
Greystone Quarry Aggregate Industries SX 363 805
Hayle Recycling Yard CIB Lello Plant Hire SW 554 379
Herniss Farm L Winn and Sons Ltd SW 735 335
Lean Quarry Viridor Ltd SX 267 613
Parc an Chy T H Douce and Sons SW 720 432
Roodscroft Roods Environmental Services Ltd SW 983 572
St Eval Recycling St Eval Recycling Co SW 867 692
Stoneybridge Peake (GB) Ltd SX 265 653
Woodlands Transfer Station
Julian and Son SW 905 572
It has been estimated, in a Technical Paper on Future Waste Arisings (as
part of the evidence for waste planning policy in Cornwall) that re-use of construction, demolition and excavation waste amounted to 696,310
tonnes in 200818. As Cornwall has a large secondary aggregate resource from china clay by-
products, the contribution that recycled aggregates can make is likely to be limited.
18 www.cornwall.gov.uk/default.aspx?page=32791

27
5 Regional Context According to the 2009 Aggregates Minerals Survey, the South West (20.8mt) was the second largest source of land-won primary aggregates. Nevertheless, all mineral planning authorities are reporting levels of production below the sub-regional apportionment (based on the 2010 technical advice, as show in Table 5.1, with the economic downturn expected to be a factor. Table 5.1 LAA and apportionment (using 2010 technical advice) by
south west mineral planning authority area
MPA Year LAA
Crushed Rock
(mt)
Annualised
Apportionment Crushed Rock
(mt)
LAA
Sand &
Gravel (mt)
Annualised
Apportionment Sand & Gravel
(mt)
Cornwall 2013 1.3 1.68 0 (with Devon)
Devon 2013 2.23 3.2 0.54 0.93
Dorset 2013 0.22 0.3 1.65 1.97
Gloucestershire 2013 1.56 2.25 0.83 1
Somerset 2013 10.45 13.42 0 (with Devon)
West of
England
2013 3.57 4.94 0 0
Wiltshire 2012 (with
Dorset)
(with Dorset) 1.2 1.4
The 2009 Aggregate Minerals Survey identifies that exports of crushed rock from Cornwall are mainly to other counties in the south west. It is
understood that imports and exports of aggregates to/from Cornwall are likely to be principally exchanged with the nearest counties due to transportation costs (i.e. Devon and to a lesser extent Somerset and
Dorset).
In 2014, Somerset initiated a Memorandum of Understanding on the “Steady and Adequate Supply of Sand and Gravel” which was also signed by Cornwall Council, Devon County Council, Dorset County Council,
Exmoor National Park Authority, Gloucestershire County Council and Wiltshire County Council to underpin the co-operative approach within the
region which is also reflected by Devon County Council’s combined reporting in its LAA to include Cornwall and Somerset’s sand and gravel production (see section 4.3.4).
Cornwall is the main source of secondary aggregate in the south west.
28
Table 5.2 shows Cornwall’s secondary aggregate production in the regional context using the figures available.

29
Table 5.2 Secondary aggregate production in the south west
MPA Year 10 Year Average Secondary Aggregate (mt)
Cornwall 2013 1.9
Devon 2013 0.49
Dorset 2013 n/s
Gloucestershire 2013 (not currently produced)
Somerset 2013 0.05*
West of England 2013 n/s
Wiltshire 2012 (currently no significant
producers/sources) * calculated from data in the LAA report
Due to difficulties capturing robust data, the SWAWP recognises that there is not a complete picture of the supply of recycled aggregate production
across the region19.
6 National Planning Policy and Guidance for
Aggregates
6.1 National Planning Policy Framework In March 2012 the Government published the National Planning Policy
Framework (NPPF), which replaced existing national planning policy. This includes a section on minerals and makes specific reference to the
sustainable use of important minerals and also to defining Mineral Safeguarding Areas for minerals of national and local importance. Certain Mineral Policy Statements and Mineral Planning Guidance notes were
replaced by the NPPF and are no longer extant.
The NPPF is supportive of aggregates extraction, especially recognising their contribution to sustainable economic growth and providing materials for infrastructure and buildings. It also states that the contribution of
substitute, secondary and recycled materials should be taken into account.
The NPPF requires local planning authorities to include policies for local and nationally important mineral resources and to safeguard those
resources and infrastructure necessary for aggregate production. Mineral Planning Authorities should plan for a steady and adequate supply of
aggregates and use the published national and sub-national guidelines on future provision as a guideline for the future demand and supply of aggregates. Provision should be made for a landbank of at least 10 years
for crushed rock and at least seven years for sand and gravel.
19 www.gov.uk/government/uploads/system/uploads/attachment_data/file/294902/140320_SOUTH_WEST_ANNUAL_REPORT_2012.pdf
30
The NPPF is accompanied by a technical guidance document which
provides guidance on the implementation of policies contained in the NPPF. This mainly relates to amenity issues, dust, noise, stability and
restoration. Guidance has also been produced on the Managed Aggregate Supply System and sets out the detail expected in the Local Aggregate Assessment, as previously discussed in section 1 above.
In addition, the Localism Act20 received Royal Assent in November 2011.
The aims of the new legislation include decentralising and strengthening local democracy, empowering communities and the introduction of neighbourhood planning.
6.2 Planning Practice Guidance The Minerals Planning Practice Guidance published in March 2014 provides further guidance on the preparation of Local Aggregate Assessments. This
includes guidance on the contents of a Local Aggregate Assessment:
A Local Aggregate Assessment should contain three elements:
a forecast of the demand for aggregates based on both the rolling
average of 10-years sales data and other relevant local information;
an analysis of all aggregate supply options, as indicated by landbanks,
mineral plan allocations and capacity data e.g. marine licences for
marine aggregate extraction, recycled aggregates and the potential
throughputs from wharves. This analysis should be informed by
planning information, the aggregate industry and other bodies such as
local enterprise partnerships; and
an assessment of the balance between demand and supply, and the
economic and environmental opportunities and constraints that might
influence the situation. It should conclude if there is a shortage or a
surplus of supply and, if the former, how this is being addressed. There is also guidance on other issues including supply sources, information sources and determining the amount of aggregate to plan for.
The guidance also details the managed aggregate supply system. It
advises that the managed aggregate supply system seeks to ensure a steady and adequate supply of aggregate mineral, to handle the significant geographical imbalances in the occurrence of suitable natural
aggregate resources, and the areas where they are most needed. The managed aggregate supply system requires mineral planning authorities
which have adequate resources of aggregates to make an appropriate contribution to national as well as local supply, while making due allowance for the need to control any environmental damage to an
acceptable level. It also ensures that areas with smaller amounts of aggregate make some contribution towards meeting local and national
need where that can be done sustainably.
20 www.communities.gov.uk/localgovernment/decentralisation/localismbill/

31
7 History of Local Planning Policy in Cornwall
for Aggregates
7.1 Cornwall Minerals Local Plan The Cornwall Minerals Local Plan (CMLP) adopted in 1997 contains planning policies for the development of aggregate quarries and related
development. The primary aim of the CMLP is to ensure the stable and long term production of the Cornish mining and quarrying industry. Chapter 9 is dedicated to aggregates and sets out a policy relating to
landbanks for permitted aggregate reserves. The saved policies which are not due to be replaced by the Local Plan – Strategic Policies document are
as follows:
E3 – Landscape S1 – Mineral Consultation Areas CC3 – Areas of Special Environmental Concern
CC5 – Protection of Settlements CC6 – Safeguarding of Existing Routes
CC7 – Railway Routes These policies will be reviewed as part of the production of the emerging
Minerals Safeguarding DPD (see section 7.4).
7.2 Cornwall Minerals Development Framework Since the reform of the planning system (as required by the Planning and Compulsory Purchase Act 2004), work has been undertaken to replace the
Cornwall Minerals Local Plan. Initially, Cornwall County Council was working towards the production of a Cornwall Minerals Development
Framework. To progress this work consultations / stakeholder participation has been
undertaken to date on the following publications:
Cornwall Minerals Development Framework: Report on Issues and Options October 2004;
Cornwall Minerals Development Framework: Report on
Preferred Options November/December 2006; and Cornwall Minerals Development Framework: Core Strategy
Revised Report on Preferred Options May 2008. However, since the amalgamation of the former county, district and
borough councils to form the unitary Cornwall Council in April 2009 minerals policy is now to be included in the Cornwall Local Plan – see
Section 7.3 below.
The Minerals Development Framework will no longer be
progressed; strategic mineral policies are included in the Cornwall
Local Plan – Strategic Policies

32
7.3 Emerging Cornwall Local Plan As mentioned above, minerals planning policy is now being prepared for inclusion in the Cornwall Local Plan, although it is anticipated that a
specific Minerals DPD will be prepared following adoption of the Local Plan. The proposed submission Local Plan – Strategic Policies March 2014 sets
out the Council’s proposed strategic mineral policies. It has been amended through Focused Changes dated September 201421.
Proposed Policy 18 aims to maintain a sufficient supply of indigenous minerals to achieve sustainable and economic growth, whilst encouraging
the use of recycled and secondary materials – particularly secondary aggregates from china clay production. Proposed Policy 18 also supports
primary aggregate development for particular grades of material not provided for by other permitted reserves and secondary aggregate extraction in the St Austell (Hensbarrow) China Clay Area – where
sensitively scaled to its landscape designations. Proposed Policy 19 seeks the identification of safeguarding areas for primary and secondary
aggregate resources and reserves, as well as for key mineral infrastructure through a Minerals Safeguarding DPD.
As set out in section 7.1, a number of policies in the 1997 Minerals Local Plan will continue to form part of the development plan when the Local
Plan – Strategic Policies document is adopted, although they will then be reviewed as part of the emerging Minerals Safeguarding DPD (see section
7.4 below).
7.4 Minerals Safeguarding DPD Consultation on a scoping document for a Minerals Safeguarding DPD has taken place between 08 November and 20 December 2013. The scoping
document focuses on minerals safeguarding with the following aspects set out:
Safeguarding sites for china clay;
Safeguarding sites for primary aggregates including high specification aggregates;
Safeguarding sites for secondary aggregates; Safeguarding sites for infrastructure and bulk transport; and Safeguarding development management criteria.
The anticipated timeframe for the DPD is as follows:
Consult on Preferred Options – Spring 2015 Pre-submission consultation – Autumn 2015 Submission to Secretary of State – Spring 2016
Adoption – Autumn 2016
The work on the Minerals Safeguarding DPD will include a review of those saved policies of the 1997 Minerals Local Plan which will not be replaced by the Local Plan – Strategic Policies (see section 7.1).
21 www.cornwall.gov.uk/default.aspx?page=22887
33
Once completed and adopted, the Minerals Safeguarding DPD will sit alongside the Cornwall Local Plan: Strategic Policies and other DPDs.
8 Future Issues for Aggregates Planning
policy
8.1 New Sites There are sufficient permitted reserves of primary aggregate in Cornwall to meet estimated needs for ‘mainstream’ crushed rock over the plan
period. Consequently it would appear that there is no need to identify new sites for crushed rock aggregate.
8.2 Provision of Particular Grades of Material There is a need to consider the provision of high specification aggregates over the plan period. Although it would appear that there are sufficient permitted resources the quality of those resources is unclear.
8.3 Secondary Aggregate Opportunities from China Clay By-Products
There are vast reserves of secondary aggregate within existing tips in the
St Austell China Clay area. In addition this resource is being added to as clay production proceeds. There is the potential to increase secondary
aggregate production to serve markets outside of Cornwall. Even with an increase in production for export there are likely to be sufficient reserves to meet needs until the end of the Plan period. Consideration should be
given to the promotion of increased use (and export) of china clay by-products as a substitute for primary aggregate through the Local Plan.
Sites relating to the bulk transport of secondary aggregates should be safeguarded.
8.4 Aggregates Levy Exemptions Secondary aggregates from china clay by-products have been exempt
from the Aggregates Levy up until 01 April 2014 so they had a financial advantage over primary aggregates.
Following the opening of a state aid investigation by the European Commission in relation to particular exemptions, exclusions and tax reliefs
from the aggregates levy, HMRC made certain secondary aggregates taxable from 01 April 2014 pending the outcome of the investigation. This affects:
– coal, lignite, slate or shale, or the spoil from the separation of these materials from other rock;
– clay; – certain industrial minerals, namely: anhydrite; ball clay; barites;
china clay; feldspar; fireclay; fluorspar; fuller's earth; gems and
semi-precious stones; gypsum; any metal or the ore of any metal; muscovite; perlite; potash; pumice; rock phosphates; sodium
chloride; talc and vermiculite;

34
– the spoil, waste or other by-products from the extraction or separation of the industrial minerals set out in the previous bullet
from other rock; and – the spoil, waste or by-products from industrial combustion or the
smelting or refining of metal. It is understood that HMRC are seeking to defend the exemptions. The
impact of this suspension will need to be monitored.
8.5 Mothballed and Dormant Sites The considerable level of permitted reserves of primary and secondary
aggregate (particularly those from china clay by-products) has resulted in a situation where potential supply from permitted reserves vastly exceeds
existing and likely future demand. Consequently many quarries work sporadically, are mothballed or are defined as dormant. Consideration should be given to the future of quarries which lie unworked or dormant.
Whilst the mothballed (active but not working) sites will be able to be re-started as long as their Review of Minerals Permissions is up to date, a
dormant site will require a new planning permission in order for work to recommence.
8.6 Transportation Cornwall Council does not hold sufficient data to report quantitatively on the modes of transportation used for importing or exporting aggregate. It is understood however that the majority of aggregate is transported by
road, with some transported by rail. Sea ports and harbours are also used, primarily for secondary aggregate. Where possible, data on the
transportation modes used for importing and exporting aggregate will be monitored in the future.
8.7 Future Construction Rates The emerging Cornwall Local Plan – Strategic Policies21 includes a housing target of 47,500 homes, which equates to 2,400 homes per year on
average. This is broadly comparable with past rates of house building. Across the whole of England, the Government predicts that the number of households will grow by 232,000 per year to 203322.
The emerging Cornwall Local Plan – Strategic Policies also includes a
target of 422,400sqm of employment space provision to 2030. This equates to approximately 21,120sqm per year on average. This rate of development is understood to be slightly lower than past rates (22,500
sqm per year 1998–2008)23.
22 DCLG (2010) Household Projections, 2008 to 2033, England. 23 www.cornwall.gov.uk/employmentreview

35
Appendix 1: Minutes from South West
Aggregates Working Party concerning sub-
regional apportionment of aggregate
provision
South West Regional Aggregates Working Party (SWRAWP) 6th August 2010
5. Sub Regional Apportionment of the National and Regional Guidelines for Aggregates Provision in England 2005-2020
A PowerPoint presentation was given on the work of South West Councils on Sub-Regional Apportionment (SRA). The presentation was followed by discussion on the way in which SRA could be carried forward in the South
West following the abolition of the Regional Assembly and consideration of a discussion paper that had been prepared by the Secretary and which
posed questions about the various ways in which SRA might be done in the South West. He reported that at a recent Secretaries’ meeting Communities and Local Government (CLG) had requested RAWPs to
complete SRA work where necessary and to find a solution to undertaking any necessary SA/SEA work in support of SRA; this request had in part
resulted in the letter from SWRAWP to CLG. The Chairman asked if members were happy for SWRAWP to provide
technical advice to CLG and there were no objections.
South West Regional Aggregates Working Party (SWRAWP) 14th March 2011 8. Sub Regional Apportionment of the National and Regional Guidelines for
Aggregates Provision in England 2005-2020 The Secretary reported that, despite reminders, there had been no reply
from CLG to the SWRAWP letter of September 2010 and that it was questionable as to what weight might be attached to the figures produced by SWRAWP. The Secretary agreed to write again to CLG asking for a
reply.

36
Appendix 2: Letter from SWAWP to DCLG
dated 28 September 2010
SOUTH WEST REGIONAL AGGREGATES
WORKING PARTY (SWRAWP)
Chairman: Paula Hewitt, Head of Environmental Management and Regeneration,
Environment Department, Somerset County Council, County Hall, Taunton,
Somerset TA1 4DY.
Email [email protected]
Secretary: Philip M Hale, Abbey Farm, Eastermead Lane, Banwell, North
Somerset BS29 6PD.
Tel/Fax: 01934 820451. Email [email protected]
Date: 28 September 2010 Our Ref: SWRAWP/SRA Your Ref:
Mark Plummer Team Leader, Minerals & Waste Planning, Resource & Environment Division
Department for Communities and Local Government Zone 1/J1
Eland House Bressenden Place London SW1E 5DU
Dear Mark
Sub Regional Apportionment (SRA) of the Aggregates Guidelines 2005 – 2020 for the South West
At the South West Regional Aggregates Working Party (AWP) meeting on
the 6th August, which following the abolition of the Regional Assembly (South West Councils) in the South West, the AWP considered South West Council’s proposed approach to SRA and the request from CLG that in the
absence of the regional assembly the AWP should complete the SRA exercise for the South West. At the meeting AWP members resolved to
use a SRA method based on the ‘old’ Mineral Planning Authorities’ 2004-2008 proportional share of crushed rock and sand and gravel production and to submit this to CLG as technical advice.
Members were given the opportunity to reflect on the approach and feed
back any views on this intended approach before the AWP formally replied to CLG.

I am able to report that no dissenting views have been received from AWP members and accordingly set out in Table 1 below the proposed technical
advice from the AWP in relation to the SRA for the South West. This is submitted to the department only as technical advice from the AWP for
CLG to use as appropriate. Please note that no formal consultation with Mineral Planning Authorities has been undertaken and we would therefore request CLG to consider consulting them on any proposed SRA
Table 1 Technical advice in relation to Sub Regional Apportionment of the Aggregates Guidelines for 2005 – 2020 (as agreed by SWRAWP 6th August 2010)
MPA CRUSHED ROCK
(million tonnes)
LAND WON SAND AND
GRAVEL (million tonnes)
Avon (i) 79.1 0
Cornwall (ii) 26.94 Included in Devon
Devon (iii) 51.21 14.91 **
Dorset (iv) 4.82 * 31.56
Gloucestershire 36.01 16.07
Somerset (v) 214.65 Included in Devon
Wiltshire (vi) Included in Dorset 22.46
TOTALS 412 85 Figures do not sum due to rounding
(i) Bristol; Bath and North East Somerset; North Somerset; South Gloucestershire
(ii) Includes Isles of Scilly
(iii) Includes Plymouth;Torbay;Dartmoor National Park (iv) Includes Bournemouth; Poole
(v) Includes Exmoor National Park (vi) Includes Swindon
* Includes Wiltshire ** Includes Cornwall and Somerset
The AWP did not have the resources to undertake any SEA work and therefore we would ask CLG to consider how and by whom the SRA is to
be formally taken forward under SEA legislation. The AWP Chair and I would be happy to discuss this with you. Also, as stated above, we would ask CLG to consider whether any further formal consultation with MPAs is
desirable prior to testing at the local level through the Local Development Framework process.
A major difficulty with translating the technical advice into an 'agreed' apportionment is that sustainability appraisal incorporating strategic
environmental assessment has specific legal requirements for consultation and reporting. Notwithstanding your request that the AWP should take
forward the sustainability appraisal process as much as possible, if the full process is not properly completed then the resultant apportionment risks being found unlawful. Given that there are no additional funds available
from CLG to complete the sustainability appraisal and this work is not

included in the current AWP contract it is not clear how the AWP could complete this essential element of SRA. Therefore we are only able to
offer technical advice to CLG.
Members have expressed concern that if the formal process is not carried out then in turn a mineral planning authority's local development document that seeks to deliver an aggregates supply based on an
apportionment that does not comply with the SEA Regulations may itself be open to legal challenge.
We would appreciate your department’s further thoughts on the above and would be pleased to meet with you and/or your colleagues to discuss
as necessary.
Yours Sincerely
Phil Hale
Secretary SWRAWP
cc AWP members

Appendix 3: Extract from ‘Devon Minerals
Plan: Review of Cross-boundary Minerals
Issues – Scoping Report’24 June 2012
Within Greater Devon, only the Plan Area has existing or potential sand and gravel resources. Of the adjoining counties:
Cornwall has one sand and gravel quarry with very limited reserves,
and the county has little, if any, potential for delivering new primary sand and gravel resources (but does have substantial
secondary aggregate resources from china clay waste believed to exceed 120 million tonnes);
Somerset has no operational sand and gravel quarries, but does
have resources within the Budleigh Salterton Pebble Beds adjacent to the boundary with Devon; and
Dorset has substantial bedrock sand and gravel resources in the south east of the county, with smaller areas of river terrace gravels including within the Axe valley in the western part of the county.
Greater Devon is grouped with Cornwall and Somerset for sand and gravel
sub-regional apportionment purposes. It is assumed that, in the light of its geological characteristics and the availability of substantial alternative resources in the form of its china clay waste, Cornwall will not contribute
any further primary sand and gravel.
24 www.devon.gov.uk/dcc_cross-boundary_minerals_issues_scoping_report_1.1.pdf