Embed Size (px)
Citation preview
crop science, vol. 57, march–april 2017 www.crops.org 983
RESEARCH
Long-term monocultures have contributed to increased disease pressure on crops (Andow, 1983) and have been reported to
result in reduced yields compared with the same species grown in long-term rotational systems (Dick and Van Doren, 1985; Griffith et al., 1988). However, development and use of synthetic pesticides and fertilizers have diminished the associated yield impacts (Matson et al., 1997). Due to increased commodity prices of corn (Zea mays L.) and soybean [Glycine max (L.) Merr.] over the past few years (USDA-ERS, 2016), maintenance or even expansion of their cul-tivated area has increased. Therefore, development of management practices that will increase crop yields in a cost-effective manner is of great importance to farmers and agriculture-related industries.
The yield of important crops, such as corn, soybean, and wheat (Triticum aestivum L.) cultivated in non-diverse cropping systems, cannot be sustained without substantial fertilizer use (Heichel, 1978; Pimentel et al., 1978). Nitrogen (N) is so impor-tant in corn production that the cost of over-application is less than the cost of yield loss due to under-application (Scharf et al., 2005), despite the fact that such a practice is not environmental friendly (Yadav, 1997). Nitrate (NO3
−) runoff or leaching due to N over-application results in environmental contamination,
Corn, Soybean, and Wheat Yield Response to Crop Rotation, Nitrogen Rates, and Foliar Fungicide Application
Spyridon Mourtzinis,* David Marburger, John Gaska, Thierno Diallo, Joe G. Lauer, and Shawn Conley
ABSTRACTCrop rotations involving corn (Zea mays L.) and soybean [Glycine max (L.) Merr.] are well-known production systems across the Midwestern United States, but the addition of wheat (Triticum aestivum L.) in the rotation has received less attention. Additionally, the interactive effect of crop rotation with nitrogen (N) fertilizer and foliar fungicide application on yields for these three crops is not yet well understood. Data were collected in Wisconsin from a long-term crop rotation experiment during 2013 to 2015 to measure corn (grain and silage), soybean, and wheat yield response to crop rotation frequency (seven rotations involving corn, soybean, and wheat), six levels of N, and foliar fungicide use. During the 3 yr of the experiment, minimal interactive effects were detected, which suggested that the examined management decisions can remain separate for growers in Wisconsin. Yearly crop rotation of corn and soybean increased corn grain yields in 2014 by 15 to 18% and soybean yields by 24 to 31% in 2015 compared with continuous cropping. No other crop rotation effect was observed. Fungicide use at the V5 growth stage for corn, at R3 for soybean, and at GS9 for wheat, increased wheat (7.4–16.8%) and soybean yield (3.6–5.4%) but not corn grain or silage yields. Nitrogen application was more beneficial for corn compared with wheat and soybean. The effect of N on soybean was similar across all rotations, and grain yields increased when N rate was higher than 100 kg ha−1. The data suggest that N rate recommendations should be based on crop needs, regardless the rotation system.
S. Mourtzinis, J.M. Gaska, T. Diallo, J. Lauer, S.P. Conley, Univ. of Wisconsin–Madison, 1575 Linden Dr., Madison, WI 53706; D.A. Marburger, Oklahoma State Univ.– Stillwater, 371 Agricultural Hall, Stillwater, OK 74078. Received 11 Oct. 2016. Accepted 17 Dec. 2016. *Corresponding author ([email protected]).
Abbreviations: CC, continuous corn; CS, corn followed by soybean; CSW, corn followed by soybean followed by wheat; CWS, corn followed by wheat followed by soybean; LCWS, crop rotation simulating a livestock system with corn (harvested as silage) followed by wheat (straw harvested as well) followed by soybean; SS, continuous soybean; WW, continuous wheat.
Published in Crop Sci. 57:983–992 (2017). doi: 10.2135/cropsci2016.10.0876 © Crop Science Society of America | 5585 Guilford Rd., Madison, WI 53711 USA All rights reserved.
Published March 3, 2017
984 www.crops.org crop science, vol. 57, march–april 2017
making NO3− the most common surface- and ground-
water contaminant across the Corn Belt (Council for Agricultural Science and Technology, 1999).
Additionally, farmers use multiple chemical inputs (e.g., herbicides, fungicides, and insecticides) to control pests and decrease yield loss. For example, it has been reported that wheat yield losses up to 42% could be pre-vented by using fungicides (Wegulo et al., 2009). A yield benefit due to fungicide use has also been observed in a multiyear, multilocation study in Ontario, Canada (Brink-man et al., 2014). Many factors (e.g., crop growth stage, disease severity, susceptibility of the hybrid or variety) contribute to yield loss and to the decision to apply foliar fungicide (Nelson and Meinhardt, 2011). The effectiveness of a fungicide to suppress the severity of a disease is greatly dependent on application timing (Ward et al., 1997). For example, applying a fungicide after soybean rust (caused by Phakopsora pachyrhizi Syd.) has been established can still result in significant yield loss (Miles et al., 2007). Prophy-lactic application of foliar fungicide at specific growth stages despite disease presence or absence is another option; how-ever, this can add significant production costs and suppress overall farm profitability when diseases are absent or are present at low levels (Orlowski et al., 2016). Furthermore, a recent study from Wisconsin showed that the use of mul-tiple inputs (i.e., fungicides, insecticides, seed treatments) did not consistently increase soybean yields across nine site-years in Wisconsin (Mourtzinis et al., 2016b).
As an alternative to the excessive use of synthetic chemicals and fertilizers, rotational cropping systems can enhance sustainability and increase farm income through improvement of soil structure (Raimbault and Vyn, 1991), increase of nutrients (Karlen et al., 1994) and water use efficiency (Roder et al., 1989; Copeland et al., 1993), and increase in soil organic matter (Campbell and Zentner, 1993; Van Eerd et al., 2014). Specifically, the corn–soy-bean rotation system has been extensively examined. It has been reported that corn and soybean yielded up to 16% more when grown in a rotation system than when grown continuously (Porter et al., 1997). In studies in Wisconsin and Nebraska, corn and soybean in rotation resulted in 18 and 38% greater corn yields and 13% greater soybean yields, respectively, than when grown continuously (Ped-ersen and Lauer, 2003; Peterson and Varvel, 1989a, 1989b). Similarly, a recent study reported an 8% yield increase for soybean grown in yearly rotation with corn in Wisconsin (Marburger et al., 2015a), whereas another study showed that yearly crop rotation increased yield of both corn and soybean when compared with continuous cropping by up to 20 and 22%, respectively (Mourtzinis et al., 2017).
The reported yield differences of crops in various rotational systems have been attributed mainly to reduced pressure of various biotic factors. However, when intro-ducing a legume in a crop rotation system, N requirements
of the following crop can change due to residual soil N from the preceding legume. Additionally, the frequency with which the crops are rotated could further alter the N fertilization requirements for maximum yield due to possible changes in residual soil N dynamics. Such infor-mation from using multiple crops and rotation systems and direct comparison of N effectiveness among all these factors is nonexistent in the literature.
The addition of wheat in the corn–soybean rotation system has been examined to a lesser degree. It has been reported that wheat following soybean resulted in greater yields than when the preceding crop was corn (Dill-Macky and Jones, 2000). Also, wheat in the rotation increased maize and soybean yields in a study in southern Ontario in Canada (Gaudin et al., 2015). However, inconsistent wheat yield response has also been observed when wheat was included in the corn–soybean rotation (Lund et al., 1993). Additionally, three-crop rotations did not increase corn or soybean yields compared with corn–soybean rotations in that same study. Nevertheless, wheat is an important crop that can increase farm profitability and mitigate soil erosion during winter. Therefore, maximization of a three-crop rotation can be of great importance for farmers.
Even though crop rotations containing corn, soybean, and wheat have received little attention to determine the yield impact, there is a lack of information available investigating interactions among these rotations and other management practices, such as N rates and fungicide application. Furthermore, due to the inconsistent effects of crop rotation, N rates, and fungicide use on crop yield, evaluation of combinations of such management practices is important to provide farmers with more accurate rec-ommendations. Therefore, the first objective of this study was to examine the effect of crop rotation, N rates, foliar fungicide use, and their interactions on corn, soybean, and wheat yield in Wisconsin. The second objective was to compare the effectiveness of N rates among the three crops and seven rotation systems.
MATERIALS AND METHODSField trials were conducted from 2013 through 2015 within a long-term corn–soybean–wheat rotation established in 2002 at the Arlington Agricultural Research Station in Wisconsin (43°18¢ N, 89°21¢ W). No-till practices have been used since establishment. The experimental design was a randomized complete block in a split-split plot arrangement with three replications. Main plots consisted of 14 crop rotation sequences, representing each phase of seven different crop rotations of corn, soybean, and wheat. The crop rotations included: (i) continuous corn (CC), continuous soybean (SS), continuous wheat (WW), corn followed by soybean (CS), corn followed by soybean followed by wheat (CSW), corn followed by wheat followed by soybean (CWS), and a rotation sim-ulating a livestock system with corn (harvested as silage) followed by wheat (straw harvested) followed by soybean (LCWS). Sub-plots consisted of six N rates (0, 48, 96, 144, 192, and 240 kg ha−1).
crop science, vol. 57, march–april 2017 www.crops.org 985
Almaco plot combine (Allen Machine Co.). Grain weights and moisture recorded from each crop were converted to kilograms per hectare and adjusted to moisture contents of 155 (corn), 130 (soybean), and 135 g kg−1 (wheat). Corn silage weights were adjusted to 650-g kg−1 moisture content.
Statistical AnalysisYield data were subjected to mixed model analysis of variance using PROC GLIMMIX in SAS version 9.3 (SAS Institute, 2011). Yield variances were different among the 3 yr of the study (Levene’s test, P < 0.05). Due to this and to a change in fungicide product among years, the year-specific fixed effects of crop rota-tion, N rates, fungicide use, and their interactions on corn grain and silage, soybean, and wheat yields were examined. Random effects included replication, replication ´ crop rotation, replica-tion ´ N ´ crop rotation, and the overall error term.
To examine the effectiveness of N rates among crops and among rotations within crops, analysis of covariance (ANCOVA) was performed on the combined dataset across years and crops. To extract meaningful regression results, the N variable was treated as continuous and centered by subtracting the overall treatment mean from each level. Then the full model was fitted, which included all variables and interactions. Due to differences in yield variances among years, a heterogeneous variance model for year was fitted in PROC GLIMMIX using the GROUP option. Degrees of freedom for all analyses were calculated using the Kenward–Rogers method (Littell et al., 2006). Due to the complexity of the model and the multiple nonsignificant effects, backwards elimination was followed as described by Littell et al. (2006). The final model included crop(rotation), the linear and
Sub-subplots consisted of two fungicide treatments: fungicide application versus a nontreated control. Headline (pyraclostrobin {carbamic acid, [2-({[1-(4-chlorophenyl)-1H-pyrazol-3-yl]oxy}methyl)phenyl]methoxy-, methyl ester}) was applied to all three crops the first year, whereas Priaxor (fluxapyroxad {1H-Pyrazole-4-carboxamide, 3-(difluoromethyl)-1-methyl-N-[3,4,5-trifluoro(1,1-biphenyl)-2-yl]} and pyraclostrobin {carbamic acid, [2-({[1-(4-chlorophenyl)-1H-pyrazol-3-yl]oxy}methyl)phenyl]methoxy-, methyl ester}) was applied in the second and third years. Corn was treated at the V5 growth stage (Ritchie et al., 1992), soybean at R3 (Fehr and Caviness, 1977), and wheat at GS9 (Large, 1954). Fungicide was applied to all three crops at a rate of 584 mL ha−1. The field arrangement of the subplots and sub-subplots remained the same across the 3 yr of the study.
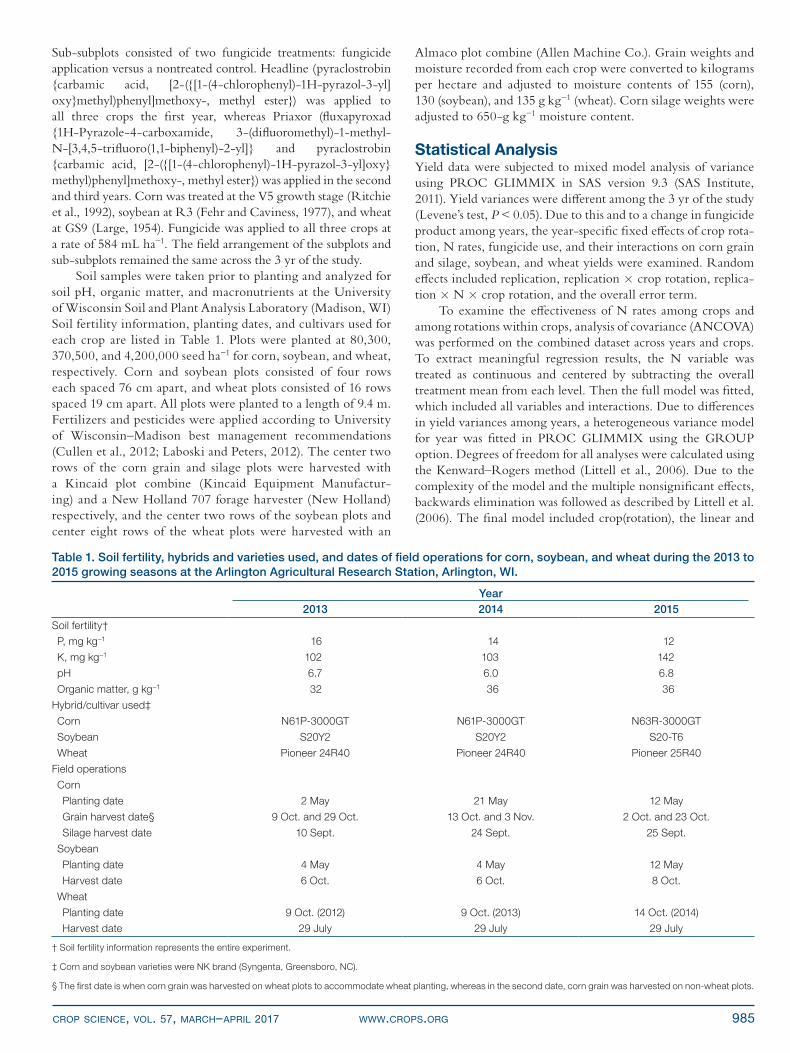
Soil samples were taken prior to planting and analyzed for soil pH, organic matter, and macronutrients at the University of Wisconsin Soil and Plant Analysis Laboratory (Madison, WI) Soil fertility information, planting dates, and cultivars used for each crop are listed in Table 1. Plots were planted at 80,300, 370,500, and 4,200,000 seed ha−1 for corn, soybean, and wheat, respectively. Corn and soybean plots consisted of four rows each spaced 76 cm apart, and wheat plots consisted of 16 rows spaced 19 cm apart. All plots were planted to a length of 9.4 m. Fertilizers and pesticides were applied according to University of Wisconsin–Madison best management recommendations (Cullen et al., 2012; Laboski and Peters, 2012). The center two rows of the corn grain and silage plots were harvested with a Kincaid plot combine (Kincaid Equipment Manufactur-ing) and a New Holland 707 forage harvester (New Holland) respectively, and the center two rows of the soybean plots and center eight rows of the wheat plots were harvested with an
Table 1. Soil fertility, hybrids and varieties used, and dates of field operations for corn, soybean, and wheat during the 2013 to 2015 growing seasons at the Arlington Agricultural Research Station, Arlington, WI.
Year2013 2014 2015
Soil fertility†
P, mg kg−1 16 14 12
K, mg kg−1 102 103 142
pH 6.7 6.0 6.8
Organic matter, g kg−1 32 36 36
Hybrid/cultivar used‡
Corn N61P-3000GT N61P-3000GT N63R-3000GT
Soybean S20Y2 S20Y2 S20-T6
Wheat Pioneer 24R40 Pioneer 24R40 Pioneer 25R40
Field operations
Corn
Planting date 2 May 21 May 12 May
Grain harvest date§ 9 Oct. and 29 Oct. 13 Oct. and 3 Nov. 2 Oct. and 23 Oct.
Silage harvest date 10 Sept. 24 Sept. 25 Sept.
Soybean
Planting date 4 May 4 May 12 May
Harvest date 6 Oct. 6 Oct. 8 Oct.
Wheat
Planting date 9 Oct. (2012) 9 Oct. (2013) 14 Oct. (2014)
Harvest date 29 July 29 July 29 July
† Soil fertility information represents the entire experiment.
‡ Corn and soybean varieties were NK brand (Syngenta, Greensboro, NC).
§ The first date is when corn grain was harvested on wheat plots to accommodate wheat planting, whereas in the second date, corn grain was harvested on non-wheat plots.
986 www.crops.org crop science, vol. 57, march–april 2017
quadratic form of N, and their interactions. The level of signifi-cance was set to 5% (a = 0.05), and the Tukey adjustment was used for pairwise means comparisons.
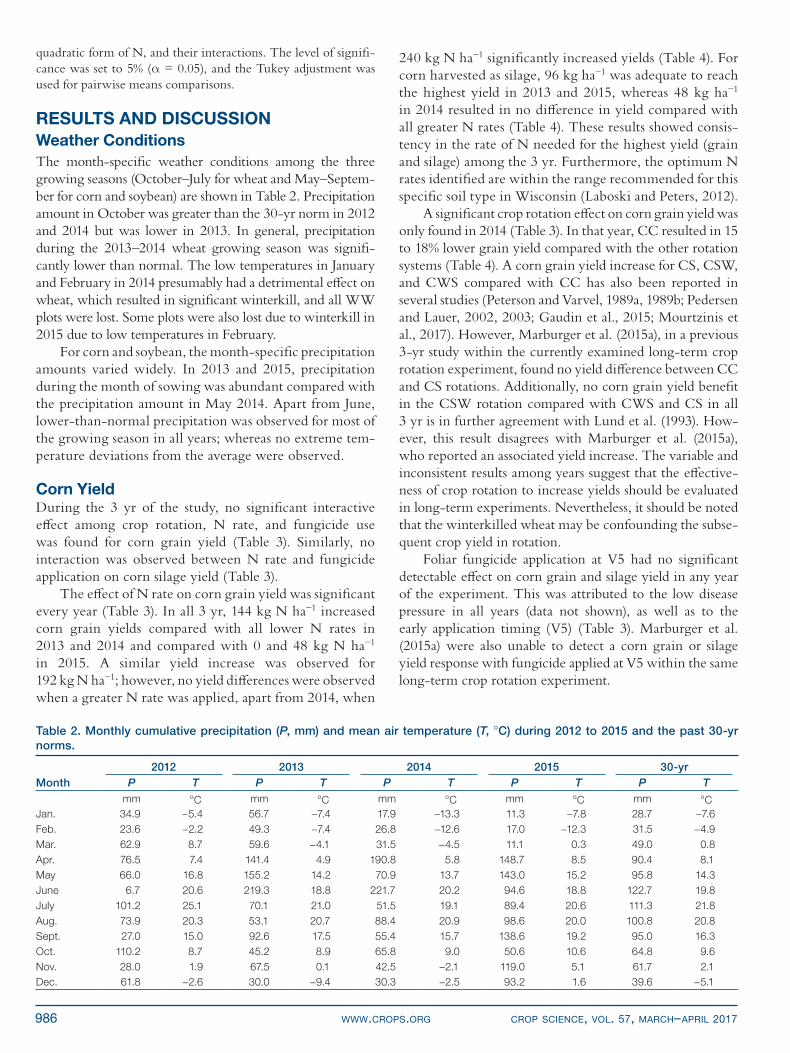
RESULTS AND DISCUSSIONWeather ConditionsThe month-specific weather conditions among the three growing seasons (October–July for wheat and May–Septem-ber for corn and soybean) are shown in Table 2. Precipitation amount in October was greater than the 30-yr norm in 2012 and 2014 but was lower in 2013. In general, precipitation during the 2013–2014 wheat growing season was signifi-cantly lower than normal. The low temperatures in January and February in 2014 presumably had a detrimental effect on wheat, which resulted in significant winterkill, and all WW plots were lost. Some plots were also lost due to winterkill in 2015 due to low temperatures in February.
For corn and soybean, the month-specific precipitation amounts varied widely. In 2013 and 2015, precipitation during the month of sowing was abundant compared with the precipitation amount in May 2014. Apart from June, lower-than-normal precipitation was observed for most of the growing season in all years; whereas no extreme tem-perature deviations from the average were observed.
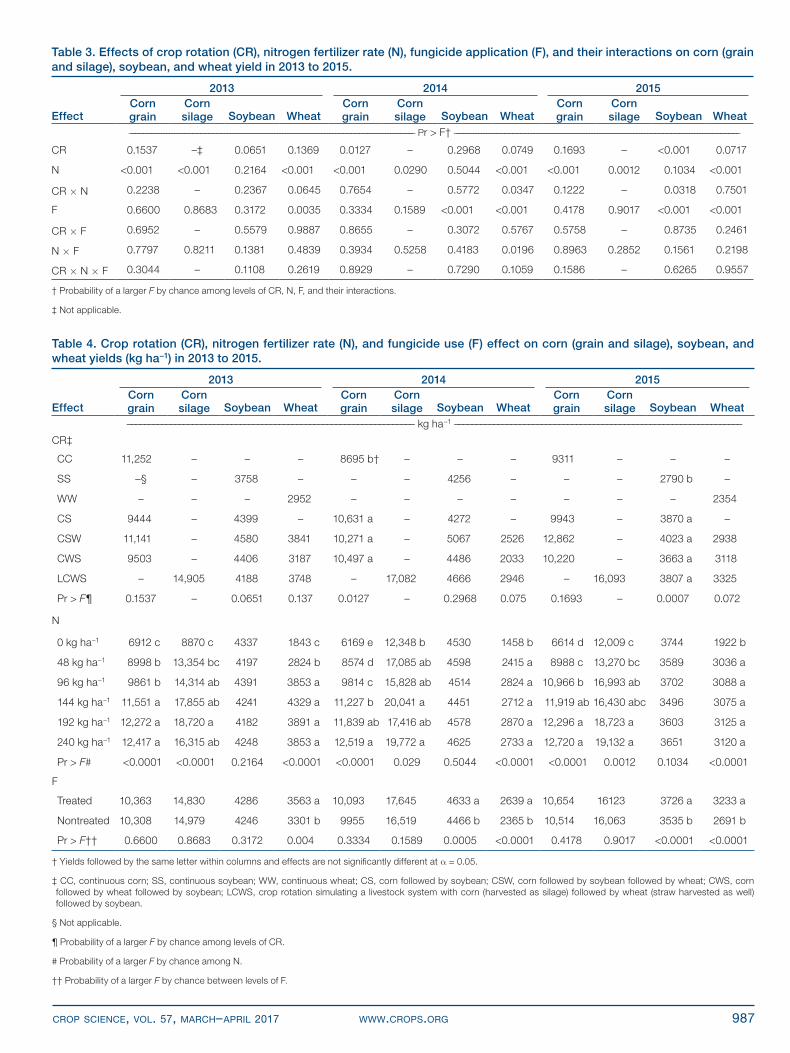
Corn YieldDuring the 3 yr of the study, no significant interactive effect among crop rotation, N rate, and fungicide use was found for corn grain yield (Table 3). Similarly, no interaction was observed between N rate and fungicide application on corn silage yield (Table 3).
The effect of N rate on corn grain yield was significant every year (Table 3). In all 3 yr, 144 kg N ha−1 increased corn grain yields compared with all lower N rates in 2013 and 2014 and compared with 0 and 48 kg N ha−1
in 2015. A similar yield increase was observed for 192 kg N ha−1; however, no yield differences were observed when a greater N rate was applied, apart from 2014, when
240 kg N ha−1 significantly increased yields (Table 4). For corn harvested as silage, 96 kg ha−1 was adequate to reach the highest yield in 2013 and 2015, whereas 48 kg ha−1 in 2014 resulted in no difference in yield compared with all greater N rates (Table 4). These results showed consis-tency in the rate of N needed for the highest yield (grain and silage) among the 3 yr. Furthermore, the optimum N rates identified are within the range recommended for this specific soil type in Wisconsin (Laboski and Peters, 2012).
A significant crop rotation effect on corn grain yield was only found in 2014 (Table 3). In that year, CC resulted in 15 to 18% lower grain yield compared with the other rotation systems (Table 4). A corn grain yield increase for CS, CSW, and CWS compared with CC has also been reported in several studies (Peterson and Varvel, 1989a, 1989b; Pedersen and Lauer, 2002, 2003; Gaudin et al., 2015; Mourtzinis et al., 2017). However, Marburger et al. (2015a), in a previous 3-yr study within the currently examined long-term crop rotation experiment, found no yield difference between CC and CS rotations. Additionally, no corn grain yield benefit in the CSW rotation compared with CWS and CS in all 3 yr is in further agreement with Lund et al. (1993). How-ever, this result disagrees with Marburger et al. (2015a), who reported an associated yield increase. The variable and inconsistent results among years suggest that the effective-ness of crop rotation to increase yields should be evaluated in long-term experiments. Nevertheless, it should be noted that the winterkilled wheat may be confounding the subse-quent crop yield in rotation.
Foliar fungicide application at V5 had no significant detectable effect on corn grain and silage yield in any year of the experiment. This was attributed to the low disease pressure in all years (data not shown), as well as to the early application timing (V5) (Table 3). Marburger et al. (2015a) were also unable to detect a corn grain or silage yield response with fungicide applied at V5 within the same long-term crop rotation experiment.
Table 2. Monthly cumulative precipitation (P, mm) and mean air temperature (T, °C) during 2012 to 2015 and the past 30-yr norms.
2012 2013 2014 2015 30-yrMonth P T P T P T P T P T
mm °C mm °C mm °C mm °C mm °CJan. 34.9 −5.4 56.7 −7.4 17.9 −13.3 11.3 −7.8 28.7 −7.6Feb. 23.6 −2.2 49.3 −7.4 26.8 −12.6 17.0 −12.3 31.5 −4.9Mar. 62.9 8.7 59.6 −4.1 31.5 −4.5 11.1 0.3 49.0 0.8Apr. 76.5 7.4 141.4 4.9 190.8 5.8 148.7 8.5 90.4 8.1May 66.0 16.8 155.2 14.2 70.9 13.7 143.0 15.2 95.8 14.3June 6.7 20.6 219.3 18.8 221.7 20.2 94.6 18.8 122.7 19.8July 101.2 25.1 70.1 21.0 51.5 19.1 89.4 20.6 111.3 21.8Aug. 73.9 20.3 53.1 20.7 88.4 20.9 98.6 20.0 100.8 20.8Sept. 27.0 15.0 92.6 17.5 55.4 15.7 138.6 19.2 95.0 16.3Oct. 110.2 8.7 45.2 8.9 65.8 9.0 50.6 10.6 64.8 9.6Nov. 28.0 1.9 67.5 0.1 42.5 −2.1 119.0 5.1 61.7 2.1Dec. 61.8 −2.6 30.0 −9.4 30.3 −2.5 93.2 1.6 39.6 −5.1
crop science, vol. 57, march–april 2017 www.crops.org 987
Table 3. Effects of crop rotation (CR), nitrogen fertilizer rate (N), fungicide application (F), and their interactions on corn (grain and silage), soybean, and wheat yield in 2013 to 2015.
2013 2014 2015
EffectCorn grain
Corn silage Soybean Wheat
Corn grain
Corn silage Soybean Wheat
Corn grain
Corn silage Soybean Wheat
–––––––––––––––––––––––––––––––––––––––––––––––––––––––––––––––––––––––––––––––––––––––––––––––––––––––––––– Pr > F† ––––––––––––––––––––––––––––––––––––––––––––––––––––––––––––––––––––––––––––––––––––––––––––––––––––––––––––
CR 0.1537 –‡ 0.0651 0.1369 0.0127 – 0.2968 0.0749 0.1693 – <0.001 0.0717
N <0.001 <0.001 0.2164 <0.001 <0.001 0.0290 0.5044 <0.001 <0.001 0.0012 0.1034 <0.001
CR ´ N 0.2238 – 0.2367 0.0645 0.7654 – 0.5772 0.0347 0.1222 – 0.0318 0.7501
F 0.6600 0.8683 0.3172 0.0035 0.3334 0.1589 <0.001 <0.001 0.4178 0.9017 <0.001 <0.001
CR ´ F 0.6952 – 0.5579 0.9887 0.8655 – 0.3072 0.5767 0.5758 – 0.8735 0.2461
N ´ F 0.7797 0.8211 0.1381 0.4839 0.3934 0.5258 0.4183 0.0196 0.8963 0.2852 0.1561 0.2198
CR ´ N ´ F 0.3044 – 0.1108 0.2619 0.8929 – 0.7290 0.1059 0.1586 – 0.6265 0.9557
† Probability of a larger F by chance among levels of CR, N, F, and their interactions.
‡ Not applicable.
Table 4. Crop rotation (CR), nitrogen fertilizer rate (N), and fungicide use (F) effect on corn (grain and silage), soybean, and wheat yields (kg ha−1) in 2013 to 2015.
2013 2014 2015
EffectCorn grain
Corn silage Soybean Wheat
Corn grain
Corn silage Soybean Wheat
Corn grain
Corn silage Soybean Wheat
–––––––––––––––––––––––––––––––––––––––––––––––––––––––––––––––––– kg ha−1 ––––––––––––––––––––––––––––––––––––––––––––––––––––––––––––––––––
CR‡
CC 11,252 – – – 8695 b† – – – 9311 – – –
SS –§ – 3758 – – – 4256 – – – 2790 b –
WW – – – 2952 – – – – – – – 2354
CS 9444 – 4399 – 10,631 a – 4272 – 9943 – 3870 a –
CSW 11,141 – 4580 3841 10,271 a – 5067 2526 12,862 – 4023 a 2938
CWS 9503 – 4406 3187 10,497 a – 4486 2033 10,220 – 3663 a 3118
LCWS – 14,905 4188 3748 – 17,082 4666 2946 – 16,093 3807 a 3325
Pr > F¶ 0.1537 – 0.0651 0.137 0.0127 – 0.2968 0.075 0.1693 – 0.0007 0.072
N
0 kg ha−1 6912 c 8870 c 4337 1843 c 6169 e 12,348 b 4530 1458 b 6614 d 12,009 c 3744 1922 b
48 kg ha−1 8998 b 13,354 bc 4197 2824 b 8574 d 17,085 ab 4598 2415 a 8988 c 13,270 bc 3589 3036 a
96 kg ha−1 9861 b 14,314 ab 4391 3853 a 9814 c 15,828 ab 4514 2824 a 10,966 b 16,993 ab 3702 3088 a
144 kg ha−1 11,551 a 17,855 ab 4241 4329 a 11,227 b 20,041 a 4451 2712 a 11,919 ab 16,430 abc 3496 3075 a
192 kg ha−1 12,272 a 18,720 a 4182 3891 a 11,839 ab 17,416 ab 4578 2870 a 12,296 a 18,723 a 3603 3125 a
240 kg ha−1 12,417 a 16,315 ab 4248 3853 a 12,519 a 19,772 a 4625 2733 a 12,720 a 19,132 a 3651 3120 a
Pr > F# <0.0001 <0.0001 0.2164 <0.0001 <0.0001 0.029 0.5044 <0.0001 <0.0001 0.0012 0.1034 <0.0001
F
Treated 10,363 14,830 4286 3563 a 10,093 17,645 4633 a 2639 a 10,654 16123 3726 a 3233 a
Nontreated 10,308 14,979 4246 3301 b 9955 16,519 4466 b 2365 b 10,514 16,063 3535 b 2691 b
Pr > F†† 0.6600 0.8683 0.3172 0.004 0.3334 0.1589 0.0005 <0.0001 0.4178 0.9017 <0.0001 <0.0001
† Yields followed by the same letter within columns and effects are not significantly different at a = 0.05.
‡ CC, continuous corn; SS, continuous soybean; WW, continuous wheat; CS, corn followed by soybean; CSW, corn followed by soybean followed by wheat; CWS, corn followed by wheat followed by soybean; LCWS, crop rotation simulating a livestock system with corn (harvested as silage) followed by wheat (straw harvested as well) followed by soybean.
§ Not applicable.
¶ Probability of a larger F by chance among levels of CR.
# Probability of a larger F by chance among N.
†† Probability of a larger F by chance between levels of F.
988 www.crops.org crop science, vol. 57, march–april 2017
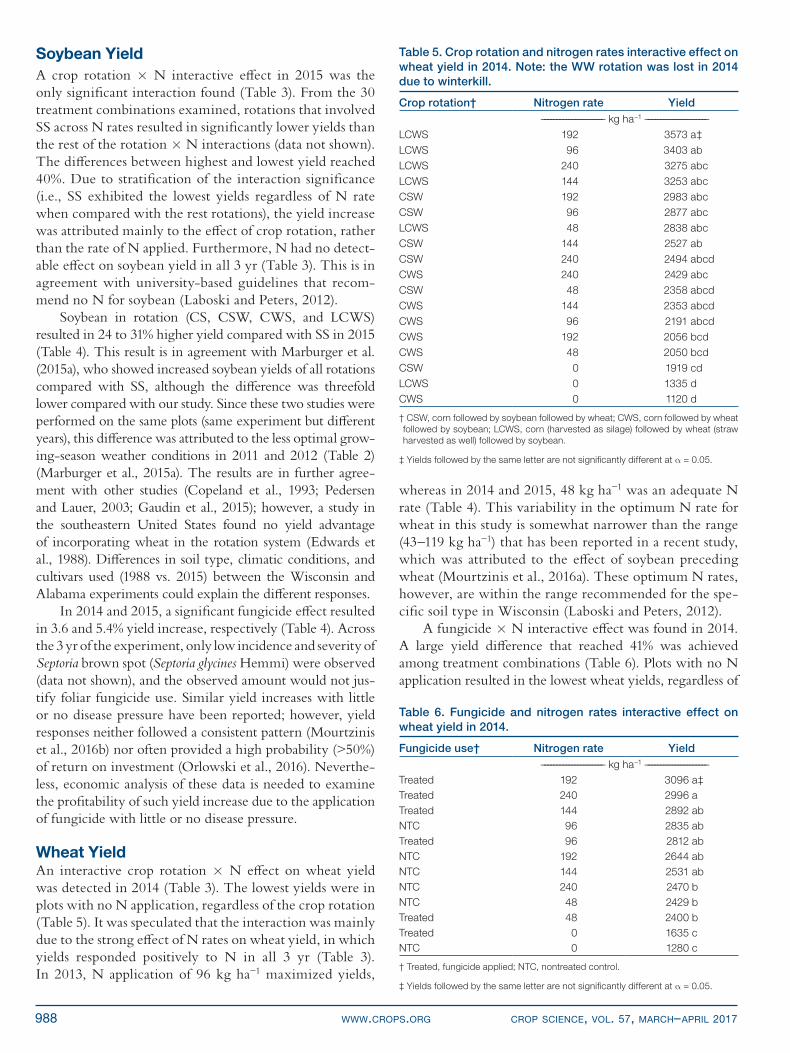
Soybean YieldA crop rotation ´ N interactive effect in 2015 was the only significant interaction found (Table 3). From the 30 treatment combinations examined, rotations that involved SS across N rates resulted in significantly lower yields than the rest of the rotation ´ N interactions (data not shown). The differences between highest and lowest yield reached 40%. Due to stratification of the interaction significance (i.e., SS exhibited the lowest yields regardless of N rate when compared with the rest rotations), the yield increase was attributed mainly to the effect of crop rotation, rather than the rate of N applied. Furthermore, N had no detect-able effect on soybean yield in all 3 yr (Table 3). This is in agreement with university-based guidelines that recom-mend no N for soybean (Laboski and Peters, 2012).
Soybean in rotation (CS, CSW, CWS, and LCWS) resulted in 24 to 31% higher yield compared with SS in 2015 (Table 4). This result is in agreement with Marburger et al. (2015a), who showed increased soybean yields of all rotations compared with SS, although the difference was threefold lower compared with our study. Since these two studies were performed on the same plots (same experiment but different years), this difference was attributed to the less optimal grow-ing-season weather conditions in 2011 and 2012 (Table 2) (Marburger et al., 2015a). The results are in further agree-ment with other studies (Copeland et al., 1993; Pedersen and Lauer, 2003; Gaudin et al., 2015); however, a study in the southeastern United States found no yield advantage of incorporating wheat in the rotation system (Edwards et al., 1988). Differences in soil type, climatic conditions, and cultivars used (1988 vs. 2015) between the Wisconsin and Alabama experiments could explain the different responses.
In 2014 and 2015, a significant fungicide effect resulted in 3.6 and 5.4% yield increase, respectively (Table 4). Across the 3 yr of the experiment, only low incidence and severity of Septoria brown spot (Septoria glycines Hemmi) were observed (data not shown), and the observed amount would not jus-tify foliar fungicide use. Similar yield increases with little or no disease pressure have been reported; however, yield responses neither followed a consistent pattern (Mourtzinis et al., 2016b) nor often provided a high probability (>50%) of return on investment (Orlowski et al., 2016). Neverthe-less, economic analysis of these data is needed to examine the profitability of such yield increase due to the application of fungicide with little or no disease pressure.
Wheat YieldAn interactive crop rotation ´ N effect on wheat yield was detected in 2014 (Table 3). The lowest yields were in plots with no N application, regardless of the crop rotation (Table 5). It was speculated that the interaction was mainly due to the strong effect of N rates on wheat yield, in which yields responded positively to N in all 3 yr (Table 3). In 2013, N application of 96 kg ha−1 maximized yields,
whereas in 2014 and 2015, 48 kg ha−1 was an adequate N rate (Table 4). This variability in the optimum N rate for wheat in this study is somewhat narrower than the range (43–119 kg ha−1) that has been reported in a recent study, which was attributed to the effect of soybean preceding wheat (Mourtzinis et al., 2016a). These optimum N rates, however, are within the range recommended for the spe-cific soil type in Wisconsin (Laboski and Peters, 2012).
A fungicide ´ N interactive effect was found in 2014. A large yield difference that reached 41% was achieved among treatment combinations (Table 6). Plots with no N application resulted in the lowest wheat yields, regardless of
Table 5. Crop rotation and nitrogen rates interactive effect on wheat yield in 2014. Note: the WW rotation was lost in 2014 due to winterkill.
Crop rotation† Nitrogen rate Yield––––––––––––––––––––– kg ha−1 –––––––––––––––––––––
LCWS 192 3573 a‡LCWS 96 3403 abLCWS 240 3275 abcLCWS 144 3253 abcCSW 192 2983 abcCSW 96 2877 abcLCWS 48 2838 abcCSW 144 2527 abCSW 240 2494 abcdCWS 240 2429 abcCSW 48 2358 abcdCWS 144 2353 abcdCWS 96 2191 abcdCWS 192 2056 bcdCWS 48 2050 bcdCSW 0 1919 cdLCWS 0 1335 dCWS 0 1120 d
† CSW, corn followed by soybean followed by wheat; CWS, corn followed by wheat followed by soybean; LCWS, corn (harvested as silage) followed by wheat (straw harvested as well) followed by soybean.
‡ Yields followed by the same letter are not significantly different at a = 0.05.
Table 6. Fungicide and nitrogen rates interactive effect on wheat yield in 2014.
Fungicide use† Nitrogen rate Yield––––––––––––––––––––– kg ha−1 –––––––––––––––––––––
Treated 192 3096 a‡Treated 240 2996 aTreated 144 2892 abNTC 96 2835 abTreated 96 2812 abNTC 192 2644 abNTC 144 2531 abNTC 240 2470 bNTC 48 2429 bTreated 48 2400 bTreated 0 1635 cNTC 0 1280 c
† Treated, fungicide applied; NTC, nontreated control.
‡ Yields followed by the same letter are not significantly different at a = 0.05.
crop science, vol. 57, march–april 2017 www.crops.org 989
fungicide treatment, whereas application of 240 kg N ha−1
was more beneficial to wheat yield when coupled with fun-gicide use. Nevertheless, for the recommended rate of N (48–96 kg ha−1), there was no difference between fungi-cide and nontreated plots. These results suggested that N rate was the main driver of the significant interactions on wheat yield. It was speculated that, due to the low disease pressure, yield differences were diminished when adequate N was applied (university-based recommended rate and above). However, when no or lower-than-recommended N was applied, fungicide application did not increase yields. Although this interaction was only achieved in 2014, a significant wheat yield response to fungicide application was detected in every year (Table 3). The associated yield increase was 7.4, 10.4, and 16.8% in 2013, 2014, and 2015, respectively (Table 4). Low disease incidence and severity of leaf rust (Puccinia triticina Erikss.), powdery mildew (Blumeria graminis (DC) Speer f. sp. tritici emend. É. J. Marchal), and Fusarium head blight (Fusarium graminearum Schwabe) were present at times during each growing season. Although the amount of disease present would not warrant fungicide use, a fungicide application mitigated yield impacts in this study nonetheless. Additionally, fungicides containing strobilurin active ingredient(s) have been shown to cause nonfungi-cidal crop physiological changes such as increased leaf greenness, chlorophyll content, photosynthetic rates, and water use efficiency, as well as delayed senescence (Gross-mann and Retzlaff, 1997; Grossmann et al., 1999; Bayles and Hilton, 2000; Bryson et al., 2000). This, coupled with the low levels of disease present, may have contributed to the observed yield increases.
There was no crop rotation that effectively increased wheat yields within each year of the experiment. This result contradicts Dill-Macky and Jones (2000), who found that wheat yields were better when following soy-bean rather than corn. Also, Marburger et al. (2015b) found that wheat yields within the CSW rotation were better than those in the CWS and LCWS rotations. Nev-ertheless, it should be noted that, in our study, all WW plots in 2014 and several plots in 2015 were completely lost due to winterkill. This could have reduced the power of the test that compared wheat yields among WW and the three other crop rotations containing wheat (LCWS, CSW, and CWS).
As mentioned earlier in the discussion, the winter-kill-affected wheat plots resulted in low average yields. The low yields in a no-till system may have resulted in a low amount of wheat residues in the soil. Steady-state soil carbon and N dynamics can be achieved at 15 to 20 yr of continuous management practices (West and Post, 2002; Alvarez, 2005) and could be affected by significant vari-ability in the amount of crop residues decomposing in the soil. Therefore, this may be a confounding factor on the subsequent crop yield in rotation.
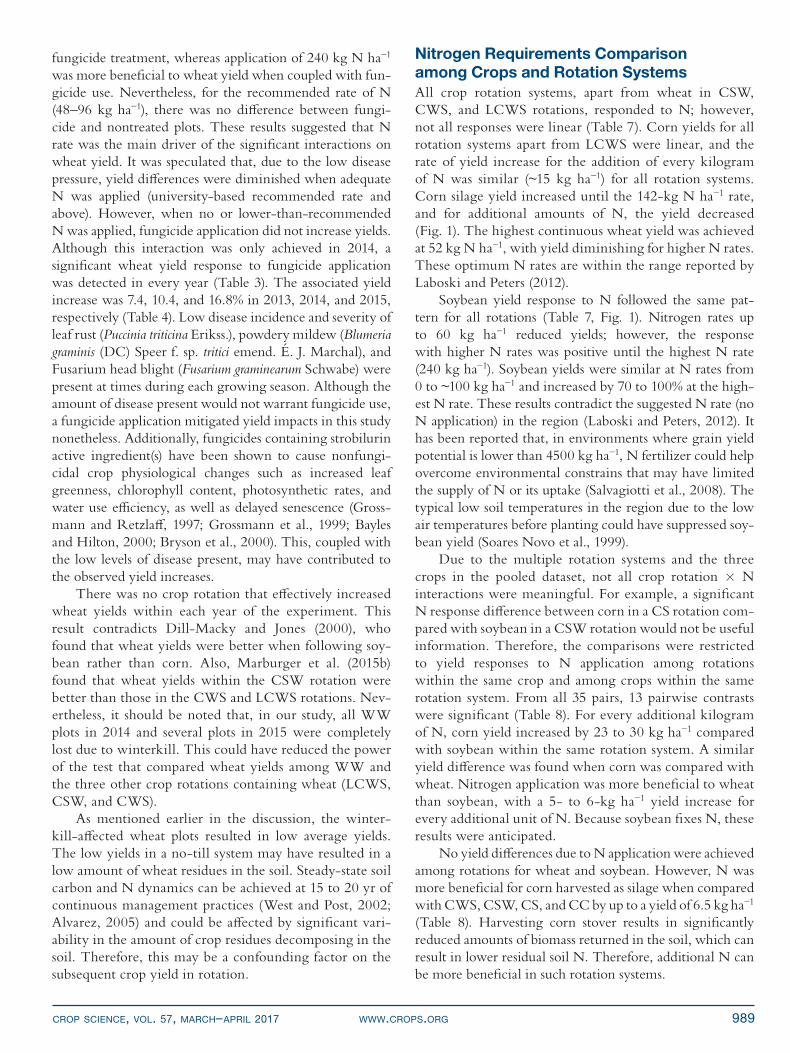
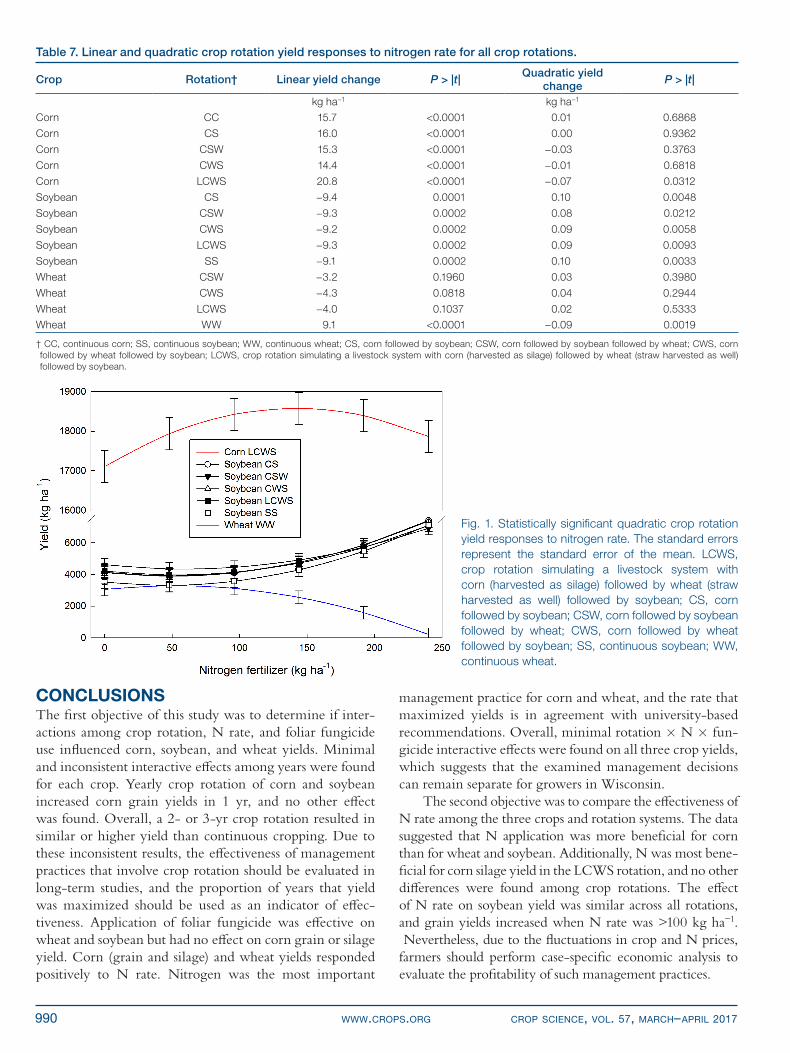
Nitrogen Requirements Comparison among Crops and Rotation SystemsAll crop rotation systems, apart from wheat in CSW, CWS, and LCWS rotations, responded to N; however, not all responses were linear (Table 7). Corn yields for all rotation systems apart from LCWS were linear, and the rate of yield increase for the addition of every kilogram of N was similar (~15 kg ha−1) for all rotation systems. Corn silage yield increased until the 142-kg N ha−1 rate, and for additional amounts of N, the yield decreased (Fig. 1). The highest continuous wheat yield was achieved at 52 kg N ha−1, with yield diminishing for higher N rates. These optimum N rates are within the range reported by Laboski and Peters (2012).
Soybean yield response to N followed the same pat-tern for all rotations (Table 7, Fig. 1). Nitrogen rates up to 60 kg ha−1 reduced yields; however, the response with higher N rates was positive until the highest N rate (240 kg ha−1). Soybean yields were similar at N rates from 0 to ~100 kg ha−1 and increased by 70 to 100% at the high-est N rate. These results contradict the suggested N rate (no N application) in the region (Laboski and Peters, 2012). It has been reported that, in environments where grain yield potential is lower than 4500 kg ha−1, N fertilizer could help overcome environmental constrains that may have limited the supply of N or its uptake (Salvagiotti et al., 2008). The typical low soil temperatures in the region due to the low air temperatures before planting could have suppressed soy-bean yield (Soares Novo et al., 1999).
Due to the multiple rotation systems and the three crops in the pooled dataset, not all crop rotation ´ N interactions were meaningful. For example, a significant N response difference between corn in a CS rotation com-pared with soybean in a CSW rotation would not be useful information. Therefore, the comparisons were restricted to yield responses to N application among rotations within the same crop and among crops within the same rotation system. From all 35 pairs, 13 pairwise contrasts were significant (Table 8). For every additional kilogram of N, corn yield increased by 23 to 30 kg ha−1 compared with soybean within the same rotation system. A similar yield difference was found when corn was compared with wheat. Nitrogen application was more beneficial to wheat than soybean, with a 5- to 6-kg ha−1 yield increase for every additional unit of N. Because soybean fixes N, these results were anticipated.
No yield differences due to N application were achieved among rotations for wheat and soybean. However, N was more beneficial for corn harvested as silage when compared with CWS, CSW, CS, and CC by up to a yield of 6.5 kg ha−1
(Table 8). Harvesting corn stover results in significantly reduced amounts of biomass returned in the soil, which can result in lower residual soil N. Therefore, additional N can be more beneficial in such rotation systems.
990 www.crops.org crop science, vol. 57, march–april 2017
CONCLUSIONSThe first objective of this study was to determine if inter-actions among crop rotation, N rate, and foliar fungicide use influenced corn, soybean, and wheat yields. Minimal and inconsistent interactive effects among years were found for each crop. Yearly crop rotation of corn and soybean increased corn grain yields in 1 yr, and no other effect was found. Overall, a 2- or 3-yr crop rotation resulted in similar or higher yield than continuous cropping. Due to these inconsistent results, the effectiveness of management practices that involve crop rotation should be evaluated in long-term studies, and the proportion of years that yield was maximized should be used as an indicator of effec-tiveness. Application of foliar fungicide was effective on wheat and soybean but had no effect on corn grain or silage yield. Corn (grain and silage) and wheat yields responded positively to N rate. Nitrogen was the most important
management practice for corn and wheat, and the rate that maximized yields is in agreement with university-based recommendations. Overall, minimal rotation ´ N ´ fun-gicide interactive effects were found on all three crop yields, which suggests that the examined management decisions can remain separate for growers in Wisconsin.
The second objective was to compare the effectiveness of N rate among the three crops and rotation systems. The data suggested that N application was more beneficial for corn than for wheat and soybean. Additionally, N was most bene-ficial for corn silage yield in the LCWS rotation, and no other differences were found among crop rotations. The effect of N rate on soybean yield was similar across all rotations, and grain yields increased when N rate was >100 kg ha−1. Nevertheless, due to the fluctuations in crop and N prices, farmers should perform case-specific economic analysis to evaluate the profitability of such management practices.
Table 7. Linear and quadratic crop rotation yield responses to nitrogen rate for all crop rotations.
Crop Rotation† Linear yield change P > |t|Quadratic yield
changeP > |t|
kg ha−1 kg ha−1
Corn CC 15.7 <0.0001 0.01 0.6868
Corn CS 16.0 <0.0001 0.00 0.9362
Corn CSW 15.3 <0.0001 −0.03 0.3763
Corn CWS 14.4 <0.0001 −0.01 0.6818
Corn LCWS 20.8 <0.0001 −0.07 0.0312
Soybean CS −9.4 0.0001 0.10 0.0048
Soybean CSW −9.3 0.0002 0.08 0.0212
Soybean CWS −9.2 0.0002 0.09 0.0058
Soybean LCWS −9.3 0.0002 0.09 0.0093
Soybean SS −9.1 0.0002 0.10 0.0033
Wheat CSW −3.2 0.1960 0.03 0.3980
Wheat CWS −4.3 0.0818 0.04 0.2944
Wheat LCWS −4.0 0.1037 0.02 0.5333
Wheat WW 9.1 <0.0001 −0.09 0.0019
† CC, continuous corn; SS, continuous soybean; WW, continuous wheat; CS, corn followed by soybean; CSW, corn followed by soybean followed by wheat; CWS, corn followed by wheat followed by soybean; LCWS, crop rotation simulating a livestock system with corn (harvested as silage) followed by wheat (straw harvested as well) followed by soybean.
Fig. 1. Statistically significant quadratic crop rotation yield responses to nitrogen rate. The standard errors represent the standard error of the mean. LCWS, crop rotation simulating a livestock system with corn (harvested as silage) followed by wheat (straw harvested as well) followed by soybean; CS, corn followed by soybean; CSW, corn followed by soybean followed by wheat; CWS, corn followed by wheat followed by soybean; SS, continuous soybean; WW, continuous wheat.
crop science, vol. 57, march–april 2017 www.crops.org 991
Conflict of Interest
The authors declare there to be no conflict of interest.
AcknowledgmentsThe authors thank the Wisconsin Soybean Marketing Board and the University of Wisconsin-Madison College of Agriculture and Life Sciences for supporting this research.
ReferencesAlvarez, R. 2005. A review of nitrogen fertilizer and conservation
tillage effects on soil organic carbon storage. Soil Use Man-age. 21:38–52. doi:10.1079/SUM2005291
Andow, D. 1983. The extent of monoculture and its effects on insect pest populations with particular reference to wheat and cotton. Agric. Ecosyst. Environ. 9:25–35. doi:10.1016/0167-8809(83)90003-8
Bayles, R.A., and G.J. Hilton. 2000. Variety as a factor in the response of cereals to strobilurins. In: The Proceedings of the BCPC Conference, Brighton, UK. 13–16 Nov. 2000. British Crop Production Council, Hampshire, UK. p. 731–738.
Brinkman, J.M.P., W. Deen, J.D. Lauzon, and D.C. Hooker. 2014. Synergism of nitrogen rate and foliar fungicides in soft red winter wheat. Agron. J. 106:491–510. doi:10.2134/agronj2013.0395
Bryson, R.J., L. Leandro, and D.R. Jones. 2000. The physio-logical effects of kresoxim-methyl on wheat leaf greenness and the implications for crop yield. In: The Proceedings of the BCPC Conference, Brighton, UK. 13–16. Nov. 2000. British Crop Production Council, Hampshire, UK. p. 739–749.
Campbell, C.A., and R.P. Zentner. 1993. Soil organic mat-ter as influenced by crop rotations and fertiliza-tion. Soil Sci. Soc. Am. J. 57:1034–1040. doi:10.2136/sssaj1993.03615995005700040026x
Copeland, P.J., R.R. Allmaras, R.K. Crookston, and W.W. Nel-son. 1993. Corn-soybean rotation effects on soil water deple-tion. Agron. J. 85:203–210. doi:10.2134/agronj1993.00021962008500020008x
Council for Agricultural Science and Technology. 1999. Gulf of Mexico hypoxia: Land and sea interactions. Task Force Rep. 134. CAST, Ames, IA.
Cullen, E.M., V. Davis, B. Jensen, G. Nice, M. Renz, and D. Smith. 2012. Pest management in Wisconsin field crops. Coop. Ext. Serv. A-3646. Univ. of Wisconsin–Madison, Madison.
Dick, W.A., and D.M. Van Doren. 1985. Continuous tillage and rotation combinations effects on corn, soybean, and oat yields. Agron. J. 77:459–465. doi:10.2134/agronj1985.00021962007700030023x
Dill-Macky, R., and R.K. Jones. 2000. The effect of previous crop residues and tillage on Fusarium head blight of wheat. Plant Dis. 84:71–76. doi:10.1094/PDIS.2000.84.1.71
Edwards, J.H., D.L. Thurlow, and J.T. Eason. 1988. Influence of tillage and crop rotation on yields of corn, soybean, and wheat. Agron. J. 80:76–80. doi:10.2134/agronj1988.00021962008000010018x
Fehr, W.R., and C.E. Caviness. 1977. Stages of soybean develop-ment. Iowa Coop. Ext. Serv. Spec. Rep. 80. Iowa State Univ., Ames, IA.
Gaudin, A.C.M., K. Janovicek, B. Deen, and D.C. Hooker. 2015. Wheat improves nitrogen use efficiency of maize and soy-bean-based cropping systems. Agric. Ecosyst. Environ. 210:1–10. doi:10.1016/j.agee.2015.04.034
Griffith, D.R., E.J. Kladivko, J.V. Mannering, T.D. West, and S.D. Parsons. 1988. Long-term tillage and rotation effects on corn growth and yield on high and low organic matter, poorly drained soil. Agron. J. 80:599–605. doi:10.2134/agronj1988.00021962008000040011x
Grossmann, K., J. Kwaltowski, and G. Caspar. 1999. Regula-tion of phytohormone levels, leaf senescence and transpira-tion by the strobilurin kresoximmethyl in wheat (Triticum aestivum). J. Plant Physiol. 154:805–808. doi:10.1016/S0176-1617(99)80262-4
Grossmann, K., and G. Retzlaff. 1997. Bioregulatory effects of the fungicidal strobilurin kresoxim-methyl in wheat (Triti-cum aestivum). Pestic. Sci. 50:11–20. doi:10.1002/(SICI)1096-9063(199705)50:1<11::AID-PS556>3.0.CO;2-8
Heichel, G.H. 1978. Stabilizing agricultural energy needs: Role of forages, rotation, and nitrogen fixation. J. Soil Water Con-serv. 33:279–282.
Karlen, D.L., G.E. Varvel, D.G. Bullock, and R.M. Cruse. 1994. Crop rotations for the 21st century. Adv. Agron. 53:1–45. doi:10.1016/S0065-2113(08)60611-2
Laboski, C.A.M., and J.B. Peters. 2012. Nutrient application guidelines for field, vegetable, and fruit crops in Wiscon-sin. Coop. Ext. Serv. A-2809. Univ. of Wisconsin–Madison, Madison.
Large, E.C. 1954. Growth stages in cereals illustration of the Feekes scale. Plant Pathol. 3:128–129. doi:10.1111/j.1365-3059.1954.tb00716.x
Littell, R.C., G.A. Milliken, W.W. Stroup, R.D. Wolfinger, and O. Schabenberger. 2006. SAS for mixed models. 2nd ed. SAS Inst., Cary, NC.
Lund, M.G., P.R. Carter, and E.S. Oplinger. 1993. Tillage and crop rotation affect corn, soybean, and winter wheat yields. J. Prod. Agric. 6:207–213. doi:10.2134/jpa1993.0207
Table 8. Crop rotation yield differences due to nitrogen rates. Total 35 comparisons were made and in this table the statistically significant (P < 0.05) are presented. The yield difference represents the yield change between the two crop-rotations for a one unit increase in nitrogen rate.
Comparison† Yield difference P > |t|kg ha−1
Corn CS vs. soybean CS 25.4 <0.0001
Corn CSW vs. soybean CSW 24.6 <0.0001
Corn CWS vs. soybean CWS 23.5 <0.0001
Corn LCWS vs. soybean LCWS 30.1 <0.0001
Corn CWS vs. wheat CWS 18.6 <0.0001
Corn LCWS vs. wheat LCWS 24.9 <0.0001
Soybean LCWS vs. wheat LCWS −5.3 0.0071
Soybean CWS vs. wheat CWS −4.9 0.0122
Soybean CSW vs. wheat CSW −6.1 0.0017
Corn CWS vs. corn LCWS −6.5 0.0009
Corn CSW vs. corn LCWS −5.5 0.0047
Corn CS vs. corn LCWS −4.8 0.0129
Corn CC vs. corn LCWS −5.2 0.0091
† CC, continuous corn; SS, continuous soybean; WW, continuous wheat; CS, corn followed by soybean; CSW, corn followed by soybean followed by wheat; CWS, corn followed by wheat followed by soybean; LCWS, crop rotation simulating a livestock system with corn (harvested as silage) followed by wheat (straw harvested as well) followed by soybean.
992 www.crops.org crop science, vol. 57, march–april 2017
Marburger, D.A., S.P. Conley, P.D. Esker, J.G. Lauer, and J.M. Ané. 2015a. Yield response to crop/genotype rotations and fungicide use to manage Fusarium-related diseases. Crop Sci. 55:889–898. doi:10.2135/cropsci2014.03.0201
Marburger, D.A., S. Mourtzinis, J.M. Gaska, and S.P. Conley. 2015b. Does crop rotation and tillage influence soybean seed-applied inoculant decisions? Agron. J. 108:402–406. doi:10.2134/agronj2015.0331
Matson, P.A., W.J. Parton, A.G. Power, and M.J. Swift. 1997. Agricultural intensification and ecosystem properties. Science 277:504–509. doi:10.1126/science.277.5325.504
Miles, M.R., C. Levy, W. Morel, T. Mueller, T. Steinlage, N. van Rij et al. 2007. International fungicide efficacy trials for the management of soybean rust. Plant Dis. 91:1450–1458. doi:10.1094/PDIS-91-11-1450
Mourtzinis, S., J.M. Gaska, and S.P. Conley. 2016a. Winter wheat response to nitrogen under simulated winterkill conditions. Agron. J. 108:1463–1467. doi:10.2134/agronj2015.0612
Mourtzinis, S., D.A. Marburger, J.M. Gaska, and S.P. Conley. 2016b. Characterizing soybean yield and quality response to multiple prophylactic inputs and synergies. Agron. J. 108:1337–1345. doi:10.2134/agronj2016.01.0023
Mourtzinis, S., D.A. Marburger, J.M. Gaska, T. Diallo, J.G. Lauer, and S.P. Conley. 2017. Corn and soybean yield response to tillage, rotation, nematicide seed treatment. Crop Sci. doi:10.2135/cropsci2016.09.0792 (in press).
Nelson, K.A., and C.G. Meinhardt. 2011. Foliar boron and pyraclostrobin effects on corn. Agron. J. 103:1352–1358. doi:10.2134/agronj2011.0090
Orlowski, J.M., B.J. Haverkamp, R.G. Laurenz, D.A. Marburger, E.W. Wilson, S.N. Casteel et al. 2016. High-input manage-ment systems effect on soybean seed yield, yield components, and economic break-even probabilities. Crop Sci. 56:1988–2004. doi:10.2135/cropsci2015.10.0620
Pedersen, P., and J.G. Lauer. 2003. Corn and soybean response to rotation sequence, row spacing, and tillage system. Agron. J. 95:965–971. doi:10.2134/agronj2003.0965
Pedersen, P., and J.G. Lauer. 2002. Influence of rotation sequence on the optimum corn and soybean plant population. Agron. J. 94:968–974. doi:10.2134/agronj2002.0968
Peterson, T.A., and G.E. Varvel. 1989a. Crop yield as affected by rotation and nitrogen rate. I. Soybean. Agron. J. 81:727–731. doi:10.2134/agronj1989.00021962008100050005x
Peterson, T.A., and G.E. Varvel. 1989b. Crop yield as affected by rotation and nitrogen rate. III. Corn. Agron. J. 81:735–738. doi:10.2134/agronj1989.00021962008100050007x
Pimentel, D., J. Krummel, D. Gallahan, J. Hough, A. Mer-rill, I. Schreiner et al. 1978. Benefits and costs of pesti-cide use in U.S. food production. Bioscience 28:772–784. doi:10.2307/1307251
Porter, P.M., J.G. Lauer, W.E. Lueschen, J.H. Ford, T.R. Hover-stad, E.S. Oplinger, and R.K. Crookston. 1997. Environment affects the corn and soybean rotation effect. Agron. J. 89:442–448. doi:10.2134/agronj1997.00021962008900030012x
Raimbault, B.A., and T.J. Vyn. 1991. Crop rotation and tillage effects on corn growth and soil structural stability. Agron. J. 83:979–985. doi:10.2134/agronj1991.00021962008300060011x
Ritchie, S.W., J.J. Hanway, and G.O. Benson. 1992. How a corn plant develops. Iowa State Univ. Ext. Spec. Rep. 48. Iowa State Univ., Ames, IA.
Roder, W., S.C. Mason, M.D. Clegg, and K.R. Kniep. 1989. Crop root distribution as influenced by grain sorghum–soybean rotation and fertilization. Soil Sci. Soc. Am. J. 53:1464–1470. doi:10.2136/sssaj1989.03615995005300050027x
Salvagiotti, F., K.G. Cassman, J.E. Specht, D.T. Walters, A. Weiss, and A. Dobermann. 2008. Nitrogen uptake, fixation and response to fertilizer N in soybeans: A review. Field Crops Res. 108:1–13. doi:10.1016/j.fcr.2008.03.001
SAS Institute. 2011. The SAS system for Windows. Release 9.3. SAS Inst., Cary, NC.
Scharf, P.C., N.R. Kitchen, K.A. Sudduth, J.G. Davis, V.C. Hub-bard, and J.A. Lory. 2005. Field-scale variability in opti-mal nitrogen fertilizer rate for corn. Agron. J. 97:452–461. doi:10.2134/agronj2005.0452
Soares Novo, M.C., R.T. Tanaka, H.A.A. Mascarenhas, N. Bor-toletto, P.B. Gallo, J.C.V.N. Alves Pereira, and A.A. Teixeira Vargas. 1999. Nitrogênio e potássio na fixação simbiótica de N2 por soja cultivada no inverno. (In Portuguese.) Sci. Agric. 56:143–156.
USDA-ERS. 2016. Corn and soybean acreage has risen since 1990, while wheat and cotton are down. USDA-ERS, Washington, DC. http://www.ers.usda.gov/data-products/chart-gallery/detail.aspx?chartId=40069&ref=collection&embed=True&widgetId=39734 (accessed 19 July 2016).
Van Eerd, L.L., K.A. Congreves, A. Hayes, A. Verhallen, and D.C. Hooker. 2014. Long-term tillage and crop rotation effects on soil quality, organic carbon, and total nitrogen. Can. J. Soil Sci. 94:303–315. doi:10.4141/cjss2013-093
Ward, J.M.J., M.D. Laing, and F.H.J. Rijkenberg. 1997. Frequency and timing of fungicide for the control of gray leaf spot in maize. Plant Dis. 81:41–48. doi:10.1094/PDIS.1997.81.1.41
Wegulo, S.N., J.A. Breathnach, and P.S. Baenziger. 2009. Effect of growth stage on the relationship between tan spot and spot blotch severity and yield in winter wheat. Crop Prot. 28:696–702. doi:10.1016/j.cropro.2009.04.003
West, T.O., and W.M. Post. 2002. Soil organic carbon sequestra-tion rates by tillage and crop rotation. Soil Sci. Soc. Am. J. 66:1930–1946. doi:10.2136/sssaj2002.1930
Yadav, S.N. 1997. Formulation and estimation of nitrate-nitrogen leaching from corn cultivation. J. Environ. Qual. 26:808–814. doi:10.2134/jeq1997.00472425002600030031x