Embed Size (px)
Citation preview
1
CORE Group Polio Project
Final Evaluation Angola, Ethiopia, India - 2012
Ellen A. Coates
Stephen Fitzgerald
David Newberry
September 2012
2
TABLE OF CONTENTS
TABLE OF CONTENTS ......................................................................................................................................................... 2 ACRONYMS ....................................................................................................................................................................... 4
EXECUTIVE SUMMARY ......................................................................................................................... 5
BACKGROUND ............................................................................................................................................... 5 KEY EVALUATION FINDINGS ........................................................................................................................... 6 RECOMMENDATIONS .................................................................................................................................... 8
CGPP/ANGOLA EVALUATION FINDINGS ............................................................................................... 9
BACKGROUND ............................................................................................................................................... 9 Achievements: ........................................................................................................................................................... 11
METHODOLOGY ........................................................................................................................................... 11 QUANTITATIVE HOUSEHOLD SURVEY FINDINGS ............................................................................................ 12
Demographic Data ............................................................................................................................................. 12 Immunization Coverage ..................................................................................................................................... 15
Routine Coverage Relative to Government of Angola Immunization Schedule .............................................................. 15 Polio Campaign Coverage ............................................................................................................................................... 18 Childre ’s Va i atio Status a d Reaso s for Missed Vaccinations .............................................................................. 19
Mother’s K owledge of Polio a d Related Topics .............................................................................................. 20 Knowledge of Vaccine Safety and the Vaccination Schedule .......................................................................................... 20 Sources of Information ................................................................................................................................................... 23
Mothers’ K owledge a d Practice Related to Acute Flaccid Paralysis ............................................................... 24 Access to Health Services/Support ..................................................................................................................... 27
Mothers’ E posure to Health I for atio /Edu atio /Co u i atio ......................................................................... 27 Access to Health Services ................................................................................................................................................ 28
Discussion ........................................................................................................................................................... 29 ANGOLA FINAL EVALUATION QUALITATIVE DATA .......................................................................................... 32
Key Informant Comments and Observations ..................................................................................................... 33 Key I for a ts’ Reco e datio s ................................................................................................................... 34
EVALUATION RECOMMENDATIONS FOR CGPP/ANGOLA ............................................................................... 35
CGPP/ETHIOPIA EVALUATION FINDINGS ............................................................................................ 38
BACKGROUND .............................................................................................................................................. 38 Achievements: ................................................................................................................................................................ 40
METHODOLOGY ........................................................................................................................................... 41 CONSTRAINTS/LIMITATIONS ......................................................................................................................... 41 QUANTITATIVE HOUSEHOLD SURVEY DATA FINDINGS ................................................................................... 42
Demographic Data ............................................................................................................................................. 42 Immunization Coverage ..................................................................................................................................... 48
Routine Immunization Coverage ..................................................................................................................................... 48 Coverage Based on Immunization Card Data Only ......................................................................................................... 50 Coverage Based on Cards Plus Mothers’ Re all .............................................................................................................. 51 Child Immunization Status .............................................................................................................................................. 58 Reaso s for Childre ’s I o plete Va i atio Status ................................................................................................... 59 Campaign Coverage ........................................................................................................................................................ 61
Access to Vaccination Services ........................................................................................................................... 62 Knowledge and Attitudes Regarding Polio Vaccination ..................................................................................... 63 AFP Surveillance ................................................................................................................................................. 67 Health Education/Social Mobilization ................................................................................................................ 69
QUALITATIVE DATA ...................................................................................................................................... 74 Partner Recommendations ............................................................................................................................................. 76
3
RECOMMENDATIONS ................................................................................................................................... 77
CGPP/INDIA EVALUATION FINDINGS .................................................................................................. 78
BACKGROUND .............................................................................................................................................. 78 Achievements ................................................................................................................................................................. 79
METHODOLOGY ........................................................................................................................................... 79 CONSTRAINTS AND LIMITATIONS .................................................................................................................. 80 QUANTITATIVE HOUSEHOLD SURVEY FINDINGS ............................................................................................ 81
Demographic Data ............................................................................................................................................. 81 Immunization Coverage ..................................................................................................................................... 86 ACCESS TO IMMUNIZATION SERVICES ............................................................................................................... 89 Polio Knowledge ................................................................................................................................................. 91
Sources of Information on Polio and Polio Campaigns ................................................................................................... 91 Mothers’ K o ledge Related to Polio ............................................................................................................................ 94
Acute Flaccid Paralysis (AFP) Knowledge and Practice ...................................................................................... 98 Diarrheal Disease Control Knowledge and Practice ......................................................................................... 100
Diarrheal Disease Control ............................................................................................................................................. 100 Use of Soap ................................................................................................................................................................... 102 Households with Latrines .............................................................................................................................................. 103
RECOMMENDATIONS ................................................................................................................................. 104 ATTACHMENT 1: ETHIOPIA CORE GROUP POLIO PROJECT FINAL EVALUATION SURVEY INSTRUMENT, 2012
......................................................................................................................................................................... 106
4
ACRONYMS
A Agrarian (population in Ethiopia) AFP Acute Flaccid Paralysis AMREF African Medical and Research Foundation B Baseline Survey BCC Behavior Change Communication BCG Bacillus Calmette-Guerin CBS Community-Based Surveillance CGPP CORE Group Polio Project CGPP PEI CORE Group Partners Project Polio Eradication Initiative CVSFP Community-based Volunteer Surveillance Focal Point F Final Survey FMOH Federal Ministry of Health GoA Government of Angola GoE Government of Ethiopia GoI Government of India HCS Hararghe Catholic Secretariat HDA Health Development Army IEC Information Education and Communication ICC Inter-agency Coordinating Committee1 IRC International Rescue Committee M Mid-term Survey NIDs National Immunization Days NGO Non-Governmental Organization NNT Neonatal Tetanus NPSP National Polio Surveillance Project OPV Oral Polio Vaccine ORS Oral Rehydration Solution P Pastoralist (population in Ethiopia) PEI Polio Eradication Initiative Penta Pentavalent Vaccine PVO Private Voluntary Organization RI Routine Immunization S Semi-pastoralist (population in Ethiopia) SNIDs Sub-National Immunization Days SIAs Supplemental Immunization Activities UP Uttar Pradesh USAID United States Agency for International Development UNICEF United Nation Children’s Fund WHO World Health OrganizationIRC WoHO Woreda Health Office
1 In some locations translated as Immunization Coordinating Committee, or Immunization Core Committee

5
EXECUTIVE SUMMARY
BACKGROUND
The CORE Group2 Polio Project, initially the CORE Group Partners Project Polio Eradication Initiative, began in the late 1990s as an effort to bring to the polio eradication effort USAID-funded private voluntary organizations (PVOs) with a strong history of delivering effective child survival programs to the most vulnerable, underserved and hard-to-reach communities in developing countries. Over the next few years different combinations of a group of ten CORE Group member PVOs began working on polio eradication in several countries in Africa and Asia. Funding was awarded annually until 2008 when a five year US$30 million grant was awarded to the CORE Group Polio Project (CGPP) for work in Angola, Ethiopia, India and Nepal. Nepal was graduated from the project two years into the grant and, therefore, is not included in this final evaluation. Given the nature of the on-going WHO-coordinated Global Polio Eradication Initiative (GPEI), immunization coverage and AFP surveillance data relative to a set of formal, standardized indicators are available at national and sub-national levels for all polio-infected and re-infected countries. The CGPP secretariats and partners in each country have consistently used these and other local data to set priorities, assess progress and inform annual workplans. With the five-year grant, a more deliberate project monitoring and evaluation plan was developed and, with additional support from a Bill and Melinda Gates Foundation grant, plans for a project baseline, mid-term and final evaluation survey were established and a household survey instrument was developed using questions and approaches from the USAID’s Demographic and Health Survey Child Survival knowledge-practice-coverage survey questionnaires, UNICEF’s Multiple Indicator Cluster Survey (MICS) tools, and relevant WHO tools. Over time qualitative data collection involving selected key informants was added. When the FY08 CGPP grant was awarded, India was one of only four countries that had never succeeded in interrupting transmission of the wild poliovirus, while Angola had been re-infected with the virus. Ethiopia was polio free at that time, but in 2008 the virus was imported across the border with Southern Sudan. Although, with participation from the CGPP partners and other key players, the virus was very quickly contained and an outbreak was avoided, the three year waiting period for polio free certification was “re-started” at that point. To support the achievement of global and national PEI goals and objectives, the CGPP proposal included five key project objectives intended to support polio eradication, reduce children’s vulnerability to vaccine-preventable diseases by strengthening national routine immunization, and enhance local capacity:
2 The CORE Group is a membership association of more than 50 international NGOs whose mission is to improve the health and wellbeing of children and women in developing countries through collaborative NGO action and learning. The CORE Group fosters strategic alliances for in-country collaboration to increase the impact of community focused child health and development programs.
6
The first three objectives involve supporting PVO/NGO efforts to strengthen: 1. national and regional immunization systems to achieve polio eradication through
interventions that will increase the number of children <60 months of age who are fully protected by routine child immunizations and will strengthen local capacity
2. national and regional planning and implementation of supplemental polio immunization to increase oral polio vaccination coverage
3. AFP case detection and reporting (and case detection of other infectious diseases) In addition, the CGPP partners strived to:
4. Build effective partnerships between PVOs, NGOs and international, national, and regional agencies involved in polio, encouraging partnerships with local non-government and church-based organizations and actively participating in national Inter-agency Coordinating Committee meetings and other appropriate technical meetings at local, sub-national, national and regional levels
5. Support timely documentation and use of information to continuously improve the quality of polio eradication (and other health related activities)
KEY EVALUATION FINDINGS
The partners and secretariats in all three countries are to be congratulated for significant contributions to polio eradication and to child, family and community health. During the current five year USAID grant for CGPP in all three project countries zero polio status was either achieved (India) or re-established (Angola and Ethiopia) following re-importation of virus. While no single PEI partner can claim responsibility for these historic achievements, there is widespread agreement among other stakeholder organizations that the CGPP partners played an important role, particularly given their effective work in each country’s most high-risk, underserved, hard-to-reach communities. Regarding routine immunization coverage, in India coverage improved for virtually every antigen and card retention increased dramatically (from 30% at baseline to 81% at the final) following introduction of CGPP-designed “poly-bags” which were distributed to new mothers for storing their children’s immunization cards. In Angola, no baseline data is available for comparison for Bacillus Calmette-Guerin (BCG) or measles, but card-confirmed coverage increased more than 3% for OPV0, 1.5% and 1.1% for OPV2 and Pentavalent 2, respectively, nearly 5% for OPV3, and about 7.5% for Pentavalent 3. In Ethiopia, card-confirmed data showed increases in OPV0 coverage in all three population groups with which the project partners worked – agrarian, semi-pastoralist and pastoralist. Although for most other antigens changes were negligible (+ <1%) within the higher risk semi-pastoralist population, which the partners began working with part way through the grant, there were improvements in OPV3 (1.4%), Pentavalent2 (2.3%) and Pentavalent 3 (3.0) coverage in the agrarian population and increases from 10.3% for OPV0 and increases ranging from 17.8 to 22.0% for the other OPV and pentavalent doses among the pastoralist children surveyed. (The survey data for BCG and measles are skewed due to extremely low baseline coverage that was most likely due to either service delivery challenges such as stock-outs, or some kind of data collection error.)
7
Looking at support for supplemental polio immunization campaigns, survey data from Angola indicate that the percentage of children 12-23 months of age who participated in the most recent campaign increased from approximately 48% at baseline to 91% at the mid-term and final. The percentage of children who had received at least four doses of OPV also increased from 2% to 25%, suggesting that while there has been significant improvement much more work needs to be done to ensure that children are well protected and that there will be no opportunity for any imported poliovirus to re-establish itself and begin circulating again. In Ethiopia the frequency of mass campaigns has declined in recent years. At the baseline, 84% of agrarian children 12-23 months of age and 94% of semi-pastoralist children in that age group had participated in a campaign but by the final only 76% and 83%, respectively, had participated, perhaps due in part to fewer opportunities. Among higher risk pastoralist populations, however, participation increased from 74% at the baseline to 85% at the final. Less than 40% of children in any of the population sub-groups have received at least 5 doses of OPV and therefore, as in Angola, more work needs to be done to ensure children are well-protected against the threat of imported virus. In India, campaign coverage remained at above 95%. Data on children with 4 or more doses of OPV was not collected at the final. Each CGPP country presented different technical and resource needs; therefore the mix of interventions varied somewhat from country to country. For example, in India the National Polio Surveillance Program (NPSP) maintains a robust nationwide AFP surveillance system that meets WHO and GPEI standards so the CGPP partners have focused instead on supporting the nearly monthly statewide oral polio vaccination campaigns in UP, increasing routine immunization coverage and, over time, reducing transmission of/exposure to polio and other communicable diseases by promoting hygiene, sanitation, and appropriate management of diarrheal disease. In Ethiopia, on the other hand, many high risk CGPP catchment areas were “silent” – without any AFP reporting – until the CGPP partners introduced their community based approach to surveillance, training local Community Volunteer Surveillance Focal Points and linking them to the local woreda health system. Formerly silent areas are now reporting regularly, not only on AFP but also neonatal tetanus and measles. In Angola, CGPP’s AFP awareness raising and education has been extremely effective, with more than 90% of mothers who have participated in health education home visits or health education sessions conducted by CGPP-trained volunteers (volontarios) able to correctly name signs of AFP and appropriate responses to suspected cases. In both countries the next challenge will be scaling up to include all families with vaccine-age children in all vulnerable and high risk areas. Key informants in Angola and Ethiopia, and data from India reported in Global Health: Science and Practice3 indicate widespread recognition of CGPP’s capacity building contributions that improved campaign quality and coverage, strengthened routine immunization static and outreach service delivery and record-keeping systems, and engaged local non-government organizations in the polio eradication effort. In addition to building local technical and project management capacity, the CGPP secretariats were also recognized for their contributions to national Inter-
3 See Coates et al. Successful polio eradication in Uttar Pradesh, India: the pivotal contribution of the Social Mobilization Network,an NGO/UNICEF collaboration. 2013;000(000):1-16. http://dx.doi.org/10.9745/GHSP-D-12-00018

8
agency Coordinating Committees and for their success in encouraging coordination and in some cases partnerships between NGOs, local health systems, and international GPEI stakeholders.
RECOMMENDATIONS
CGPP has made significant contributions to polio eradication, universal immunization and disease prevention in all three countries through improved participation in and strengthened delivery of immunization services, strengthened disease surveillance and/or improved community and household health seeking behaviors. The partners have established networks of trained, effective community-based workers and successful working relationships with Ministry of Health counterparts, multi-lateral stakeholders such as WHO and UNICEF, and local implementing organizations. They are now well positioned to expand beyond their current scope and capitalize on their potential as a platform for broader child survival and maternal and child health programming, not only in current CGPP countries but potentially in other countries with strong CORE Group member presence. Seeking additional resources and building local fund-raising and grant management capacity would be a valuable investment in child health. In each of the current CGPP countries the survey data suggests particular strengths; for example, the CGPP partners seem to have been extremely effective in educating the mothers they interact with on recognizing and responding to possible cases of AFP. Further investigation of these strengths and, if confirmed, expansion of these activities should be included in the next phase. Evaluation of the survey data alone cannot provide a complete picture of the work done and/or the progress made, particularly given some of the data collection and analysis challenges experienced with the final evaluation. At this stage of the project, the monitoring and evaluation approach should be expanded to include targeted, formative research that will better assess the project’s impact and offer more in-depth insights into remaining gaps and weaknesses to be addressed. Given the CGPP secretariats’ progress in data use and research, it is apparent that while a knowledge-practice-coverage 30 cluster survey offers a snapshot assessment of immunization coverage and possibly of some aspects of polio and AFP knowledge and practice in CGPP catchment areas, this approach is not adequate to capture the nuances of the project’s activities or achievements. In particular, assessing the following would serve project partners and beneficiaries and contribute to polio eradication, disease prevention and child health: Direct and indirect contributions to MOH capacity at district, regional and/or national levels
Direct and indirect contributions to community/family health knowledge and behavior Strengthened linkages between local, national and international levels Fostering of voluntarism There are important lessons to be learned from the challenges encountered in the final survey. In particular, local capacity building for research and data use is an important goal; however, consistent quality and strategy across linked research such as baseline, mid-term and final surveys contributes substantially to data’s value. If working with the same trusted researchers for repeated surveys in a single funding cycle is not possible, it will be essential for the secretariat (and potentially headquarters) staff to invest in active participation in both data collector training and on-site supervision of data collection and analysis.
9
CGPP/ANGOLA EVALUATION FINDINGS
BACKGROUND
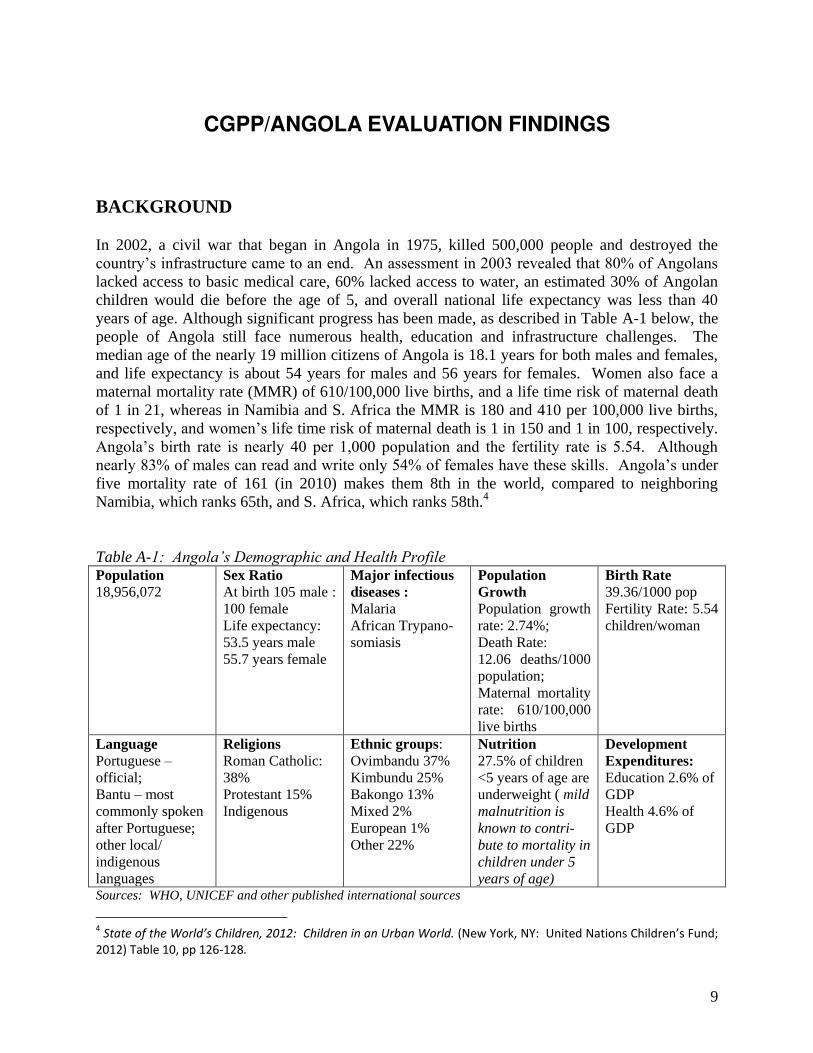
In 2002, a civil war that began in Angola in 1975, killed 500,000 people and destroyed the country’s infrastructure came to an end. An assessment in 2003 revealed that 80% of Angolans lacked access to basic medical care, 60% lacked access to water, an estimated 30% of Angolan children would die before the age of 5, and overall national life expectancy was less than 40 years of age. Although significant progress has been made, as described in Table A-1 below, the people of Angola still face numerous health, education and infrastructure challenges. The median age of the nearly 19 million citizens of Angola is 18.1 years for both males and females, and life expectancy is about 54 years for males and 56 years for females. Women also face a maternal mortality rate (MMR) of 610/100,000 live births, and a life time risk of maternal death of 1 in 21, whereas in Namibia and S. Africa the MMR is 180 and 410 per 100,000 live births, respectively, and women’s life time risk of maternal death is 1 in 150 and 1 in 100, respectively. Angola’s birth rate is nearly 40 per 1,000 population and the fertility rate is 5.54. Although nearly 83% of males can read and write only 54% of females have these skills. Angola’s under five mortality rate of 161 (in 2010) makes them 8th in the world, compared to neighboring Namibia, which ranks 65th, and S. Africa, which ranks 58th.4 Table A-1: Angola’s Demographic and Health Profile Population 18,956,072
Sex Ratio At birth 105 male : 100 female Life expectancy: 53.5 years male 55.7 years female
Major infectious diseases : Malaria African Trypano-somiasis
Population Growth Population growth rate: 2.74%; Death Rate: 12.06 deaths/1000 population; Maternal mortality rate: 610/100,000 live births
Birth Rate 39.36/1000 pop Fertility Rate: 5.54 children/woman
Language Portuguese – official; Bantu – most commonly spoken after Portuguese; other local/ indigenous languages
Religions Roman Catholic: 38% Protestant 15% Indigenous
Ethnic groups: Ovimbandu 37% Kimbundu 25% Bakongo 13% Mixed 2% European 1% Other 22%
Nutrition 27.5% of children <5 years of age are underweight ( mild malnutrition is known to contri-bute to mortality in children under 5 years of age)
Development Expenditures: Education 2.6% of GDP Health 4.6% of GDP
Sources: WHO, UNICEF and other published international sources
4 State of the World’s Childre , : Children in an Urban World. Ne York, NY: U ited Natio s Childre ’s Fu d;
2012) Table 10, pp 126-128.
10
In the health sector, the CORE Group partners participated in a country-wide effort to eradicate polio through a strategy of full collaboration with the GOA, WHO, UNICEF and a host of private voluntary organizations (PVOs), as well as the Angolan Interagency Coordinating Committee (ICC). This agency helped focus efforts on improving polio immunization coverage in the metropolitan areas of Angola while supporting the military in raising coverage in the rural areas of Angola. This strategy resulted in the eradication of polio from Angola over a two and a half year period and supported a highly successful active surveillance network. The GOA Vice Minister for Health collaborated with the CORE Group (CGPP) from the beginning of that initial 2.5 year campaign. At that time the key PVO contributions were focused on reaching the most vulnerable, hard-to-reach, under-served areas and where possible combining their immunization programs with those of the national and global polio eradication program activities, thus strengthening both efforts.
After this initial success in polio eradication in Angola, the GOA, WHO, UNICEF and the CORE Group continued their effort, with various sources of funding, to address the high number of internally displaced persons amid very poor environmental hygiene conditions that contributed to the high rates of malnutrition, morbidity and mortality, particularly among children under five years of age. Unfortunately, wild polio virus (WPV) that had originated in India (as confirmed by genetic sequencing) was reintroduced into Angola in 2005 and the virus gained a foothold in areas with low polio immunization coverage. With the combined efforts of multiple PEI partners and more than 30 mass immunization campaigns, in August 2012 Angola celebrated an entire year with no new polio cases reported and was declared polio free.
The CORE Group Partners Project Polio Eradication Initiative had been working in Angola for several years when the 2007 follow-on USAID “CORE Group Polio Project” (CGPP) grant provided funds for five more years of activities. To support achievement of global and national PEI goals and objectives the FY08 CGPP grant included five key project objectives: Support PVO/NGO efforts to strengthen national and regional immunization systems to
achieve polio eradication through interventions that will increase the number of children <60 months of age who are fully protected by routine child immunizations and will strengthen local capacity to support routine immunization services
Support PVO/NGO involvement in national and regional planning and implementation of supplemental polio immunization with interventions that will increase oral polio vaccination coverage among children <60 months of age
Support PVO/NGO efforts to strengthen AFP case detection and reporting (and case detection of other infectious diseases)
Build effective partnerships between PVOs, NGOs and international, national, and regional agencies involved in polio, encouraging partnerships with local non-government and church-based organizations and actively participating in national Inter-agency Coordinating Committee meetings and other appropriate technical meetings at local, sub-national, national and regional levels
Support timely documentation and use of information to continuously improve the quality of polio eradication (and other health related activities)
11
This report documents progress made through USAID-funded CGPP activities, where possible comparing data from the most recent “final survey,” conducted in 2012 with data collected at the 2008 baseline and 2010 mid-term. The 2012 interviews, based on standardized questions, were conducted with immunization/polio eradication officers from UNICEF and WHO in Angola.
Achievements: A number of important advances have been achieved in the country and in the very high risk CGPP catchment areas during the life of the 2007 grant; and, although the CGPP partners cannot take sole credit for any of them, it is highly likely that the project interventions were important contributing factors:
1. On-going zero polio status with more than 12 consecutive months with no confirmed cases of polio
2. Improved routine immunization coverage for most antigens, especially the 3rd doses of oral polio and pentavalent vaccines
3. Improved polio vaccination campaign coverage (note that campaigns ended before the grant period ended)
4. The development of a strategic cadre of trained, committed community volunteers in high risk and border areas
5. Improvements in knowledge of AFP signs and appropriate responses among mothers who have heard of AFP
METHODOLOGY
The final evaluation survey in Angola, like the previous baseline and mid-term surveys, consisted of a quantitative household survey conducted in randomly selected, representative communities in each CGPP coverage area. Households were randomly selected in each community; eligible households were those with a mother or permanent caregiver of a child 12 to 23 months of age living in the same household. Since households were randomly selected, and assignment to a CGPP volontario was not a requirement, the households surveyed were not necessarily CGPP beneficiary households. A total of 454 mothers and their ‘index’ child aged 12 to 23 months were included in the survey. The survey instrument was based on the same survey instrument used at the baseline and mid-term assessments; however, given the iterative nature of the project in response to shifts in the wild poliovirus epidemiology in Angola and the eradication effort modifications to the instrument were made over time. In addition, the senior polio eradication/immunization officers of the UNICEF and WHO programs in Angola were interviewed using a structured questionnaire.
12
QUANTITATIVE HOUSEHOLD SURVEY FINDINGS
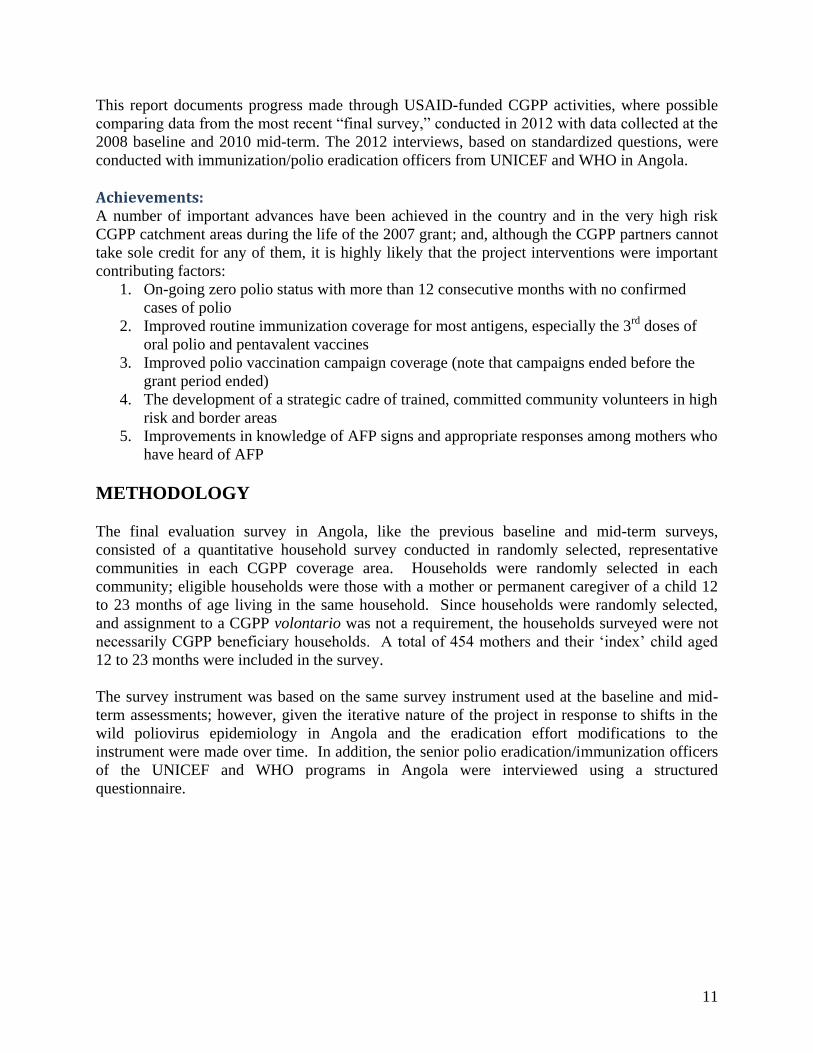
Demographic Data The mothers surveyed in Angola were relatively young, with more mothers in the 20-24 year age group than in any other group, particularly among final survey participants, as shown in Figure A-1.5 Of the mothers in the final survey, 55.1% were 20 to 29 years old and 24.7% were 30 to 39. Only 12.6% of mothers surveyed in the final evaluation were in the higher risk 15 to 19 year age group, down from 16% at the mid-term, although 3.5% were 45 or more years of age (compared to 2% at the mid-term). The mothers’ mean age remained consistent at 27 years. Figure A-1: Distribution of Mothers Surveyed by Survey and Age in Years
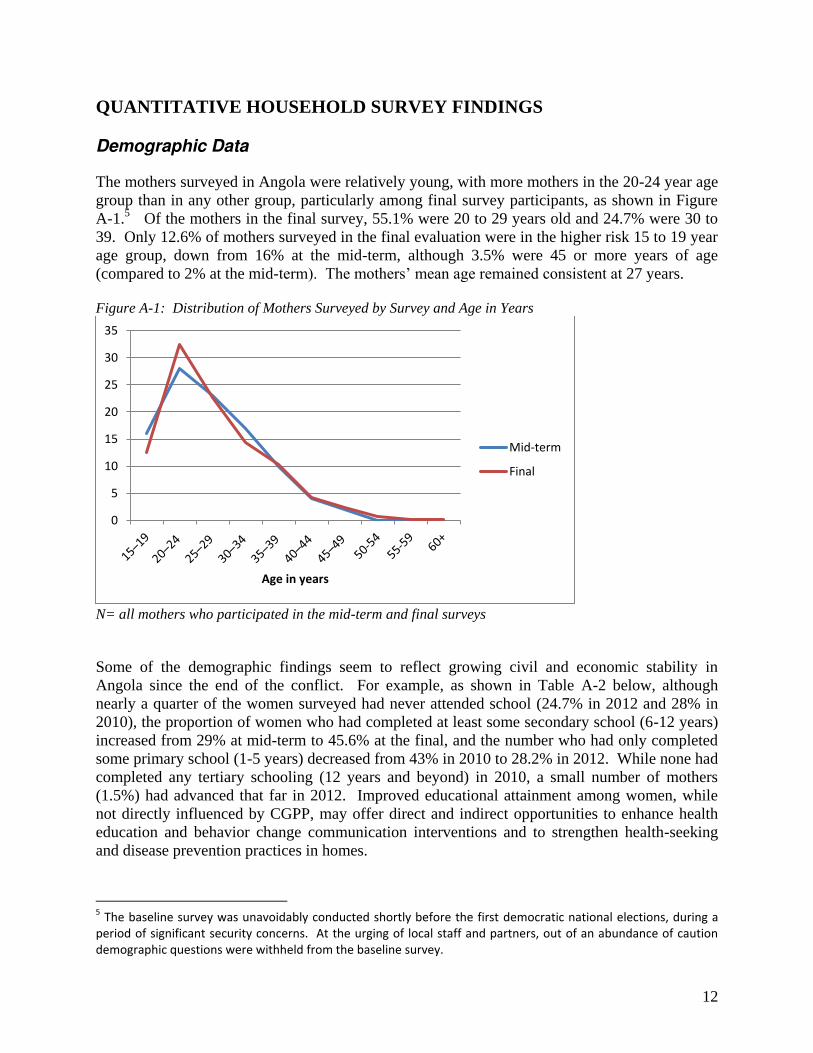
N= all mothers who participated in the mid-term and final surveys Some of the demographic findings seem to reflect growing civil and economic stability in Angola since the end of the conflict. For example, as shown in Table A-2 below, although nearly a quarter of the women surveyed had never attended school (24.7% in 2012 and 28% in 2010), the proportion of women who had completed at least some secondary school (6-12 years) increased from 29% at mid-term to 45.6% at the final, and the number who had only completed some primary school (1-5 years) decreased from 43% in 2010 to 28.2% in 2012. While none had completed any tertiary schooling (12 years and beyond) in 2010, a small number of mothers (1.5%) had advanced that far in 2012. Improved educational attainment among women, while not directly influenced by CGPP, may offer direct and indirect opportunities to enhance health education and behavior change communication interventions and to strengthen health-seeking and disease prevention practices in homes.
5 The baseline survey was unavoidably conducted shortly before the first democratic national elections, during a
period of significant security concerns. At the urging of local staff and partners, out of an abundance of caution
demographic questions were withheld from the baseline survey.
0
5
10
15
20
25
30
35
Age in years
Mid-term
Final
13
Table A-2: Mothers’ School Attainment
Baseline
(%) Mid-term
(%) Final (%)
Ever attended school not asked 72 75.3
Primary (1- 5 years) Not asked 43 28.2
Secondary (6-12 years) Not asked 29 45.6
Tertiary (12 years and above) Not asked 0 1.5
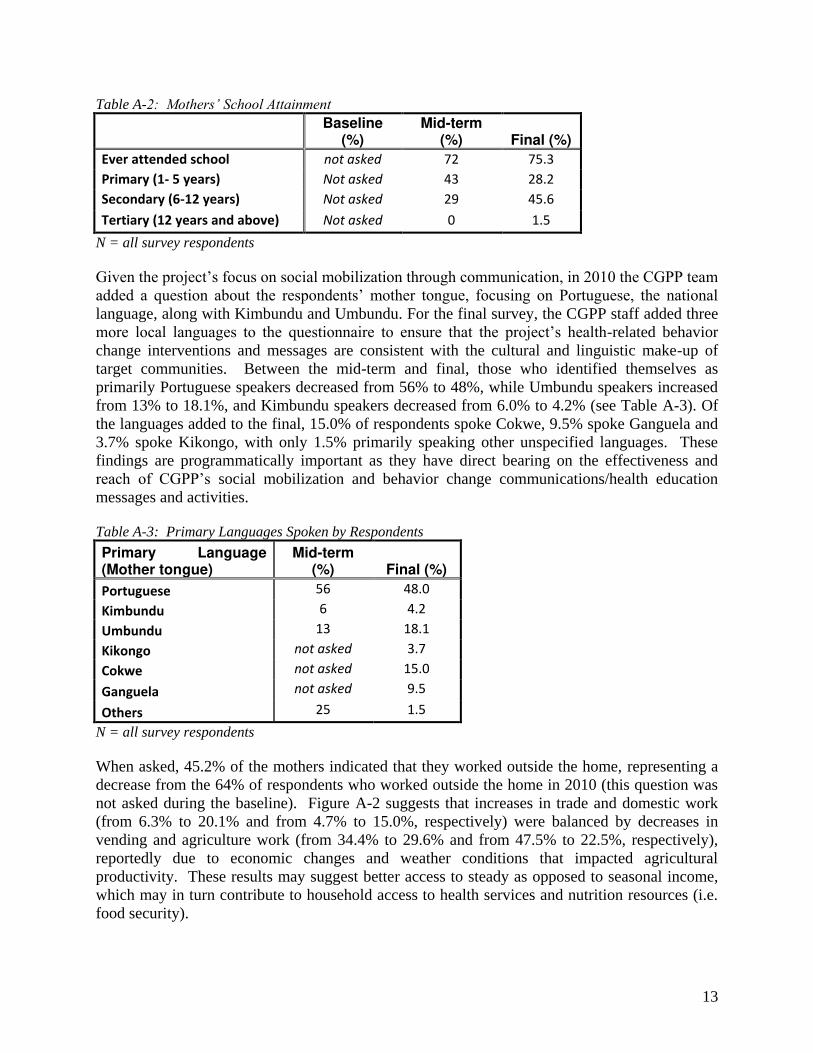
N = all survey respondents Given the project’s focus on social mobilization through communication, in 2010 the CGPP team added a question about the respondents’ mother tongue, focusing on Portuguese, the national language, along with Kimbundu and Umbundu. For the final survey, the CGPP staff added three more local languages to the questionnaire to ensure that the project’s health-related behavior change interventions and messages are consistent with the cultural and linguistic make-up of target communities. Between the mid-term and final, those who identified themselves as primarily Portuguese speakers decreased from 56% to 48%, while Umbundu speakers increased from 13% to 18.1%, and Kimbundu speakers decreased from 6.0% to 4.2% (see Table A-3). Of the languages added to the final, 15.0% of respondents spoke Cokwe, 9.5% spoke Ganguela and 3.7% spoke Kikongo, with only 1.5% primarily speaking other unspecified languages. These findings are programmatically important as they have direct bearing on the effectiveness and reach of CGPP’s social mobilization and behavior change communications/health education messages and activities. Table A-3: Primary Languages Spoken by Respondents
Primary Language (Mother tongue)
Mid-term (%) Final (%)
Portuguese 56 48.0
Kimbundu 6 4.2
Umbundu 13 18.1
Kikongo not asked 3.7
Cokwe not asked 15.0
Ganguela not asked 9.5
Others 25 1.5
N = all survey respondents When asked, 45.2% of the mothers indicated that they worked outside the home, representing a decrease from the 64% of respondents who worked outside the home in 2010 (this question was not asked during the baseline). Figure A-2 suggests that increases in trade and domestic work (from 6.3% to 20.1% and from 4.7% to 15.0%, respectively) were balanced by decreases in vending and agriculture work (from 34.4% to 29.6% and from 47.5% to 22.5%, respectively), reportedly due to economic changes and weather conditions that impacted agricultural productivity. These results may suggest better access to steady as opposed to seasonal income, which may in turn contribute to household access to health services and nutrition resources (i.e. food security).

14
Figure A-2: Distribution of Surveyed Mothers Who Work Outside of Their Homes by Survey and Type of Work
* Denominator = only mid-term and final survey respondents who work outside of their homes; M: 45.2%; F: 64% Regarding child care, the final survey indicates that the percentage of mothers who rely on their older children to care for the younger ones decreased from 49% at the mid-term to 38.3% at the final (Table A-4). More mothers rely on their own mothers to care for their young children (increased from 27% at the mid-term to 35.7% at the final). In both the mid-term and final surveys, less than 10% of respondents indicated that they rely on their mothers-in-law for child care, and less than 5% rely on their husbands/partners or neighbors/friends. Childcare choices suggest more of a reliance on responsible persons rather than familial obligations. While the recorded changes are small, they are important in a culture where the extended family is linked to all aspects of human relationships and family responsibilities are directly linked to age and position in the extended family. Decreases in older siblings’ involvement in child care may be related to increased opportunities for children to remain in school. Table A- 4: Primary Sources of Child Care
Child Caretakers Baseline
(%) Mid-term
(%) Final (%)
Respondent's mother not asked 27 35.7
Respondent's mother-in-law not asked 9 8.6
Husband/partner not asked 4 4.8
Older children not asked 49 38.3
Neighbors/friends not asked 4 3.7
Other not asked 8 8.8
N = all survey respondents
6.3 4.7
34.4
47.5
6.3
20.1
15
29.6
22.5
12.6
0
5
10
15
20
25
30
35
40
45
50
Trade Domestic Vendor Agricultural Other
Mid-term (%)
Final (%)
15
Immunization Coverage
While the CGPP is primarily focused on contributing to polio eradication, the project strategy included promoting and improving routine immunization coverage. In Angola during the period of CGPP implementation under evaluation, the national routine immunization schedule included one dose of BCG, three doses of the pentavalent [Penta] vaccine, and one dose of measles as well as at least four doses of OPV (including the birth or “polio zero” dose) within the first 12 months of life. The final survey in Angola drew data directly from child immunization cards whenever the surveyed mothers were able to provide the cards for examination, along with information the mothers provided based on their recall as to whether or not their children had received each of the vaccinations described by the data collectors. At the time of the final evaluation, 47.8% of mothers surveyed were able to show the data collector a vaccination card for their child. Relatively speaking this is a high percentage and the CGPP should be congratulated for its contributions to vaccination card retention among families in this particularly challenging environment.
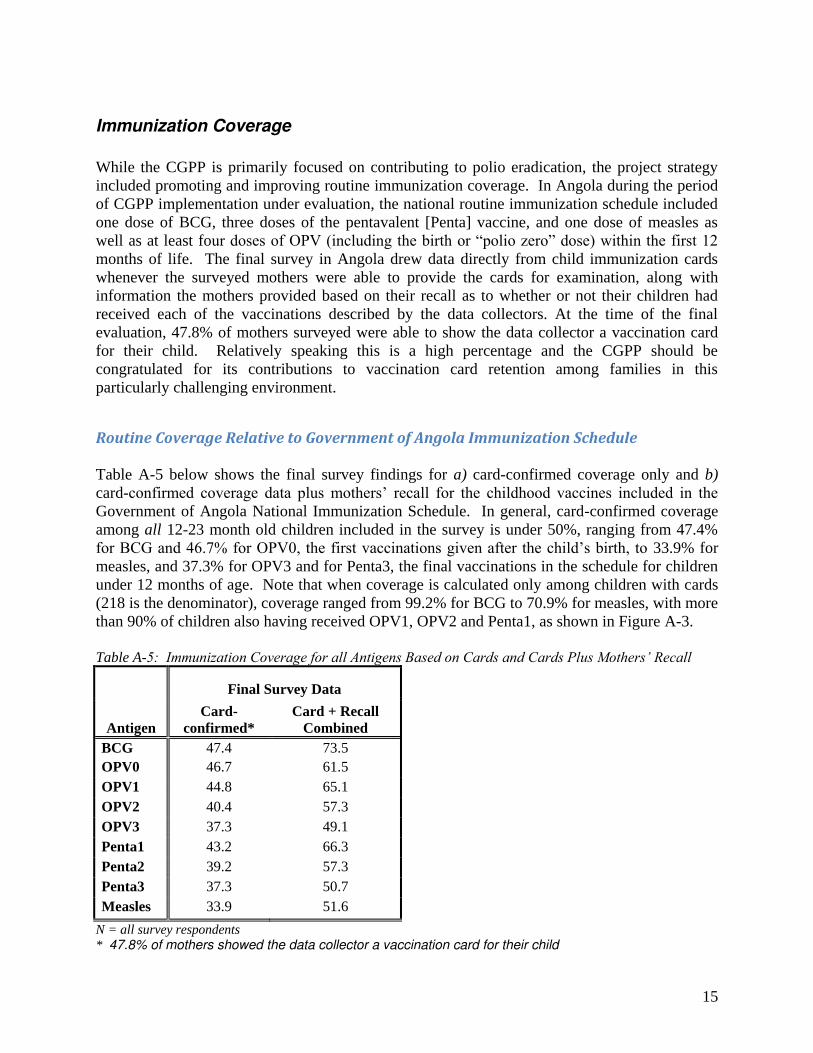
Routine Coverage Relative to Government of Angola Immunization Schedule Table A-5 below shows the final survey findings for a) card-confirmed coverage only and b) card-confirmed coverage data plus mothers’ recall for the childhood vaccines included in the Government of Angola National Immunization Schedule. In general, card-confirmed coverage among all 12-23 month old children included in the survey is under 50%, ranging from 47.4% for BCG and 46.7% for OPV0, the first vaccinations given after the child’s birth, to 33.9% for measles, and 37.3% for OPV3 and for Penta3, the final vaccinations in the schedule for children under 12 months of age. Note that when coverage is calculated only among children with cards (218 is the denominator), coverage ranged from 99.2% for BCG to 70.9% for measles, with more than 90% of children also having received OPV1, OPV2 and Penta1, as shown in Figure A-3. Table A-5: Immunization Coverage for all Antigens Based on Cards and Cards Plus Mothers’ Recall
Antigen
Final Survey Data
Card-confirmed*
Card + Recall Combined
BCG 47.4 73.5 OPV0 46.7 61.5 OPV1 44.8 65.1 OPV2 40.4 57.3 OPV3 37.3 49.1 Penta1 43.2 66.3 Penta2 39.2 57.3 Penta3 37.3 50.7 Measles 33.9 51.6
N = all survey respondents * 47.8% of mothers showed the data collector a vaccination card for their child

16
When cards and mothers’ recall data are combined, BCG coverage reaches 73.5%, while only about half of the children were reported to have received measles (51.6%), OPV3 (49.1%) and Penta3 (50.7%). Looking at card-confirmed coverage, the data shows that slightly more children received OPV0 than OPV1 (46.7% and 44.8%, respectively) while the combined card and recall data shows the opposite, with fewer children receiving the OPV0 birth dose (61.5%) than the later OPV1 dose (65.1%). With this exception (which is small and may be due to mothers’ misunderstandings regarding the two doses) there is a significant level of drop-out from one dose to the next in the series of both OPV and the pentavalent vaccine based on both card only and card plus recall data. Figure A-3: Card-confirmed immunization coverage among 12-23 month old children of mothers who participated in the final survey among only children with cards (N=217) and among all children (N=454)
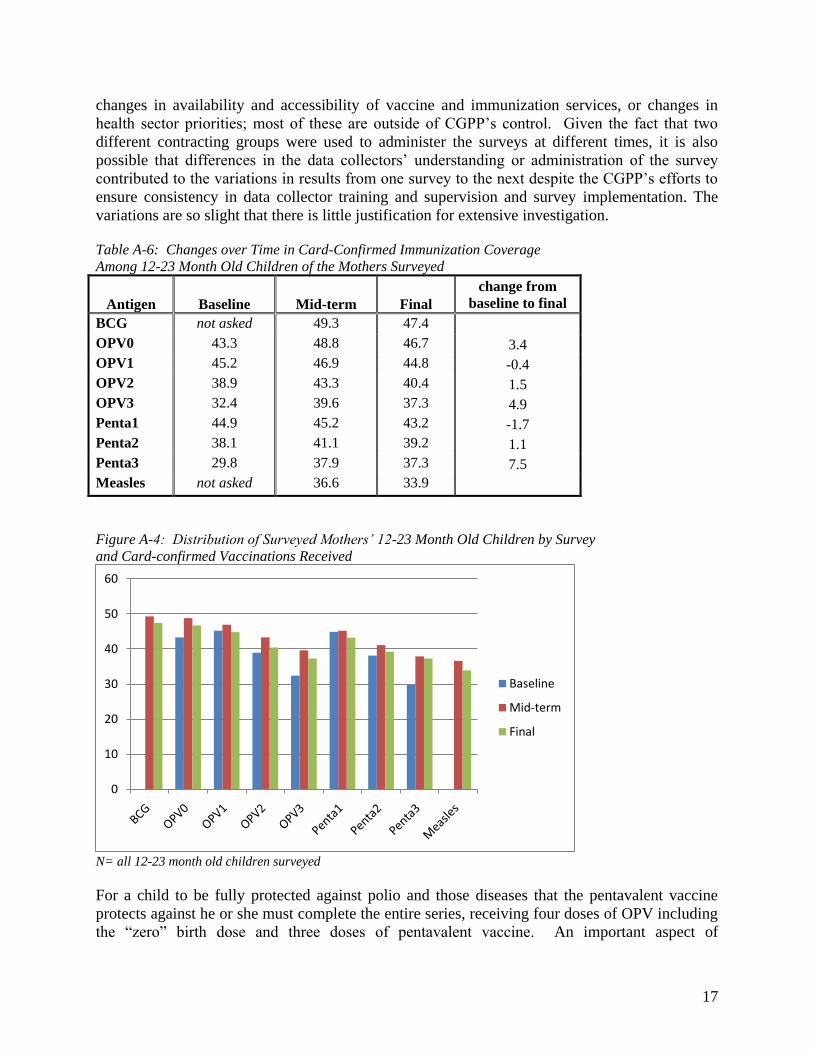
N = all final survey respondents Table A-5 also indicates that as confirmed by card alone, 47.4% of children were immunized with BCG vaccine; when mothers’ recall was added the coverage increased to 73.0%. Looking at cards only, 46.7% of children received OPV-0; this increased to 61.5% when mothers’ recall was included. Only 37.3% received the third dose of polio vaccine as verified by card alone; coverage with OPV-3 increased to 49.1% when history was added. The same patterns between card confirmed and history by recall apply for other antigens. Where and when three sampling time frames were measured, coverage for each antigen improved between the baseline and mid-term, as shown in Table A-6 and Figure A-4, and although there were slight declines (approximately 2% for most antigens) between the mid-term and final, nonetheless some improvement in coverage was maintained for all antigens but OPV1 and Penta1 (no baseline data is available for comparison for BCG or measles). In particular, between the baseline and the final surveys in CGPP catchment areas OPV3 coverage improved by nearly 5% and Penta 3 coverage improved by 7.5%. The declines that were observed could reflect a range of factors including CGPP expansion into more high-risk, underserved areas,
0
20
40
60
80
100
120
N=454
N=217
17
changes in availability and accessibility of vaccine and immunization services, or changes in health sector priorities; most of these are outside of CGPP’s control. Given the fact that two different contracting groups were used to administer the surveys at different times, it is also possible that differences in the data collectors’ understanding or administration of the survey contributed to the variations in results from one survey to the next despite the CGPP’s efforts to ensure consistency in data collector training and supervision and survey implementation. The variations are so slight that there is little justification for extensive investigation. Table A-6: Changes over Time in Card-Confirmed Immunization Coverage Among 12-23 Month Old Children of the Mothers Surveyed
Antigen Baseline Mid-term Final change from
baseline to final BCG not asked 49.3 47.4 OPV0 43.3 48.8 46.7 3.4 OPV1 45.2 46.9 44.8 -0.4 OPV2 38.9 43.3 40.4 1.5 OPV3 32.4 39.6 37.3 4.9 Penta1 44.9 45.2 43.2 -1.7 Penta2 38.1 41.1 39.2 1.1 Penta3 29.8 37.9 37.3 7.5 Measles not asked 36.6 33.9
Figure A-4: Distribution of Surveyed Mothers’ 12-23 Month Old Children by Survey and Card-confirmed Vaccinations Received
N= all 12-23 month old children surveyed For a child to be fully protected against polio and those diseases that the pentavalent vaccine protects against he or she must complete the entire series, receiving four doses of OPV including the “zero” birth dose and three doses of pentavalent vaccine. An important aspect of
0
10
20
30
40
50
60
Baseline
Mid-term
Final
18
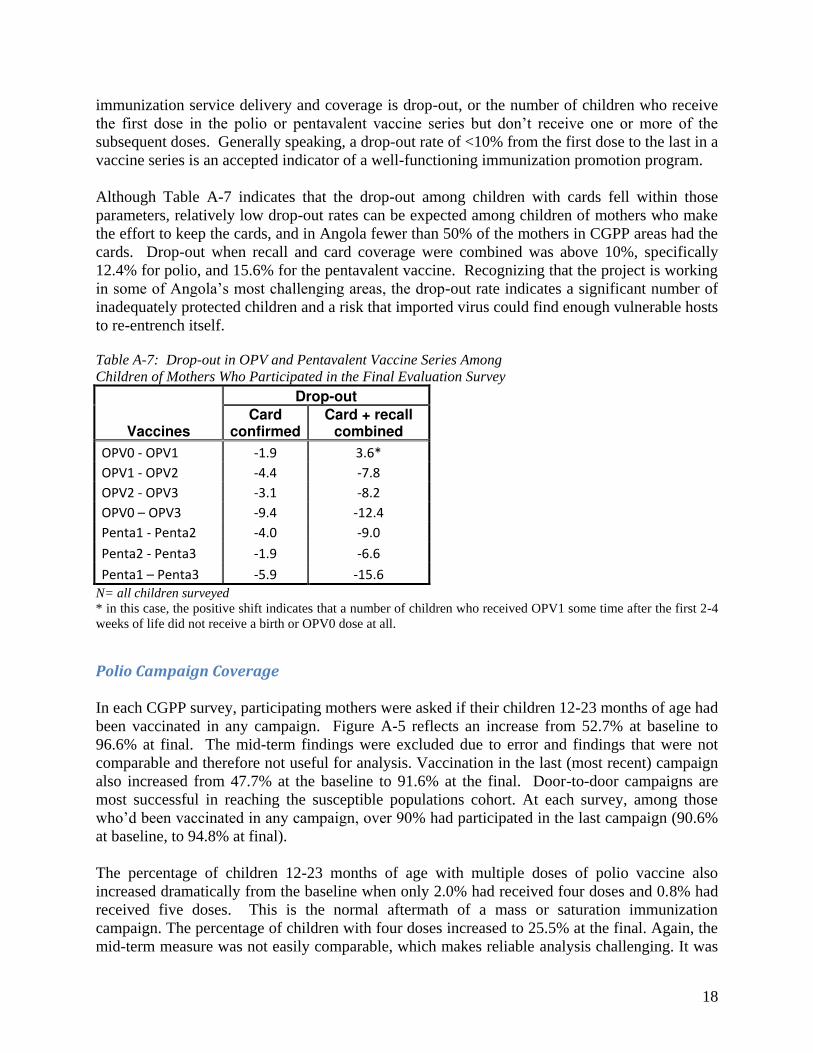
immunization service delivery and coverage is drop-out, or the number of children who receive the first dose in the polio or pentavalent vaccine series but don’t receive one or more of the subsequent doses. Generally speaking, a drop-out rate of <10% from the first dose to the last in a vaccine series is an accepted indicator of a well-functioning immunization promotion program. Although Table A-7 indicates that the drop-out among children with cards fell within those parameters, relatively low drop-out rates can be expected among children of mothers who make the effort to keep the cards, and in Angola fewer than 50% of the mothers in CGPP areas had the cards. Drop-out when recall and card coverage were combined was above 10%, specifically 12.4% for polio, and 15.6% for the pentavalent vaccine. Recognizing that the project is working in some of Angola’s most challenging areas, the drop-out rate indicates a significant number of inadequately protected children and a risk that imported virus could find enough vulnerable hosts to re-entrench itself. Table A-7: Drop-out in OPV and Pentavalent Vaccine Series Among Children of Mothers Who Participated in the Final Evaluation Survey
Vaccines
Drop-out
Card confirmed
Card + recall combined
OPV0 - OPV1 -1.9 3.6*
OPV1 - OPV2 -4.4 -7.8
OPV2 - OPV3 -3.1 -8.2
OPV0 – OPV3 -9.4 -12.4
Penta1 - Penta2 -4.0 -9.0
Penta2 - Penta3 -1.9 -6.6
Penta1 – Penta3 -5.9 -15.6
N= all children surveyed * in this case, the positive shift indicates that a number of children who received OPV1 some time after the first 2-4 weeks of life did not receive a birth or OPV0 dose at all.
Polio Campaign Coverage
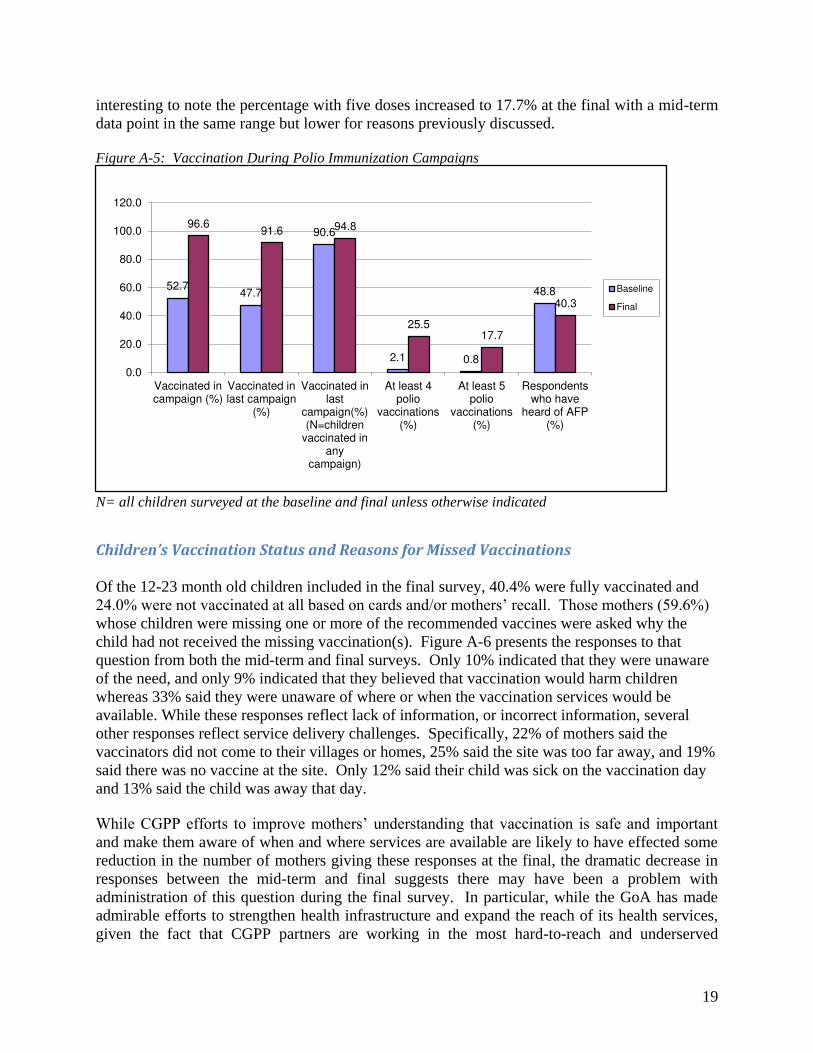
In each CGPP survey, participating mothers were asked if their children 12-23 months of age had been vaccinated in any campaign. Figure A-5 reflects an increase from 52.7% at baseline to 96.6% at final. The mid-term findings were excluded due to error and findings that were not comparable and therefore not useful for analysis. Vaccination in the last (most recent) campaign also increased from 47.7% at the baseline to 91.6% at the final. Door-to-door campaigns are most successful in reaching the susceptible populations cohort. At each survey, among those who’d been vaccinated in any campaign, over 90% had participated in the last campaign (90.6% at baseline, to 94.8% at final). The percentage of children 12-23 months of age with multiple doses of polio vaccine also increased dramatically from the baseline when only 2.0% had received four doses and 0.8% had received five doses. This is the normal aftermath of a mass or saturation immunization campaign. The percentage of children with four doses increased to 25.5% at the final. Again, the mid-term measure was not easily comparable, which makes reliable analysis challenging. It was
19
interesting to note the percentage with five doses increased to 17.7% at the final with a mid-term data point in the same range but lower for reasons previously discussed. Figure A-5: Vaccination During Polio Immunization Campaigns
N= all children surveyed at the baseline and final unless otherwise indicated
Children’s Vaccination Status and Reasons for Missed Vaccinations
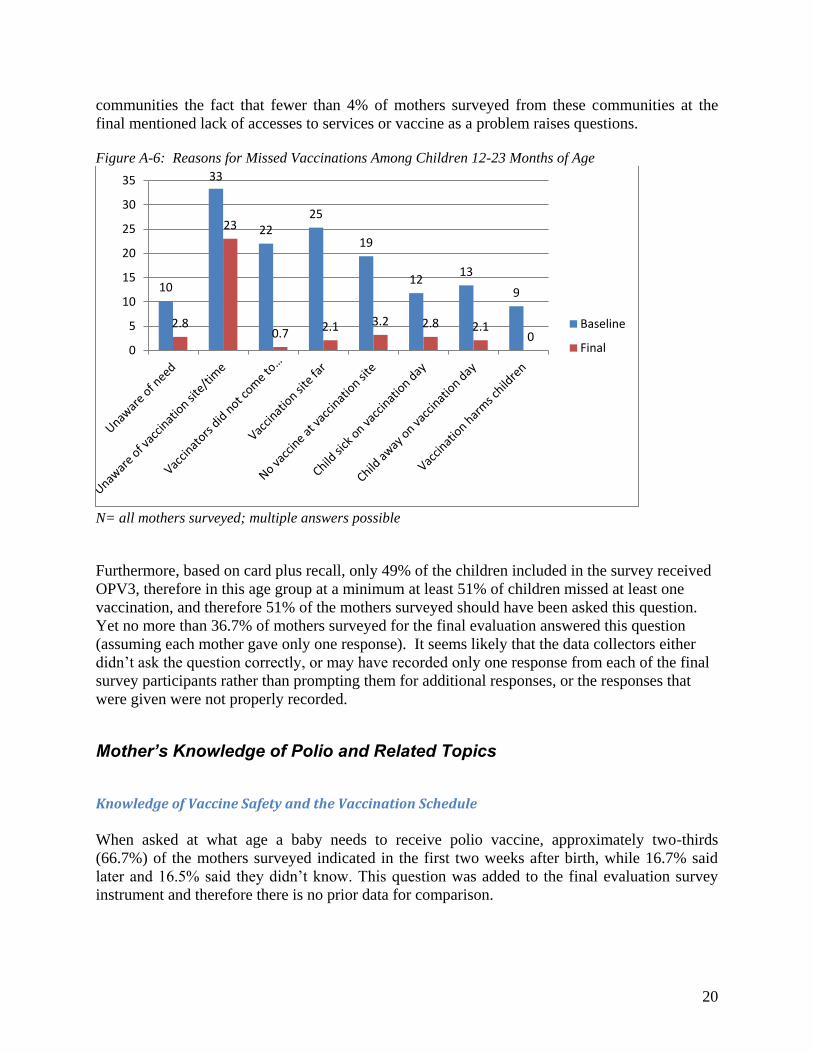
Of the 12-23 month old children included in the final survey, 40.4% were fully vaccinated and 24.0% were not vaccinated at all based on cards and/or mothers’ recall. Those mothers (59.6%) whose children were missing one or more of the recommended vaccines were asked why the child had not received the missing vaccination(s). Figure A-6 presents the responses to that question from both the mid-term and final surveys. Only 10% indicated that they were unaware of the need, and only 9% indicated that they believed that vaccination would harm children whereas 33% said they were unaware of where or when the vaccination services would be available. While these responses reflect lack of information, or incorrect information, several other responses reflect service delivery challenges. Specifically, 22% of mothers said the vaccinators did not come to their villages or homes, 25% said the site was too far away, and 19% said there was no vaccine at the site. Only 12% said their child was sick on the vaccination day and 13% said the child was away that day. While CGPP efforts to improve mothers’ understanding that vaccination is safe and important and make them aware of when and where services are available are likely to have effected some reduction in the number of mothers giving these responses at the final, the dramatic decrease in responses between the mid-term and final suggests there may have been a problem with administration of this question during the final survey. In particular, while the GoA has made admirable efforts to strengthen health infrastructure and expand the reach of its health services, given the fact that CGPP partners are working in the most hard-to-reach and underserved
52.7 47.7
90.6
2.1 0.8
48.8
96.6 91.6 94.8
25.5 17.7
40.3
0.0
20.0
40.0
60.0
80.0
100.0
120.0
Vaccinated incampaign (%)
Vaccinated inlast campaign
(%)
Vaccinated inlast
campaign(%)(N=children
vaccinated inany
campaign)
At least 4polio
vaccinations(%)
At least 5polio
vaccinations(%)
Respondentswho have
heard of AFP(%)
Baseline
Final
20
communities the fact that fewer than 4% of mothers surveyed from these communities at the final mentioned lack of accesses to services or vaccine as a problem raises questions. Figure A-6: Reasons for Missed Vaccinations Among Children 12-23 Months of Age
N= all mothers surveyed; multiple answers possible Furthermore, based on card plus recall, only 49% of the children included in the survey received OPV3, therefore in this age group at a minimum at least 51% of children missed at least one vaccination, and therefore 51% of the mothers surveyed should have been asked this question. Yet no more than 36.7% of mothers surveyed for the final evaluation answered this question (assuming each mother gave only one response). It seems likely that the data collectors either didn’t ask the question correctly, or may have recorded only one response from each of the final survey participants rather than prompting them for additional responses, or the responses that were given were not properly recorded.
Mother’s Knowledge of Polio and Related Topics
Knowledge of Vaccine Safety and the Vaccination Schedule
When asked at what age a baby needs to receive polio vaccine, approximately two-thirds (66.7%) of the mothers surveyed indicated in the first two weeks after birth, while 16.7% said later and 16.5% said they didn’t know. This question was added to the final evaluation survey instrument and therefore there is no prior data for comparison.
10
33
22
25
19
12 13
9
2.8
23
0.7 2.1 3.2 2.8 2.1
0 0
5
10
15
20
25
30
35
Baseline
Final

21
Only 17.4% of the respondents believed that there are some children who should not be vaccinated or might be hurt by polio vaccination compared to 33.2% at the baseline. Table A-8 below also indicates that an additional 10.4% indicated that they did not know if some children should not be vaccinated or might be hurt by polio vaccine compared to 8.1% at the baseline. Table A-8: Mothers’ Who Believe Polio Vaccine Could Be Harmful to Some Children
Respondents’ Beliefs About Polio Vaccine Baseline
(%) Final (%) % of respondents who believe there are some children who should not be vaccinated or might be hurt by polio vaccination 33.2 17.4 % of respondents who don’t know if some children should not be vaccinated or might be hurt by polio vaccination 8.1 10.4 N= all mothers surveyed at the baseline and at the final Among those who believe that there are children who should not be vaccinated or could be harmed by polio vaccination, Figure A-7 indicates that half (50.7%) believe that newborns in particular should not be vaccinated or could be harmed, although it is important to note that these women represent only 17.4% of all mothers surveyed. Figure A-7: Mothers’ Beliefs Regarding Which Children Should Not Be Vaccinated
N= Mothers who believe some children should not be vaccinated or might be hurt by polio vaccine (B=150; F=79) Although not as dramatic, concern about vaccinating sick and physically handicapped children also increased from 14.2% and 5.5% respectively at the baseline to 34.2% and 9.6%, respectively at the final. The number of women who indicated that there were ‘other’ children who should not be vaccinated decreased dramatically from 70% at baseline to 5.5% (less than 5 women) at the final. It should be noted, again, that the baseline and final survey data represent just 33.2% and 17.4% of all of mothers surveyed, respectively. Furthermore, it is possible that some of the
9.4 14.2
5.5
70.0
50.7
34.2
9.6 5.5
0.0
10.0
20.0
30.0
40.0
50.0
60.0
70.0
80.0
Newborns Sick children Physicallyhandicapped
children
Other (specify)
Baseline
Final
22
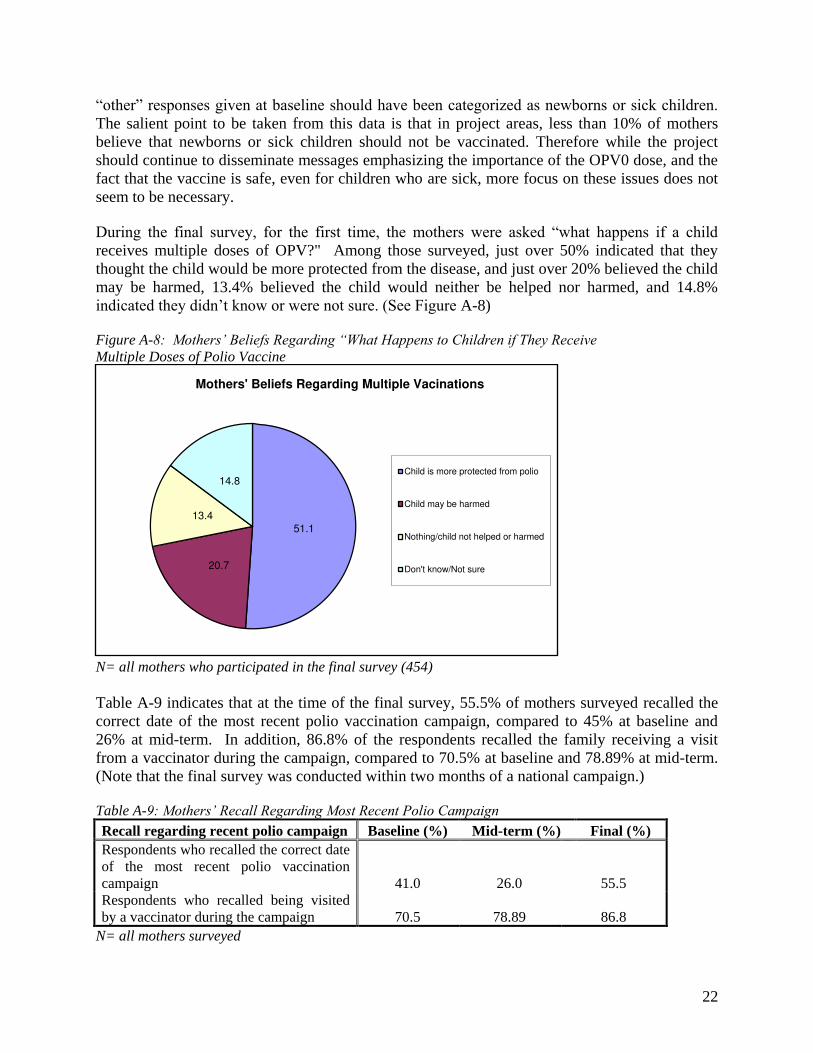
“other” responses given at baseline should have been categorized as newborns or sick children. The salient point to be taken from this data is that in project areas, less than 10% of mothers believe that newborns or sick children should not be vaccinated. Therefore while the project should continue to disseminate messages emphasizing the importance of the OPV0 dose, and the fact that the vaccine is safe, even for children who are sick, more focus on these issues does not seem to be necessary. During the final survey, for the first time, the mothers were asked “what happens if a child receives multiple doses of OPV?" Among those surveyed, just over 50% indicated that they thought the child would be more protected from the disease, and just over 20% believed the child may be harmed, 13.4% believed the child would neither be helped nor harmed, and 14.8% indicated they didn’t know or were not sure. (See Figure A-8) Figure A-8: Mothers’ Beliefs Regarding “What Happens to Children if They Receive Multiple Doses of Polio Vaccine
N= all mothers who participated in the final survey (454) Table A-9 indicates that at the time of the final survey, 55.5% of mothers surveyed recalled the correct date of the most recent polio vaccination campaign, compared to 45% at baseline and 26% at mid-term. In addition, 86.8% of the respondents recalled the family receiving a visit from a vaccinator during the campaign, compared to 70.5% at baseline and 78.89% at mid-term. (Note that the final survey was conducted within two months of a national campaign.) Table A-9: Mothers’ Recall Regarding Most Recent Polio Campaign
Recall regarding recent polio campaign Baseline (%) Mid -term (%) Final (%) Respondents who recalled the correct date of the most recent polio vaccination campaign 41.0 26.0 55.5 Respondents who recalled being visited by a vaccinator during the campaign 70.5 78.89 86.8
N= all mothers surveyed
51.1
20.7
13.4
14.8
Mothers' Beliefs Regarding Multiple Vacinations
Child is more protected from polio
Child may be harmed
Nothing/child not helped or harmed
Don't know/Not sure
23
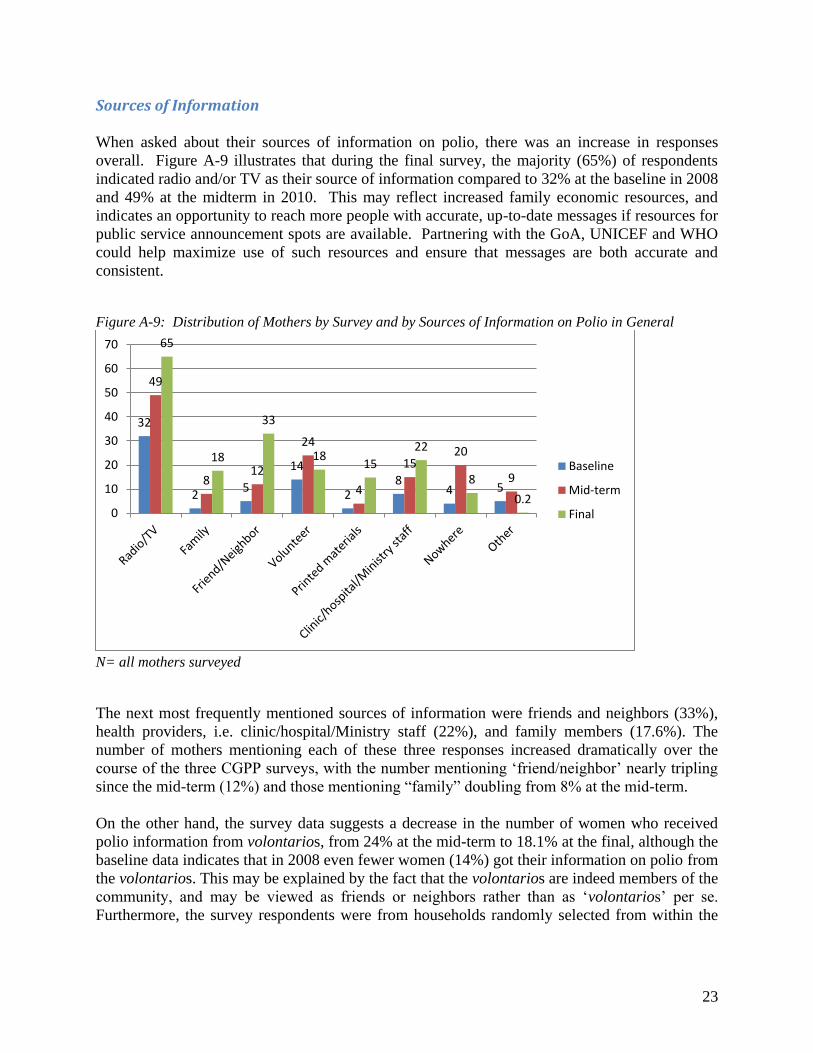
Sources of Information When asked about their sources of information on polio, there was an increase in responses overall. Figure A-9 illustrates that during the final survey, the majority (65%) of respondents indicated radio and/or TV as their source of information compared to 32% at the baseline in 2008 and 49% at the midterm in 2010. This may reflect increased family economic resources, and indicates an opportunity to reach more people with accurate, up-to-date messages if resources for public service announcement spots are available. Partnering with the GoA, UNICEF and WHO could help maximize use of such resources and ensure that messages are both accurate and consistent. Figure A-9: Distribution of Mothers by Survey and by Sources of Information on Polio in General
N= all mothers surveyed The next most frequently mentioned sources of information were friends and neighbors (33%), health providers, i.e. clinic/hospital/Ministry staff (22%), and family members (17.6%). The number of mothers mentioning each of these three responses increased dramatically over the course of the three CGPP surveys, with the number mentioning ‘friend/neighbor’ nearly tripling since the mid-term (12%) and those mentioning “family” doubling from 8% at the mid-term. On the other hand, the survey data suggests a decrease in the number of women who received polio information from volontarios, from 24% at the mid-term to 18.1% at the final, although the baseline data indicates that in 2008 even fewer women (14%) got their information on polio from the volontarios. This may be explained by the fact that the volontarios are indeed members of the community, and may be viewed as friends or neighbors rather than as ‘volontarios’ per se. Furthermore, the survey respondents were from households randomly selected from within the
32
2 5
14
2 8
4 5
49
8 12
24
4
15 20
9
65
18
33
18 15
22
8
0.2 0
10
20
30
40
50
60
70
Baseline
Mid-term
Final
24
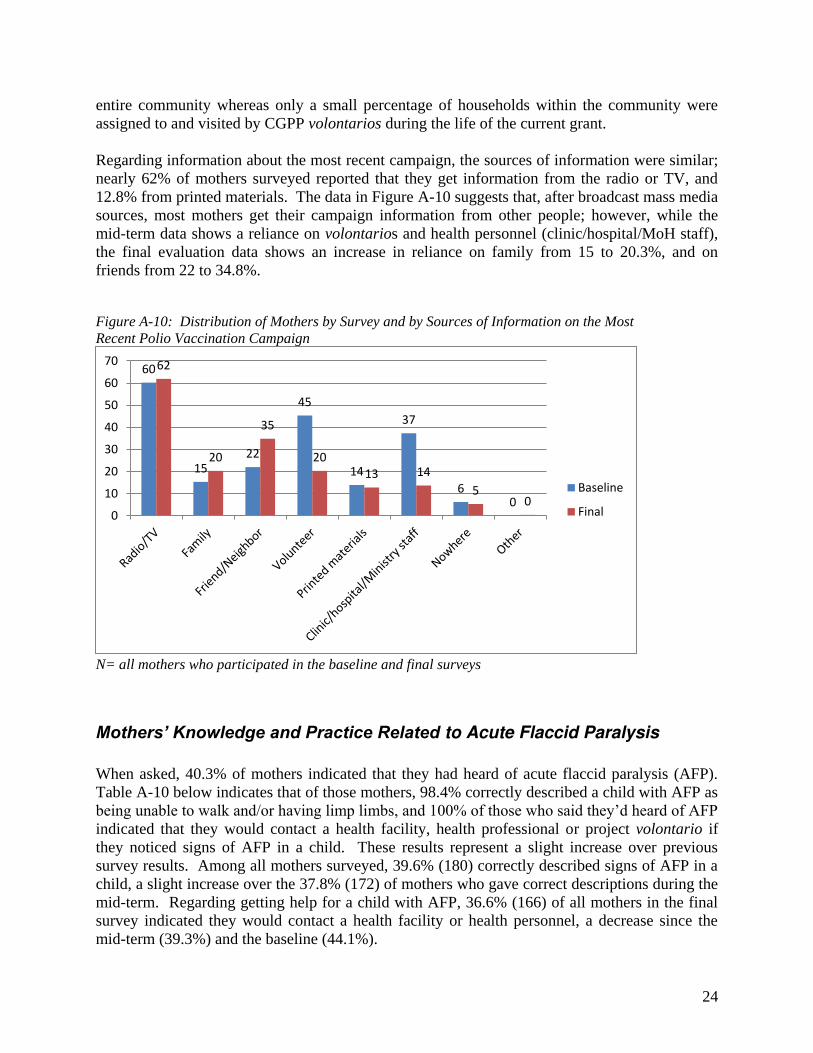
entire community whereas only a small percentage of households within the community were assigned to and visited by CGPP volontarios during the life of the current grant. Regarding information about the most recent campaign, the sources of information were similar; nearly 62% of mothers surveyed reported that they get information from the radio or TV, and 12.8% from printed materials. The data in Figure A-10 suggests that, after broadcast mass media sources, most mothers get their campaign information from other people; however, while the mid-term data shows a reliance on volontarios and health personnel (clinic/hospital/MoH staff), the final evaluation data shows an increase in reliance on family from 15 to 20.3%, and on friends from 22 to 34.8%. Figure A-10: Distribution of Mothers by Survey and by Sources of Information on the Most Recent Polio Vaccination Campaign
N= all mothers who participated in the baseline and final surveys
Mothers’ Knowledge and Practice Related to Acute Flaccid Paralysis
When asked, 40.3% of mothers indicated that they had heard of acute flaccid paralysis (AFP). Table A-10 below indicates that of those mothers, 98.4% correctly described a child with AFP as being unable to walk and/or having limp limbs, and 100% of those who said they’d heard of AFP indicated that they would contact a health facility, health professional or project volontario if they noticed signs of AFP in a child. These results represent a slight increase over previous survey results. Among all mothers surveyed, 39.6% (180) correctly described signs of AFP in a child, a slight increase over the 37.8% (172) of mothers who gave correct descriptions during the mid-term. Regarding getting help for a child with AFP, 36.6% (166) of all mothers in the final survey indicated they would contact a health facility or health personnel, a decrease since the mid-term (39.3%) and the baseline (44.1%).
60
15 22
45
14
37
6 0
62
20
35
20
13 14
5 0
0
10
20
30
40
50
60
70
Baseline
Final

25
Although the data shows overall decreases in the population’s awareness of AFP and knowledge of AFP signs and appropriate responses, Table A-10 also reflects the fact that among mothers who had heard of AFP, 98.4% mentioned at least one sign of AFP (up from 94.4% at the mid-term), and 100% indicated they would contact a health facility, health professional or volontario if they identified a child with AFP signs (up from 90.4% at baseline). Key informants and CGPP secretariat staff indicated that in CGPP areas, the project volontarios are the only actors conducting awareness-raising and education on AFP at the community and household level, suggesting that the CGPP volontario’s AFP education is remarkably effective among the mothers they are able to reach. Table A-10: Mothers’ Knowledge and Practices Related to AFP
AFP knowledge and practice Baseline
(%) Mid -term
(%) Final (%)
Respondents who have heard of AFP 48.8 40.0 40.3
Respondents who say a child with AFP will not be able to walk and/or will have limp limbs (denominator: all respondents)
Not asked 37.8 39.6
Respondents who say a child with AFP will not be able to walk and/or will have limp limbs (denominator: all respondents who have heard of AFP)
Not asked 94.4 98.4
Respondents who would contact a health facility, health professional, or project volontario if they noticed signs of AFP in a child (denominator: all respondents)
44.1 39.3 36.6
Percent of respondents who would contact a health facility, health professional, or project volontario if they noticed signs of AFP in a child (denominator: all respondents who have heard of AFP)
90.4 98.3 100
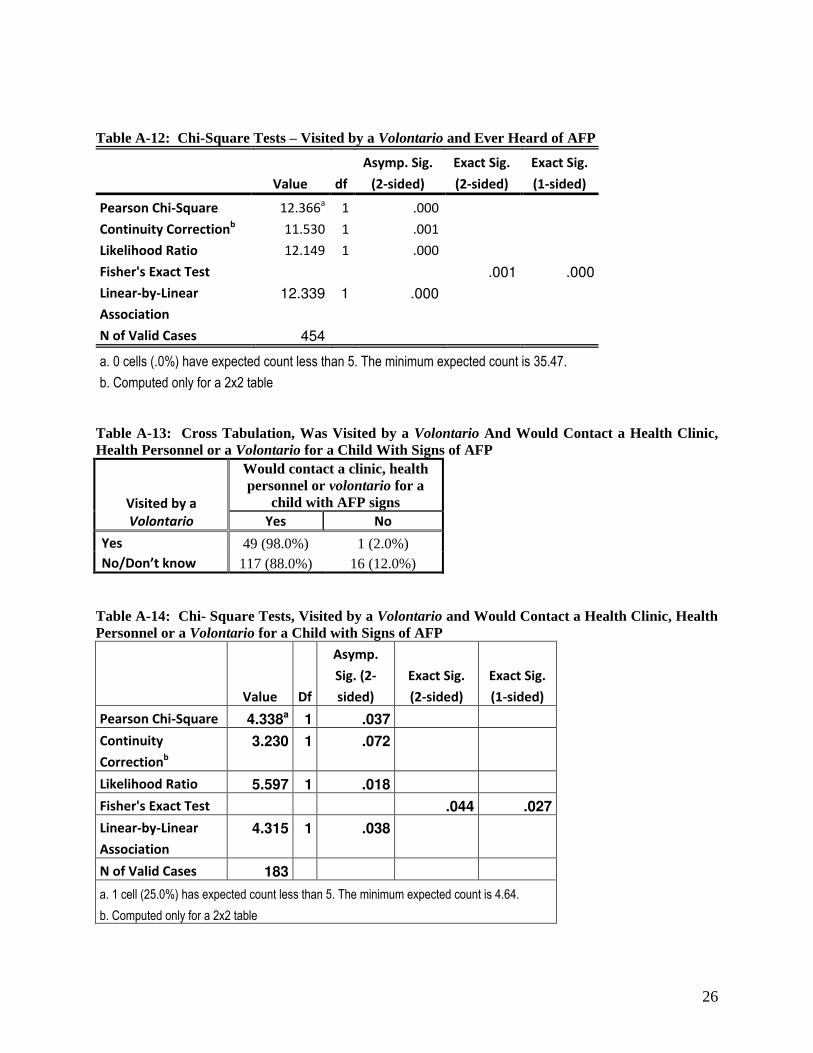
N= all mothers surveyed, except where stated otherwise As shown in Tables A-11 through A-16 below, cross tab and chi-square analyses of the AFP question data indicates a significant relationship (< .01) between either having been visited by a volontario or having attended a health education session conducted by a volontario and having heard of AFP, suggesting that the volontarios are doing an outstanding job educating the mothers that they are able to reach regarding AFP. Given Angola’s history of imported virus leading to re-established polio circulation, and current pre-certification status, robust AFP surveillance involving every family in every community, preferably with active surveillance, is paramount. Securing and investing additional resources in expanding the volontarios’ reach to educate more women on AFP could make invaluable contributions to polio eradication. Table A-11: Cross Tab Comparison – Visited by a Volontario and Ever Heard of AFP
Visited by a
Volontario
Ever Heard of AFP
Yes No/Don’t Know
Yes 50 (56.8%) 38 (43.2%)
No/Don’t know 133 (36.3%) 233 (63.7%)
26
Table A-12: Chi-Square Tests – Visited by a Volontario and Ever Heard of AFP
Value df
Asymp. Sig.
(2-sided)
Exact Sig.
(2-sided)
Exact Sig.
(1-sided)
Pearson Chi-Square 12.366a 1 .000
Continuity Correctionb 11.530 1 .001
Likelihood Ratio 12.149 1 .000
Fisher's Exact Test .001 .000
Linear-by-Linear
Association
12.339 1 .000
N of Valid Cases 454
a. 0 cells (.0%) have expected count less than 5. The minimum expected count is 35.47.
b. Computed only for a 2x2 table Table A-13: Cross Tabulation, Was Visited by a Volontario And Would Contact a Health Clinic, Health Personnel or a Volontario for a Child With Signs of AFP
Visited by a
Volontario
Would contact a clinic, health personnel or volontario for a
child with AFP signs
Yes No
Yes 49 (98.0%) 1 (2.0%) No/Don’t know 117 (88.0%) 16 (12.0%)
Table A-14: Chi- Square Tests, Visited by a Volontario and Would Contact a Health Clinic, Health Personnel or a Volontario for a Child with Signs of AFP
Value Df
Asymp.
Sig. (2-
sided)
Exact Sig.
(2-sided)
Exact Sig.
(1-sided)
Pearson Chi-Square 4.338a 1 .037
Continuity
Correctionb
3.230 1 .072
Likelihood Ratio 5.597 1 .018
Fisher's Exact Test .044 .027
Linear-by-Linear
Association
4.315 1 .038
N of Valid Cases 183
a. 1 cell (25.0%) has expected count less than 5. The minimum expected count is 4.64.
b. Computed only for a 2x2 table

27
Table A-15: Cross Tabulation, Attended a Volontario-led Education Session and Would Contact a Health Clinic, Health Personnel or a Volontario for a Child With Signs of AFP
Attended a Volontario-led
Education Session
Has Ever Heard of AFP
Yes No
Yes 51 (58.6%) 36 (41.4%) No/Don’t know 132 (36.0%) 238 (64.0%)
Table A-16: Chi-Square Tests, Attended a Volontario-led Education Session and Has Ever Heard of AFP
Value Df
Asymp. Sig.
(2-sided)
Exact Sig.
(2-sided)
Exact Sig.
(1-sided)
Pearson Chi-Square 15.000a 1 .000
Continuity Correction b 14.073 1 .000
Likelihood Ratio 14.733 1 .000
Fisher's Exact Test .000 .000
Linear-by-Linear
Association
14.967 1 .000
N of Valid Cases 454
a. 0 cells (.0%) have expected count less than 5. The minimum expected count is 35.07.
b. Computed only for a 2x2 table
Access to Health Services/Support
Mothers’ Exposure to Health Information/Education/Communication When asked if they recalled being visited by a project volontario at times other than during a vaccination campaign, only 19.4% of the final survey respondents said yes. Of those who did remember being visited, just over 70% remembered discussing a vaccination campaign, nearly 60% remembered discussing routine immunization and 40% remembered discussing paralysis. Less than 5% of final survey respondents said they couldn’t remember what was discussed and less than 1% said they’d discussed something other than the above-mentioned topics. The respondents’ recall of project-led health education sessions is similar to that of home visits. While no baseline data is available, 19.2% of final survey respondents recalled attending a health education session conducted by a project volontario compared to 36% of mid-term respondents who recalled attending a mothers meeting, an activity subsequently replaced with more open health education sessions at the request of fathers. Those final survey respondents who indicated that they had attended a session recalled discussing vaccination campaigns (70.1%), routine immunization (65.5%) and paralysis (46.0%). Of the mid-term respondents who recalled

28
attending a health education session, 90.1% mentioned at least one of the three above-listed topics (more specific data is not available from the mid-term).
Access to Health Services The final survey results suggest that in 2012 people lived further from the health centers where children are usually vaccinated than reported at the mid-term, as shown in Figure A-11. Only 47.8% of respondents could walk to the health center in less than 30 minutes compared to 57.1% at mid-term. Furthermore, 31.1% had to walk for half an hour to under an hour in 2012 compared to 27.1% at mid-term. Figure A-11: Distribution of Mothers Surveyed by Survey and Length of Time Required to Walk to the Nearest Health Facility Where Children Are Usually Vaccinated
N= all mothers who participated in the mid-term and final surveys Figure A-11 also shows that 16.3% of final survey respondents had to walk for 1 to 2 hours compared to just 10.9% at mid-term. Slightly less than 5% reported walking for more than 2 hours at both the mid-term and the final. A valuable investment in improving access to immunization services could be to conduct a survey to establish and record locations of health facilities serving families/communities that are more than five (5) kilometers distant and expand immunization outreach programs for those facilities’ catchment areas to better ensure that those families living more than 5 km away access/receive immunization services.
57.1
27.1
10.9
4.0 0.9
47.8
31.1
16.3
3.3 1.5
0.0
10.0
20.0
30.0
40.0
50.0
60.0
Less than 30
minutes
30 minutes -
under 1 hour
1 hour to
under 2 hours
2 hours to
under 3 hours
3 or more
hours
Mid-term
Final

29
Figure A-12: Distribution of Mothers by Survey and Perceptions of Quality of Health Services
N= all mothers who participated in the baseline and final surveys The survey results also indicated some improvements in perceived quality of health services: Figure A-12 indicates that only 18.3% of mothers surveyed during the final described the health services as poor or fair compared to 22.7% at mid-term. The percentage of mothers who considered services acceptable increased from 14.4% to 17.4%. While the percentage of mothers who described the services as good changed only slightly from 55.8% at the mid-term to 54.6% at the final, the percentage who described the services as excellent grew from 1.8% to 8.4%. Only 1.3% said “don’t know” at the final compared to 5.3% at the mid-term.
Discussion
1) While the survey data suggests that polio campaign coverage is more than 90%, routine
immunization coverage including polio coverage in Angola remains well below the levels necessary to prevent outbreaks of vaccine-preventable diseases, even in the CGPP catchment areas. While card plus mothers’ recall data indicates that 60% to 75% of children receive the initial antigens (BCG, OPV-0 and OPV-1 and a first dose of pentavalent vaccine), coverage with subsequent antigens drops to approximately 50% for measles and third doses of polio and pentavalent vaccine.
2) Only about 25% of children 12-23 months of age have received the recommended four doses
of polio vaccine based on cards and recall combined. Card data only reflects coverage levels ranging from about 47% for BCG and OPV-0 to between 30% and 40% for the later doses of polio and pentavalent vaccines and for measles. Since only 47.8% of mothers, however, were able to show child vaccination cards to the data collectors, coverage among the children of those mothers appears to be quite high, raising questions about the availability and retention of the cards. If cards are readily available, the data would suggest that mothers who are inclined to vaccinate their children are also inclined to keep the cards. If this is the case then
13.6
9.1
14.4
55.8
1.8
5.3
10.6 7.7
17.4
54.6
8.4
1.3
0.0
10.0
20.0
30.0
40.0
50.0
60.0
Poor Fair Acceptable Good Excellent Don't know
Baseline
Final
30
it may be worth exploring card retention as an indicator of a low-risk family requiring limited intervention beyond support to prevent drop-out. Conversely, families who have not retained cards they received could be considered high risk requiring more intensive intervention, possibly one-on-one education and follow-up from a local CGPP-trained CVSFP, HEW, or local leader who is trusted by the family and is supportive of CGPP and PEI efforts.
3) The data does indicate a significant improvement in campaign participation, increased from
just over 50% at the baseline to over 95% at the mid-term and final; however, only 25% had received the recommended 4 doses. This could be a problem with recall questions in general, or with the tool design and administration: since the question regarding number of OPV doses received immediately followed the question about campaigns it is possible that some mothers were thinking only of campaign doses, although card coverage also reflects significant levels of drop-out in all 3 surveys. If possible, a review of both campaign data and clinic data on child immunization, if it’s available, would be useful, along with some qualitative research involving mothers, providers and volontarios. Understanding that the Angolan culture and health service delivery systems are different from those in Uttar Pradesh, India, nonetheless it might be useful for the CGPP headquarters technical staff to discuss CGPP/India focus group research that uncovered key unrecognized counterproductive immunization-related knowledge, attitudes and practices among health providers and CGPP volunteers.
4) Interestingly, coverage seems to have decreased since the mid-term despite the fact that
mothers’ perceptions of the quality of the health system (Table A-19) have improved. Since families surveyed for the final evaluation indicated having to travel longer distances to reach clinics compared to families surveyed previously, access may also be a factor in routine coverage since these services are provided in clinics, rather than in campaigns that bring the vaccine closer to communities and families. Furthermore, at least some of this can be explained by the combination of the survey approach which randomly selected houses from all homes in the communities, rather than just CGPP-served households, and the graduation of some catchment areas along with the subsequent addition of new very high risk catchment areas, particularly along the country’s borders. In fact the UNICEF and WHO representatives indicated that while coverage may still be low in some CGPP areas, the project cannot and should not be held responsible. The declines may also be a reflection of vaccination fatigue, although campaign coverage remains quite high. Note that coverage with the relatively new pentavalent vaccine remains quite high, with very small declines in coverage.
5) When asked why their children had missed one or more vaccinations, the most frequently
mentioned response was that the mothers weren’t aware of either where to go or when to go for child vaccination services. Given the high campaign participation this presumably indicates an urgent need for a) better education for mothers regarding their children’s vaccination schedules and appropriate sources of vaccine, and b) more proactive promotion of routine services. The CGPP staff should explore the possibility of engaging a broad range of providers in the effort to promote routine immunization and to educate/remind mothers and families about the vaccination schedule for their children. In particular, opportunities to expand the project’s reach and enhance its impact may be possible through partnerships with professional and traditional health workers, especially the urban area traditional healers mentioned by UNICEF and WHO.
31
6) Decreases in Pentavalent vaccine coverage over time were relatively small compared to polio.
This may simply be due to the fact that the vaccine was relatively recently introduced in Angola and offered the benefit of reducing the required number of vaccination contacts for infants. Exploring mothers’ attitudes towards the pentavalent vaccine relative to other vaccines in focus group discussions could potentially offer insights that would be valuable in increasing RI coverage in general.
7) The project staff appropriately expanded mothers’ health education sessions to more inclusive
meetings open to fathers in response to community demands. The survey data indicates that maternal grandmothers and older siblings are significant sources of child care support when mothers are away and should also be a focal audience for polio and AFP surveillance messages and health education. Exploring fathers’ and grandmothers’ roles and their attitudes toward polio, vaccine/immunization, and AFP could offer useful data to inform health education and immunization messaging that will sensitize these women regarding the importance and safety of child immunization, and counteract any misinformation or unhealthy practices. School based programs educating children regarding healthy practices for themselves and children will benefit not only their younger siblings and families’ health in general but will also be an investment in their own children’s health in the future.
8) More in-depth investigation of CGPP’s impact on AFP knowledge and practice could also be
of value to the broader polio surveillance and eradication effort. If indeed CGPP is a primary source of AFP information, they have been very effective among the families they reach, and investments in expanding that reach would clearly be warranted, particularly given Angola’s past history of undetected circulating virus leading to outbreaks. Consider expanding the AFP education effort, possibly using a training-of-trainers approach with careful follow up of the trained trainers’ effectiveness, partnering with GoA, UNICEF and WHO health education/behavior change communications staff and programs. If resources are available, consider reinforcing messages and expanding reach through mass media announcements on radio and TV, given that 65% of mothers surveyed indicate that they get polio information from radio and/or TV (See Figure A-9, above).
9) Although friends and neighbors are not a significant source of child care, they are a very
significant source of information regarding immunization and possibly other health issues. The data, which is representative of communities rather than simply CGPP catchment households, suggest that the CGPP volontarios are not able to reach enough families to have the necessary impact on immunization access and coverage. CGPP’s apparent success with AFP surveillance education is particularly indicative: although only 40% of mothers surveyed had heard of AFP, well over 90% of those who had heard of AFP gave appropriate responses to knowledge and practice questions. Particularly in the very hard-to-reach communities, CGPP may be the primary, if not the only source of such information suggesting that they are doing a very good job educating those families that they reach, but they aren’t reaching enough families. This may be a reflection of other aspects of CGPP’s information-education-communication efforts. Further intensifying community mobilization activities and involving influential community members in the effort to improve awareness and access is warranted
32
given the apparent increases in distances that must be traveled by CGPP catchment area families who need health services.
10) Reliance on friends and neighbors for health information, as opposed to health personnel, has
increased since the mid-term. Possibly there is a relationship between this shift and changes in access to health care, as the data indicate that survey participants live further away from health services than they had in the past. If so, this is one more reason to focus more on educating and mobilizing communities and community members to actively support participation in polio eradication and routine immunization. Focus group discussions and reviews of innovative best practices emerging in other PEI and immunization programs could help to identify effective approaches and participants e.g. respected opinion-influencers and families exhibiting positive deviance.
11) Explore opportunities to maximize the project’s reach given limited resources and the costs
of operating in Angola as well as the limited number of CGPP-trained volontarios relative to the population of children less than two years of age,. The CORE Group has considerable experience with community-based approaches involving, for example, ‘positive deviance,’ community-based surveillance, child-to-child and child-to-family advocacy for health-seeking behaviors. In coordination with the CGPP headquarters staff, engage with the partner organizations’ technical staff and explore the CORE Group’s website. Furthermore, recognizing that each of the CGPP countries is unique in its culture, health infrastructure, resources and challenges, reviewing the innovative approaches and successes CGPP has achieved in Ethiopia and India could spark creative new ideas that could be adapted to the Angolan context.
ANGOLA FINAL EVALUATION QUALITATIVE DATA
UNICEF representative in Angola and co-chair of the Inter-agency Coordinating Committee (ICC) and WHO Expanded Programme on Immunization (EPI) team leader in Angola were contacted and their organizational experiences with the CORE Group Polio Project (CGPP) project was solicited. The UNICEF representative roles and responsibilities include: guiding the overall PEI strategy represents the International Monitoring Board (IMB)
representing the NGOs on all social mobilization issues
supporting campaigns by planning activities; supervising each campaign; collecting and analyzing campaign data and providing feedback to the ICC regarding performance in each province; and ensuring that the ICC has high quality data for decision-making ensuring the availability of high quality data to support campaign planning and strategic decision-making and campaign strengthening.
33
Key Informant Comments and Observations
Both UNICEF and WHO are pleased with CGPP’s performance, and they trust and rely on the CGPP partners, particularly for providing quality information when it is needed. CGPP’s data collection, analysis and monitoring activities are clearly respected and valued, as are the partners’ support for campaign coordination and logistics, and their social mobilization efforts. 1) UNICEF and WHO recognized and appreciated the partners’ flexibility and willingness to
actively adjust to changing situations and strategies in reaching the High Risk populations in hard to reach areas where polio virus invasion was possible.
2) Other CGPP contributions included:
The CGPP team has consistently been very professional, very concerned about overcoming challenges and very committed to getting the job done effectively as measured by their success in improving the timeliness of and response to campaign data.
Expansion of CGPP geographic coverage to support goal achievement in the provinces, CGPP increased its staff and the number of provinces it covers while providing consistent
quality in their technical work and performance monitoring. CGPP improved coverage in very important areas of Luanda such as Vianna,
Zambizanga and Kazenga.
3) In the CGPP operational areas the linkages with the health sector are also very important to the national EPI program development to the extent that they could develop a lead role in establishing facilities and resources and health facility-based areas for modeling expanded routine immunization centers. The project’s increased focus on promoting routine immunization, a relatively new
activity, represents a valuable contribution as it has increased demand for routine immunization at the community level could serve as the ideal mechanism for a national vaccine disease prevention model through building on a successful basic mechanism.
The partners’ community level work is very valuable as they have involved many influential community members including community presidents, traditional birth attendants, and traditional healers.
The CGPP partners have been participating in the revitalization of health services, especially outreach services and health day activities. Their support for outreach services, their links to health worker networks and their success in coordinating health services helps ensure that services are of the quality needed to achieve the goals.
The data CGPP provided two years ago in Luanda, Lunda Norte and Benguela was instrumental in gaining the commitment of the provincial governors, who then used the CGPP data on missed children to hold municipal administrators accountable for immunization coverage. Data remains a valuable tool in the war against vaccine preventable disease. We also need to collect data on morbidity and mortality on children less than 5 years in age. Such data may be used in the early detection of preventable child infectious disease and preventable mortality.
34
3) Beyond the narrow focus on immunization and polio eradication, UNICEF and WHO noted CGPP’s broader contributions to improvements in community participation in health services resulting from the links the project partners have created between the community and the health sector at the local level.
4) CGPP maps and enumeration lists provide valuable information on health facility/health
service catchment areas, and in WHO’s view, the partners have fostered good relations with and earned the trust of health sector representatives at the central level.
5) Mild malnutrition is often an underlying component in child mortality. 6) UNICEF and the CGPP have been discussing the current nutrition crisis in Angola and
possibilities for CGPP partners to introduce community management of malnutrition. 7) Loss of CGPP’s funding would result in a negative impact on the health of women and
children in high risk areas. 8) Organizations would have serious concerns if funding was withdrawn and the Angolan
government was forced to take over CGPP’s activities.
Key Informants’ Recommendations
Key informants suggested that strengthening and expanding programmatic activities
would enhance the project’s contributions to polio eradication and establish improved Routine Immunization coverage.
Use improved routine immunization coverage as a top priority when the project’s involvement is needed, especially in hard-to-reach areas. In designated high-performing areas strengthen routine Immunization coverage and performance by partnering with facilities, collecting relevant data and promoting evidence-based interventions
Key partners also suggested that documenting the process of the CGPP secretariat methodologies and their successes would be very valuable in the context of the project’s work with performance monitoring data.
The project’s data, as well as findings from some CGPP studies, should be more broadly distributed for widespread use.
In the next phase of the project, consider expanding data collection to include child morbidity and mortality of children less than 5 years in age to inform broader child survival programming.
Establish a process for the spread and ownership of these data with local community leaders, other NGOs, district and municipal government administrators, and staffs of MOH planning, social communications, and health promotion departments.
The CGPP partnership has important roles to play in revitalizing health services and improving community access to primary care and health seeking behaviors.
The CGPP partners should expand their interventions to combat malnutrition and to promote and support other interventions such as antenatal care and TB treatment.
35
Observation: WHO and UNICEF have basic discussions on active community based surveillance (CBS) with the CGPP operational staff and they should work together on a common CBS plan for Luanda
Recommendation: CGPP should be included in active community based surveillance and be added to the certification system.
Recommendation: CGPP should establish every mechanism for improving routine immunizations (RI) services and coverage through data collection, analysis, programmatic modification, implementation and decision making! Further investment in building staffs’ understanding of data’s value and their capacity to analyze and interpret data is essential.
EVALUATION RECOMMENDATIONS FOR CGPP/ANGOLA
1) Review the project’s supervisory systems to ensure that volontarios’ level/quality of performance is objectively known and meets project standards and that performance gaps are being effectively addressed at the secretariat level, with support from CGPP headquarters staff and in coordination, at least, with the CGPP partners,.
2) Explore opportunities to capitalize on the CORE partners’ supervisory visits to the field,
ideally to provide more supportive monitoring and capacity-building supervision to the field staff, or at least to obtain more frequent information on quality of performance in the field. These visits should be regular, scheduled, frequent, and routine.
3) Also consider exploring monitoring and capacity-building partnerships with other polio
stakeholders who may be working or traveling in CGPP catchment areas. 4) Invest in high quality investigative/formative research to obtain more details about the
knowledge, attitudes and practices of both community members and CGPP staff and volontarios, being careful to differentiate between households that are in fact visited by CGPP volontarios, and those that are not. Some key questions to be addressed could include: a. Are the volontarios reaching the highest risk families? b. How can CGPP expand to reach more families? Is the problem access, or is it related to
the effectiveness of the messages? The AFP data suggests the issue is access. Are there community members who could informally join forces with the volontarios to help spread one or two key messages among their families and friends? Are community and religious leaders who communicate with many community members effectively engaged in promoting immunization? Are there “positive deviant” families that could proactively serve as role models for other families, within the context of local culture? Are there other opinion-influencers in the CGPP communities (artists, sports figures, and teachers, etc.) who could help promote complete immunization coverage, urging parents to ensure their children receive all the required doses of each antigen?
c. How does immunization and AFP knowledge and practice among families visited by CGPP volontarios compare to that of families who are not contacted by the volontarios? Conduct more in-depth investigative and formative research to develop better
36
understanding of the attitudes and practices not only of mothers of children less than two years of age, but also, if possible, among the children’s grandmothers and siblings, as well as CGPP volontarios and both traditional and trained health providers, and community members regarding: routine and campaign immunization services value and safety of vaccine contra-indications for vaccinating children importance of fully immunizing children with the GoA-recommended vaccines purpose and value of child health cards and the factors contributing to the high % of
mothers who reported that they did have cards at one time but could/would not produce them at the time of the survey
explore providing plastic envelopes for the child’s health card to improve child care givers card retention
AFP surveillance awareness and perceptions of the CGPP volontarios, their trustworthiness, and the
relevance and value of their messages 5) Explore opportunities to expand the project’s reach and impact by engaging and mobilizing
community members, especially opinion-influencers and positive role models, doctors, nurses, midwives and traditional health providers of all kinds to expand the volontarios’ reach and strengthen community participation in immunization, especially routine, and AFP surveillance.
6) Explore opportunities to leverage additional resources to expand the reach of CGPP’s
effective activities supporting AFP awareness and community-based surveillance 7) Pursue opportunities to discuss and act on the recommendations made by the WHO and
UNICEF spokespersons: To help achieve polio eradication, CGPP should extend the reach of their effective
missed child tracking program beyond their current coverage areas. (Note that at the central level WHO has heard that CGPP has introduced a card-based tracking system but they “have not seen or heard reports on the results of this challenging but important activity.”)
Strengthening micro-planning in Luanda’s high risk barrios as it will be essential to the eradication effort’s success
Given the trust and positive working relationships it has established in its catchment communities, CGPP may be uniquely suited to engaging the traditional healers more fully in AFP surveillance as one of the critical challenges to AFP surveillance is the fact that parents typically bring their children with paralysis to traditional healers and while these healers are engaged in AFP surveillance in rural areas, in Luanda they operate underground and have been very difficult to involve them in surveillance.
Encourage the CGPP field workers to also help support the effort to enroll women in serving as trained volunteer vaccinators, as women have proven to be more reliable and more effective than more readily available students.
Encourage CGPP to engage CHWs and explore non-monetary incentives, strengthen competencies, build outreach programs, and promote demand for services. (Currently
37
UNICEF is working on the community health worker (CHW) program with the GoA, problems including continuity and salary-related issues have created problems and interruptions in services, especially in Luanda where CGPP has a strong presence).
The CGPP partners are also perceived as having an important role to play in increasing the partnership between the government and NGOs, particularly community-based and community service organizations.
Document CGPP processes and successes, especially related to campaign performance monitoring
38
CGPP/ETHIOPIA EVALUATION FINDINGS
BACKGROUND
The CORE Group Polio Project (CGPP) was formed in 1999 and has been active participant in the global Polio Eradication Initiative (PEI). It has been working in high risk areas of Angola, Bangladesh, Ethiopia, India, Nepal and Uganda. Bangladesh, Uganda and Nepal have “graduated.” Currently the project is functioning in Angola, Ethiopia and India with funds made available by USAID and the Bill & Melinda Gates Foundation; the focus of this report is the USAID-funded activities in these countries, although the Gates Foundation resources has supported interventions and created synergies that have furthered the achievement of project objectives. The current USAID grant which funds the project from October, 2007 – September 2012 is designed to contribute to polio eradication by increasing population immunity and enhancing the sensitivity of surveillance for AFP. The CGPP’s CORE Group partners and local NGOs began working together on polio eradication in Ethiopia in November 2001. In close coordination with the Government of Ethiopia (GoE) at all levels the Ethiopia CGPP secretariat and the partners it guides and coordinates have strengthened the technical and management capacity of local NGOs, enhanced local research capacity; contributed significantly to the Inter-agency Coordinating Committee; and contributed to improved immunization coverage and strengthened AFP surveillance. Ethiopia is Africa’s oldest independent country. It is the tenth largest country in Africa, covering 1,104,300 square kilometers (with 1 million sq km land area and 104,300 sq km water) and is the major constituent of the landmass known as the Horn of Africa. It is bordered on the north and northeast by Eritrea, on the east by Djibouti and Somalia, on the south by Kenya, and on the west and southwest by Sudan. Ethiopia is a country with great geographical diversity and its topography shows a variety of contrasts ranging from high peaks of 4,550m above sea level to a low depression of 110m below sea level. The predominant climate type is tropical monsoon, with cool highlands above 2,400 meters, a temperate climate on the plateau and a hot climate in the lowlands. Ethiopia’s population is extremely diverse (See Table E-1). With a total population of over 76 million, the country is home to more than 80 different ethnic groups with different cultures. Three groups – Oromo, Amhara, and Tigray – make up nearly 70% of the population. Some of the ethnic groups in the country are very small in number - just about 10,000 people in a group.
The two most important religions in Ethiopia are Christianity and Islam. According to latest statistics (Table A-1) more than 60% of the Ethiopia population is Christian, making Christianity the most dominant and the most followed religion in the country. While the Christians in the country mostly live in the highlands, the lowlands are occupied mostly by the Moslems. Apart from this, the followers of animist religions are found in the southernmost regions of the country.
The multiplicity of language and culture, the lack of functioning universal health infrastructure and the economic status of Ethiopia result in widespread and diverse health, disease and
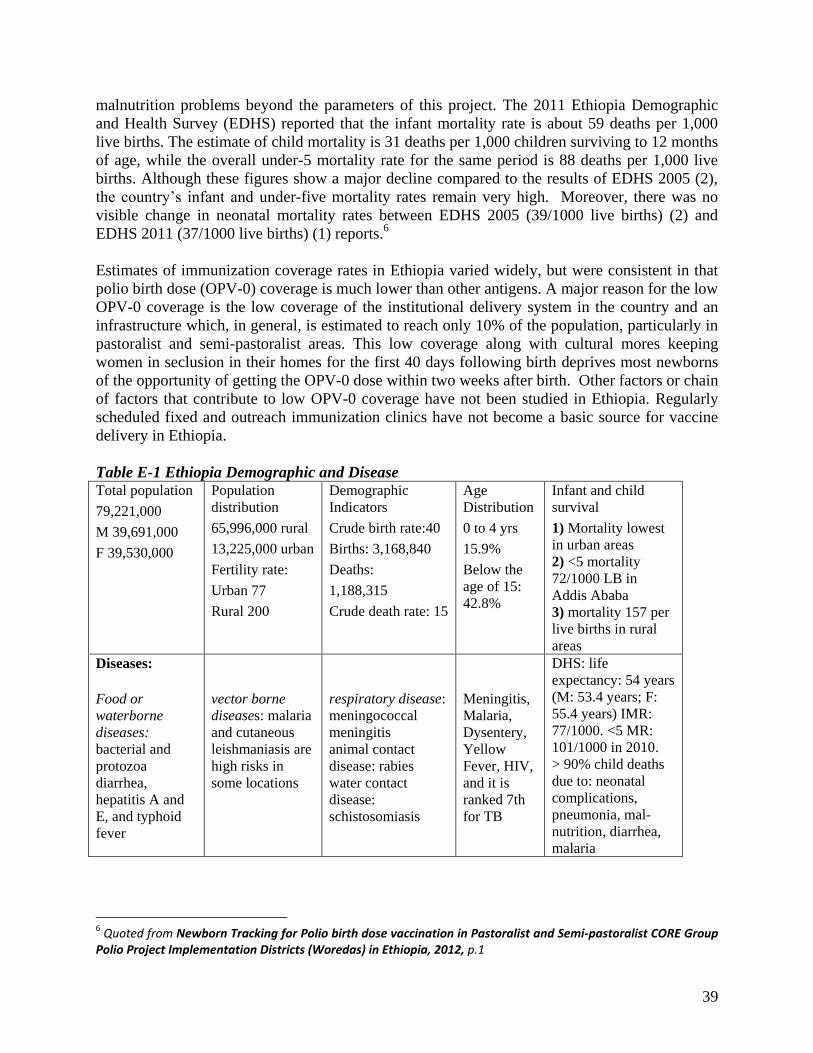
39
malnutrition problems beyond the parameters of this project. The 2011 Ethiopia Demographic and Health Survey (EDHS) reported that the infant mortality rate is about 59 deaths per 1,000 live births. The estimate of child mortality is 31 deaths per 1,000 children surviving to 12 months of age, while the overall under-5 mortality rate for the same period is 88 deaths per 1,000 live births. Although these figures show a major decline compared to the results of EDHS 2005 (2), the country’s infant and under-five mortality rates remain very high. Moreover, there was no visible change in neonatal mortality rates between EDHS 2005 (39/1000 live births) (2) and EDHS 2011 (37/1000 live births) (1) reports.6 Estimates of immunization coverage rates in Ethiopia varied widely, but were consistent in that polio birth dose (OPV-0) coverage is much lower than other antigens. A major reason for the low OPV-0 coverage is the low coverage of the institutional delivery system in the country and an infrastructure which, in general, is estimated to reach only 10% of the population, particularly in pastoralist and semi-pastoralist areas. This low coverage along with cultural mores keeping women in seclusion in their homes for the first 40 days following birth deprives most newborns of the opportunity of getting the OPV-0 dose within two weeks after birth. Other factors or chain of factors that contribute to low OPV-0 coverage have not been studied in Ethiopia. Regularly scheduled fixed and outreach immunization clinics have not become a basic source for vaccine delivery in Ethiopia. Table E-1 Ethiopia Demographic and Disease Total population
79,221,000
M 39,691,000
F 39,530,000
Population distribution
65,996,000 rural
13,225,000 urban
Fertility rate:
Urban 77
Rural 200
Demographic Indicators
Crude birth rate:40
Births: 3,168,840
Deaths:
1,188,315
Crude death rate: 15
Age Distribution
0 to 4 yrs
15.9%
Below the age of 15: 42.8%
Infant and child survival
1) Mortality lowest in urban areas 2) <5 mortality 72/1000 LB in Addis Ababa 3) mortality 157 per live births in rural areas
Diseases:
Food or waterborne diseases: bacterial and protozoa diarrhea, hepatitis A and E, and typhoid fever
vector borne diseases: malaria and cutaneous leishmaniasis are high risks in some locations
respiratory disease: meningococcal meningitis animal contact disease: rabies water contact disease: schistosomiasis
Meningitis, Malaria, Dysentery, Yellow Fever, HIV, and it is ranked 7th for TB
DHS: life expectancy: 54 years (M: 53.4 years; F: 55.4 years) IMR: 77/1000. <5 MR: 101/1000 in 2010. > 90% child deaths due to: neonatal complications, pneumonia, mal-nutrition, diarrhea, malaria
6 Quoted from Newborn Tracking for Polio birth dose vaccination in Pastoralist and Semi-pastoralist CORE Group
Polio Project Implementation Districts (Woredas) in Ethiopia, 2012, p.1
40
To support achievement of global and national PEI goals and objectives the FY08 CGPP grant included five key project objectives: Support PVO/NGO efforts to strengthen national and regional immunization systems to
achieve polio eradication through interventions that will increase the number of children <60 months of age who are fully protected by routine child immunizations and will strengthen local capacity to support routine immunization services
Support PVO/NGO involvement in national and regional planning and implementation of supplemental polio immunization with interventions that will increase oral polio vaccination coverage among children <60 months of age
Support PVO/NGO efforts to strengthen AFP case detection and reporting (and case detection of other infectious diseases)
Build effective partnerships between PVOs, NGOs and international, national, and regional agencies involved in polio, encouraging partnerships with local non-government and church-based organizations and actively participating in national Inter-agency Coordinating Committee meetings and other appropriate technical meetings at local, sub-national, national and regional levels
Support timely documentation and use of information to continuously improve the quality of polio eradication (and other health related activities)
The final evaluation survey was intended to provide the immunization and AFP surveillance knowledge, practice and coverage data for the final evaluation of implementation of the 2007 CGPP grant in Ethiopia. It also complemented other studies that were identified as essential research areas needed to fill gaps limiting effective mobilization of CGPP Ethiopia’s contributions to polio eradication in Ethiopia. For example, one of these focus studies examines pregnancy and child delivery practices to identify mechanisms for improving polio birth dose coverage in CGPP implementation districts/ woredas. Early AFP detection, effective disease prevention measures and large scale availability of immunization services represent other obvious targets for this project. In addition to the survey, key informant interviews were conducted with representatives of the Federal Ministry of Health, UNICEF, WHO, the Rotary Club/Ethiopia and CGPP CORE Group and local NGO partners.
Achievements: A number of important advances have been achieved in Ethiopia in general and in the very high risk CGPP catchment areas during the life of the 2007 grant, particularly containment of poliovirus imported from S. Sudan and re-establishment of on-going zero polio status with more than 12 consecutive months with no confirmed cases of polio. Although the CGPP partners can’t take sole credit for that milestone, the CGPP partners and their trained community-based AFP surveillance volunteers are generally credited with shifting silent zones to active zero and case reporting. They also expanded disease surveillance in high risk areas to include neonatal tetanus and measles case surveillance. By the end of the five year grant period CGPP partners had begun working with high risk pastoralist communities; the final survey data showed improvements in key indicators among pastoralist mothers:
immunization coverage reliance on trained health workers for information on polio knowledge of AFP signs and appropriate responses
41
METHODOLOGY
The final evaluation survey was conducted in 9 districts (woredas) selected using criteria that included representativeness and feasibility. A CGPP-trained team consisting of enumerators, supervisors, coordinators, core research team members and community guides were involved in collecting data and ensuring its quality. Quantitative data were entered and analyzed using SPSS version 17. Appropriate statistical tests (Chi squared test) and measures (OR, 95%CI) were used to assess significance and strength of associations, respectively. Multiple regression analysis was used to measure the effect of different factors adjusted for possible confounders. The survey instrument used for the final evaluation survey is included as Attachment 1. During the 5 year period of the current grant, CGPP activities were more consistently conducted among agrarian populations; therefore, the survey data is weighted to reflect the relative intensity of efforts in that population. Of the total of 900 mothers surveyed for the final evaluation, 330 were randomly selected from agrarian CGPP areas, 300 were randomly selected from semi-pastoralist areas, and 270 were randomly selected from the pastoralist areas.
CONSTRAINTS/LIMITATIONS
The local consultants who oversaw conduct of the three evaluation surveys changed over time and so problems with internal consistency across the three surveys may pose limits on the validity of the data and the interpretations. With different overall training and supervision in each survey it is also possible that different data collectors involved in different surveys over time either presented the question differently, or interpreted and recorded the responses differently.
Logistics, technical, data reporting (including gaps in data available from prior surveys), sample size (relative to population sub-groups and variables such as geographic location) and other constraints limited the in-depth analysis of correlations between dependent and independent variables. It seems likely that relationships may exist, but are masked in the analysis.
The survey consultants also did not provide information on or results of quality assurance measures taken during data collection or data entry
Over time the project partners shifted their geographic focuses, expanding into high risk agrarian and semi-pastoralist regions in response to outbreaks in neighboring Kenya, S. Sudan and Uganda. While these shifts were appropriate, even essential, from a programmatic and disease eradication perspective, they complicate the analysis of project results, and dilute the project’s overall impact based on quantitative data. At the same time, with only quantitative survey data and anecdotal evidence from key informants who are connected to the project we cannot be certain that the improvements seen in the data are due exclusively to CGPP given that the same compelling reasons that prompted CGPP’s expansion into high-risk border areas also drew greater UNICEF, WHO and GoE attention to these areas.

42
QUANTITATIVE HOUSEHOLD SURVEY DATA FINDINGS
The baseline survey covered 900 mothers of children 12 to 23 months of age from agrarian, pastoralist and semi-pastoralist populations in CGPP coverage areas. It is important to note that the project’s catchment areas have shifted over time as local needs and priorities changed and as partners’ resources and capacities changed. In the past project activities have been directed more toward the agrarian communities than pastoralist and semi-pastoralist ones; in the up-coming new grant-funded phase of the project much more attention will be directed toward these more under-served sub-populations to better address their needs and mitigate polio risks in the national border and other high-risk areas. The findings from the data described below support and encourage this shift.
Demographic Data
Unlike the surveys conducted in Angola and in India, in Ethiopia a small percentage of male caretakers (fathers or other relatives) were interviewed for the CGPP surveys. Among the agrarian and semi-pastoralist populations, male participation in the survey increased slightly from 6-7% at the baseline to 11% at the final, while male participation among pastoralists decreased from 10% at the baseline to 5% at the mid-term and 8% at the final. Respondents’ gender does not, however, seem to have impacted the results or influenced immunization history. Figure E-1: Distribution of Survey Participants by Population Sub-group and Age in Years
N= all survey respondents As shown in Figure E-1, the age range of the final survey participants follows an expected bell curve with the majority of mothers/caretakers of children 12 to 23 months of age falling in the 20 to 30 year age group. Fewer than 10% in each population group were in the higher risk age groups of 15-19 years of age or over 40. It is also possible that some of the respondents falling
4
26
31
20
14
4
1 1
8
24
34
22
8
3
0 1
5
23
29
25
11
4 2
1 0
5
10
15
20
25
30
35
40
15 – 19 20 – 24 25 – 29 30 – 34 35 – 39 40 – 44 45 – 49 50+
Agrarian
Semi-pastoralist
Pastoralist
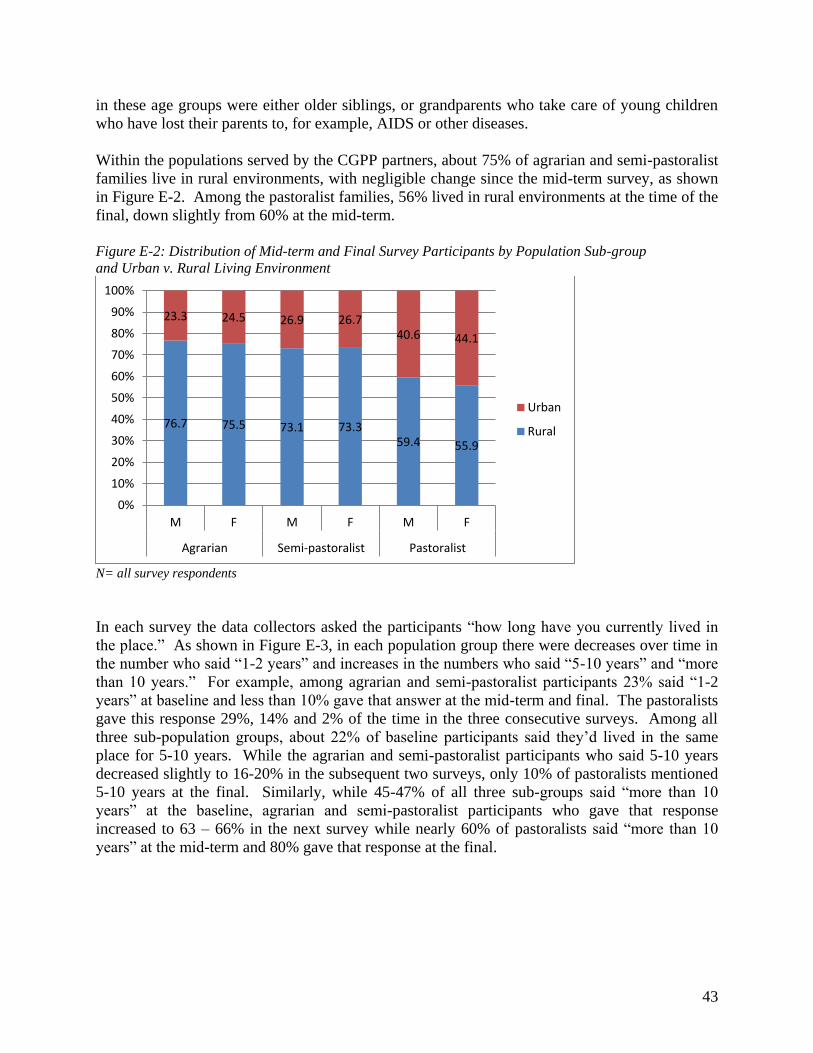
43
in these age groups were either older siblings, or grandparents who take care of young children who have lost their parents to, for example, AIDS or other diseases. Within the populations served by the CGPP partners, about 75% of agrarian and semi-pastoralist families live in rural environments, with negligible change since the mid-term survey, as shown in Figure E-2. Among the pastoralist families, 56% lived in rural environments at the time of the final, down slightly from 60% at the mid-term. Figure E-2: Distribution of Mid-term and Final Survey Participants by Population Sub-group and Urban v. Rural Living Environment
N= all survey respondents In each survey the data collectors asked the participants “how long have you currently lived in the place.” As shown in Figure E-3, in each population group there were decreases over time in the number who said “1-2 years” and increases in the numbers who said “5-10 years” and “more than 10 years.” For example, among agrarian and semi-pastoralist participants 23% said “1-2 years” at baseline and less than 10% gave that answer at the mid-term and final. The pastoralists gave this response 29%, 14% and 2% of the time in the three consecutive surveys. Among all three sub-population groups, about 22% of baseline participants said they’d lived in the same place for 5-10 years. While the agrarian and semi-pastoralist participants who said 5-10 years decreased slightly to 16-20% in the subsequent two surveys, only 10% of pastoralists mentioned 5-10 years at the final. Similarly, while 45-47% of all three sub-groups said “more than 10 years” at the baseline, agrarian and semi-pastoralist participants who gave that response increased to 63 – 66% in the next survey while nearly 60% of pastoralists said “more than 10 years” at the mid-term and 80% gave that response at the final.
76.7 75.5 73.1 73.3 59.4 55.9
23.3 24.5 26.9 26.7 40.6 44.1
0%
10%
20%
30%
40%
50%
60%
70%
80%
90%
100%
M F M F M F
Agrarian Semi-pastoralist Pastoralist
Urban
Rural
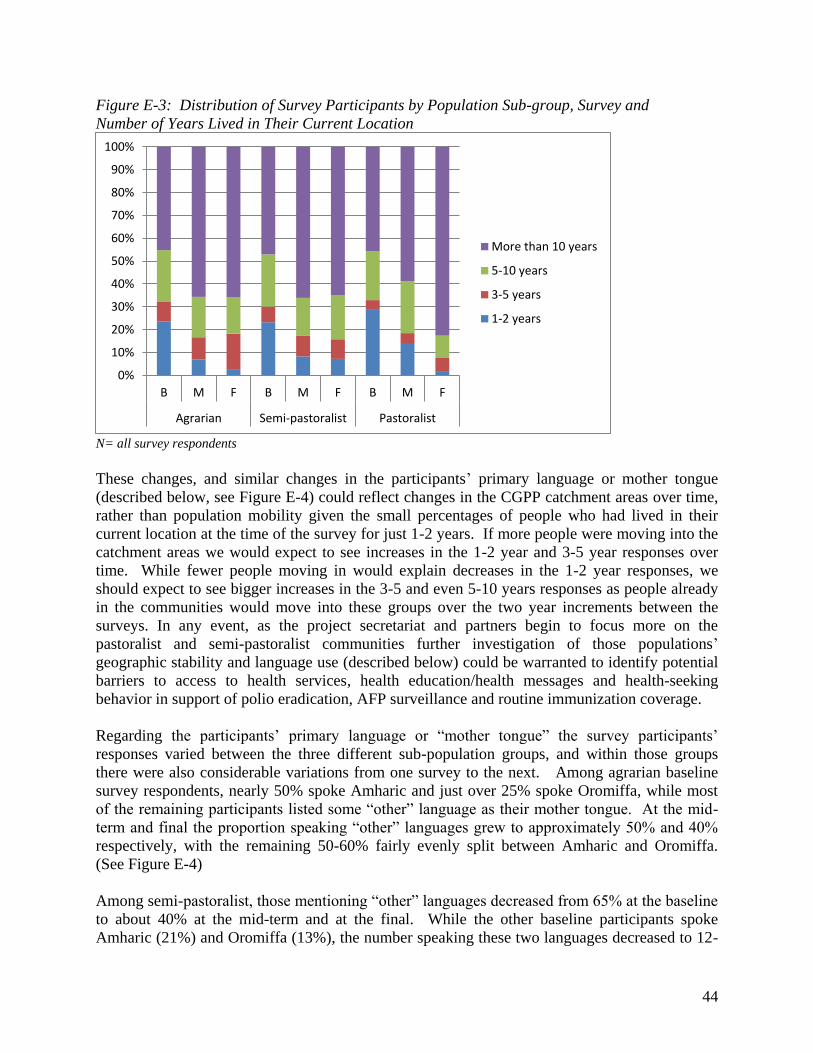
44
Figure E-3: Distribution of Survey Participants by Population Sub-group, Survey and Number of Years Lived in Their Current Location
N= all survey respondents These changes, and similar changes in the participants’ primary language or mother tongue (described below, see Figure E-4) could reflect changes in the CGPP catchment areas over time, rather than population mobility given the small percentages of people who had lived in their current location at the time of the survey for just 1-2 years. If more people were moving into the catchment areas we would expect to see increases in the 1-2 year and 3-5 year responses over time. While fewer people moving in would explain decreases in the 1-2 year responses, we should expect to see bigger increases in the 3-5 and even 5-10 years responses as people already in the communities would move into these groups over the two year increments between the surveys. In any event, as the project secretariat and partners begin to focus more on the pastoralist and semi-pastoralist communities further investigation of those populations’ geographic stability and language use (described below) could be warranted to identify potential barriers to access to health services, health education/health messages and health-seeking behavior in support of polio eradication, AFP surveillance and routine immunization coverage. Regarding the participants’ primary language or “mother tongue” the survey participants’ responses varied between the three different sub-population groups, and within those groups there were also considerable variations from one survey to the next. Among agrarian baseline survey respondents, nearly 50% spoke Amharic and just over 25% spoke Oromiffa, while most of the remaining participants listed some “other” language as their mother tongue. At the mid-term and final the proportion speaking “other” languages grew to approximately 50% and 40% respectively, with the remaining 50-60% fairly evenly split between Amharic and Oromiffa. (See Figure E-4) Among semi-pastoralist, those mentioning “other” languages decreased from 65% at the baseline to about 40% at the mid-term and at the final. While the other baseline participants spoke Amharic (21%) and Oromiffa (13%), the number speaking these two languages decreased to 12-
0%
10%
20%
30%
40%
50%
60%
70%
80%
90%
100%
B M F B M F B M F
Agrarian Semi-pastoralist Pastoralist
More than 10 years
5-10 years
3-5 years
1-2 years

45
15% and 4-8%, respectively, in the subsequent surveys. The remaining 40% of semi-pastoralist mid-term and final survey participants were evenly divided between Anuak and Neur languages. Figure E-4: Distribution of Survey Participants by Population Sub-group and Primary Language/Mother Tongue
N= all survey respondents Among the pastoralist participants, nearly 50% of baseline participants spoke Somaligna; at the mid-term nearly 70% spoke that language and at the final 63% claimed that language as their mother tongue. Although 28% of baseline participants spoke Afarigna, just 12% at the mid-term and 14% at the final mentioned this language. Amharic speakers also decreased from 17% at the baseline to 11% at the mid-term and final, while Oromiffa speakers increased slightly from 4% at baseline to 7% at the mid-term and 12% at the final. Only 4% of baseline participants and 1% of mid-term and final participants mentioned other languages. Figure E-5: Distribution of Survey Participants by Survey, Population Sub-group and Religion
N= all survey respondents
0%
10%
20%
30%
40%
50%
60%
70%
80%
90%
100%
B M F B M F B M F
Other
Neur
Anuak
Afarigna
Somaligna
Oromiffa
Amharic
0% 20% 40% 60% 80% 100%
B
M
F
B
M
F
B
M
F
Ag
rari
an
Se
mi-
pa
sto
rali
stP
ast
ora
list
Coptic Christian
Other Christian
Muslim
Other

46
Among Agrarian participants, at the baseline the vast majority (88%) were relatively evenly split between Coptic Christian and Muslim, with the remaining “Other Christian.” By the final “Other Christians” had increased to 33% of respondents, numbering between Coptic Christians and Muslims. Conversely, at the baseline more semi-pastoralists (42%) were “Other Christian” with 38% Muslim, 14% Coptic Christians and 6% “other.” Although there were apparent shifts during the mid-term, by the final just 2% were “Other” while Muslims increased to 45% and Coptic and Other Christians had each decreased by 1-2%. Among pastoralists, fewer than 10% of respondents in all three surveys indicated they were Coptic or Other Christian. Nearly 60% of baseline participants in the pastoralist group were Muslim and 30% were of some “Other” religion but by the mid-term and final 91% were Muslims and none were “Other.” The participants were also asked whether or not they worked outside of the home in each survey. While the percentage of participants who indicated that they worked stayed relatively steady across the baseline, mid-term and final surveys among the agrarian participants (32%, 28% and 35%, respectively) and pastoralist participants (32%, 29%, 30%, respectively), the percentage of semi-pastoralists who worked increased significantly from 39% at baseline to 54% at the mid-term and 67% at the final. (Figure E-6) Figure E-6: Distribution of Survey Participants Who Work Outside the Home by Survey, Population Sub-group and Type of Work
N= varies with each survey, see parenthetical figures Those respondents who indicated that they worked outside their homes were then asked what types of work they did. Between the baseline and the final there were dramatic decreases in farming in all three sub-populations, from 70% to 28% among agrarian participants who worked, from 72% to 60% among semi-pastoralists and from 29% to 13% among pastoralists. Over the same period, participation in pastoral farming remained at 5% or less among agrarian and semi-
0%
10%
20%
30%
40%
50%
60%
70%
80%
90%
100%
B (
32
.2%
)
M (
28
.0%
)
F (
35
.5%
)
B (
39
.0%
)
M (
54
.5%
)
F (
67
.3%
)
B (
31
.7%
)
M (
29
.2%
)
F (
30
.4%
)
Agrarian Semi-pastoralist Pastoralist
Other
Pastoral farming
Farming
Selling in street/market
Domestic work
Business/shop/office
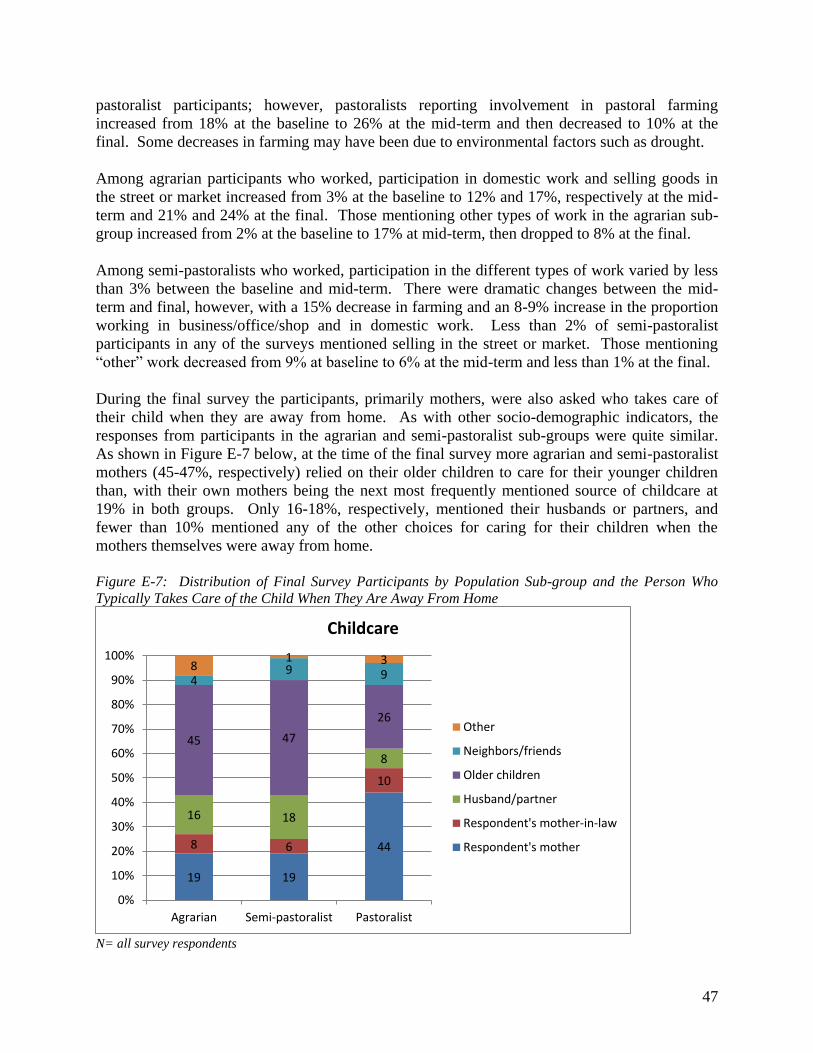
47
pastoralist participants; however, pastoralists reporting involvement in pastoral farming increased from 18% at the baseline to 26% at the mid-term and then decreased to 10% at the final. Some decreases in farming may have been due to environmental factors such as drought. Among agrarian participants who worked, participation in domestic work and selling goods in the street or market increased from 3% at the baseline to 12% and 17%, respectively at the mid-term and 21% and 24% at the final. Those mentioning other types of work in the agrarian sub-group increased from 2% at the baseline to 17% at mid-term, then dropped to 8% at the final. Among semi-pastoralists who worked, participation in the different types of work varied by less than 3% between the baseline and mid-term. There were dramatic changes between the mid-term and final, however, with a 15% decrease in farming and an 8-9% increase in the proportion working in business/office/shop and in domestic work. Less than 2% of semi-pastoralist participants in any of the surveys mentioned selling in the street or market. Those mentioning “other” work decreased from 9% at baseline to 6% at the mid-term and less than 1% at the final. During the final survey the participants, primarily mothers, were also asked who takes care of their child when they are away from home. As with other socio-demographic indicators, the responses from participants in the agrarian and semi-pastoralist sub-groups were quite similar. As shown in Figure E-7 below, at the time of the final survey more agrarian and semi-pastoralist mothers (45-47%, respectively) relied on their older children to care for their younger children than, with their own mothers being the next most frequently mentioned source of childcare at 19% in both groups. Only 16-18%, respectively, mentioned their husbands or partners, and fewer than 10% mentioned any of the other choices for caring for their children when the mothers themselves were away from home. Figure E-7: Distribution of Final Survey Participants by Population Sub-group and the Person Who Typically Takes Care of the Child When They Are Away From Home
N= all survey respondents
19 19
44 8 6
10
16 18
8
45 47
26
4 9 9
8 1 3
0%
10%
20%
30%
40%
50%
60%
70%
80%
90%
100%
Agrarian Semi-pastoralist Pastoralist
Childcare
Other
Neighbors/friends
Older children
Husband/partner
Respondent's mother-in-law
Respondent's mother
48
Conversely, 44% of the pastoralist participants in the final survey indicated that they relied on their own mothers to care for their children, while only 26% mentioned older children and just 8% mentioned their husbands or partners. As with the other two sub-groups, no more than 10% mentioned the other child care options. These results could have implications for CGPP activities in the coming years as the partners shift their focus toward the semi-pastoralist and pastoralist populations. A key step would be to consider focus group discussions to determine the level of influence mothers have on decision-making regarding their grandchildren’s health care, It could also be useful to determine how effective school children are as health behavior change agents within their families and communities. If the results are positive, engaging mothers and school children in activities that will educate them regarding: The crucial importance of polio and routine immunization for child/family health
The importance of, and steps to take to improve hygiene and sanitation in the home to prevent disease transmission
Participating in community-based disease surveillance by recognizing and reporting signs of AFP, and of other vaccine-preventable diseases as appropriate
If grandmothers and older siblings are in fact responsible for young children on a regular and very frequent basis, ensuring that they support the children’s access to both routine and supplemental campaign vaccination services will also be important.
Immunization Coverage
A key component of polio eradication is ensuring universal polio immunization coverage among children under five years of age in the population. Since the CGPP partners are committed to improving routine as well as polio immunization coverage based on the Government of Ethiopia (GoE) immunization schedule, the CGPP evaluation surveys have assessed the vaccination status of the 12 to 23 month old children of the participating mothers using data from the child immunization cards as well as mothers’ recall, following WHO guidelines for assessing child immunization coverage.
Routine Immunization Coverage The data collectors asked the mothers to show them the immunization card for their child 12-23 months of age; those who could not produce the card were asked if they had ever had a card. Although 85% of final survey participants in all three population sub-groups indicated that they had had vaccination cards for their children, at the time of the final survey only 53% of mothers in the agrarian group, 26% in the semi-pastoralist group and 40% in the pastoralist group were able to produce the cards (See Figure E-8). Among the agrarian and pastoralist mothers, this represents an increase over baseline when 47% and 26%, respectively, were able to produce cards. Among semi-pastoralist mothers, the 26% finding at the final represents a decrease since
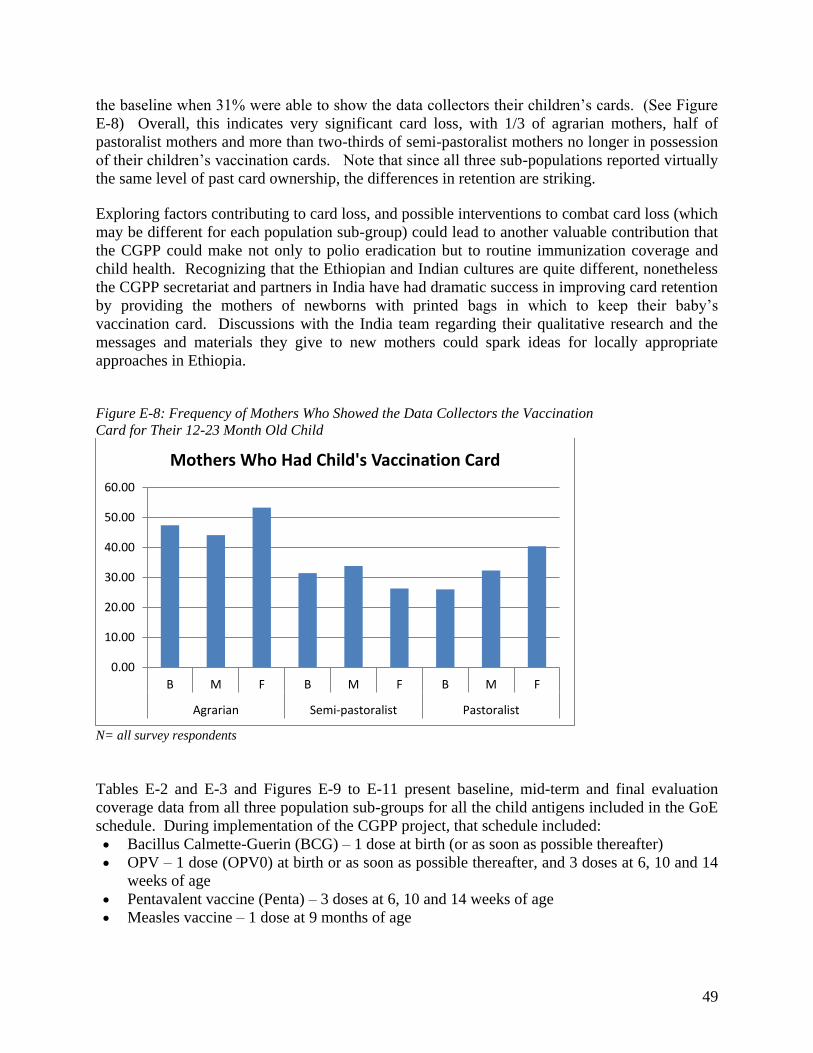
49
the baseline when 31% were able to show the data collectors their children’s cards. (See Figure E-8) Overall, this indicates very significant card loss, with 1/3 of agrarian mothers, half of pastoralist mothers and more than two-thirds of semi-pastoralist mothers no longer in possession of their children’s vaccination cards. Note that since all three sub-populations reported virtually the same level of past card ownership, the differences in retention are striking. Exploring factors contributing to card loss, and possible interventions to combat card loss (which may be different for each population sub-group) could lead to another valuable contribution that the CGPP could make not only to polio eradication but to routine immunization coverage and child health. Recognizing that the Ethiopian and Indian cultures are quite different, nonetheless the CGPP secretariat and partners in India have had dramatic success in improving card retention by providing the mothers of newborns with printed bags in which to keep their baby’s vaccination card. Discussions with the India team regarding their qualitative research and the messages and materials they give to new mothers could spark ideas for locally appropriate approaches in Ethiopia. Figure E-8: Frequency of Mothers Who Showed the Data Collectors the Vaccination Card for Their 12-23 Month Old Child
N= all survey respondents Tables E-2 and E-3 and Figures E-9 to E-11 present baseline, mid-term and final evaluation coverage data from all three population sub-groups for all the child antigens included in the GoE schedule. During implementation of the CGPP project, that schedule included: Bacillus Calmette-Guerin (BCG) – 1 dose at birth (or as soon as possible thereafter) OPV – 1 dose (OPV0) at birth or as soon as possible thereafter, and 3 doses at 6, 10 and 14
weeks of age Pentavalent vaccine (Penta) – 3 doses at 6, 10 and 14 weeks of age Measles vaccine – 1 dose at 9 months of age
0.00
10.00
20.00
30.00
40.00
50.00
60.00
B M F B M F B M F
Agrarian Semi-pastoralist Pastoralist
Mothers Who Had Child's Vaccination Card
50
Figure E-9 compares vaccination coverage based on vaccination cards only among all children 12 to 23 months of age from all three population sub-groups, collected during each of the three CGPP surveys. Figure E-10 compares vaccination coverage based on cards only among only those children for whom the mother was able to produce a vaccination card. Figure E-11 presents data for all children based on vaccination cards plus mothers’ recall; however, since recall data was added at the mid-term, no baseline data is available for this figure, or for cards plus recall in Table E-3, which provides vaccination coverage data from all surveys by card only and by card plus recall.
Coverage Based on Immunization Card Data Only Figure E-9 illustrates the immunization coverage of children with cards within the entire population of surveyed children (using as the denominator the total number of children surveyed). Looking at coverage in general among the children of agrarian, semi-pastoralist and pastoralist respondents, agrarian children were more likely than the children in the other sub-groups to have received the recommended antigens except for OPV0. Among the other two sub-groups, during the baseline for all antigens but BCG and measles the semi-pastoralist children were more likely to have been vaccinated, but at the mid-term there was little difference among the two groups, and among final survey respondents the children of the pastoralists were more likely to have received each of the recommended antigens. Both BCG and OPV0 should be given at birth or as soon as possible after, within two weeks for OPV0. In all three sub-populations coverage with these two initial antigens among the children of baseline participants was alarmingly low even given the limited number of mothers who had their children’s cards. Among agrarians, BCG coverage was 0.1% and OPV0 coverage was 8.5%. With the exception of measles (0.6%), coverage for all other antigens in the GoE schedule ranged between 39% and 45%. Although coverage in general was much lower among the semi-pastoralist and pastoralist populations at the baseline, the pattern was similar to that seen in the agrarian sub-group. Among semi-pastoralists and pastoralists, BCG coverage was 0% and 4.2% respectively and OPV0 was 12% and 7.1%, respectively, while measles was 0 and 1.7% respectively. Coverage with the other antigens ranged between 22.1% and 26.1% among semi-pastoralists, and between 8.4 and 18.9% among pastoralists.7 Continuing to look at coverage based on cards only, among the agrarians surveyed at the mid-term, their children’s coverage with BCG, OPV0 and measles increased to 42.7%, 12.9% and 34.3% respectively, but coverage with the other antigens remained steady in the 38% to 44% range, with small shifts of less than 3% up or down. At the final, coverage among agrarians had increased by 2-5% for all antigens except measles which decreased from 34.3% to 32.7%. Coverage among semi-pastoralists based on cards only showed improvements for all antigens at the mid-term. BCG increased from 0% to 31% and OPV0 increased less dramatically, from 12% to 15.7%, while measles coverage increased from 0% at baseline to 23.8% at the mid-term. Regarding the other antigens, coverage increased from 22-26% at baseline to 30.2-33.5% at the
7 Since BCG coverage improved dramatically in subsequent surveys and was much higher when card data was
o i ed ith others’ re all Ta le 3 it see s likel that the er lo aseli e o erage for BCG, a d easles, may be due to training or administration factors related to health worker record-keeping

51
mid-term. Unfortunately, coverage was lower among the semi-pastoralists whose children were included in the final survey, when BCG coverage was 24.7%, OPV0 was back down to 12.7%, and measles fell slightly to 21.3%. Coverage with the other antigens was back to 22.7%-24.7%. Table E-2: Distribution of Survey Participants Who Had Their Child’s Immunization Card by Population Sub-group, Survey and Card-confirmed Vaccination Coverage
Agrarian Semi-pastoralist Pastoralist B
N=47%
M N=44
%
F N=53
%
B N=31
%
M N=34
%
F N=26
%
B N=26
%
M N=32
%
F N=40
% BCG 0.2 97.0 85.3 0.0 91.2 95.0 16.2 99.7 89.0 OPV0 18.1 29.3 29.2 38.7 46.2 48.8 27.3 69.1 43.5 OPV1 96.2 99.3 84.5 84.2 98.5 95.0 72.7 99.0 91.8 OPV2 93.0 93.0 82.3 76.1 97.4 88.5 53.8 99.0 87.0 OPV3 84.0 88.2 77.2 71.3 93.2 87.3 38.8 92.8 74.0 Penta1 96.2 98.6 85.3 81.3 96.2 95.0 65.0 99.7 89.8 Penta2 89.8 94.5 84.0 77.7 93.2 89.6 46.5 97.5 85.3 Penta3 83.2 89.8 79.4 73.5 88.8 87.3 32.3 93.8 76.0 Measles 1.3 78.0 61.7 0.0 70.0 81.9 6.5 85.6 70.3
Given the fact that among the different population sub-groups and different surveys only 26% to 53% of mothers were able to show the data collectors their children’s immunization cards for card coverage data, there is some value in looking at card-based immunization coverage within this group alone (using the percentage of mothers who produced cards as the denominator). Table E-2 and Figure E-10 present that data. It is not surprising that coverage among the children of mothers who retain possession of their vaccination cards is quite high: during the mid-term coverage for most antigens in all three sub-groups was 90% or higher. During the final although coverage was lower overall, for most antigens coverage was between 75% and 85% for agrarian children, between 81.9% and 95% for semi-pastoralist children, and between 71.3% and 91.8% for pastoralist children. Interestingly, comparing Figure E-9 and Figure E-10, when examining coverage among only those children with cards the differences between the sub-groups even out. Agrarian children no longer show significantly better coverage, and in fact final survey results indicate that among children who do have cards, coverage among semi-pastoralist children is higher than coverage among the other two groups. It is possible that further investigation of the knowledge, attitudes and behaviors among families who have retained their children’s immunization cards could help to identify opportunities to use positive deviance strategies to encourage card retention and vaccination.
Coverage Based on Cards Plus Mothers’ Recall Beginning with the mid-term evaluation the data collectors described each of the recommended vaccinations to the survey participants, following WHO guidelines, and asked if they recalled their 12-23 month old child having received any of the vaccinations, and the number of doses received. Figure E-11 and Table E-3 present coverage based on the combination of vaccination
52
card data plus mothers’ recall data. Not surprisingly, particularly given poor card retention, these data reflect significantly higher immunization coverage than was suggested by the card only data, although there is still room for improvement and some causes for concern, particularly related to pastoralist children and to the OPV0 dose. BCG coverage with recall was quite high for the mid-term and final surveys, at least double the card only coverage figures at 88.1% and 90.3%, respectively, in the agrarian sub-group, 81.9% and 80.3%, respectively, among semi-pastoralists, and 71.1% and 75.6%, respectively, among pastoralists. Interestingly, OPV0 coverage was significantly lower at 31.1% and 34.2% among agrarian children, 40.9 and 52.7% among semi-pastoralist children and 48.3% and 31.5% among pastoralist children.8 Coverage for OPV1, OPV2 and OPV3 was highest among agrarian respondents’ children in both the mid-term (90.6%, 87.1%, 80.8%, respectively) and the final (91.8%, 89.4%, 73.3%, respectively). Unlike the agrarian children, semi-pastoralist children were more likely to have received each OPV dose in the mid-term (89.3%, 87.9%, 70.8%, respectively) than the semi-pastoralist children who participated in the final (82.3%, 77.3%, 63%). As described in greater depth in the section on qualitative data below, key informants from CGPP partners in Ethiopia indicated that immunization coverage improved in their communities following introduction of CGPP interventions. For example, a representative of EECMY indicated that after CGPP organized and supported mobile vaccination teams for hard-to-reach communities in the project areas, immunization coverage increased from about 14% to about 73%. A representative from AMREF’s field office in Awash indicated that as a result of CGPP support to the Woreda health offices in their zone they saw annual incremental increases in coverage of 6% to 15%.
8 More in-depth discussion of the OPV0 issue and evidence-based recommendations that should be considered in the
new phase of the project are found in Newborn Tracking for Polio birth dose vaccination in Pastoralist and Semi-pastoralist CORE Group Polio Project Implementation Districts (Woredas) in Ethiopia, 2012
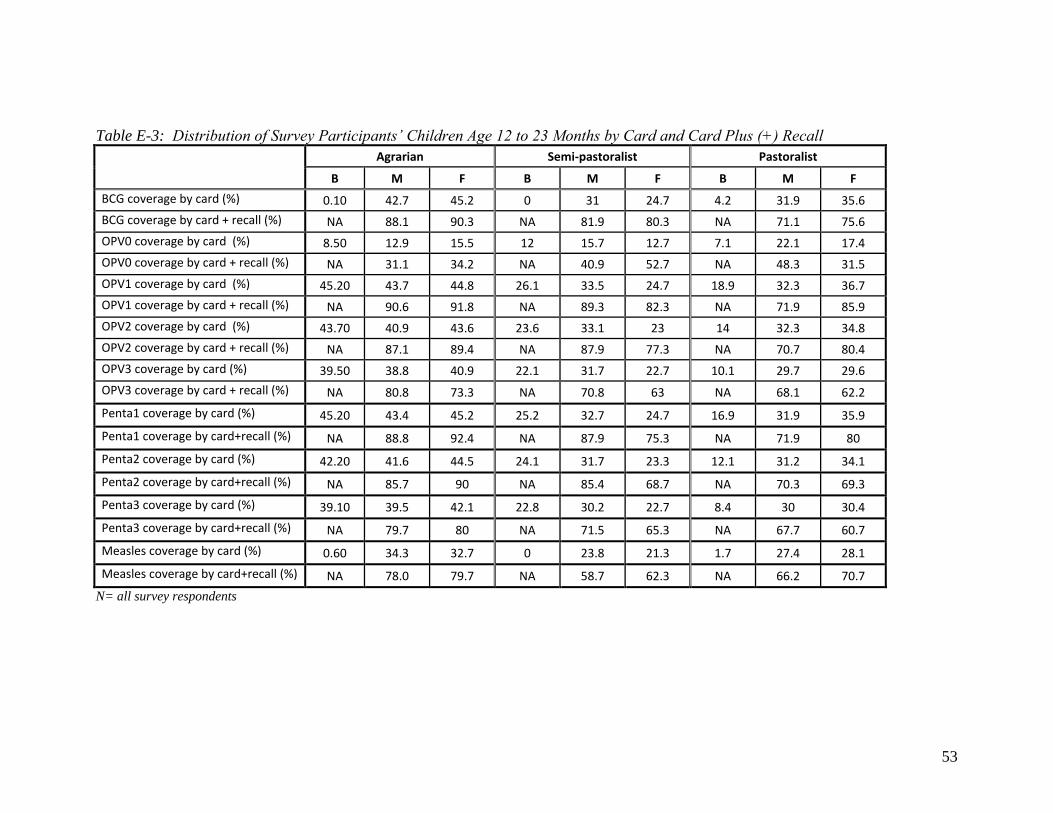
53
Table E-3: Distribution of Survey Participants’ Children Age 12 to 23 Months by Card and Card Plus (+) Recall
Agrarian Semi-pastoralist Pastoralist
B M F B M F B M F
BCG coverage by card (%) 0.10 42.7 45.2 0 31 24.7 4.2 31.9 35.6
BCG coverage by card + recall (%) NA 88.1 90.3 NA 81.9 80.3 NA 71.1 75.6
OPV0 coverage by card (%) 8.50 12.9 15.5 12 15.7 12.7 7.1 22.1 17.4
OPV0 coverage by card + recall (%) NA 31.1 34.2 NA 40.9 52.7 NA 48.3 31.5
OPV1 coverage by card (%) 45.20 43.7 44.8 26.1 33.5 24.7 18.9 32.3 36.7
OPV1 coverage by card + recall (%) NA 90.6 91.8 NA 89.3 82.3 NA 71.9 85.9
OPV2 coverage by card (%) 43.70 40.9 43.6 23.6 33.1 23 14 32.3 34.8
OPV2 coverage by card + recall (%) NA 87.1 89.4 NA 87.9 77.3 NA 70.7 80.4
OPV3 coverage by card (%) 39.50 38.8 40.9 22.1 31.7 22.7 10.1 29.7 29.6
OPV3 coverage by card + recall (%) NA 80.8 73.3 NA 70.8 63 NA 68.1 62.2
Penta1 coverage by card (%) 45.20 43.4 45.2 25.2 32.7 24.7 16.9 31.9 35.9
Penta1 coverage by card+recall (%) NA 88.8 92.4 NA 87.9 75.3 NA 71.9 80
Penta2 coverage by card (%) 42.20 41.6 44.5 24.1 31.7 23.3 12.1 31.2 34.1
Penta2 coverage by card+recall (%) NA 85.7 90 NA 85.4 68.7 NA 70.3 69.3
Penta3 coverage by card (%) 39.10 39.5 42.1 22.8 30.2 22.7 8.4 30 30.4
Penta3 coverage by card+recall (%) NA 79.7 80 NA 71.5 65.3 NA 67.7 60.7
Measles coverage by card (%) 0.60 34.3 32.7 0 23.8 21.3 1.7 27.4 28.1
Measles coverage by card+recall (%) NA 78.0 79.7 NA 58.7 62.3 NA 66.2 70.7
N= all survey respondents
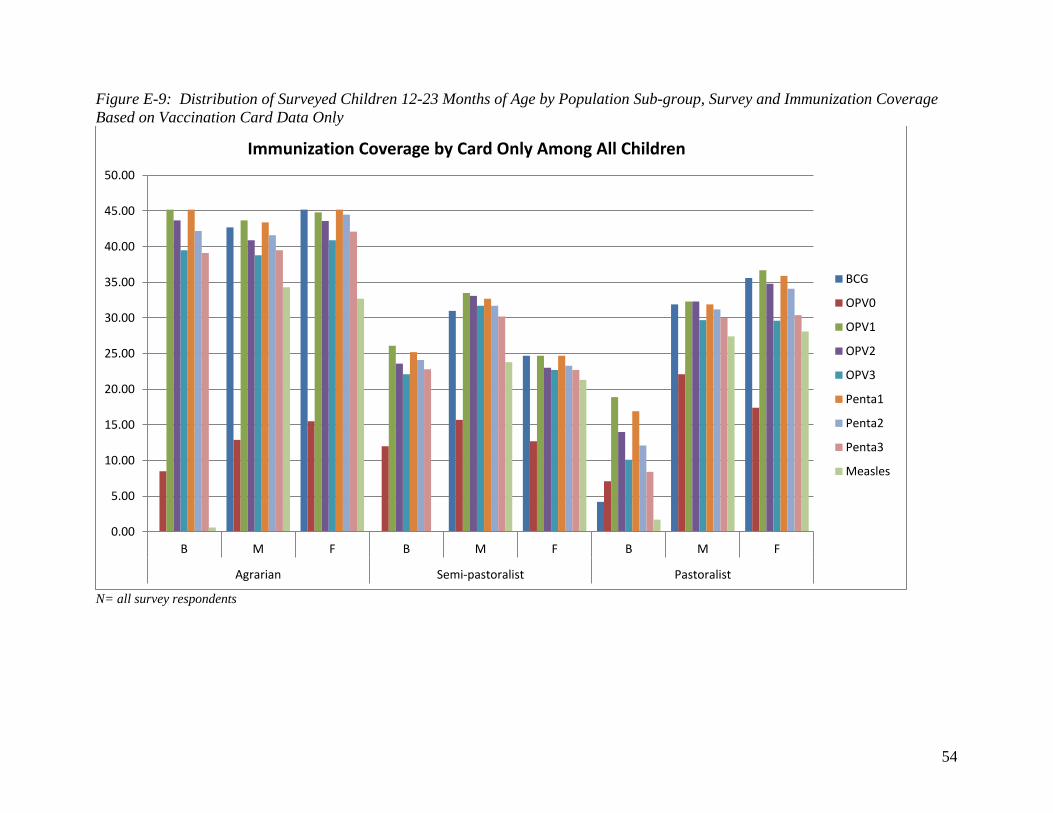
54
Figure E-9: Distribution of Surveyed Children 12-23 Months of Age by Population Sub-group, Survey and Immunization Coverage Based on Vaccination Card Data Only
N= all survey respondents
0.00
5.00
10.00
15.00
20.00
25.00
30.00
35.00
40.00
45.00
50.00
B M F B M F B M F
Agrarian Semi-pastoralist Pastoralist
Immunization Coverage by Card Only Among All Children
BCG
OPV0
OPV1
OPV2
OPV3
Penta1
Penta2
Penta3
Measles
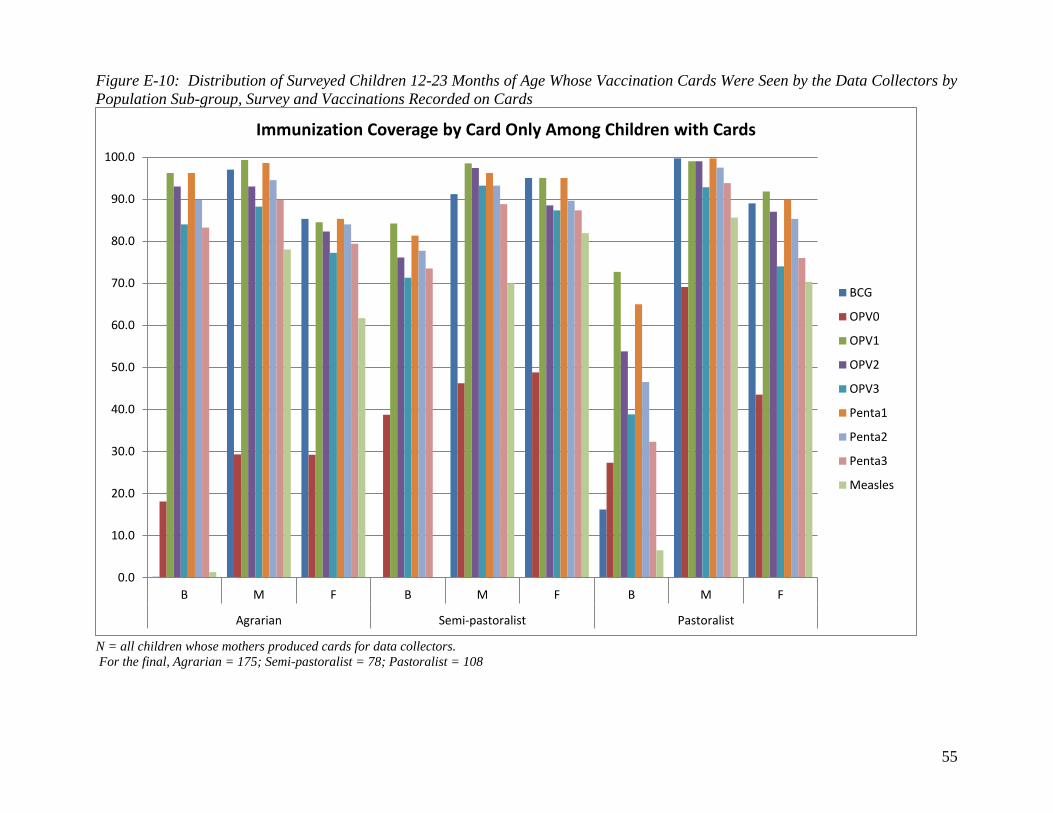
55
Figure E-10: Distribution of Surveyed Children 12-23 Months of Age Whose Vaccination Cards Were Seen by the Data Collectors by Population Sub-group, Survey and Vaccinations Recorded on Cards
N = all children whose mothers produced cards for data collectors. For the final, Agrarian = 175; Semi-pastoralist = 78; Pastoralist = 108
0.0
10.0
20.0
30.0
40.0
50.0
60.0
70.0
80.0
90.0
100.0
B M F B M F B M F
Agrarian Semi-pastoralist Pastoralist
Immunization Coverage by Card Only Among Children with Cards
BCG
OPV0
OPV1
OPV2
OPV3
Penta1
Penta2
Penta3
Measles
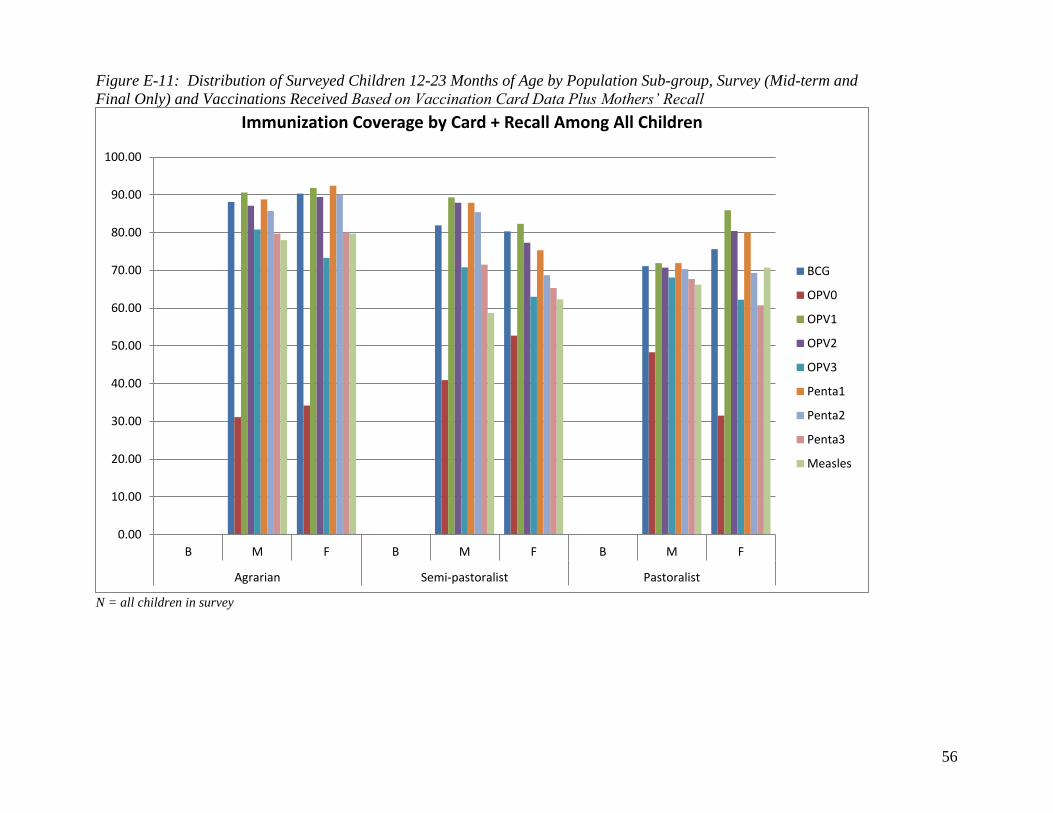
56
Figure E-11: Distribution of Surveyed Children 12-23 Months of Age by Population Sub-group, Survey (Mid-term and Final Only) and Vaccinations Received Based on Vaccination Card Data Plus Mothers’ Recall
N = all children in survey
0.00
10.00
20.00
30.00
40.00
50.00
60.00
70.00
80.00
90.00
100.00
B M F B M F B M F
Agrarian Semi-pastoralist Pastoralist
Immunization Coverage by Card + Recall Among All Children
BCG
OPV0
OPV1
OPV2
OPV3
Penta1
Penta2
Penta3
Measles
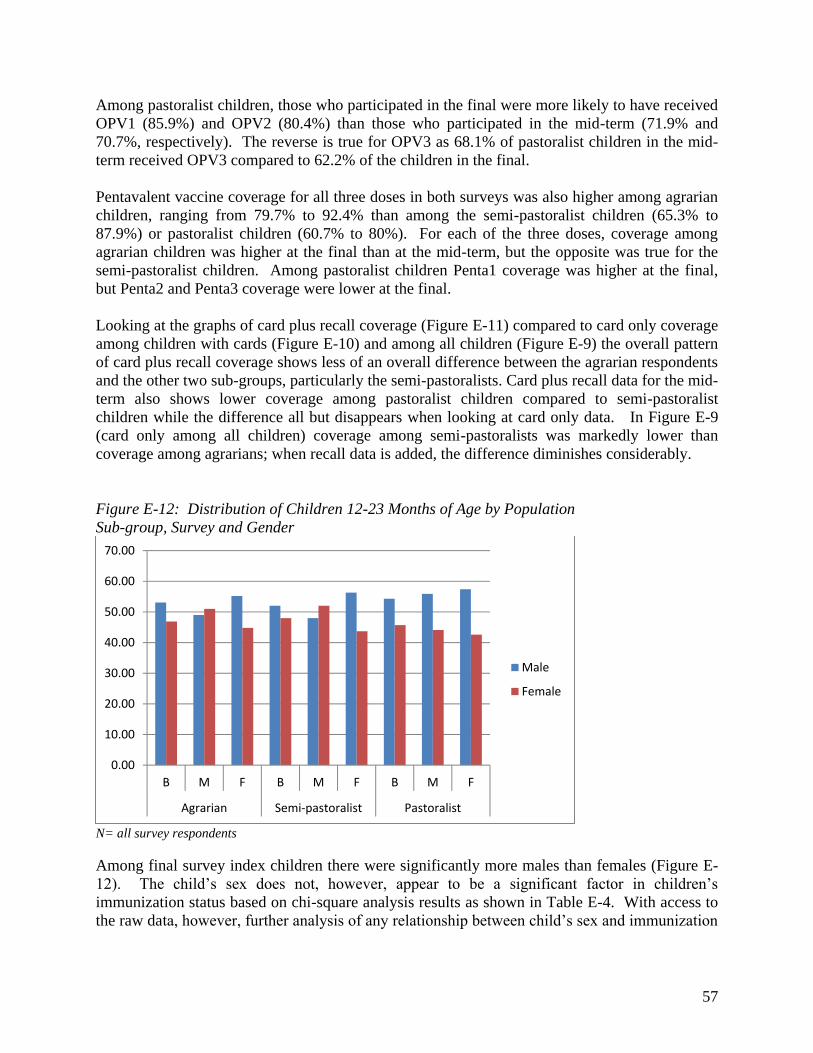
57
Among pastoralist children, those who participated in the final were more likely to have received OPV1 (85.9%) and OPV2 (80.4%) than those who participated in the mid-term (71.9% and 70.7%, respectively). The reverse is true for OPV3 as 68.1% of pastoralist children in the mid-term received OPV3 compared to 62.2% of the children in the final. Pentavalent vaccine coverage for all three doses in both surveys was also higher among agrarian children, ranging from 79.7% to 92.4% than among the semi-pastoralist children (65.3% to 87.9%) or pastoralist children (60.7% to 80%). For each of the three doses, coverage among agrarian children was higher at the final than at the mid-term, but the opposite was true for the semi-pastoralist children. Among pastoralist children Penta1 coverage was higher at the final, but Penta2 and Penta3 coverage were lower at the final. Looking at the graphs of card plus recall coverage (Figure E-11) compared to card only coverage among children with cards (Figure E-10) and among all children (Figure E-9) the overall pattern of card plus recall coverage shows less of an overall difference between the agrarian respondents and the other two sub-groups, particularly the semi-pastoralists. Card plus recall data for the mid-term also shows lower coverage among pastoralist children compared to semi-pastoralist children while the difference all but disappears when looking at card only data. In Figure E-9 (card only among all children) coverage among semi-pastoralists was markedly lower than coverage among agrarians; when recall data is added, the difference diminishes considerably. Figure E-12: Distribution of Children 12-23 Months of Age by Population Sub-group, Survey and Gender
N= all survey respondents Among final survey index children there were significantly more males than females (Figure E-12). The child’s sex does not, however, appear to be a significant factor in children’s immunization status based on chi-square analysis results as shown in Table E-4. With access to the raw data, however, further analysis of any relationship between child’s sex and immunization
0.00
10.00
20.00
30.00
40.00
50.00
60.00
70.00
B M F B M F B M F
Agrarian Semi-pastoralist Pastoralist
Male
Female
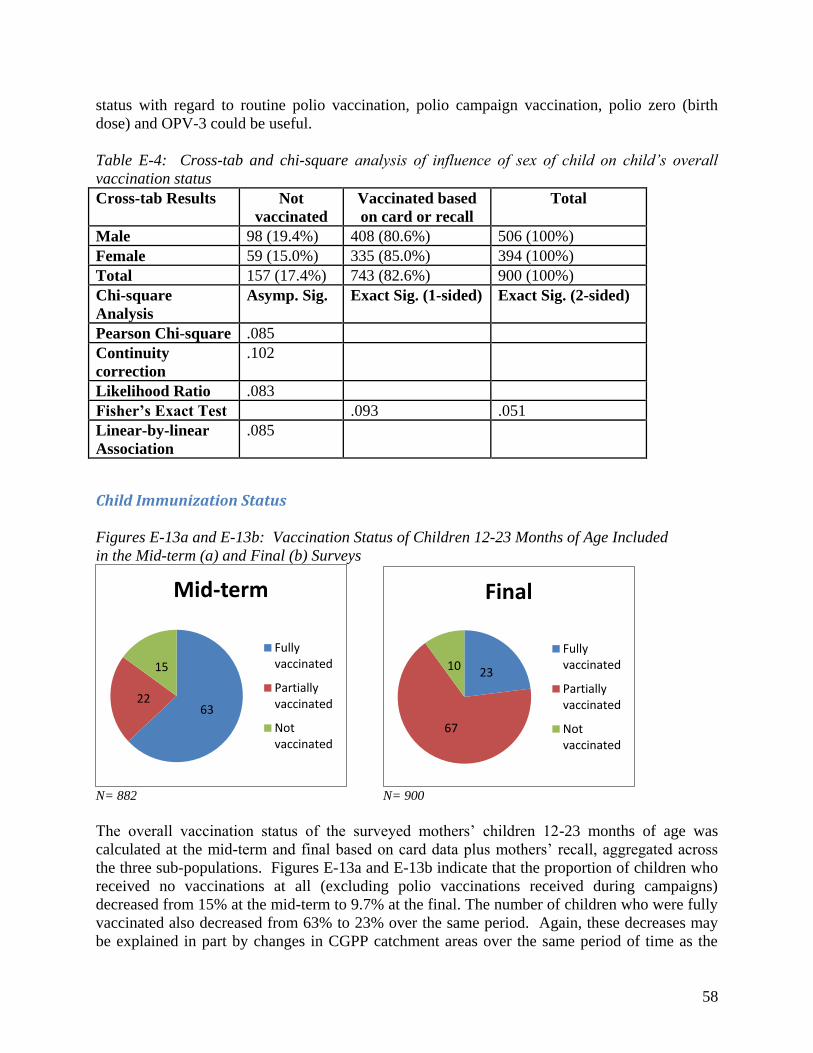
58
status with regard to routine polio vaccination, polio campaign vaccination, polio zero (birth dose) and OPV-3 could be useful. Table E-4: Cross-tab and chi-square analysis of influence of sex of child on child’s overall vaccination status Cross-tab Results Not
vaccinated Vaccinated based on card or recall
Total
Male 98 (19.4%) 408 (80.6%) 506 (100%) Female 59 (15.0%) 335 (85.0%) 394 (100%) Total 157 (17.4%) 743 (82.6%) 900 (100%) Chi-square Analysis
Asymp. Sig. Exact Sig. (1-sided) Exact Sig. (2-sided)
Pearson Chi-square .085 Continuity correction
.102
Likelihood Ratio .083 Fisher’s Exact Test .093 .051 Linear-by-linear Association
.085
Child Immunization Status Figures E-13a and E-13b: Vaccination Status of Children 12-23 Months of Age Included in the Mid-term (a) and Final (b) Surveys
N= 882 N= 900 The overall vaccination status of the surveyed mothers’ children 12-23 months of age was calculated at the mid-term and final based on card data plus mothers’ recall, aggregated across the three sub-populations. Figures E-13a and E-13b indicate that the proportion of children who received no vaccinations at all (excluding polio vaccinations received during campaigns) decreased from 15% at the mid-term to 9.7% at the final. The number of children who were fully vaccinated also decreased from 63% to 23% over the same period. Again, these decreases may be explained in part by changes in CGPP catchment areas over the same period of time as the
63 22
15
Mid-term
Fully
vaccinated
Partially
vaccinated
Not
vaccinated
23
67
10
Final
Fully
vaccinated
Partially
vaccinated
Not
vaccinated
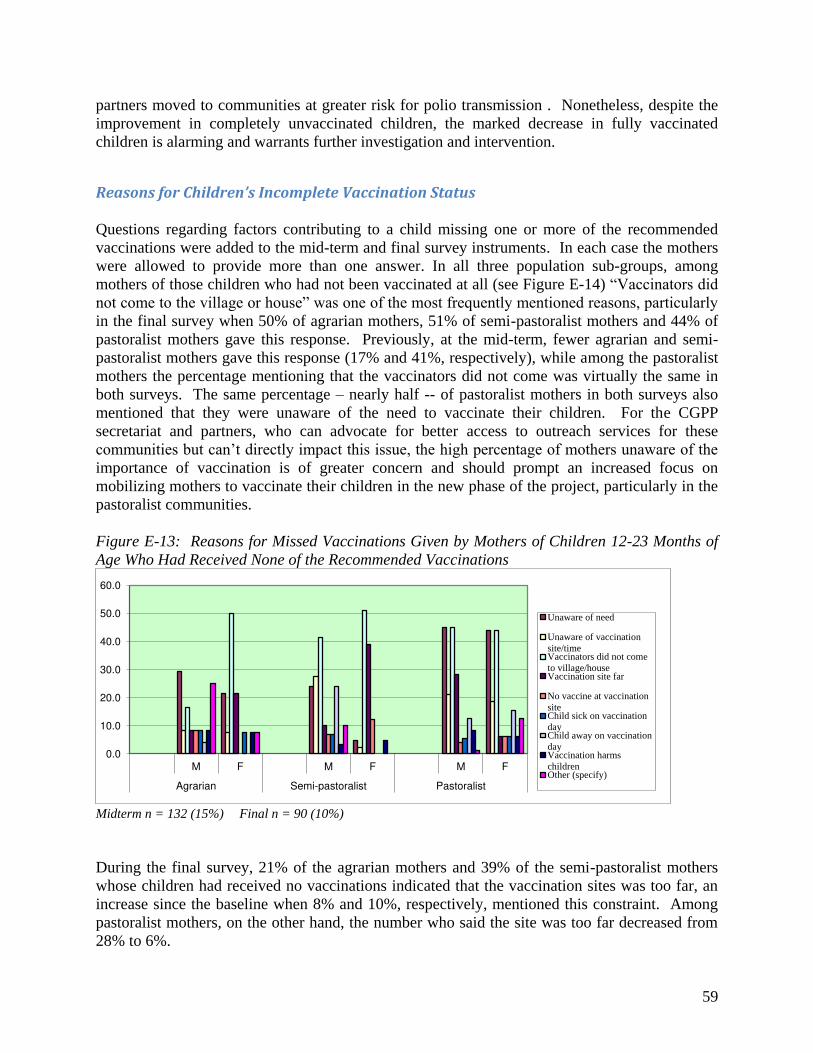
59
partners moved to communities at greater risk for polio transmission . Nonetheless, despite the improvement in completely unvaccinated children, the marked decrease in fully vaccinated children is alarming and warrants further investigation and intervention.
Reasons for Children’s Incomplete Vaccination Status Questions regarding factors contributing to a child missing one or more of the recommended vaccinations were added to the mid-term and final survey instruments. In each case the mothers were allowed to provide more than one answer. In all three population sub-groups, among mothers of those children who had not been vaccinated at all (see Figure E-14) “Vaccinators did not come to the village or house” was one of the most frequently mentioned reasons, particularly in the final survey when 50% of agrarian mothers, 51% of semi-pastoralist mothers and 44% of pastoralist mothers gave this response. Previously, at the mid-term, fewer agrarian and semi-pastoralist mothers gave this response (17% and 41%, respectively), while among the pastoralist mothers the percentage mentioning that the vaccinators did not come was virtually the same in both surveys. The same percentage – nearly half -- of pastoralist mothers in both surveys also mentioned that they were unaware of the need to vaccinate their children. For the CGPP secretariat and partners, who can advocate for better access to outreach services for these communities but can’t directly impact this issue, the high percentage of mothers unaware of the importance of vaccination is of greater concern and should prompt an increased focus on mobilizing mothers to vaccinate their children in the new phase of the project, particularly in the pastoralist communities. Figure E-13: Reasons for Missed Vaccinations Given by Mothers of Children 12-23 Months of Age Who Had Received None of the Recommended Vaccinations
Midterm n = 132 (15%) Final n = 90 (10%) During the final survey, 21% of the agrarian mothers and 39% of the semi-pastoralist mothers whose children had received no vaccinations indicated that the vaccination sites was too far, an increase since the baseline when 8% and 10%, respectively, mentioned this constraint. Among pastoralist mothers, on the other hand, the number who said the site was too far decreased from 28% to 6%.
0.0
10.0
20.0
30.0
40.0
50.0
60.0
M F M F M F
Agrarian Semi-pastoralist Pastoralist
Unaware of need
Unaware of vaccinationsite/timeVaccinators did not cometo village/houseVaccination site far
No vaccine at vaccinationsiteChild sick on vaccinationdayChild away on vaccinationdayVaccination harmschildrenOther (specify)
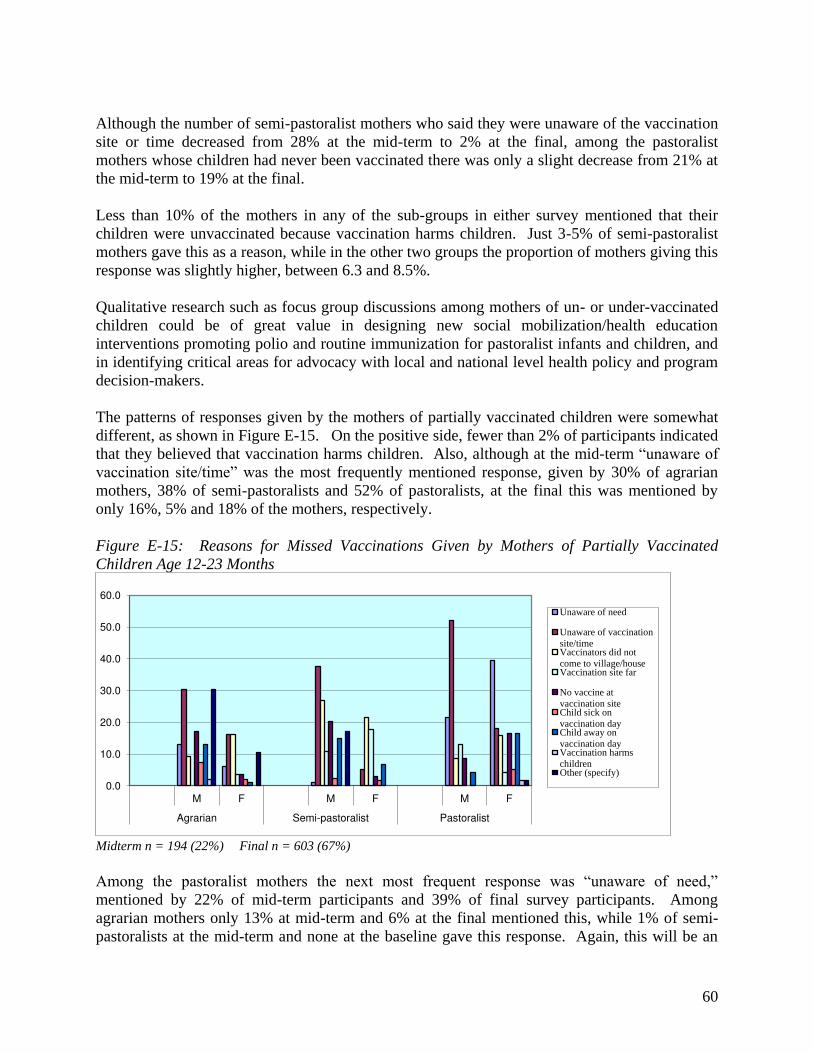
60
Although the number of semi-pastoralist mothers who said they were unaware of the vaccination site or time decreased from 28% at the mid-term to 2% at the final, among the pastoralist mothers whose children had never been vaccinated there was only a slight decrease from 21% at the mid-term to 19% at the final. Less than 10% of the mothers in any of the sub-groups in either survey mentioned that their children were unvaccinated because vaccination harms children. Just 3-5% of semi-pastoralist mothers gave this as a reason, while in the other two groups the proportion of mothers giving this response was slightly higher, between 6.3 and 8.5%. Qualitative research such as focus group discussions among mothers of un- or under-vaccinated children could be of great value in designing new social mobilization/health education interventions promoting polio and routine immunization for pastoralist infants and children, and in identifying critical areas for advocacy with local and national level health policy and program decision-makers. The patterns of responses given by the mothers of partially vaccinated children were somewhat different, as shown in Figure E-15. On the positive side, fewer than 2% of participants indicated that they believed that vaccination harms children. Also, although at the mid-term “unaware of vaccination site/time” was the most frequently mentioned response, given by 30% of agrarian mothers, 38% of semi-pastoralists and 52% of pastoralists, at the final this was mentioned by only 16%, 5% and 18% of the mothers, respectively. Figure E-15: Reasons for Missed Vaccinations Given by Mothers of Partially Vaccinated Children Age 12-23 Months
Midterm n = 194 (22%) Final n = 603 (67%) Among the pastoralist mothers the next most frequent response was “unaware of need,” mentioned by 22% of mid-term participants and 39% of final survey participants. Among agrarian mothers only 13% at mid-term and 6% at the final mentioned this, while 1% of semi-pastoralists at the mid-term and none at the baseline gave this response. Again, this will be an
0.0
10.0
20.0
30.0
40.0
50.0
60.0
M F M F M F
Agrarian Semi-pastoralist Pastoralist
Unaware of need
Unaware of vaccinationsite/timeVaccinators did notcome to village/houseVaccination site far
No vaccine atvaccination siteChild sick onvaccination dayChild away onvaccination dayVaccination harmschildrenOther (specify)
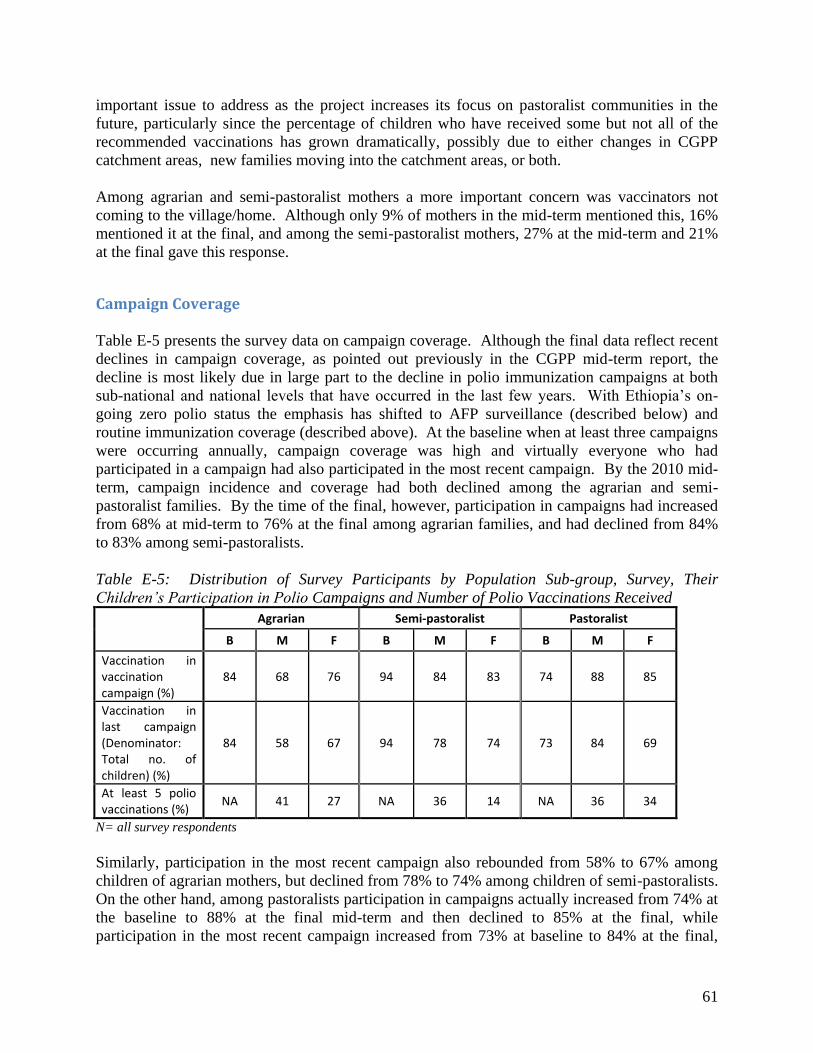
61
important issue to address as the project increases its focus on pastoralist communities in the future, particularly since the percentage of children who have received some but not all of the recommended vaccinations has grown dramatically, possibly due to either changes in CGPP catchment areas, new families moving into the catchment areas, or both. Among agrarian and semi-pastoralist mothers a more important concern was vaccinators not coming to the village/home. Although only 9% of mothers in the mid-term mentioned this, 16% mentioned it at the final, and among the semi-pastoralist mothers, 27% at the mid-term and 21% at the final gave this response.
Campaign Coverage Table E-5 presents the survey data on campaign coverage. Although the final data reflect recent declines in campaign coverage, as pointed out previously in the CGPP mid-term report, the decline is most likely due in large part to the decline in polio immunization campaigns at both sub-national and national levels that have occurred in the last few years. With Ethiopia’s on-going zero polio status the emphasis has shifted to AFP surveillance (described below) and routine immunization coverage (described above). At the baseline when at least three campaigns were occurring annually, campaign coverage was high and virtually everyone who had participated in a campaign had also participated in the most recent campaign. By the 2010 mid-term, campaign incidence and coverage had both declined among the agrarian and semi-pastoralist families. By the time of the final, however, participation in campaigns had increased from 68% at mid-term to 76% at the final among agrarian families, and had declined from 84% to 83% among semi-pastoralists. Table E-5: Distribution of Survey Participants by Population Sub-group, Survey, Their Children’s Participation in Polio Campaigns and Number of Polio Vaccinations Received
Agrarian Semi-pastoralist Pastoralist
B M F B M F B M F
Vaccination in
vaccination
campaign (%)
84 68 76 94 84 83 74 88 85
Vaccination in
last campaign
(Denominator:
Total no. of
children) (%)
84 58 67 94 78 74 73 84 69
At least 5 polio
vaccinations (%) NA 41 27 NA 36 14 NA 36 34
N= all survey respondents Similarly, participation in the most recent campaign also rebounded from 58% to 67% among children of agrarian mothers, but declined from 78% to 74% among children of semi-pastoralists. On the other hand, among pastoralists participation in campaigns actually increased from 74% at the baseline to 88% at the final mid-term and then declined to 85% at the final, while participation in the most recent campaign increased from 73% at baseline to 84% at the final,
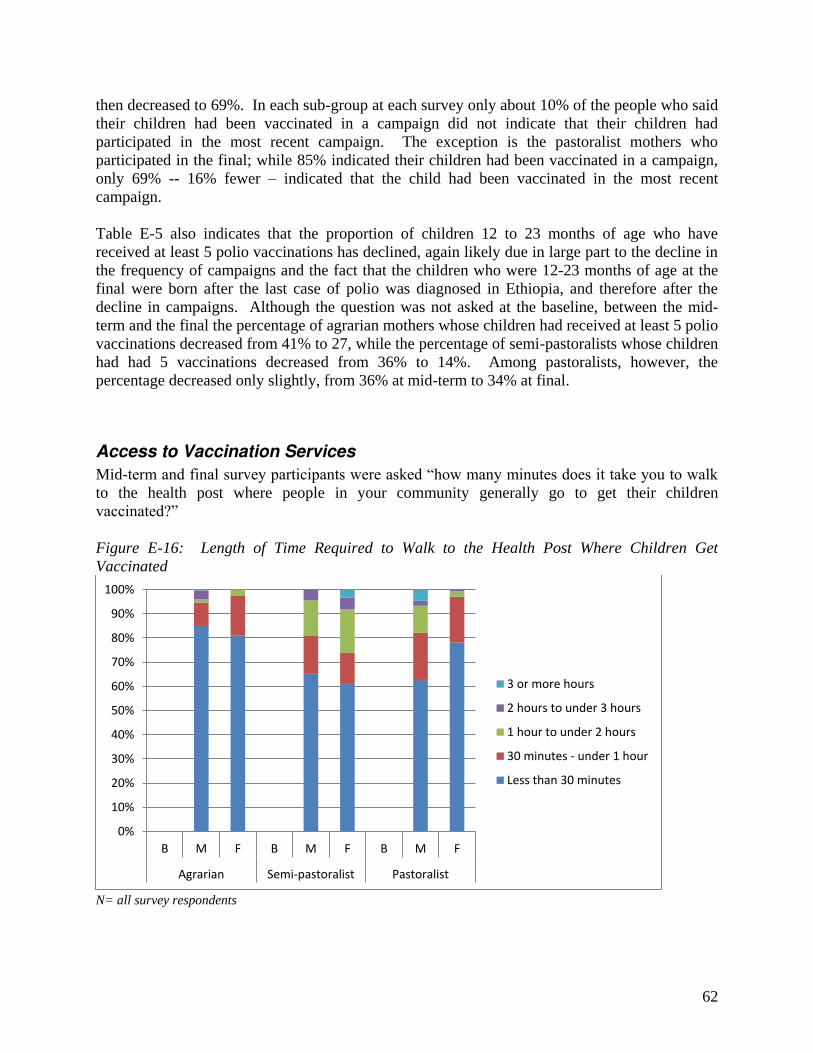
62
then decreased to 69%. In each sub-group at each survey only about 10% of the people who said their children had been vaccinated in a campaign did not indicate that their children had participated in the most recent campaign. The exception is the pastoralist mothers who participated in the final; while 85% indicated their children had been vaccinated in a campaign, only 69% -- 16% fewer – indicated that the child had been vaccinated in the most recent campaign. Table E-5 also indicates that the proportion of children 12 to 23 months of age who have received at least 5 polio vaccinations has declined, again likely due in large part to the decline in the frequency of campaigns and the fact that the children who were 12-23 months of age at the final were born after the last case of polio was diagnosed in Ethiopia, and therefore after the decline in campaigns. Although the question was not asked at the baseline, between the mid-term and the final the percentage of agrarian mothers whose children had received at least 5 polio vaccinations decreased from 41% to 27, while the percentage of semi-pastoralists whose children had had 5 vaccinations decreased from 36% to 14%. Among pastoralists, however, the percentage decreased only slightly, from 36% at mid-term to 34% at final.
Access to Vaccination Services
Mid-term and final survey participants were asked “how many minutes does it take you to walk to the health post where people in your community generally go to get their children vaccinated?” Figure E-16: Length of Time Required to Walk to the Health Post Where Children Get Vaccinated
N= all survey respondents
0%
10%
20%
30%
40%
50%
60%
70%
80%
90%
100%
B M F B M F B M F
Agrarian Semi-pastoralist Pastoralist
3 or more hours
2 hours to under 3 hours
1 hour to under 2 hours
30 minutes - under 1 hour
Less than 30 minutes
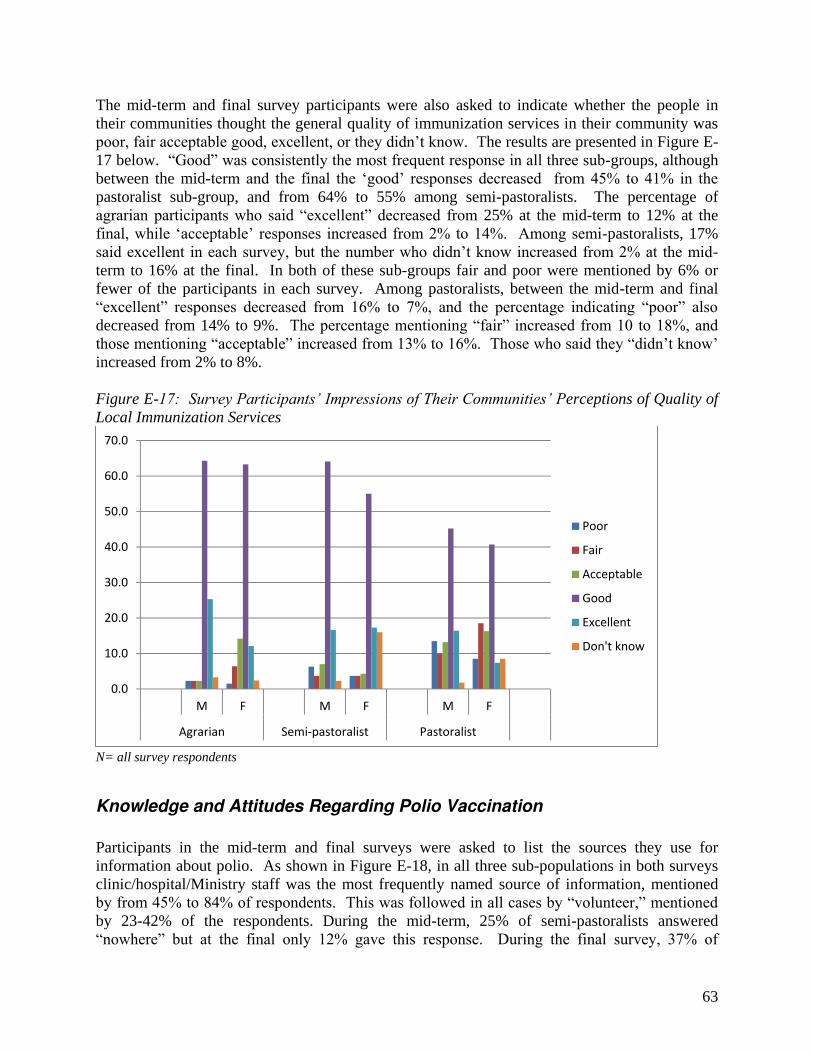
63
The mid-term and final survey participants were also asked to indicate whether the people in their communities thought the general quality of immunization services in their community was poor, fair acceptable good, excellent, or they didn’t know. The results are presented in Figure E-17 below. “Good” was consistently the most frequent response in all three sub-groups, although between the mid-term and the final the ‘good’ responses decreased from 45% to 41% in the pastoralist sub-group, and from 64% to 55% among semi-pastoralists. The percentage of agrarian participants who said “excellent” decreased from 25% at the mid-term to 12% at the final, while ‘acceptable’ responses increased from 2% to 14%. Among semi-pastoralists, 17% said excellent in each survey, but the number who didn’t know increased from 2% at the mid-term to 16% at the final. In both of these sub-groups fair and poor were mentioned by 6% or fewer of the participants in each survey. Among pastoralists, between the mid-term and final “excellent” responses decreased from 16% to 7%, and the percentage indicating “poor” also decreased from 14% to 9%. The percentage mentioning “fair” increased from 10 to 18%, and those mentioning “acceptable” increased from 13% to 16%. Those who said they “didn’t know’ increased from 2% to 8%. Figure E-17: Survey Participants’ Impressions of Their Communities’ Perceptions of Quality of Local Immunization Services
N= all survey respondents
Knowledge and Attitudes Regarding Polio Vaccination
Participants in the mid-term and final surveys were asked to list the sources they use for information about polio. As shown in Figure E-18, in all three sub-populations in both surveys clinic/hospital/Ministry staff was the most frequently named source of information, mentioned by from 45% to 84% of respondents. This was followed in all cases by “volunteer,” mentioned by 23-42% of the respondents. During the mid-term, 25% of semi-pastoralists answered “nowhere” but at the final only 12% gave this response. During the final survey, 37% of
0.0
10.0
20.0
30.0
40.0
50.0
60.0
70.0
M F M F M F
Agrarian Semi-pastoralist Pastoralist
Poor
Fair
Acceptable
Good
Excellent
Don't know

64
pastoralists mentioned friend/neighbor. None of the other responses were mentioned by more than 15% of respondents in any group during either survey. Figure E-18: Distribution of Survey Participants by Population Sub-group, Survey and Source(s) of Information on Polio in General
N= all survey respondents Mid-term and final survey participants were asked “at what age does a baby need to receive the first dose of polio vaccine?” As illustrated in Figure E-19 below, 59% of the semi-pastoralist participants in the final survey correctly said in the first two weeks, an increase from 39% at the mid-term, while the percent of pastoralists who answered correctly decreased from 60% at the mid-term to 32% at the final. About 31% of the agrarian respondents in both surveys answered correctly. Interestingly, as shown in Table E-3 above, based on cards plus recall in the final survey 53% of semi-pastoralist respondents’ children 12-23 months of age had received OPV0, representing both an increase in that population sub-group from 41% at the mid-term, as well as higher OPV0 coverage than was found in the other sub-groups in either survey. About 55% of agrarian respondents in each survey indicated that babies should receive the first polio dose at later than two weeks. The percentage of semi-pastoralists who gave that answer decreased from 37% at the mid-term to 20% at the final while pastoralists who gave that answer increased from 27% to 49%. The remaining didn’t know. As shown in Table E-3 above, OPV0 coverage is very low in the populations served by CGPP – ranging from 32-53% at the final based on card plus recall, but knowledge may have contributed to the higher coverage among semi-pastoralist children. Although other cultural factors and limited outreach resources contribute to poor OPV0 coverage strengthened education and promotion of the importance of the OPV0 dose for newborns could enhance CGPP’s contributions to polio eradication and child health.
0.0
10.0
20.0
30.0
40.0
50.0
60.0
70.0
80.0
90.0
M F M F M F
Agrarian Semi-pastoralist Pastoralist
Radio/TV Family
Friend/Neighbor Volunteer
Printed materials Clinic/hospital/Ministry staff
Nowhere Other
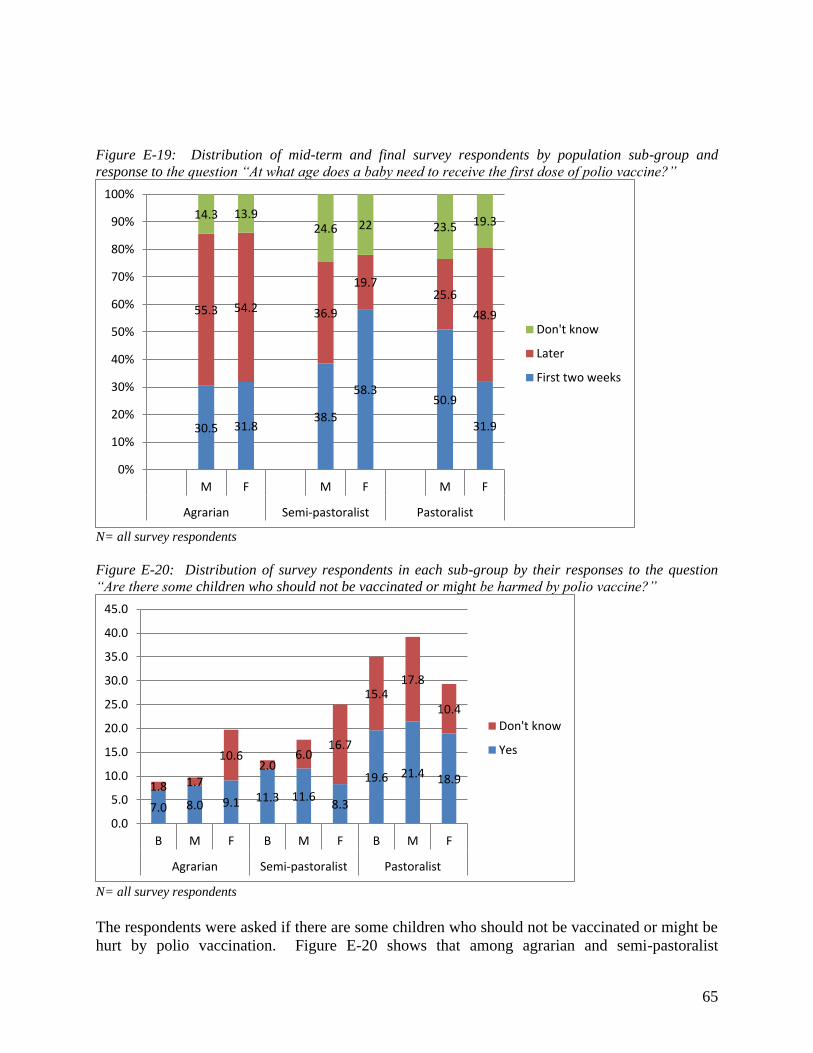
65
Figure E-19: Distribution of mid-term and final survey respondents by population sub-group and response to the question “At what age does a baby need to receive the first dose of polio vaccine?”
N= all survey respondents Figure E-20: Distribution of survey respondents in each sub-group by their responses to the question “Are there some children who should not be vaccinated or might be harmed by polio vaccine?”
N= all survey respondents The respondents were asked if there are some children who should not be vaccinated or might be hurt by polio vaccination. Figure E-20 shows that among agrarian and semi-pastoralist
30.5 31.8 38.5
58.3 50.9
31.9
55.3 54.2 36.9
19.7 25.6
48.9
14.3 13.9 24.6 22 23.5 19.3
0%
10%
20%
30%
40%
50%
60%
70%
80%
90%
100%
M F M F M F
Agrarian Semi-pastoralist Pastoralist
Don't know
Later
First two weeks
7.0 8.0 9.1 11.3 11.6 8.3
19.6 21.4 18.9 1.8 1.7
10.6 2.0
6.0 16.7
15.4 17.8
10.4
0.0
5.0
10.0
15.0
20.0
25.0
30.0
35.0
40.0
45.0
B M F B M F B M F
Agrarian Semi-pastoralist Pastoralist
Don't know
Yes
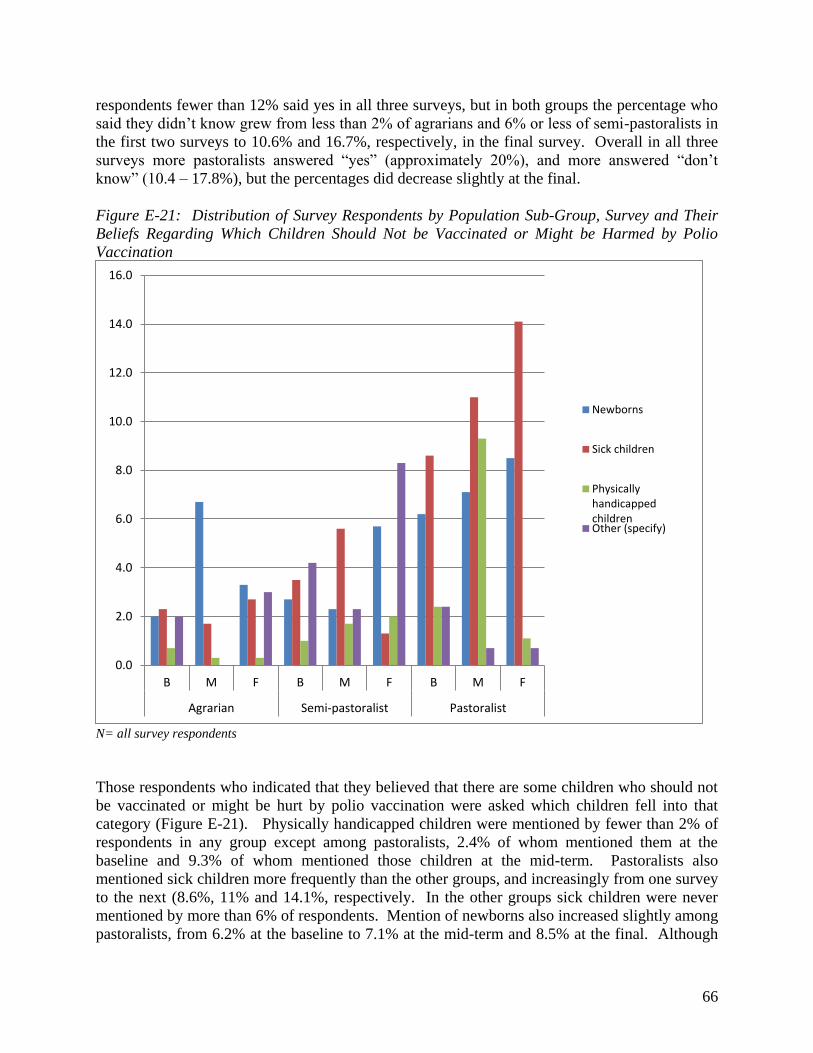
66
respondents fewer than 12% said yes in all three surveys, but in both groups the percentage who said they didn’t know grew from less than 2% of agrarians and 6% or less of semi-pastoralists in the first two surveys to 10.6% and 16.7%, respectively, in the final survey. Overall in all three surveys more pastoralists answered “yes” (approximately 20%), and more answered “don’t know” (10.4 – 17.8%), but the percentages did decrease slightly at the final. Figure E-21: Distribution of Survey Respondents by Population Sub-Group, Survey and Their Beliefs Regarding Which Children Should Not be Vaccinated or Might be Harmed by Polio Vaccination
N= all survey respondents Those respondents who indicated that they believed that there are some children who should not be vaccinated or might be hurt by polio vaccination were asked which children fell into that category (Figure E-21). Physically handicapped children were mentioned by fewer than 2% of respondents in any group except among pastoralists, 2.4% of whom mentioned them at the baseline and 9.3% of whom mentioned those children at the mid-term. Pastoralists also mentioned sick children more frequently than the other groups, and increasingly from one survey to the next (8.6%, 11% and 14.1%, respectively. In the other groups sick children were never mentioned by more than 6% of respondents. Mention of newborns also increased slightly among pastoralists, from 6.2% at the baseline to 7.1% at the mid-term and 8.5% at the final. Although
0.0
2.0
4.0
6.0
8.0
10.0
12.0
14.0
16.0
B M F B M F B M F
Agrarian Semi-pastoralist Pastoralist
Newborns
Sick children
Physically
handicapped
childrenOther (specify)

67
6.7% of agrarians mentioned newborns at the mid-term only 3.3% mentioned them at the final; among semi-pastoralists less than 6% mentioned newborns at the final, while less than 3% mentioned newborns in the earlier surveys. Finally, at the final survey the respondents were also asked what would happen if a child received many doses of polio vaccine. As shown in Figure E-22, 66% of agrarian respondents, 79% of semi-pastoralists and 50% of pastoralists indicated that the child would be more protected from polio. Only 3% of semi-pastoralists, 12% of agrarians, and 21% of pastoralists said the child may be harmed, while 0.3%, 5% and 6% respectively said the child would not be helped or harmed. Close to 20% in each group said they didn’t know or weren’t sure what would happen. Figure E-22: Distribution of Final Survey Respondents by Population Sub-group and Response(s) to the Question: “What would happen if a child received many doses of polio vaccine?”
N= all survey respondents
AFP Surveillance
The CGPP secretariat and partners have made community-based AFP surveillance a priority element of the project interventions, and have a history of moving into AFP zero reporting areas, training local community members as Community-based Volunteer Surveillance Focal Persons (CVSFPs) to both participate in and promote AFP surveillance, and achieving at least some level of AFP reporting. The data in Table E-6 below suggests that in the CGPP areas, some of which are new and most of which had performed very poorly relative to AFP surveillance, the vast majority of those who have heard of AFP know the signs to look for and know whom to contact if they do see a case of AFP. As Ethiopia moves toward certification status, and with on-going
0
20
40
60
80
100
120
F F F
Agrarian Semi-
pastoralist
Pastoralist
Don't know/Not sure
Nothing/child not helped or
harmed
Child may be harmed
Child is more protected from
polio
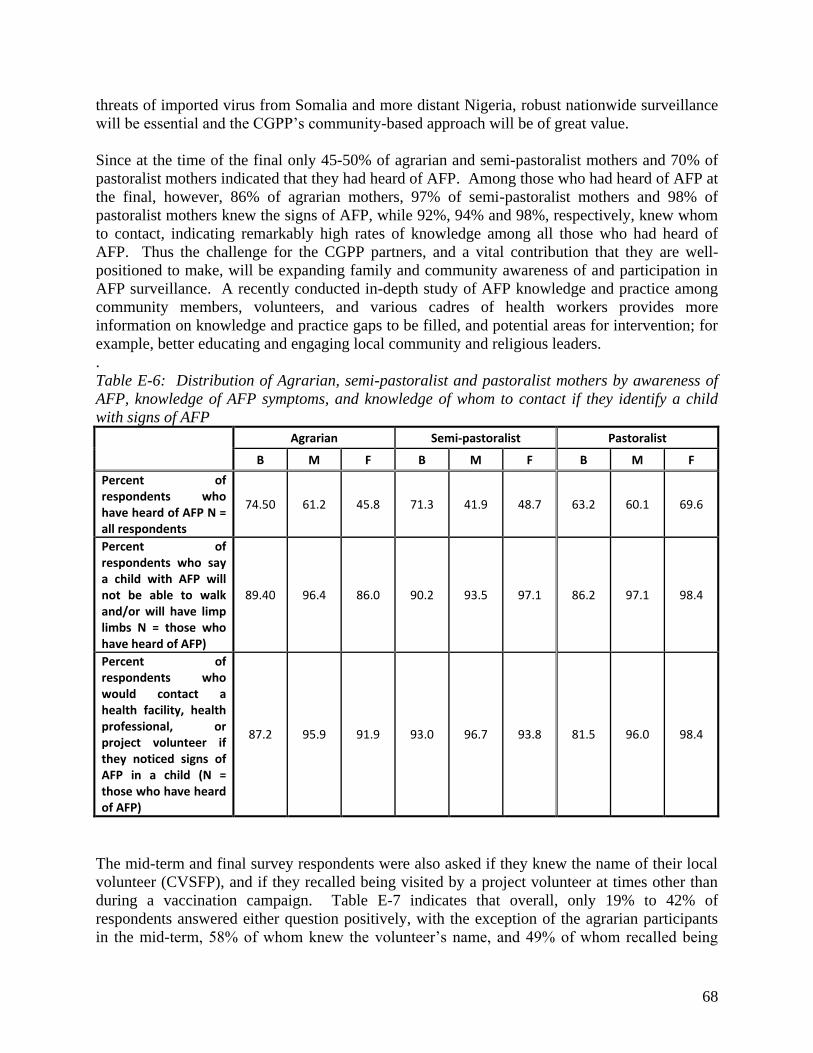
68
threats of imported virus from Somalia and more distant Nigeria, robust nationwide surveillance will be essential and the CGPP’s community-based approach will be of great value. Since at the time of the final only 45-50% of agrarian and semi-pastoralist mothers and 70% of pastoralist mothers indicated that they had heard of AFP. Among those who had heard of AFP at the final, however, 86% of agrarian mothers, 97% of semi-pastoralist mothers and 98% of pastoralist mothers knew the signs of AFP, while 92%, 94% and 98%, respectively, knew whom to contact, indicating remarkably high rates of knowledge among all those who had heard of AFP. Thus the challenge for the CGPP partners, and a vital contribution that they are well-positioned to make, will be expanding family and community awareness of and participation in AFP surveillance. A recently conducted in-depth study of AFP knowledge and practice among community members, volunteers, and various cadres of health workers provides more information on knowledge and practice gaps to be filled, and potential areas for intervention; for example, better educating and engaging local community and religious leaders. . Table E-6: Distribution of Agrarian, semi-pastoralist and pastoralist mothers by awareness of AFP, knowledge of AFP symptoms, and knowledge of whom to contact if they identify a child with signs of AFP
Agrarian Semi-pastoralist Pastoralist
B M F B M F B M F
Percent of
respondents who
have heard of AFP N =
all respondents
74.50 61.2 45.8 71.3 41.9 48.7 63.2 60.1 69.6
Percent of
respondents who say
a child with AFP will
not be able to walk
and/or will have limp
limbs N = those who
have heard of AFP)
89.40 96.4 86.0 90.2 93.5 97.1 86.2 97.1 98.4
Percent of
respondents who
would contact a
health facility, health
professional, or
project volunteer if
they noticed signs of
AFP in a child (N =
those who have heard
of AFP)
87.2 95.9 91.9 93.0 96.7 93.8 81.5 96.0 98.4
The mid-term and final survey respondents were also asked if they knew the name of their local volunteer (CVSFP), and if they recalled being visited by a project volunteer at times other than during a vaccination campaign. Table E-7 indicates that overall, only 19% to 42% of respondents answered either question positively, with the exception of the agrarian participants in the mid-term, 58% of whom knew the volunteer’s name, and 49% of whom recalled being

69
visited. The final survey, however, found that only 19% in the agrarian sub-group remembered their volunteer’s name, and 35% recalled being visited outside of vaccination campaign days. Since mass polio vaccination campaigns are no longer being conducted in Ethiopia this is of concern. 9 Among the semi-pastoralists, just over 40% in both surveys knew the volunteer’s name, and about 34% remembered being visited. Among pastoralists, 39% at the baseline and 34% at the final knew the volunteer’s name, while 19% and 26%, respectively, remembered being visited.
Health Education/Social Mobilization
In order to achieve the CGPP objectives regarding improved polio and routine immunization and AFP surveillance families and communities must be educated and encouraged to have their children vaccinated and to recognize and report possible AFP cases. Home visits and health education sessions conducted by the trained project volunteers are intended to support these goals. Therefore, the mid-term and final surveys included questions regarding home visits, health education sessions and the topics discussed. Table E-8 describes the percentages of respondents from each population sub-group in each survey who recalled being visited by a project volunteer at a time other than during a vaccination campaign as well as those who recalled attending a health education session conducted by the project. Fewer than 50% of respondents in any group remembered either occurring. While 49% of agrarian participants in the mid-term remembered a home visit outside of a campaign, on 34.5% recalled a visit at the final. Among semi-pastoralists, 33.2% to 34.7% recalled a visit, while among pastoralists only 19.2% to 25.9% recalled a visit. Table E-8: Distribution of Respondents by Population Sub-Group, Survey and Participation in a Home Visit Outside of Campaigns, and by Attendance at a Health Education Session by a Health Volunteer
Agrarian Semi-pastoralist Pastoralist
M F M F M F
Percent of respondents who recall
being visited at their home by a project
volunteer at times other than the days
of a vaccination campaign
49.0 34.5 33.2 34.7 19.2 25.9
Percent of respondents who recall
attending a health education session
conducted by a project volunteer
28.0 21.2 27.9 37 20.6 15.2
N= all survey respondents
9 Note that other CGPP research activities conducted in 2012 and reported elsewhere also highlighted the need for the secretariat and partners to focus some of their resources on strengthening training and supervision of the project volunteers, as well as enhancing the capacity of local health and health education workers and community leaders in order to strengthen both health seeking/disease prevention and AFP surveillance. See AFP case detection and status of surveillance in pastoralist and semi-pastoralist communities of CORE Group Polio Project implementation districts (woredas) in Ethiopia, and Newborn Tracking for Polio birth dose vaccination in Pastoralist and Semi-pastoralist CORE Group Polio Project Implementation Districts (Woredas) in Ethiopia.
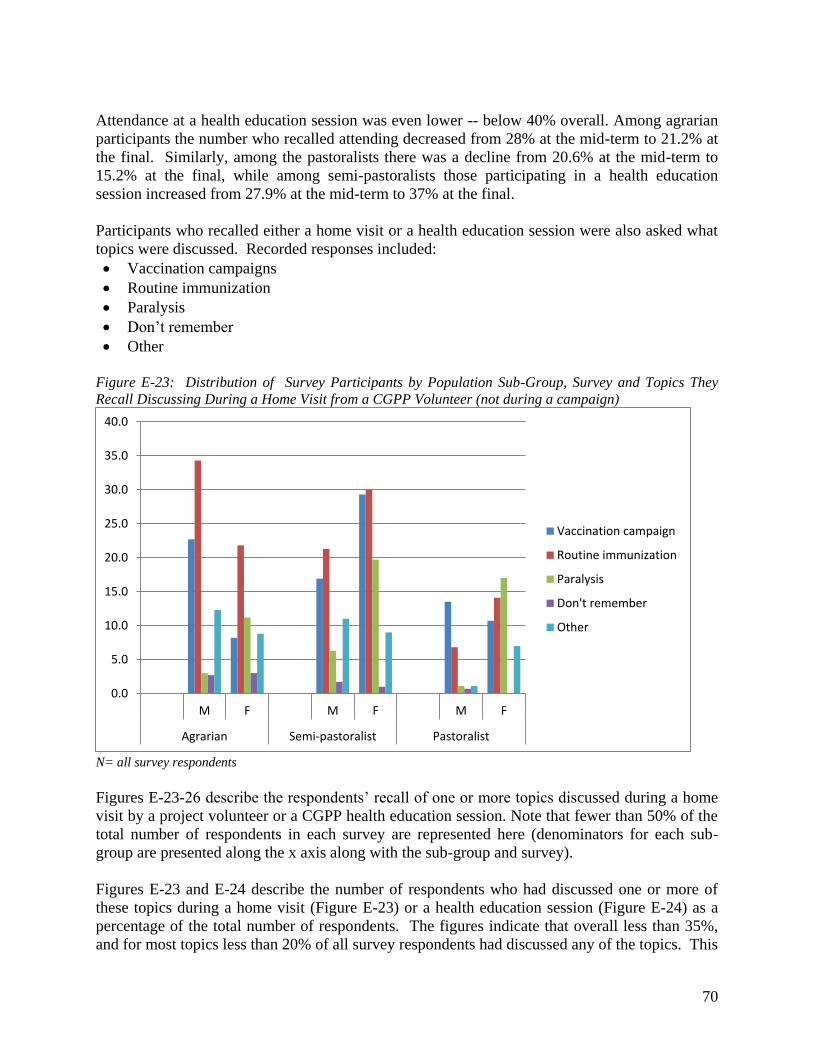
70
Attendance at a health education session was even lower -- below 40% overall. Among agrarian participants the number who recalled attending decreased from 28% at the mid-term to 21.2% at the final. Similarly, among the pastoralists there was a decline from 20.6% at the mid-term to 15.2% at the final, while among semi-pastoralists those participating in a health education session increased from 27.9% at the mid-term to 37% at the final. Participants who recalled either a home visit or a health education session were also asked what topics were discussed. Recorded responses included: Vaccination campaigns Routine immunization Paralysis Don’t remember Other
Figure E-23: Distribution of Survey Participants by Population Sub-Group, Survey and Topics They Recall Discussing During a Home Visit from a CGPP Volunteer (not during a campaign)
N= all survey respondents Figures E-23-26 describe the respondents’ recall of one or more topics discussed during a home visit by a project volunteer or a CGPP health education session. Note that fewer than 50% of the total number of respondents in each survey are represented here (denominators for each sub-group are presented along the x axis along with the sub-group and survey). Figures E-23 and E-24 describe the number of respondents who had discussed one or more of these topics during a home visit (Figure E-23) or a health education session (Figure E-24) as a percentage of the total number of respondents. The figures indicate that overall less than 35%, and for most topics less than 20% of all survey respondents had discussed any of the topics. This
0.0
5.0
10.0
15.0
20.0
25.0
30.0
35.0
40.0
M F M F M F
Agrarian Semi-pastoralist Pastoralist
Vaccination campaign
Routine immunization
Paralysis
Don't remember
Other
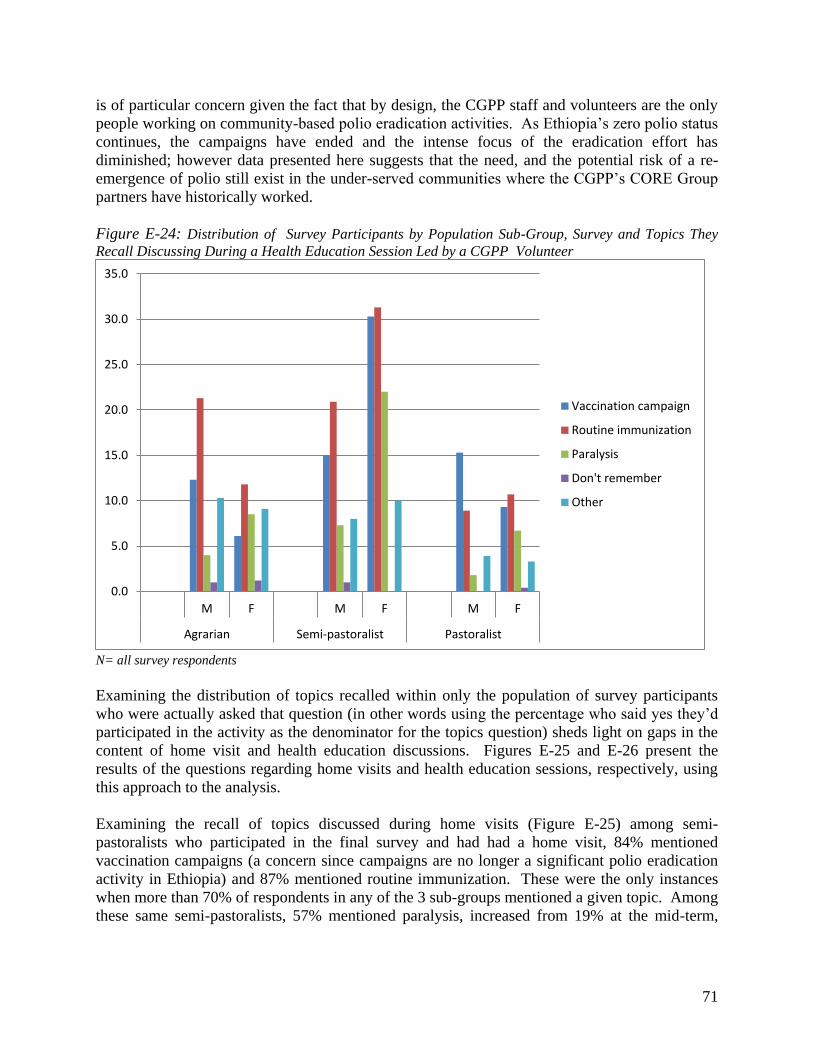
71
is of particular concern given the fact that by design, the CGPP staff and volunteers are the only people working on community-based polio eradication activities. As Ethiopia’s zero polio status continues, the campaigns have ended and the intense focus of the eradication effort has diminished; however data presented here suggests that the need, and the potential risk of a re-emergence of polio still exist in the under-served communities where the CGPP’s CORE Group partners have historically worked. Figure E-24: Distribution of Survey Participants by Population Sub-Group, Survey and Topics They Recall Discussing During a Health Education Session Led by a CGPP Volunteer
N= all survey respondents Examining the distribution of topics recalled within only the population of survey participants who were actually asked that question (in other words using the percentage who said yes they’d participated in the activity as the denominator for the topics question) sheds light on gaps in the content of home visit and health education discussions. Figures E-25 and E-26 present the results of the questions regarding home visits and health education sessions, respectively, using this approach to the analysis. Examining the recall of topics discussed during home visits (Figure E-25) among semi-pastoralists who participated in the final survey and had had a home visit, 84% mentioned vaccination campaigns (a concern since campaigns are no longer a significant polio eradication activity in Ethiopia) and 87% mentioned routine immunization. These were the only instances when more than 70% of respondents in any of the 3 sub-groups mentioned a given topic. Among these same semi-pastoralists, 57% mentioned paralysis, increased from 19% at the mid-term,
0.0
5.0
10.0
15.0
20.0
25.0
30.0
35.0
M F M F M F
Agrarian Semi-pastoralist Pastoralist
Vaccination campaign
Routine immunization
Paralysis
Don't remember
Other
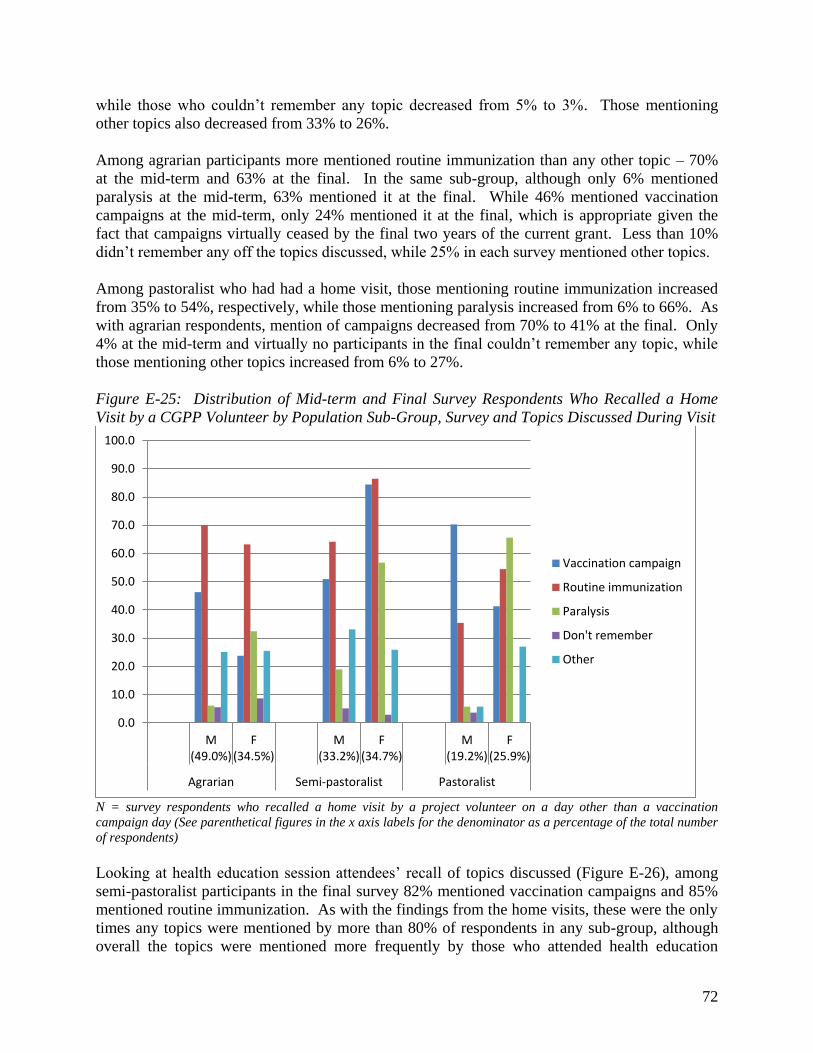
72
while those who couldn’t remember any topic decreased from 5% to 3%. Those mentioning other topics also decreased from 33% to 26%. Among agrarian participants more mentioned routine immunization than any other topic – 70% at the mid-term and 63% at the final. In the same sub-group, although only 6% mentioned paralysis at the mid-term, 63% mentioned it at the final. While 46% mentioned vaccination campaigns at the mid-term, only 24% mentioned it at the final, which is appropriate given the fact that campaigns virtually ceased by the final two years of the current grant. Less than 10% didn’t remember any off the topics discussed, while 25% in each survey mentioned other topics. Among pastoralist who had had a home visit, those mentioning routine immunization increased from 35% to 54%, respectively, while those mentioning paralysis increased from 6% to 66%. As with agrarian respondents, mention of campaigns decreased from 70% to 41% at the final. Only 4% at the mid-term and virtually no participants in the final couldn’t remember any topic, while those mentioning other topics increased from 6% to 27%. Figure E-25: Distribution of Mid-term and Final Survey Respondents Who Recalled a Home Visit by a CGPP Volunteer by Population Sub-Group, Survey and Topics Discussed During Visit
N = survey respondents who recalled a home visit by a project volunteer on a day other than a vaccination campaign day (See parenthetical figures in the x axis labels for the denominator as a percentage of the total number of respondents) Looking at health education session attendees’ recall of topics discussed (Figure E-26), among semi-pastoralist participants in the final survey 82% mentioned vaccination campaigns and 85% mentioned routine immunization. As with the findings from the home visits, these were the only times any topics were mentioned by more than 80% of respondents in any sub-group, although overall the topics were mentioned more frequently by those who attended health education
0.0
10.0
20.0
30.0
40.0
50.0
60.0
70.0
80.0
90.0
100.0
M
(49.0%)
F
(34.5%)
M
(33.2%)
F
(34.7%)
M
(19.2%)
F
(25.9%)
Agrarian Semi-pastoralist Pastoralist
Vaccination campaign
Routine immunization
Paralysis
Don't remember
Other

73
sessions than by those who received home visits. This may be a function of the fact that attending a health education session is pro-active, implying a pre-existing interest. Among agrarian and semi-pastoralist respondents the most frequently mentioned topic in each survey was routine immunization. More agrarian participants mentioned vaccination campaigns than paralysis at the mid-term (44% and 14.3%, respectively) but by the final more mothers mentioned paralysis than campaigns (40% and 29%, respectively). While less than 10% couldn’t remember any topic, 37% at the mid-term and 43% at the final mentioned other topics. In addition to the 80%+ of semi-pastoralist respondents who mentioned vaccination campaigns and routine immunization (up from 54% and 75%, respectively), at the final 60% mentioned paralysis, up from 26% at the mid-term. Just 4% at the mid-term and zero at the final couldn’t remember any topic, while approximately 28% in each survey mentioned other topics. Figure E-26: Distribution of Mid-term and Final Survey Respondents Who Attended a Health Education Session by a CGPP Volunteer by Population Sub-Group, Survey and Topics Discussed During Visit
N = survey respondents who attended a CGPP health education session (See parenthetical figures in the x axis labels for the denominator as a percentage of the total number of respondents) Pastoralists mentioning campaigns also decreased between the mid-term and final from 74% to 61%, while those mentioning routine immunization increased from 43% to 70%, and those mentioning paralysis increased from 9% to 44%. No mid-term participants and just 3% of final survey participants couldn’t remember any topic while those mentioning other topics increased from 19% to 22%.
0.0
10.0
20.0
30.0
40.0
50.0
60.0
70.0
80.0
90.0
M
(28.0%)
F
(21.2%)
M
(27.9%)
F
(37.0%)
M
(20.6%)
F
(15.2%)
Agrarian Semi-pastoralist Pastoralist
Vaccination campaign
Routine immunization
Paralysis
Don't remember
Other
74
Ultimately this data suggests that it will be important for the CGPP partners to strengthen the discussion and health education session guidelines or curricula as well as the volunteers’ capacity to deliver health messages effectively in order to successfully reach and mobilize more people to participate in immunization and surveillance. Also, since campaigns have ended, this issue should no longer be emphasized.
QUALITATIVE DATA
In addition to the quantitative household survey, key informants from the GoE Federal Ministry of Health, Rotary Club, UNICEF, WHO and the CORE Group international partners as well as local NGOs were interviewed using a standardized interview guide. In addition to their perspectives on programmatic issues and CGPP contributions to polio eradication and disease prevention in their operating areas, they also shed light on CGPP’s effectiveness and contributions as a partnering organization within the context of the Ethiopian health sector, the Ethiopian polio eradication effort, and local technical and organizational management capacity building. Dr. Beza of the GoE’s Federal Ministry of Health recognized the CGPP secretariat’s active involvement as a member of the Inter-agency Coordinating Committee (ICC), its support for the Ministry’s priorities, as well as the ICC’s, and its encouragement of effective PEI implementation, particularly through support for the development of national guidelines on immunization and polio eradication. The CGPP has actively supported PEI trainings, workshops and other capacity building activities, as well as strengthening the polio eradication effort through its community-based surveillance program, support for SIAs, and support for routine immunization, particularly in border, marginalized and emerging regions at risk. The project’s contributions also include development of information/education/communication (iec) and behavior change communications materials, radio spots, advocacy tools, and methods and toolds for documenting PEI and other health sector activities. Dr. Beza indicated that there is “no question that CORE Group scaling up its support at the national level would be vital.” UNICEF ’s representative, Dr. Tersit, indicated that without the CGPPs partnership with other PEI implementing organizations at the regional level, gaps in the local administrations’ financial and technical resources would negatively impact both the immunization and the disease surveillance situations in high risk areas. In particular, the direct support and technical assistance CGPP partners provide to local NGOs in pastoralist, border and marginalized regions such as Afar, Gambella and Somali region have allowed them to do “a great job in improving immunization coverage as well as case detection and reporting.” CGPPs contributions to the ICC include valuable support for the ICC’s SIA task force. Dr. Tersit in fact stated that he would like to see CGPPs human resources increased so that the partners could be fully engaged in, for example, the national SIA task force’s program coordination, and could expand CGPP operations into more of the country’s high risk regions, including urban centers. The WHO representative, Dr. Fiona, indicated that the CGPP partners work in and contribute to effective surveillance in areas that have some of the greatest surveillance challenges. Further,
75
they have supported stronger surveillance in Ethiopia by establishing community-based surveillance in selected woredas, organizing cross-border meetings, and supporting synchronous SIAs. CGPP collaborates with WHO on training, especially for periphery health workers, participates in review processes and shares weekly surveillance data with a wide audience.
Mr. Ato Mohammod, the Rotary International/Ethiopia representative, indicated that the CGPP plays a leading role in coordinating many other NGOs working on PEI in Ethiopia. “It enables its partnering organization to focus on interventions of the initiative in a more focused manner [than] any other organizations I know of in the country. . . It generally operates…in a manner which shows a huge sense of ownership and strong drive [to] motivate others to do the same… CGPP is always seen as a front runner in promoting PEI in the country.” He went on to say that “In Shinnille zone in Somali Region the observed high level success in increasing awareness and coverage would not have been possible without CGPP providing support to Woreda Health Offices through the [local partners] it funds.” In addition to the support for CBS and PEI immunization activities, the CGPP partners also work with counterparts to strengthen health service delivery infrastructure at the woreda level. He added that the CGPP strengthens the surveillance program by participating in monitoring and evaluation, identifying gaps, and doing its share to bridge those gaps. The CGPP invites Rotary and other PEI partners to participate in capacity building trainings both as ‘trainees’ and as resource persons, and includes them actively in the joint planning and monitoring activities that the CGPP leads. The CGPP partners also provide direct logistical and hosting/accomodations assistance to Rotary and its international visitors (who are important in the global effort to raise awareness and maintain adequate funding for PEI). Representatives from the CGPP partners’ national offices in Addis and field offices in CGPP implementation areas consistently mentioned the following contributions CGPP had made:
CGPP’s community-based surveillance, including house-to-house activities, has strengthened AFP case reporting, and previously silent areas now covered by CGPP are reporting monthly, including zero case reporting. The project partners have also been able to expand community-based surveillance to include neonatal tetanus and measles as well as AFP
CGPP’s technical, resource and logistics support to the Woreda health offices has ensured routine immunization services in areas where those services would otherwise have been sporadic or non-existent.
Some partners reported that in their CGPP catchment areas local data indicates improved immunization coverage. For example, AMREF/Awash indicated annual incremental increases of 6% to 15%, and EECMY/Gambella indicated an increase “from 14% to about 73%.”
In addition to supporting CBS and PEI activities, CGPP efforts, and in some areas establishment of mobile immunization teams, have strengthened woreda level capacity and health service delivery infrastructure so that periphery and hard-to-reach communities are reached
CGPP advocacy efforts at the regional and woreda level have mobilized resources and political support for PEI
76
The GoE is planning to establish a “Health Development Army” (HDA) and the CGPP partners are likely to play a critical role in strengthening this community-based structure
The CGPP Partners’ Forum provides a valuable opportunity for the international and local partners to get technical and program updates and share field experiences, lessons learned and emerging best practices
Training and other capacity building support has been especially valuable. Training and refresher training sessions have included resource persons from the Federal Ministry of Health, UNICEF and WHO and have enhanced the skills of CVSFPs, health extension workers, Woreda Health Office staff, and CGPP partners staff at national and field levels. In fact, AMREF mentioned that this and other capacity-building technical support was even more valuable than funding support, particularly since strengthened staff capacity to implement health projects has had a “spill-over effect” on other AMREF projects
CGPP capacity building support for the project and the broader health sector also includes strengthening documentation capacity by supporting printing and distribution of registration books, immunization cards and report forms and establishing/strengthening record keeping systems at the local woreda health office and facility levels
Supportive supervision for field offices, with regular on-site visits and in-person support as well as written feedback from the secretariat to both the field and national offices
The CGPP leadership has been effective at boosting morale and at motivating not only project volunteers but also the local health extension workers and HDA personnel
The CGPP secretariat staff are seen as being always available and providing helpful assistance through what ever channels are available (field visits, telephone calls, written communications, etc.)
Partner Recommendations
The FMOH representative recommended that the project continue to direct its invaluable contributions to border, low performing and pastoralist areas and expand to other parts of the country including urban areas. Key CGPP activities should include PEI advocacy with all partners at all levels to ensure adequate political commitment and mobilization of sufficient resources for PEI, and capacity building for woreda level and health facility staff to sustain gains in routine service delivery
The WHO and UNICEF spokespersons indicated that “CBS needs to be scaled up to allow for early detection of all AFP cases …[since] with polio close to eradication, enhancing surveillance is necessary to ensure that no case is missed.”
Currently the CGPP field budget covers program costs only; it would be helpful if the project obtained sufficient resources to allocate funds to the partners’ project managers and non-technical support officers as the limited funds available to CGPP partners stretches their management staff and resources
More frequent supportive supervision for field staff, as well as more capacity building and refresher training opportunities for CVSFPs and health extension workers
Providing refrigerators, motor bikes and solar batteries to local health facilities would expand the reach of immunization services and reduce vaccine and kerosene costs
Regarding scaling up, UNICEF and most of the CGPP partners advocated for a staged approach focusing on expanding first to those border areas, marginalized and high risk woredas in the zones and regions where CGPP currently has a presence, and then expand
77
to new regions, prioritizing areas that pose a threat to universal immunization coverage and polio eradication
RECOMMENDATIONS
1. As Ethiopia continues to maintain zero polio status and approaches certification, the CGPP’s contributions are at least as important as ever, since the potential remains high for cross-border transmission of poliovirus from Nigeria or from re-infected countries, potentially including both S. Sudan and Somalia on the western and south eastern borders. Universal immunization coverage and robust, pro-active surveillance that meets WHO standards for quality and coverage are still important objectives to achieve.
2. The final survey data along with other targeted research conducted by CGPP in 2012 highlight on-going challenges to be addressed including: Poor immunization card retention Very low OPV0 coverage and sub-optimal OPV2 and OPV3 coverage Knowledge gaps related to the need for an OPV0 dose within 2 weeks of birth Misunderstandings regarding contraindications for polio vaccination, especially among
pastoralist communities Apparently poor coverage of essential polio eradication, routine immunization and AFP
surveillance messages during volunteers’ home visits and health education sessions
3. Consider pursuing:
Partner recommendations (discussed above) Focus group discussions to further explore key issues raised in the 2012 research Updating and strengthening volunteer training curricula, and inviting health education
workers and other health workers in the communities to participate in training and/or refresher training sessions
Ensure that polio campaign information is no longer a key focus of CVSFPs or health education messages
Increase the frequency of refresher training for volunteers Explore training of trainer opportunities to expand the reach of the volunteers, and
strengthen volunteer supervision Introduce new activities to acknowledge and celebrate volunteers and their achievements
and encourage them to take pride in and focus on quality in their work – CGPP India has had great success maintaining morale among their community-based workers and strengthening awareness of the project and the importance of polio eradication among local leaders through their annual jamborees
Explore the potential for ‘positive deviance’ approaches and interventions to promote immunization and other health seeking and disease prevention behaviors
Advocate through all appropriate channels for strengthened immunization outreach services, especially to reach newborns with OPV0 – consider discussing these issues at the next Horn of Africa TAG and/or at other regional meetings or at technical meetings with WHO, UNICEF and GAVI to explore successful approaches in use elsewhere
78
Explore opportunities to link other child health interventions such as home hygiene and sanitation to the existing CGPP platform
CGPP/India Evaluation Findings
BACKGROUND
When the current (FY2008-2012) USAID grant began India was one of the only four remaining polio-endemic countries that had never succeeded in interrupting poliovirus transmission, along with Nigeria, Pakistan and Afghanistan. Within India, Uttar Pradesh (UP) and Bihar, two underserved states with poor socio-economic status and infrastructure located in northern India along the Nepal border, were the only polio-endemic states in India. The CGPP partners implemented their activities in ten high risk districts of UP, which had been the epicenter of numerous outbreaks. Of the 741 cases in India in 2009, 602 occurred in UP. (At this writing, UP has achieved zero polio status and India has been officially declared polio free.) When the CGPP first began working in India in 1999/2000 the Indian government, with technical support from the US Centers for Disease Control and Prevention, had already established an extremely effective AFP surveillance system. Therefore, the CGPP partners focused on increasing polio immunization coverage by promoting participation in the almost monthly UP-wide polio vaccination campaigns and routine immunization (RI) services. In the high risk districts where the CGPP partners worked many families resisted having their children immunized against polio, either because of a lack of trust, or in protest against a perceived government focus on polio and neglect of other severe health and infrastructure needs. In partnership with UNICEF and Rotary, the CGPP partners formed the Social Mobilization Network (SMNet) and through their creative, innovative messages and materials, their success in winning community members’ trust, and careful, regular collection and use of household level immunization coverage data they contributed to the reduced resistance and increased coverage that supported India’s achievement of zero polio status in February 2012. During the CGPP funding phase under review, the main interventions in India, specifically in Uttar Pradesh (UP) continued to focus on immunization coverage (polio campaign and routine), knowledge of polio eradication, child vaccination, and participation in polio vaccination campaigns as well as health promotion and disease prevention through hygiene and sanitation. A baseline survey established the levels of key intervention-related indicators, and a mid-term survey was intended to measure progress and identify areas needing new or strengthened focus. The CGPP staff and mobilization workers at every level have developed a solid commitment and capacity for using data for monitoring, decision-making, and design and introduction of new interventions, messages and materials. The use of data for program planning and implementation was not new—decision makers used data from NPSP’s AFP Surveillance weekly reports to determine the vaccination status of children with AFP, which helped them identify gaps in coverage, prioritize districts and blocks, and direct limited resources strategically. They used coverage and performance data from national and subnational campaigns to assess campaign
79
achievements and plan for the future. As campaign monitoring improved, UP campaign implementers used real-time data in nightly government-led debriefings to support rapid situation analysis and problem-solving. Over time the CGPP has participated in, and contributed data to these data driven activities. The CGPP partners have implemented an amazing set of interventions which contributed to polio eradication, improved AFP surveillance, improved immunization coverage, established an important resource in selecting, training, and creating an important skilled health worker force at the community level known as the community mobilizers workers (CMC). The amount of household level health education was basic and effective. The degree that social mobilization, a reality tool for improving OPV and routine immunization coverage, was also remarkable.
Achievements
Since the current grant funding began UP and India as a whole have achieved historic milestones and significant progress toward polio eradication and children’s health, particularly in very high risk CGPP catchment areas of UP. Although the CGPP partners cannot take sole credit for any of these achievements, it is highly likely (and acknowledged by external partners) that CGPP interventions were important contributing factors:
1. Both UP and India officially declared polio free for the first time in history 2. On-going zero polio status nation-wide with more than 18 consecutive months with no
confirmed cases of polio 3. Improved routine immunization coverage including measles 4. The development of a strategic cadre of trained, committed community-based mobilization
workers 5. Development of highly effective social mobilization interventions supporting polio
eradication, routine immunization and other health promotion and disease prevention behaviors
METHODOLOGY
In India, the CGPP contracted a new (to CGPP) consulting firm, GfK Mode, to conduct a quantitative household survey using the same methodology applied to the 2008 baseline survey and 2010 mid-term evaluation. The CGPP catchment communities were divided into two survey areas: Area A consisted of the highly urban, primarily Muslim districts Moradabad and Rampur. Area B includes the remaining, less densely populated and more diverse districts Baghpat, Bareilly, Mau, Meerut, Muzaffarnagar, Shaharanpur, Shahjahanpur, and Sitapur. In each survey area 30 clusters were selected from within the 56 CGPP blocks using the population proportionate to size (PPS) method. For the purposes of the survey, a “cluster” refers to a village or part of a village where CGPP community mobilization coordinators (CMCs) were working. In each cluster, ten randomly selected mothers of children 12 to 23 months of age were interviewed for a total of 604 mothers including at least 300 in each of the two survey areas.
80
The consulting firm assigned a lead researcher to the survey and recruited data collectors from Lucknow and neighboring districts. The researcher and CGPP representatives coordinated a two-day training session for the data collectors covering topics including polio eradication, routine immunization and the government of India immunization schedule, the survey questionnaire, sampling methods, quality standards and reporting. Role playing sessions and a ‘dry run’ were included in the training. Each of the six data collection teams included one supervisor and four investigators. The interviews were conducted from August 8 – 26, 2012. To monitor and ensure the quality of the data collection, GfK Mode supervisors and researchers observed some interviews and conducted spot checks and back checks of completed interviews. The survey instruments were drawn from the baseline and mid-term survey instruments, with some changes introduced by CGPP to capture new interventions and concerns. The survey questionnaires were translated from English into the Hindi language. The collected data was compiled using MSAccess and cleaned by the GfK Mode Data Processing Unit in Kolkata. Range, structure and other data checks were conducted to confirm internal consistency. The survey data was then analyzed using SPSS.
CONSTRAINTS AND LIMITATIONS
The highly iterative nature of the CGPP has allowed project staff in India to respond remarkably rapidly and effectively to a very mobile virus, emerging new data about factors contributing to resistance to vaccine and vaccination services, shifting attitudes about immunization services, and emerging needs and demands at the community level. This responsiveness is widely recognized as contributing to the project’s technical success and the level of trust it now enjoys among the communities it serves. The project’s scope has also grown to include new behavior change communications activities promoting home health behaviors to improve hygiene and sanitation and reduce transmission of polio and other pathogens. The CGPP data needs and survey instruments have also changed over time such that for some of the final survey data no baseline and/or mid-term data are available for comparison. These new data will, however, provide useful snapshots to inform activities under the new grant, and could provide baseline measures for new indicators.
Review of the final survey data and discussions with the CGPP Secretariat staff in India have raised questions regarding internal consistency in the administration of the survey by the final survey data collectors as well as variations among the three different surveys. This in turn raises questions about the reliability of comparisons of the final survey data with data from previous surveys, even for questions that were in principle included in all three survey instruments. For example, in investigating the OPV0 or first polio vaccine dose, the final survey data collectors may have asked mothers at what age their child did receive his or her first dose rather than at what age they should have received that dose.
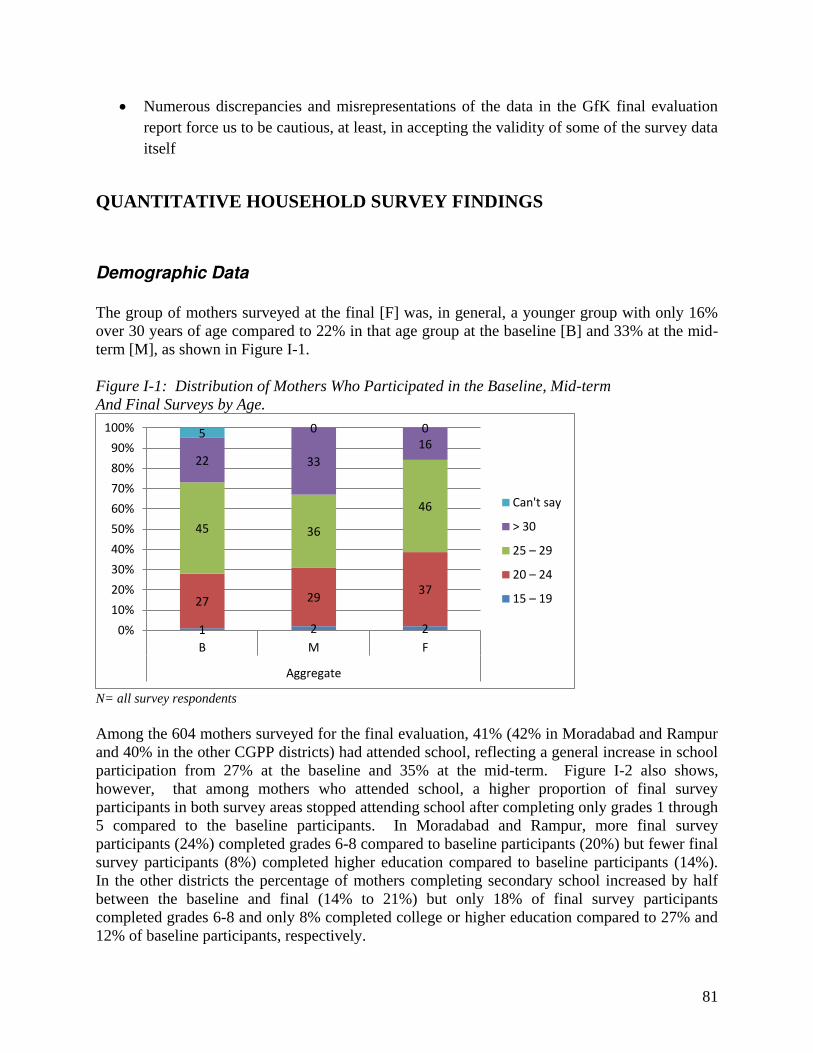
81
Numerous discrepancies and misrepresentations of the data in the GfK final evaluation report force us to be cautious, at least, in accepting the validity of some of the survey data itself
QUANTITATIVE HOUSEHOLD SURVEY FINDINGS
Demographic Data
The group of mothers surveyed at the final [F] was, in general, a younger group with only 16% over 30 years of age compared to 22% in that age group at the baseline [B] and 33% at the mid-term [M], as shown in Figure I-1. Figure I-1: Distribution of Mothers Who Participated in the Baseline, Mid-term And Final Surveys by Age.
N= all survey respondents Among the 604 mothers surveyed for the final evaluation, 41% (42% in Moradabad and Rampur and 40% in the other CGPP districts) had attended school, reflecting a general increase in school participation from 27% at the baseline and 35% at the mid-term. Figure I-2 also shows, however, that among mothers who attended school, a higher proportion of final survey participants in both survey areas stopped attending school after completing only grades 1 through 5 compared to the baseline participants. In Moradabad and Rampur, more final survey participants (24%) completed grades 6-8 compared to baseline participants (20%) but fewer final survey participants (8%) completed higher education compared to baseline participants (14%). In the other districts the percentage of mothers completing secondary school increased by half between the baseline and final (14% to 21%) but only 18% of final survey participants completed grades 6-8 and only 8% completed college or higher education compared to 27% and 12% of baseline participants, respectively.
1 2 2
27 29 37
45 36
46
22 33
16 5 0 0
0%
10%
20%
30%
40%
50%
60%
70%
80%
90%
100%
B M F
Aggregate
Can't say
> 30
25 – 29
20 – 24
15 – 19
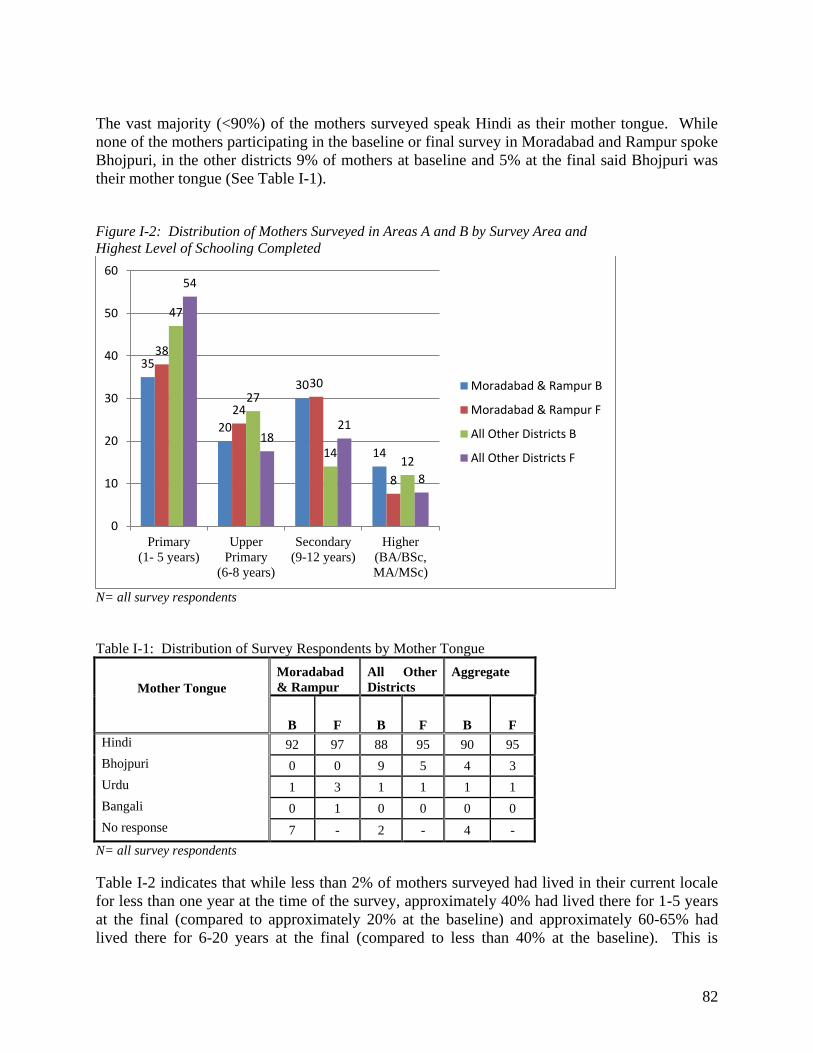
82
The vast majority (<90%) of the mothers surveyed speak Hindi as their mother tongue. While none of the mothers participating in the baseline or final survey in Moradabad and Rampur spoke Bhojpuri, in the other districts 9% of mothers at baseline and 5% at the final said Bhojpuri was their mother tongue (See Table I-1). Figure I-2: Distribution of Mothers Surveyed in Areas A and B by Survey Area and Highest Level of Schooling Completed
N= all survey respondents Table I-1: Distribution of Survey Respondents by Mother Tongue
Mother Tongue
Moradabad & Rampur
All Other Districts
Aggregate
B F B F B F Hindi 92 97 88 95 90 95
Bhojpuri 0 0 9 5 4 3
Urdu 1 3 1 1 1 1
Bangali 0 1 0 0 0 0
No response 7 - 2 - 4 -
N= all survey respondents Table I-2 indicates that while less than 2% of mothers surveyed had lived in their current locale for less than one year at the time of the survey, approximately 40% had lived there for 1-5 years at the final (compared to approximately 20% at the baseline) and approximately 60-65% had lived there for 6-20 years at the final (compared to less than 40% at the baseline). This is
35
20
30
14
38
24
30
8
47
27
14 12
54
18 21
8
0
10
20
30
40
50
60
Primary(1- 5 years)
UpperPrimary
(6-8 years)
Secondary(9-12 years)
Higher(BA/BSc,MA/MSc)
Moradabad & Rampur B
Moradabad & Rampur F
All Other Districts B
All Other Districts F
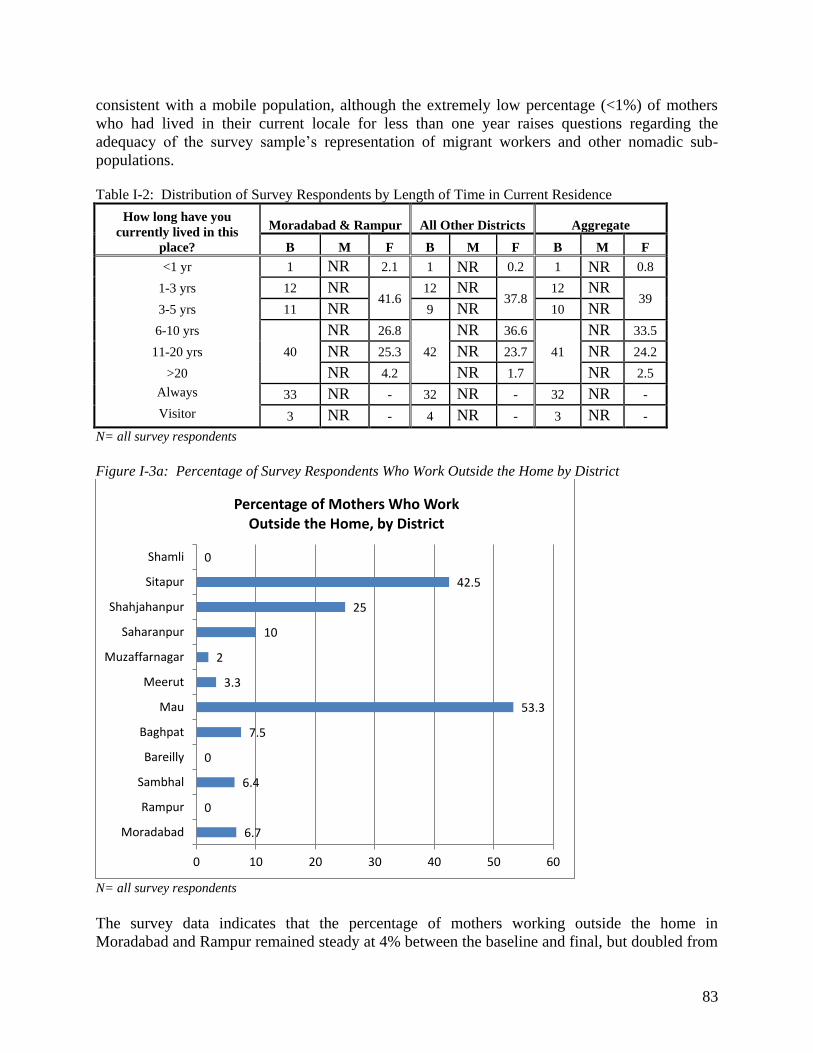
83
consistent with a mobile population, although the extremely low percentage (<1%) of mothers who had lived in their current locale for less than one year raises questions regarding the adequacy of the survey sample’s representation of migrant workers and other nomadic sub-populations. Table I-2: Distribution of Survey Respondents by Length of Time in Current Residence
How long have you currently lived in this
place?
Moradabad & Rampur All Other Districts Aggregate
B M F B M F B M F
<1 yr 1 NR 2.1 1 NR 0.2 1 NR 0.8
1-3 yrs 12 NR 41.6
12 NR 37.8
12 NR 39
3-5 yrs 11 NR 9 NR 10 NR 6-10 yrs
40
NR 26.8
42
NR 36.6
41
NR 33.5
11-20 yrs NR 25.3 NR 23.7 NR 24.2
>20 NR 4.2 NR 1.7 NR 2.5
Always 33 NR - 32 NR - 32 NR -
Visitor 3 NR - 4 NR - 3 NR -
N= all survey respondents Figure I-3a: Percentage of Survey Respondents Who Work Outside the Home by District
N= all survey respondents The survey data indicates that the percentage of mothers working outside the home in Moradabad and Rampur remained steady at 4% between the baseline and final, but doubled from
6.7
0
6.4
0
7.5
53.3
3.3
2
10
25
42.5
0
0 10 20 30 40 50 60
Moradabad
Rampur
Sambhal
Bareilly
Baghpat
Mau
Meerut
Muzaffarnagar
Saharanpur
Shahjahanpur
Sitapur
Shamli
Percentage of Mothers Who Work
Outside the Home, by District
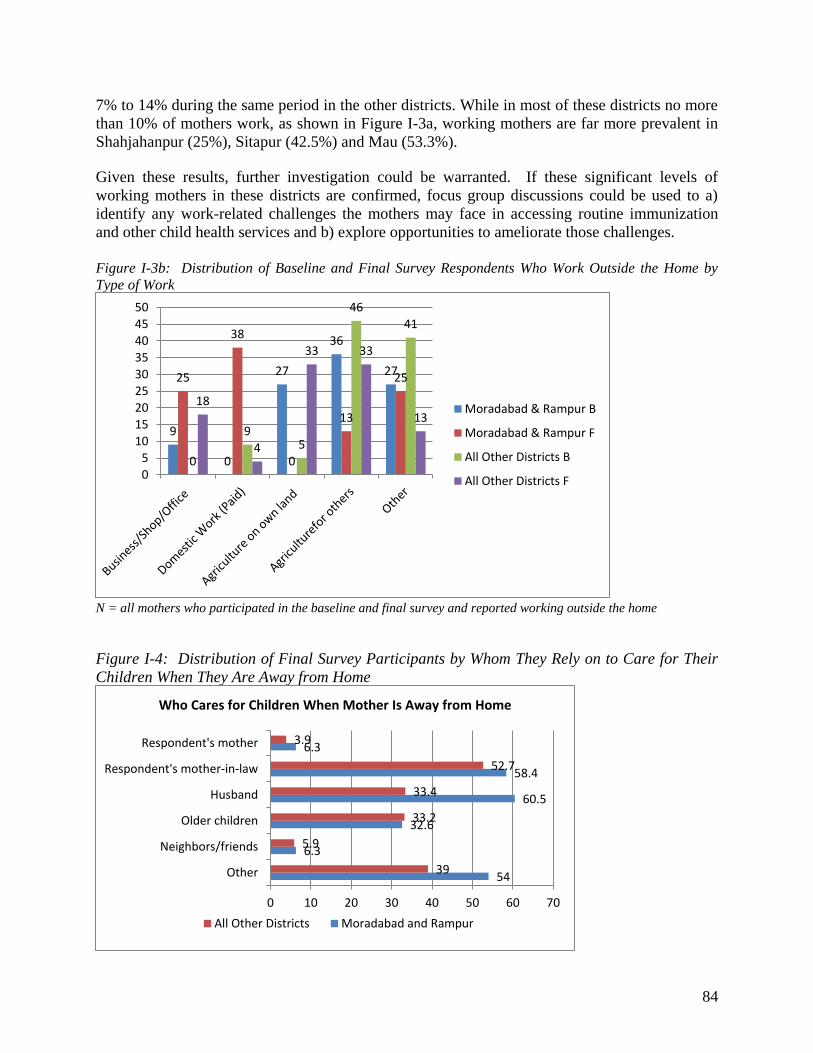
84
7% to 14% during the same period in the other districts. While in most of these districts no more than 10% of mothers work, as shown in Figure I-3a, working mothers are far more prevalent in Shahjahanpur (25%), Sitapur (42.5%) and Mau (53.3%). Given these results, further investigation could be warranted. If these significant levels of working mothers in these districts are confirmed, focus group discussions could be used to a) identify any work-related challenges the mothers may face in accessing routine immunization and other child health services and b) explore opportunities to ameliorate those challenges. Figure I-3b: Distribution of Baseline and Final Survey Respondents Who Work Outside the Home by Type of Work
N = all mothers who participated in the baseline and final survey and reported working outside the home Figure I-4: Distribution of Final Survey Participants by Whom They Rely on to Care for Their Children When They Are Away from Home
9
0
27
36
27 25
38
0
13
25
0
9 5
46
41
18
4
33 33
13
0
5
10
15
20
25
30
35
40
45
50
Moradabad & Rampur B
Moradabad & Rampur F
All Other Districts B
All Other Districts F
54
6.3
32.6
60.5
58.4
6.3
39
5.9
33.2
33.4
52.7
3.9
0 10 20 30 40 50 60 70
Other
Neighbors/friends
Older children
Husband
Respondent's mother-in-law
Respondent's mother
Who Cares for Children When Mother Is Away from Home
All Other Districts Moradabad and Rampur
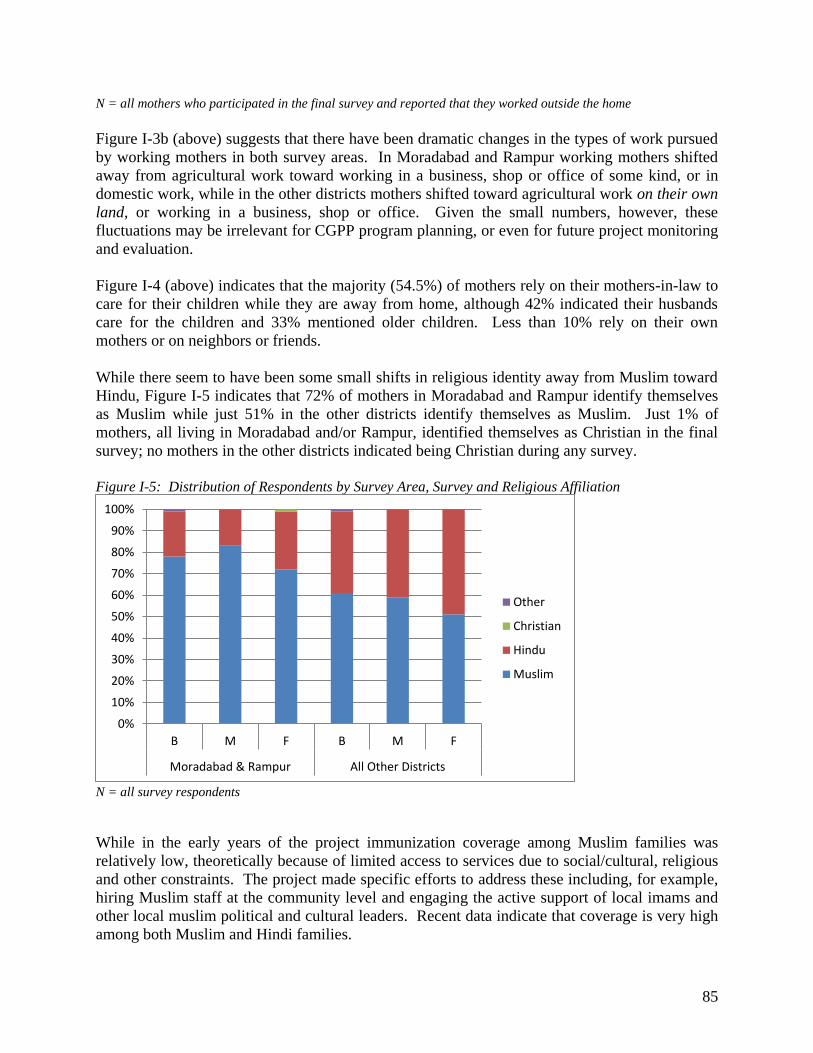
85
N = all mothers who participated in the final survey and reported that they worked outside the home Figure I-3b (above) suggests that there have been dramatic changes in the types of work pursued by working mothers in both survey areas. In Moradabad and Rampur working mothers shifted away from agricultural work toward working in a business, shop or office of some kind, or in domestic work, while in the other districts mothers shifted toward agricultural work on their own land, or working in a business, shop or office. Given the small numbers, however, these fluctuations may be irrelevant for CGPP program planning, or even for future project monitoring and evaluation. Figure I-4 (above) indicates that the majority (54.5%) of mothers rely on their mothers-in-law to care for their children while they are away from home, although 42% indicated their husbands care for the children and 33% mentioned older children. Less than 10% rely on their own mothers or on neighbors or friends. While there seem to have been some small shifts in religious identity away from Muslim toward Hindu, Figure I-5 indicates that 72% of mothers in Moradabad and Rampur identify themselves as Muslim while just 51% in the other districts identify themselves as Muslim. Just 1% of mothers, all living in Moradabad and/or Rampur, identified themselves as Christian in the final survey; no mothers in the other districts indicated being Christian during any survey. Figure I-5: Distribution of Respondents by Survey Area, Survey and Religious Affiliation
N = all survey respondents While in the early years of the project immunization coverage among Muslim families was relatively low, theoretically because of limited access to services due to social/cultural, religious and other constraints. The project made specific efforts to address these including, for example, hiring Muslim staff at the community level and engaging the active support of local imams and other local muslim political and cultural leaders. Recent data indicate that coverage is very high among both Muslim and Hindi families.
0%
10%
20%
30%
40%
50%
60%
70%
80%
90%
100%
B M F B M F
Moradabad & Rampur All Other Districts
Other
Christian
Hindu
Muslim
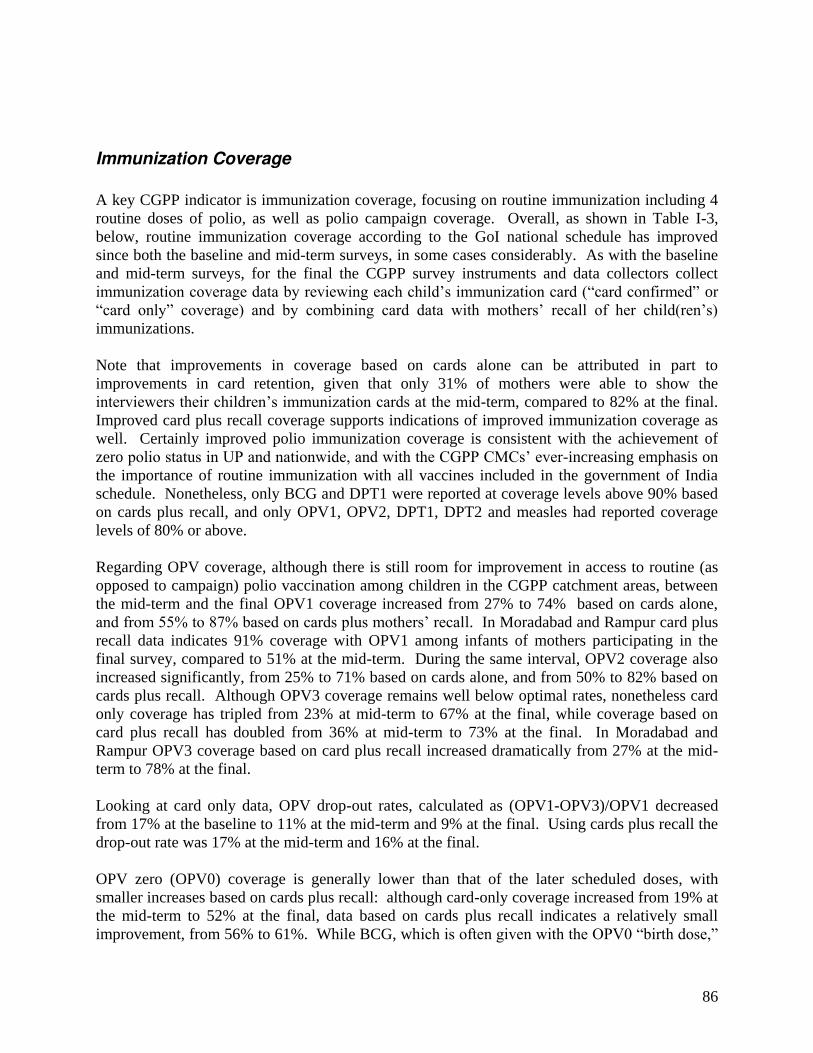
86
Immunization Coverage
A key CGPP indicator is immunization coverage, focusing on routine immunization including 4 routine doses of polio, as well as polio campaign coverage. Overall, as shown in Table I-3, below, routine immunization coverage according to the GoI national schedule has improved since both the baseline and mid-term surveys, in some cases considerably. As with the baseline and mid-term surveys, for the final the CGPP survey instruments and data collectors collect immunization coverage data by reviewing each child’s immunization card (“card confirmed” or “card only” coverage) and by combining card data with mothers’ recall of her child(ren’s) immunizations. Note that improvements in coverage based on cards alone can be attributed in part to improvements in card retention, given that only 31% of mothers were able to show the interviewers their children’s immunization cards at the mid-term, compared to 82% at the final. Improved card plus recall coverage supports indications of improved immunization coverage as well. Certainly improved polio immunization coverage is consistent with the achievement of zero polio status in UP and nationwide, and with the CGPP CMCs’ ever-increasing emphasis on the importance of routine immunization with all vaccines included in the government of India schedule. Nonetheless, only BCG and DPT1 were reported at coverage levels above 90% based on cards plus recall, and only OPV1, OPV2, DPT1, DPT2 and measles had reported coverage levels of 80% or above. Regarding OPV coverage, although there is still room for improvement in access to routine (as opposed to campaign) polio vaccination among children in the CGPP catchment areas, between the mid-term and the final OPV1 coverage increased from 27% to 74% based on cards alone, and from 55% to 87% based on cards plus mothers’ recall. In Moradabad and Rampur card plus recall data indicates 91% coverage with OPV1 among infants of mothers participating in the final survey, compared to 51% at the mid-term. During the same interval, OPV2 coverage also increased significantly, from 25% to 71% based on cards alone, and from 50% to 82% based on cards plus recall. Although OPV3 coverage remains well below optimal rates, nonetheless card only coverage has tripled from 23% at mid-term to 67% at the final, while coverage based on card plus recall has doubled from 36% at mid-term to 73% at the final. In Moradabad and Rampur OPV3 coverage based on card plus recall increased dramatically from 27% at the mid-term to 78% at the final. Looking at card only data, OPV drop-out rates, calculated as (OPV1-OPV3)/OPV1 decreased from 17% at the baseline to 11% at the mid-term and 9% at the final. Using cards plus recall the drop-out rate was 17% at the mid-term and 16% at the final. OPV zero (OPV0) coverage is generally lower than that of the later scheduled doses, with smaller increases based on cards plus recall: although card-only coverage increased from 19% at the mid-term to 52% at the final, data based on cards plus recall indicates a relatively small improvement, from 56% to 61%. While BCG, which is often given with the OPV0 “birth dose,”
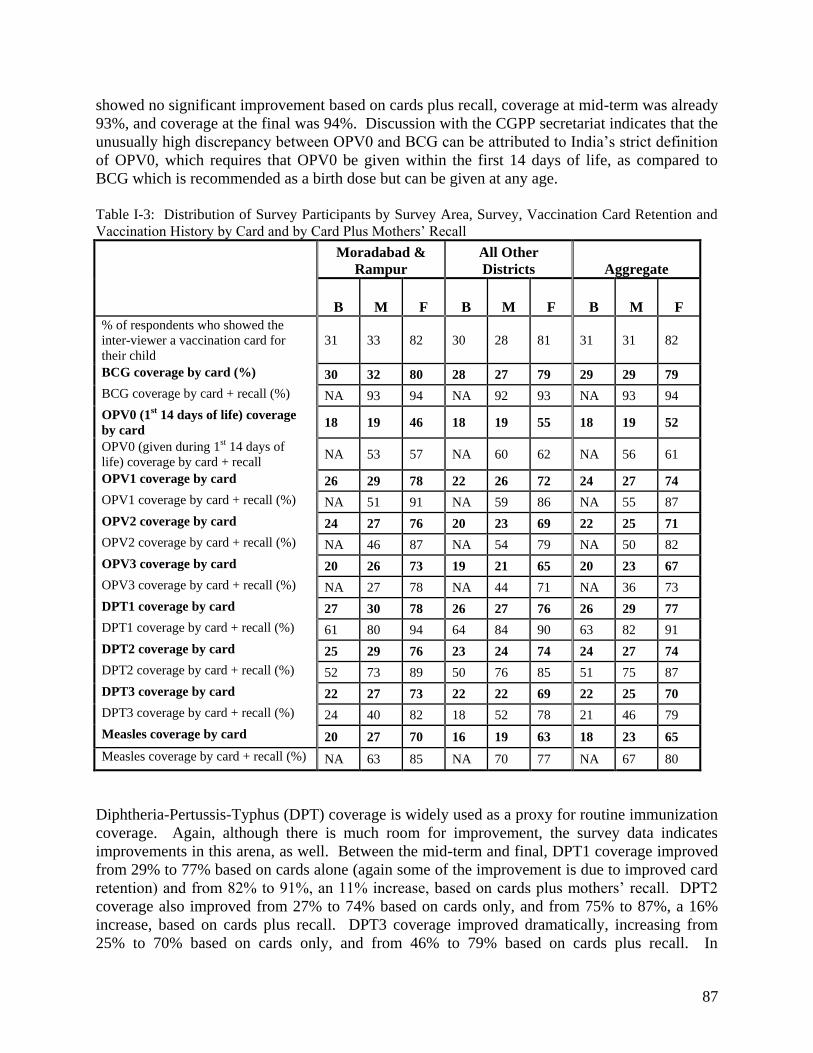
87
showed no significant improvement based on cards plus recall, coverage at mid-term was already 93%, and coverage at the final was 94%. Discussion with the CGPP secretariat indicates that the unusually high discrepancy between OPV0 and BCG can be attributed to India’s strict definition of OPV0, which requires that OPV0 be given within the first 14 days of life, as compared to BCG which is recommended as a birth dose but can be given at any age. Table I-3: Distribution of Survey Participants by Survey Area, Survey, Vaccination Card Retention and Vaccination History by Card and by Card Plus Mothers’ Recall Moradabad &
Rampur All Other Districts Aggregate
B M F B M F B M F % of respondents who showed the inter-viewer a vaccination card for their child
31 33 82 30 28 81 31 31 82
BCG coverage by card (%) 30 32 80 28 27 79 29 29 79 BCG coverage by card + recall (%) NA 93 94 NA 92 93 NA 93 94
OPV0 (1st 14 days of life) coverage by card 18 19 46 18 19 55 18 19 52
OPV0 (given during 1st 14 days of life) coverage by card + recall
NA 53 57 NA 60 62 NA 56 61
OPV1 coverage by card 26 29 78 22 26 72 24 27 74 OPV1 coverage by card + recall (%) NA 51 91 NA 59 86 NA 55 87
OPV2 coverage by card 24 27 76 20 23 69 22 25 71 OPV2 coverage by card + recall (%) NA 46 87 NA 54 79 NA 50 82
OPV3 coverage by card 20 26 73 19 21 65 20 23 67 OPV3 coverage by card + recall (%) NA 27 78 NA 44 71 NA 36 73
DPT1 coverage by card 27 30 78 26 27 76 26 29 77 DPT1 coverage by card + recall (%) 61 80 94 64 84 90 63 82 91
DPT2 coverage by card 25 29 76 23 24 74 24 27 74 DPT2 coverage by card + recall (%) 52 73 89 50 76 85 51 75 87
DPT3 coverage by card 22 27 73 22 22 69 22 25 70 DPT3 coverage by card + recall (%) 24 40 82 18 52 78 21 46 79
Measles coverage by card 20 27 70 16 19 63 18 23 65
Measles coverage by card + recall (%) NA 63 85 NA 70 77 NA 67 80
Diphtheria-Pertussis-Typhus (DPT) coverage is widely used as a proxy for routine immunization coverage. Again, although there is much room for improvement, the survey data indicates improvements in this arena, as well. Between the mid-term and final, DPT1 coverage improved from 29% to 77% based on cards alone (again some of the improvement is due to improved card retention) and from 82% to 91%, an 11% increase, based on cards plus mothers’ recall. DPT2 coverage also improved from 27% to 74% based on cards only, and from 75% to 87%, a 16% increase, based on cards plus recall. DPT3 coverage improved dramatically, increasing from 25% to 70% based on cards only, and from 46% to 79% based on cards plus recall. In
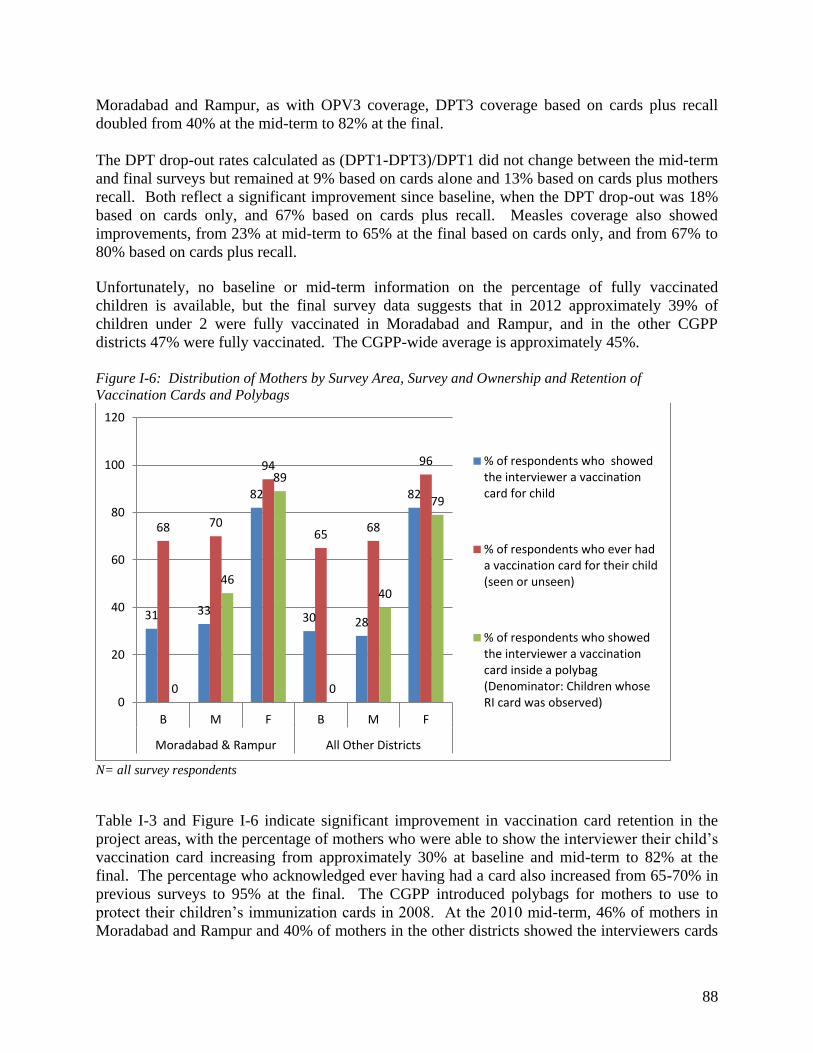
88
Moradabad and Rampur, as with OPV3 coverage, DPT3 coverage based on cards plus recall doubled from 40% at the mid-term to 82% at the final. The DPT drop-out rates calculated as (DPT1-DPT3)/DPT1 did not change between the mid-term and final surveys but remained at 9% based on cards alone and 13% based on cards plus mothers recall. Both reflect a significant improvement since baseline, when the DPT drop-out was 18% based on cards only, and 67% based on cards plus recall. Measles coverage also showed improvements, from 23% at mid-term to 65% at the final based on cards only, and from 67% to 80% based on cards plus recall. Unfortunately, no baseline or mid-term information on the percentage of fully vaccinated children is available, but the final survey data suggests that in 2012 approximately 39% of children under 2 were fully vaccinated in Moradabad and Rampur, and in the other CGPP districts 47% were fully vaccinated. The CGPP-wide average is approximately 45%. Figure I-6: Distribution of Mothers by Survey Area, Survey and Ownership and Retention of Vaccination Cards and Polybags
N= all survey respondents Table I-3 and Figure I-6 indicate significant improvement in vaccination card retention in the project areas, with the percentage of mothers who were able to show the interviewer their child’s vaccination card increasing from approximately 30% at baseline and mid-term to 82% at the final. The percentage who acknowledged ever having had a card also increased from 65-70% in previous surveys to 95% at the final. The CGPP introduced polybags for mothers to use to protect their children’s immunization cards in 2008. At the 2010 mid-term, 46% of mothers in Moradabad and Rampur and 40% of mothers in the other districts showed the interviewers cards
31 33
82
30 28
82
68 70
94
65 68
96
0
46
89
0
40
79
0
20
40
60
80
100
120
B M F B M F
Moradabad & Rampur All Other Districts
% of respondents who showed
the interviewer a vaccination
card for child
% of respondents who ever had
a vaccination card for their child
(seen or unseen)
% of respondents who showed
the interviewer a vaccination
card inside a polybag
(Denominator: Children whose
RI card was observed)

89
inside bags. During the 2012 final survey, 89% of mothers in Moradabad and Rampur and 79% of mothers in the other districts showed the interviewers cards inside bags. Although 82% of mothers in all coverage areas had cards, exploring the lower percentage of mothers with polybags outside of Moradabad and Rampur might lead to even greater card retention there.
ACCESS TO IMMUNIZATION SERVICES
Adequate access to immunization services outside of polio-specific campaigns is essential to ensure all children are protected from vaccine-preventable diseases, either through being fully vaccinated themselves or through community-wide/population-wide immunization coverage levels adequate to maintain herd immunity. Nearly all (97%) of the mothers who participated in the survey in all CGPP districts know where to go to immunize their children and, as shown in Figure I-7, the same percentage have to travel no more than 30 minutes to reach services. Figure I-7: Distribution of Final Survey Participants (%) by Length of Time Required to Reach Health Post Where People Generally Go to Get Their Children Vaccinated
N= all survey respondents Figure I-8 also indicates that in both survey areas the same very small percentage of mothers who participated in the final survey mentioned either VHNDs (1%) or Anganwadi Centers (14%). In Moradabad and Rampur, from 31% to 47% of mothers mentioned health centers, government-run District and private hospitals, private doctors and schools, with health centers mentioned most frequently and schools mentioned least frequently. In the other districts, on the other hand, 35% of mothers mentioned schools and less than 20% mentioned health centers, government-run District and private hospitals, or private doctors. The fact that 46% of mothers in Moradabad and Rampur and 60% of mothers in the other districts mentioned “Other” sources for immunization services complicates interpretation of this data. Unfortunately, the GfK consultants did not provide CGPP with the breakdown of “other” responses, nor were they available to discuss possible variations in question administration in the two different districts. If
97
2 1
Time needed to walk to health post for
child immunization services
Less than 30 minutes
30 minutes - under 1 hour
1 hour to under 2 hours
2 hours to under 3 hours
3 or more hours
90
further formal or informal investigation suggests that the results are valid in each area, it could be worthwhile for the CGPP Secretariat staff to:
Explore why very few mothers mentioned actual health service delivery sites in the “Other Districts” and share information on local perceptions of health services with GoI and health sector colleagues and counterparts, and potentially with local leaders
Further expand on-going health education/promotion and disease prevention work with schools, particularly in the “Other Districts”
Figure I-8: Distribution of Final Survey Participants by the Places Where They Say They Could Take Their Child(ren) to be Immunized
N= all final survey respondents Figure I-9: Surveyed Mothers Who Indicated that a Vaccinator Had Visited The Family During the Last Polio Campaign
3 1
14
31 35
38
47
0 1
14
35
11 13 17
05
101520253035404550
M&R
Other Districts

91
N= all survey respondents As shown in Figure I-9, during the final survey, 90% or more of the participating mothers remembered being visited by a vaccinator during the most recent campaign, reflecting an improvement since the mid-term when the number of mothers remembering a vaccinator’s visit had decreased to 86% in Rampur and Moradabad and 74% in the other districts. While the vaccinators don’t work for CGPP, the CGPP community mobilization coordinators play a key role in helping the vaccinators reach every household and vaccinate every eligible child.
Polio Knowledge
Sources of Information on Polio and Polio Campaigns At both the baseline and final surveys mothers were asked to name all the sources they used to obtain information on polio in general (Table I-4, below), and on polio campaigns (Table I-5, below). No mid-term data is available on these questions at this writing. Overall, mothers in both survey areas and in both surveys mentioned the same sources with generally the same frequency. Notice that in Figure I-10, presenting data collected in Moradabad and Rampur, the baseline data for each question show a remarkably similar pattern, as do the final survey data for each question. Figure I-11 presents the data collected in All Other Districts, and the same similarities are evident in the data patterns from each survey. In both figures, note the prominence of CMCs as key sources of information, exceeded only by “Other” as sources of information among final survey participants in Moradabad and Rampur. Figures I-10 and I-11 indicate that although the percentage of women mentioning CMCs as sources decreased slightly between baseline and final in Moradabad and Rampur, from 72% to 70.5% for general information and from 70% to 66.3% for campaign information, the percentages mentioning CMCs increased in the other districts, from 59% to 74.1% for general polio information and from 63% to 71.7% for campaign information. This may be explained by the fact that since Moradabad was the epicenter of polio outbreaks numerous organizations were very actively engaged in polio eradication activities.
95 86
91 95
74
90
0
20
40
60
80
100
B M F B M F
Moradabad & Rampur All Other Districts
Recalled that a vaccinator visited the
family during the last polio campaign
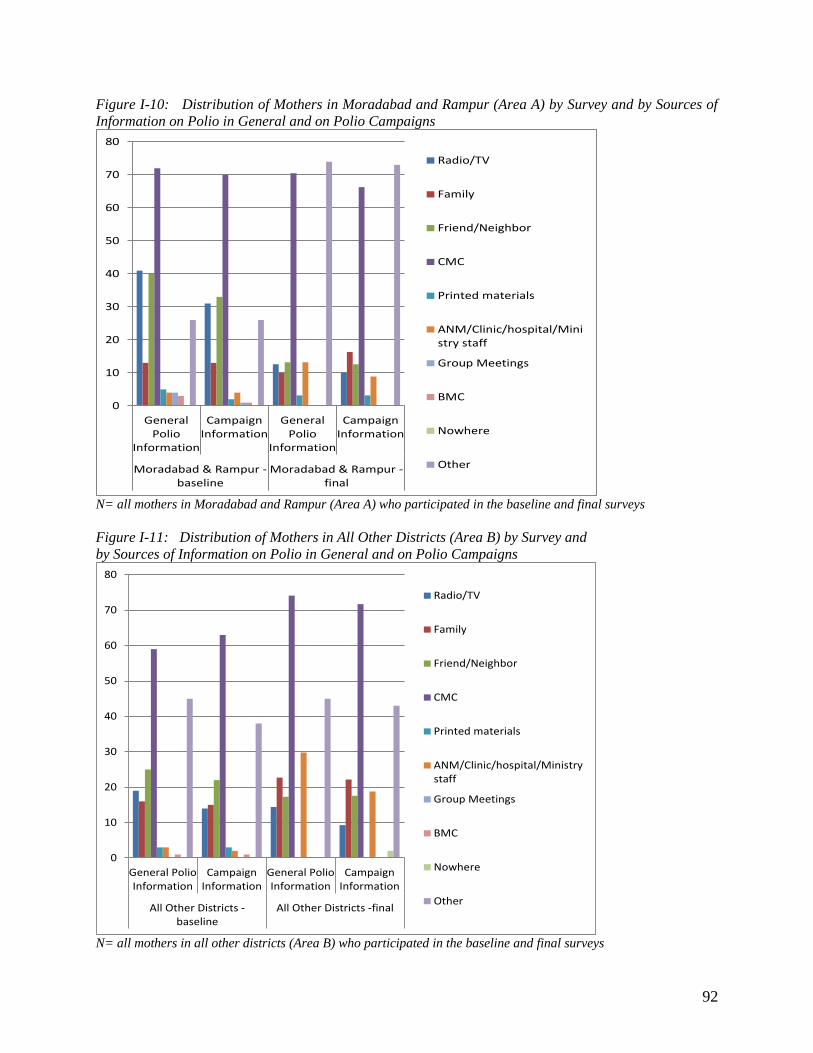
92
Figure I-10: Distribution of Mothers in Moradabad and Rampur (Area A) by Survey and by Sources of Information on Polio in General and on Polio Campaigns
N= all mothers in Moradabad and Rampur (Area A) who participated in the baseline and final surveys Figure I-11: Distribution of Mothers in All Other Districts (Area B) by Survey and by Sources of Information on Polio in General and on Polio Campaigns
N= all mothers in all other districts (Area B) who participated in the baseline and final surveys
0
10
20
30
40
50
60
70
80
General
Polio
Information
Campaign
Information
General
Polio
Information
Campaign
Information
Moradabad & Rampur -
baseline
Moradabad & Rampur -
final
Radio/TV
Family
Friend/Neighbor
CMC
Printed materials
ANM/Clinic/hospital/Mini
stry staff
Group Meetings
BMC
Nowhere
Other
0
10
20
30
40
50
60
70
80
General Polio
Information
Campaign
Information
General Polio
Information
Campaign
Information
All Other Districts -
baseline
All Other Districts -final
Radio/TV
Family
Friend/Neighbor
CMC
Printed materials
ANM/Clinic/hospital/Ministry
staff
Group Meetings
BMC
Nowhere
Other
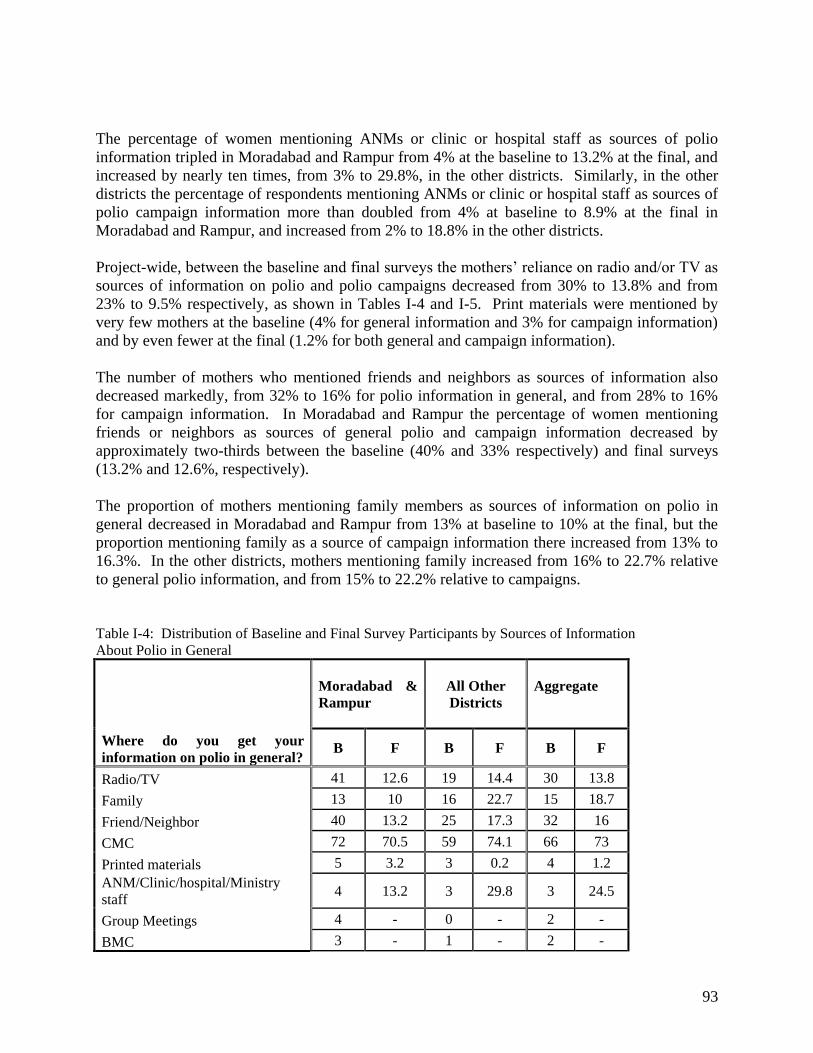
93
The percentage of women mentioning ANMs or clinic or hospital staff as sources of polio information tripled in Moradabad and Rampur from 4% at the baseline to 13.2% at the final, and increased by nearly ten times, from 3% to 29.8%, in the other districts. Similarly, in the other districts the percentage of respondents mentioning ANMs or clinic or hospital staff as sources of polio campaign information more than doubled from 4% at baseline to 8.9% at the final in Moradabad and Rampur, and increased from 2% to 18.8% in the other districts. Project-wide, between the baseline and final surveys the mothers’ reliance on radio and/or TV as sources of information on polio and polio campaigns decreased from 30% to 13.8% and from 23% to 9.5% respectively, as shown in Tables I-4 and I-5. Print materials were mentioned by very few mothers at the baseline (4% for general information and 3% for campaign information) and by even fewer at the final (1.2% for both general and campaign information). The number of mothers who mentioned friends and neighbors as sources of information also decreased markedly, from 32% to 16% for polio information in general, and from 28% to 16% for campaign information. In Moradabad and Rampur the percentage of women mentioning friends or neighbors as sources of general polio and campaign information decreased by approximately two-thirds between the baseline (40% and 33% respectively) and final surveys (13.2% and 12.6%, respectively). The proportion of mothers mentioning family members as sources of information on polio in general decreased in Moradabad and Rampur from 13% at baseline to 10% at the final, but the proportion mentioning family as a source of campaign information there increased from 13% to 16.3%. In the other districts, mothers mentioning family increased from 16% to 22.7% relative to general polio information, and from 15% to 22.2% relative to campaigns. Table I-4: Distribution of Baseline and Final Survey Participants by Sources of Information About Polio in General
Where do you get your information on polio in general?
Moradabad & Rampur
All Other Districts
Aggregate
B F B F B F
Radio/TV 41 12.6 19 14.4 30 13.8
Family 13 10 16 22.7 15 18.7
Friend/Neighbor 40 13.2 25 17.3 32 16
CMC 72 70.5 59 74.1 66 73
Printed materials 5 3.2 3 0.2 4 1.2 ANM/Clinic/hospital/Ministry staff
4 13.2 3 29.8 3 24.5
Group Meetings 4 - 0 - 2 -
BMC 3 - 1 - 2 -

94
Nowhere - 0 - 0 - 0
Other 26 74 45 45 36 54
Table I-5: Distribution of Baseline and Final Survey Participants by Sources of Information About the Most Recent Campaign
How did you find out about the last campaign?
Moradabad & Rampur
All Other Districts
Aggregate
B F B F B F
Radio/TV 31 10 14 9.3 23 9.5
Family 13 16.3 15 22.2 14 20.3
Friend/Neighbor 33 12.6 22 17.6 28 16
CMC 70 66.3 63 71.7 67 70
Printed materials 2 3.2 3 0.2 3 1.2 ANM/Clinic/hospital/Ministry staff
4 8.9 2 18.8 3 15.7
Group Meetings 1 - 0 - 1 -
BMC 1 - 1 - 1 -
Nowhere - 0 38 2 - 1
Other 26 73 43 32 53
Mothers’ Knowledge Related to Polio While there is room for improvement, Figure I-12 indicates that two thirds or more of the mothers who participated in the 2012 final survey believed that children are more protected from polio if they receive many doses of polio vaccine. In Moradabad, 12% of the mothers surveyed believed many doses will neither help nor harm children, and 10% didn’t know or weren’t sure. On the other hand, in the other districts, although only 3% believed many doses will neither help nor harm children, 25% indicated they didn’t know or weren’t sure what would happen if a child received many doses. Thus more emphasis on educating mothers on this issue could be useful, especially in the less urban districts. Figure I-12: Distribution of Mothers Who Participated in the Final Survey by Survey Area and Beliefs Regarding “What Happens if a Child Receives Many Doses of Polio Vaccine”
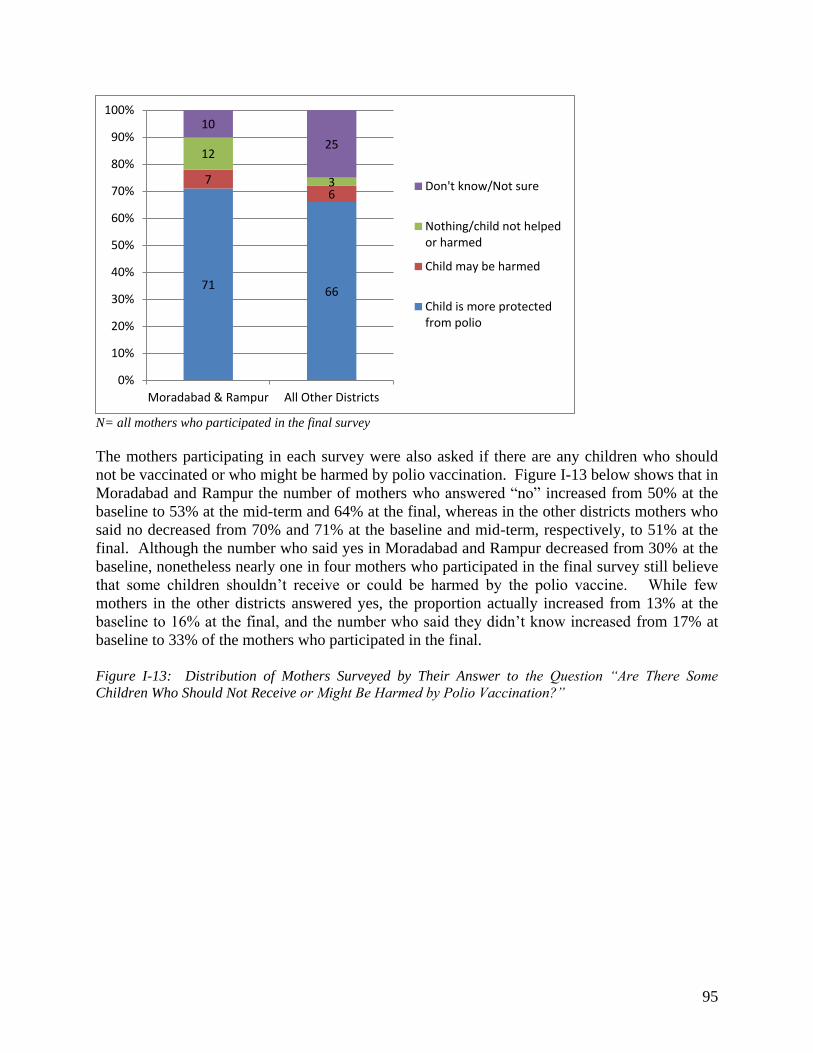
95
N= all mothers who participated in the final survey The mothers participating in each survey were also asked if there are any children who should not be vaccinated or who might be harmed by polio vaccination. Figure I-13 below shows that in Moradabad and Rampur the number of mothers who answered “no” increased from 50% at the baseline to 53% at the mid-term and 64% at the final, whereas in the other districts mothers who said no decreased from 70% and 71% at the baseline and mid-term, respectively, to 51% at the final. Although the number who said yes in Moradabad and Rampur decreased from 30% at the baseline, nonetheless nearly one in four mothers who participated in the final survey still believe that some children shouldn’t receive or could be harmed by the polio vaccine. While few mothers in the other districts answered yes, the proportion actually increased from 13% at the baseline to 16% at the final, and the number who said they didn’t know increased from 17% at baseline to 33% of the mothers who participated in the final. Figure I-13: Distribution of Mothers Surveyed by Their Answer to the Question “Are There Some Children Who Should Not Receive or Might Be Harmed by Polio Vaccination?”
71 66
7 6
12
3
10
25
0%
10%
20%
30%
40%
50%
60%
70%
80%
90%
100%
Moradabad & Rampur All Other Districts
Don't know/Not sure
Nothing/child not helped
or harmed
Child may be harmed
Child is more protected
from polio
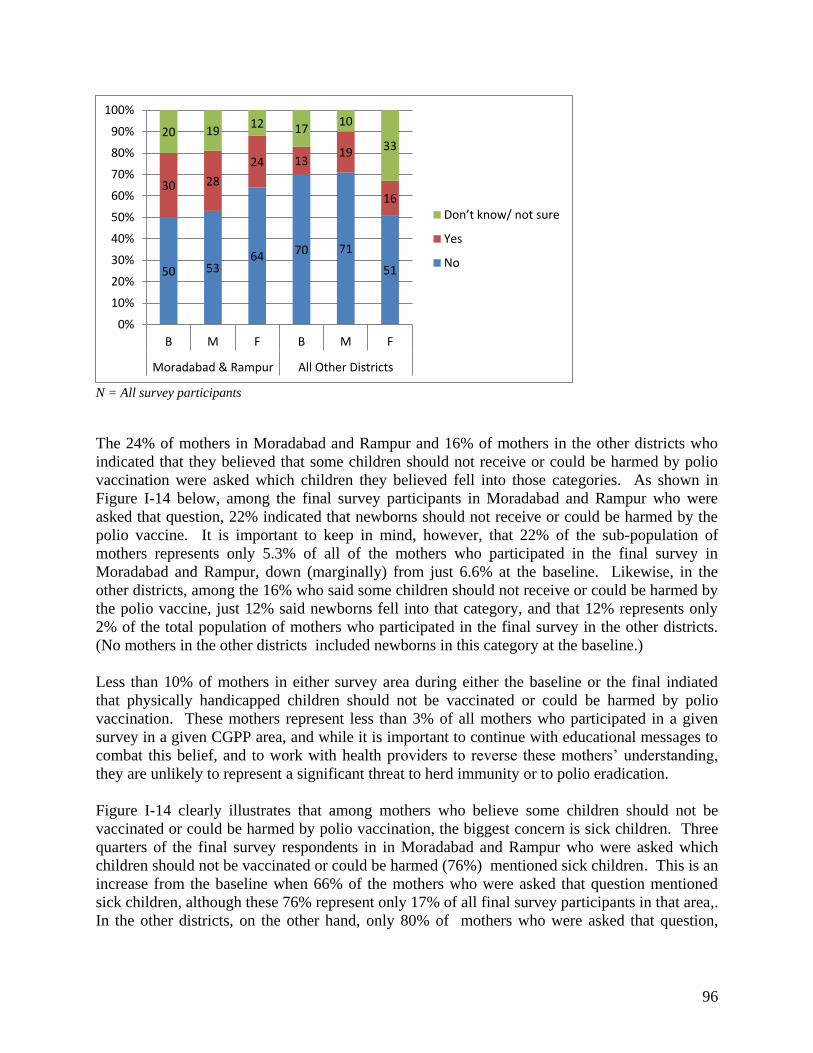
96
N = All survey participants The 24% of mothers in Moradabad and Rampur and 16% of mothers in the other districts who indicated that they believed that some children should not receive or could be harmed by polio vaccination were asked which children they believed fell into those categories. As shown in Figure I-14 below, among the final survey participants in Moradabad and Rampur who were asked that question, 22% indicated that newborns should not receive or could be harmed by the polio vaccine. It is important to keep in mind, however, that 22% of the sub-population of mothers represents only 5.3% of all of the mothers who participated in the final survey in Moradabad and Rampur, down (marginally) from just 6.6% at the baseline. Likewise, in the other districts, among the 16% who said some children should not receive or could be harmed by the polio vaccine, just 12% said newborns fell into that category, and that 12% represents only 2% of the total population of mothers who participated in the final survey in the other districts. (No mothers in the other districts included newborns in this category at the baseline.) Less than 10% of mothers in either survey area during either the baseline or the final indiated that physically handicapped children should not be vaccinated or could be harmed by polio vaccination. These mothers represent less than 3% of all mothers who participated in a given survey in a given CGPP area, and while it is important to continue with educational messages to combat this belief, and to work with health providers to reverse these mothers’ understanding, they are unlikely to represent a significant threat to herd immunity or to polio eradication. Figure I-14 clearly illustrates that among mothers who believe some children should not be vaccinated or could be harmed by polio vaccination, the biggest concern is sick children. Three quarters of the final survey respondents in in Moradabad and Rampur who were asked which children should not be vaccinated or could be harmed (76%) mentioned sick children. This is an increase from the baseline when 66% of the mothers who were asked that question mentioned sick children, although these 76% represent only 17% of all final survey participants in that area,. In the other districts, on the other hand, only 80% of mothers who were asked that question,
50 53 64
70 71
51
30 28
24 13 19
16
20 19 12 17
10
33
0%
10%
20%
30%
40%
50%
60%
70%
80%
90%
100%
B M F B M F
Moradabad & Rampur All Other Districts
Do ’t k o / ot sure
Yes
No
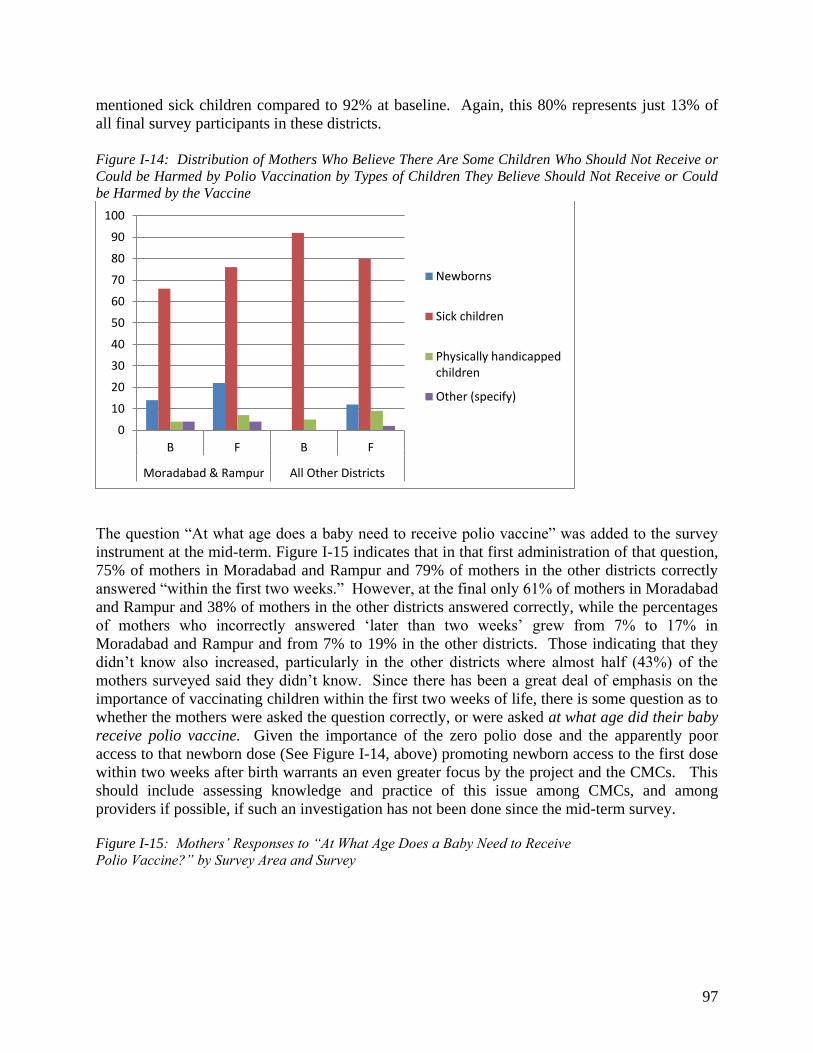
97
mentioned sick children compared to 92% at baseline. Again, this 80% represents just 13% of all final survey participants in these districts. Figure I-14: Distribution of Mothers Who Believe There Are Some Children Who Should Not Receive or Could be Harmed by Polio Vaccination by Types of Children They Believe Should Not Receive or Could be Harmed by the Vaccine
The question “At what age does a baby need to receive polio vaccine” was added to the survey instrument at the mid-term. Figure I-15 indicates that in that first administration of that question, 75% of mothers in Moradabad and Rampur and 79% of mothers in the other districts correctly answered “within the first two weeks.” However, at the final only 61% of mothers in Moradabad and Rampur and 38% of mothers in the other districts answered correctly, while the percentages of mothers who incorrectly answered ‘later than two weeks’ grew from 7% to 17% in Moradabad and Rampur and from 7% to 19% in the other districts. Those indicating that they didn’t know also increased, particularly in the other districts where almost half (43%) of the mothers surveyed said they didn’t know. Since there has been a great deal of emphasis on the importance of vaccinating children within the first two weeks of life, there is some question as to whether the mothers were asked the question correctly, or were asked at what age did their baby receive polio vaccine. Given the importance of the zero polio dose and the apparently poor access to that newborn dose (See Figure I-14, above) promoting newborn access to the first dose within two weeks after birth warrants an even greater focus by the project and the CMCs. This should include assessing knowledge and practice of this issue among CMCs, and among providers if possible, if such an investigation has not been done since the mid-term survey. Figure I-15: Mothers’ Responses to “At What Age Does a Baby Need to Receive Polio Vaccine?” by Survey Area and Survey
0
10
20
30
40
50
60
70
80
90
100
B F B F
Moradabad & Rampur All Other Districts
Newborns
Sick children
Physically handicapped
children
Other (specify)
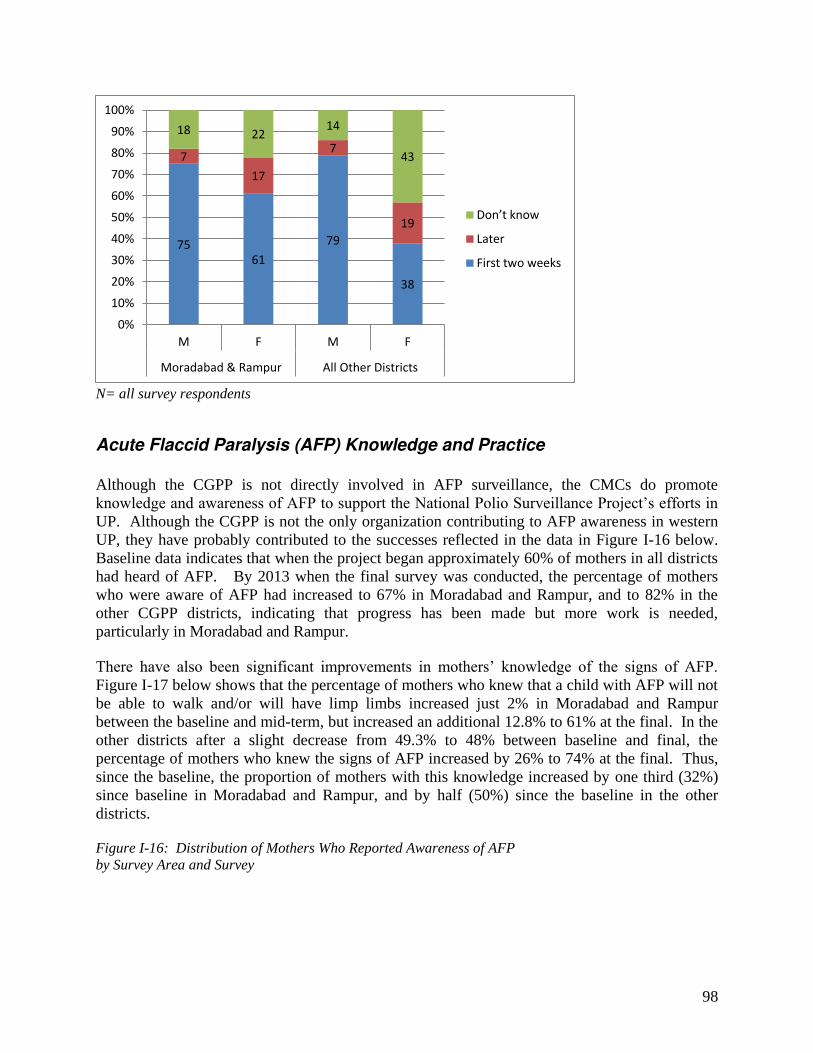
98
N= all survey respondents
Acute Flaccid Paralysis (AFP) Knowledge and Practice
Although the CGPP is not directly involved in AFP surveillance, the CMCs do promote knowledge and awareness of AFP to support the National Polio Surveillance Project’s efforts in UP. Although the CGPP is not the only organization contributing to AFP awareness in western UP, they have probably contributed to the successes reflected in the data in Figure I-16 below. Baseline data indicates that when the project began approximately 60% of mothers in all districts had heard of AFP. By 2013 when the final survey was conducted, the percentage of mothers who were aware of AFP had increased to 67% in Moradabad and Rampur, and to 82% in the other CGPP districts, indicating that progress has been made but more work is needed, particularly in Moradabad and Rampur. There have also been significant improvements in mothers’ knowledge of the signs of AFP. Figure I-17 below shows that the percentage of mothers who knew that a child with AFP will not be able to walk and/or will have limp limbs increased just 2% in Moradabad and Rampur between the baseline and mid-term, but increased an additional 12.8% to 61% at the final. In the other districts after a slight decrease from 49.3% to 48% between baseline and final, the percentage of mothers who knew the signs of AFP increased by 26% to 74% at the final. Thus, since the baseline, the proportion of mothers with this knowledge increased by one third (32%) since baseline in Moradabad and Rampur, and by half (50%) since the baseline in the other districts. Figure I-16: Distribution of Mothers Who Reported Awareness of AFP by Survey Area and Survey
75
61
79
38
7
17
7
19
18 22 14
43
0%
10%
20%
30%
40%
50%
60%
70%
80%
90%
100%
M F M F
Moradabad & Rampur All Other Districts
Do ’t k o
Later
First two weeks
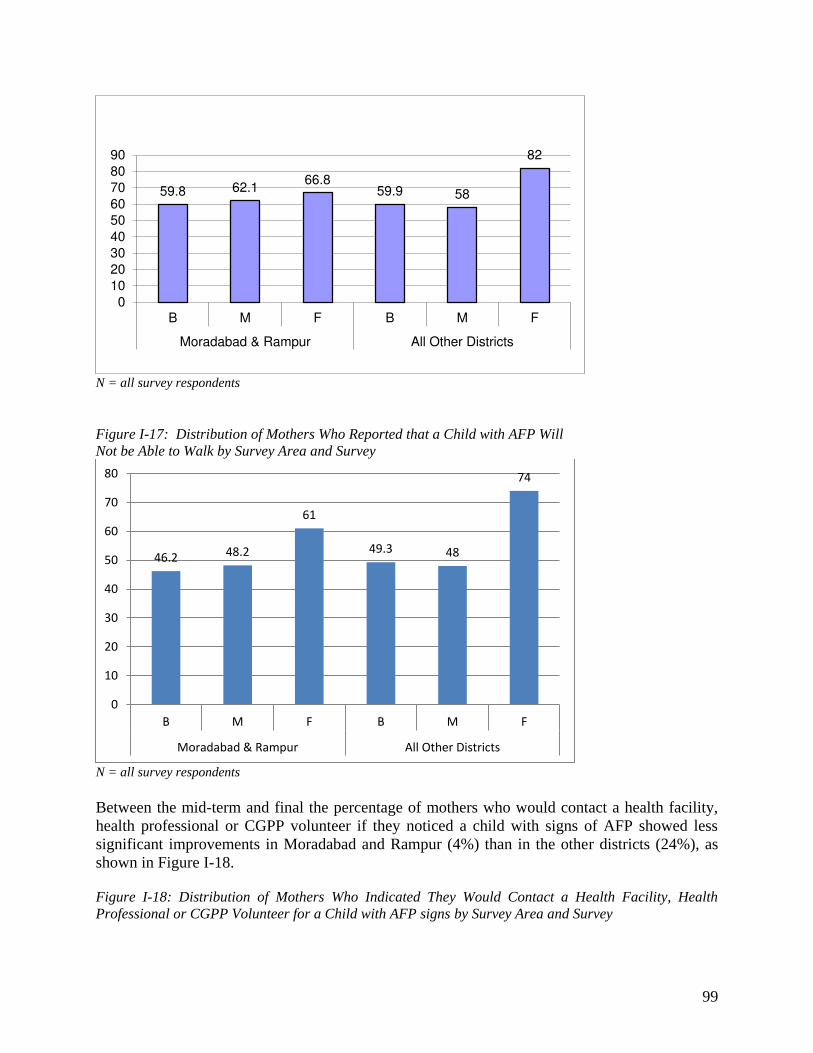
99
N = all survey respondents Figure I-17: Distribution of Mothers Who Reported that a Child with AFP Will Not be Able to Walk by Survey Area and Survey
N = all survey respondents Between the mid-term and final the percentage of mothers who would contact a health facility, health professional or CGPP volunteer if they noticed a child with signs of AFP showed less significant improvements in Moradabad and Rampur (4%) than in the other districts (24%), as shown in Figure I-18. Figure I-18: Distribution of Mothers Who Indicated They Would Contact a Health Facility, Health Professional or CGPP Volunteer for a Child with AFP signs by Survey Area and Survey
59.8 62.1 66.8
59.9 58
82
0
10
20
30
40
50
60
70
80
90
B M F B M F
Moradabad & Rampur All Other Districts
46.2 48.2
61
49.3 48
74
0
10
20
30
40
50
60
70
80
B M F B M F
Moradabad & Rampur All Other Districts
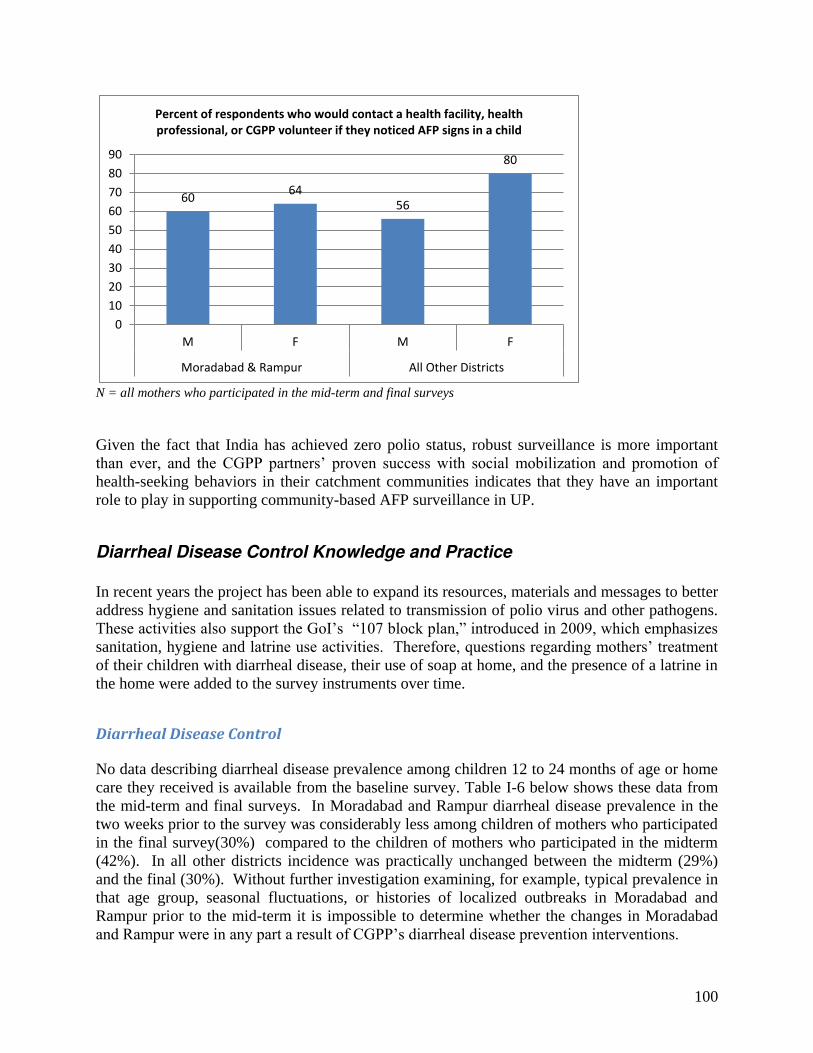
100
N = all mothers who participated in the mid-term and final surveys Given the fact that India has achieved zero polio status, robust surveillance is more important than ever, and the CGPP partners’ proven success with social mobilization and promotion of health-seeking behaviors in their catchment communities indicates that they have an important role to play in supporting community-based AFP surveillance in UP.
Diarrheal Disease Control Knowledge and Practice
In recent years the project has been able to expand its resources, materials and messages to better address hygiene and sanitation issues related to transmission of polio virus and other pathogens. These activities also support the GoI’s “107 block plan,” introduced in 2009, which emphasizes sanitation, hygiene and latrine use activities. Therefore, questions regarding mothers’ treatment of their children with diarrheal disease, their use of soap at home, and the presence of a latrine in the home were added to the survey instruments over time.
Diarrheal Disease Control No data describing diarrheal disease prevalence among children 12 to 24 months of age or home care they received is available from the baseline survey. Table I-6 below shows these data from the mid-term and final surveys. In Moradabad and Rampur diarrheal disease prevalence in the two weeks prior to the survey was considerably less among children of mothers who participated in the final survey(30%) compared to the children of mothers who participated in the midterm (42%). In all other districts incidence was practically unchanged between the midterm (29%) and the final (30%). Without further investigation examining, for example, typical prevalence in that age group, seasonal fluctuations, or histories of localized outbreaks in Moradabad and Rampur prior to the mid-term it is impossible to determine whether the changes in Moradabad and Rampur were in any part a result of CGPP’s diarrheal disease prevention interventions.
60 64
56
80
0
10
20
30
40
50
60
70
80
90
M F M F
Moradabad & Rampur All Other Districts
Percent of respondents who would contact a health facility, health
professional, or CGPP volunteer if they noticed AFP signs in a child
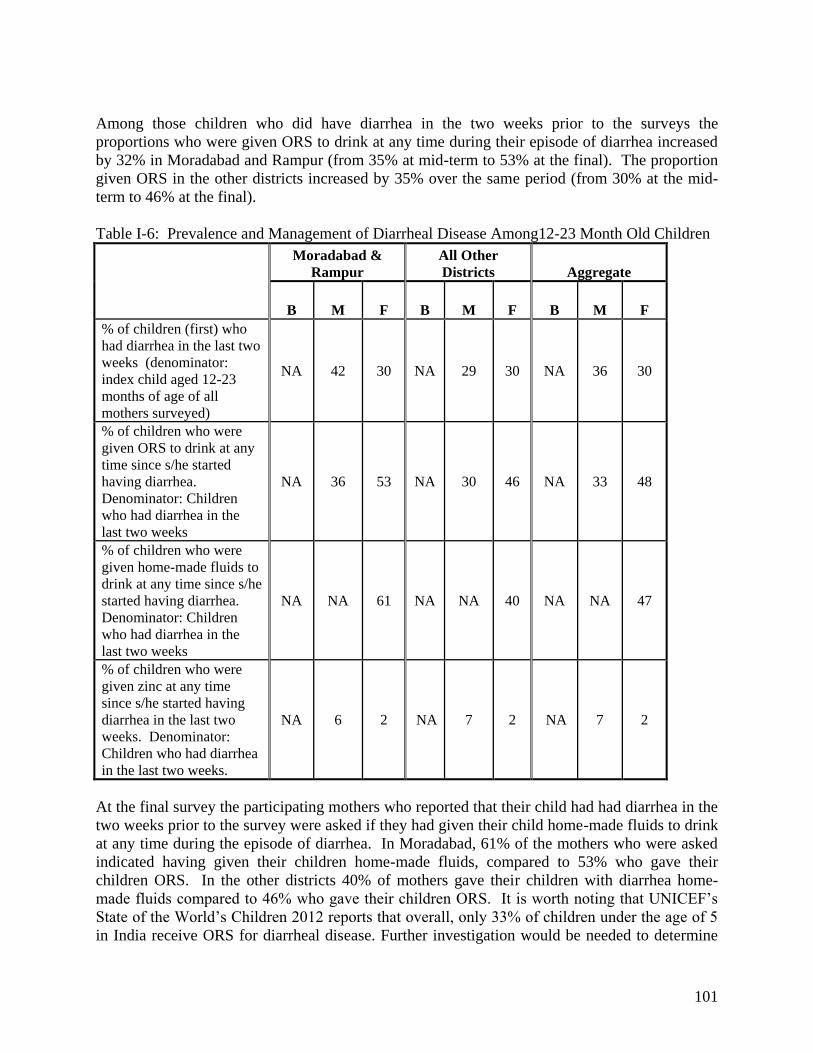
101
Among those children who did have diarrhea in the two weeks prior to the surveys the proportions who were given ORS to drink at any time during their episode of diarrhea increased by 32% in Moradabad and Rampur (from 35% at mid-term to 53% at the final). The proportion given ORS in the other districts increased by 35% over the same period (from 30% at the mid-term to 46% at the final). Table I-6: Prevalence and Management of Diarrheal Disease Among12-23 Month Old Children
Moradabad & Rampur
All Other Districts Aggregate
B M F B M F B M F % of children (first) who had diarrhea in the last two weeks (denominator: index child aged 12-23 months of age of all mothers surveyed)
NA 42 30 NA 29 30 NA 36 30
% of children who were given ORS to drink at any time since s/he started having diarrhea. Denominator: Children who had diarrhea in the last two weeks
NA 36 53 NA 30 46 NA 33 48
% of children who were given home-made fluids to drink at any time since s/he started having diarrhea. Denominator: Children who had diarrhea in the last two weeks
NA NA 61 NA NA 40 NA NA 47
% of children who were given zinc at any time since s/he started having diarrhea in the last two weeks. Denominator: Children who had diarrhea in the last two weeks.
NA 6 2 NA 7 2 NA 7 2
At the final survey the participating mothers who reported that their child had had diarrhea in the two weeks prior to the survey were asked if they had given their child home-made fluids to drink at any time during the episode of diarrhea. In Moradabad, 61% of the mothers who were asked indicated having given their children home-made fluids, compared to 53% who gave their children ORS. In the other districts 40% of mothers gave their children with diarrhea home-made fluids compared to 46% who gave their children ORS. It is worth noting that UNICEF’s State of the World’s Children 2012 reports that overall, only 33% of children under the age of 5 in India receive ORS for diarrheal disease. Further investigation would be needed to determine
102
whether the underlying factors include CGPP messages, other sources of home health education, local economic or resource factors, or other issues. Use of zinc for children with diarrhea decreased from an average of 6% to 7% at the mid-term to just 2% throughout the CGPP districts at the final. If zinc tablets are both readily available and affordable in all of these districts, more intensive education and behavior change promotion focusing on the importance of zinc for children with diarrheal disease. This is warranted for the next phase of the project given the importance of diarrheal disease as a contributing factor to malnutrition, weakened immune systems, morbidity and mortality in children, particularly in the CGPP communities which are by definition underserved and impacted by poor access to resources.
Use of Soap In the final survey in both survey areas the mothers were also asked if they had used soap the day of or the day before the survey interview. GfK reports that 100% indicated that they had used soap, and therefore all of the mothers were asked to name all of the ways that they had used soap in that time period. The data collectors were instructed not to mention any of the answers, but to ask the mothers to be specific and to continue until they had mentioned every way in which they had used soap. The data collectors were trained to check the appropriate answer on a checklist included in the survey instrument. These answers and the percentage of mothers who mentioned each one in each survey area are presented in Figure I-19. In both survey areas, the relative frequency with which each indicator mentioned is the same; however, compared to mothers in the other districts, a higher percentage of mothers in Moradabad and Rampur used soap for every indicator listed except ‘washing my body’ (92% in Moradabad and Rampur, 94% in other districts) and ‘washing clothes’ (85% in Moradabad and Rampur and 89% in the other districts). These two uses of soap, along with ‘washing cooking pots or dishes’ were the most frequently mentioned in both survey areas, with more than 80% of all mothers surveyed mentioning each of these. A number of different answers focused on washing hands with soap. More mothers in Moradabad and Rampur and in the other districts mentioned “washing hands after defecating” (63% and 49%, respectively), whereas very few mentioned washing hands either “before eating” (44% and 20% respectively) or “before preparing food” (32% and 21%, respectively). Fewer than 20% of mothers in Moradabad and Rampur and fewer than 10% in the other districts mentioned “washing hands before feeding child.” Also of concern is the fact that only about half of the mothers in Moradabad and Rampur and one third of the mothers in the other districts mentioned washing their hands after cleaning their children. Although 73% of mothers in Moradabad and Rampur and 69% in the other districts mentioned that they use soap when washing their children, only 27% and 11%, respectively, mentioned using soap to wash their child’s bottom. It is possible, however, that some who said that they washed their children with soap also used soap to wash their child’s bottom but did not distinguish between the two when giving their answers. Figure I-19: Distribution of Mothers Who Participated in the Final Survey by District
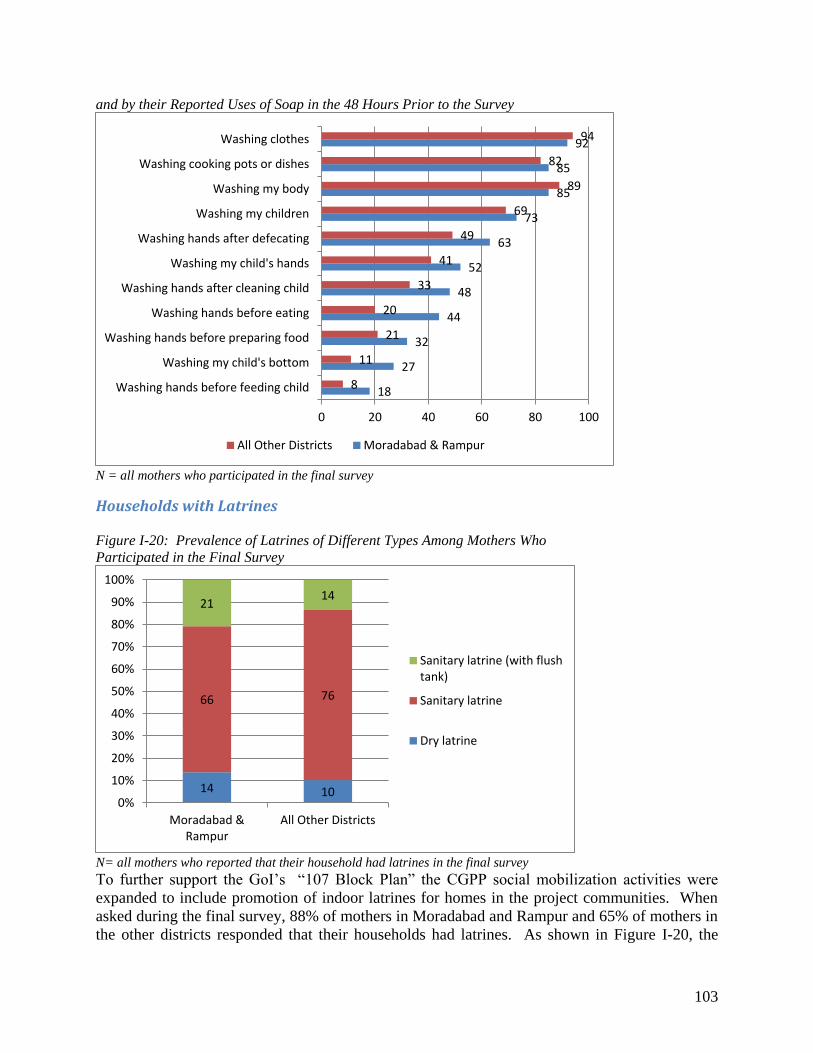
103
and by their Reported Uses of Soap in the 48 Hours Prior to the Survey
N = all mothers who participated in the final survey
Households with Latrines Figure I-20: Prevalence of Latrines of Different Types Among Mothers Who Participated in the Final Survey
N= all mothers who reported that their household had latrines in the final survey To further support the GoI’s “107 Block Plan” the CGPP social mobilization activities were expanded to include promotion of indoor latrines for homes in the project communities. When asked during the final survey, 88% of mothers in Moradabad and Rampur and 65% of mothers in the other districts responded that their households had latrines. As shown in Figure I-20, the
18
27
32
44
48
52
63
73
85
85
92
8
11
21
20
33
41
49
69
89
82
94
0 20 40 60 80 100
Washing hands before feeding child
Washing my child's bottom
Washing hands before preparing food
Washing hands before eating
Washing hands after cleaning child
Washing my child's hands
Washing hands after defecating
Washing my children
Washing my body
Washing cooking pots or dishes
Washing clothes
All Other Districts Moradabad & Rampur
14 10
66 76
21 14
0%
10%
20%
30%
40%
50%
60%
70%
80%
90%
100%
Moradabad &
Rampur
All Other Districts
Sanitary latrine (with flush
tank)
Sanitary latrine
Dry latrine

104
majority of those women with latrines in their households in both survey areas had sanitary latrines (66% in Moradabad and Rampur and 76% in the other districts). Compared to mothers in the other districts, more mothers in Moradabad and Rampur had sanitary latrines with flush tanks (14% and 21%, respectively), but more also had dry latrines (14% and 10%, respectively).
RECOMMENDATIONS
1. The CGPP secretariat and partners in India have established a very effective approach to
behavior change communications and health education at the community level. The work done thus far, the effective interventions already introduced, and the trust that the CGPP staff and volunteers have gained in recognized under-served and high risk communities represent an invaluable resource that could serve as a platform for broader impact on child morbidity and mortality. Continue to strengthen and expand the CGPP maternal and child health interventions beyond immunization (e.g. hygiene and sanitation, diarrheal disease control/ management, breastfeeding, maternal and child nutrition, etc.) and consider expanding into community-based tuberculosis prevention and control, given high annual incidence of new cases of tuberculosis in India. Ensure that on-going and new activities are linked to the national and UP health strategies.
2. The CGPP interventions promoting use of soap and latrines were introduced in part to support the GoI’s 2009 “107 block plan” that emphasizes sanitation, hygiene and latrine use. Strengthening and expanding these activities would provide a valuable boost to population immunity against the poliovirus in the context of decreased polio immunization campaigns in the coming years, when the risk of poliovirus importation into India remains a threat to eradication. Consider exploring USAID’s Water and Sanitation for Health grants and other potential sources of additional funding for these activities. During the grant period under evaluation the CGPP team in India, under the secretariat
team’s leadership, conducted effective in-depth qualitative research that illuminated previously unrecognized constraints to universal immunization and led to important program modifications. With appropriate resources, the coming grant phase could present an excellent opportunity for further investigation of challenges and constraints that limit family and community health seeking behaviors and contribute to children’s vulnerability to disease. For example:
If the India team finds that the migrant worker and nomadic populations in UP are under-represented in the 2012 survey, consider working with the existing network of supportive informants to reach out to those populations and engage them in either focus group discussions or key informant interviews.
Given the density of UP’s population, it may be worthwhile investigating whether or not mothers’ work outside the home has an impact on their children’s immunization status. If so, explore opportunities to address the underlying factors. For example, do
105
immunization clinic hours conflict with mothers’ time working in fields and if so could extended hours or targeted outreach services be made available during planting or harvest seasons.
As appropriate, consider expanding engagement with children, fathers and mothers-in-law to ensure that all family members are contributing to the health of their children, families and communities.
Conduct needs assessments at the community level to identify and capitalize on opportunities to strengthen local health-seeking, disease prevention and emergency response systems in the high risk, underserved communities in CGPP catchment areas
3. On-going emphasis on research and data driven program design and decision-making will help strengthen not only the project’s impact and but also local capacity for data collection, analysis, interpretation and use in decision-making.
4. Ensure that training, refresher training and supportive supervision, as well as jamborees and other morale-boosting activities are maintained at the strongest possible level to ensure that gains in capacity and in health sector impact are maintained.
5. The US-based headquarters team should work with the secretariat staff to strengthen their capacity to develop proposal/grant writing and management skills to ensure sustainable access to funds for long-term health improvements, and should invest in capacity-building and morale-boosting training opportunities for secretariat staff.
106
ATTACHMENT 1: ETHIOPIA CORE GROUP POLIO PROJECT FINAL EVALUATION SURVEY INSTRUMENT, 2012
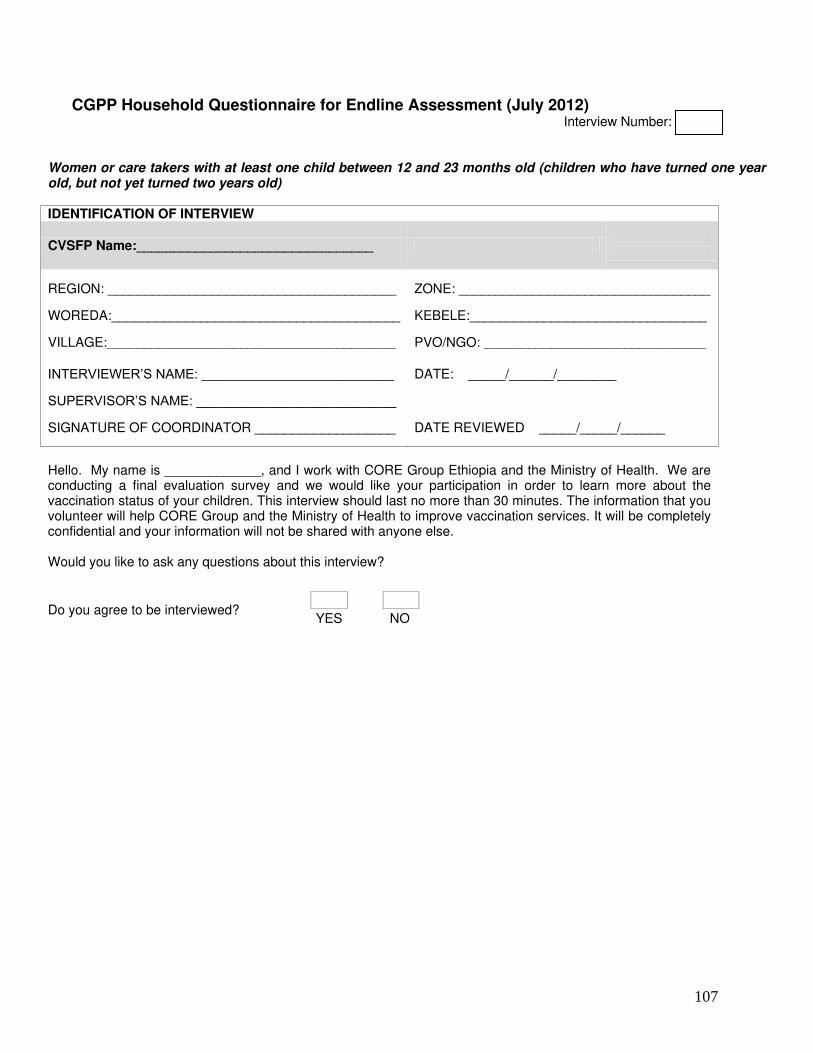
107
CGPP Household Questionnaire for Endline Assessment (July 2012) Interview Number:
Women or care takers with at least one child between 12 and 23 months old (children who have turned one year old, but not yet turned two years old) IDENTIFICATION OF INTERVIEW
CVSFP Name:________________________________
REGION: _______________________________________ ZONE: __________________________________
WOREDA:_______________________________________ KEBELE:________________________________
VILLAGE:_______________________________________ PVO/NGO: ______________________________
INTERVIEWER’S NAME: __________________________ DATE: _____/______/________
SUPERVISOR’S NAME: ___________________________
SIGNATURE OF COORDINATOR ___________________ DATE REVIEWED _____/_____/______
Hello. My name is _____________, and I work with CORE Group Ethiopia and the Ministry of Health. We are conducting a final evaluation survey and we would like your participation in order to learn more about the vaccination status of your children. This interview should last no more than 30 minutes. The information that you volunteer will help CORE Group and the Ministry of Health to improve vaccination services. It will be completely confidential and your information will not be shared with anyone else. Would you like to ask any questions about this interview?
Do you agree to be interviewed?
YES NO

108
SOCIO-DEMOGRAPHIC MODULE
No. Question Coding Go to…
Residence: Rural ………1 Urban………2
Sex of Interviewee: Male ………1
Female………2
1 Have you ever attended school?
Yes……………………………..……1 Go to 1.1
No……………………………...…….2 Go to 2
1.1 What is the highest grade of school you completed?
Grade…………………
2 What is your mother tongue?
Amharic..…………………………..21
Oromiffa……………………………22
Somali……………………………...23
Afar…………………………………24
Anuak………………………………25
Nuer………………………………..26
Other (SPECIFY)..……...……..…96
____________________________
3 How old are you? Response in years……
4
How long have you lived continuously in (NAME PLACE OF CURRENT RESIDENCE)? IF ALWAYS, ENTER AGE FROM Q3 IF LESS THAN A YEAR, ENTER 00
Number in years……
Visitor……………………………..998
5 Do you work outside the home?
Yes………………………………......1 Go to 5.1
No……………………………………2 Go to 6
5.1 Where you do work/what is your means of living?
Business/shop/office………..….21
Domestic work…………………22
Selling in street/market..…………23
Farming………………..………..…24
Pastoralism………………………..25
Other (SPECIFY)…………………96
____________________________
6 Who takes care of your child when you are not at home?
Respondent’s mother……..……….1
Respondent’s mother-in-law……...2
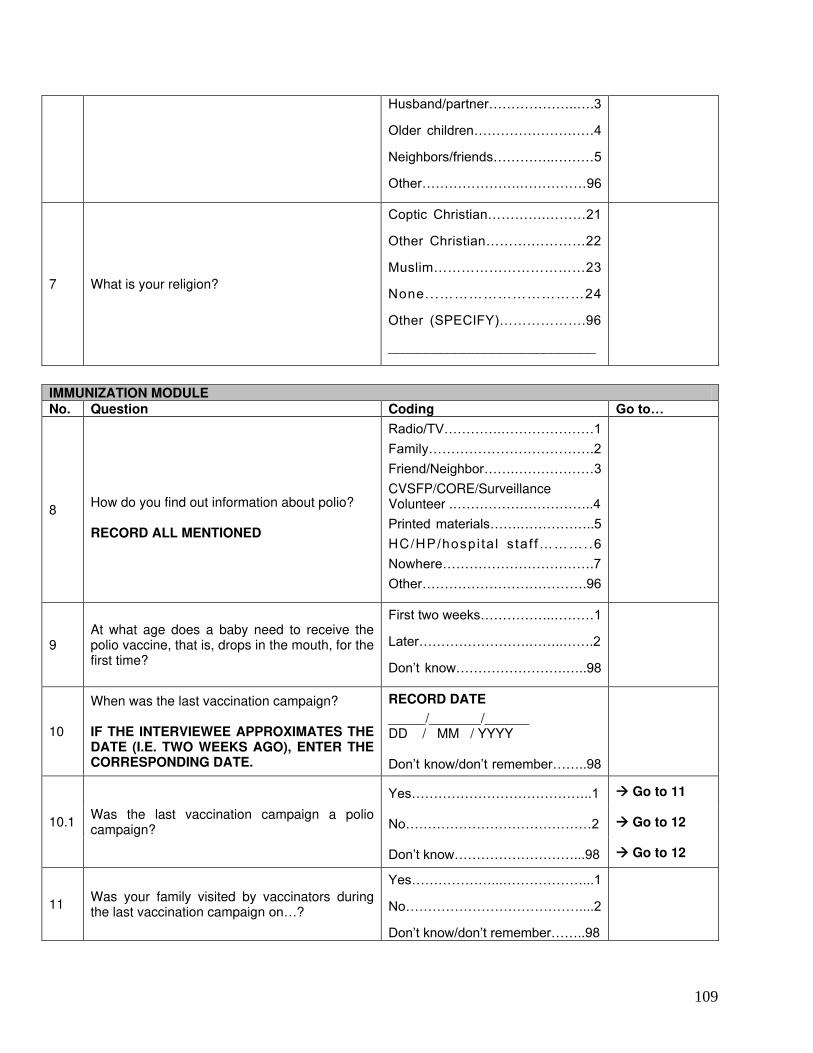
109
Husband/partner………………..….3
Older children………………………4
Neighbors/friends…………..………5
Other………………….……………96
7 What is your religion?
Coptic Christian………….………21
Other Christian……….…………22
Muslim……………………………23
None...…………………………24
Other (SPECIFY)……………….96
____________________________
IMMUNIZATION MODULE No. Question Coding Go to…
8
How do you find out information about polio? RECORD ALL MENTIONED
Radio/TV………….…………………1
Family……………………………….2
Friend/Neighbor…….………………3
CVSFP/CORE/Surveillance Volunteer .…………………………..4
Printed materials…….……………..5
HC/HP /hospi ta l s taf f………. .6
Nowhere…………………………….7
Other……………………………….96
9 At what age does a baby need to receive the polio vaccine, that is, drops in the mouth, for the first time?
First two weeks……………..………1
Later…………………….……..…….2
Don’t know…………………….…..98
10
When was the last vaccination campaign? IF THE INTERVIEWEE APPROXIMATES THE DATE (I.E. TWO WEEKS AGO), ENTER THE CORRESPONDING DATE.
RECORD DATE
_____/_______/______ DD / MM / YYYY Don’t know/don’t remember……..98
10.1 Was the last vaccination campaign a polio campaign?
Yes…………………………………..1 Go to 11
No……………………………………2 Go to 12
Don’t know………………………...98 Go to 12
11 Was your family visited by vaccinators during the last vaccination campaign on…?
Yes………………...………………...1
No…………………………………....2
Don’t know/don’t remember……..98
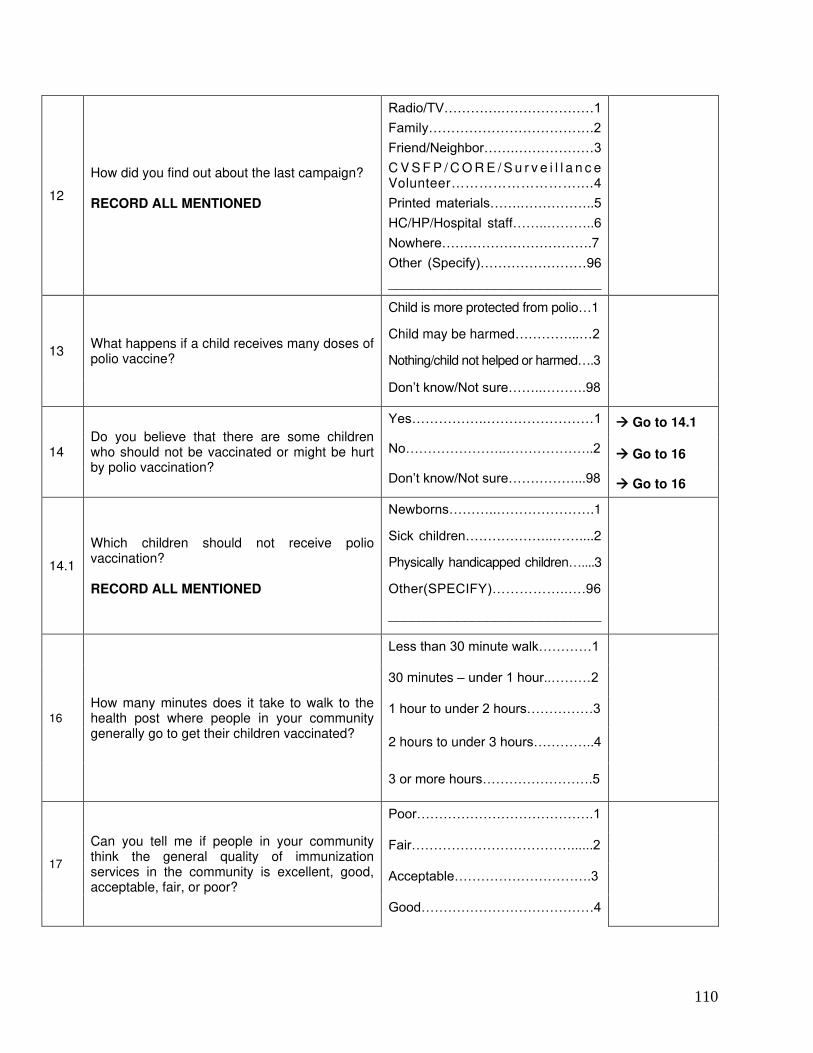
110
12
How did you find out about the last campaign? RECORD ALL MENTIONED
Radio/TV………….…………………1
Family……………………………….2
Friend/Neighbor…….………………3
C V S F P / C O R E / S u r v e i l l a n c e Volunteer………………………....4
Printed materials…….……………..5
HC/HP/Hospital staff……..………..6
Nowhere…………………………….7
Other (Specify)……………………96
____________________________
13 What happens if a child receives many doses of polio vaccine?
Child is more protected from polio…1
Child may be harmed…………...…2
Nothing/child not helped or harmed….3
Don’t know/Not sure……..……….98
14 Do you believe that there are some children who should not be vaccinated or might be hurt by polio vaccination?
Yes……………..……………………1 Go to 14.1
No…………………..………………..2 Go to 16
Don’t know/Not sure……………...98 Go to 16
14.1
Which children should not receive polio vaccination? RECORD ALL MENTIONED
Newborns………..………………….1
Sick children………………..……....2
Physically handicapped children…....3
Other(SPECIFY)……………..….96
____________________________
16
How many minutes does it take to walk to the health post where people in your community generally go to get their children vaccinated?
Less than 30 minute walk…………1
30 minutes – under 1 hour..………2
1 hour to under 2 hours……………3
2 hours to under 3 hours…………..4
3 or more hours…………………….5
17
Can you tell me if people in your community think the general quality of immunization services in the community is excellent, good, acceptable, fair, or poor?
Poor………………………………….1
Fair………………………………......2
Acceptable………………………….3
Good…………………………………4
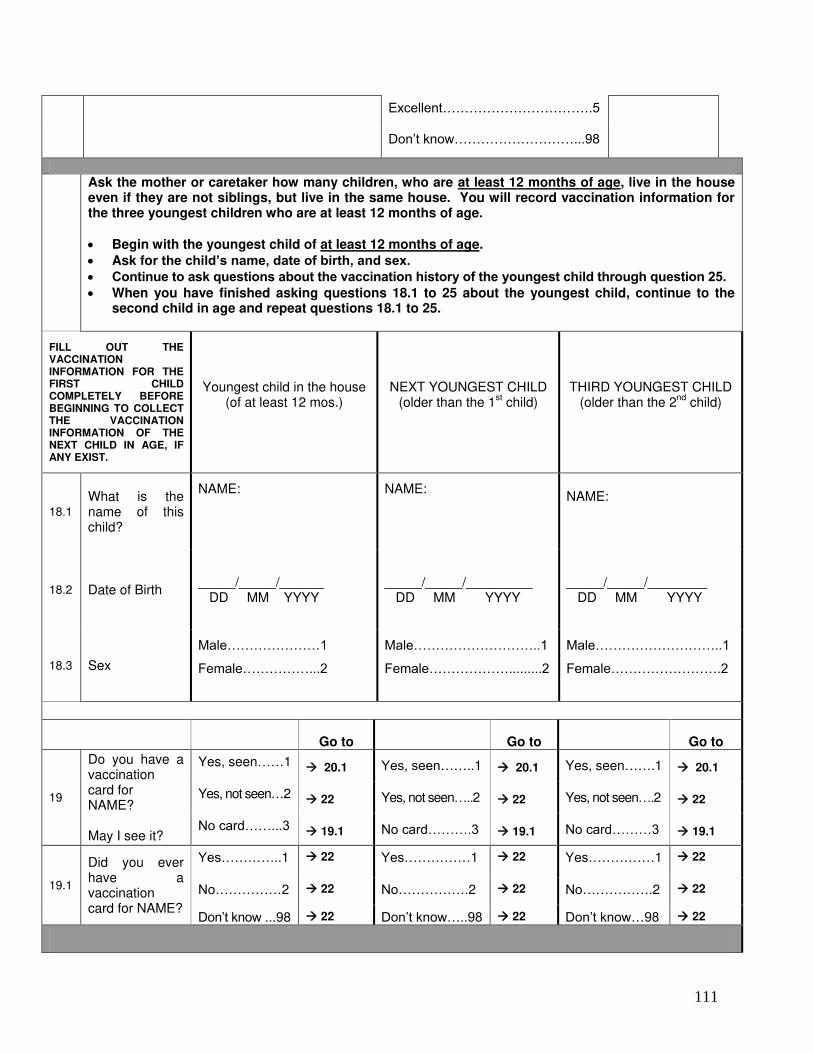
111
Excellent…………………………….5
Don’t know………………………...98
Ask the mother or caretaker how many children, who are at least 12 months of age, live in the house even if they are not siblings, but live in the same house. You will record vaccination information for the three youngest children who are at least 12 months of age.
Begin with the youngest child of at least 12 months of age.
Ask for the child’s name, date of birth, and sex. Continue to ask questions about the vaccination history of the youngest child through question 25.
When you have finished asking questions 18.1 to 25 about the youngest child, continue to the second child in age and repeat questions 18.1 to 25.
FILL OUT THE VACCINATION INFORMATION FOR THE FIRST CHILD COMPLETELY BEFORE BEGINNING TO COLLECT THE VACCINATION INFORMATION OF THE NEXT CHILD IN AGE, IF ANY EXIST.
Youngest child in the house (of at least 12 mos.)
NEXT YOUNGEST CHILD (older than the 1
st child)
THIRD YOUNGEST CHILD (older than the 2
nd child)
18.1
What is the name of this child?
NAME:
NAME:
NAME:
18.2 Date of Birth _____/_____/______ DD MM YYYY
_____/_____/_________ DD MM YYYY
_____/_____/________ DD MM YYYY
18.3 Sex
Male…………………1
Female……………...2
Male………………………..1
Female……………….........2
Male………………………..1
Female…………………….2
Go to Go to Go to
19
Do you have a vaccination card for NAME? May I see it?
Yes, seen……1 20.1 Yes, seen……..1 20.1 Yes, seen…….1 20.1
Yes, not seen…2 22 Yes, not seen…..2 22 Yes, not seen….2 22
No card……...3 19.1 No card……….3 19.1 No card………3 19.1
19.1
Did you ever have a vaccination card for NAME?
Yes…………..1 22
Yes……………1 22
Yes……………1 22
No……………2 22 No…………….2 22 No…………….2 22
Don’t know ...98 22 Don’t know…..98 22 Don’t know…98 22
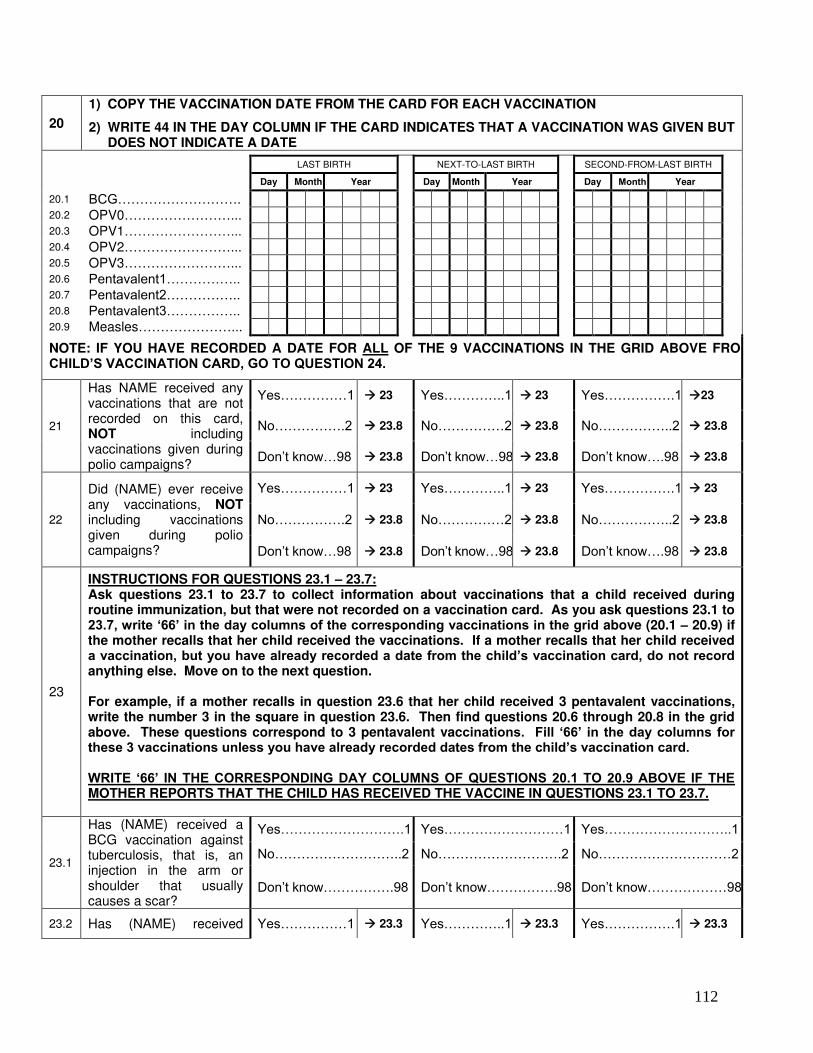
112
20
1) COPY THE VACCINATION DATE FROM THE CARD FOR EACH VACCINATION
2) WRITE 44 IN THE DAY COLUMN IF THE CARD INDICATES THAT A VACCINATION WAS GIVEN BUT DOES NOT INDICATE A DATE
LAST BIRTH NEXT-TO-LAST BIRTH
SECOND-FROM-LAST BIRTH
Day Month Year Day Month Year Day Month Year
20.1 BCG………………………. 20.2 OPV0……………………... 20.3 OPV1……………………... 20.4 OPV2……………………... 20.5 OPV3……………………... 20.6 Pentavalent1…………….. 20.7 Pentavalent2…………….. 20.8 Pentavalent3…………….. 20.9 Measles…………………...
NOTE: IF YOU HAVE RECORDED A DATE FOR ALL OF THE 9 VACCINATIONS IN THE GRID ABOVE FROMCHILD’S VACCINATION CARD, GO TO QUESTION 24.
21
Has NAME received any vaccinations that are not recorded on this card, NOT including vaccinations given during polio campaigns?
Yes……………1 23 Yes…………..1 23 Yes…………….1 23
No…………….2 23.8 No……………2 23.8 No……………..2 23.8
Don’t know…98 23.8 Don’t know…98 23.8 Don’t know….98 23.8
22
Did (NAME) ever receive any vaccinations, NOT including vaccinations given during polio campaigns?
Yes……………1 23 Yes…………..1 23 Yes…………….1 23
No…………….2 23.8 No……………2 23.8 No……………..2 23.8
Don’t know…98 23.8 Don’t know…98 23.8 Don’t know….98 23.8
23
INSTRUCTIONS FOR QUESTIONS 23.1 – 23.7: Ask questions 23.1 to 23.7 to collect information about vaccinations that a child received during routine immunization, but that were not recorded on a vaccination card. As you ask questions 23.1 to 23.7, write ‘66’ in the day columns of the corresponding vaccinations in the grid above (20.1 – 20.9) if the mother recalls that her child received the vaccinations. If a mother recalls that her child received a vaccination, but you have already recorded a date from the child’s vaccination card, do not record anything else. Move on to the next question. For example, if a mother recalls in question 23.6 that her child received 3 pentavalent vaccinations, write the number 3 in the square in question 23.6. Then find questions 20.6 through 20.8 in the grid above. These questions correspond to 3 pentavalent vaccinations. Fill ‘66’ in the day columns for these 3 vaccinations unless you have already recorded dates from the child’s vaccination card. WRITE ‘66’ IN THE CORRESPONDING DAY COLUMNS OF QUESTIONS 20.1 TO 20.9 ABOVE IF THE MOTHER REPORTS THAT THE CHILD HAS RECEIVED THE VACCINE IN QUESTIONS 23.1 TO 23.7.
23.1
Has (NAME) received a BCG vaccination against tuberculosis, that is, an injection in the arm or shoulder that usually causes a scar?
Yes……………………….1 Yes………………………1 Yes………………………..1
No………………………..2 No……………………….2 No…………………………2
Don’t know…………….98 Don’t know…………….98 Don’t know………………98
23.2 Has (NAME) received Yes……………1 23.3 Yes…………..1 23.3 Yes…………….1 23.3
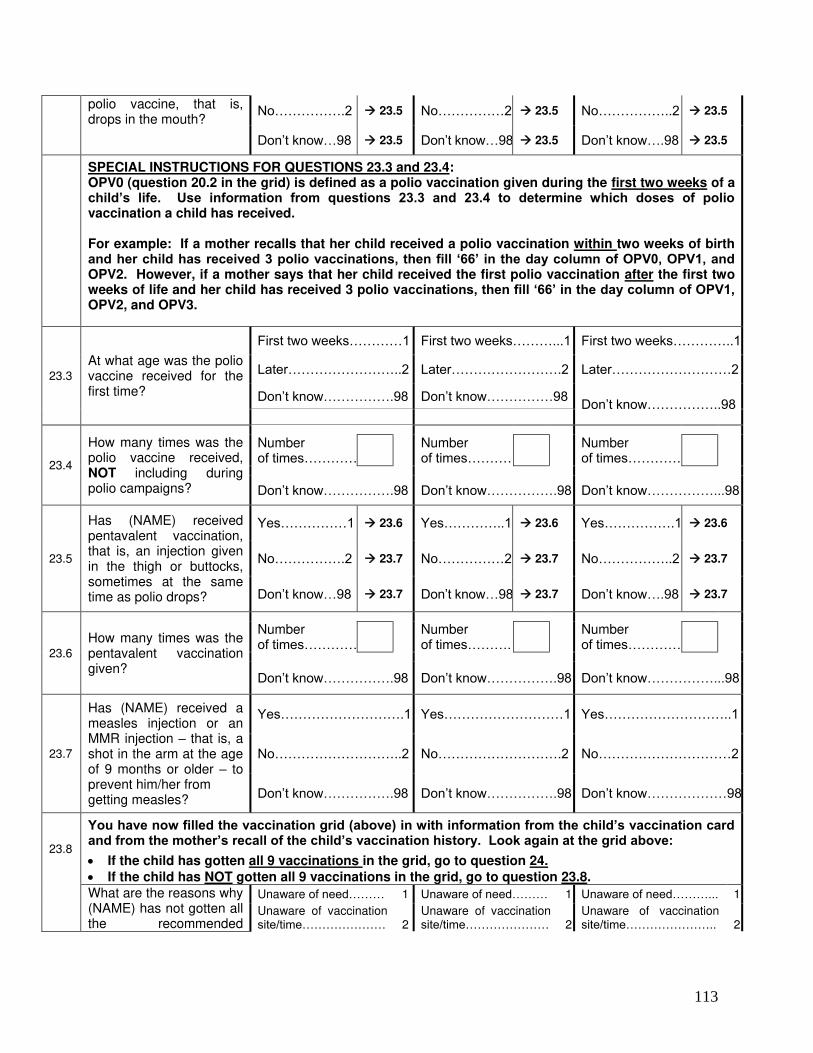
113
polio vaccine, that is, drops in the mouth?
No…………….2 23.5 No……………2 23.5 No……………..2 23.5
Don’t know…98 23.5 Don’t know…98 23.5 Don’t know….98 23.5
SPECIAL INSTRUCTIONS FOR QUESTIONS 23.3 and 23.4: OPV0 (question 20.2 in the grid) is defined as a polio vaccination given during the first two weeks of a child’s life. Use information from questions 23.3 and 23.4 to determine which doses of polio vaccination a child has received. For example: If a mother recalls that her child received a polio vaccination within two weeks of birth and her child has received 3 polio vaccinations, then fill ‘66’ in the day column of OPV0, OPV1, and OPV2. However, if a mother says that her child received the first polio vaccination after the first two weeks of life and her child has received 3 polio vaccinations, then fill ‘66’ in the day column of OPV1, OPV2, and OPV3.
23.3
At what age was the polio vaccine received for the first time?
First two weeks…………1 First two weeks………...1 First two weeks…………..1
Later……………………..2 Later…………………….2 Later………………………2
Don’t know…………….98 Don’t know……………98 Don’t know……………..98
23.4
How many times was the polio vaccine received, NOT including during polio campaigns?
Number of times…………
Number of times………….
Number of times…………
Don’t know…………….98 Don’t know…………….98 Don’t know……………...98
23.5
Has (NAME) received pentavalent vaccination, that is, an injection given in the thigh or buttocks, sometimes at the same time as polio drops?
Yes……………1 23.6 Yes…………..1 23.6 Yes…………….1 23.6
No…………….2 23.7 No……………2 23.7 No……………..2 23.7
Don’t know…98 23.7 Don’t know…98 23.7 Don’t know….98 23.7
23.6
How many times was the pentavalent vaccination given?
Number of times…………
Number of times……….
Number of times…………
Don’t know…………….98 Don’t know…………….98 Don’t know……………...98
23.7
Has (NAME) received a measles injection or an MMR injection – that is, a shot in the arm at the age of 9 months or older – to prevent him/her from getting measles?
Yes……………………….1 Yes………………………1 Yes………………………..1
No………………………..2 No……………………….2 No…………………………2
Don’t know…………….98 Don’t know…………….98 Don’t know………………98
23.8
You have now filled the vaccination grid (above) in with information from the child’s vaccination card and from the mother’s recall of the child’s vaccination history. Look again at the grid above: If the child has gotten all 9 vaccinations in the grid, go to question 24.
If the child has NOT gotten all 9 vaccinations in the grid, go to question 23.8. What are the reasons why
(NAME) has not gotten all the recommended
Unaware of need……… 1 Unaware of need……… 1 Unaware of need………... 1
Unaware of vaccination site/time………………… 2
Unaware of vaccination site/time………………… 2
Unaware of vaccination site/time………………….. 2
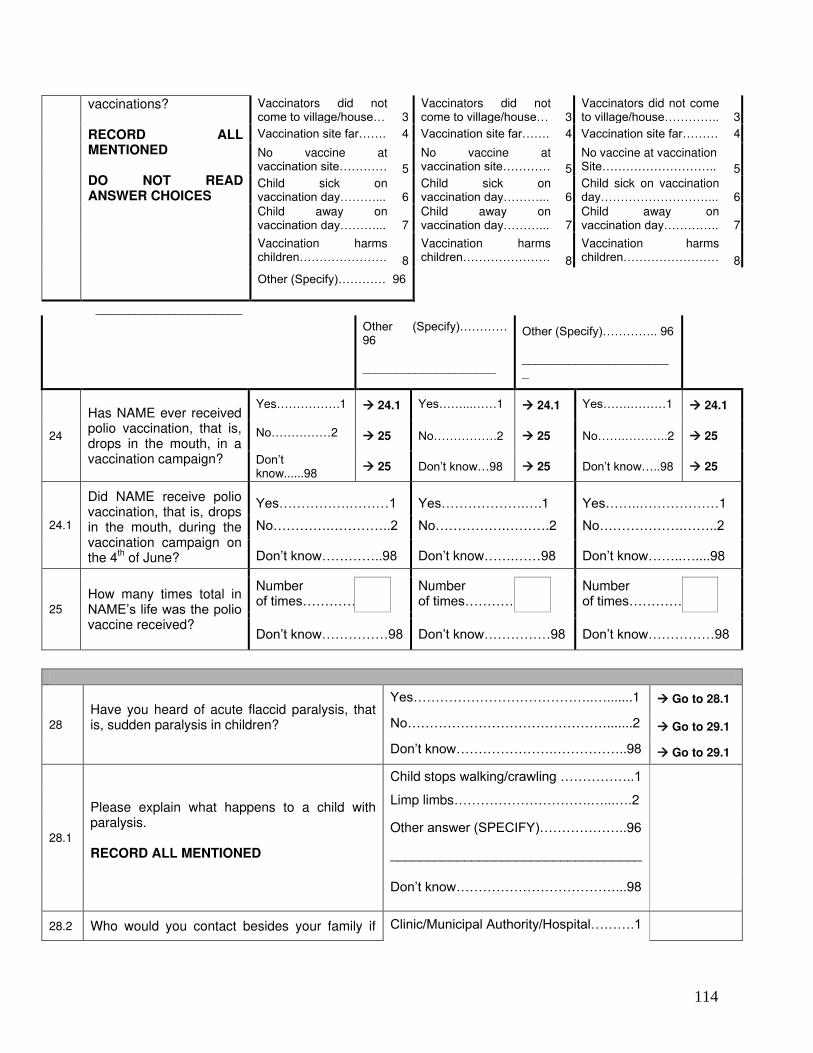
114
vaccinations? RECORD ALL MENTIONED DO NOT READ ANSWER CHOICES
Vaccinators did not come to village/house… 3
Vaccinators did not come to village/house… 3
Vaccinators did not come to village/house………….. 3
Vaccination site far……. 4 Vaccination site far……. 4 Vaccination site far……… 4
No vaccine at vaccination site………… 5
No vaccine at vaccination site………… 5
No vaccine at vaccination Site……………………….. 5
Child sick on vaccination day………... 6
Child sick on vaccination day………... 6
Child sick on vaccination day………………………... 6
Child away on vaccination day………... 7
Child away on vaccination day………... 7
Child away on vaccination day………….. 7
Vaccination harms children…………………. 8
Vaccination harms children…………………. 8
Vaccination harms children…………………… 8
Other (Specify)………… 96
______________________
Other (Specify)………… 96 ____________________
Other (Specify)………….. 96 _______________________
24
Has NAME ever received polio vaccination, that is, drops in the mouth, in a vaccination campaign?
Yes…………….1 24.1 Yes……...……1 24.1 Yes…….………1 24.1
No……………2 25 No…………….2 25 No…….………..2 25
Don’t know......98
25 Don’t know…98 25 Don’t know…..98 25
24.1
Did NAME receive polio vaccination, that is, drops in the mouth, during the vaccination campaign on the 4
th of June?
Yes…………….………1 Yes……………….….1 Yes……..………………1
No………….…………..2 No…………….……….2 No……………….……..2
Don’t know…………..98 Don’t know…….……98 Don’t know……..…....98
25
How many times total in NAME’s life was the polio vaccine received?
Number of times…………
Number of times………….
Number of times…………
Don’t know……………98 Don’t know……………98 Don’t know……………98
28
Have you heard of acute flaccid paralysis, that is, sudden paralysis in children?
Yes…………………………………..….......1 Go to 28.1
No……………………………………….......2 Go to 29.1
Don’t know………………….……………..98 Go to 29.1
28.1
Please explain what happens to a child with paralysis. RECORD ALL MENTIONED
Child stops walking/crawling ……………..1
Limp limbs………………………….…...….2
Other answer (SPECIFY)………………..96
__________________________________
Don’t know………………………………...98
28.2 Who would you contact besides your family if Clinic/Municipal Authority/Hospital……….1
115
(NAME) had paralysis, that is, stopped being able to move his/her arm or leg? RECORD ALL MENTIONED
Traditional healer……………………..……2
Herbalist………………………...…………..3
CORE/Surveillance Volunteer....…………4
Other (PLEASE SPECIFY).....................96
__________________________________
29.1 How many live-born children have you (the mother of the first child) given birth to?
Number………….
29.2 How many of those children are living?
Number………….
29.3
How many of those children, who were alive at birth, have died? 29.3 PLUS 29.2 SHOULD EQUAL 29.1
Number………….
30
Have any of your children under 5 years of age needed to stay overnight in the hospital or health center in the past 6 months?
Yes…………………………………………..1
No…………………………………………....2
Don’t know………..……………………….98
31
What is the name of the surveillance volunteer who has visited your house or neighborhood? COMPARE THE NAME GIVEN HERE TO THE CVSFP NAME RECORDED ON PAGE 1 AFTER YOU HAVE COMPLETED THE SURVEY
Name:
____________________
Compare to name recorded on page 1
Match……….1
Not a match...2
Don’t know…………………………………………………...98
32
Do you remember being visited at your home by a surveillance volunteer at times other than the days of a vaccination campaign?
Yes…………………………………………..1 Go to 32.1
No…………………………………………....2 Go to 33
Don’t know………………………………...98 Go to 33
32.1
What do you remember them talking about with you? RECORD ALL MENTIONED
Polio campaign……………………………..1
Polio vaccination……...…………………...2
Paralysis…………………………………….3
Other …………...……….………………...96
Nothing/Don’t remember..……………….98
33 Have you ever attended a group health Yes…………………………………………..1 Go to 33.1
116
education session given by a surveillance volunteer?
No……………………………………………2 END
Don’t know………………………………...98 END
33.1
What was the topic of health education? RECORD ALL MENTIONED
Polio campaign……………………………..1
Polio vaccination..………………………....2
Paralysis……….....………………………...3
Other……………………………………….96
Nothing/Don’t remember………………...98
Thank the mother for her participation

![Final Nepal Brochure-Ben Child...1. PoorestCentral Bureau of Statistics [Nepal] and UNICEF Nepal, Nepal Multiple Indicator Cluster Survey 2014: Final Report, Central Bureau of Statistics,](https://img.pdfslide.us/doc/110x75/6088cbf34a070a3c45013968/final-nepal-brochure-ben-child-1-poorestcentral-bureau-of-statistics-nepal.jpg)