Embed Size (px)
Citation preview
ARTICLE IN PRESS
0098-3004/$ - se
doi:10.1016/j.ca
$Code availa
index.htm�Correspond
fax: +1954 262
E-mail addr
Computers & Geosciences 32 (2006) 1259–1269
www.elsevier.com/locate/cageo
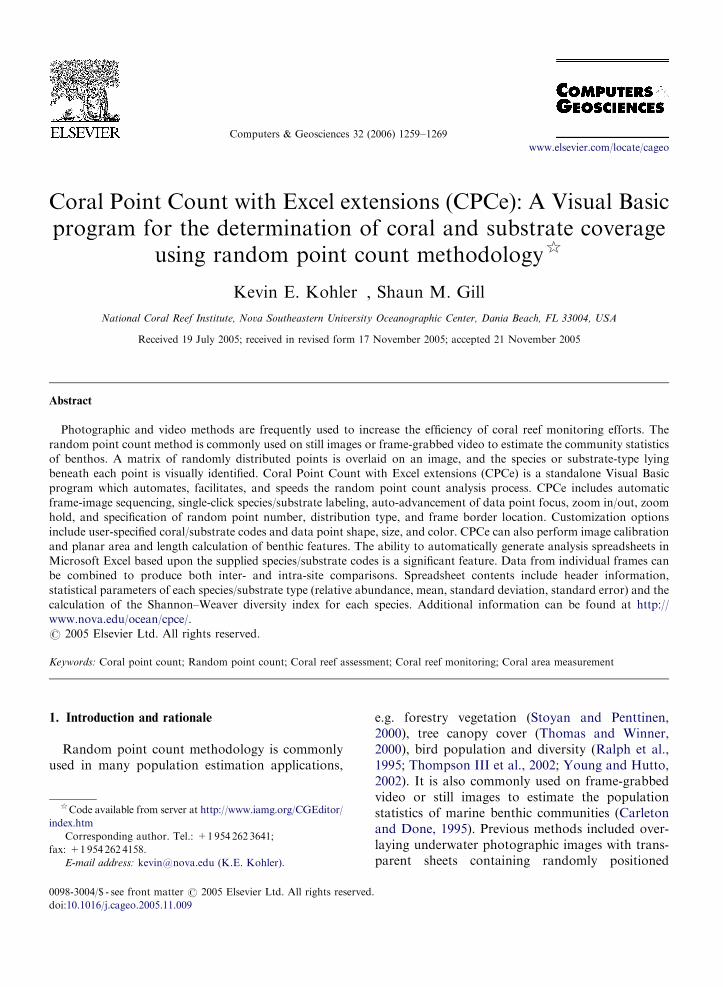
Coral Point Count with Excel extensions (CPCe): A Visual Basicprogram for the determination of coral and substrate coverage
using random point count methodology$
Kevin E. Kohler�, Shaun M. Gill
National Coral Reef Institute, Nova Southeastern University Oceanographic Center, Dania Beach, FL 33004, USA
Received 19 July 2005; received in revised form 17 November 2005; accepted 21 November 2005
Abstract
Photographic and video methods are frequently used to increase the efficiency of coral reef monitoring efforts. The
random point count method is commonly used on still images or frame-grabbed video to estimate the community statistics
of benthos. A matrix of randomly distributed points is overlaid on an image, and the species or substrate-type lying
beneath each point is visually identified. Coral Point Count with Excel extensions (CPCe) is a standalone Visual Basic
program which automates, facilitates, and speeds the random point count analysis process. CPCe includes automatic
frame-image sequencing, single-click species/substrate labeling, auto-advancement of data point focus, zoom in/out, zoom
hold, and specification of random point number, distribution type, and frame border location. Customization options
include user-specified coral/substrate codes and data point shape, size, and color. CPCe can also perform image calibration
and planar area and length calculation of benthic features. The ability to automatically generate analysis spreadsheets in
Microsoft Excel based upon the supplied species/substrate codes is a significant feature. Data from individual frames can
be combined to produce both inter- and intra-site comparisons. Spreadsheet contents include header information,
statistical parameters of each species/substrate type (relative abundance, mean, standard deviation, standard error) and the
calculation of the Shannon–Weaver diversity index for each species. Additional information can be found at http://
www.nova.edu/ocean/cpce/.
r 2005 Elsevier Ltd. All rights reserved.
Keywords: Coral point count; Random point count; Coral reef assessment; Coral reef monitoring; Coral area measurement
1. Introduction and rationale
Random point count methodology is commonlyused in many population estimation applications,
e front matter r 2005 Elsevier Ltd. All rights reserved
geo.2005.11.009
ble from server at http://www.iamg.org/CGEditor/
ing author. Tel.: +1954 262 3641;
4158.
ess: [email protected] (K.E. Kohler).
e.g. forestry vegetation (Stoyan and Penttinen,2000), tree canopy cover (Thomas and Winner,2000), bird population and diversity (Ralph et al.,1995; Thompson III et al., 2002; Young and Hutto,2002). It is also commonly used on frame-grabbedvideo or still images to estimate the populationstatistics of marine benthic communities (Carletonand Done, 1995). Previous methods included over-laying underwater photographic images with trans-parent sheets containing randomly positioned
.
ARTICLE IN PRESSK.E. Kohler, S.M. Gill / Computers & Geosciences 32 (2006) 1259–12691260
points (Murdoch and Aronson, 1999). Later im-provements to this method included the use ofcomputer software to generate the random pointpatterns and to identify the underlying benthicfeatures. PointCount991 is one such computerprogram.
Instead of requiring the counting of each speci-men, the random point method relies on statisticalpower analysis to estimate the actual populationusing the random point samples as a proxy (Lenth,2001). The technique consists of randomly distri-buting a number of points onto an underwaterphotographic image, and then visually identifyingthe features (e.g. coral, algae, rubble, etc.) lyingunder each point. The percentage of points over-lying each benthic category is calculated, andstatistics can be compiled to estimate the populationof biota such as stony coral, sponges, macroalgae,etc. over a region of interest. Coral Point Countwith Excel extensions (CPCe) was developed toincrease the efficiency and ease of performing thelarge number of image analyses and featureidentification required to provide meaningful popu-lation estimates. It includes many user-friendlydesign features, and provides a reliable means ofdata archiving. This paper describes the featuresand functionality of CPCe at the time of thiswriting, Version 3.3.
2. Overview
CPCe was designed specifically to quickly andefficiently calculate statistical coral coverage over aspecified area. Underwater photographic frames areoverlaid by a matrix of randomly distributed points,and the fauna/flora species or substrate type lyingbeneath each point is visually identified. The speciescode data for each frame is stored in a .cpc filewhich contains the image filename, point coordi-nates and the identified data codes. Data fromindividual frames can be combined to produce bothinter- and intra-site comparisons via automaticallygenerated Excel spreadsheets. The transect datasetscan then be statistically analyzed to give quantita-tive population estimates over the area of interest.In addition, CPCe has the ability to measure bothplanar length and area of selected benthic features.This capability allows the statistical comparison
1Dustan, P., Leard, J., Meier, O., Brill, M., Kosmynin, V.,
1999. PointCount99 software. University of Charleston, South
Carolina, http://www.cofc.edu/�coral/pc99/pc99.htm.
between video quadrat analyses and in situ mea-surements, and also to determine growth trendsover time.
The primary features of CPCe are:
�
automatic frame-image sequencing, � single-click species/substrate labeling, � auto-advancement of data point focus, � multiple point data assignment, � user-specified coral/substrate codes, � variable random point number/distribution, � image scaling and calibration, � planar area analysis, � batch data input and output, � automatic Excel spreadsheet generation, � adjustable frame border dimensions, � color-coded category boxes, � zoom in/out and zoom hold, � hide/show random points on image, � customizable data point shape/color, � code file integrity checker,A significant feature of CPCe is the ability toautomatically generate analysis spreadsheets inMicrosoft Excel based upon the supplied species/substrate codes. Individual image frames can beanalyzed separately or multiple frames can becombined into a single transect datasheet containingheader information, statistical parameters of eachspecies/substrate type (relative abundance, meanand standard deviation), and the calculation of theShannon–Weaver diversity index for each species.
3. CPCe operation
The basic operations of CPCe consist of specify-ing a digital image, defining a frame border,overlaying random points, identifying the coralspecies and/or substrate-type lying beneath each ofthe random points, and saving the data to file. Afterthe images have been processed, the data can beautomatically assembled into Excel spreadsheets forstatistical analysis. CPCe was specifically designedto flow logically from one operation to the next, andto simplify and speed the processing effort. Each ofthese operations is detailed below.
3.1. Image and coral code file specification
The user specifies a digital image in the form of a.jpg, .gif, or .bmp file by selecting File-Open-Rawimage file. Images smaller than the available screen
ARTICLE IN PRESSK.E. Kohler, S.M. Gill / Computers & Geosciences 32 (2006) 1259–1269 1261
area are expanded to fill the available space, whilelarger images are reduced in size to fit. A set ofmultiple image files can be specified at once andCPCe will process each file sequentially in alphabe-tical order. This eliminates the need to manuallyspecify each image file for analysis, and allows theuser to quickly switch back and forth betweenimages.
3.2. Border designation
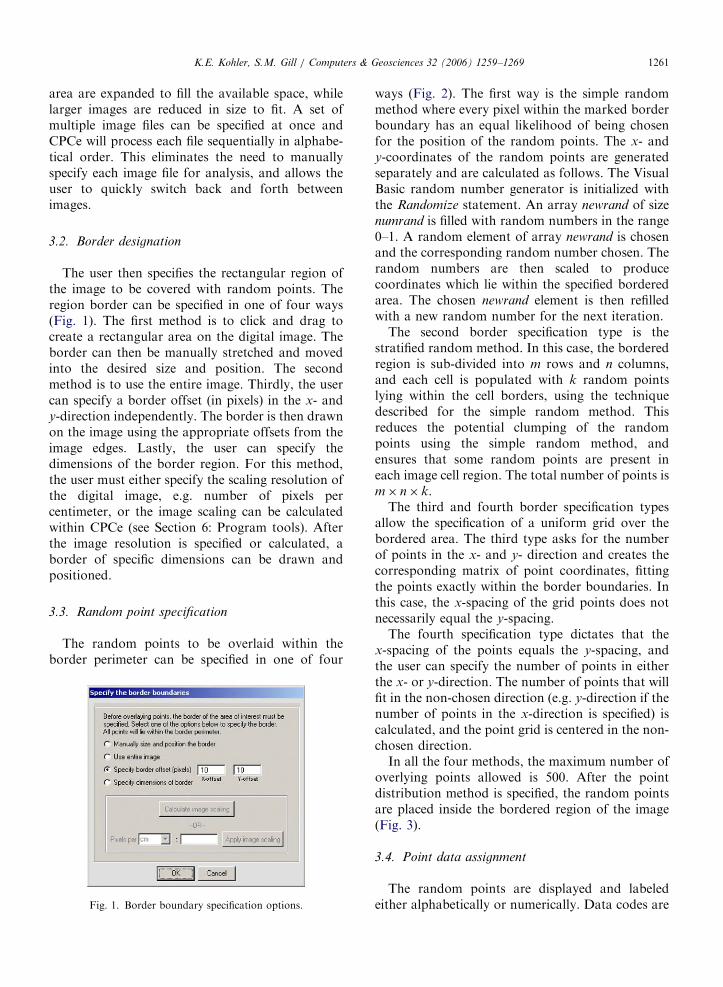
The user then specifies the rectangular region ofthe image to be covered with random points. Theregion border can be specified in one of four ways(Fig. 1). The first method is to click and drag tocreate a rectangular area on the digital image. Theborder can then be manually stretched and movedinto the desired size and position. The secondmethod is to use the entire image. Thirdly, the usercan specify a border offset (in pixels) in the x- andy-direction independently. The border is then drawnon the image using the appropriate offsets from theimage edges. Lastly, the user can specify thedimensions of the border region. For this method,the user must either specify the scaling resolution ofthe digital image, e.g. number of pixels percentimeter, or the image scaling can be calculatedwithin CPCe (see Section 6: Program tools). Afterthe image resolution is specified or calculated, aborder of specific dimensions can be drawn andpositioned.
3.3. Random point specification
The random points to be overlaid within theborder perimeter can be specified in one of four
Fig. 1. Border boundary specification options.
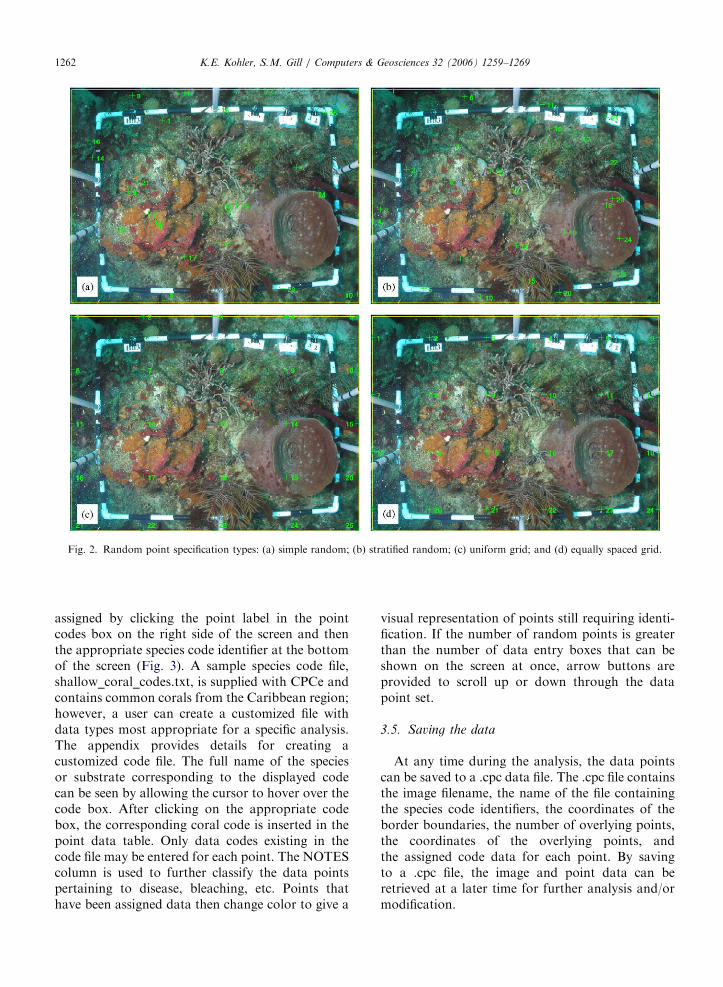
ways (Fig. 2). The first way is the simple randommethod where every pixel within the marked borderboundary has an equal likelihood of being chosenfor the position of the random points. The x- andy-coordinates of the random points are generatedseparately and are calculated as follows. The VisualBasic random number generator is initialized withthe Randomize statement. An array newrand of sizenumrand is filled with random numbers in the range0–1. A random element of array newrand is chosenand the corresponding random number chosen. Therandom numbers are then scaled to producecoordinates which lie within the specified borderedarea. The chosen newrand element is then refilledwith a new random number for the next iteration.
The second border specification type is thestratified random method. In this case, the borderedregion is sub-divided into m rows and n columns,and each cell is populated with k random pointslying within the cell borders, using the techniquedescribed for the simple random method. Thisreduces the potential clumping of the randompoints using the simple random method, andensures that some random points are present ineach image cell region. The total number of points ism� n� k.
The third and fourth border specification typesallow the specification of a uniform grid over thebordered area. The third type asks for the numberof points in the x- and y- direction and creates thecorresponding matrix of point coordinates, fittingthe points exactly within the border boundaries. Inthis case, the x-spacing of the grid points does notnecessarily equal the y-spacing.
The fourth specification type dictates that thex-spacing of the points equals the y-spacing, andthe user can specify the number of points in eitherthe x- or y-direction. The number of points that willfit in the non-chosen direction (e.g. y-direction if thenumber of points in the x-direction is specified) iscalculated, and the point grid is centered in the non-chosen direction.
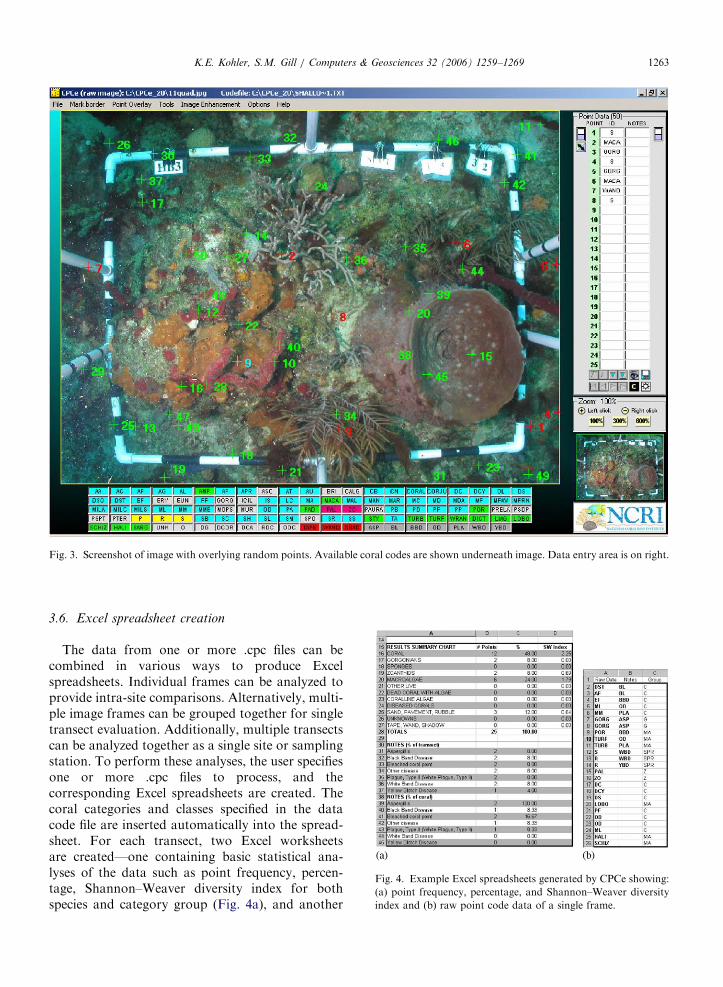
In all the four methods, the maximum number ofoverlying points allowed is 500. After the pointdistribution method is specified, the random pointsare placed inside the bordered region of the image(Fig. 3).
3.4. Point data assignment
The random points are displayed and labeledeither alphabetically or numerically. Data codes are
ARTICLE IN PRESS
Fig. 2. Random point specification types: (a) simple random; (b) stratified random; (c) uniform grid; and (d) equally spaced grid.
K.E. Kohler, S.M. Gill / Computers & Geosciences 32 (2006) 1259–12691262
assigned by clicking the point label in the pointcodes box on the right side of the screen and thenthe appropriate species code identifier at the bottomof the screen (Fig. 3). A sample species code file,shallow_coral_codes.txt, is supplied with CPCe andcontains common corals from the Caribbean region;however, a user can create a customized file withdata types most appropriate for a specific analysis.The appendix provides details for creating acustomized code file. The full name of the speciesor substrate corresponding to the displayed codecan be seen by allowing the cursor to hover over thecode box. After clicking on the appropriate codebox, the corresponding coral code is inserted in thepoint data table. Only data codes existing in thecode file may be entered for each point. The NOTEScolumn is used to further classify the data pointspertaining to disease, bleaching, etc. Points thathave been assigned data then change color to give a
visual representation of points still requiring identi-fication. If the number of random points is greaterthan the number of data entry boxes that can beshown on the screen at once, arrow buttons areprovided to scroll up or down through the datapoint set.
3.5. Saving the data
At any time during the analysis, the data pointscan be saved to a .cpc data file. The .cpc file containsthe image filename, the name of the file containingthe species code identifiers, the coordinates of theborder boundaries, the number of overlying points,the coordinates of the overlying points, andthe assigned code data for each point. By savingto a .cpc file, the image and point data can beretrieved at a later time for further analysis and/ormodification.
ARTICLE IN PRESS
Fig. 4. Example Excel spreadsheets generated by CPCe showing:
(a) point frequency, percentage, and Shannon–Weaver diversity
index and (b) raw point code data of a single frame.
Fig. 3. Screenshot of image with overlying random points. Available coral codes are shown underneath image. Data entry area is on right.
K.E. Kohler, S.M. Gill / Computers & Geosciences 32 (2006) 1259–1269 1263
3.6. Excel spreadsheet creation
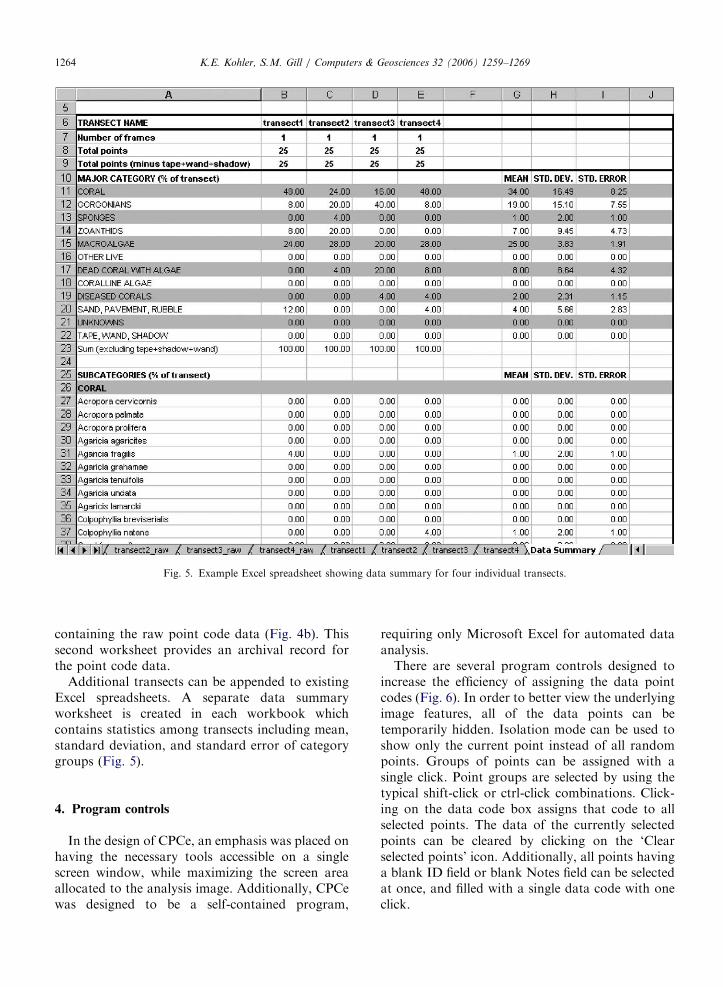
The data from one or more .cpc files can becombined in various ways to produce Excelspreadsheets. Individual frames can be analyzed toprovide intra-site comparisons. Alternatively, multi-ple image frames can be grouped together for singletransect evaluation. Additionally, multiple transectscan be analyzed together as a single site or samplingstation. To perform these analyses, the user specifiesone or more .cpc files to process, and thecorresponding Excel spreadsheets are created. Thecoral categories and classes specified in the datacode file are inserted automatically into the spread-sheet. For each transect, two Excel worksheetsare created—one containing basic statistical ana-lyses of the data such as point frequency, percen-tage, Shannon–Weaver diversity index for bothspecies and category group (Fig. 4a), and another
ARTICLE IN PRESS
Fig. 5. Example Excel spreadsheet showing data summary for four individual transects.
K.E. Kohler, S.M. Gill / Computers & Geosciences 32 (2006) 1259–12691264
containing the raw point code data (Fig. 4b). Thissecond worksheet provides an archival record forthe point code data.
Additional transects can be appended to existingExcel spreadsheets. A separate data summaryworksheet is created in each workbook whichcontains statistics among transects including mean,standard deviation, and standard error of categorygroups (Fig. 5).
4. Program controls
In the design of CPCe, an emphasis was placed onhaving the necessary tools accessible on a singlescreen window, while maximizing the screen areaallocated to the analysis image. Additionally, CPCewas designed to be a self-contained program,
requiring only Microsoft Excel for automated dataanalysis.
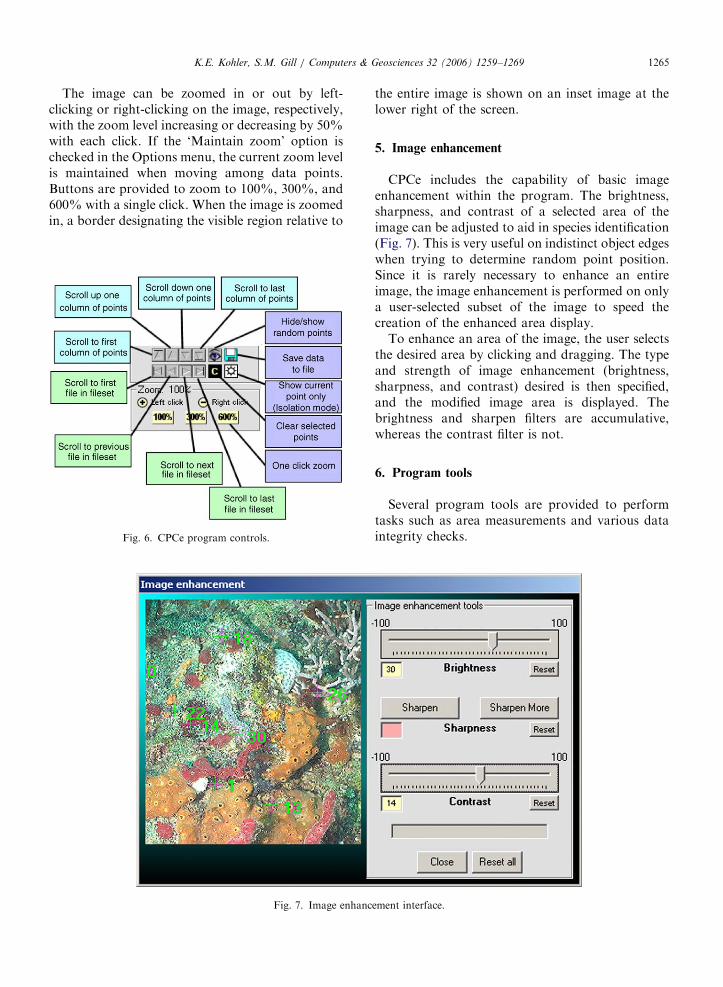
There are several program controls designed toincrease the efficiency of assigning the data pointcodes (Fig. 6). In order to better view the underlyingimage features, all of the data points can betemporarily hidden. Isolation mode can be used toshow only the current point instead of all randompoints. Groups of points can be assigned with asingle click. Point groups are selected by using thetypical shift-click or ctrl-click combinations. Click-ing on the data code box assigns that code to allselected points. The data of the currently selectedpoints can be cleared by clicking on the ‘Clearselected points’ icon. Additionally, all points havinga blank ID field or blank Notes field can be selectedat once, and filled with a single data code with oneclick.
ARTICLE IN PRESSK.E. Kohler, S.M. Gill / Computers & Geosciences 32 (2006) 1259–1269 1265
The image can be zoomed in or out by left-clicking or right-clicking on the image, respectively,with the zoom level increasing or decreasing by 50%with each click. If the ‘Maintain zoom’ option ischecked in the Options menu, the current zoom levelis maintained when moving among data points.Buttons are provided to zoom to 100%, 300%, and600% with a single click. When the image is zoomedin, a border designating the visible region relative to
Fig. 7. Image enhanc
Fig. 6. CPCe program controls.
the entire image is shown on an inset image at thelower right of the screen.
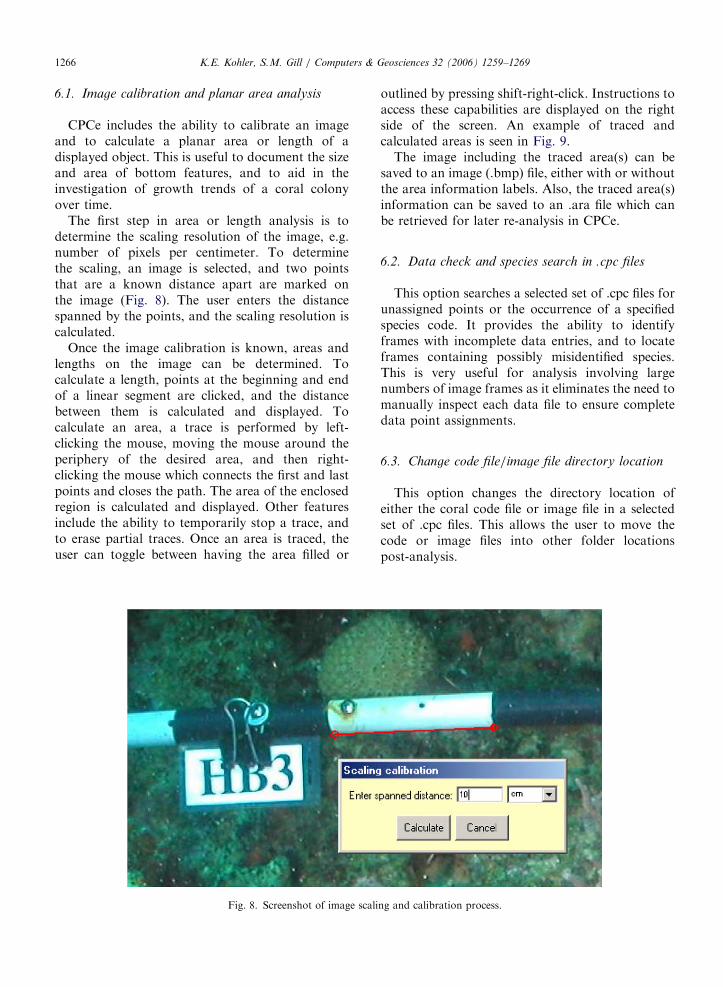
5. Image enhancement
CPCe includes the capability of basic imageenhancement within the program. The brightness,sharpness, and contrast of a selected area of theimage can be adjusted to aid in species identification(Fig. 7). This is very useful on indistinct object edgeswhen trying to determine random point position.Since it is rarely necessary to enhance an entireimage, the image enhancement is performed on onlya user-selected subset of the image to speed thecreation of the enhanced area display.
To enhance an area of the image, the user selectsthe desired area by clicking and dragging. The typeand strength of image enhancement (brightness,sharpness, and contrast) desired is then specified,and the modified image area is displayed. Thebrightness and sharpen filters are accumulative,whereas the contrast filter is not.
6. Program tools
Several program tools are provided to performtasks such as area measurements and various dataintegrity checks.
ement interface.
ARTICLE IN PRESSK.E. Kohler, S.M. Gill / Computers & Geosciences 32 (2006) 1259–12691266
6.1. Image calibration and planar area analysis
CPCe includes the ability to calibrate an imageand to calculate a planar area or length of adisplayed object. This is useful to document the sizeand area of bottom features, and to aid in theinvestigation of growth trends of a coral colonyover time.
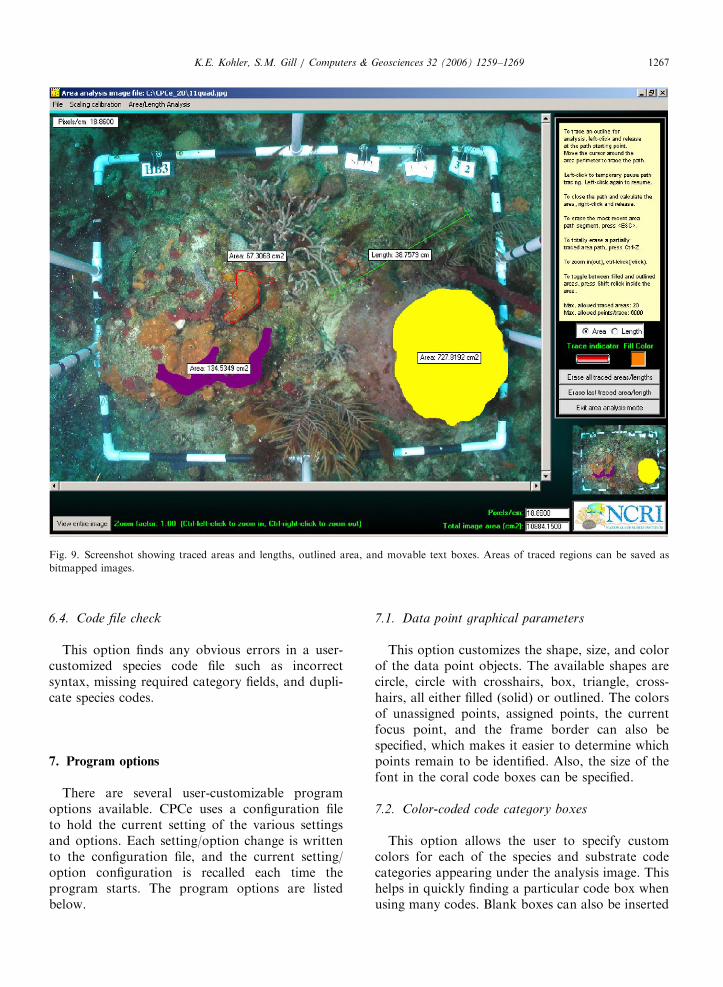
The first step in area or length analysis is todetermine the scaling resolution of the image, e.g.number of pixels per centimeter. To determinethe scaling, an image is selected, and two pointsthat are a known distance apart are marked onthe image (Fig. 8). The user enters the distancespanned by the points, and the scaling resolution iscalculated.
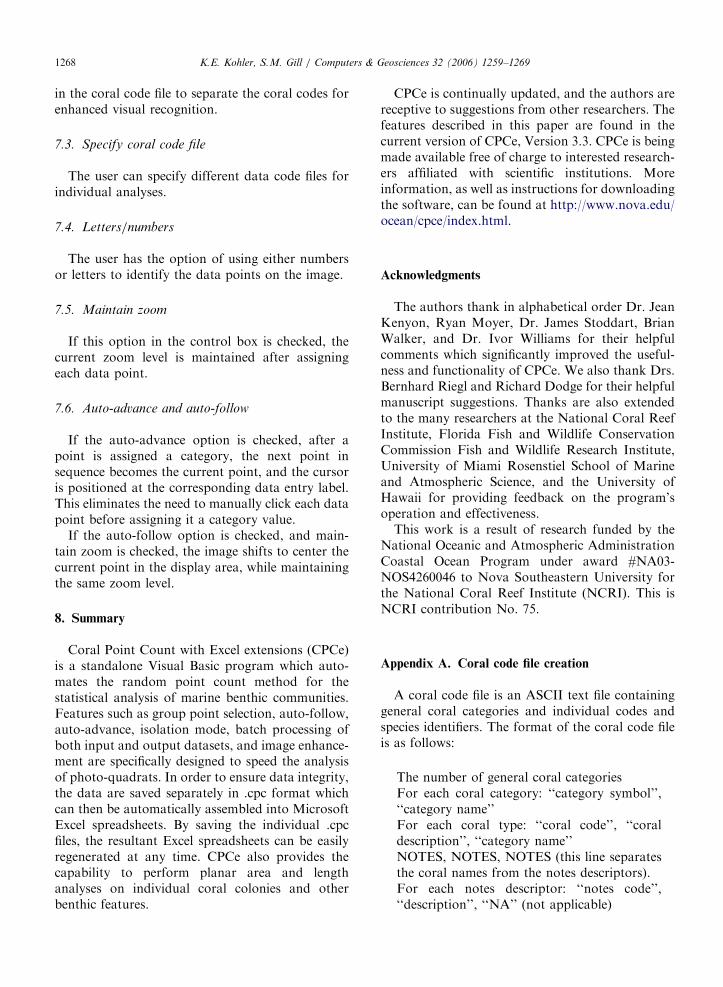
Once the image calibration is known, areas andlengths on the image can be determined. Tocalculate a length, points at the beginning and endof a linear segment are clicked, and the distancebetween them is calculated and displayed. Tocalculate an area, a trace is performed by left-clicking the mouse, moving the mouse around theperiphery of the desired area, and then right-clicking the mouse which connects the first and lastpoints and closes the path. The area of the enclosedregion is calculated and displayed. Other featuresinclude the ability to temporarily stop a trace, andto erase partial traces. Once an area is traced, theuser can toggle between having the area filled or
Fig. 8. Screenshot of image scali
outlined by pressing shift-right-click. Instructions toaccess these capabilities are displayed on the rightside of the screen. An example of traced andcalculated areas is seen in Fig. 9.
The image including the traced area(s) can besaved to an image (.bmp) file, either with or withoutthe area information labels. Also, the traced area(s)information can be saved to an .ara file which canbe retrieved for later re-analysis in CPCe.
6.2. Data check and species search in .cpc files
This option searches a selected set of .cpc files forunassigned points or the occurrence of a specifiedspecies code. It provides the ability to identifyframes with incomplete data entries, and to locateframes containing possibly misidentified species.This is very useful for analysis involving largenumbers of image frames as it eliminates the need tomanually inspect each data file to ensure completedata point assignments.
6.3. Change code file/image file directory location
This option changes the directory location ofeither the coral code file or image file in a selectedset of .cpc files. This allows the user to move thecode or image files into other folder locationspost-analysis.
ng and calibration process.
ARTICLE IN PRESS
Fig. 9. Screenshot showing traced areas and lengths, outlined area, and movable text boxes. Areas of traced regions can be saved as
bitmapped images.
K.E. Kohler, S.M. Gill / Computers & Geosciences 32 (2006) 1259–1269 1267
6.4. Code file check
This option finds any obvious errors in a user-customized species code file such as incorrectsyntax, missing required category fields, and dupli-cate species codes.
7. Program options
There are several user-customizable programoptions available. CPCe uses a configuration fileto hold the current setting of the various settingsand options. Each setting/option change is writtento the configuration file, and the current setting/option configuration is recalled each time theprogram starts. The program options are listedbelow.
7.1. Data point graphical parameters
This option customizes the shape, size, and colorof the data point objects. The available shapes arecircle, circle with crosshairs, box, triangle, cross-hairs, all either filled (solid) or outlined. The colorsof unassigned points, assigned points, the currentfocus point, and the frame border can also bespecified, which makes it easier to determine whichpoints remain to be identified. Also, the size of thefont in the coral code boxes can be specified.
7.2. Color-coded code category boxes
This option allows the user to specify customcolors for each of the species and substrate codecategories appearing under the analysis image. Thishelps in quickly finding a particular code box whenusing many codes. Blank boxes can also be inserted
ARTICLE IN PRESSK.E. Kohler, S.M. Gill / Computers & Geosciences 32 (2006) 1259–12691268
in the coral code file to separate the coral codes forenhanced visual recognition.
7.3. Specify coral code file
The user can specify different data code files forindividual analyses.
7.4. Letters/numbers
The user has the option of using either numbersor letters to identify the data points on the image.
7.5. Maintain zoom
If this option in the control box is checked, thecurrent zoom level is maintained after assigningeach data point.
7.6. Auto-advance and auto-follow
If the auto-advance option is checked, after apoint is assigned a category, the next point insequence becomes the current point, and the cursoris positioned at the corresponding data entry label.This eliminates the need to manually click each datapoint before assigning it a category value.
If the auto-follow option is checked, and main-tain zoom is checked, the image shifts to center thecurrent point in the display area, while maintainingthe same zoom level.
8. Summary
Coral Point Count with Excel extensions (CPCe)is a standalone Visual Basic program which auto-mates the random point count method for thestatistical analysis of marine benthic communities.Features such as group point selection, auto-follow,auto-advance, isolation mode, batch processing ofboth input and output datasets, and image enhance-ment are specifically designed to speed the analysisof photo-quadrats. In order to ensure data integrity,the data are saved separately in .cpc format whichcan then be automatically assembled into MicrosoftExcel spreadsheets. By saving the individual .cpcfiles, the resultant Excel spreadsheets can be easilyregenerated at any time. CPCe also provides thecapability to perform planar area and lengthanalyses on individual coral colonies and otherbenthic features.
CPCe is continually updated, and the authors arereceptive to suggestions from other researchers. Thefeatures described in this paper are found in thecurrent version of CPCe, Version 3.3. CPCe is beingmade available free of charge to interested research-ers affiliated with scientific institutions. Moreinformation, as well as instructions for downloadingthe software, can be found at http://www.nova.edu/ocean/cpce/index.html.
Acknowledgments
The authors thank in alphabetical order Dr. JeanKenyon, Ryan Moyer, Dr. James Stoddart, BrianWalker, and Dr. Ivor Williams for their helpfulcomments which significantly improved the useful-ness and functionality of CPCe. We also thank Drs.Bernhard Riegl and Richard Dodge for their helpfulmanuscript suggestions. Thanks are also extendedto the many researchers at the National Coral ReefInstitute, Florida Fish and Wildlife ConservationCommission Fish and Wildlife Research Institute,University of Miami Rosenstiel School of Marineand Atmospheric Science, and the University ofHawaii for providing feedback on the program’soperation and effectiveness.
This work is a result of research funded by theNational Oceanic and Atmospheric AdministrationCoastal Ocean Program under award #NA03-NOS4260046 to Nova Southeastern University forthe National Coral Reef Institute (NCRI). This isNCRI contribution No. 75.
Appendix A. Coral code file creation
A coral code file is an ASCII text file containinggeneral coral categories and individual codes andspecies identifiers. The format of the coral code fileis as follows:
The number of general coral categoriesFor each coral category: ‘‘category symbol’’,‘‘category name’’For each coral type: ‘‘coral code’’, ‘‘coraldescription’’, ‘‘category name’’NOTES, NOTES, NOTES (this line separatesthe coral names from the notes descriptors).For each notes descriptor: ‘‘notes code’’,‘‘description’’, ‘‘NA’’ (not applicable)
ARTICLE IN PRESSK.E. Kohler, S.M. Gill / Computers & Geosciences 32 (2006) 1259–1269 1269
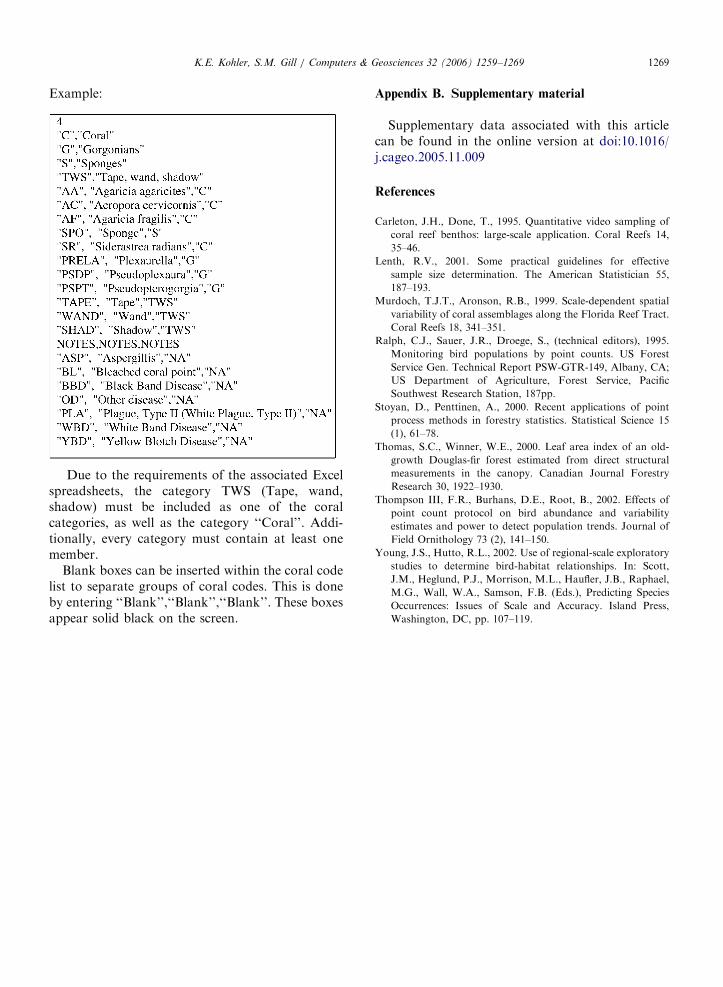
Example:
Due to the requirements of the associated Excelspreadsheets, the category TWS (Tape, wand,shadow) must be included as one of the coralcategories, as well as the category ‘‘Coral’’. Addi-tionally, every category must contain at least onemember.
Blank boxes can be inserted within the coral codelist to separate groups of coral codes. This is doneby entering ‘‘Blank’’,‘‘Blank’’,‘‘Blank’’. These boxesappear solid black on the screen.
Appendix B. Supplementary material
Supplementary data associated with this articlecan be found in the online version at doi:10.1016/j.cageo.2005.11.009
References
Carleton, J.H., Done, T., 1995. Quantitative video sampling of
coral reef benthos: large-scale application. Coral Reefs 14,
35–46.
Lenth, R.V., 2001. Some practical guidelines for effective
sample size determination. The American Statistician 55,
187–193.
Murdoch, T.J.T., Aronson, R.B., 1999. Scale-dependent spatial
variability of coral assemblages along the Florida Reef Tract.
Coral Reefs 18, 341–351.
Ralph, C.J., Sauer, J.R., Droege, S., (technical editors), 1995.
Monitoring bird populations by point counts. US Forest
Service Gen. Technical Report PSW-GTR-149, Albany, CA;
US Department of Agriculture, Forest Service, Pacific
Southwest Research Station, 187pp.
Stoyan, D., Penttinen, A., 2000. Recent applications of point
process methods in forestry statistics. Statistical Science 15
(1), 61–78.
Thomas, S.C., Winner, W.E., 2000. Leaf area index of an old-
growth Douglas-fir forest estimated from direct structural
measurements in the canopy. Canadian Journal Forestry
Research 30, 1922–1930.
Thompson III, F.R., Burhans, D.E., Root, B., 2002. Effects of
point count protocol on bird abundance and variability
estimates and power to detect population trends. Journal of
Field Ornithology 73 (2), 141–150.
Young, J.S., Hutto, R.L., 2002. Use of regional-scale exploratory
studies to determine bird-habitat relationships. In: Scott,
J.M., Heglund, P.J., Morrison, M.L., Haufler, J.B., Raphael,
M.G., Wall, W.A., Samson, F.B. (Eds.), Predicting Species
Occurrences: Issues of Scale and Accuracy. Island Press,
Washington, DC, pp. 107–119.