Embed Size (px)
Citation preview

Copyright(c)2013 Juan B. Morales Ph.D. CCP1
WMTA January 2013
Juan B. Morales de la Garza Ph.D. CCP RUIZ-MORALES & ASSOCIATES
January 16th 2013Tel :(01152664) 686-4116 Fax: (01152664) 686-1998
Email: [email protected] www.ruiz-morales.com.mx
Labor and Economic Indicators Update for 2013

Copyright(c)2013 Juan B. Morales Ph.D. CCP2
PRESENTATION PRESENTATION OBJECTIVESOBJECTIVES
1.0 Employment Indicators – Tijuana Turnover_ Baja California Unemployment
_ IMMEX Employment Data
2.0 Economic Indicators- Inflation
3.0 Modified Projections for 2012
Copyright(c)2013 Juan B. Morales Ph.D. CCP3
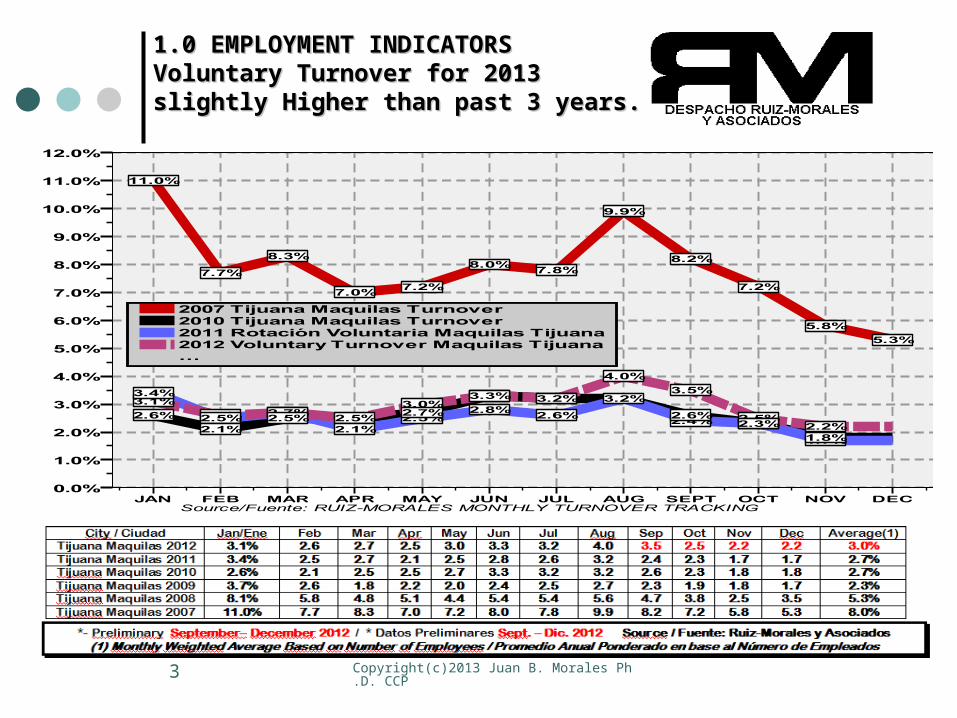
1.0 EMPLOYMENT INDICATORS1.0 EMPLOYMENT INDICATORSVoluntary Turnover for 2013 slightly Voluntary Turnover for 2013 slightly Higher than past 3 years.Higher than past 3 years.
Copyright(c)2013 Juan B. Morales Ph.D. CCP4
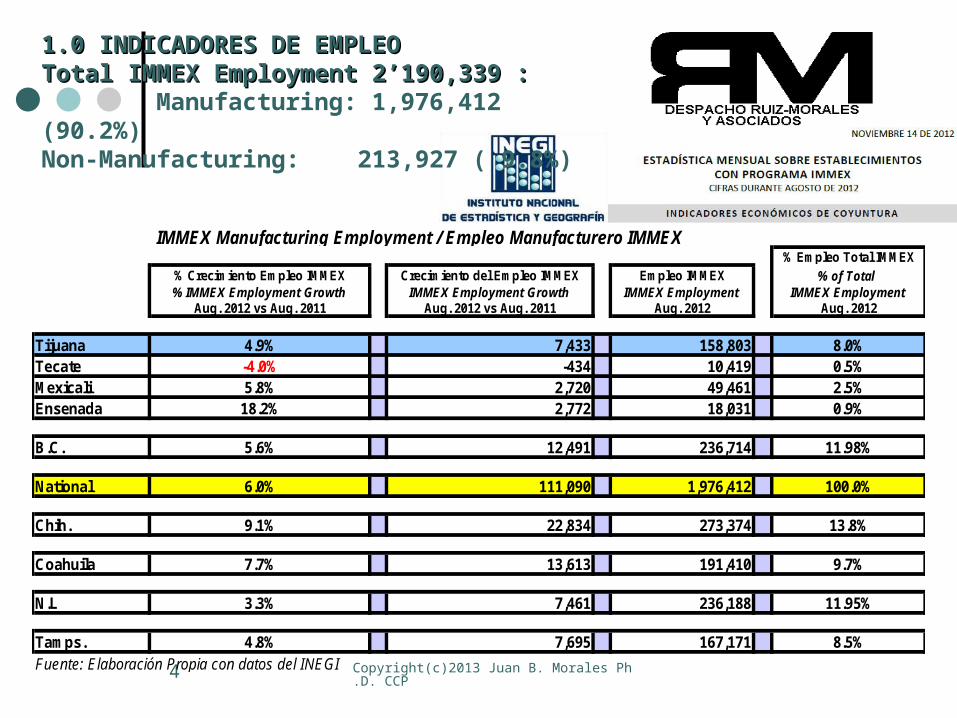
1.0 INDICADORES DE EMPLEO1.0 INDICADORES DE EMPLEOTotal IMMEX Employment 2’190,339 :Total IMMEX Employment 2’190,339 : Manufacturing: 1,976,412 (90.2%)Non-Manufacturing: 213,927 ( 9.8%)
IMMEX Manufacturing Employment / Empleo Manufacturero IMMEX% Empleo Total IMMEX
% Crecimiento Empleo IMMEX Crecimiento del Empleo IMMEX Empleo IMMEX % of Total % IMMEX Employment Growth IMMEX Employment Growth IMMEX Employment IMMEX Employment
Aug. 2012 vs Aug. 2011 Aug. 2012 vs Aug. 2011 Aug. 2012 Aug. 2012
Tijuana 4.9% 7,433 158,803 8.0%Tecate -4.0% -434 10,419 0.5%Mexicali 5.8% 2,720 49,461 2.5%Ensenada 18.2% 2,772 18,031 0.9%
B.C. 5.6% 12,491 236,714 11.98%
National 6.0% 111,090 1,976,412 100.0%
Chih. 9.1% 22,834 273,374 13.8%
Coahuila 7.7% 13,613 191,410 9.7%
N.L 3.3% 7,461 236,188 11.95%
Tamps. 4.8% 7,695 167,171 8.5%Fuente: Elaboración Propia con datos del INEGI
Copyright(c)2013 Juan B. Morales Ph.D. CCP5
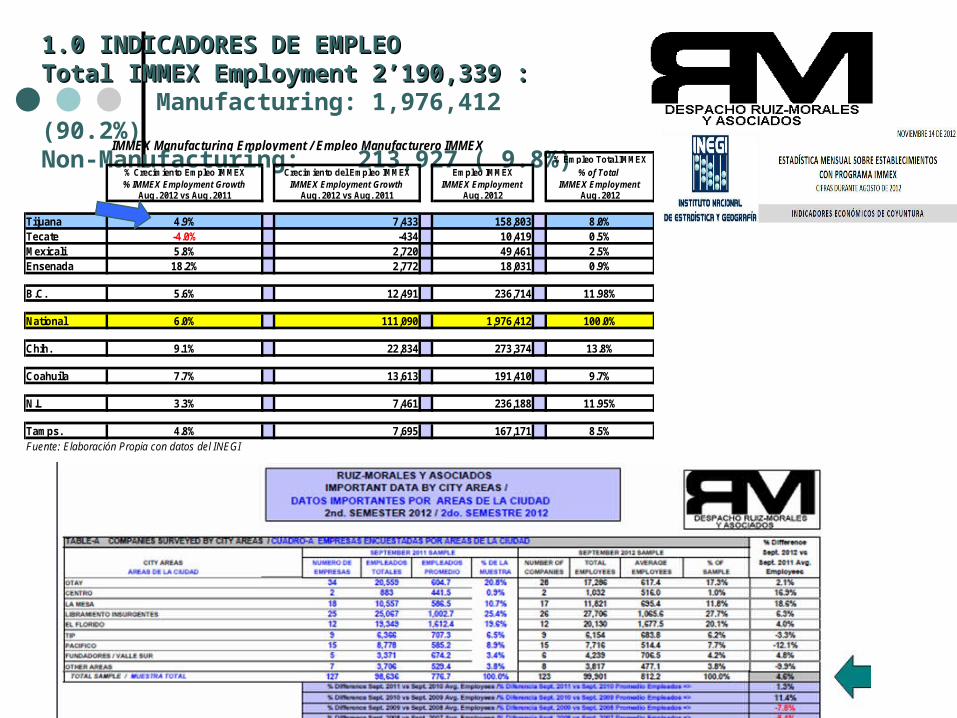
1.0 INDICADORES DE EMPLEO1.0 INDICADORES DE EMPLEOTotal IMMEX Employment 2’190,339 :Total IMMEX Employment 2’190,339 : Manufacturing: 1,976,412 (90.2%)Non-Manufacturing: 213,927 ( 9.8%)
IMMEX Manufacturing Employment / Empleo Manufacturero IMMEX% Empleo Total IMMEX
% Crecimiento Empleo IMMEX Crecimiento del Empleo IMMEX Empleo IMMEX % of Total % IMMEX Employment Growth IMMEX Employment Growth IMMEX Employment IMMEX Employment
Aug. 2012 vs Aug. 2011 Aug. 2012 vs Aug. 2011 Aug. 2012 Aug. 2012
Tijuana 4.9% 7,433 158,803 8.0%Tecate -4.0% -434 10,419 0.5%Mexicali 5.8% 2,720 49,461 2.5%Ensenada 18.2% 2,772 18,031 0.9%
B.C. 5.6% 12,491 236,714 11.98%
National 6.0% 111,090 1,976,412 100.0%
Chih. 9.1% 22,834 273,374 13.8%
Coahuila 7.7% 13,613 191,410 9.7%
N.L 3.3% 7,461 236,188 11.95%
Tamps. 4.8% 7,695 167,171 8.5%Fuente: Elaboración Propia con datos del INEGI
Copyright(c)2013 Juan B. Morales Ph.D. CCP6
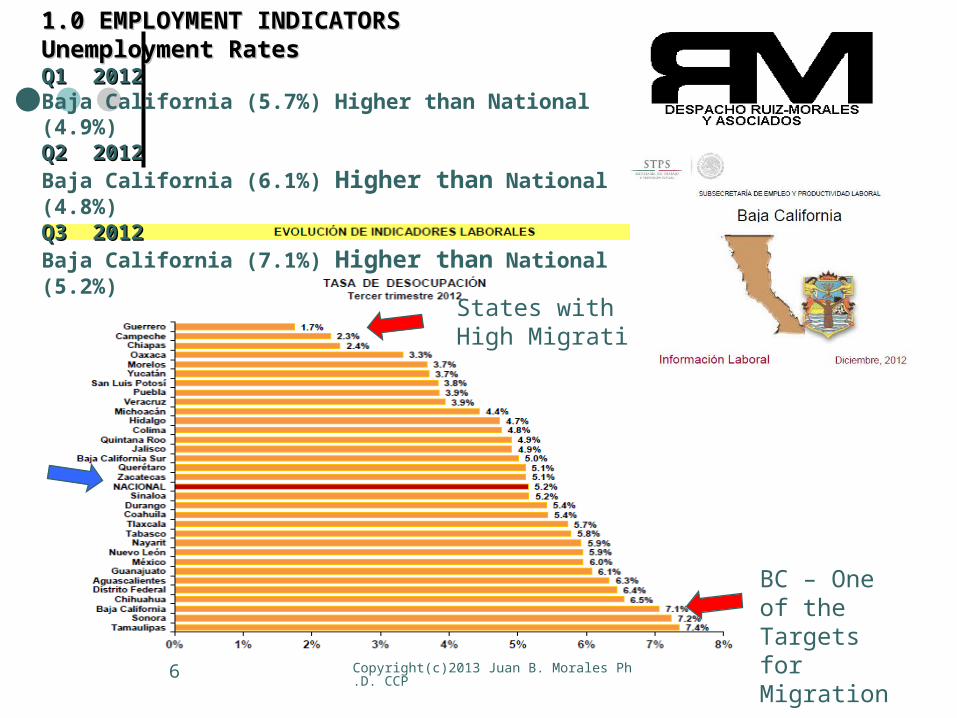
1.0 EMPLOYMENT INDICATORS1.0 EMPLOYMENT INDICATORSUnemployment RatesUnemployment RatesQ1 2012Q1 2012 Baja California (5.7%) Higher than National (4.9%) Q2 2012Q2 2012 Baja California (6.1%) Higher than National (4.8%) Q3 2012Q3 2012Baja California (7.1%) Higher than National (5.2%)
States with High Migration
BC – One of the Targets for Migration
Copyright(c)2013 Juan B. Morales Ph.D. CCP7
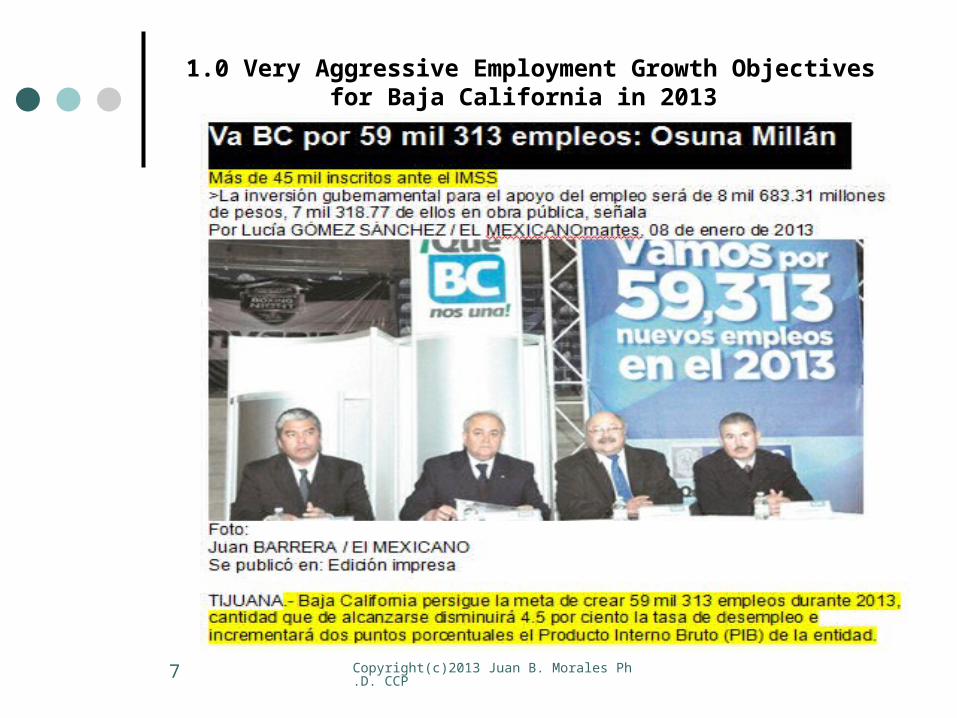
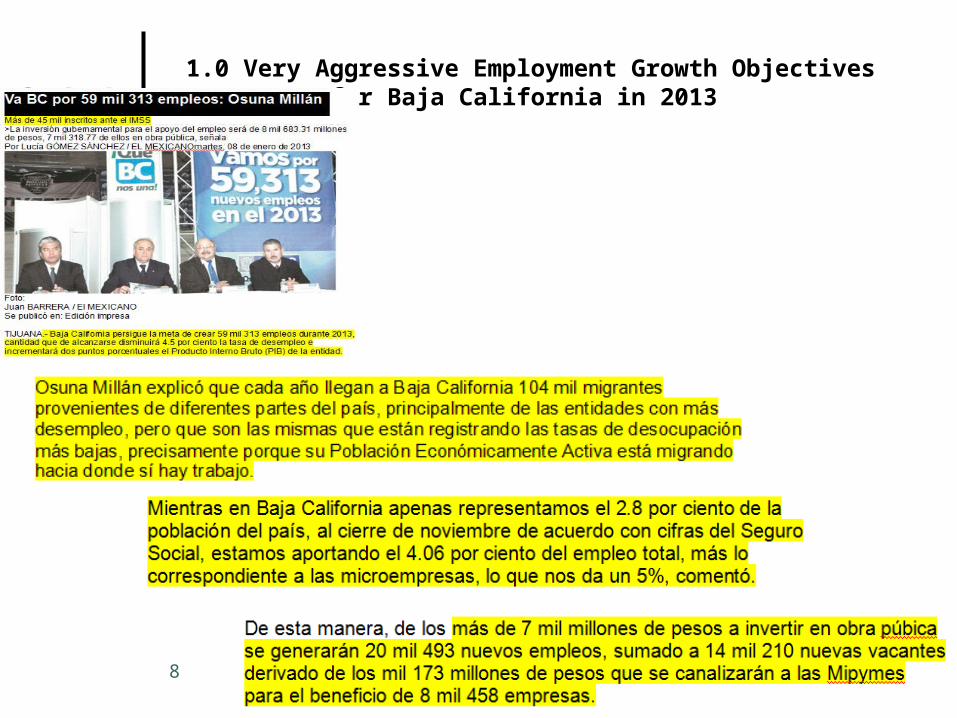
1.0 Very Aggressive Employment Growth Objectives for Baja California in 2013
Copyright(c)2013 Juan B. Morales Ph.D. CCP8
1.0 Very Aggressive Employment Growth Objectives for Baja California in 2013
Copyright(c)2013 Juan B. Morales Ph.D. CCP9
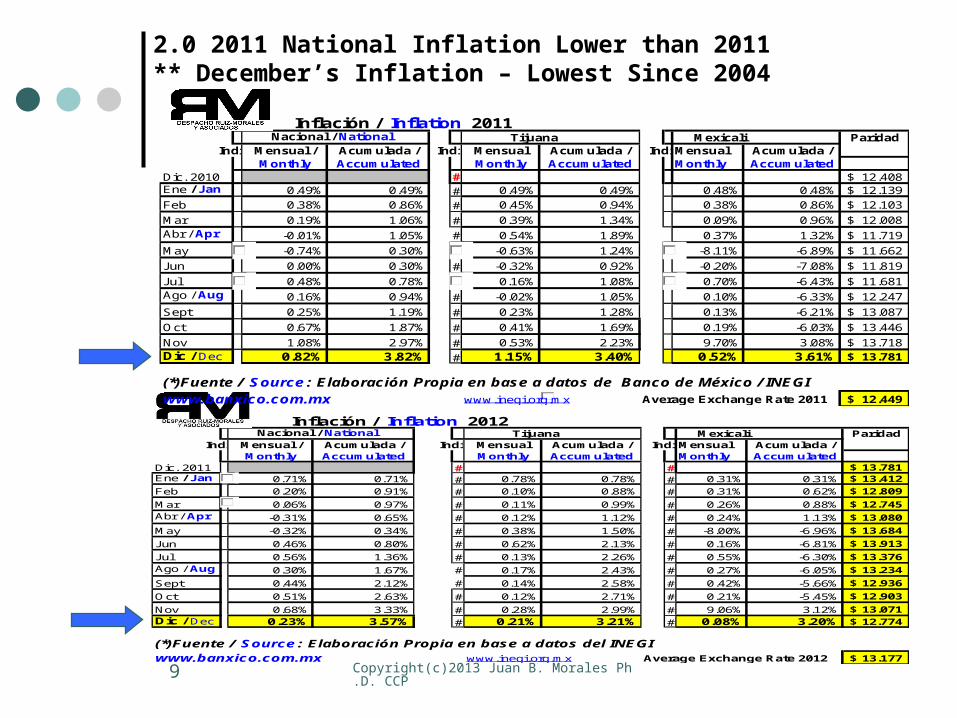
2.0 2011 National Inflation Lower than 2011 ** December’s Inflation – Lowest Since 2004
Nacional / National Tijuana Mexicali ParidadIndiceMensual / Acumulada / IndiceMensual Acumulada / IndiceMensual Acumulada /
Monthly Accumulated Monthly Accumulated Monthly AccumulatedDic. 2011 # # 13.781$ Ene / Jan 0.71% 0.71% # 0.78% 0.78% # 0.31% 0.31% 13.412$
Feb 0.20% 0.91% # 0.10% 0.88% # 0.31% 0.62% 12.809$
Mar 0.06% 0.97% # 0.11% 0.99% # 0.26% 0.88% 12.745$ Abr / Apr -0.31% 0.65% # 0.12% 1.12% # 0.24% 1.13% 13.080$
May -0.32% 0.34% # 0.38% 1.50% # -8.00% -6.96% 13.684$
Jun 0.46% 0.80% # 0.62% 2.13% # 0.16% -6.81% 13.913$
Jul 0.56% 1.36% # 0.13% 2.26% # 0.55% -6.30% 13.376$ Ago / Aug 0.30% 1.67% # 0.17% 2.43% # 0.27% -6.05% 13.234$
Sept 0.44% 2.12% # 0.14% 2.58% # 0.42% -5.66% 12.936$
Oct 0.51% 2.63% # 0.12% 2.71% # 0.21% -5.45% 12.903$
Nov 0.68% 3.33% # 0.28% 2.99% # 9.06% 3.12% 13.071$ Dic / Dec 0.23% 3.57% # 0.21% 3.21% # 0.08% 3.20% 12.774$
(*)Fuente / Source : Elaboración Propia en base a datos del INEGIwww.banxico.com.mx www.inegi.org.mx Average Exchange Rate 2012 13.177$
Inflación / Inflation 2012
Nacional / National Tijuana Mexicali ParidadIndiceMensual / Acumulada / IndiceMensual Acumulada / IndiceMensual Acumulada /
Monthly Accumulated Monthly Accumulated Monthly AccumulatedDic. 2010 # 12.408$ Ene / Jan 0.49% 0.49% # 0.49% 0.49% 0.48% 0.48% 12.139$
Feb 0.38% 0.86% # 0.45% 0.94% 0.38% 0.86% 12.103$
Mar 0.19% 1.06% # 0.39% 1.34% 0.09% 0.96% 12.008$ Abr / Apr -0.01% 1.05% # 0.54% 1.89% 0.37% 1.32% 11.719$
May -0.74% 0.30% # -0.63% 1.24% -8.11% -6.89% 11.662$
Jun 0.00% 0.30% # -0.32% 0.92% -0.20% -7.08% 11.819$
Jul 0.48% 0.78% # 0.16% 1.08% 0.70% -6.43% 11.681$ Ago / Aug 0.16% 0.94% # -0.02% 1.05% 0.10% -6.33% 12.247$
Sept 0.25% 1.19% # 0.23% 1.28% 0.13% -6.21% 13.087$
Oct 0.67% 1.87% # 0.41% 1.69% 0.19% -6.03% 13.446$
Nov 1.08% 2.97% # 0.53% 2.23% 9.70% 3.08% 13.718$ Dic / Dec 0.82% 3.82% # 1.15% 3.40% 0.52% 3.61% 13.781$
(*)Fuente / Source : Elaboración Propia en base a datos de Banco de México / INEGIwww.banxico.com.mx www.inegi.org.mx Average Exchange Rate 2011 12.449$
Inflación / Inflation 2011
Copyright(c)2013 Juan B. Morales Ph.D. CCP10
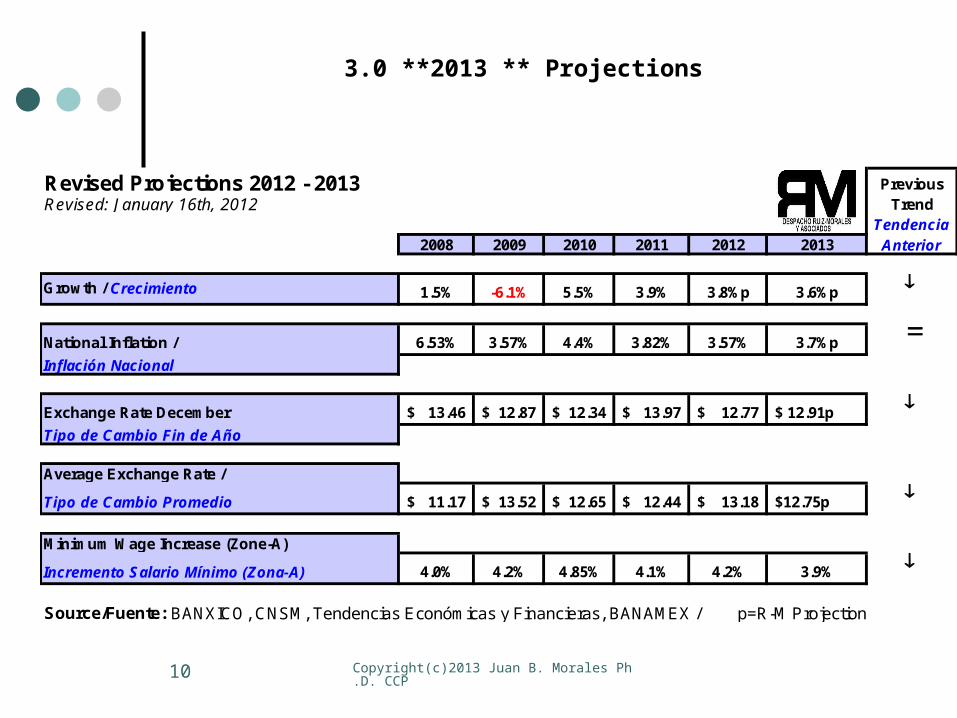
3.0 **2013 ** Projections
Revised Projections 2012 - 2013 PreviousRevised: January 16th, 2012 Trend
Tendencia2008 2009 2010 2011 2012 2013 Anterior
Growth / Crecimiento 1.5% -6.1% 5.5% 3.9% 3.8%p 3.6%p
National Inflation / 6.53% 3.57% 4.4% 3.82% 3.57% 3.7%p =Inflación Nacional
Exchange Rate December 13.46$ 12.87$ 12.34$ 13.97$ 12.77$ $ 12.91p Tipo de Cambio Fin de Año
Average Exchange Rate /
Tipo de Cambio Promedio 11.17$ 13.52$ 12.65$ 12.44$ 13.18$ $12.75p
Minimum Wage Increase (Zone-A)
Incremento Salario Mínimo (Zona-A) 4.0% 4.2% 4.85% 4.1% 4.2% 3.9%
Source/Fuente: BANXICO, CNSM, Tendencias Económicas y Financieras, BANAMEX / p=R-M Projection
Copyright(c)2013 Juan B. Morales Ph.D. CCP11
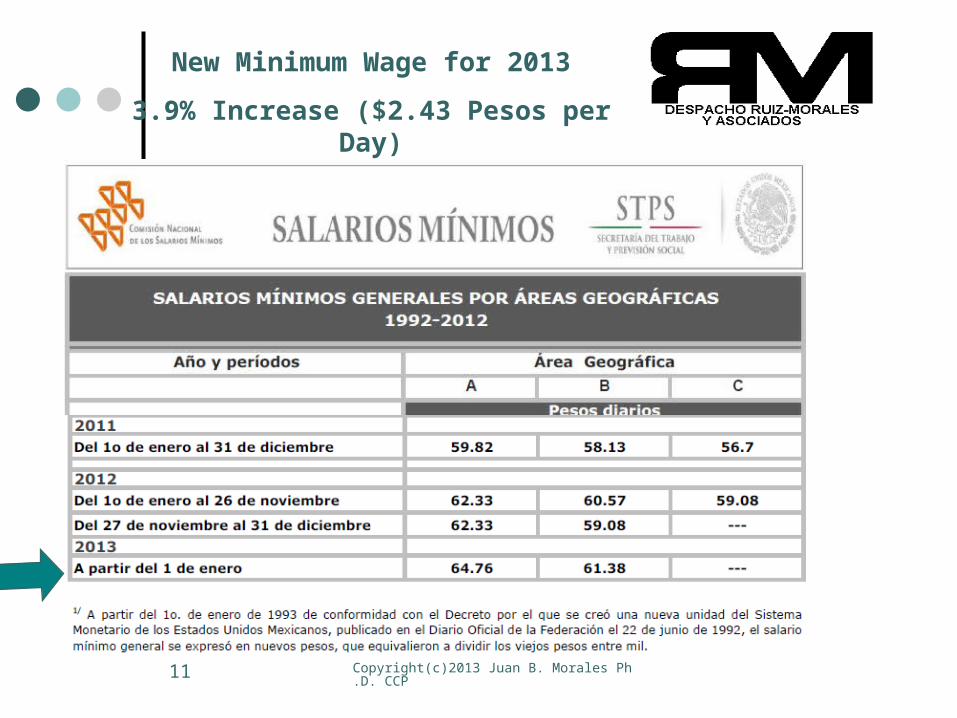
New Minimum Wage for 2013
3.9% Increase ($2.43 Pesos per Day)

Copyright(c)2013 Juan B. Morales Ph.D. CCP12
Fiscal Reform ???

Copyright(c)2013 Juan B. Morales Ph.D. CCP13
Thank You !Questions ?
Copyright(c)2013 Juan B. Morales Ph.D. CCP14